1. Introduction
Empirical economic geography lives through data, data for observation and data for attempts at explanation of spatial differentiations in economic development. Generally such data is available in aggregate form for specific territorial divisions, either because the data is only collected in this form, or because aggregation happens at the time of dissemination for reasons of resource limitations, confidentiality rules or simply tradition (see [
1] for a selective overview of the situation in Europe). Recent years, however, have witnessed the arrival of more and more data sets containing micro-data. For most official data sets, spatial information is still only available in the form of specific scales of territorial divisions, either because only a specific territorial level is recorded during a survey or because confidentiality rules forbid the dissemination of precise location information (see for example [
2]). However, in some, mostly commercial, data sets, spatial information is available in the form of postal addresses, thus allowing a very precise localization of the data subjects. To be usable for geographic analysis, though, these addresses have to be translated to geographic coordinates via the process of geocoding which creates a whole new class of problems for researchers dealing with large data sets.
At the same time, these private data sets do not always contain the same level of detail as public data sets. The Amadeus database of the Bureau Van Dijk, for example, does not contain information about local units of production but only about headquarters (at least for most countries), whereas the official business registers that are the basis for the Eurostat Structural Business Statistics, contain information on local production units in the regional data sets. Researchers, thus, have to take special care to verify whether the data is still usable for the set task.
This article presents an analysis of the usability of the Amadeus database for studying firm localization and concentration in several European countries. It focuses on two main questions: How to geocode large datasets of such micro-data and whether the data is actually usable for economic geography where both the spatial and the sectoral differentiation is important. The article is structured as follows: I begin by briefly reviewing some discussions on the use of micro-data, including some examples of such uses in economic geography. I then go on to present the data used for this study, the Amadeus database from the Bureau Van Dijck. The two main sections then go into more detail concerning, first, the process of geocoding using public data and web services and, second, a detailed analysis concerning the usability of the data given some of its limitations. In the final section, I present some maps that come out of the data and then present my conclusions concerning the use of such databases and the issues researchers have to face using them.
2. Micro-Data in Economic Geography
Recently, the use of micro-data has increased in economic geography (and economics, for that matter). This can be explained both by the increased availability of such data sets and by the rise of technologies allowing the treatment of larger data sets. One of the main arguments for using micro-data is the ability it provides to avoid the pitfalls of the modifiable areal unit problem. Another is that micro-data offers new insights that are invisible in aggregated data sets.
2.1. The Modifiable Areal Unit Problem
In economic geography, spatial patterns and relations are the basic bricks of analysis. Furthermore, it is no secret that the content of these bricks is highly scale-dependent. Conclusions drawn at NUTS 2 level in Europe, mixing rural and urban areas, will be very different from conclusions drawn from observations aggregated at municipal level. This can include the simple question of internal spatial differentiation of localisations, but it also effects the results of statistical analyses of relations between variables. The modifiable areal unit problem (MAUP) is the overarching concept dealing with these issues.
The MAUP has been known for a long time [
3], but as Briant
et al. put it [
4], “surprisingly, economists paid little attention to this problem up until recently”. Much has been written on the subject by geographers, though. Discussions range from the actual impact of the MAUP through best ways of “solving” the problem all the way to notions that the MAUP is not a problem as such, but rather an intregal part of geographic analysis (for an overview see [
5]). Briant
et al. [
4] also show, for example, that in most cases, at least in the French administrative and statistical spatial hierarchy, model specification or variable definitions actually have a much stronger impact on results than the MAUP, although this does depend on how variables are aggregated in the spatial units.
However, the idea is not to go into detail here concerning these discussions, but rather to follow one thread that comes out of it and that postulates that the best answer to these questions is the use of micro-data. As stated by Grasland and Madelin [
5], “The access to individual data is of course the ideal situation, not because the individual level is in all cases the most appropriate one to observe or model a phenomenon, but mainly because it gives the choice to observe information at all possible levels and for all forms of spatial partitions.” Prominent advocates of the use of micro-data are Tobler [
6,
7], Grasland [
8] as well as, and more specifically in the field of economic geography, Arbia [
9,
10,
11]. They propose the use of continuous space in order to transcend the issues raised by discrete boundaries, or the use of the flexibility of aggregation provided by point-located micro-data.
2.2. New Insights through Micro-Data
As already mentioned, micro-data is becoming more and more accessible to researchers, and improved computing power and statistics now allow treating these data with more and more sophisticated methods. Several examples of existing research exist that show that the use of micro-data in economic geography seems a promising path forward.
Arbia provides several examples of applications of continuous space modelling, notably in birth, survival and growth analysis of firms [
9,
11,
12] proposing innovative uses of modelling of spatial processes. He does acknowledge, however, that one of the weakness in the current state of affairs is that the data sets are often limited in their content and that “it would be necessary to have access to a larger information set on structural variables other than just the mere geographical location of firms, such as, for instance, the characteristics of the local demand, workforce skill and urban structure” [
11]. As we will see further on, the Amadeus database already widens the scope of available information, although it is still limited to characteristics of the firms themselves.
Another use of micro-data in recent years has been in the study of agglomeration, or clustering, of firms. Boix
et al. [
13] explore creative clusters in Europe, using a sample of almost 600,000 firms from the Amadeus database, using spatial nearest neighbour hierarchical clustering to identify clusters per industry. They conclude that the use of micro-data allows for much richer and detailed results than classical approaches with aggregated data. In terms of methodology, Marcon and Puech, as well as Duranton and Overman [
14,
15,
16] have initiated a line of reflection on the best way to measure localization patterns and concentration based on micro-data, mostly in line with or explicitly based on Ripley’s K function.
In economics, a recent research field depending on micro-data is firm heterogeneity [
17,
18,
19,
20]. Even though, at this stage, research is a-spatial, in the sense of not including spatial patterns as a factor in the analysis, it is an interesting case of use of micro-data in order to better understand the actual drivers behind regional economic development. One provocative conclusion out of this research is that exports out of regions are limited to a few, highly productive, exporting firms, while most firms only cater to local markets. Although these conclusions are based on surveys providing a large number of variables, they only represent a limited sample of firms, and thus are often not very representative in terms of spatial patterns. Therefore, use of more exhaustive micro-data, although more limited in terms of variables, might possibly provide another interesting path to explore in that field. Some examples of possible directions of such further geographical analysis include the works of Koenig and Farole and Winkler who have worked with large databases, albeit not exactly at the spatial micro-data level as location seems to have been defined at the regional scale, and focused on the question of how agglomeration influences decisions to export [
21,
22]. Combined with the above-mentioned work on location and concentration in continuous space, this latter literature on links between agglomeration and export is certainly an interesting topic for the future.
3. Data
The firm data used comes from Amadeus database produced by the Bureau Van Dijck and contains micro-data on firms for all European countries [
23]. It contains a total of about 17 million firms across the continent. It is based on business accounts filed in national registers and collected by national contact points before being fed into the database. The origin of the data explains that it contains mostly financial information, with a large number of variables available to assess the balance sheet of each firm. It also contains ownership information allowing to study firm networks [
24], although this data was not available for the present study. Finally, it contains the complete official postal address of the headquarters (although for some countries this data needs to be purchased for an additional fee), a geographic location at NUTS2-level (The geocoding level available directly in the AMADEUS database has actually significantly improved during the writing and revision of this article from NUTS2-level to NUTS3 or even finer resolution—down to municipalities in some countries—making the database directly usable for certain types of analyses in economic geography.) and basic characteristics such as 4-digit NACE codes and legal form. Size information is available in the form of number of employees and turnover, although this data is not complete in many countries.
One of the aims of the study was to assess what public data or services are currently available to allow geocoding such micro-data without having to resort to expensive commercial solutions. An attempt was made to identify data available in each country in Europe, although no claim to exhaustivity can be made, as the data is not often easy to find, although this issue should be resolved soon with the infrastructure put in place in the context of the INSPIRE directive (see below).
Combining the address data to which I had access in the Amadeus database and the address data or geocoding services I found, I finally ended up working with data on the following countries: Belgium, Denmark, France, Netherlands, Spain and the United Kingdom, for a total of 5,232,318 firms.
4. Public Resources for Geocoding
In any spatial analysis, putting the data in the right place is essential. In many applications, location is given at the outset, be it for data aggregated within known administrative units or for data collected in the field with GPS, satellite or other instruments. There is a growing set of data, however, for which location is given by postal addresses, making any analysis impossible since addresses do not allow quantitative treatment, and do not explicitly provide information about distances and other spatial relationships between the observations.
In order to obtain a usable geographic positioning of such data, the postal addresses have to be translated into point coordinates through geocoding. Commercial solutions exist, but they are often too expensive for users in the academic sphere. Free commercial online geocoding services such as the Google, Yahoo and Bing APIs strongly limit the use of the geocoding results to simple viewing on their respective maps. Any analytical treatment is legally excluded, thus reducing these services to simple placing of markers on maps. The main reason for these limitations is actually not the service itself, but the data behind the service. Private data providers invest important resources in the maintenance of their databases linking addresses to geographic coordinates. As the above APIs or other commercial solutions use these databases, restrictions aiming at protecting these data also impede the related geocoding services (Personal communication from the Google Support services to the author). In an academic environment where flexible use of the data is primordial, such restrictions render the geocoding results almost useless. In the United States of America, an alternative exists in the form of the Census Bureau Tiger data, and free solutions exist based on these data. In Europe access to such data was much more difficult in the past.
Finally, a crowd-sourcing solution has come into existence in the last years (often integrating public data if the latter is available under adequate licence conditions), in the form of OpenStreetMap. Depending on the countries, data is already quite complete, although in some areas house numbers are still not available. See [
25] for a study of the use of these data for geocoding.
Times are changing, however, and there are fundamental evolutions currently occurring in European governments’ perspective and policy on government-produced data. The OpenData movement is gaining momentum [
26], supported by the general reform of public spatial data accessibility impulsed by the EU INSPIRE directive, and so several countries have made their official address data publicly and freely available, thus enabling the elaboration of geocoding solutions based on that data. Some countries and regions have gone even further and offer geocoding web services.
4.1. The Role of the INSPIRE Directive
The dissemination of spatial data in Europe is strongly influenced by the European INSPIRE directive of 2007 which establishes the rules and infrastructures for a European spatial data system [
27]. It identifies a series of themes for which member states have to make data available in the form of a variety of services, from discovery to download. According to the directive’s article 14, only discovery and view services must be free of charge, for the others member states can levy charges. Address data is part of Annex I, which lists the most important data. All services including download services should be implemented by member states since December 2012 [
28]. In addition, member states can also provide spatial data services as regulated in the relevant implementation rules currently in finalisation phases.
Member states have chosen very different pathways in the implementation of the INSPIRE directive and regulations. Many have not changed the access limitations in terms of charges and licensing, but have only made the form of access INSPIRE compliant. In some countries, however, the INSPIRE directive has inspired a more fundamental move towards opening up public datasets for general access and use.
Content of data sets is also determined within the INSPIRE process. In its Annex I, for example, the INSPIRE directive defines address data as “Location of properties based on address identifiers, usually by road name, house number, postal code” [
27]. The INSPIRE data specification for addresses goes further by explaining that “an address has an identifier, e.g., an address number or a building name, which enables a user to distinguish it from the neighbour addresses, as well as a geographic position, which enables an application to locate the address spatially. The human readable identifier is in the application schema defined as the address “locator”. The geographic position is represented as a geographic point” [
27]. Countries thus have to structure their data in order to comply to these specifications, making use of the data easier when working across countries.
4.3. National Idiosyncrasies in Formats and Contents of Data
In each country, addresses are handled differently. The main issues which will determine the simplicity of geocoding are:
the spatial detail of postal codes which can represent anything from single buildings and streets to a collection of municipalities: As postal codes are a fairly easy element to match, the smaller the postal code area, the easier it is to find a specific street in that area.
(in combination with the previous) the presence or not of more than one street with the same name in a single postcode area.
the propensity in the country to use unofficial place names (“lieux-dits”), building names, etc. as acceptable addresses for mail delivery.
the presence in the reference data set of old, abandoned addresses with validity dates: This allows to geocode data even if there has been a change of street name, a renumbering or a change of postcodes.
the dissemination of addresses as opposed to GIS data (streets, parcels, etc.) that necessitate the use of specialised software and often need to be pre-treated before obtaining actual addresses
Table 2 lists some of the specificities of the datasets actually used in the research in terms of content, and ease of use. Again, the situation is diverse. Some countries provide simple spreadsheet type data with decomposed addresses and their respective coordinates. Others provide complex XML data which is not easy to use directly.
Table 2.
Content, format and specificities of national address data sets.
Table 2.
Content, format and specificities of national address data sets.
| Country | Dataset Format | Content | Specificities of Use |
|---|
| United Kingdom | Text data | coordinates of postcode centroids | Only postcodes available as open data; postcodes spatially very discriminant (at most one street, and often individual buildings [29]) |
| Netherlands | xml atom-feed | GIS data in xml format | Data quite complex, and not easy to treat, but tools have been developed by the community that help in the usage
Each postcode represents a single street |
| Denmark | csv file or xml atom-feed | Addresses with coordinates | Postcodes cover large areas with many streets, but addresses are quite standardized making address matching fairly easy |
| France | Shapefiles | address points (different data sets for street address, place names, and industrial parks) | Postcodes regroup several municipalities; street names can repeat within a postcode area; industrial parks and place names can be used as addresses in database, but are not always present in reference data |
| Spain | Shapefiles | complete GIS data (streets, buildings, addresses, etc.) | Not complete for the entire country, especially in terms of house numbers; Street names are not always standardized, making matching more difficult
After web service became available, use of the address data was abandoned |
| Belgium-Brussels | Variable GIS formats | complete GIS data | Data actually not used because spatial data service available |
| Belgium-Flanders | Shapefiles and DBF files | address points + additional address data | Data actually not used because spatial data service available |
| Belgium-Wallonia | Spreadsheets | addresses and their geographic coordinates | Data set not complete (several large areas without data); same street name can be found several times in postal code; old (smaller) municipality names available allowing to limit search |
5. Practical Issues in Geocoding
5.1. Introduction
The process of geocoding is actually a combination of two processes: (a) decoding the address into its constituent parts (street, house number, postcode, and city) and (b) matching each of these parts to relevant data in the reference database. How these have to be applied depends on the data or service provided in each country.
Most countries offering web services also offer address parsing services, sometimes integrated into one service, sometimes as a separate service. In the latter case, one thus has to first call the address parsing service to find a best match and then the geocoding service to retrieve the coordinates of the found address.
When using spatial reference data for geocoding, or when no parsing service is provided, or when the parsing service is somewhat more challenging to use, one can manually parse the addresses before submitting them to a service or matching them with existing addresses in the reference data.
The aim in this section is not to review the theory of geocoding in all of its aspects (see [
30] for an overview), but rather to explore the practical issues in the context of current public data and service availability.
5.2. Integrated Web Services
In theory, those countries that provide integrated web services of parsing and geocoding prove to be the easiest to handle for the user: just send the address “as is” to the service and retrieve coordinates of the best match the service can find. This resembles the general use case of commercial online services such as Google Maps or the relevant API. There is no need in this case for manual address parsing. However, sometimes the addresses are in such bad state, or contain much more information than necessary, thus confusing the web service. In that case, some manual parsing and cleaning might prove necessary in order to significantly increase the matching rate. A series of test runs with a limited, random sample of addresses is often necessary in order to identify common problems and necessary interventions.
The main challenge for these services when working with large databases is thus the automation of the process. Most of the time, the service allows requests for one address at a time, thus requiring a loop going through all addresses, treating them one by one and storing the results. Services are provided either as REST [
31] or as SOAP [
32] services. In the former case, the use of the service is a simple matter of calling a HTTP URL containing the address as parameter and retrieving the result in the form provided (JSON, XML, and CSV). In the latter case, communication is a bit more sophisticated sending information in XML form. In both cases, it is important to study the documentation concerning the API in order to understand the content returned by the service. An essential information provided by most services is a measure of the quality of the match. Even though the absolute values of these measures do not necessarily have a clear meaning as such, they can be used for comparison amongst matches and for getting a feeling of the potential quality of the match. In complement, the information concerning the number of possible matches found for a given address is also an interesting statistic, allowing again to assess the probability of error.
A minimum knowledge of a scripting-friendly language such as Python, Ruby, or others is necessary to provide the looping and basic error handling. In the case of a SOAP service, specialised libraries exist for most programming languages, facilitating the access to such services. In the case presented in this article, I used the Python language, with the suds library [
33] providing an interface to the SOAP protocol.
5.3. Address Parsing
For all countries for which it was necessary, the address parsing was conducted in the relational database management system PostgreSQL (with its extension PostGIS to handle those data sets which came in form of vector geometry). The language used was pure SQL.
Because of the very different forms of addresses in each country, and the fact that the Amadeus database addresses were provided by national correspondents in a country-specific style, I developed ad hoc country-by-country rules to isolate street names and house numbers. In the Amadeus database, the address consists of a street or place name and generally a house number, sometimes with modifiers. City names and postal codes are already in separate fields of the database. Generally, the address styles are consistent within each country with, for example, the house number either before or after the street name, possible use of a comma between house number and street name, etc. However, much cleaning was still necessary to make the street and city names compatible between databases (replace accented characters, expand abbreviations, etc.). Generally, the ad hoc rules for decoding addresses involved cutting up the address according to specific rules. The SQL code in the additional files gives the details on which rules were applied.
An important question at this stage is whether house numbers are necessary, and if yes, whether house number modifiers and combinations (e.g., 7A 115-117, 234 Box 10A) have to be preserved or can be dropped. As in some countries streets can be long, I decided to maintain house numbers. Attempting to preserve modifiers significantly increases the difficulty of decoding the address, without much improvement of location precision, so I decided to work without modifiers except for those countries where the extraction of these modifiers was easy. One has to note that not all address databases contain modifiers, or at least not always in a consistent manner.
Once the house number and modifiers are identified and extracted, the rest can generally be considered as the street name. However, many exceptions exist to this rule, with possible place names, building names, names of industrial parks and multiple combinations of these. In order to identify the actual street name it is advisable, at this stage, to already use the reference database as source of possible street names and to thus identify the official street name that most probably corresponds to the address in the Amadeus database. This search implies the use of fuzzy string matching algorithms that provide a metric of similarity between two strings, thus allowing the selection of the most similar street name. Many algorithms exist in the literature and more algorithms are developed as time goes by, notably to supply web search engines, spell checkers,
etc. Combinations of different techniques can be used to create more complex matching algorithms, such as through decision trees [
34]. It is beyond the scope of this article to go into the detail of this research, but for matching of short texts such as street and city names, two algorithms stand out as the most widely used: n-grams and the Levenshtein distance. The first identifies all possible substrings of n letters (I used n = 3) in each character string and then calculates a standardized similarity between the two strings as the number of matching substrings divided by a measure of the total length of the strings. The latter is an editing distance defined as the number of edits (deletion, insertion and substitution) necessary to get from one string to the other [
35,
36,
37]. In order to choose between these two, I did some brief tests with the algorithms provided by PostgreSQL. Both showed fairly similar results, with a slight advantage to trigrams so I decided to use these for pattern matching, using the pg_trgm extension [
38]. This worked sufficiently well to justify not building a more complex pattern matching engine.
In conclusion, the address parsing, including fuzzy matching of street and city names, is the most challenging part of the process, requiring quite a lot of
ad hoc solutions depending on the state of the addresses. However, solutions do exist and can be applied in pure SQL, thus not requiring much programming skills. One effort of developing freely available address parsing techniques that is worth mentioning is the PostGIS geocoder [
39]. Originally developed for the US Tiger data, thus limited to US address formats, efforts are now ongoing to develop specific modules for each country which should facilitate address parsing using this free software (the Spanish online service is based on such a customized module).
5.4. Techniques Used for Geocoding
Once the address is decoded and suitable street and city names are found the actual geocoding, i.e., the translation of the address data into geographic coordinates in a database is fairly easy and consists simply in the retrieval of the coordinates corresponding to the found street and city and the specific house number.
Sometimes, however, the house numbers in the firm database do not exist in the reference database, or there is simply no house number in the address. In the first case, one can interpolate the location of the house number based on neighbouring house numbers in the reference base. In the second case, one has to either use a reference point representing the street (e.g., its centre point), or one can interpolate a central location based on existing house numbers in that street. This latter approach is especially useful for rural areas, where streets can be quite long with buildings concentrated only at certain points, and especially effective in countries where municipalities are small, allowing to use as the basis for interpolation only those house numbers that fall into the same municipality as the address searched for.
For online services, all depends on the specific implementation of the proposed service. Some services automatically propose “similar” addresses including closest house numbers, closest street name or coordinates of the smallest higher spatial unit that can be identified (street, postal zone, etc.). In the Flemish batch service, no coordinates are provided if the house number is missing. In that case, another web service needs to be used to receive coordinates at street level.
As interpolation of house numbers requires a whole series of tests and calculations, I decided to use the in-built scripting language PL/PGSQL for this task when geocoding in the database or I implemented algorithms of interpolation in the Python scripts calling the web services, looping through closest house numbers until a match is found. The basic algorithm implemented for interpolation is:
The details of the individual implementations can be found in the additional files. In order to ensure harmonisation in the localisation information, all coordinates in the reference data sets were transformed with the PostGIS ST_Transform function to lat-long coordinates in degrees using the datum WGS84 (EPSG code 4326) before geocoding.
6. Usability
While geocoding is an important issue in the evaluation of the usability of micro-databases such as the Amadeus database, the most important question obviously is how useful the actual information contained in the database is. Often the answer will depend on the specific research question, but a few fundamental elements cut across most objectives.
6.1. Exhaustivity
The Amadeus database in its February 2012 version used for this study contains about 17 million active firms across Europe. When limited to firms within the EU28 this number goes down to about 14 million. The Eurostat Structural Business Statistics (SBS) database, based on national business registers gives a total of about 22 million enterprises in 2011 (last year for which exhaustive coverage is available for EU28) in NACE Rev. 2 Sections B to N and Division 95. This shows that Amadeus does not cover all business registered in the business registers across the European Union, but it still contains a fair share of companies.
In a country-by-country comparison (
Table 3), it becomes clear that the situation is very unequal between countries, consistent with observations by Boix et al on creative industries [
12]. Note that totals here are only for those sectors covered by the SBS database, so only a subset of sectors covered by the Amadeus database.
Table 3.
Number of enterprises in the Amadeus database and in the Eurostat structural business statistics in sectors covered by SBS.
Table 3.
Number of enterprises in the Amadeus database and in the Eurostat structural business statistics in sectors covered by SBS.
| Country | Amadeus | SBS | Proportion |
|---|
| BE | 360,000 | 538,849 | 0.67 |
| DK | 112,170 | 213,398 | 0.53 |
| ES | 905,614 | 2,429,628 | 0.37 |
| FR | 1,059,426 | 2,601,501 | 0.41 |
| NL | 341,907 | 811,155 | 0.42 |
| UK | 1,313,898 | 1,696,589 | 0.77 |
The large differences come from rules concerning companies that have to file accounts, as the Amadeus database is based on these filed accounts while the business register is based on administrative and survey data, and can also include different forms of public companies, including those that are linked to local governments and that should probably be excluded from localisation analyses as their freedom of movement is limited. For France, Amadeus actually proposes more companies than indicated in the table, but half of the companies come from a different source database access to which is subject to extra fees, and were thus not available for this study. Generally, however, the data in the Amadeus database can be considered as a sufficiently large sample to analyse enterprise localisation.
Simple localisation of firms by sector is already an interesting variable to study, but the Amadeus database provides a large number of other variables that can be interesting for economic geography. All variables of the accounts that companies are obliged to file are registered in the database as well as available stock market and ownership information. Information includes legal information such as legal form and data of incorporation, the entire balance sheet and profit and loss account including information on assets, employees and employee-based productivity, and sales, stock data, information about shareholders and subsidiaries. Potential analyses thus include firm births, geographies of profits, geographies of ownership relations at very fine scales, productivity analyses,
etc. However, which variables are compulsory for which types of companies depends on each country. As accounting rules change and the quality of the reporting evolves, the Amadeus database also changes over time, and so indications here are only a snapshot at the date of the data used (February 2012). Data is updated as soon as new information is available. In order to create time series, regular snapshots have thus to be taken.
Table 4 shows the proportion of missing data for a small selection of such variables. This clearly indicates that researchers have to be extremely careful in selecting the variables and the territory of study in order not to work with a severely limited sample. However, when only looking at large and very large firms (according to the Amadeus definition), the situation is already much more encouraging as these firms are generally subject to more extensive accounting rules than small and medium-sized firms.
Table 4.
Proportion by country of missing data for a selection of variables in the Amadeus database (EBIT = Earnings before interest and taxes, ROE = Return on equity, L&VL = only large and very large firms, i.e., operating revenue ≥ 10 million EUR or total assets ≥ 20 million EUR or employees ≥ 150).
| Country | Firms | Addresses | NACE Sector | Turnover | Employees | EBIT | ROE |
|---|
| All | L&VL | All | L&VL | All | L&VL | All | L&VL | All | L&VL | All | L&VL | All | L&VL |
|---|
| BE | 450,272 | 12,412 | 1% | 0% | 2% | 1% | 83% | 19% | 55% | 17% | 15% | 8% | 29% | 12% |
| DK | 205,102 | 6,497 | 0% | 0% | 6% | 2% | 84% | 33% | 72% | 26% | 89% | 0% | 18% | 6% |
| ES | 1,001,556 | 30,249 | 0% | 0% | 0% | 0% | 7% | 5% | 28% | 15% | 2% | 0% | 24% | 7% |
| FR | 1,242,726 | 40,082 | 0% | 1% | 0% | 0% | 0% | 0% | 33% | 19% | 0% | 0% | 18% | 8% |
| NL | 687,940 | 54,936 | 0% | 0% | 0% | 3% | 97% | 15% | 27% | 26% | 94% | 10% | 94% | 19% |
| UK | 1,644,722 | 22,480 | 0% | 0% | 2% | 0% | 84% | 51% | 94% | 33% | 82% | 35% | 87% | 42% |
As we are not only interested in totals of firms, but also in the differentiation of these firms in terms of the sector of activity, I calculated the correlations, country-by-country, between the absolute number of firms per NACE2 sector according to the SBS and according to Amadeus (
Table 5—Throughout the entire paper, all correlations of absolute numbers were calculated with the corr() function in PostgreSQL, weighted correlations were calculated with the cov.wt() function in R [
40]). The situation again varies between countries with some countries with a very high correlation, but others, notably the UK, Spain and the Netherlands with lower values. The picture is similar but shifted to lower correlations when using weighted correlations of proportions (
i.e., proportion of NACE sector in country total weighted by the absolute number of firms in the NACE). Interestingly, there does not seem to be any relation between the ratio between Amadeus and SBS firms and these correlations.
Table 5.
Correlation per country between number of enterprises per NACE2 in Amadeus and SBS (weights = average number of firms between Amadeus and SBS).
Table 5.
Correlation per country between number of enterprises per NACE2 in Amadeus and SBS (weights = average number of firms between Amadeus and SBS).
| Country | N | R of Absolute Numbers | Weighted R of Proportions | Number of Firms in Amadeus | Number of Firms in SBS |
|---|
| BE | 68 | 0.97 | 0.93 | 342,854 | 550,178 |
| DK | 68 | 0.92 | 0.88 | 109,927 | 213,398 |
| ES | 68 | 0.77 | 0.51 | 867,870 | 2,429,628 |
| FR | 68 | 0.97 | 0.98 | 1,056,281 | 2,601,501 |
| NL | 68 | 0.78 | 0.63 | 341,834 | 811,155 |
| UK | 68 | 0.69 | 0.27 | 1,310,491 | 1,696,589 |
Exploring the situation a bit further for those countries where the correlation is low reveals that a few outlier sectors are decisive. In the case of the United Kingdom, for example, eliminating a single sector, NACE 82 (Office administrative, office support and other business support activities), increases the correlation from 0.69 to 0.89 (with the weighted coefficient going from 0.27 to 0.75). This shows that special care has to be taken, analysing in each country the specific customs concerning the attribution of firms to sectors and the legal and regulatory environment in which the firms are active. To illustrate this point,
Table 6 shows the correlations for the sole manufacturing sectors (letter C). Here, we have 80% of variance explained in all countries (for much lower numbers of firms, however).
Table 6.
Correlation per country between number of enterprises per NACE2 in Amadeus and SBS (manufacturing only, weights = average number of firms between Amadeus and SBS).
Table 6.
Correlation per country between number of enterprises per NACE2 in Amadeus and SBS (manufacturing only, weights = average number of firms between Amadeus and SBS).
| Country | N | R of Absolute Numbers | Weighted R of Proportions | Number of Firms in Amadeus | Number of Firms in SBS |
|---|
| BE | 24 | 0.98 | 0.98 | 24,841 | 37,436 |
| DK | 24 | 0.95 | 0.91 | 9561 | 15,715 |
| ES | 24 | 0.98 | 0.99 | 102,658 | 182,161 |
| FR | 24 | 0.96 | 0.97 | 101,044 | 207,013 |
| NL | 24 | 0.89 | 0.89 | 25,242 | 51,065 |
| UK | 24 | 0.95 | 0.95 | 89,245 | 122,650 |
6.2. The Use of Headquarters instead of Establishments
In order to really judge the usefulness of the Amadeus database for economic geography, it is not enough to just evaluate the total number of enterprises per country. We have to assess whether the geographic pattern of the enterprises in the database corresponds to the geographic patterns we wish to analyse. One factor that might limit the usability of the Amadeus database is that it (generally) only provides information concerning firm headquarters and not production units. If we want to analyse the production at regional scale, in a context where this production might be controlled by headquarters situated in other regions, this could constitute a serious bias. Analysis shows, however, that this bias is not as strong as one might have expected. The correlation by country between the number of firms in Amadeus and the number of local units in SBS by NUTS2 region is very high in all countries (
Table 7). Note, however, the low number of cases, limited to the number of NUTS2 regions in each country (Even with such low numbers of cases, p-values are below 0.001 for all correlations measured in this article, most even much lower).
Table 7.
Correlation per country between the number of firms in Amadeus and the number of local units in SBS by NUTS2.
Table 7.
Correlation per country between the number of firms in Amadeus and the number of local units in SBS by NUTS2.
| Country | N | R | Number of Firms in Amadeus | Number of Local Units in SBS |
|---|
| BE | 11 | 0.985 | 342,854 | 560,043 |
| DK | 5 | 0.997 | 109,927 | 240,347 |
| ES | 20 | 0.987 | 867,870 | 2,677,308 |
| FR | 27 | 0.993 | 1,056,281 | 3,409,402 |
| NL | 12 | 0.996 | 341,834 | 899,779 |
| UK | 39 | 0.978 | 1,310,491 | 2,031,044 |
The situation is less clear when one looks at the combination NUTS2 and NACE2,
i.e., the spatial and the sectoral differentiation, but one needs to take into account the significantly higher number of cases resulting from crossing the NUTS2 regions with the NACE2 codes (
Table 8). The result is even more discouraging when looking at the weighted correlation of proportions. However, this is just a confirmation of the observation made above on national level differentiated only by sector. Again, excluding some sectors immediately increases the correlations (excluding just NACE 82 in the UK increases the correlation to 0.82 and the weighted correlation of proportions to 0.64).
Table 8.
Correlation by country between the number of firms in Amadeus and the number of local units in SBS by NUTS2 and NACE2 (for those combinations where the number of firms per NUTS2 and NACE2 > 5 − weights = average number of firms between Amadeus and SBS).
Table 8.
Correlation by country between the number of firms in Amadeus and the number of local units in SBS by NUTS2 and NACE2 (for those combinations where the number of firms per NUTS2 and NACE2 > 5 − weights = average number of firms between Amadeus and SBS).
| Country | N | R of Absolute Numbers | Weighted R of Proportions | Number of Firms in Amadeus | Number of Local Units in SBS |
|---|
| BE | 596 | 0.96 | 0.93 | 341,456 | 559,714 |
| DK | 300 | 0.89 | 0.82 | 109,863 | 240,228 |
| ES | 993 | 0.75 | 0.50 | 864,599 | 2,674,908 |
| FR | 1291 | 0.97 | 0.96 | 1,055,959 | 3,283,256 |
| NL | 697 | 0.78 | 0.55 | 341,623 | 898,803 |
| UK | 2196 | 0.66 | 0.21 | 1,308,410 | 1,966,425 |
In order to evaluate the impact of different sectors, I calculated the correlations per country between number of Amadeus firms and SBS local units per NUTS2 and NACE one-letter codes. As can be seen in
Table 9, there are some sectors with quite low correlations, but 10 out of 13 are above 0.8. These results do not change significantly when excluding large and very large firms. However, using weighted correlations of proportions does show more differentiation amongst sectors, with some sectors, notably utilities, but also a series of other sectors, showing significantly lower correlations.
6.3. Conclusions on the Usability of the Amadeus Database
From the above comparative analyses, it becomes clear that researchers always have to take care to analyse what the data they use actually represents. In general, however, it seems that at least for some countries, and for most economic sectors, headquarter-based micro-data such as the Amadeus database can be used for analyses in economic geography without taking the risk of completely different results than with local units-based data. Specifically, the additional variables available in databases based on balance sheets are worth the effort to steer around the problems inherent in the data to leverage this wealth of information. In some cases, notably for some types of variables, it might be necessary to limit the analysis to larger companies in order to access a larger set of variables.
Table 9.
Correlation by NACE-letter code between the number of firms in Amadeus and the number of local units by NUTS2 and by NACE2.
Table 9.
Correlation by NACE-letter code between the number of firms in Amadeus and the number of local units by NUTS2 and by NACE2.
| NACE Letter | Sector | N | R | Weighted R of Proportions | Number of Firms in Amadeus | Number of Local Units in SBS |
|---|
| B | Mining and Quarrying | 565 | 0.53 | 0.82 | 9878 | 9571 |
| C | Manufacturing | 2712 | 0.92 | 0.90 | 352,591 | 708,841 |
| D | Electricity, Gas, Steam and Air Conditioning Supply | 113 | 0.60 | 0.10 | 22,466 | 59,387 |
| E | Water Supply; Sewerage, Waste Management and Remediation Activities | 452 | 0.82 | 0.45 | 13,469 | 36,954 |
| F | Construction | 342 | 0.87 | 0.66 | 698,686 | 1,450,478 |
| G | Wholesale and Retail Trade; Repair Of Motor Vehicles and Motorcycles | 342 | 0.87 | 0.56 | 864,346 | 2,803,878 |
| H | Transportation and Storage | 570 | 0.82 | 0.66 | 130,964 | 505,369 |
| I | Accommodation and Food Service Activities | 228 | 0.88 | 0.48 | 244,860 | 904,047 |
| J | Information and Communication | 684 | 0.90 | 0.97 | 266,072 | 467,777 |
| L | Real Estate Activities | 114 | 0.91 | 0.69 | 336,497 | 518,553 |
| M | Professional, Scientific and Technical Activities | 798 | 0.81 | 0.80 | 631,035 | 1,613,197 |
| N | Administrative and Support Service Activities | 684 | 0.43 | 0.81 | 444,587 | 658,803 |
| S | Other Service Activities | 114 | 0.91 | 0.67 | 13,806 | 81,068 |
7. Some Maps as Results
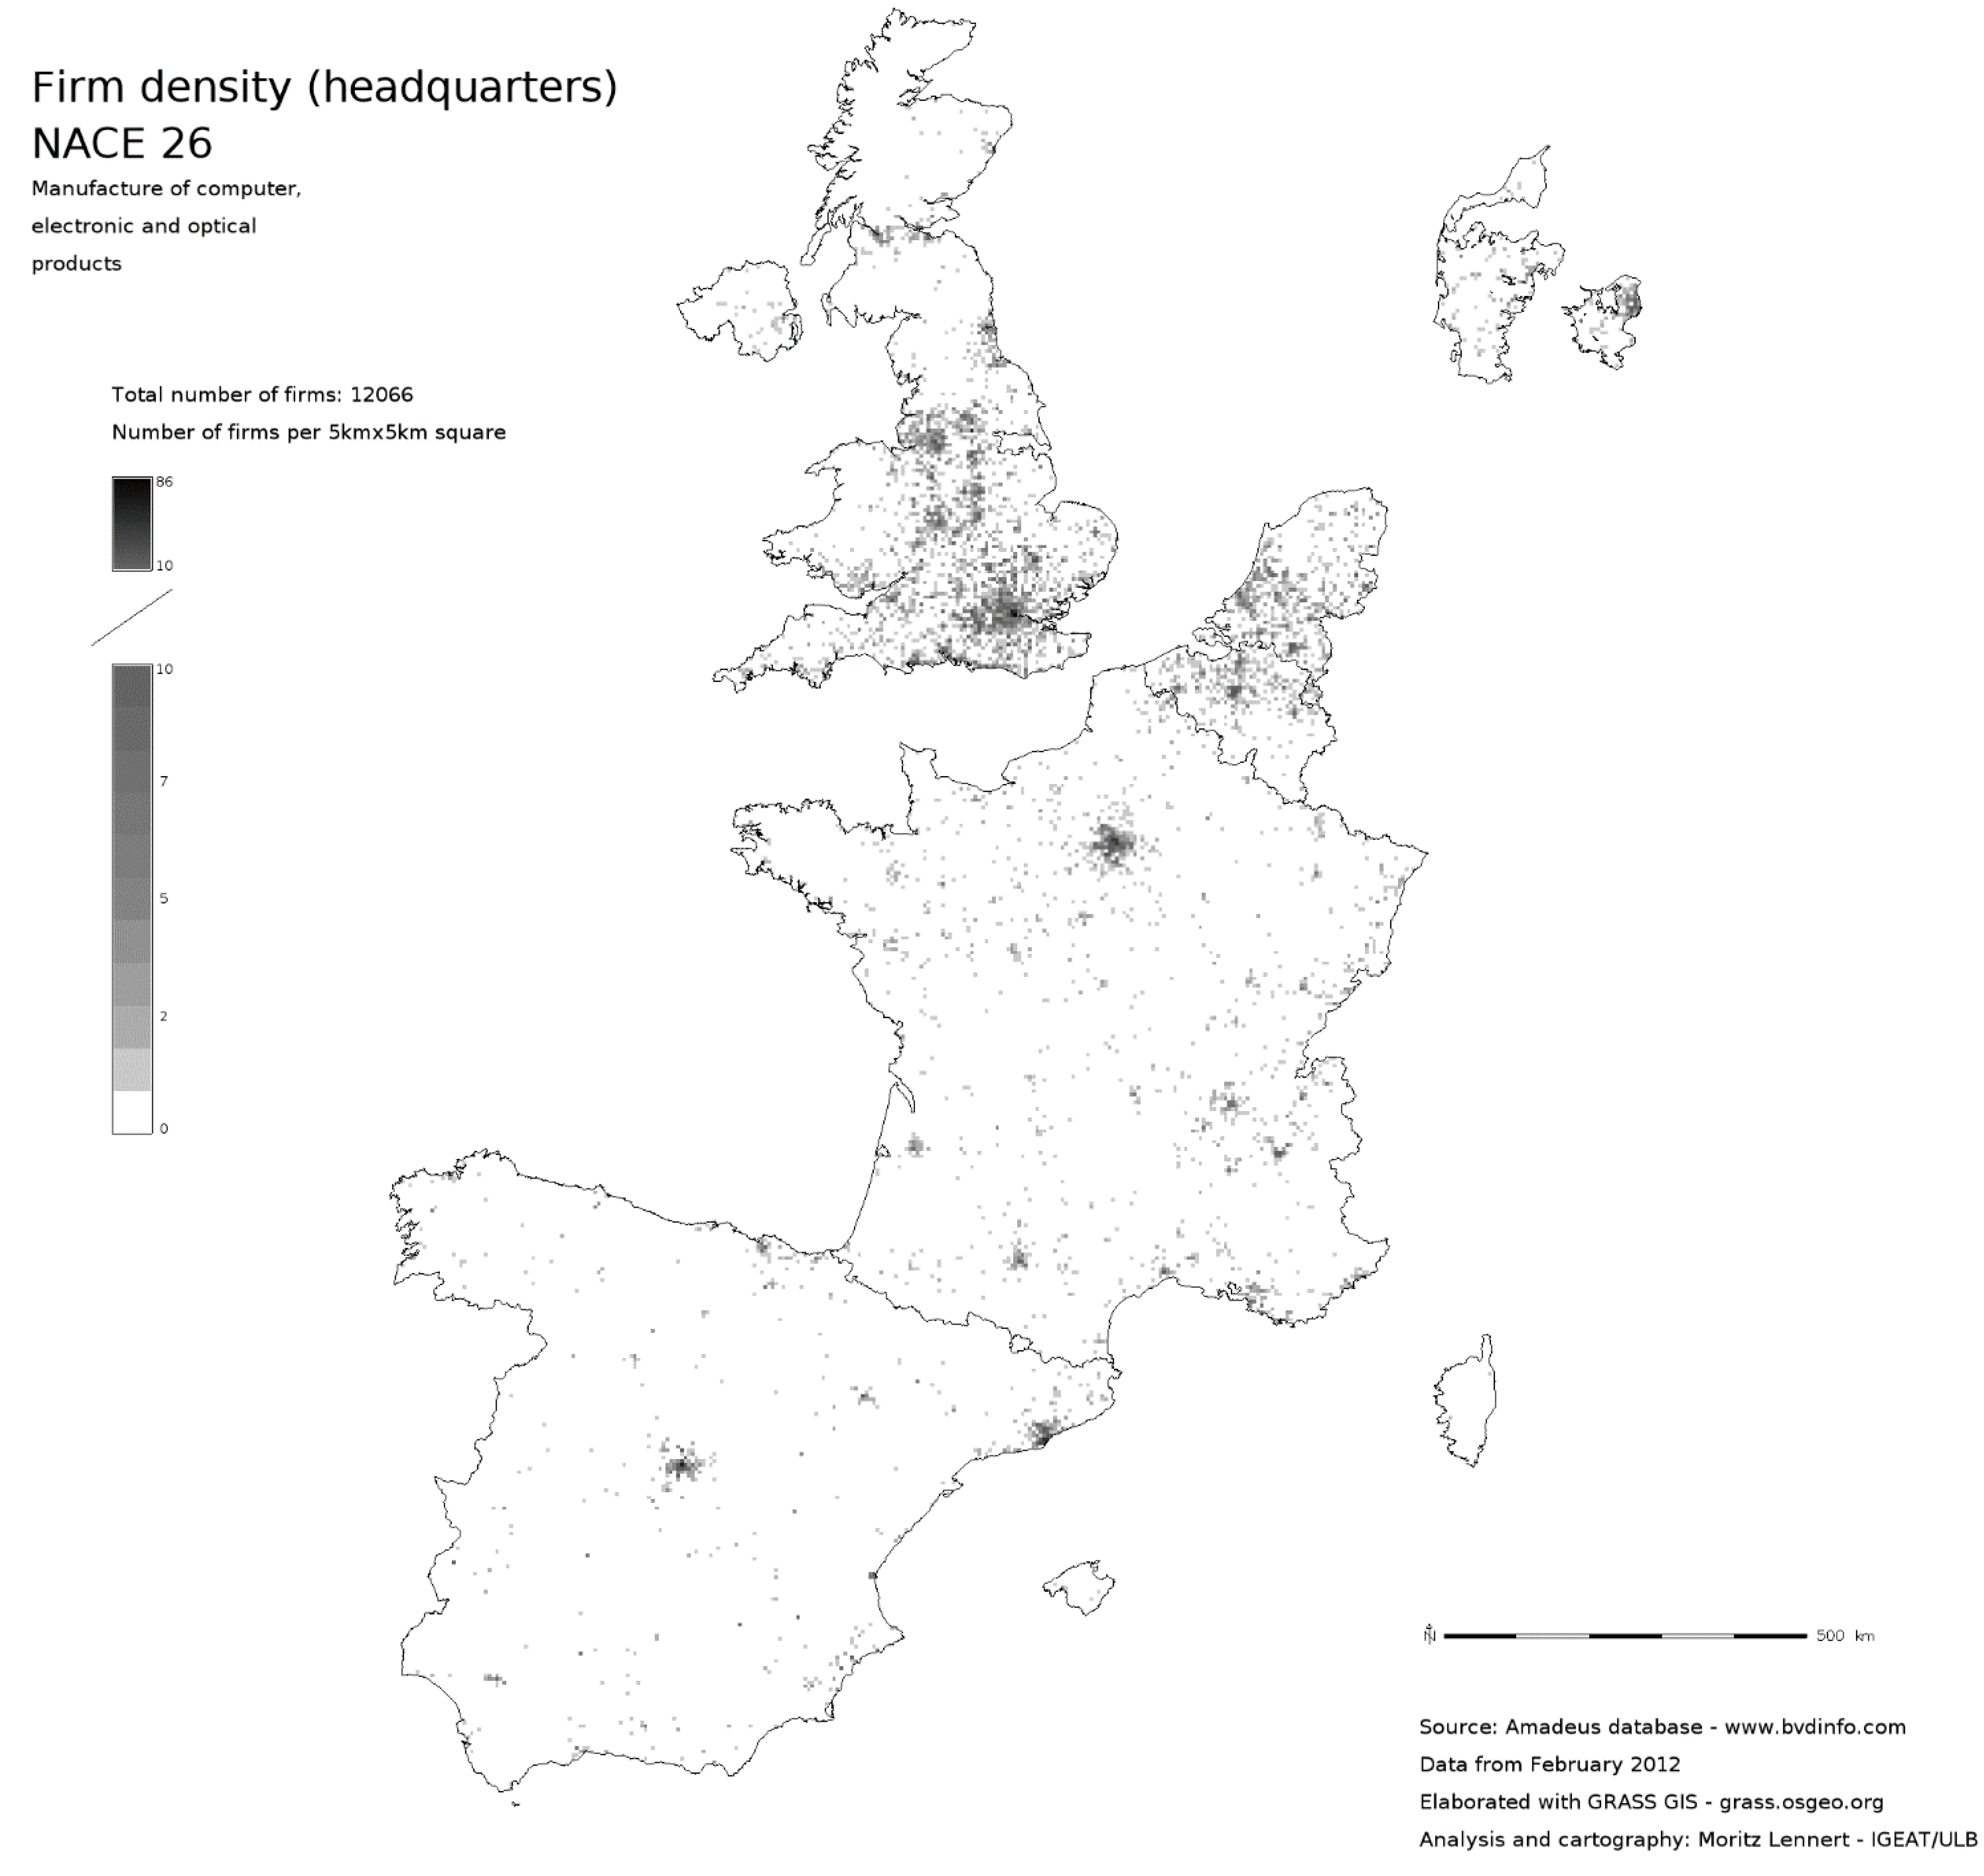
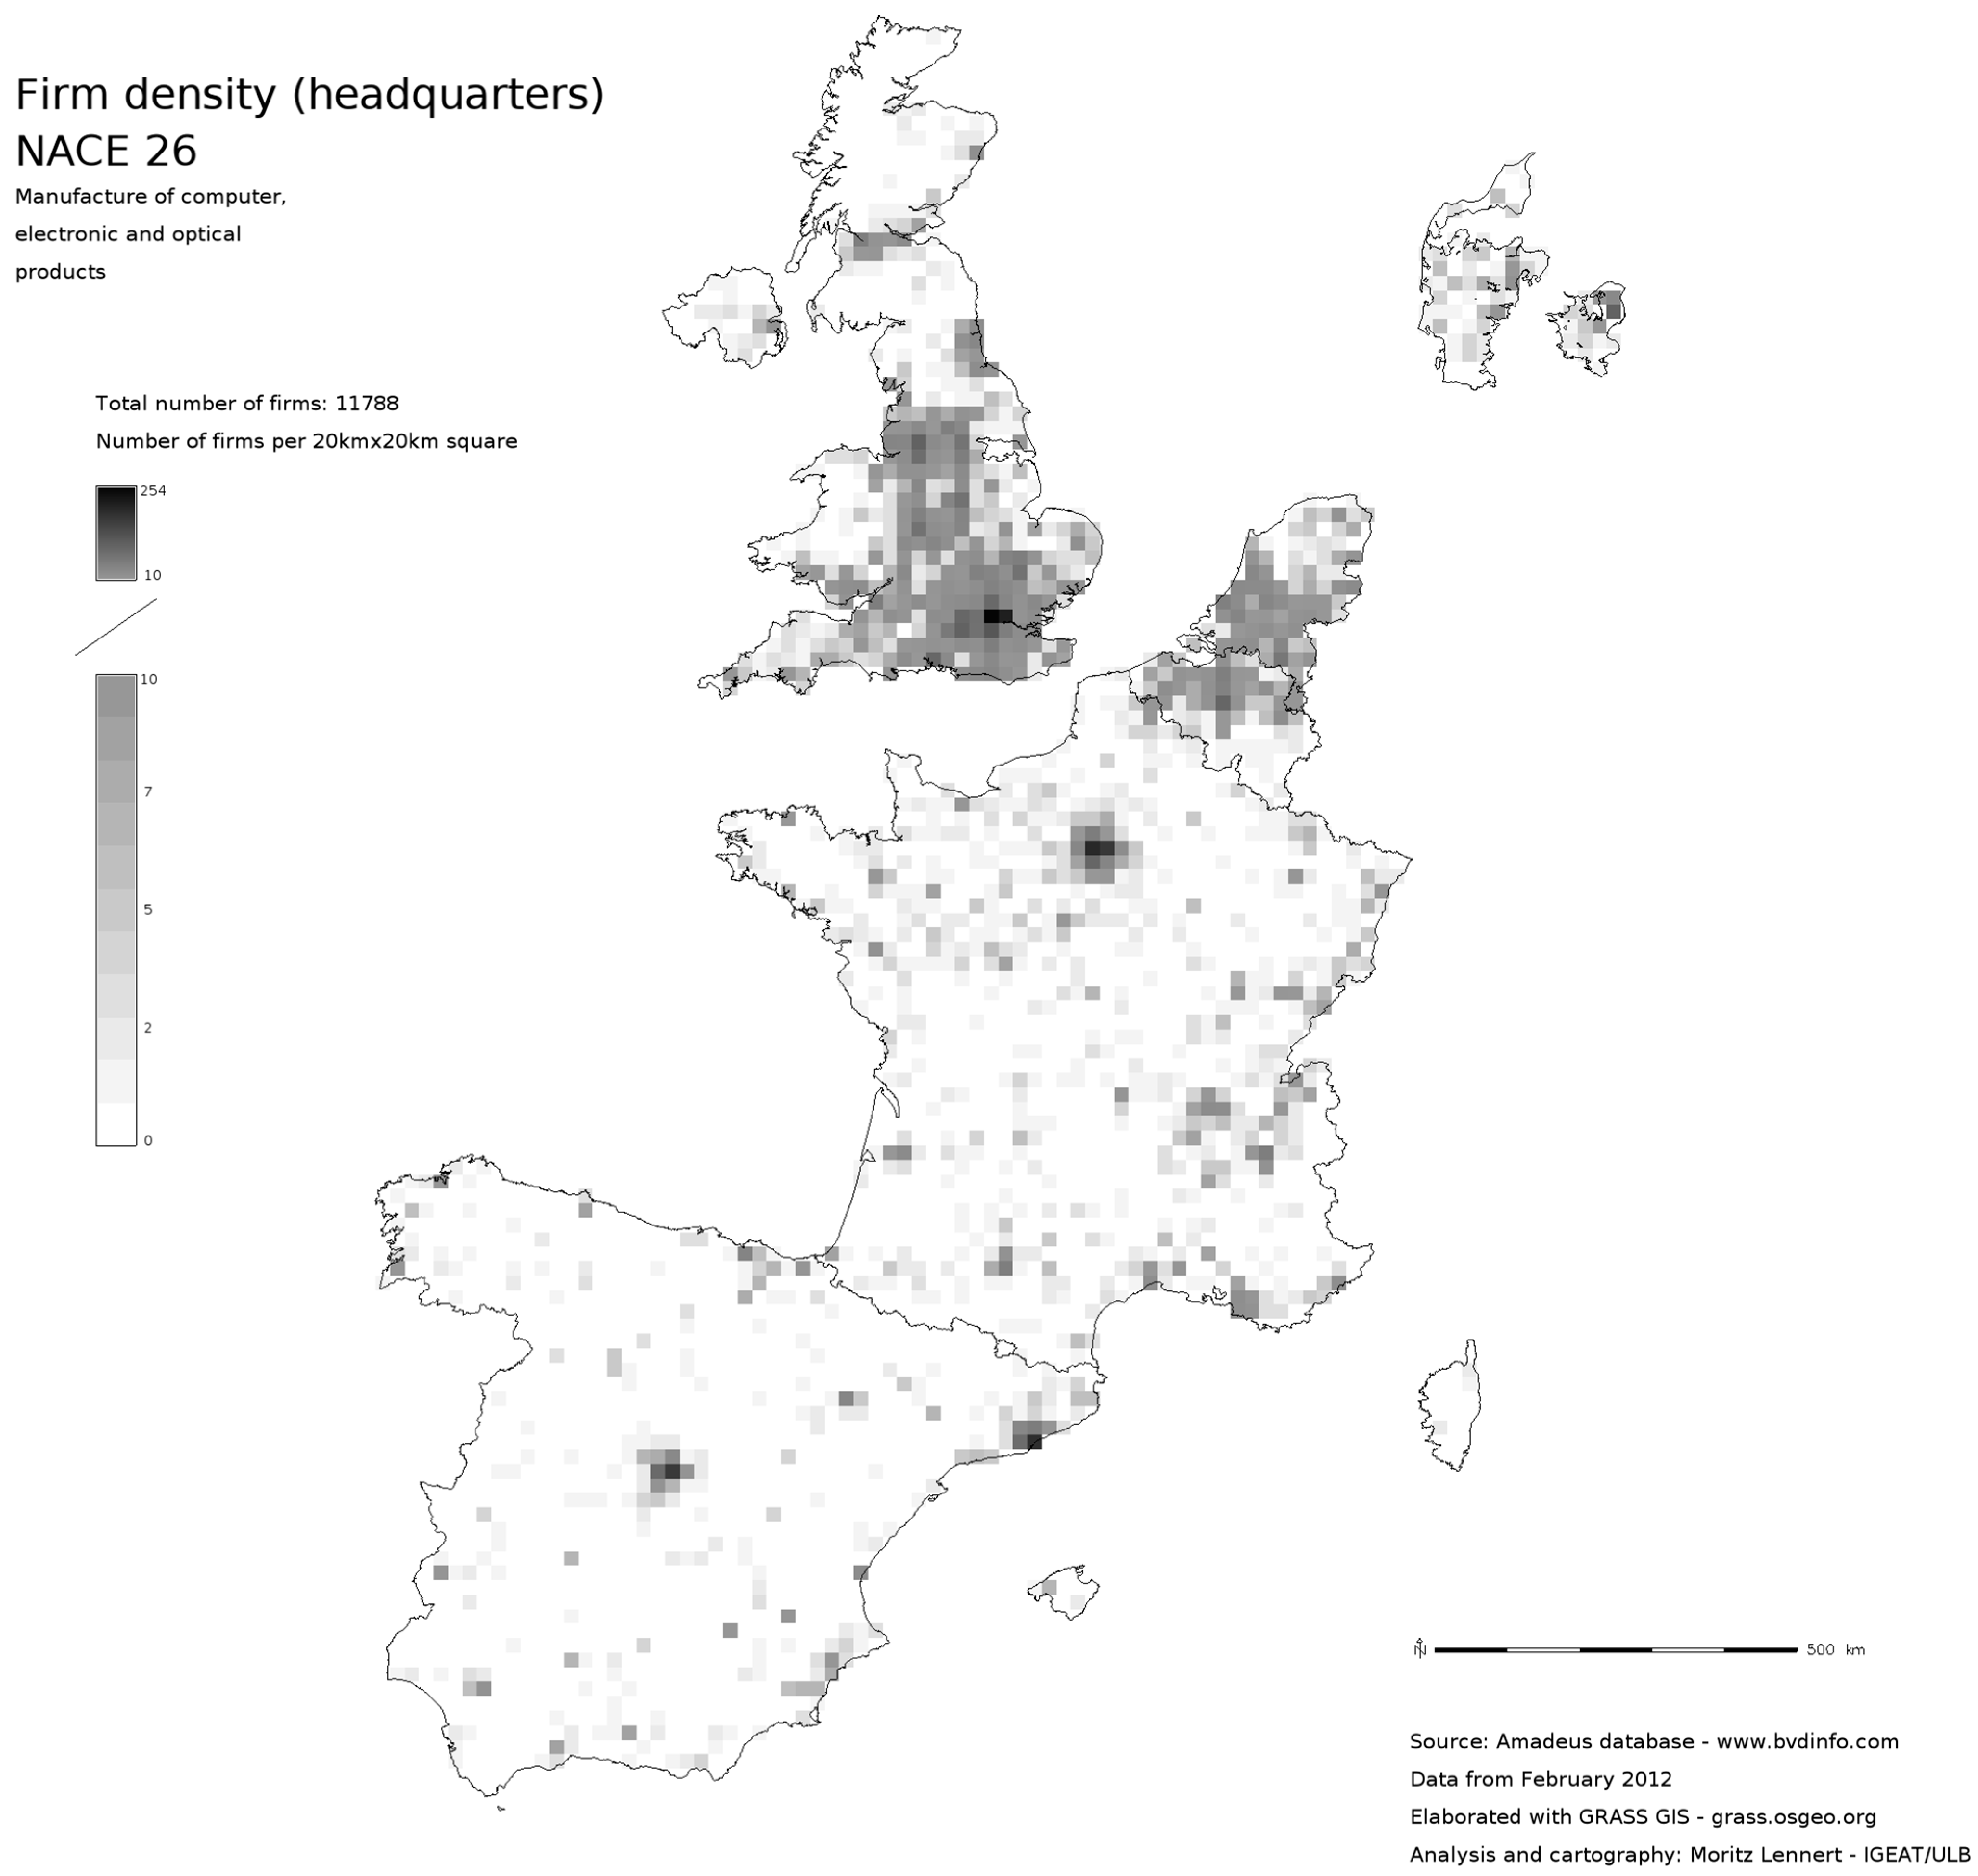
This article is mostly about the question of usability of the Amadeus database and about the possibilities of geocoding with open public data. However, it would be frustrating to not see at least a few results coming out of the database. In this section, I, therefore, present a few maps that hint at the possibilities that the use of such massive micro-data offers. These maps notably show the flexibility in mapping the data at different scales, but also the higher sectoral resolution these data offer compared, for example, to structural business statistics of Eurostat.
Figure 1,
Figure 2 and
Figure 3 show the localisation of firms in NACE sector 26 (Manufacture of computer, electronic and optical products) at three different scales: a dot-map in which each firm is represented by a dot, a 5 km
2 and a 20 km
2 density map. As a comparison
Figure 4 shows the density of companies per km
2 by NUTS2 unit based on SBS data. One can see that the overall pattern is the same, but that the internal differentiation within NUTS2 is obviously completely lost. Finally,
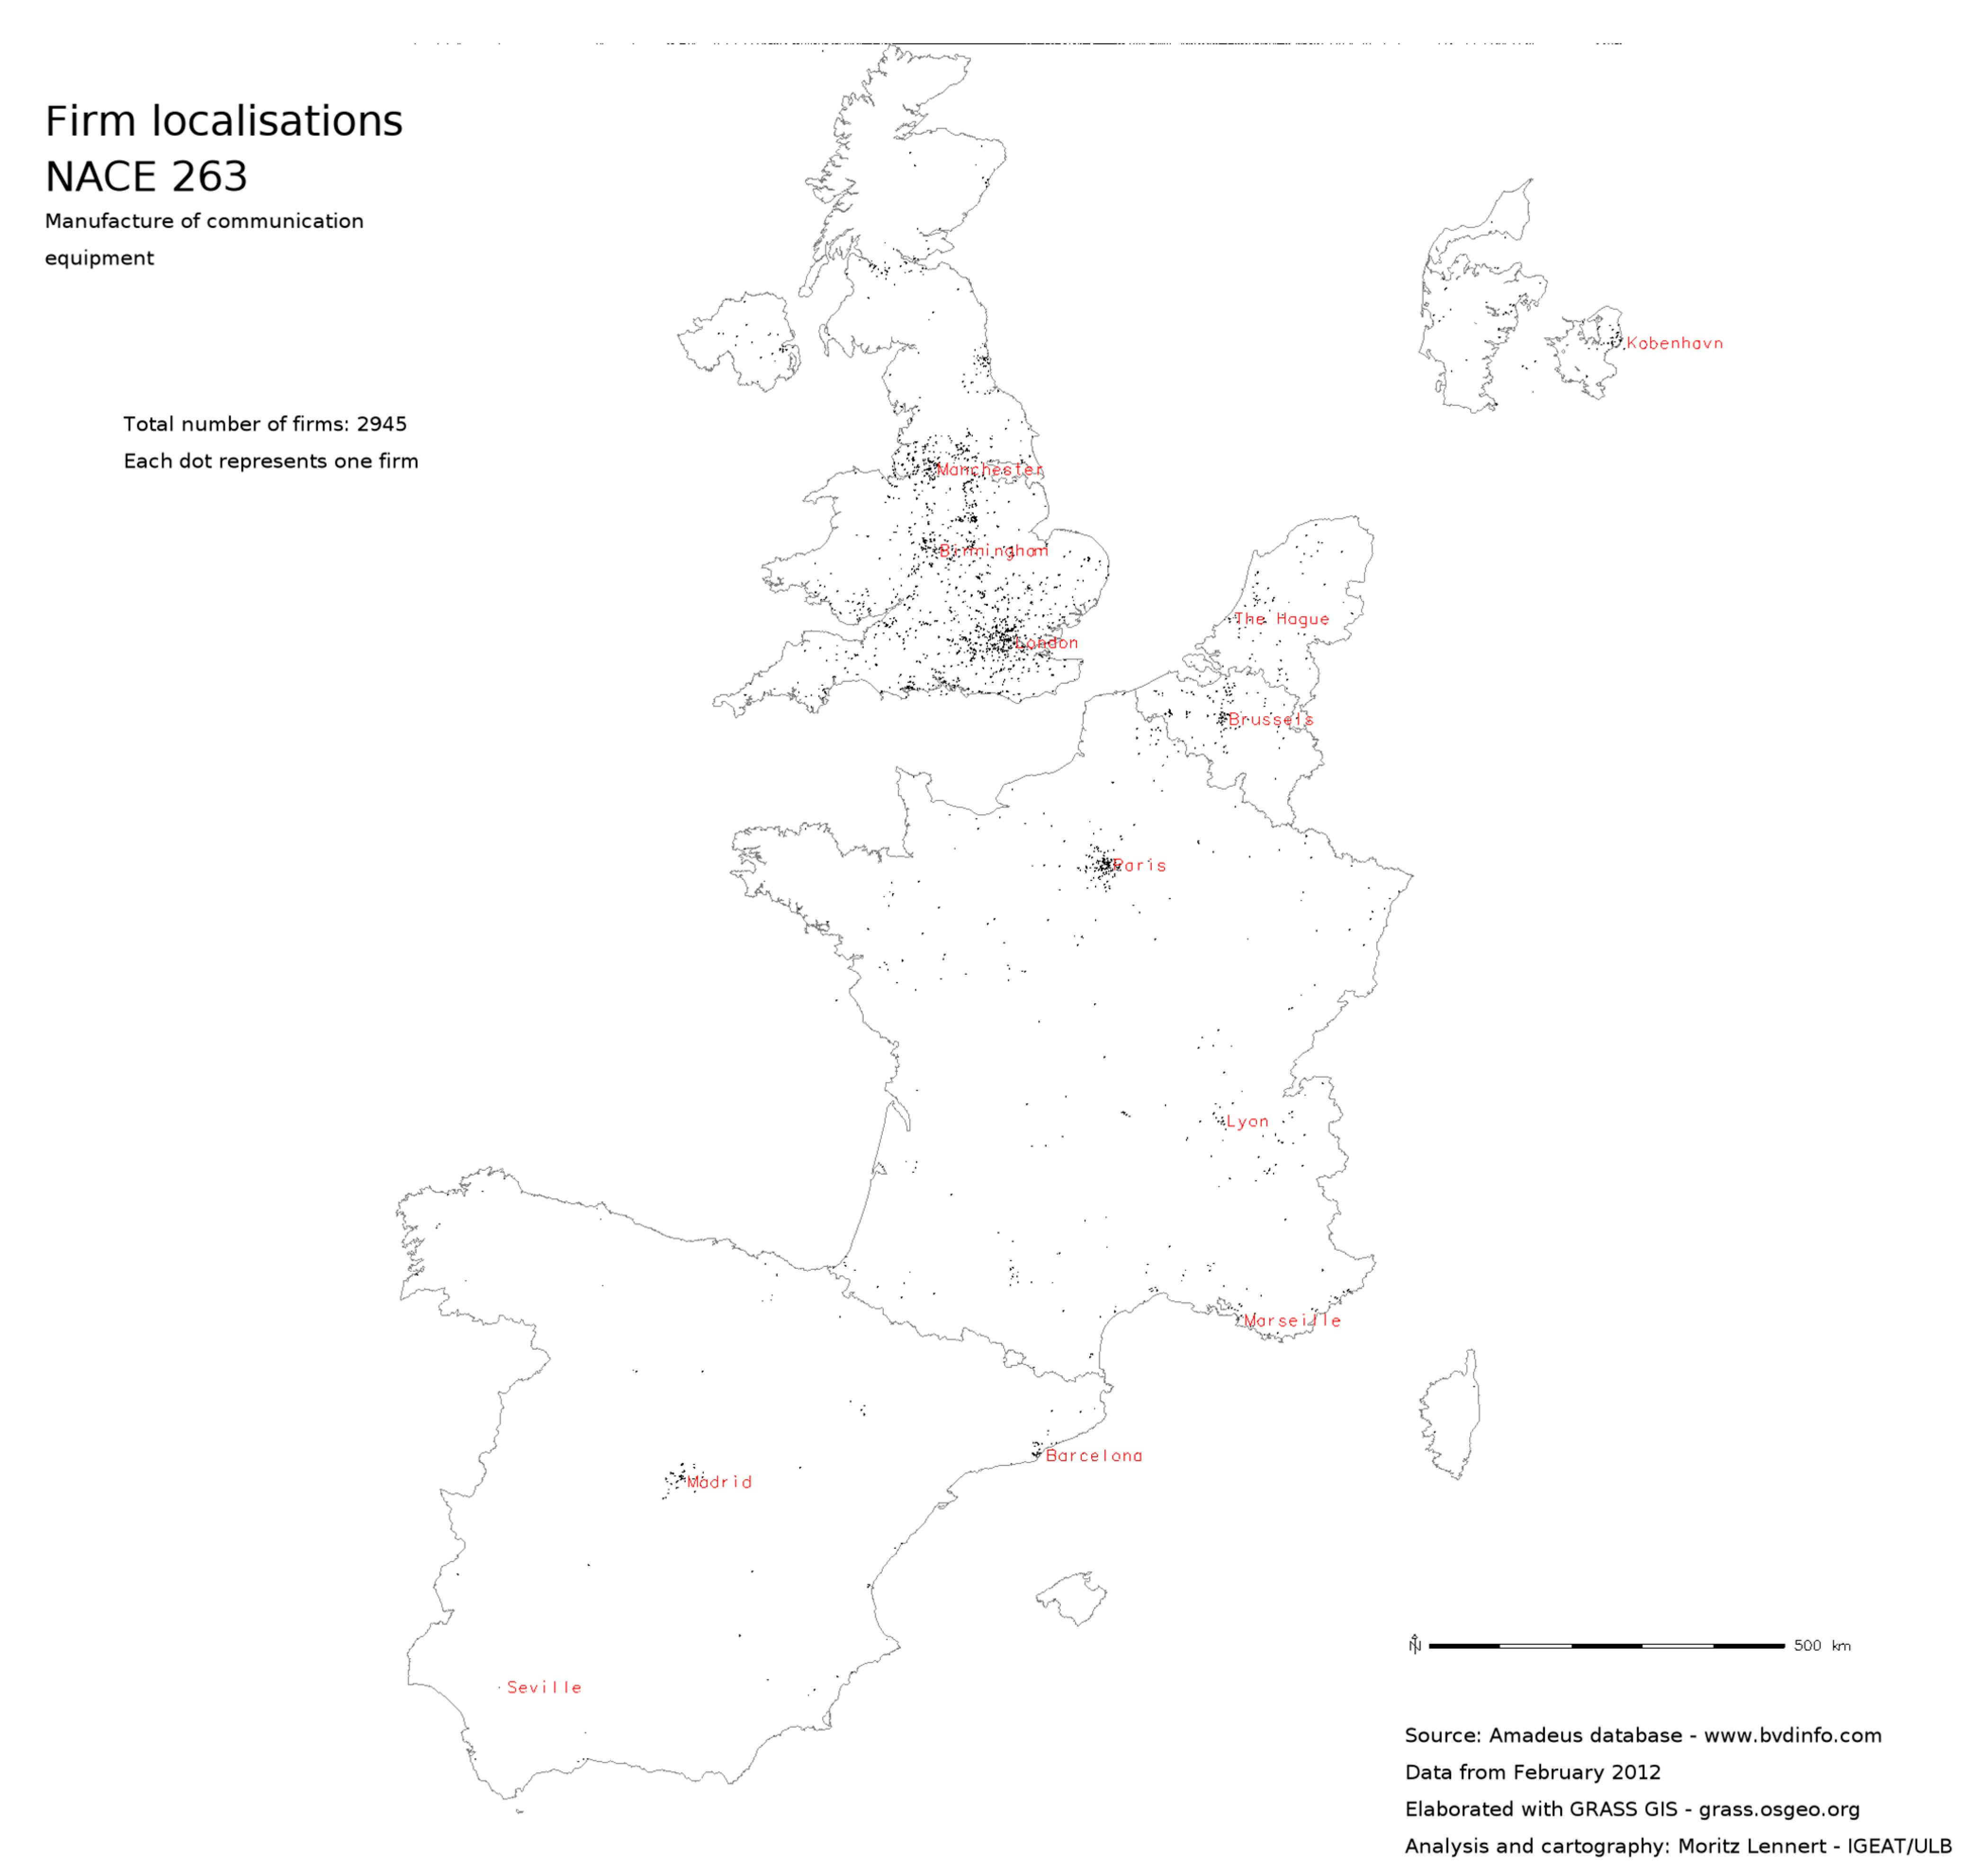
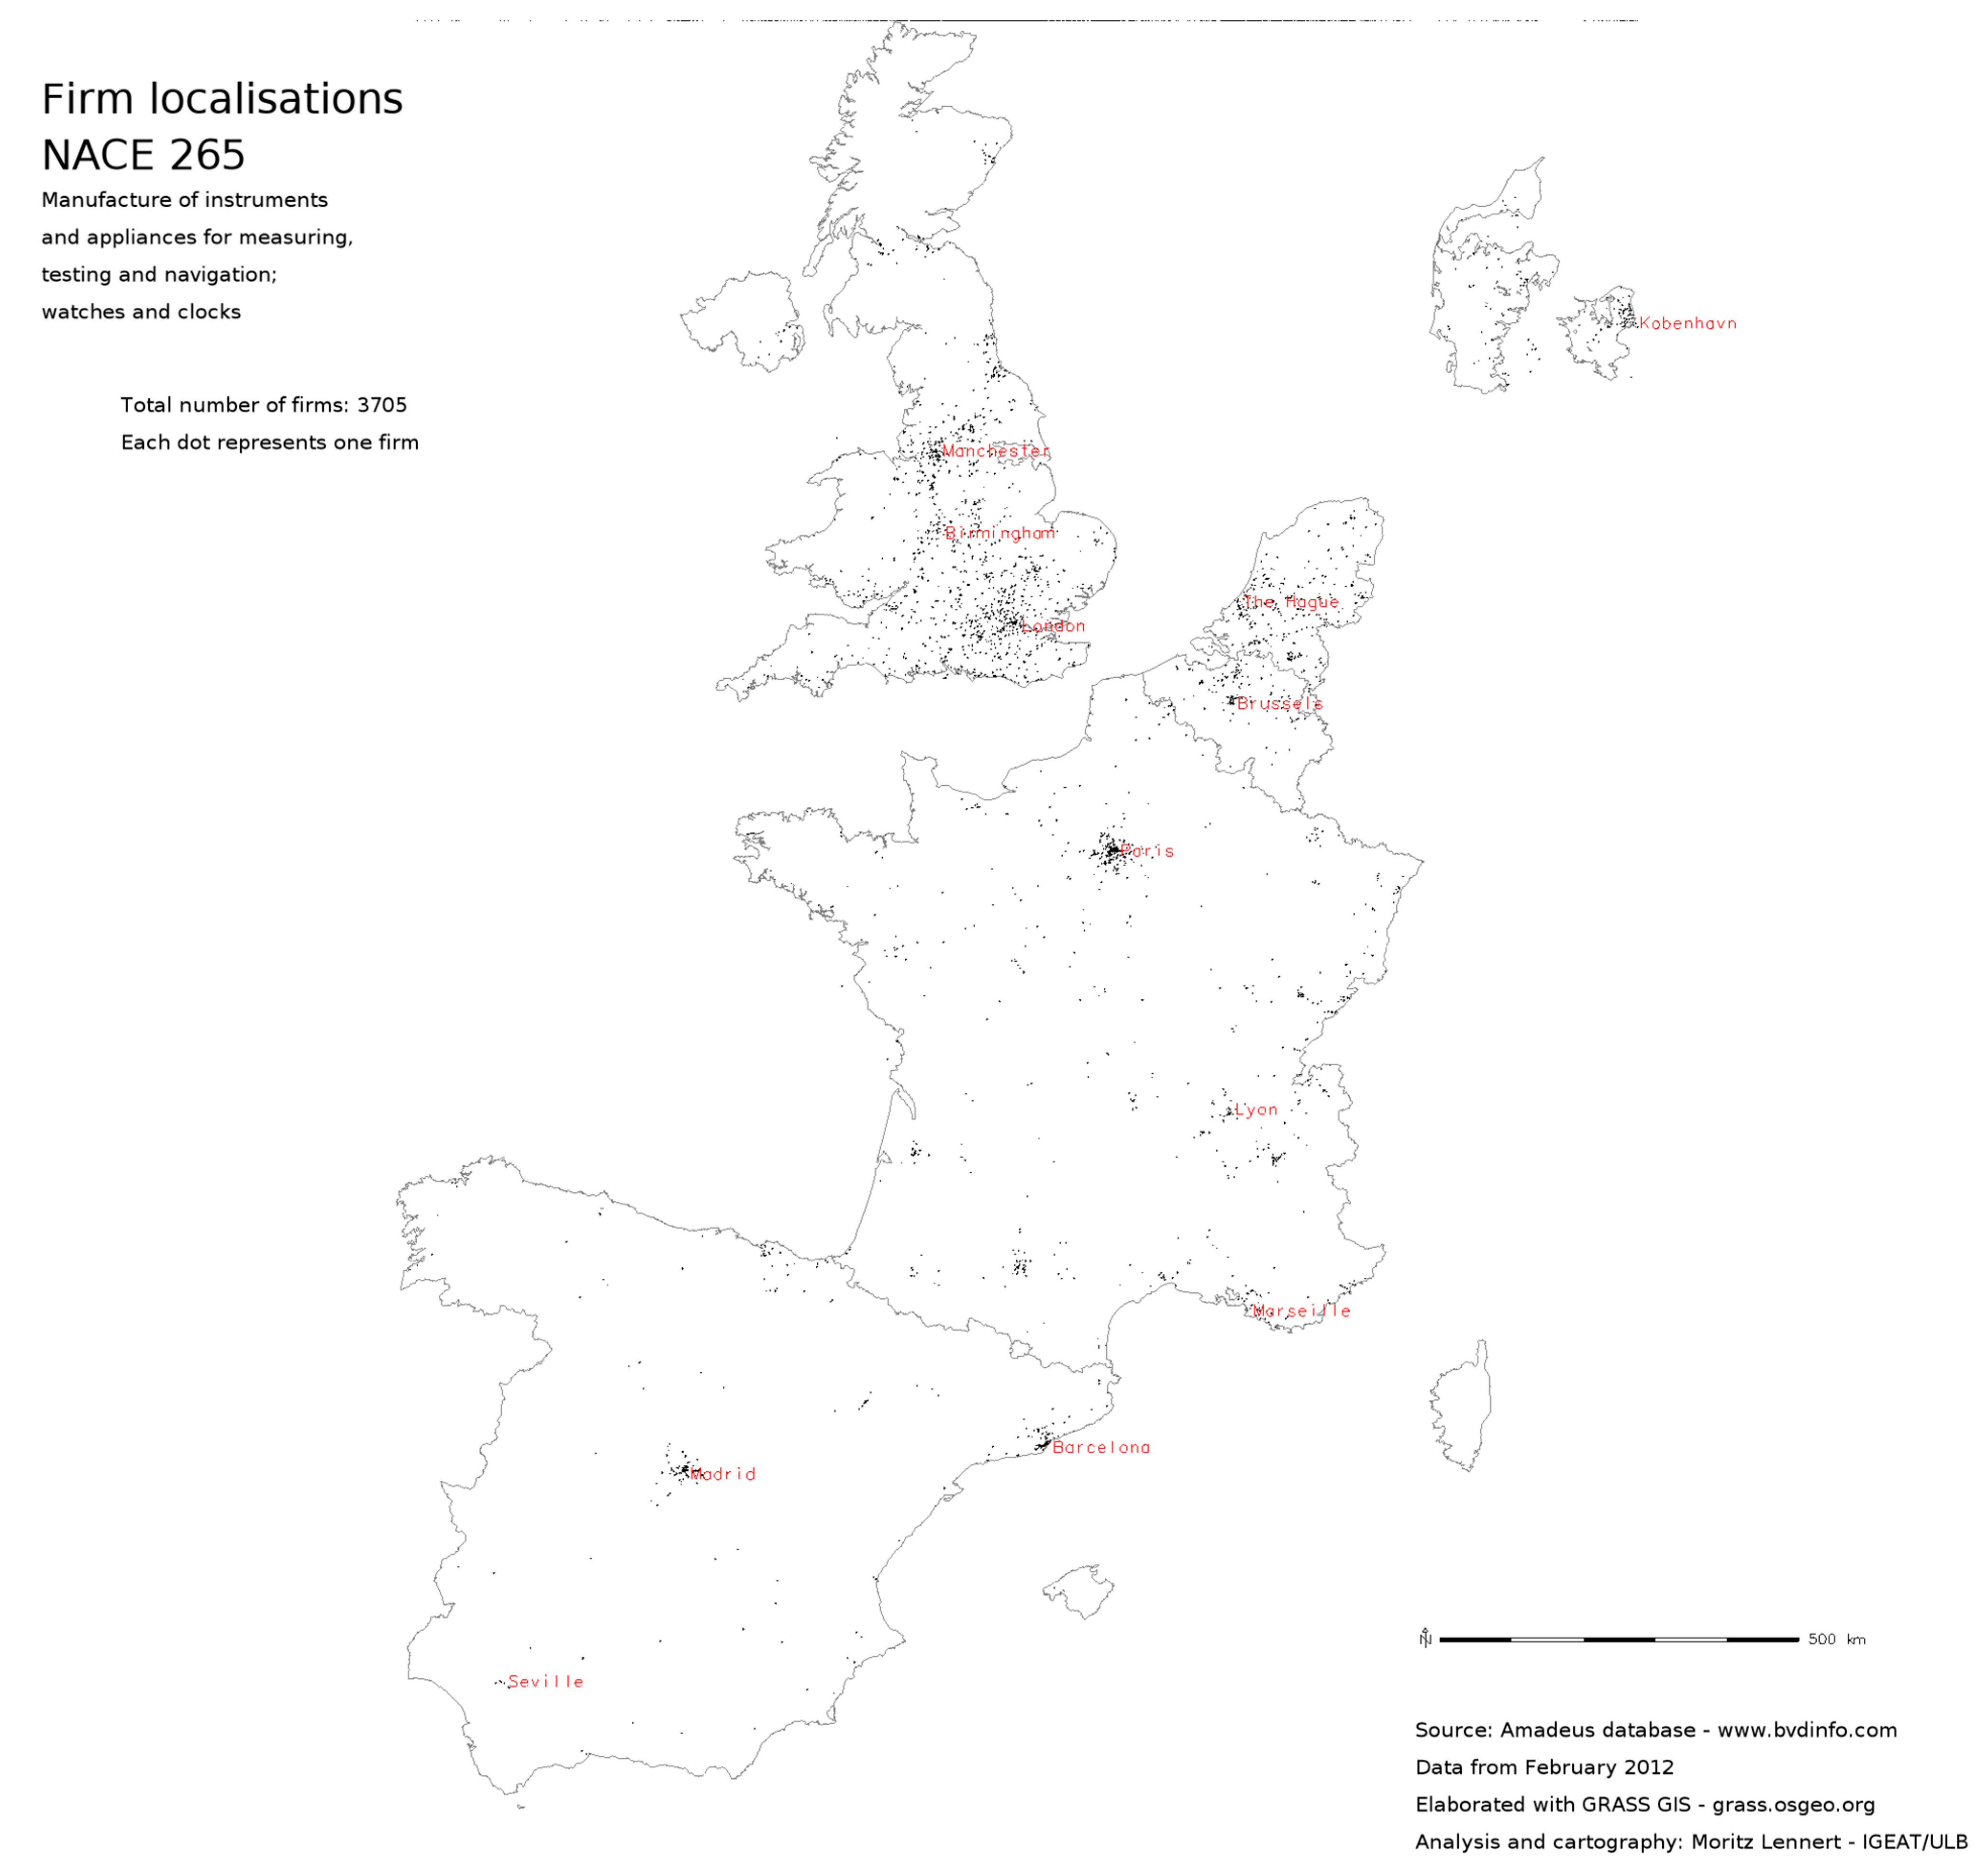
Figure 5 and
Figure 6 show to subsectors of NACE 26 in order to illustrate the possibility of analysing localisation at a finer sectoral resolution than SBS.
Figure 1.
Point map of firm localisation in NACE sector 26.
Figure 1.
Point map of firm localisation in NACE sector 26.
Figure 2.
20 × 20 km density map of firm localisatio in NACE sector 26.
Figure 2.
20 × 20 km density map of firm localisatio in NACE sector 26.
Figure 3.
Density of firm localisation by NUTS2 in NACE sector 26.
Figure 3.
Density of firm localisation by NUTS2 in NACE sector 26.
Figure 4.
The density of companies per km2 by NUTS2 unit based on SBS data
Figure 4.
The density of companies per km2 by NUTS2 unit based on SBS data
Figure 5.
Point map of firm localisation in NACE sector 263.
Figure 5.
Point map of firm localisation in NACE sector 263.
Figure 6.
Point map of firm localisation in NACE sector 265.
Figure 6.
Point map of firm localisation in NACE sector 265.
8. Conclusions
In this article, I have explored the usability of a large firm micro-data base for economic geography, looking both at the possibilities of geocoding the data in an affordable way using public address data or geocoding services and at the usability of the data in light of its limitations. Even though these limitations should not be taken too lightly, and even though geocoding demands a minimum level of knowledge in database manipulation and/or scripting of web services, the overall conclusion is that the data is usable and that it opens a whole new field to explore for economic geographers, both in terms of (flexibility of) scale of analysis and in terms of content of data, although results have to be treated with care.
The Amadeus database used in this experiment is a private database subject to a subscription fee. However, public databases do exist in the form of business registers. The latter are often more exhaustive in terms of their coverage of firms, but contain less variables. In addition, current confidentiality constraints limit access to precise localisation information, although it is difficult to understand why data that is publicly available in account databases should be subject to confidentiality concerns, especially when these data only concern firms, and not individuals or households. Basic data, such as detailed sector of activity, turnover and number of employees should be available without constraint, in connection with precise localisation based on geocoded address. With the INSPIRE directive providing a harmonised framework for data and, perhaps more importantly, web services, data processing chains become possible where an administration publishing data with postal addresses could integrate into its offering a web processing service that takes that data and runs it through the geocoding service of another administration.


