
Optimising Mobile Mapping System Laser Scanner Orientation


Abstract
: Multiple laser scanner hardware configurations can be applied to Mobile Mapping Systems. As best practice, laser scanners are rotated horizontally or inclined vertically to increase the probability of contact between the laser scan plane and any surfaces that are perpendicular to the direction of travel. Vertical inclinations also maximise the number of scan profiles striking narrow vertical features, something that can be of use when trying to recognise features. Adding a second scanner allows an MMS to capture more data and improve laser coverage of an area by filling in laser shadows. However, in any MMS the orientation of each scanner on the platform must be decided upon. Changes in the horizontal or vertical orientations of the scanner can increase the range to vertical targets and the road surface, with excessive scanner angles lowering point density significantly. Limited information is available to assist the manufacturers or operators in identifying the optimal scanner orientation for roadside surveys. The method proposed in this paper applies 3D surface normals and geometric formulae to assess the influence of scanner orientation on point distribution. It was demonstrated that by changing the orientation of the scanner the number of pulses striking a target could be greatly increased, and the number of profiles intersecting with the target could also be increased—something that is particularly important for narrow vertical features. The importance of identifying the correct trade-off between the number of profiles intersecting with the target and the point spacing was also raised.1. Introduction
Mobile Mapping Systems (MMSs) can enable rapid, efficient and accurate data collection in terrestrial and marine environments. Combining varieties of measurement sensors such as cameras [1], laser scanners [2], thermal cameras [3] or ground penetrating radar [4] on a moving platform allows data collection at speeds that are comparable to surrounding vehicles. This ability negates the need for road-closures and increases the safety of survey crew by keeping the surveyor separate from moving traffic. A combination of GNSS receivers, Distance Measurement Instruments (DMIs) and Inertial Measurement Units (IMUs) enable direct georeferencing of spatial data without the need for ground control. Point clouds of city, urban or rural environments can then be used in multiple potential projects, ranging from transport projects [5] to river surveys [6], vegetation studies [7] or city models for analysing pedestrian behaviour [8]. The most common scanner type on commercial MMSs used to create these point clouds is the 2D full-circle scanner ([2,9–11]). This type of scanner relies on the forward motion of the MMS to provide the third dimension and results in a corkscrew scanning pattern.
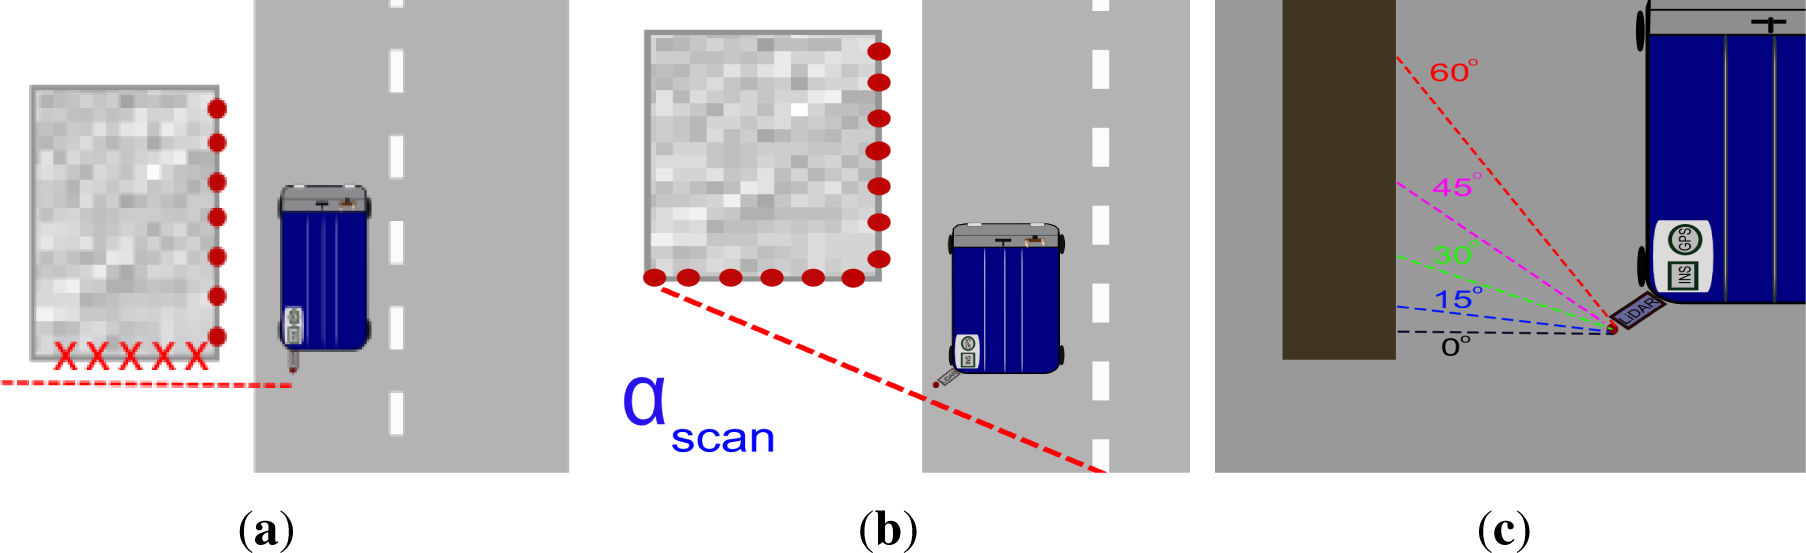
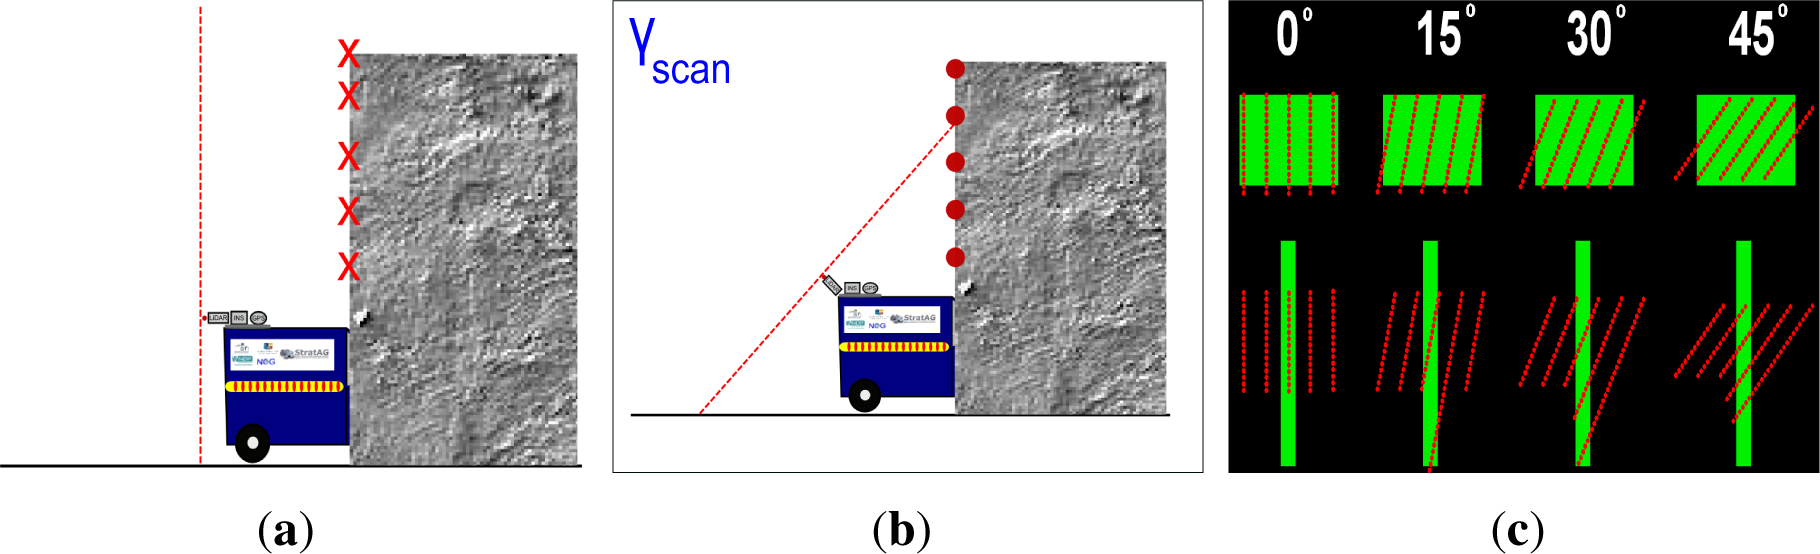
It is survey best practice when using 2D laser scanners on an MMS to orientate the laser scanner(s) on the survey platform to maximise coverage of the environment. Improving our understanding of how the changes in scanner orientation affect the scanning pattern can provide many potential benefits. Horizontal rotations of the scanner ensure contact between the 2D scan plane and any structures that are perpendicular to the direction of travel of the vehicle, something that would not occur if no rotation was applied, as demonstrated in Figure 1a,b. One side-effect of incorporating a horizontal rotation of a 2D scanner is that the range to target is increased (Figure 1c), which will result in a larger point spacing and therefore reduce point density.
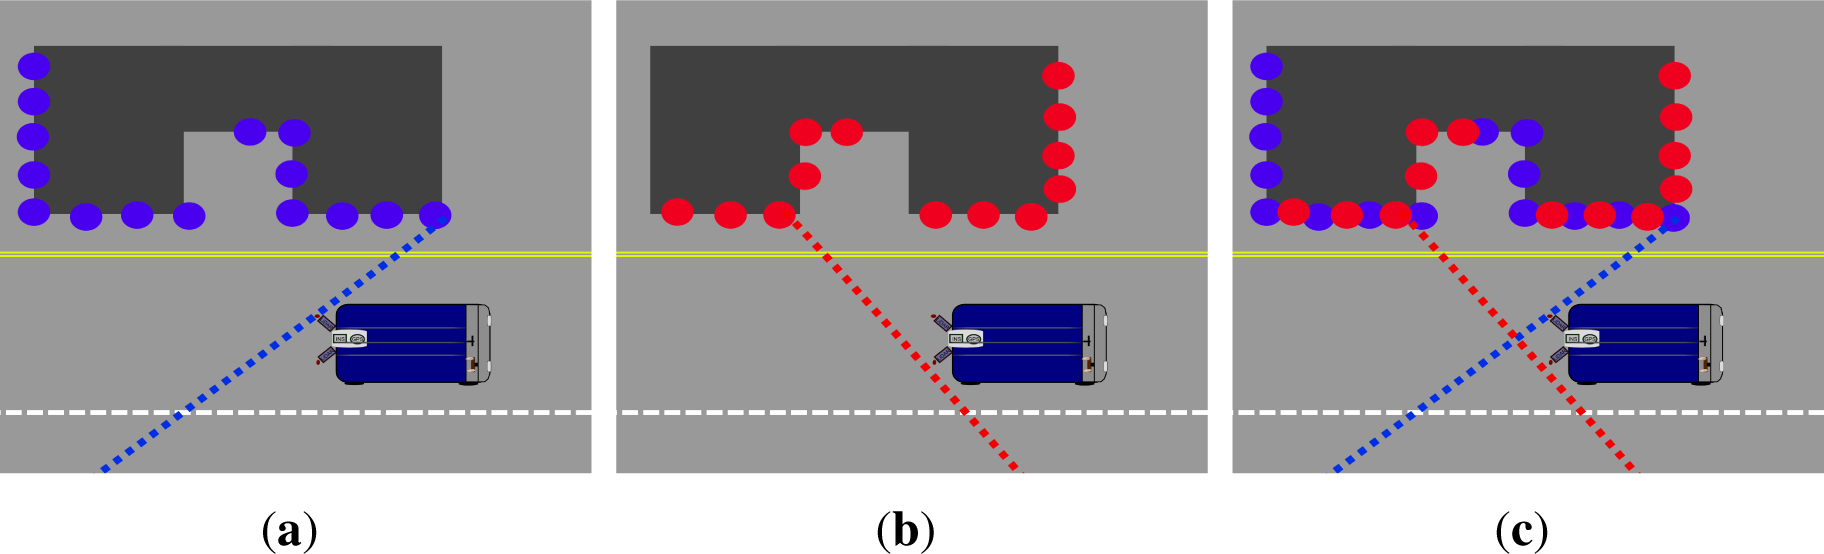
It is also survey best practice to introduce a vertical inclination of the laser scanner. This enables overhead structures that are perpendicular to the direction of travel to be captured by the scan plane, as demonstrated in Figure 2a,b. An additional benefit of incorporating a vertical inclination of the scanner is that the number of scan planes coming into contact with a vertical structure can be increased. The profile spacing is largely controlled by the vehicle velocity and the scanner mirror frequency, but narrow objects can be missed entirely by subsequent scan profiles. A vertical inclination of the scanner can mitigate this risk, as demonstrated in Figure 2c, whereby the 45° rotation results in multiple scan profiles intersecting with the narrow vertical target. A combination of both a horizontal rotation and vertical inclination, providing the benefits of both and referred to in this paper as a dual axis scanner rotation, is employed in many of the commercial systems already referenced [2,9–11].
Incorporating a second scanner will also benefit MMS coverage. This is because the scan plane from one scanner can capture data that may be hidden to the second scanner. This is the major benefit of a dual scanner system and it not only increases the data volume on all surfaces but also reduces the risk of requiring a resurvey of an area to fill in data shadows. Figure 3a illustrates the interaction between a nearside scanner and a roadside structure. The scan plane does not come into contact with certain parts of the structure and therefore data shadows appear. Figure 3b demonstrates this principle for the scanner on the other side of the vehicle, although the area of shadow then becomes reversed. In Figure 3c the dual scanner system has surveyed each side of the structure that is visible from the road and all data shadows have been eliminated.
Survey specifications such as [12–14] specify strict guidelines for what point density is required for specific areas in a survey. Capturing information with the required point density is particularly important when automated algorithms will be used to extract features from the point cloud. Automated algorithms are a popular research topic in the mobile mapping community, as the potential savings in processing time that arise from automating these workflows are very attractive to industry. A number of works [15–21] demonstrate how non-trivial it is to create these algorithms, particularly when point density is low [22,23]. For example, the authors in [24–27] demonstrate that on cylindrical objects, either a minimum profile spacing or point spacing or both are required if trying to automate the process of identifying these features in a point cloud. Thus, there is strong justification for further research aimed at improving the point spacing, profile spacing or overall point density of objects in the point cloud to facilitate automatic recognition.
2. Background and Related Work
Changes in the scanner orientation can help maximise the information that the surveyor captures on objects in the point cloud. The effects of variations in MMS configuration and hardware have been of interest to the research community and industry for quite some time. To date, these tests have been carried out using multiple systems in benchmarking tests, LiDAR simulations or other methods, such as MIMIC, designed by the National Centre for Geocomputation at Maynooth University. The importance of this topic is becoming apparent as research groups and industry are beginning to provide more flexibility in their scanner mounting.
2.1. System Benchmarking
In their work on MMS benchmarking, [28] benchmarked a number of mobile mapping systems, providing results for a collection of commercial and research platforms. LiDAR simulations such as those developed in [29] for Aerial platforms are also popular and useful tools for assessing LiDAR system performance. These have been adapted for terrestrial platforms, as [30] demonstrated when they simulated multiple scanner orientations and scanner positions to minimise data shadows and developed metrics to visualise the point density in 3D urban scenes. In [31], a LiDAR simulator was used to perform MMS benchmarking. Tools such as Rigel’s RiACQUIRE [32] also provide the functionality to test system performance; the ability to specify additional target and scanner parameters would help increase accuracy.
2.2. MIMIC: Mobile Mapping System Point Density Calculator
Although the horizontal and vertical orientation of the scanner varied over each system in the benchmarking tests listed above, these studies were not focussed on examining the sole influence of scanner orientation, and therefore further study is required to isolate its influence. An as yet unreleased prototype system, the “MobIle Mapping point densIty Calculator” or “MIMIC” has been designed and developed at the National Centre for Geocomputation at Maynooth University. MIMIC is an innovative system for calculating point distribution and point density. MIMIC and the multiple variables that need to be considered when designing a system to calculate point density were first introduced in [33], and the formulae and processes used for its design and experimental validation are detailed in [34–37]. MIMIC calculates the theoretically optimal position that each laser pulse strikes a surface, and therefore random events such as occlusions, multiple returns and different surface types are not modelled. The purpose of MIMIC is to provide a tool for assessing MMS hardware configurations during mission planning stage or during MMS benchmarking, and therefore a standard scenario (the theoretically optimal position of each pulse) is considered to be suitable. MIMIC is compatible with different scanner hardware, scanner configurations, vehicle variables and target variables and provides detailed information in tabular or graphical format (using interpolation techniques designed in [38]) to help visualise point and profile distribution.
2.3. Adjustable Mounts
In the majority of hardware datasheets, very little information is available for operators on how important the scanner orientation is, largely due to the fixed nature of the scan and navigation hardware casings, such as ([2,9–11]). These systems are designed to protect the MMS hardware, keeping them contained in a water-and dust-proof casing, ensuring a constant lever-arm offset in the configuration and minimising the risk of boresight misalignments. They also enable easy transport and mounting of the hardware on different platforms and are designed to make the work of the MMS operator easier and to streamline the system calibration process. However, a number of MMS operators and scanner manufacturers have recognised the need to incorporate flexibility into their system configuration. These “adaptable” mounts can be subdivided into those that allow the orientation of the scanner to be altered in the horizontal or vertical. To the best of the authors’ knowledge, no adaptable mounts allow the orientation of the scanner to be altered in both axes.
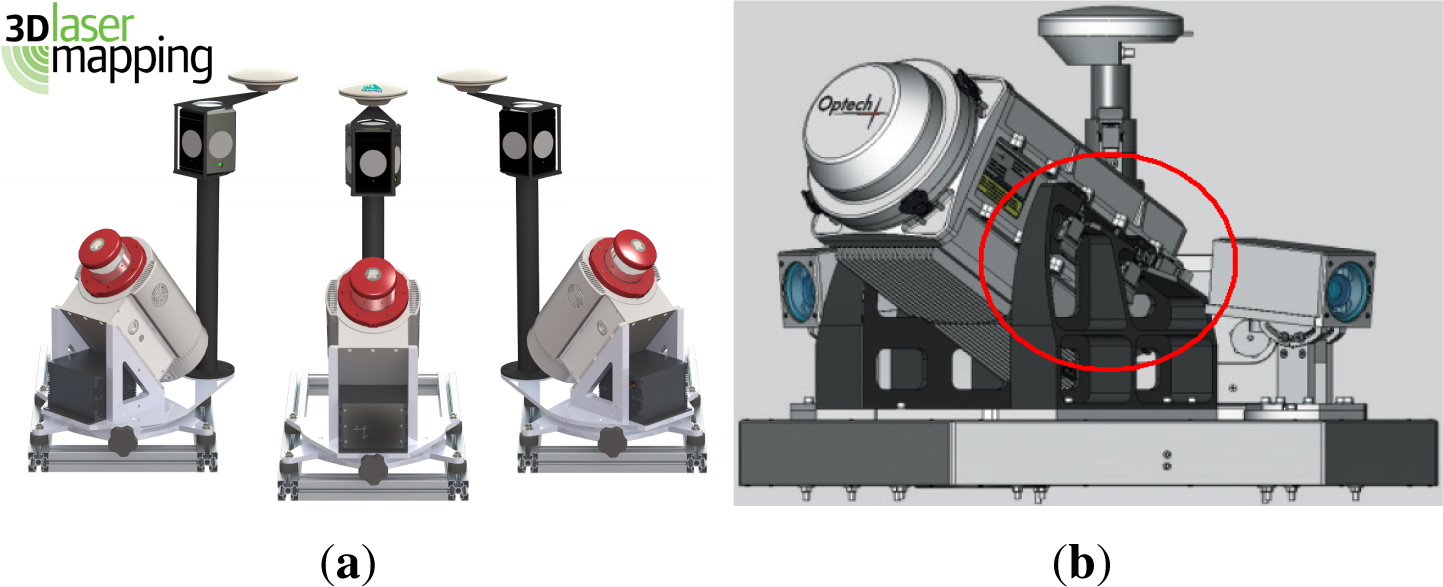
In Figure 4a an adaptable mount designed by 3D Laser Mapping allows the user to adjust the horizontal rotation of the scanner. The GNSS receiver and IMU also rotate with the scanner, which allows the operator to change the scanner orientation without needing to recalibrate the system. The latest MMS from Leica, the Pegasus 2 [39], also comes with an adaptable mount, designed specifically for the Leica ScanStation P20, enabling horizontal rotations only. The Optech scanner displayed in Figure 4b, the M1 [10], contains adjustable orientation mounts for two LiDAR sensors. In [40], the authors incorporated vertical inclinations with the FARO LS880HE80 [41] in a series of tests on MMS performance on their system, the FGI ROAMER.
3. Quantifying Changes in Scanner Orientation
Horizontal rotations of the scanner increase the range to target. Vertical rotations of the scanner increase the profile angle. Dual axis scanner rotations do both. We applied MIMIC in a series of tests to calculate the profile spacing, point spacing and total number of pulses striking a target that any changes in scanner orientation may result in. In these tests, the axial rotation angles α, γ and β vary for the target and the surface. For the scanner, αscan relates to the horizontal angle of the scanner whereas γscan refers to the vertical inclination. For the target, αtarg refers to the horizontal rotation whereas βtarg refers to a vertical inclination of the target. Readers are referred to [34] for more information on this principle and the rotation matrices applied.
3.1. Horizontal Rotation
A horizontal rotation of the scanner ensures laser returns from surfaces perpendicular to the direction of travel. One result of this is that a horizontal rotation of the scanner increases the range to target, as Figure 1c illustrates in 15° increments. To quantify this using MIMIC, the PRR was kept constant at 300 kHz and the mirror frequency at 100 Hz in these tests. These were the parameters of one of the highest specification scanners on the market, the Riegl VQ-250 [42], at the time these tests were being designed. The initial tests employed a constant vehicle velocity of 50 km/h and the simulated target was 2 m wide and 1 m high, defined at a constant horizontal 5 m range from the vehicle. The horizontal scanner rotation was then increased in 15° increments and the total number of laser pulses striking the target was calculated after each scanner rotation change. The results of these tests are displayed in Table 1. Tests 1–4 demonstrate how the increase in measurement range arising from a horizontal rotation of the scanner affects the number of points striking the parallel vertical target. The higher the horizontal rotation of the scanner, the higher the point spacing, and therefore the lower the point density. For example, the 60° horizontal scanner rotation in Test 4 results in only 60% of the number of points striking the target when compared with the 0° horizontal scanner rotation in Test 1. This implies that moving from 45° rotation to 60° rotation results in a larger decrease than moving from 15° rotation to 45° rotation, despite the latter having twice as much angular change. This effect can be explained by the orientation of the surface, which in these tests is parallel. The higher scanner rotations have increased the range to the parallel target, as Figure 1c illustrates, and therefore increased point spacing.
3.2. Vertical Inclination
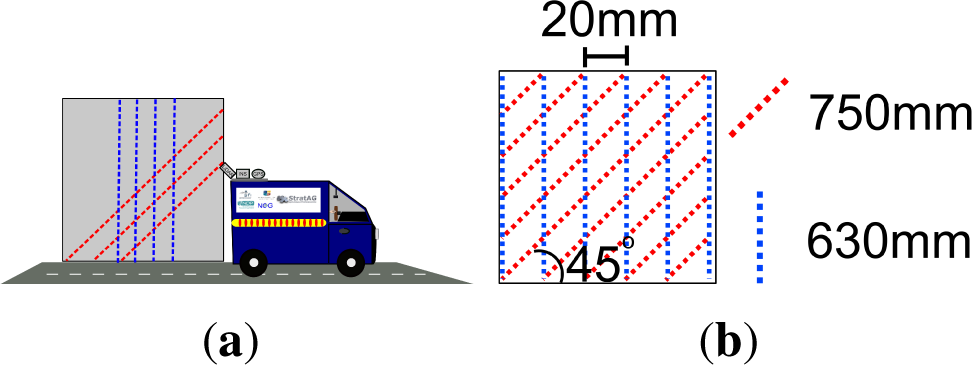
Point density is also influenced by vertical scanner rotations. As previously demonstrated, a vertical scanner rotation alters the profile angle on vertical surfaces and is important for increasing the number of profiles intersecting a narrow target. Automated algorithms that require a minimum profile spacing or point spacing to recognise cylindrical objects can take advantage of vertical rotations of the scanner to achieve this. Four vertical scanner rotations were implemented to assess their effects on the number of pulses striking the target. A parallel vertical target with dimensions of 2 m × 1 m and at 5 m range from the scanner was defined. In these tests, the scanner was inclined in 15° increments and the total number of points was measured on the target after each rotation. The results are detailed in Table 2. Each of the vertical rotations results in an equal or greater number of pulses striking the target than the corresponding horizontal scanner rotation in the previous tests. This is primarily because a vertical inclination of the scanner results in a longer profile intersecting with the target, as demonstrated in Figure 5. With a target of approximately 100 mm2, and a vehicle velocity resulting in a 20 mm profile spacing, a 45° rotation of the scanner results in an additional 120 mm of profile intersecting with the surface, which is an increase of 20%.
3.3. Dual Axis Scanner Rotations
Dual axis scanner rotations are an important characteristic of the current generation of MMSs. This scanner orientation provides the benefits of both a horizontal and a vertical scanner rotation. Features perpendicular to the direction of travel can be surveyed. Additionally, profile spacing is decreased on narrow targets. However, if a horizontal rotation of the scanner increases point spacing but a vertical inclination decreases profile spacing, there is therefore a possibility that the effect will be negated in terms of point density. The tests in this section applied a series of horizontal and vertical scanner rotations to investigate this possibility.
The same vehicle and target parameters were applied in these tests. The scanner rotation was simultaneously increased by 15° for both a horizontal and vertical scanner orientation after each test. Four dual axis scanner configurations were defined and the point density was calculated for the target. Table 3 details the results of these tests for the different scanner orientations. For every increase in horizontal and vertical rotation there is a corresponding increase in the number of points striking the target. The 60°/60° horizontal/vertical dual axis scanner rotation was capable of reaching the highest point density, returning 4196 points. This conflicts with the previous results in Table 1, where a 60° horizontal scanner rotation resulted in a higher measurement range and therefore a larger point spacing and a reduced point density.
To investigate this further, an additional test where the horizontal scanner rotation remains fixed but the vertical scanner rotation is varied was designed. In this test, the horizontal scanner rotation was set at 60° but the vertical scanner rotation was increased by 15° after each test. Table 4 details the results of these tests. From a low starting point of 670 points, the number of pulses striking the target increases significantly as the vertical scanner rotation is increased. This is because the vertical scanner rotation increases the length of the profile that will intersect with the surface, thereby decreasing profile spacing and increasing point density. Additionally, due to the combination of horizontal rotation and vertical inclination of the scanner, the profile angle is even higher than what the vertical inclination might imply, as our work in [37] demonstrated. These tests demonstrate that a high vertical scanner rotation is capable of negating the increase in point spacing resulting from a horizontal rotation of the scanner on this target type. However, despite the high point density arising from this configuration, it is important to point out that a horizontal/vertical 60°/60° orientation is not suitable for all targets. For instance, a target horizontally rotated −30° or higher relative to the parallel target would never intersect with the 60°/60° scan plane, similar to the situation demonstrated in Figure 1a. This scenario would result in no laser returns from the target and this is an unacceptable risk for a single scanner MMS operating commercially as it could result in having to re-survey an area. It is up to the MMS operator to select the orientation that best suits their automated algorithms or survey specification. In the following sections, we will look at some of the issues that the operator should consider.
4. Target Parameters and Point Distribution
MIMIC can be used to assess the influence of scanner orientation when multiple mission parameters change for a more complex target. In this case a narrow target is chosen while the range to target and the vehicle velocity are varied. The resulting changes in profile spacing and point spacing will influence automated algorithms whereby a minimum point spacing and profile spacing are required to recognise a cylindrical target. When choosing the MMS laser scanner orientation for a specific target, the operator can decide whether to prioritise profile spacing or point spacing.
4.1. Minimising Point Spacing or Profile Spacing?
Narrow vertical targets are a common type of roadside infrastructure. It is important to minimise vertical point spacing and profile spacing on these narrow, vertical features because they are a potential limiting factor to certain automated algorithms. The target parameters were altered for these tests and a target of 0.1 m × 2 m was defined. A scanner operating at 300 kHz PRR and 100 Hz mirror frequency was simulated in MIMIC. The tests were designed with a constant vehicle velocity of 50 km/h. The number of laser pulses striking the target was measured after each 15° increase in the vertical scanner rotation. Table 5 displays the results for the point density tests. These tests demonstrate how the point density on a narrow vertical object increases as the vertical profile spacing decreases, as it has increased by a factor of 33% between Test 1 and Test 4 after an additional 45° vertical scanner rotation.
The lowest vertical scanner rotation (15°) results in just over 12% the number of scan profiles intersecting with the target that the 60° rotation does. Despite this underperformance, it is important to note that a high number of scan profiles does not guarantee a high number of points striking the target. For example, Test 1 results in only 8.33% the number of profiles intersecting with the target compared with Test 4, yet Test 1 has almost 74% of the total number of points of Test 4. Assuming an equal distribution of points per profile line for targets at short ranges, there is approximately 41 points per profile (Ppp) in Test 1 but there are only 7 Ppp in Test 4. This demonstrates the trade-off between the number of scan profiles intersecting with a target and the number of points per profile. Short scan profiles crossing the target, if combined with a large point spacing, can lead to a point cloud that inadequately represents the target. This is more likely to be encountered when the objects are very narrow or are at long ranges.
4.2. Influence of Range on Point Spacing
To demonstrate the influence of range on point spacing and to identify the effect of increased point spacing on the number of points per profile, the target range was varied in these tests. The horizontal scanner rotation was fixed at 60° to maximise the change in range resulting from a horizontal rotation, whereas the vertical scanner orientation was increased by 15° after each test. The target was simulated in MIMIC at three different ranges, increased in 5 m intervals. By examining Table 6, the effect of increased point spacing on point density at longer target ranges can be seen. For example, at 15 m range, the 8 profile lines resulting from the 15° vertical scanner rotation will result in approximately only 3 Ppp (number of points/number of profiles). This is not ideal, but three points may provide some idea of the dimensions of the object and (depending on the accuracy of the scanner and navigation solution) may show if it is a curved surface. For the 60° vertical rotation this is not the case, as for the 50 profile lines this will result in just over 1 Ppp. One point per profile is not sufficient to accurately define an object.
4.3. Influence of Vehicle Velocity on Profile Spacing
If an MMS operator is attempting to balance points per profile and also profile spacing, they must also take vehicle velocity into account. The next tests examined the impact of the dual axis scanner rotations and the vehicle velocity on point density for narrow targets. The vehicle velocity was increased in 10 km/h increments and the number of pulses striking the target was measured on the target after each velocity increase. The range to target was set constant at 5 m for these tests. Figure 6 illustrates the results of the point density calculation and vehicle velocity on a narrow target for a selection of dual axis scanner rotations. The increase in the number of pulses striking the target arising from a 60°/60° scanner orientation was approximately twice that of the 45°/45° scanner orientation. As previously explained, this was due to the smaller vertical profile spacing arising from a high profile angle. To verify this, two different dual axis scanner rotations and their intersection with a parallel vertical surface is calculated by MIMIC. The profile spacing and profile angle were measured. The difference in profile angle between the two was 19.10° and this equates to a difference in profile spacing of 0.058 m on a vertical target, but 0.058 m could be significant for narrow targets.
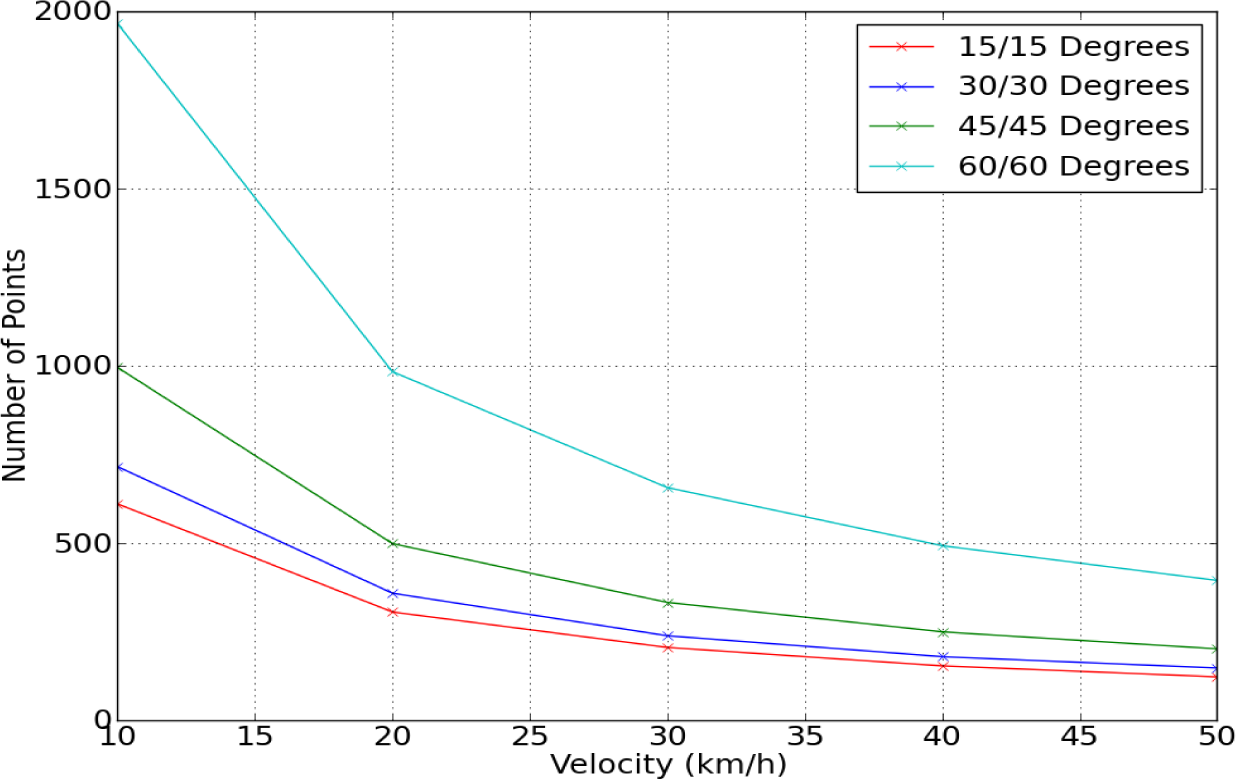
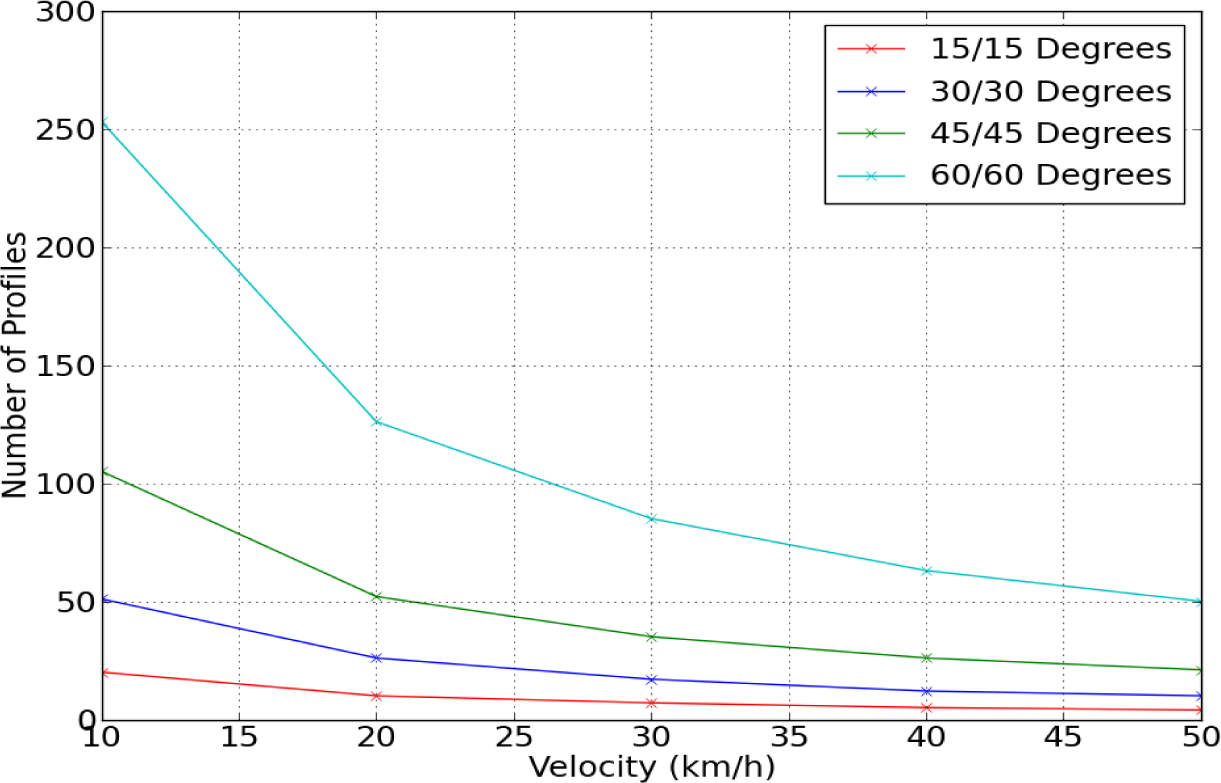
It is important to note that at shorter ranges, the reduction in Ppp may not be an issue. To demonstrate this, a test was designed to measure the Ppp for a narrow target using four different dual axis scanner rotations. A target range of 5 m and a vehicle velocity of 50 km/h were applied. Table 7 lists the number of Ppp for these tests. Six is the lowest number of Ppp occurring in these tests. This occurs in Test 4, which is the 60°/60° dual axis rotation and therefore has the highest number of profiles. Although the number of Ppp from the 15°/15° dual axis rotation is five times this amount, six points is sufficient for defining a narrow object only 0.1 m wide. Conversely, the 15°/15° rotation provides the highest number of Ppp, but this must be offset against the number of scan profiles that may be required by an automated algorithm. Figure 7 illustrates the number of scan profiles on a target at different velocities for each scanner orientation in Table 7. As velocity increases, the number of scan profiles for each dual axis scanner rotation drops significantly, reinforcing the link between velocity and profile spacing.
As has been demonstrated, when designing a system to maximise point density, there is a trade-off between the number of scan profiles intersecting a narrow target and also the number of Ppp. A high point density may not accurately define a target if the number of Ppp is too low, or if the profile spacing is too high. A number of factors influence point density: system parameters, target parameters and vehicle parameters. Consideration must also be given to those target orientations that will return no points for specific scanner orientations. Therefore, when designing a fixed scanner system, the configuration of the scanner orientation is an extremely important decision. It is a decision that could cause manufacturers to err on the side of caution to ensure that the MMS will operate efficiently in the majority of scenarios. Alternatively, including a second scanner will largely negate these risks. A second scanner will increase the number of returns from a target and minimise data shadows, but will also lead to longer data processing times, increased hardware costs and higher data storage requirements.
5. Identifying the Optimal Orientation
It is difficult to quantify the point distribution required to recognise an object in a point cloud, and therefore this section summarises the effect of combining high vertical scanner inclinations with low horizontal scanner rotations. A human operator requires significantly fewer points to recognise an object than an automated algorithm does. The research presented in [15–18,20,21,24–27] demonstrates the complexity of this problem. Each algorithm performs differently; the accuracy of each varies and many algorithms are designed for a specific feature (trees, buildings, road markings, road edges, etc.). Algorithm development has not reached the stage where we can definitively state the point distribution requirements, and therefore we have necessarily focussed on providing information on the implications behind changes in scanner orientation such that our results can assist with optimising scanner orientation.
These tests investigated whether this is a more practical configuration for a dynamic real-world environment. A number of trends were apparent when investigating the results.
As the dual scanner vertical and horizontal rotations are increased by 15° (e.g., 15°/15° up to 30°/30°) the point density approximately doubles.
As the dual scanner vertical and horizontal rotations are increased by 15°, the number of profiles approximately doubles.
As the velocity doubles, the point density approximately halves.
As the range doubles, the resulting point density approximately halves.
When selecting the horizontal scanner rotation for the tests in this section, two important factors had to be considered. Firstly, higher horizontal rotations (≥60°) of the scanner could potentially miss a surface that is angled away from the MMS (≥−30°). Additionally, a low horizontal rotation (15°) results in too few points striking a surface perpendicular to the direction of travel, which is the primary reason for introducing a horizontal rotation of the scanner. For these reasons, horizontal scanner rotations of 30° and 45° were selected while vertical scanner inclinations of 30°, 45° and 60° were selected. A 2 m × 1 m parallel vertical target was defined for these tests. The target range was fixed at 5 m and the vehicle velocity was set at 50 km/h. A scanner operating at 300 kHz PRR and 100 Hz mirror frequency was also defined in MIMIC.
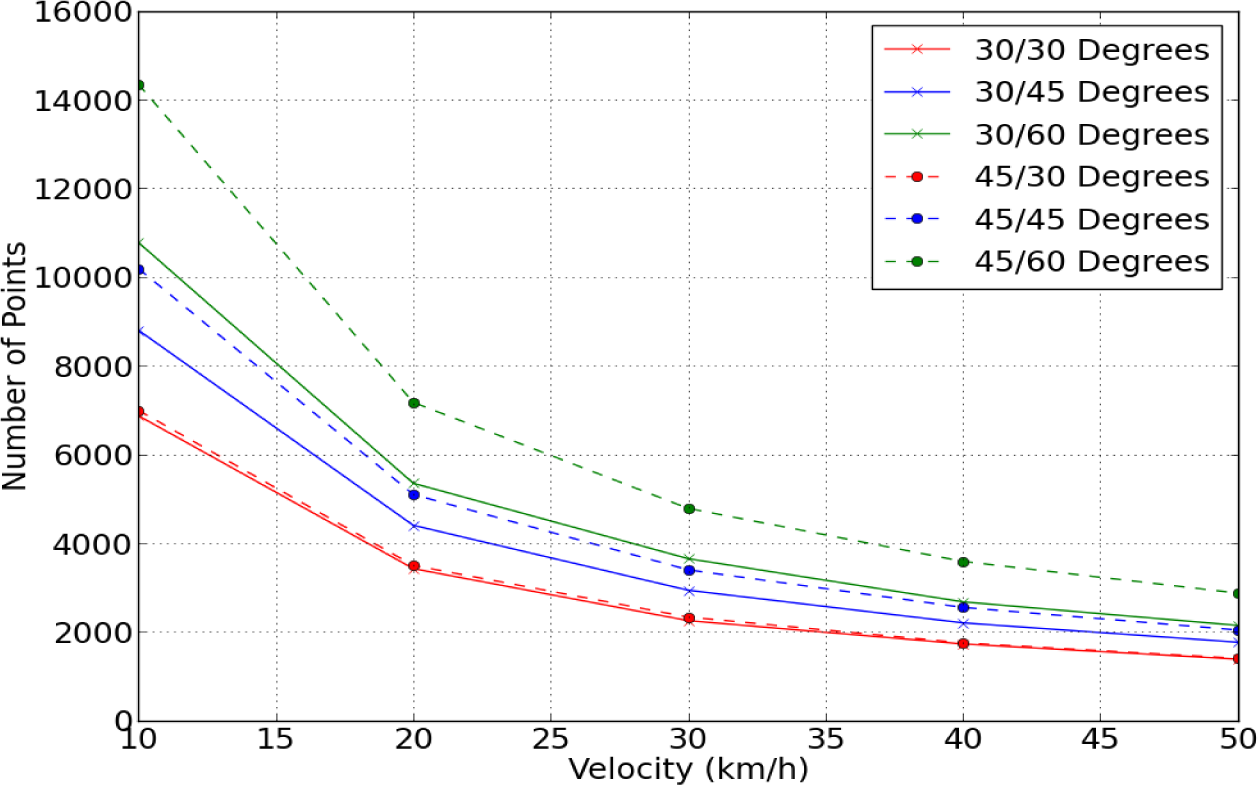
The point density for each scanner orientation was then calculated. These point density results were assessed to identify whether the specified configurations perform better than the 30°/30° and 45°/45° configurations employed in the previous sections. For each scanner rotation combination, the increased vertical rotation of the scanner resulted in an increased point density. By combining a 45° horizontal rotation with a 60° vertical rotation, the number of points striking the target was increased from 10,188 to 14,343 points on the target when compared with the 45°/45° orientation. This equated to a 40% increase and also diminished the risk of missing a negatively rotated target that would arise with a 60° horizontal scanner rotation. Additionally, it also decreases the distance to the target when compared with the 60° horizontal scanner rotation and therefore decreases the point spacing on the target. Figure 8 illustrates the results of these tests.
These results are target-dependant and system-specific. For standard parallel targets such as walls or building facades, αscan/γscan of 45°/60° is the recommended orientation for nearside infrastructure. This orientation is particularly relevant for maximising point density with single scanner MMSs. The 45° αscan increases the number of profiles intersecting with objects perpendicular to the direction of travel, yet does not constitute an excessive αscan that could potentially result in zero returns on negatively rotated targets. The 60° γscan decreases the vertical profile spacing and therefore increases point density. However, for the multiple possible angled targets, the recommended orientation may change. MIMIC allows for examination of multiple target orientations and dimensions. MIMIC can therefore provide the surveyor with the recommended configuration information for any valid user-defined target.
6. Conclusions
Our tests demonstrated that the orientation of the scanner influences point and profile distribution significantly. Changing the vertical inclination of the scanner provides a method to increase the number of pulses striking the target by maximising the length of the scan profile that intersects with the surface. Changing the horizontal rotation of the scanner increases the range to the target while increasing point spacing. The importance of identifying the correct trade-off between the number of profiles intersecting with the target and the point spacing was also demonstrated when applying a dual axis scanner rotation. Choosing a dual axis scanner orientation that optimises point density, point spacing or profile spacing for one target will unavoidably result in a reduction in these values for other target types. The “catch-all” is to assign medium horizontal and vertical scanner orientations, which assists with minimising shadowing and provides an acceptable point distribution. However, in a scenario where an algorithm has been designed to extract features automatically from the point cloud, it makes sense for the operator to configure the system to ensure the best chance of achieving the required point distribution that will permit that algorithm to function. The MMS operator can also ensure their system is capable of recording the smallest feature in a survey specification document or tender document. If manual operator input is required for other targets, then the point distribution can be allowed to drop in these areas but increased in others to take advantage of the automated element. In this paper we have shown that if the scan hardware has a high mirror speed, the operator can take advantage of this and prioritise point spacing. It has also been shown that if the scanner has a high pulse repetition rate, whereby using their knowledge of the system and algorithms, the operator can balance the requirement in points per profile against the number of profiles intersecting the target. MIMIC is a vital tool that can be used to quantify changes in system configuration on MMS performance.
Acknowledgments
Research presented in this paper was funded by the Irish Research Council (IRC) and the Enterprise Partner, Pavement Management Services Ltd. (Galway, Ireland), by the NRA research fellowship program, ERA-NET SR01 projects and by a Strategic Research Cluster grant (07/SRC/I1168) from Science Foundation Ireland under the National Development Plan.
The Authors would like to thank Optech Inc., Vaughan, ON, Canada and 3D Laser Mapping for supplying images used in this paper.
Author Contributions
MIMIC was developed by Conor Cahalane. Paul Lewis and Conor P. McElhinney collaborated with Cahalane in identifying and designing each test. Tim McCarthy provided technical advice at all stages. All authors contributed equally in preparing this manuscript.
Conflicts of Interest
The authors declare no conflict of interest.
References
- El-Sheimy, N. An overview of mobile mapping systems, Proceedings of the FIG Working Week 2005 and GSDI-8—From Pharaohs to Geoinformatics, FIG/GSDI, Cairo, Egypt, 16–21 April 2005.
- 3D Laser Mapping, StreetMapper Technical Report, Available online: http://www.3dlasermapping.com/downloads/brochures accessed on 5 October 2012.
- Cahalane, C.; McCarthy, T.; McElhinney, C.P. Mobile mapping system performance: An initial investigation into the effect of vehicle speed on laser scan lines, Proceedings of the Remote Sensing and Photogrammetry Society Annual Conference—“From the Sea-Bed to the Cloudtops”, Cork, Ireland, 1–3 September 2010.
- GISPro. GPR Enabled MMS Datasheet, Available online: http://www.riegl.com/fileadmin/user_upload/Press/Mobile_Mapping_System.pdf accessed on 9 October 2014.
- Williams, K.; Olsen, M.J.; Roe, G.V.; Glennie, C. Synthesis of transportation applications of mobile LIDAR. Remote Sens. 2013, 5, 4652–4692. [Google Scholar]
- Flener, C.; Vaaja, M.; Jaakkola, A.; Krooks, A.; Kaartinen, H.; Kukko, A.; Kasvi, E.; Hyyppä, H.; Hyyppä, J.; Alho, P. Seamless mapping of river channels at high resolution using mobile LiDAR and UAV-Photography. Remote Sens. 2013, 5, 6382–6407. [Google Scholar]
- Saarinen, N.; Vastaranta, M.; Vaaja, M.; Lotsari, E.; Jaakkola, A.; Kukko, A.; Kaartinen, H.; Holopainen, M.; Hyyppä, H.; Alho, P. Area-based approach for mapping and monitoring riverine vegetation using mobile laser scanning. Remote Sens. 2013, 5, 5285–5303. [Google Scholar]
- McArdle, G.; Demšar, U.; van der Spek, S.; McLoone, S. Classifying pedestrian movement behaviour from GPS trajectories using visualization and clustering. Ann. GIS. 2014, 20, 85–98. [Google Scholar]
- Riegl. Dual Scanner Data Sheet Riegl VMX-450, Available online: http://www.riegl.com/nc/products/mobile-scanning/produktdetail/product/scannersystem/10/ accessed on 9 October 2012.
- Optech. Optech Lynx M1 and V200 System Specifications, Available online: http://www.optech.ca/lynx.htm accessed on 9 October 2012.
- Trimble. Trimble MX8 Mobile Mapping System, Available online: http://www.trimble.com/geospatial/Trimble-MX8.aspx?dtID=overview accessed on 9 October 201.
- Yen, W.; Ravani, B.; Lasky, T. LiDAR for Data Efficiency, Available online: http://www.wsdot.wa.gov/Research/Reports/700/778.1.htm accessed on 5 October 2011.
- Florida Department of Transport. Terrestrial Mobile LiDAR Surveying and Mapping Guidelines; Florida Department of Transport: Tallahassee, FL, USA, 2012. Available online: http://www.dot.state.fl.us/surveyingandmapping/regulations.shtm accessed on 5 October 2012.
- Olsen, M.J.; Roe, G.; Glennie, C.; Persi, F.; Reedy, M.; Hurwitz, D.; Williams, K.; Tuss, H.; Squellati, A.; Knodler, M. NCHRP 15-44 Guidelines for the Use of Mobile LiDAR in Transportation Applications; NCHRP: Washington, DC, USA, 2013. Available online: http://apps.trb.org/cmsfeed/TRBNetProjectDisplay.asp?ProjectID=2972 accessed on 3 April 2013.
- Becker, S.; Haala, N. Grammar supported facade reconstruction from mobile LiDAR mapping. Int. Arc. Photogramm. Remote Sens. Spat. Inform. Sci. 2009, 38, 229–234. [Google Scholar]
- Hammoudi, K.; Dornaika, F.; Paparoditis, N. Extracting building footprints from 3D point clouds using terrestrial laser scanning at street level. Int. Arc. Photogramm. Remote Sens. Spat. Inform. Sci. 2009, 38, 65–70. [Google Scholar]
- McElhinney, C.P.; Kumar, P.; Cahalane, C.; McCarthy, T. Initial results from European Road Safety Inspection (EURSI) mobile mapping project, Proceedings of the ISPRS Commission V Technical Symposium, Newcastle, UK, 22–24 June 2010.
- Kumar, P.; McElhinney, C.P.; Lewis, P.; McCarthy, T. Automated road markings extraction from mobile laser scanning data. Int. J. Appl. Earth Obs. Geoinf. 2014, 32, 125–137. [Google Scholar]
- Kumar, P.; McElhinney, C.P.; Lewis, P.; McCarthy, T. An automated algorithm for extracting road edges from terrestrial mobile LiDAR data. ISPRS J. Photogramm. Remote Sens. 2013, 85, 44–55. [Google Scholar]
- Pu, S.; Vosselman, G. Extracting windows from terrestrial laser scanning. Int. Arch. Photogramm. Remote Sens. Spat. Inform. Sci. 2007, 36, 320–325. [Google Scholar]
- Pu, S.; Rutzinger, M.; Vosselman, G.; Elberink, S. Recognizing basic structures from mobile laser scanning data for road inventory studies. ISPRS J. Photogramm. Remote Sens. 2011, 66, 28–39. [Google Scholar]
- Kaartinen, H.; Hyyppä, J.; Gulch, E.; Vosselman, G.; Hyyppä, H.; Matikainen, L.; Hofmann, A.D.; Mäder, U.; Perssion,, Å; Söderman,, U.; et al. Accuracy of 3D city models: EuroSDR comparison. Int. Arch. Photogramm. Remote Sens. Spat. Inform. Sci. 2005, 36, 227–232. [Google Scholar]
- Lari, Z.; Habib, A. Alternative methodologies for the estimation of local point density index: Moving towards adaptive LiDAR data processing. Int. Arch. Photogramm. Remote Sens. Spat. Inform. Sci. 2012, 39, 127–132. [Google Scholar]
- Brenner, C. Global localization of vehicles using local pole patterns. Pattern Recognit 2009, 5748, 61–70. [Google Scholar]
- Kukko, A.; Jaakola, A.; Lehtomäki, M.; Kaartinen, H; Chen, Y. Mobile mapping system and computing methods for modelling of road environment, Proceedings of the Joint Urban Remote Sensing Event, Shanghai, China, 20–22 May 2009.
- Lehtomäki, M.; Jaakkola, A.; Hyyppä, J.; Kukko, A.; Kaartinen, H. Detection of vertical pole-like objects in a road environment using vehicle-based laser scanning data. Remote Sens. 2010, 2, 331–336. [Google Scholar]
- Wu, B.; Yu, B.; Yue, W.; Shu, S.; Tan, W.; Hu, C.; Huang, Y.; Wu, J.; Liu, H. A voxel based-method for automated identification and morphological parameters estimation of individual street trees from mobile laser scanning data. Remote Sens. 2013, 5, 584–611. [Google Scholar]
- Lin, Y.; Hyyppä, J.; Kaartinen, H.; Kukko, A. Performance analysis of mobile laser scanning systems in target representation. Remote Sens. 2013, 5, 3140–3155. [Google Scholar]
- Lohani, B.; Mishra, R. Generating LiDAR data in laboratory: LiDAR simulator. Int. Arch. Photogramm. Remote Sens. 2007, 52, 12–14. [Google Scholar]
- Yoo, H.; Goulette, F.; Senpauroca, J.; Lepere, G. Simulation based comparative analysis for the design of laser terrestrial mobile mapping, Proceedings of the 6th International Symposium on Mobile Mapping Technology, Sao Paolo, Brazil, 21–24 July 2009; pp. 839–854.
- Kukko, A.; Hyyppä, J. Small-footprint laser scanning simulator for system validation, error assessment and algorithm development. Photogramm. Eng. Remote Sens. 2009, 75, 1177–1189. [Google Scholar]
- Riegl. RiACQUIRE Software Datasheet, Available online: http://products.rieglusa.com/item/software-packages/riacquire-data-acquisition-software/item-1011 accessed on 11 October 2012.
- Cahalane, C.; McElhinney, C.P.; Lewis, P.; McCarthy, T. MIMIC: Mobile mapping point density calculator, Proceedings of the 3rd International Conference on Computing for Geospatial Research and Applications (COM.Geo ’12).
- Cahalane, C.; McElhinney, C.P.; Lewis, P.; McCarthy, T. Calculation of target-specific point distribution for 2D mobile laser scanners. Sensors 2014, 14, 9471–9488. [Google Scholar]
- Cahalane, C.; McElhinney, C.P.; Lewis, P.; McCarthy, T. MIMIC: An innovative methodology for determining mobile laser scanning system point density. Remote Sens. 2014, 6, 7857–7877. [Google Scholar]
- Cahalane, C.; McElhinney, C.P.; McCarthy, T. Mobile mapping system performance: An analysis of the effect of laser scanner configuration and vehicle velocity on scan profiles, Proceedings of the European Laser Mapping Forum (ELMF 2010), The Hague, The Netherlands, 30 November–1 December 2010.
- Cahalane, C.; McElhinney, C.P.; McCarthy, T. Calculating the effect of dual-axis scanner rotations and surface orientation on scan profiles, Proceedings of the 7th International Symposium on Mobile Mapping Technology (MMT11), Krakaw, Poland, 13–16 June 2011.
- Shepard, D. A two-dimensional interpolation function for irregularly-spaced data, Proceedings of the 23rd National Conference ACM, New York, NY, USA, 27–29 August 1968; pp. 517–524.
- Leica. Leica Pegasus Data Sheet, Available online: http://www.leica-geosystems.com/en/Leica-PegasusTwo_105371.htm accessed on 9 October 2014.
- Kukko, A.; Andrei, C.O.; Salminen, V.M.; Kaartinen, H.; Chen, Y.; Rönnholm, P.; Hyyppä, H.; Hyyppä, J.; Chen, R.; Haggrén, H.; et al. Road environment mapping system of the Finnish Geodetic Institute-FGI Roamer. Int. Arch. Photogramm. Remote Sens. Spat. Inform. Sci. 2007, 36, 241–247. [Google Scholar]
- Faro. Faro LS880 DataSheet, Available online: http://www.faro.com/FAROIP/Files/File/TechSheets/SEALaserScanner880.htm accessed on 9 October 2014.
- Riegl. Dual Scanner Data Sheet Riegl VQ-250, Available online: http://www.riegl.com/nc/products/mobile-scanning/produktdetail/product/scannersystem/22/ accessed on 9 October 2012.


| Test | αscan | γscan | αtarg | βtarg | MIMIC |
|---|---|---|---|---|---|
| 1 | 0° | 0° | 0° | 0° | 1126 pts |
| 2 | 15° | 0° | 0° | 0° | 1103 pts |
| 3 | 30° | 0° | 0° | 0° | 1029 pts |
| 4 | 45° | 0° | 0° | 0° | 890 pts |
| 5 | 60° | 0° | 0° | 0° | 670 pts |
| Test | αscan | γscan | αtarg | βtarg | MIMIC |
|---|---|---|---|---|---|
| 1 | 0° | 0° | 0° | 0° | 1126 pts |
| 2 | 0° | 15° | 0° | 0° | 1103 pts |
| 3 | 0° | 30° | 0° | 0° | 1168 pts |
| 4 | 0° | 45° | 0° | 0° | 1264 pts |
| 5 | 0° | 60° | 0° | 0° | 1328 pts |
| Test | αscan | γscan | αtarg | βtarg | MIMIC |
|---|---|---|---|---|---|
| 1 | 0° | 0° | 0° | 0° | 1126 pts |
| 2 | 15° | 15° | 0° | 0° | 1142 pts |
| 3 | 30° | 30° | 0° | 0° | 1380 pts |
| 4 | 45° | 45° | 0° | 0° | 2039 pts |
| 5 | 60° | 60° | 0° | 0° | 4196 pts |
| Test | αscan | γscan | αtarg | βtarg | MIMIC |
|---|---|---|---|---|---|
| 1 | 60° | 0° | 0° | 0° | 670 pts |
| 1 | 60° | 15° | 0° | 0° | 842 pts |
| 2 | 60° | 30° | 0° | 0° | 1245 pts |
| 3 | 60° | 45° | 0° | 0° | 2214 pts |
| 4 | 60° | 60° | 0° | 0° | 4196 pts |
| Test | αscan | γscan | αtarg | βtarg | Profiles | MIMIC | Ppp |
|---|---|---|---|---|---|---|---|
| 1 | 0° | 15° | 0° | 0° | 3 | 122 pts | 40.66 |
| 2 | 0° | 30° | 0° | 0° | 8 | 129 pts | 16.12 |
| 3 | 0° | 45° | 0° | 0° | 14 | 144 pts | 10.28 |
| 4 | 0° | 60° | 0° | 0° | 25 | 163 pts | 6.52 |
| αscan/γscan | Profiles | MIMIC 5 m | Ppp | MIMIC 10 m | Ppp | MIMIC 15 m | Ppp |
|---|---|---|---|---|---|---|---|
| 60°/15° | 8 | 85 pts | 11 | 40 pts | 5 | 26 pts | 3 |
| 60°/30° | 17 | 117 pts | 7 | 49 pts | 3 | 30 pts | 2 |
| 60°/45° | 29 | 197 pts | 7 | 71 pts | 2 | 41 pts | 1 |
| 60°/60° | 50 | 393 pts | 8 | 136 pts | 3 | 72 pts | 1 |
| No. | αscan | γscan | αtarg | βtarg | Ppp |
|---|---|---|---|---|---|
| 1 | 15° | 15° | 0° | 0° | 30 |
| 2 | 30° | 30° | 0° | 0° | 14 |
| 3 | 45° | 45° | 0° | 0° | 10 |
| 4 | 60° | 60° | 0° | 0° | 6 |
© 2015 by the authors; licensee MDPI, Basel, Switzerland This article is an open access article distributed under the terms and conditions of the Creative Commons Attribution license (http://creativecommons.org/licenses/by/4.0/).
Share and Cite
Cahalane, C.; Lewis, P.; McElhinney, C.P.; McCarthy, T. Optimising Mobile Mapping System Laser Scanner Orientation. ISPRS Int. J. Geo-Inf. 2015, 4, 302-319. https://doi.org/10.3390/ijgi4010302
Cahalane C, Lewis P, McElhinney CP, McCarthy T. Optimising Mobile Mapping System Laser Scanner Orientation. ISPRS International Journal of Geo-Information. 2015; 4(1):302-319. https://doi.org/10.3390/ijgi4010302
Chicago/Turabian StyleCahalane, Conor, Paul Lewis, Conor P. McElhinney, and Timothy McCarthy. 2015. "Optimising Mobile Mapping System Laser Scanner Orientation" ISPRS International Journal of Geo-Information 4, no. 1: 302-319. https://doi.org/10.3390/ijgi4010302