Article

Spatial and Semantic Validation of Secondary Food Source Data

Department of Development and Planning, Aalborg University, A. C. Meyers Vænge 15, København SV 2450, Denmark
*
Author to whom correspondence should be addressed.
ISPRS Int. J. Geo-Inf. 2014, 3(1), 236-253; https://doi.org/10.3390/ijgi3010236
Submission received: 28 November 2013 / Revised: 6 February 2014 / Accepted: 12 February 2014 / Published: 28 February 2014
(This article belongs to the Special Issue GIS in Public Health)

Abstract

:
Governmental and commercial lists of food retailers are often used to measure food environments and foodscapes for health and nutritional research. Information about the validity of such secondary food source data is relevant to understanding the potential and limitations of its application. This study assesses the validity of two government lists of food retailer locations and types by comparing them to direct field observations, including an assessment of whether pre-classification of the directories can reduce the need for field observation. Lists of food retailers were obtained from the Central Business Register (CVR) and the Smiley directory. For each directory, the positive prediction value (PPV) and sensitivity were calculated as measures of completeness and thematic accuracy, respectively. Standard deviation was calculated as a measure of geographic accuracy. The effect of the pre-classification was measured through the calculation of PPV, sensitivity and negative prediction value (NPV). The application of either CVR or Smiley as a measure of the food environment would result in a misrepresentation. The pre-classification based on the food retailer names was found to be a valid method for identifying approximately 80% of the food retailers and limiting the need for field observation.

1. Introduction

Personal factors, such as taste preferences, nutritional knowledge, cooking culture, sensitivity to price and accessibility to food outlets, interact with the environment to influence food behavior. The food environment includes places where food can be acquired, such as supermarkets, bakeries and restaurants [1]. This physical food environment influences the types and amounts of food available and the opportunity for choosing a healthful diet [2,3]. Insights into food environments and nutritional behavior can facilitate human wellbeing and improve nutritional benefits [4]. Local food environments have proven to be an indicator of individual food behavior [1,5].
Reliable and valid measures of food environments are needed to fully understand the relationship between these environments and health [6]. Secondary food source data, including both governmental and commercial lists, are used repeatedly to measure food environments and foodscapes within health and nutritional research [4,5,7,8,9,10,11]. Knowledge of the validity of such secondary food source data is needed to fully understand the potential and limitations of the application of such datasets. Hence, the analysis, results and conclusions based on secondary data sources are influenced by four types of data integrity: completeness, thematic accuracy, geographical accuracy and contemporaneity. For food retailer lists, completeness refers to the percentage of the listed retailers that are actually present and whether there are missing retailers on the lists. Thematic accuracy is an expression of correctness in the classification of the food retailers. Geographic accuracy is the difference between the listed position (geocoded addresses or coordinates) and the actual position. Contemporaneity informs about the retention of outdated information. Unknown errors in the data lead to misinterpretations of the results or under- or over-estimation [12,13] of, for example, the density of food retailers or an analysis of the association of foodscapes with health or socioeconomic factors.
Previous examinations of the validity of food retailer lists have demonstrated limitations compared to direct observations, due to the lack of completeness, thematic and geographical accuracy and contemporaneity of such lists in the United States of America [13,14] and the United Kingdom [12]. However, studies have demonstrated contradicting results between the use of commercial and government lists. A study from the United Kingdom demonstrated high sensitivity between direct observations and council data, but only moderate sensitivity of commercial data sources [15]. On the contrary, a Danish study demonstrated a high positive prediction value (PPV) between commercial lists and field observations and only a moderate PPV for the government list [16]. The alternative to secondary food source data is direct observations, which are very time consuming and expensive to complete for large and/or densely populated areas. The combination of more than one source of secondary food data has been shown to improve the validity of data on individual food retailers based on the number of lists a retailer appears on [10].
Few studies [16,17,18] have been conducted on the validity of secondary food source data in Denmark despite the strong tradition of using register data. The studies have been limited geographically to the capital area of Copenhagen and thematically to supermarkets and fast food outlets, which made room for further development of methods for measuring the food environment [16,17].
The aim of this study is to examine the possibility of combining two government food retailer directories to achieve a higher validity though a proposed method for classifying food retailers based on a combination of retailer name and the standard classification in the directories. The purpose of the classification is to focus the time used for field observations of the retailers on the lists that may be wrongly classified or for which there is doubt about the coherence between the retailer name and classification. Previous studies have successfully applied a search for the identification of fast food outlets by combining the relevant NACE classification (the statistical classification of economic activities in the European Community) and retailer name [18]. This study expands this approach to include all retailers primarily targeted at selling food in public. Field observation is applied to evaluate the validity of the CVR and Smiley directories and also the proposed method for focusing field observations in future studies.
This paper will present the two secondary food sources examined and the method proposed to limit the time used on field observation. Furthermore, the method used for the field observations is explained. The PPV and sensitivity results are presented to evaluate the proposed method and the validity of the studied secondary food sources.

2. Methods

Forty-nine parishes in Northern Jutland were selected for the study, including both urban and rural areas. Aalborg is the largest city in the area, with a population of approximately 100,000, whereas the remaining areas consist of small villages with populations up to 7,000 and low-density housing. The study area is approximately 974 km2, of which the city of Aalborg with the high-density housing constitutes 75 km2 (8%). Approximately 15% of the population in the study area has an ethnicity other than Danish, and the levels of education and income are diverse across both the low- and high-density housing. Northern Jutland consists of eleven municipalities, of which five are defined as peripheral regions. Peripheral regions are defined by, among others, a lower average income than the national average, a lower amount of commuting traffic and low or negative population growth. In contrast to the peripheral regions, Aalborg attracts many young people and is the economic center of the region.
Food premises in the study area were identified using two freely available government directories (CVR and Smiley). In both directories, branch codes were used to define food premises. The branch codes are based on the European NACE classification [19]. The Smiley and CVR data were retrieved in June 2013.

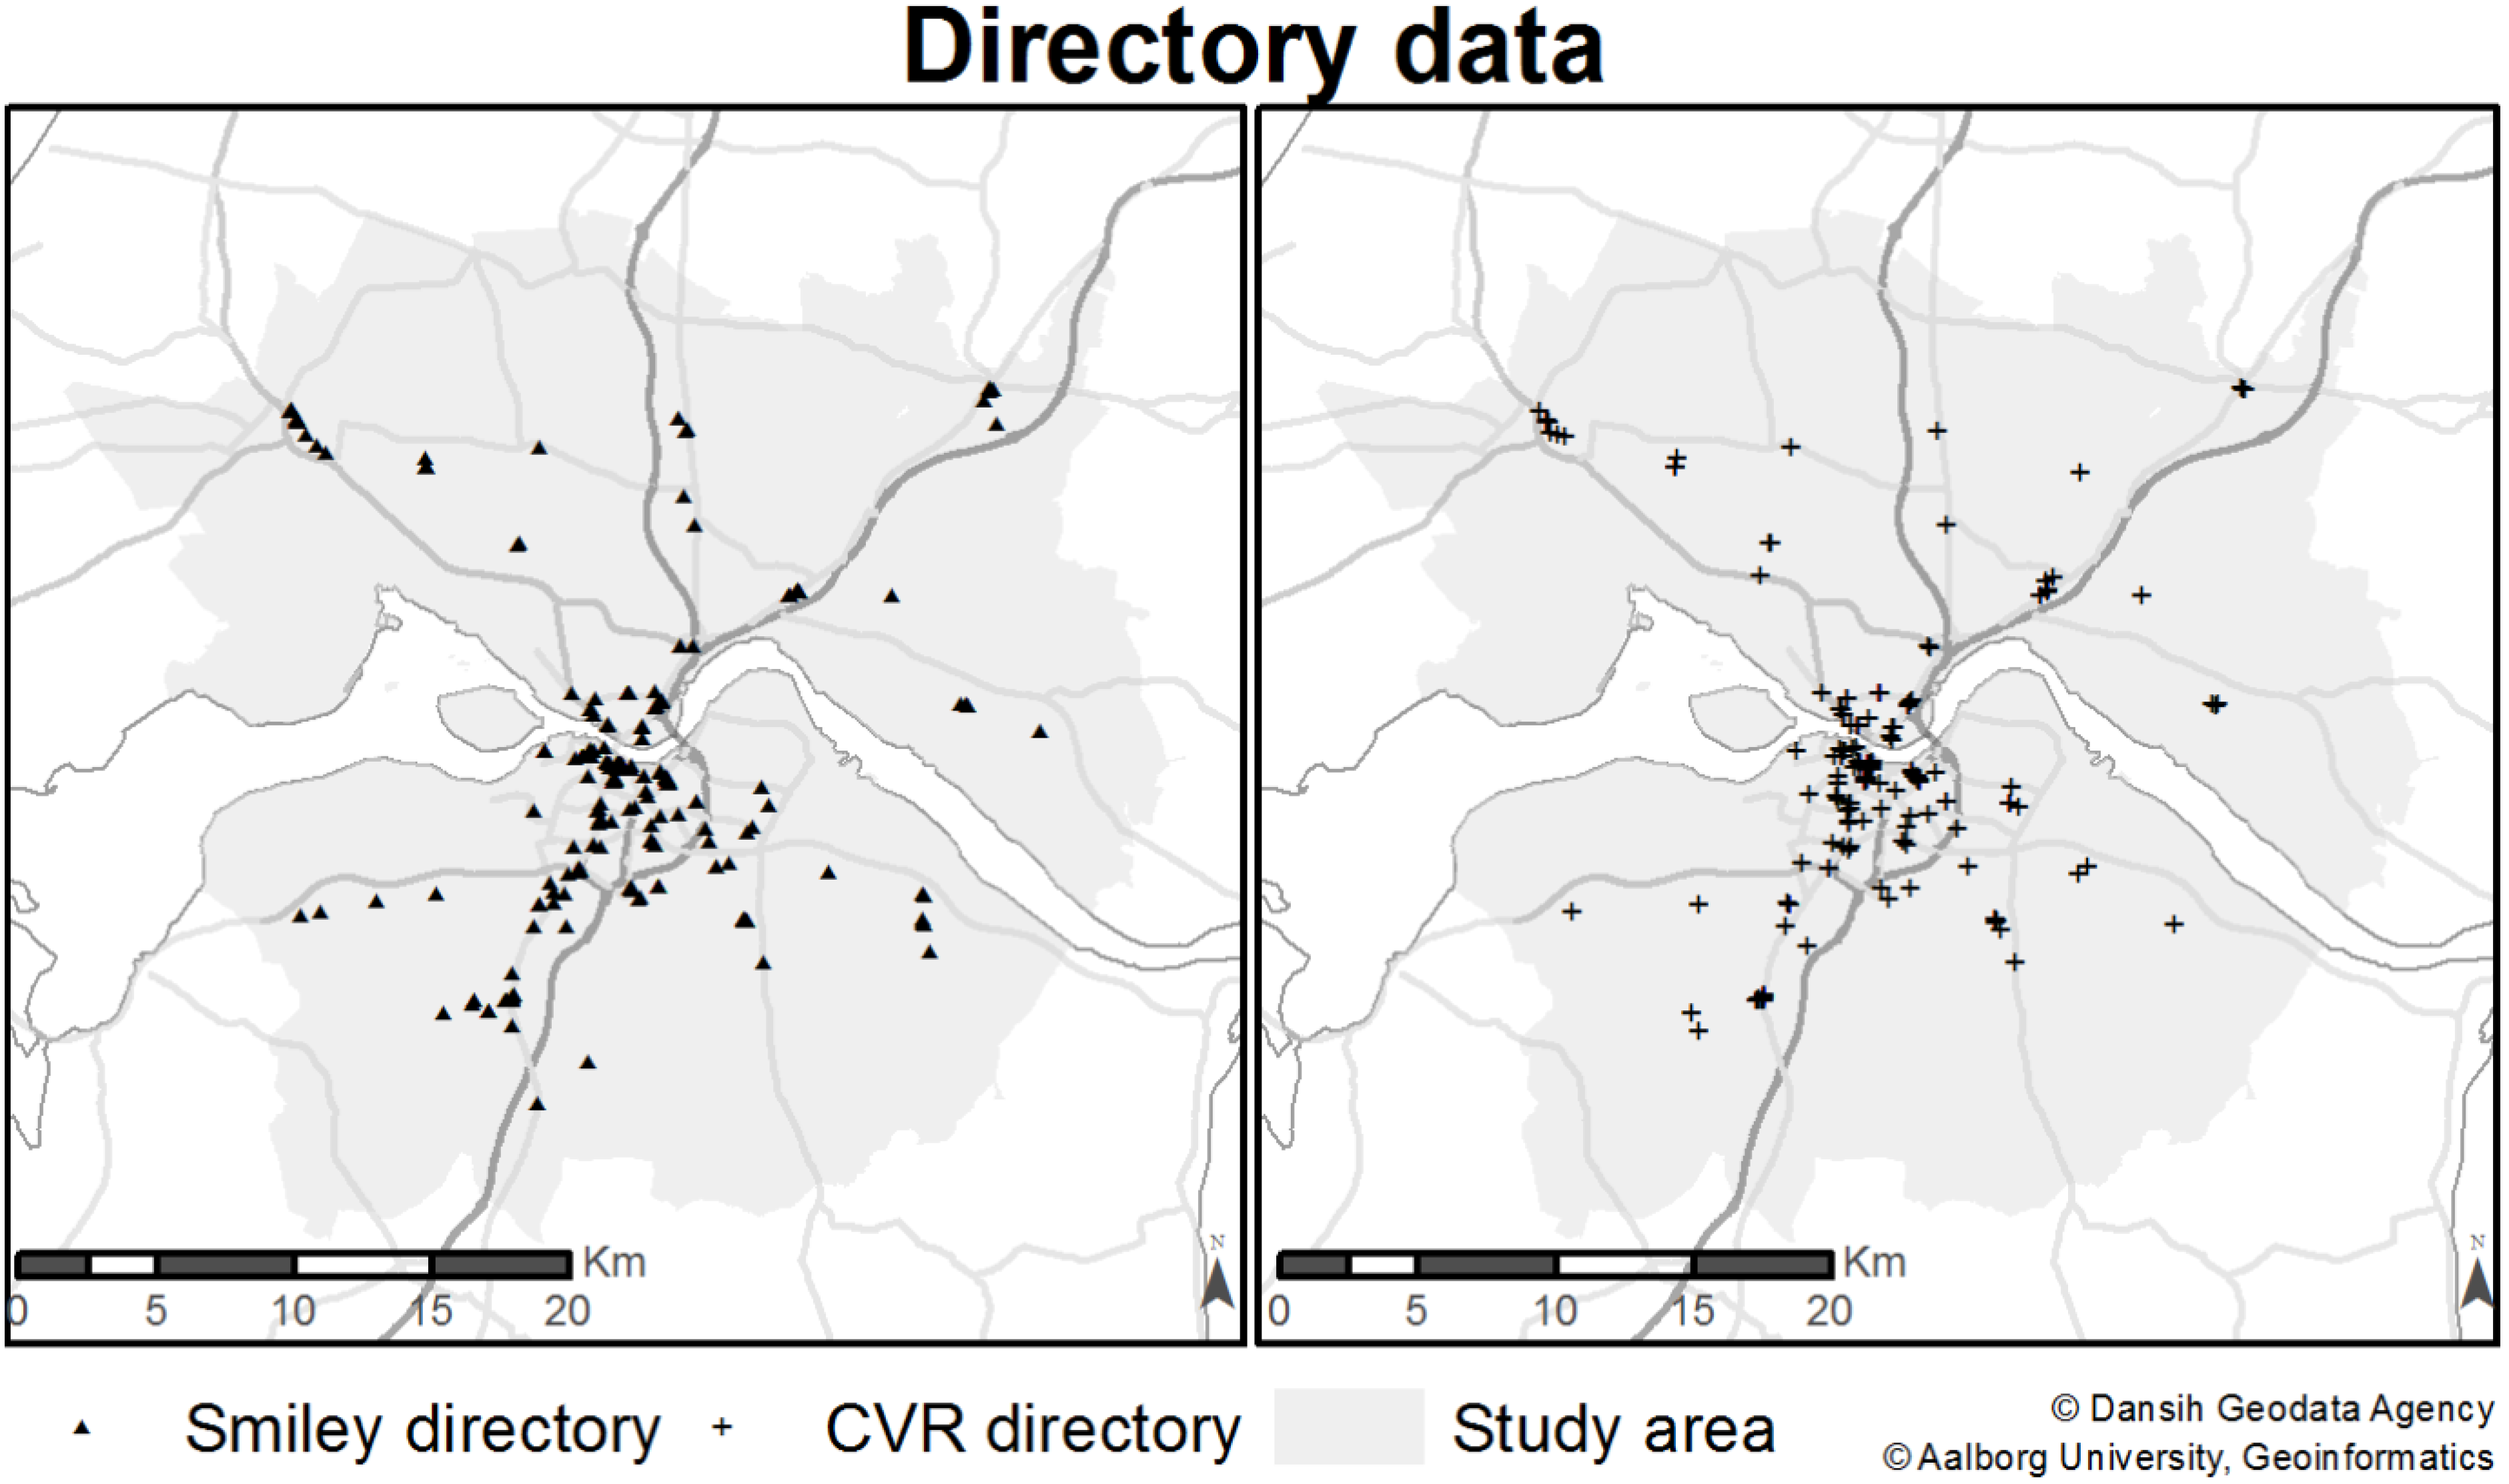
2.1. Central Business Register (CVR)

The CVR is a government register that contains information about businesses in Denmark. Information about the legal unit in the companies is uniquely identified through the CVR number, and within each legal unit, production units are identified through unique P-numbers. The P-number is used for a complete list of food retailers, because each individual retailer in a chain has its own P-number. The CVR is updated once each day, 5 days a week, year-round. The database is administered and managed by the Danish Business Authority. The business owners provide the information, and it is their responsibility by law to keep the information up to date and correct. That the information about the branch and address are kept up to date through third party reporting implies that information consistency, accuracy and completeness could be doubtful. The CVR contains no information about the availability of foods, such as fresh meat or vegetables, in food selling premises or about the furnishing, business hours or payment options of food serving premises. Consequently, the NACE classification and business names are the only sources for identifying different food premises. The 15 branches listed in Table 1 were identified in the CVR as food selling or serving premises by definition [20].
Table 1. List of NACE codes applied to limit the search to food retailers in Smiley and Central Business Register (CVR).
ClassificationNACE Code Used in CVRNACE Code Used in Smiley
Grocery shops and kiosks47.11.1047.11.00.A
Supermarket47.11.20
Discount supermarket47.11.30
Other non-specialized shops47.19.00
Greengrocer47.21.0047.21.00.A
47.21.00.B
Butcher shops and delis47.22.0047.22.00.A
47.22.00.B
Fish shops47.23.0047.23.00
Retail with bread, confectionery and sugar products47.24.0047.24.00.A
47.24.00.B
Retail with beverages47.25.0047.25.00
Other food in specialized shops47.29.0047.29.00.C
47.29.00.D
47.29.00.E
Gas stations47.30.00-
Full service restaurants56.10.1056.10.00.A
Pizzeria, ice cream, etc.56.10.2056.10.00.B
Bars, cafés, etc.56.30.0056.30.00

2.2. Smiley Register

The Smiley register was introduced in 2001 and belongs under the Ministry of Food, Agriculture and Fisheries, who administers the food safety and hygiene regulations in Denmark. The register was created to register the food safety inspections of businesses and present the food safety level of each business to the public. Inspections are performed to ensure that shops and restaurants comply with the regulation. The inspection rates of the businesses are based on the health risk the branches constitute, ranging from twice a year to once every two years. Businesses with non-perishable goods are inspected as needed. Consequently, updates of the register are similar to the inspection rate, which suggests the retention of outdated data for up to two years. The register is updated every three months with the latest inspections. The lag time of three months between inspections and updates decreases the validity of the data, as it is less accurate and complete, as well as retaining outdated information. The relevant NACE classifications identified are listed in Table 1 along with the indication of aggregated and disaggregated groups in Smiley compared to the use of the NACE codes in the CVR. The NACE classification and the business names are the only indicators of type of food premise, as there is no information about merchandise, menu, business hours, table service or payment options [21].

2.3. Pre-Classification of Businesses

Pre-classification of the business records in Smiley and CVR was performed to examine the possibility of reducing or removing the field observation process, as this is a very time-consuming and expensive process. Previous literature has used a pre-classification based on a combination of business name and the NACE classifications to identify fast food restaurants [17,18]. Fast food restaurants were defined as within the NACE classification in question and with a restaurant name, including one of the following words associated with fast food: pizza, burger, sausages, barbeque (grill), kebab and falafel.
Table 2. Positive and negative words for each NACE code used to pre-classify the business records.
NACE CodesPositive WordsNegative WordsChain Names
47.11.10 Grocery shops and kiosksKiosk, convenience shop, grocery, food, marked, staple goodsCanteen, cafeteria, flowersSpar, Brugsen, 7-Eleven, Twenty 4–7
47.11.20 SupermarketGrocery, food, marked, staple goodsCanteen, cafeteria, flowersSpar, Superbest, Dreisler, Brugsen
47.11.30 Discount supermarketConvenience shop, grocery, food, marked, staple goodsCanteen, cafeteria, flowersRema, Fakta, Netto Kiwi, Irma
47.19.00 Other retail from non-specialized shopsKiosk, convenience shop, grocery, food, marked, staple goodsCanteen, cafeteria, flowersKvickly, Bilka, Føtex, Salling
47.21.00 GreengrocerVegetables, green, fruitCanteen, cafeteria, flowers-
47.22.00 Butcher shops and delisSlaughter, butcher, delis, delicatessen--
47.23.00 Fish shopsFish--
47.24.00 Retail with bread, confectionery and sugar productsBakery, candy, chocolate, confectionary, sweetsSport, care home, canteen, cafeteriaFrellsen
47.25.00 Retail with beveragesWine, beerCanteen, cafeteria-
47.29.00 Other retail with food in specialized shopsCheese, nutrition, bazaar, egg, thee, coffeeTransportation, canteen, cafeteria-
47.30.00 Gas stationsRetail, shop, 7-Eleven, service Q8, Shell, Statoil, Haahr
56.10.10 Full service restaurantsRestaurantPizza, pub (bodega), rental, sport, invest, club, development, golf, kiosk, assembly room, management-
56.10.20 Pizzeria, take away, ice cream shops, etc.Sausage, hotdog, pizza, grill, sandwich, pita, barbeque, burger, shawarma, sushi, kebab, Thai, salad, pancakes, take awayCultural center, bingo, cafeteria, sport, trader, canteen, ice cream, bar, invest, club, assembly room, pool, administration, office, hallMcDonalds, Burger King, Subway,
56.29.00 Other restaurants-Canteen, hall, catering, school, sport-
56.30.00 Cafés, pub, bars, etc.Bar, café, bodega, pub, nightclub, discoSport, club
Pre-classifying the businesses has previously been proven to focus the search for fast food outlets in the Smiley register [18] and is applied here to all types of food retailers to evaluate the results for different food sources. The list of words used for classifying the businesses can be found in Table 2. The words are based on Danish food tradition and culture combined with empirical knowledge gathered in the fieldwork. Positive words indicate that a business is most likely selling or serving food based on the business name combined with the NACE classification. Negative words indicate that a business is not targeted at selling food, has very limited opening hours or is located in a restricted area. Positive words listed under a different NACE code than the one in question indicates that the business has been given the wrong NACE code. Any business name not associated with either a positive or a negative word is not classifiable. Based on the positive and negative words and NACE codes, the business records can be divided into four groups.
  • Most likely food businesses: the business name contains positive words associated with the NACE code.
  • Non-food targeted businesses: the business name contains negative words associated with the NACE code.
  • Wrongly classified businesses: the business name contains positive words associated with a different NACE code.
  • The business’s relevance is not possible to categorize based on the name.
If the pre-classification proves successful, the application thereof to the registers in other parts of the country would reduce the field observation process to include only group four.

2.4. Geo-Coding

The addresses in CVR were geocoded based on address reference data in the Universal Transverse Mercator (UTM) projection obtained from the Danish Geodata Agency. The Smiley register contains WGS84 (World Geodetic System 84) coordinates for approximately 95% of entries, which are transformed to UTM and used as their locations. The remaining records are geocoded through the use of the address and reference data from the Danish Geodata Agency. The distribution of the Smiley and CVR directory entries is visualized in Figure 1.
Figure 1. Map of the records in Smiley and CVR.
Ijgi 03 00236 g001

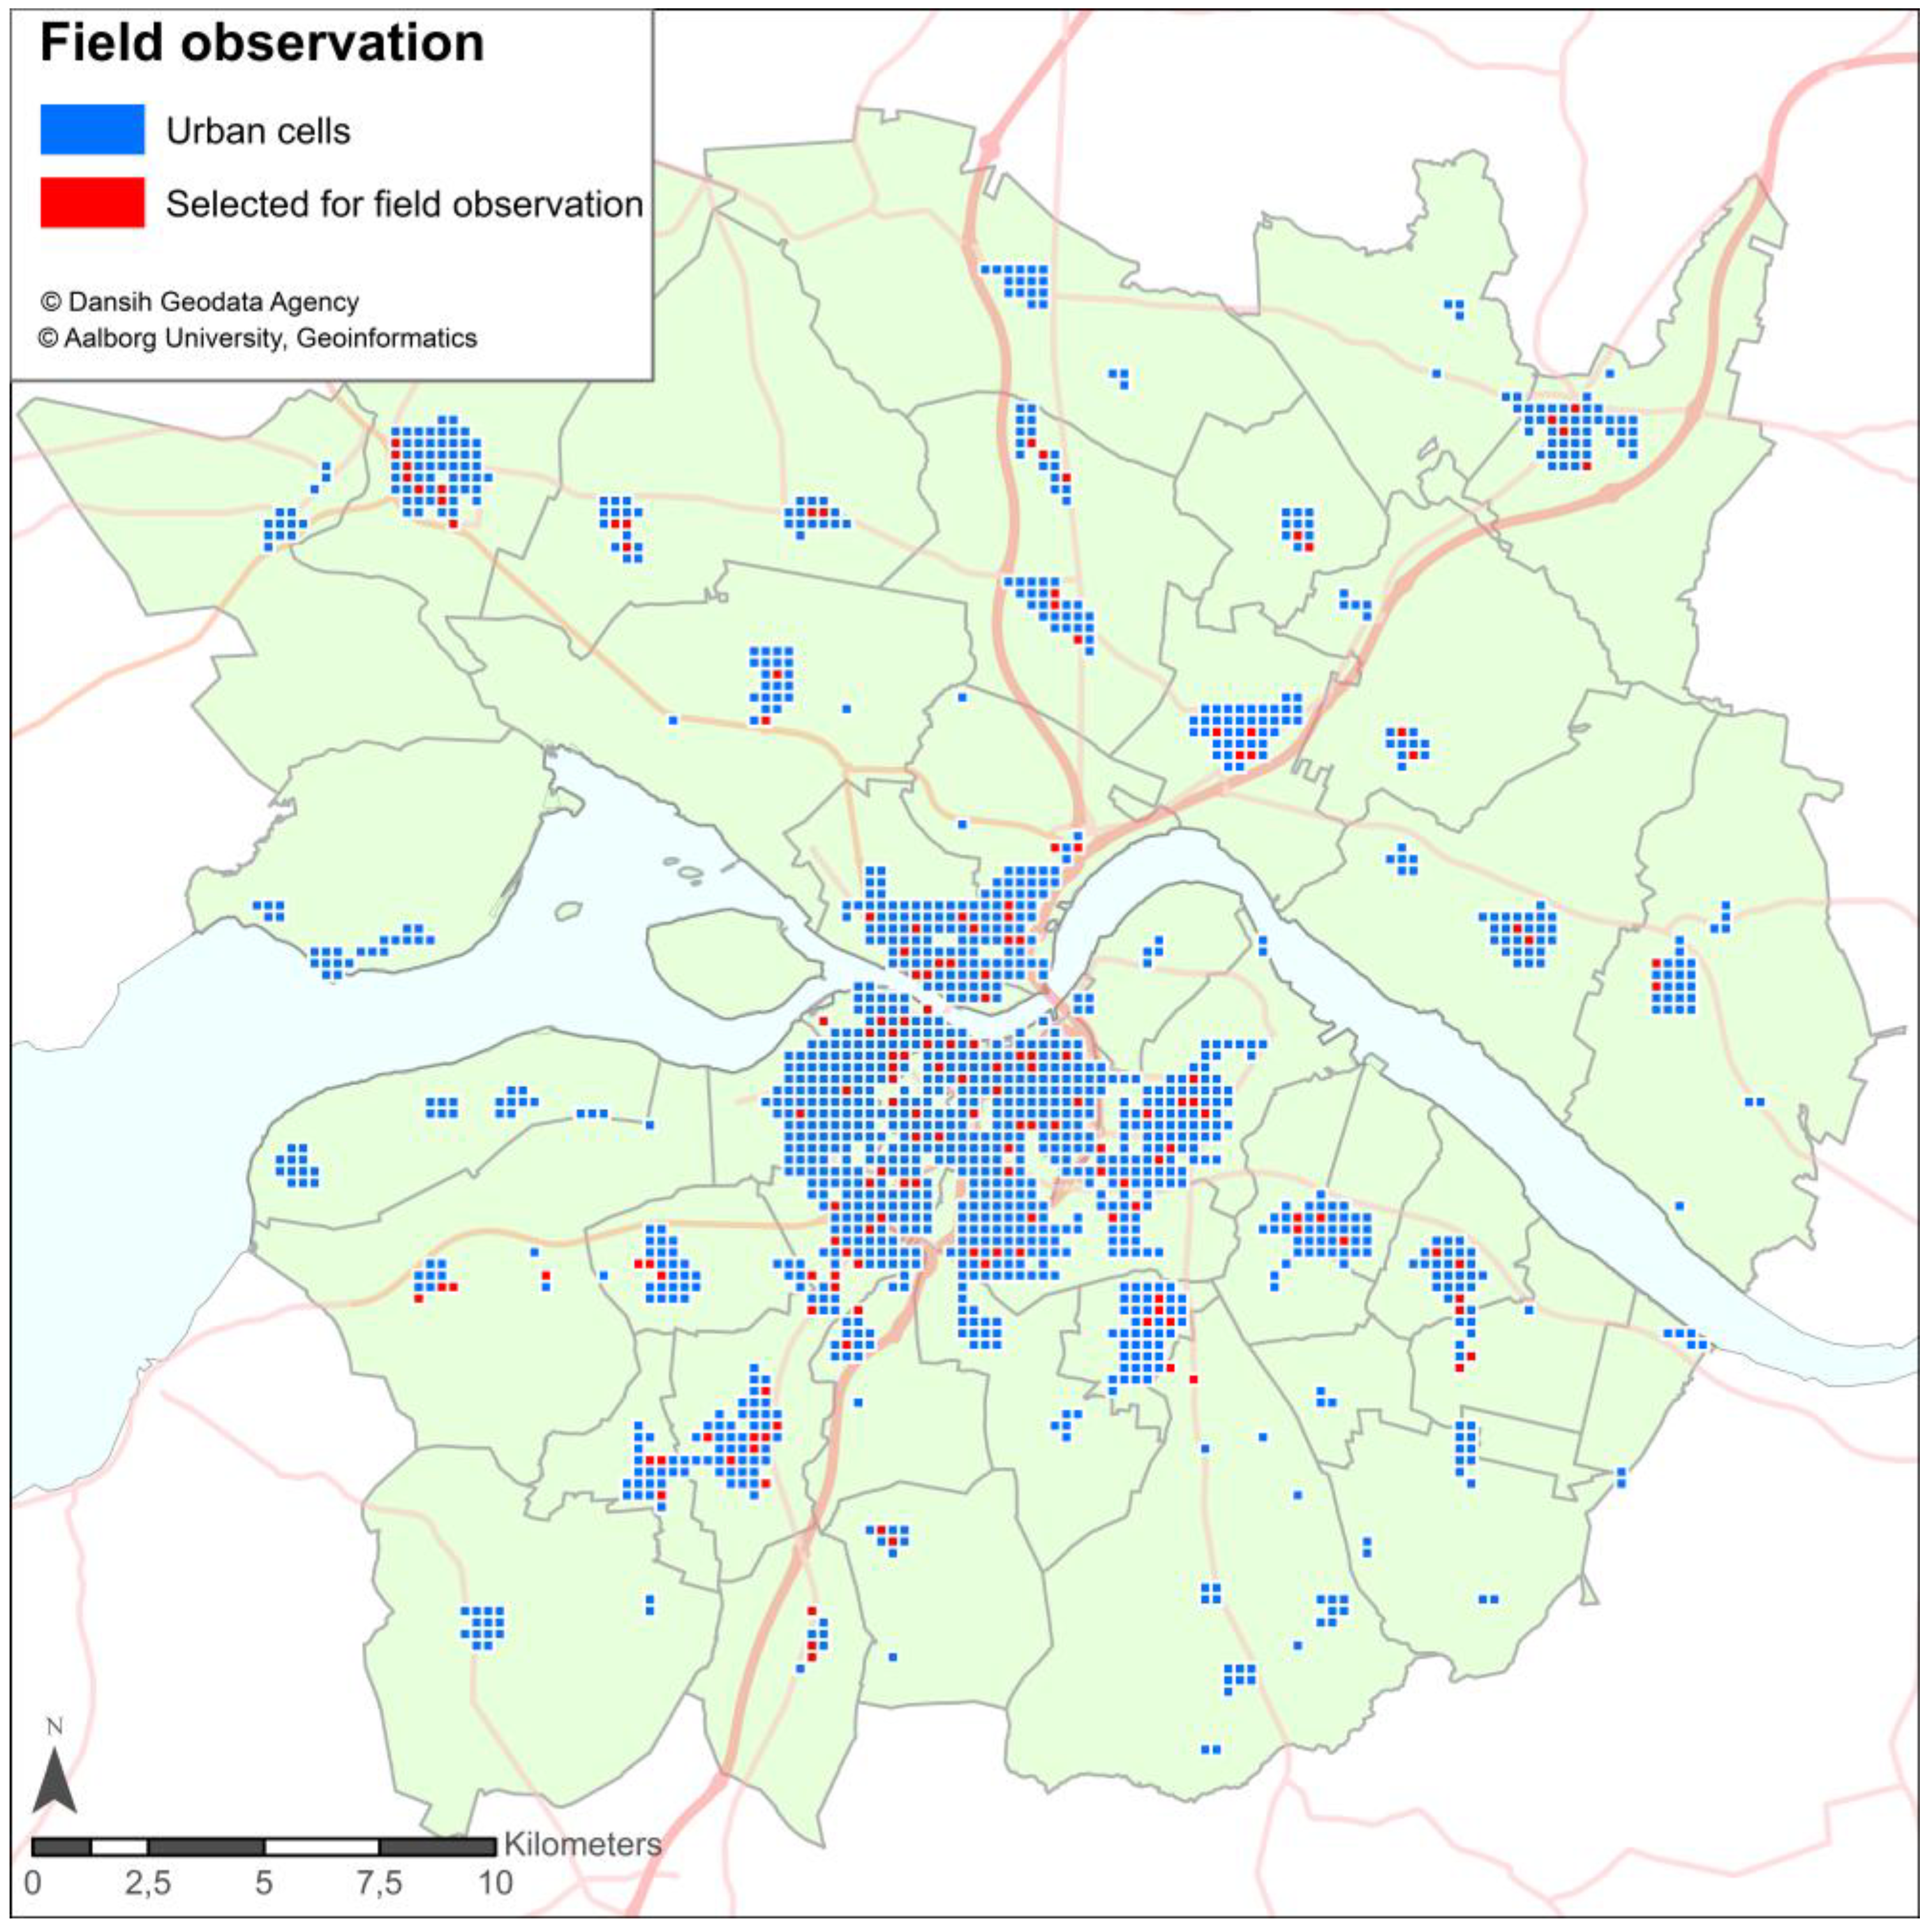
2.5. Field Observation

The method for field observation was adopted from Toft et al. [18]. The study area was divided into cells of 250 × 250 m through the use of the standard Danish Grid Cell system. Four hundred and ninety-seven grid cells contain records from the Smiley register and CVR. A random sample of 125 cells was selected from the 497 cells for field observation. An additional 35 cells were selected to search for unlisted food retailers in cells that, based on population, could possibly support the existence of a food retailer. To fulfill this, the 35 cells had to follow these three criteria: the cell contains no records in Smiley or CVR; a minimum of 10 addresses from the address reference data are located in the cell; and a minimum of two neighboring (queen’s rule) cells have a minimum of 10 addresses. The selected and populated (following the criteria) cells are illustrated in Figure 2. The selected cells were approximately divided into 50% located in the metropolitan area of Aalborg and 50% located in the rural areas surrounding Aalborg.
Figure 2. Map of the 160 randomly selected grid cells located within the 60 parishes in the region around Aalborg.
Ijgi 03 00236 g002
Two surveyors performed the field observations in July 2013, visiting the 160 grid cells. Every street in the cells was systematically searched for food retailers listed in Smiley or CVR, as well as unlisted food retailers. A real-time kinematic global navigation satellite system (RTK GNSS) was used to measure every observed food retailer, and the characteristics of the retailer were identified to classify the food retailer by type. The characteristics of the businesses used to classify the food retailers were drawn from previous literature used for classifying food stores [22] and restaurants [16,23], but modified to fit Danish standards. The definitions of the food retailers are based on the businesses’ characteristics as listed in Table 3. In the field observations, food retailers listed in CVR and Smiley were omitted from being measured if they belonged to one of the three following definitions: retailers not targeted at selling food, retailers located within a restricted area and nonexistent retailers.
Table 3. Characteristics used to classify food stores and restaurants.
Food Retailer TypeCharacteristics
SupermarketSupermarkets that are part of a large chain, a minimum of three cash registers, fresh meat, a large selection of fresh vegetables and fruit and often one or more of the following features: butcher, deli or bakery
Discount supermarketSupermarkets that are part of a chain, a maximum of two cash registers, a small selection of fresh meat and vegetables and fruit
Grocery shops and kiosksSmall independent convenience and grocery stores, kiosks and gas stations with a limited selection of food items
Gas stations
Specialty food stores: fish, greengrocers, butchers, delis, bakers, beverages, etc.Specialized in the trade of one food (meat, vegetables, beverages, fish, etc.) with little or no other food types in store
Full service restaurants and cafésFine dining, sit down (eat-in) with service at tables
Pizzeria, take away, ice cream shops, etc. (fast food)Fast food chains and independent retailers with two or more of the following features: expedited food service, counter service only, takeout business and payment tendered prior to receiving food
Bars, pubs, etc.Limited food serving with a focus on serving alcohol and late-night opening hours

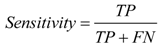
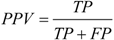
2.6. Statistical Analysis

Sensitivity and PPV were calculated to establish the level of agreement between the two food directories and the field observations. The results from the field observations were treated as the “gold standard”. The calculation was performed using the 2 × 2 shown in Table 4.
Table 4. Illustration of the relationships between true and false field observations and food directories.
Field Observation
PresentAbsent
Food directoriesPresentTrue positive (TP)False positive (FP)
AbsentFalse negative (FN)True negative (TN)
Sensitivity is the proportion of food retailers observed through the field observations that were listed in the food directories. Sensitivity is a measure of the completeness of the food directories calculated using Equation (1).
Ijgi 03 00236 i001
PPV is the proportion of food retailers listed in the directories that were observed in the field observations and was calculated using Equation (2).
Ijgi 03 00236 i002
Sensitivity and PPV were also calculated for the NACE classification, including both non-exact and exact classification matches between the NACE classification and the field observations. This presents a measure of the thematic accuracy of the government directories.
The pre-classification of the food retailers was evaluated through sensitivity, PPV and negative predictive value (NPV). NPV is the proportion of observations pre-classified as not targeted at selling food and observed in the field observation as not selling food. NPV was calculated using Equation (3).
Ijgi 03 00236 i003
The categorization of sensitivity, PPV and NPV was as follows [24]: <0.30 (poor), 0.31–0.50 (fair), 0.51–0.70 (moderate), 0.71–0.90 (good) and >0.91 (excellent). The standard deviation (σ) between the food directory’s location and the RTK GNSS measurements collected in the field observations was calculated as a measure of the geographical accuracy. This standard deviation was calculated using Equation (4) [25], where di is the Euclidean distance between a retailer’s observed location and the location in the food directory and d is the mean value of all the distances, di.
Ijgi 03 00236 i004
The standard deviation is an indicator of the dispersion from the expected or “true” value. The observations measured by a real-time kinematic global navigation satellite system (RTK GNNS; advanced GPS) have an accuracy of 1–2 cm in the plane [26], and hence, the coordinates measured by the RTK GNSS receiver were considered the “true value”.

3. Results

3.1. Completeness

In Table 5, the comparison between the retailers listed in Smiley and CVR and the field observations is summarized. From Smiley and CVR, 285 and 199 retailers, respectively, were selected for field observation. In the field observations, 272 retailers from the Smiley directory and 164 retailers from the CVR directory were present. Thirteen of the retailers listed in Smiley were not observed in the field. This was primarily because either the retailer was listed at the owner’s address (n = 5) or the listing was for a mobile retailer (n = 4). The PPV calculated for the retailers listed in Smiley that were present in the field observations was excellent (0.95). Thirty-five of the retailers listed in CVR were not observed in the field. The majority were retailers listed at the address of the owner (n = 25) or mobile retailers (n = 2), similar to Smiley. The PPV for the retailers listed in CVR was good (0.82).
Table 5. Identification of retailers in CVR and Smiley in relation to the field observations.
Field Observation
PresentAbsent
SmileyPresent27213
Absent--
CVRPresent16435
Absent--

3.2. Thematic Accuracy

The retailers present in Smiley and CVR did not all fit the characteristics of one of the food retailer types in Table 3. Table 6 presents the comparison between the food retailers listed in Smiley and the food retailers found in the field observation. A total of 187 food retailers were observed in the field observations and also listed in Smiley, and 41 (21.93%) were observed that were unlisted in Smiley. One third of the retailers listed in Smiley were not located in the field observations (n = 98), including those omitted because they were not targeted at selling food (n = 15), or were located in a restricted area (n = 76). This primarily included canteens (n = 11), institutions for children and the elderly (n = 29) and sports venues (n = 34). The PPV calculated for the food retailers in Smiley that were present in the field observations was moderate (0.66), and the sensitivity for food retailers in the field observations listed in Smiley was good (0.82). The individually calculated sensitivities for each food retailer classification were good and ranged from 0.77–0.86. PPVs were also calculated for the individual classifications, but with a larger dispersion from fair to excellent (0.50–0.93).
Table 6. Comparison of the food retailers listed in Smiley with those found in the field observations for each classification of food retailers and the total number (* incorrectly classified retailers). PPV, positive prediction value.
SupermarketSpecialty Food StoresRestaurantsBars, Cafés, etc.Total
PresentAbsentPresentAbsentPresentAbsentPresentAbsentPresentAbsent
Field observationPresent40 (1 *)1236 (2 *)699 (25 *)2012 (0 *)3187 (28 *)41
Absent3-8-75-12-98-
Sensitivity0.770.860.830.800.82
PPV0.930.820.570.500.66
Of the 187 food retailers present in both the field observations and Smiley, 28 (14.97%) were incorrectly classified based on the characteristics from Table 3, though 17 of these were cafés listed as restaurants, which in terms of their characteristics are much more similar than bars and cafés according to the NACE classification. The remaining misclassified retailers were fast food retailers listed as supermarkets (n = 1) or specialty food stores (n = 2), bars listed as restaurants (n = 3) and kiosks listed as restaurants (n = 5).
In Table 7, the comparison between the food retailers listed in CVR and the food retailers found in the field observations is presented. One hundred and forty-three of the food retailers in CVR were found in the field observations and 55 were absent. Of those 55, nine were not located, 25 were located at the owner’s home address and 14 were in restricted areas, such as canteens (n = 5) and sport venues (n = 4). The PPV and sensitivity for the comparison of CVR and field observations were, respectively, good (PPV = 0.72) and moderate (sensitivity = 0.63). The sensitivity for the individual food retailer classifications ranged from fair to good (0.34–0.81). PPV ranged from moderate to excellent (0.54–0.91).
Table 7. Comparison of the food retailers listed in CVR with those found in the field observations for each classification of food retailers and the total number (* incorrectly classified retailers).
SupermarketSpecialty Food StoreRestaurantFast FoodBar, Cafés, etc.Total
PresentAbsentPresentAbsentPresentAbsentPresentAbsentPresentAbsentPresentAbsent
Field observationPresent42 (2 *)10132522 (15 *)1048 (2 *)3318 (1 *)7143 (20 *)85
Absent4-11-11-20-10-56-
Sensitivity0.810.340.690.590.720.63
PPV0.910.540.670.710.640.72
In the comparison of food retailer classifications between CVR and the field observations, 20 of the 143 retailers (13.99%) found in the field observations were incorrectly classified. These included fast food retailers listed as supermarkets (n = 2) or restaurants (n = 9), cafés listed as fast food (n = 4), bars listed as restaurants (n = 2) and restaurants listed as bars in CVR (n = 1).
In Table 8, rural and urban areas are compared based on the number of food retailers listed in CVR or Smiley and the field validation. The PPV for Smiley ranged from 0.62 in rural to 0.67 in urban areas and for CVR from 0.73 in rural to 0.71 in urban areas. The sensitivity for Smiley ranged from 0.88 in rural to 0.95 in urban areas and for CVR from 0.85 in rural to 0.93 in urban areas. Only small differences were found in both PPV and sensitivity between the rural and urban areas for both CVR and Smiley. However, there was a small tendency that retailers found during field observations in urban areas were a bit more likely to be present in Smiley and CVR.
Table 8. Comparison of food retailers divided into urban and rural areas.
Urban AreaRural Area
SmileyCVRSmileyCVR
PresentAbsentPresentAbsentPresentAbsentPresentAbsent
Field observationPresent1267997618448
Absent61-40-37-16-
A comparison of Smiley with CVR is presented in Table 9. In the field observations, 228 food retailers were identified, but only 117 (51.32%) of these were listed in both CVR and Smiley. Additionally, 15 observations from the field observations were not found in either CVR or Smiley. The probability of a food retailer found in the field observations being listed in either CVR or Smiley is excellent (sensitivity = 0.93).
Table 9. Comparison of the food retailers found in the field observations being listed in Smiley and CVR.
Smiley
PresentAbsent
CVRPresent11726
Absent7015

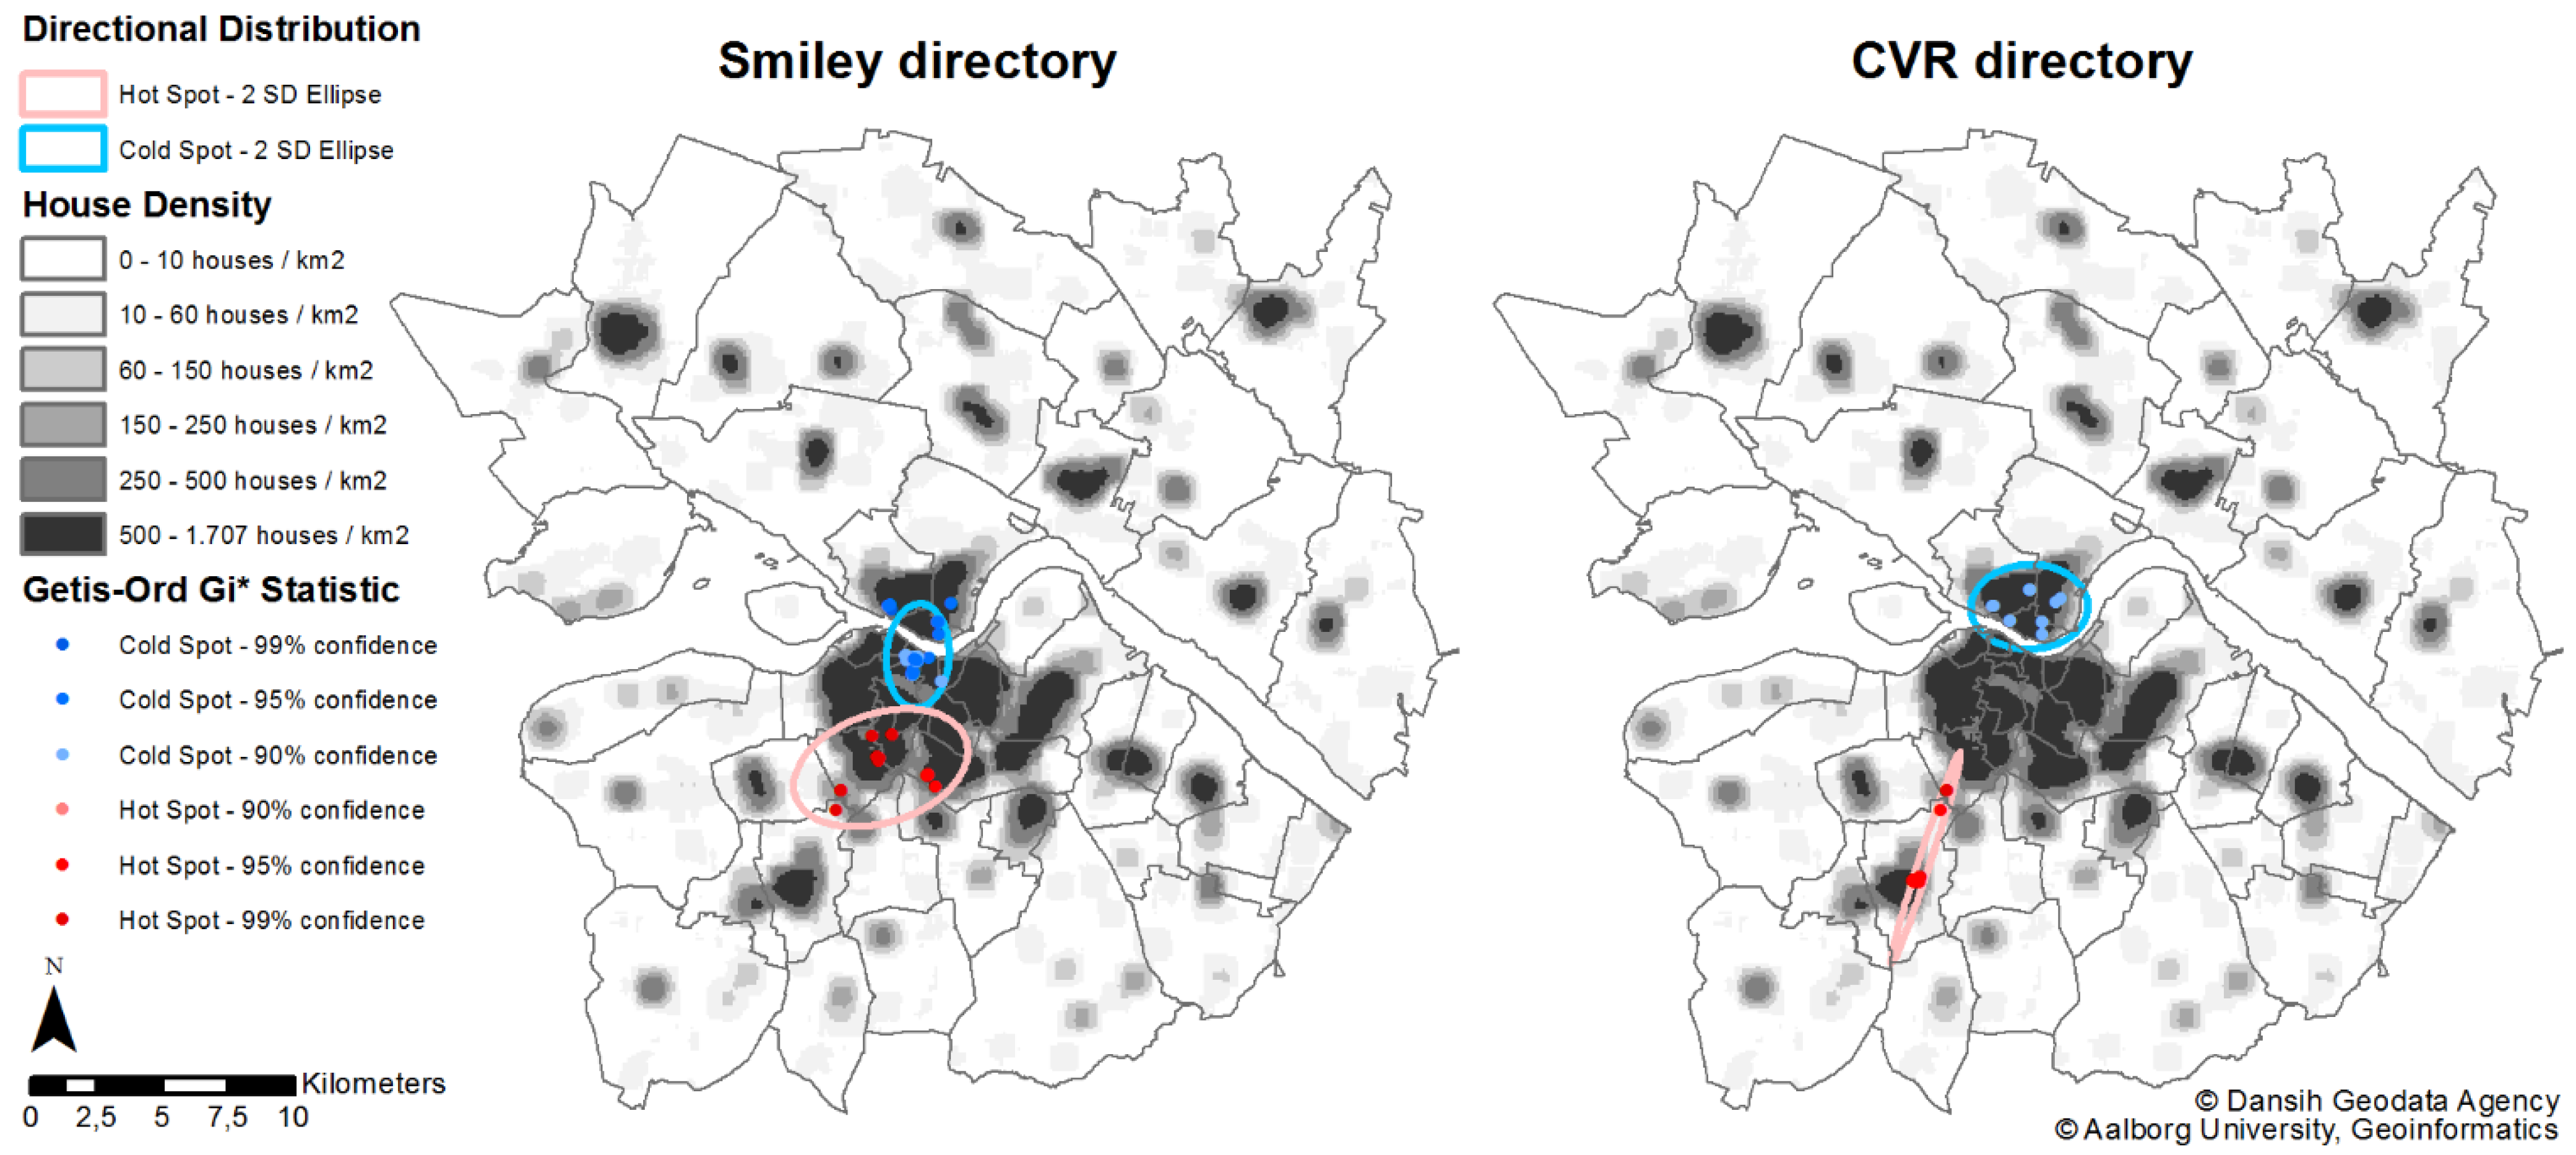
3.3. Geographic Accuracy

The field observation coordinates collected with the RTK GNSS receiver and those from Smiley (few geocoded) and CVR (all geocoded) were compared based on joint Euclidian distance. The mean and standard deviation for Smiley and CVR are 23.74 ± 23.04 m and 18.74 ± 19.83 m, respectively. For Smiley, 97.33% of the records measured in the field were within 100 m of the listed coordinates and 87.70% were within 50 m. For CVR, all records measured in the field were within 100 m and 92.31% were within 50 m. For the 250 × 250 m cells, 12.30% of the records in Smiley and 12.59% of the records in CVR were found outside the cell in which the listing was registered. None of the records in either Smiley or CVR were found outside the parish in which the retailer was registered.
The errors between the locations in the registers and the measured locations were analyzed for spatial patterns through the measurement of spatial autocorrelation (Moran’s I) and high/low clustering (Getis-Ord General G). The results of the analysis were high positive z-scores for both spatial autocorrelation (Smiley 15.74; CVR 15.96) and high/low clustering (Smiley 8.66; CVR 11.18), indicating clustered results. The p-value was, on all occasions, below 0.001, indicating significant results.
Figure 3. Map of hot/cold spot Getis-Ord Gi* statistical analysis of the Euclidean distances between “true” locations and the locations derived from the registers. Two standard deviational ellipses are visualized for the hot and cold spots.
Ijgi 03 00236 g003
The distribution of the clusters was analyzed to determine whether the clusters are located in urban or rural areas. The analysis was conducted in the software ArcGIS Desktop 10.2 by ESRI using optimized hot spot analysis (Getis-Ord Gi* Statistic) from the Spatial Statistics package. In Figure 3, the results are visualized. The clusters with low values (cold spots) are for both Smiley and CVR located in the central part of Aalborg, whereas the clusters with high values are located in the sub-urban/rural areas for Smiley and in rural areas for CVR.

3.4. Pre-Classification

The pre-classification divided the food retailers listed in CVR and Smiley into four groups based on the retailers’ names. In CVR and Smiley, respectively, 109 and 124 retailers were classified as “most likely food business”, 26 and 85 retailers as “non-food targeted business”, 20 and 29 retailers as “wrongly classified business” and 44 and 47 as “business classification not possible”. The field observations were compared to each group in the pre-classification, as shown in Table 10, and the proportion of correctly classified retailers in each group was calculated as PPV for three of the groups and as NPV for the group “non-food-targeted business”. The PPVs for the classifications “most likely food business” (0.98) and “wrongly classified business” (0.97) were both excellent for Smiley, as was the NPV for the classification “non-food-targeted business” (0.98). The PPV for the classification “business classification not possible” in Smiley was good (0.74). Similarly excellent results were calculated for CVR when comparing the pre-classification and the field observations for the classes “most likely food business” (0.95), “wrongly classified business” (0.95) and “non-food-targeted business” (1.00), but only a fair PPV for the class “business classification not possible” (0.45). Based on the pre-classification, 47 retailers in Smiley and 44 retailers in CVR would be selected for field observation, thereby reducing the amount of field observation needed, with 83.51% for Smiley and 77.89% for CVR. The remaining retailers in Smiley (n = 238) and CVR (n = 155) have excellent PPVs of, respectively, 0.98 and 0.93 as a measure of being classified correctly. The combination of CVR and Smiley results in a total of 224 food retailers, including 11 errors, where only 23.15% were selected for field observation. Additionally, 15 retailers are missing, as they were not found in the field observations. This results in an excellent PPV (0.95) and sensitivity (0.93).
Table 10. Comparison of the pre-classification method, where the retailers are classified based on their name and the field observations.
Most Likely Food BusinessNon-Food-Targeted BusinessWrongly Classified BusinessBusiness Classification not Possible
PresentAbsentPresentAbsentPresentAbsentPresentAbsent
Pre-classification Smiley
Field observationPresent122--228-35-
Absent2--831-12-
Pre-classification CVR
Field observationPresent104--019-20-
Absent5--261-24-

4. Discussion

The identification of food retailers in the public space using individual lists from secondary sources has limited utility as a measure of the food environment. This is because the thematic accuracy for the directories are represented by a PPV of 66% for Smiley and 72% for CVR, indicating the proportion of food retailers listed in the directories that are actually a food retailer in reality; likewise for the sensitivity values of 82% for Smiley and 63% for CVR, indicating the proportion of food retailers found through the field observations that were listed in the directories. The results have similarities to previous studies of Smiley [18], where an identical sensitivity of 82% was achieved, though the PPV was a great deal higher at 92%. The higher PPV obtained was most likely the result of that study being limited to fast food retailers. Previous studies of the CVR directory [17] reached higher values for PPV (81% vs. 72%) and sensitivity (75% vs. 63%) compared to this study. Both studies included all food retailers and had the same sample size and applied field observations as the validation method. The only difference is in the geographical extents of the studies; while the previous study was limited to Copenhagen (high-density housing), this study included Aalborg, a city somewhat comparable to Copenhagen, but also included rural areas as approximately 50% of the areas for field observation.
The differences between urban and rural areas in the identification of food retailers are hard to establish if present. The difference found in this and in previous studies was a slightly higher sensitivity in urban areas. This includes the Smiley directory (93% vs. 85%), the CVR (95% vs. 88%) and a previous study of the Smiley directory (84% vs. 76%) [18]. The PPV is contradictory between CVR and Smiley in this study, as urban is highest in Smiley (67% vs. 62%) and rural highest in CVR (73% vs. 71%). The previous study of Smiley found the PPV to be highest in rural areas (94% vs. 90%), which contradicts the results found for Smiley in this study. Hence, there is no clear indication of better or worse PPV between urban and rural areas, with only a marginally better sensitivity for urban areas. These contradictions and small differences make no positive indications as to the possibility of significantly improving the accuracy of the directories.
Previous studies have stated that individual lists of food retailers have limited utility for identifying food stores, but combining the lists improves the likelihood of a retailer being a food store [27]. Combining CVR and Smiley produced the same results, as sensitivity increased to 93%, but still fell short of getting a high PPV. A combination of the two directories is not a method for reaching a valid list of food retailers without field observation or another method.
The geographic accuracy of the Smiley directory (23.74 ± 23.04 m) is comparable to previous studies (15 ± 24 m) [18]. The CVR is slightly better than Smiley with an accuracy of 18.74 ± 19.83 m. With 87.70% of the retailers in Smiley and 92.31% in CVR registered within 50 m of the true GPS position, the directories are accurate compared to other studies yielding results of 53%–56% within 100 m in the United States of America [13]. Whether the errors are larger in urban or rural areas is uncertain based on the analysis, though with a small tendency towards smaller errors being in the most populated areas.
The geographic accuracy clearly influences the applicability of the data. Analyses aggregating retailers over large areas or analyzing distances to the nearest food retailer are less affected by geographical inaccuracy, particularly if the food environment is dense with retailers. On the other hand, areas with few food retailers and analyses at small scales are vulnerable to geographic inaccuracy. In areas with a high density of food retailers, the distance in the analysis will theoretically have no impact, as the direction of the errors should be random. Whether this holds true is doubtful, but it calls for further research to fully understand the nature of the errors. The aggregation of retailers over small areas will create errors, as exemplified by the CVR directory. In CVR, 92.31% of the records were within 50 m, and according to the standard deviation, 95% should be within 58 m, but when aggregated into 250 × 250 m cells, more than 12% were aggregated incorrectly.
The completeness and thematic accuracy of the data demonstrates that if the raw data were used in research, there would exist a huge overrepresentation of food retailers similar to other studies [13]. The misclassification of retailers poses a major problem if analyzing small retailer groups, such as specialty stores, whereas the errors have less of an impact on large groups, such as restaurants or supermarkets. The completeness of both CVR and Smiley are poor in their raw state, as they are both missing retailers and have retailers that are in restricted areas, misclassified and nonexistent. We have not managed to identify the contemporaneity of the data, as there are several problems in measuring this completely. There are obvious problems with the retention of old data and the lack of new data in Smiley. The extent of these problems differs, as retailers closing down may only be visited once every second year, whereas retailers opening a shop need to enroll in the Smiley register within two weeks. This could indicate an overrepresentation of retailers in Smiley. The CVR directory has different issues, as this is updated on a daily basis, but requires input from the retail owners about address and classification. Based on the field work, the accuracy of the addresses is good, but the classifications include many errors, especially in regard to combined retailer classifications, i.e., gas stations often have a small kiosk, but are only classified as a gas station.
The Danish government has made basic data freely available to all, by which action the data are usable by a much larger crowd. Hence, there are obvious applications for this information in research, but the data were not collected for the purpose of research and, therefore, have limitations in term of completeness and thematic accuracy. In the Smiley directory, all units serving food are listed, which include limited access retailers that are not relevant in a measure of the public food environment. Similarly, for CVR, many mobile stands are included as being located at the owners address, but during business hours are located at more central spots in the city. Consequently, knowledge about the data’s accuracy, completeness, etc., is essential when basing analysis and conclusions on such directories.
The pre-classification method based on business names was earlier proven to be a good method for improving PPV and sensitivity for the identification of fast food outlets in Copenhagen [18]. The results of applying the pre-classification in this study were excellent, with a greatly improved PPV and sensitivity of the directories. The method demands knowledge about the tradition and culture of the food retailers, as well as the language to determine which words the classification should be based on. In a Danish context, the study confirms the results of a previous study by Toft and colleagues for both CVR and Smiley. The pre-classification limits the time and cost of field observations, which is most needed, as fieldwork can be a very expensive affair if the area and the number of food retailers in question are large [6]. Based on a study including five secondary sources [17] and another combining nine secondary sources of food retailers [27], the inclusion of more sources is believed to improve the identification of food retailers in the directories and, hence, the measure of the food environment. The application of the pre-classification method followed by the use of additional food retailer directories to further limit the needed amount of field observation is considered to improve the measure of the food environment even more in terms of time and finances needed.

5. Conclusions

The completeness of the listings of retailers in Smiley and CVR were excellent and good, respectively, but a large proportion of the retailers (34% in Smiley and 28% in CVR) were not targeted to selling food in the public space or were limited to a confined area. This was the result for all of the NACE classifications, though most pronouncedly for restaurants (PPV = 0.57) and bars (PPV = 0.50) in Smiley and for specialty food shops in CVR (PPV = 0.54). Both CVR and Smiley were missing retailers, which were found in the field observations with sensitivities of, respectively, 0.63 and 0.82. As neither CVR nor Smiley has a combination of excellent PPV and sensitivity, the direct application of either directory would result in a misrepresentation of food retailers.
There were found to be no clear differences between food retailers in urban vs. rural areas, with differences of 0.02–0.08 for sensitivity and PPV.
Combining CVR and Smiley resulted in an excellent sensitivity (0.93), with only 15 retailers missing from both directories, but without field observation, the retailers not targeted at selling food in the public space cannot be removed from the directories, again leading to a misrepresentation of food retailers.
The pre-classification resulted in an excellent PPV and sensitivity, but is limited to the specific classification characteristics and application in CVR and Smiley. Adaption to other Danish and possibly Scandinavian directories is plausible with the current characteristics of the pre-classification, due to the similarity in languages, tradition and culture. Application of the pre-classification to other countries’ directories is believed to be possible if the criteria for classifying the food retailers are modified to the culture and tradition of the country’s language and food environment.

Acknowledgments

This paper was founded by an internal research grant from Aalborg University, Copenhagen, Denmark. The authors acknowledge Mette Lund Jensen for her technical assistance during the field observation.

Author Contributions

Both authors contributed to the conceptualization of the study. Anders Knørr Lyseen led the field observation, data analysis and writing of the article. Henning Sten Hansen reviewed and revised all drafts of the article.

Conflicts of Interest

The authors declares no conflict of interest.

References

  1. McKinnon, R.A.; Reedy, J.; Morrissette, M.A.; Lytle, L.A.; Yaroch, A.L. Measures of the food environment: A compilation of the literature, 1990–2007. Am. J. Prev. Med. 2009, 36, 124–133. [Google Scholar] [CrossRef]
  2. Pearce, J.A.; Hiscock, R.A.; Blakely, T.B.; Witten, K.C. A national study of the association between neighbourhood access to fast-food outlets and the diet and weight of local residents. Health Place 2009, 15, 193–197. [Google Scholar]
  3. Thornton, L.E.; Pearce, J.R.; Macdonald, L.; Lamb, K.E.; Ellaway, A. Does the choice of neighbourhood supermarket access measure influence associations with individual-level fruit and vegetable consumption? A case study from glasgow. Int. J Health Geogr. 2012, 11. [Google Scholar] [CrossRef]
  4. Mikkelsen, B.E. Images of foodscapes: Introduction to foodscape studies and their application in the study of healthy eating out-of-home environments. Perspect. Public Health 2011, 131, 209–216. [Google Scholar] [CrossRef]
  5. Moore, L.V.; Diez Roux, A.V. Associations of neighborhood characteristics with the location and type of food stores. Am. J. Public Health 2006, 96, 325–331. [Google Scholar] [CrossRef]
  6. Kelly, B.; Flood, V.M.; Yeatman, H. Measuring local food environments: An overview of available methods and measures. Health Place 2011, 17, 1284–1293. [Google Scholar] [CrossRef]
  7. Neckerman, K.M.; Bader, M.D.M.; Richards, C.A.; Purcial, M.; Quinn, J.W.; Thomas, J.S.; Warbelow, C.; Weiss, C.C.; Lovasi, G.S.; Rundle, A. Disparities in the food environments of New York city public schools. Am. J. Prev. Med. 2010, 39, 195–202. [Google Scholar] [CrossRef]
  8. Sturm, R. Disparities in the food environment surrounding US middle and high schools. Public Health 2008, 122, 681–690. [Google Scholar] [CrossRef]
  9. Lytle, L.A. Measuring the food environment. Am. J. Prev. Med. 2009, 36, 134–144. [Google Scholar] [CrossRef]
  10. Glanz, K. Measuring food environments: A historical perspective. Am. J. Prev. Med. 2009, 36, 93–98. [Google Scholar] [CrossRef]
  11. Wang, M.C.; Kim, S.; Gonzalez, A.A.; MacLeod, K.E.; Winkleby, M.A. Socioeconomic and food-related physical characteristics of the neighbourhood environment are associated with body mass index. J. Epidemiol. Commun. Health 2007, 61, 491–498. [Google Scholar] [CrossRef]
  12. Cummins, S.; Macintyre, S. Are secondary data sources on the neighbourhood food environment accurate? Case-study in glasgow, UK. Prev. Med. 2009, 49, 527–528. [Google Scholar] [CrossRef]
  13. Liese, A.D.; Colabianchi, N.; Lamichhane, A.P.; Barnes, T.L.; Hibbert, J.D.; Porter, D.E.; Nichols, M.D.; Lawson, A.B. Validation of 3 food outlet databases: Completeness and geospatial accuracy in rural and urban food environments. Am. J. Epi 2010, 172, 1324–1333. [Google Scholar] [CrossRef]
  14. Lanvin, M.R. A clash of the titans: Comparing America’s most comprehensive business directories. Database 1998, 21, 44–48. [Google Scholar]
  15. Lake, A.A.; Burgoine, T.; Greenhalgh, F.; Stamp, E.; Tyrrell, R. The foodscape: Classification and field validation of secondary data sources. Health Place 2010, 16, 666–673. [Google Scholar] [CrossRef] [Green Version]
  16. Svastisalee, C.M.; Holstein, B.E.; Due, P. Validation of presence of supermarkets and fast-food outlets in copenhagen: Case study comparison of multiple sources of secondary data. Public Health Nutr. 2012, 15, 1228–1231. [Google Scholar] [CrossRef]
  17. Svastisalee, C.M.; Nordahl, H.; Glümer, C.; Holstein, B.E.; Powell, L.M.; Due, P. Supermarket and fast-food outlet exposure in copenhagen: Associations with socio-economic and demographic characteristics. Public Health Nutr. 2011, 14, 1618–1626. [Google Scholar] [CrossRef]
  18. Toft, U.; Erbs-Maibing, P.; Glümer, C. Identifying fast-food restaurants using a central register as a measure of the food environment. Scan. J. Public Health 2011, 39, 864–869. [Google Scholar] [CrossRef]
  19. Eurostat-European Commision. NACE Rev. 2—Statistical Classification of Economic Activities in the European Community; Eurostat Methodologies and Working Papers; Office for Official Publications of the European Communities: Luxembourg, Luxembourg, 2008. [Google Scholar]
  20. Danish Business Agency. CVR.dk. 2013. Available online: http://www.cvr.dk (accessed on 17 September 2013).
  21. Ministry of Food, Agriculture and Fisheries, Danish Veterinary and Food Administration. 2013. Available online: http://www.findsmiley.dk/en-US (accessed on 17 September 2013).
  22. Powell, L.M.; Han, E.; Zenk, S.N.; Khan, T.; Quinn, C.M.; Gibbs, K.P.; Pugach, O.; Barker, D.C.; Resnick, E.A.; Myllyluoma, A.; et al. Field validation of secondary commercial data sources on the retail food outlet environment in the US. Health Place 2011, 17, 1122–1131. [Google Scholar] [CrossRef]
  23. Bovell-Benjamin, A.C.; Hathorn, C.S.; Ibrahim, S.; Gichuhi, P.N.; Bromfield, E.M. Healthy food choices and physical activity opportunities in two contrasting Alabama cities. Health Place 2009, 15, 429–438. [Google Scholar] [CrossRef]
  24. Paquet, C.; Daniel, M.; Kestens, Y.; Léger, K.; Gauvin, L. Field validation of listings of food stores and commercial physical activity establishments from secondary data. Int. J. Behav. Nutr. Phys. Act. 2008, 5. [Google Scholar] [CrossRef]
  25. De Smith, M.J.; Goodchild, M.F.; Longley, P. Geospatial Analysis: A Comprehensive Guide to Principles, Techniques and Software Tools; Matador: Leicester, UK, 2007. [Google Scholar]
  26. Geoteam. Om GPSNET.dk (About GPSNET.dk). 2013. Available online: http://www.geoteam.dk/produkter/gpsnetdk/om-gpsnetdk.html (accessed on 17 September 2013).
  27. Hosler, A.S.; Dharssi, A. Identifying retail food stores to evaluate the food environment. Am. J. Prev. Med. 2010, 39, 41–44. [Google Scholar] [CrossRef]

