Drainage Structure Datasets and Effects on LiDAR-Derived Surface Flow Modeling

Abstract
:1. Introduction
2. Research Methods


3. A Case Study in Nebraska
3.1. Study Area
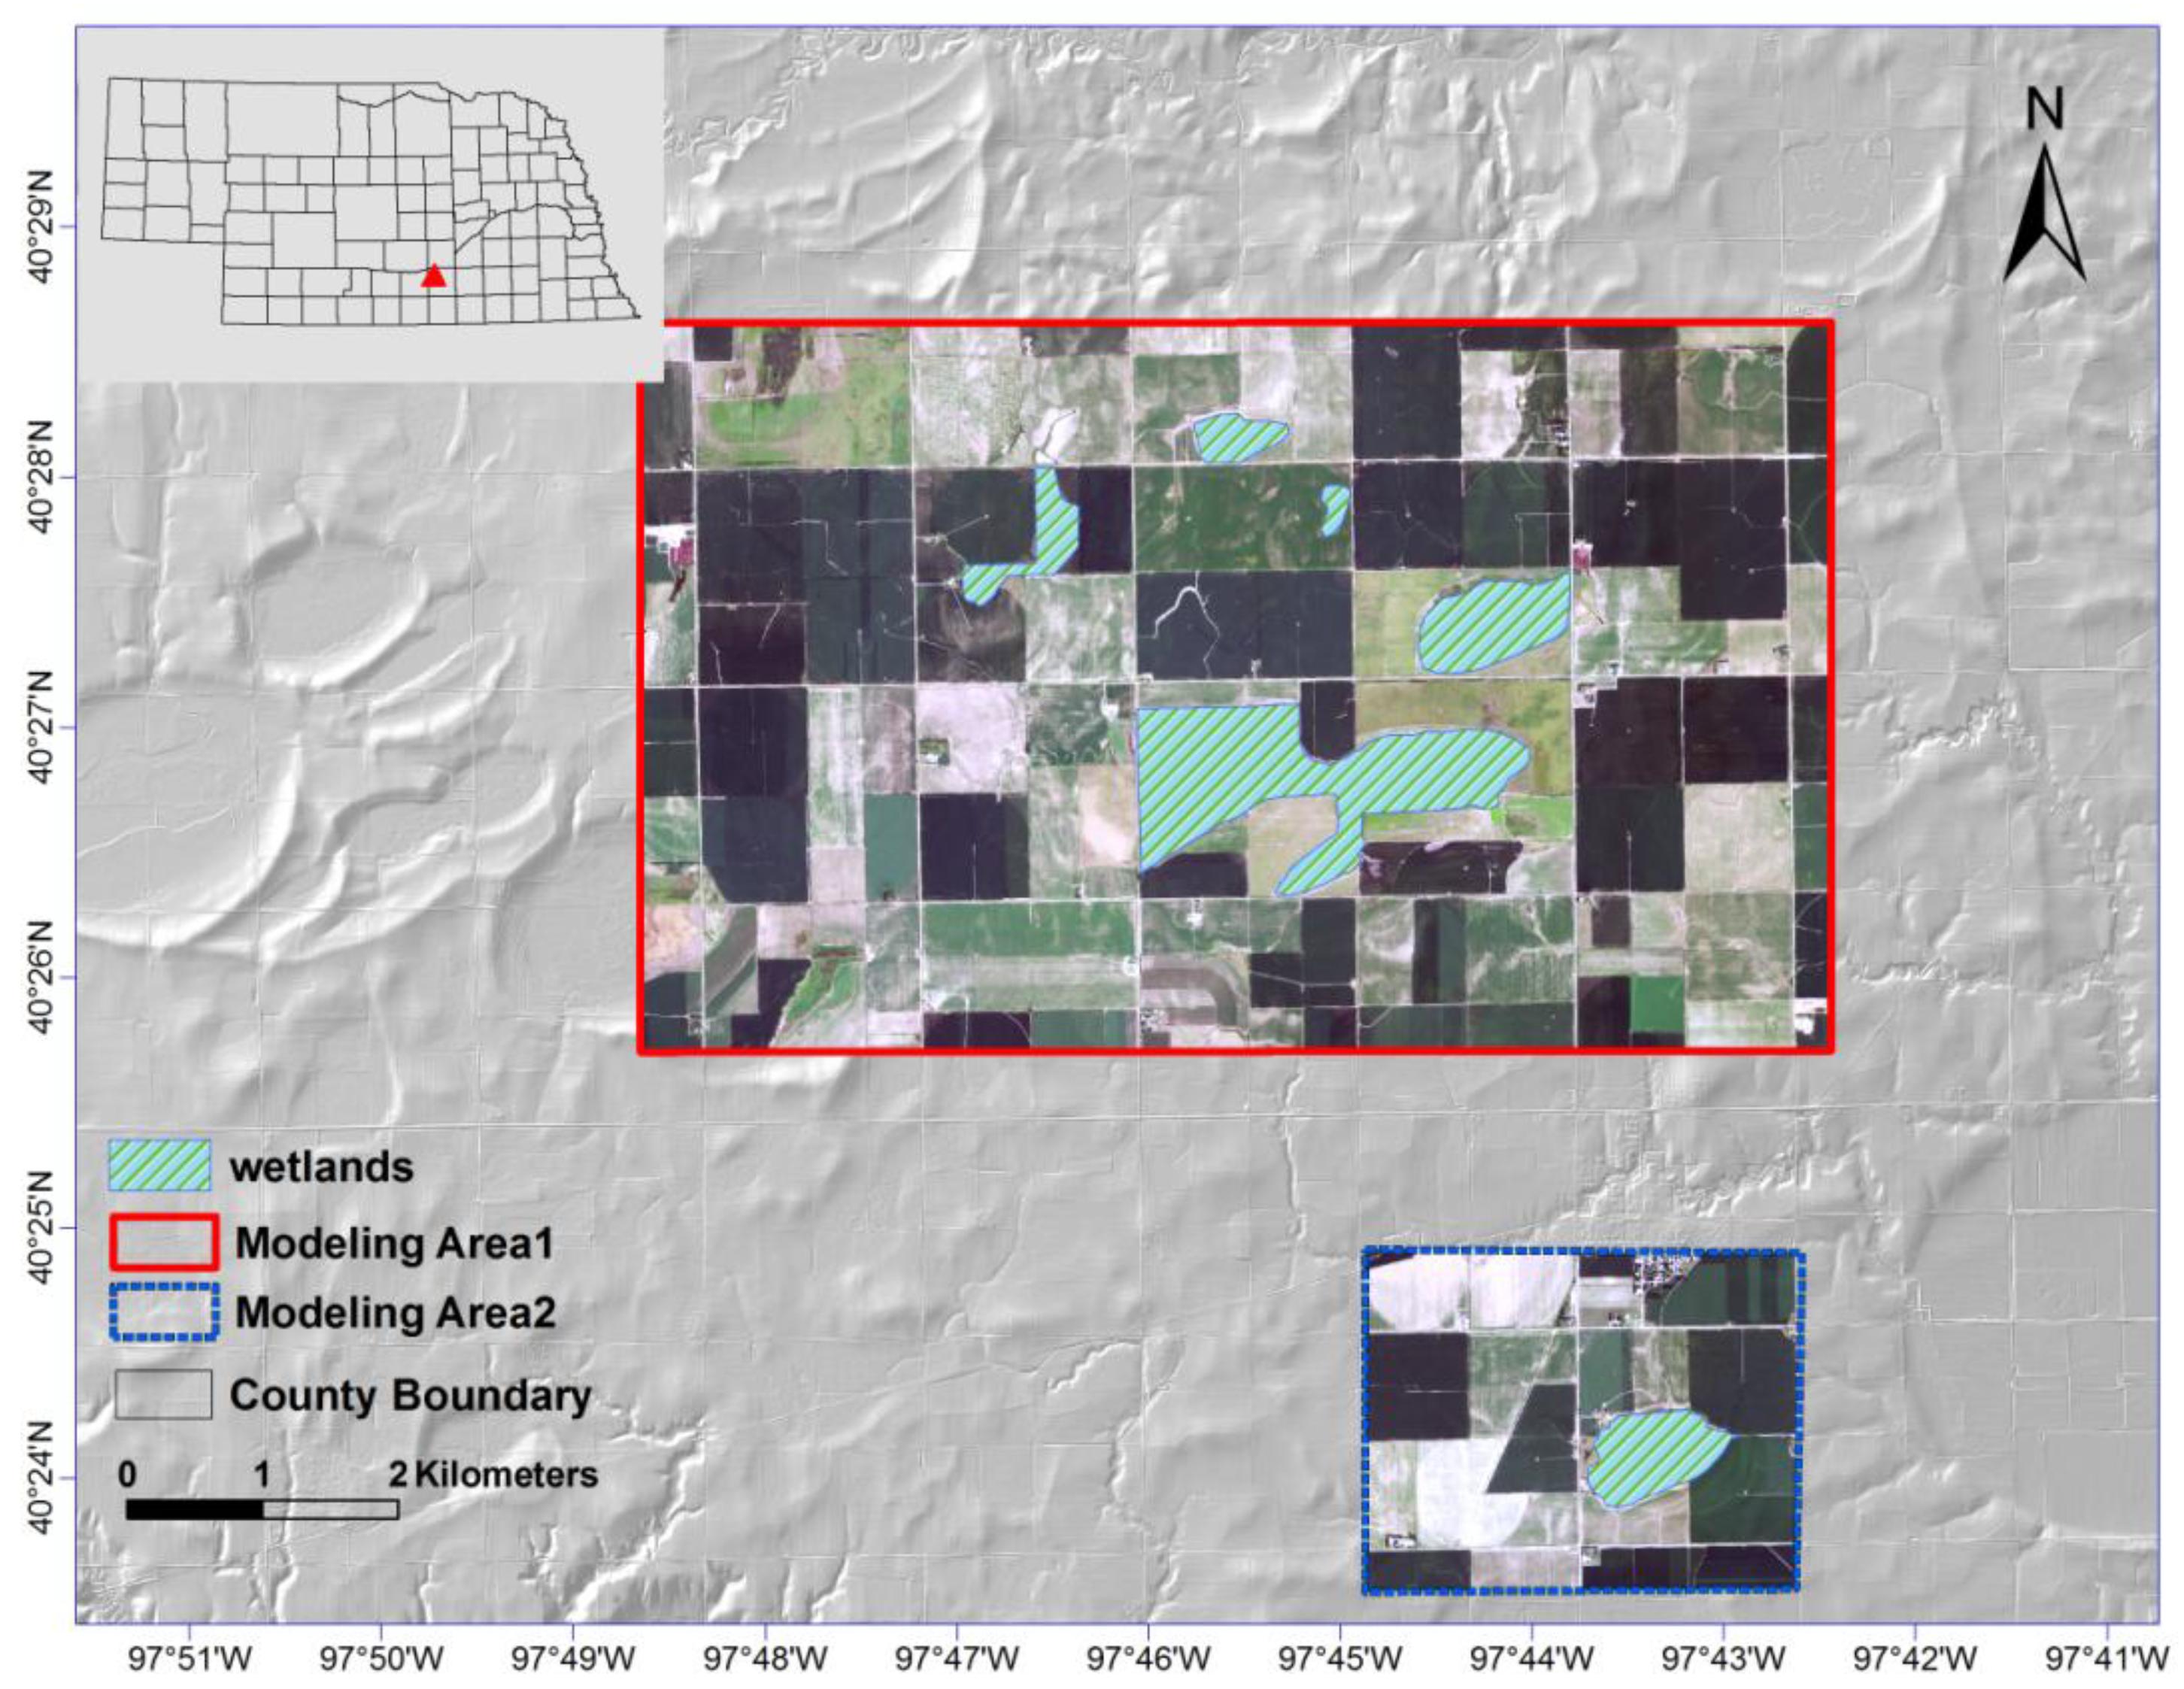
3.2. Data Sources and Collection

| Items | Information |
|---|---|
| Ground sample distance | 1.0 m |
| Collection conditions | Leaf off; Snow free |
| Accuracy required (Bare Earth) | Vertical: 0.15 m Root Mean Squared Error (RMSE) Horizontal: 1 m RMSE |
| Products (Mass Points) | First return; last return; bare earth; number of returns required is 5. |
| Datum | Vertical: NAVD 88 (default) Horizontal: NAD 83 (default) |
| Coordinate system | UTM Zone 14 Nebraska State Plane Zone 2600 |
| Units | Meters: to 3 decimal places (meters is default for UTM) Feet: to 3 decimal places (feet is default for state plane) |
| Title size | 2,000 m × 2,000 m (default meters) 2 m × 2 m (default feet) |
| Metadata required | FGDC (XML) in project level |
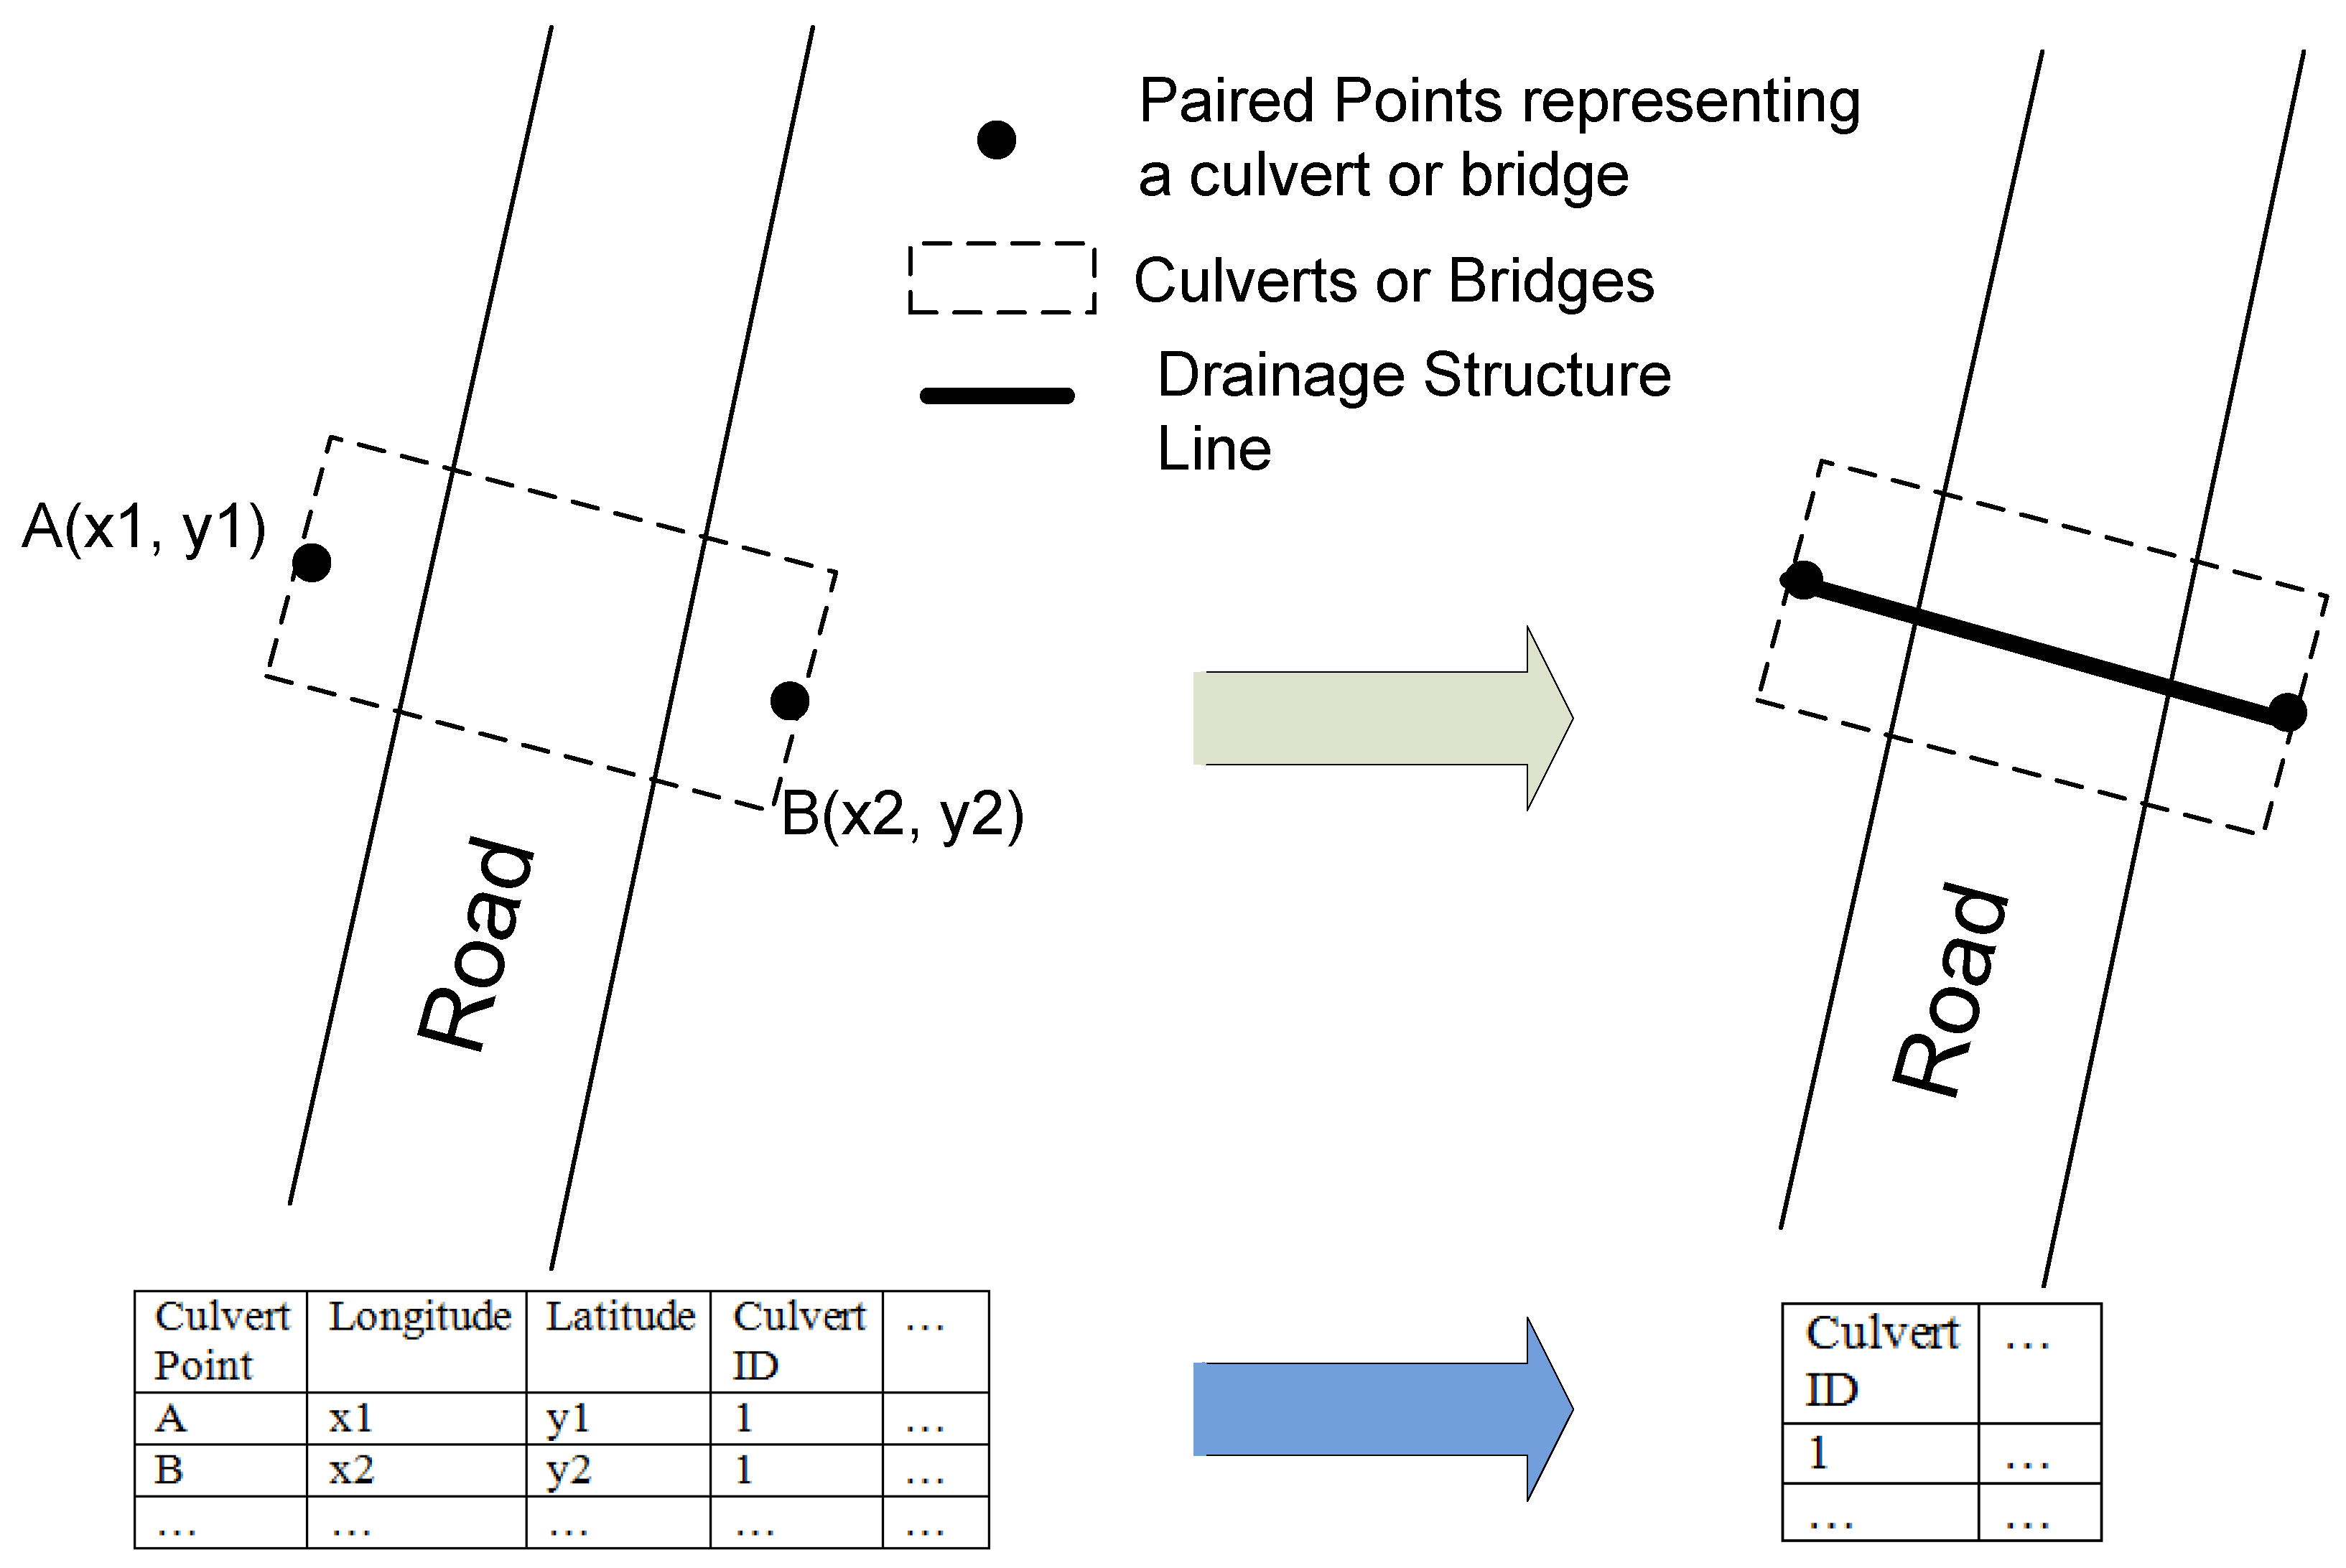
| No | Lat | Long | Culvert ID | Depth (m) | Diameter (m) | Notes |
|---|---|---|---|---|---|---|
| 1 | 40.45510 | −97.78576 | 1 | 0.6 | 1 | twin culverts |
| 2 | 40.45510 | −97.78564 | 1 | 1 | 1.2 | twin culverts |
| 3 | 40.43758 | −97.76812 | 2 | 0.8 | 0.8 | in the middle of wetlands |
| 4 | 40.43748 | −97.76808 | 2 | 0.8 | 0.8 | in the middle of wetlands |
| 5 | 40.44774 | −97.76671 | 3 | 0.7 | 0.5 | This culvert was newly replaced |
| 6 | 40.44779 | −97.76663 | 3 | 0.7 | 0.5 | This culvert was newly replaced |
| 7 | 40.46039 | −97.76667 | 4 | 0.9 | 0.6 | No drainage path was visible upstream side |
| 8 | 40.46047 | −97.76656 | 4 | 0.9 | 0.6 | No drainage path was visible upstream side |
| 9 | 40.46789 | −97.76656 | 5 | 0.9 | 0.6 | no wetland found nearby |
| 10 | 40.46788 | −97.76667 | 5 | 0.9 | 0.6 | blocked by corn stalks |
| 11 | 40.45208 | −97.77881 | 6 | 2.2 | 2 | |
| 12 | 40.45199 | −97.77881 | 6 | 2.2 | 2 | |
| … | … | … | … | … | … | … |
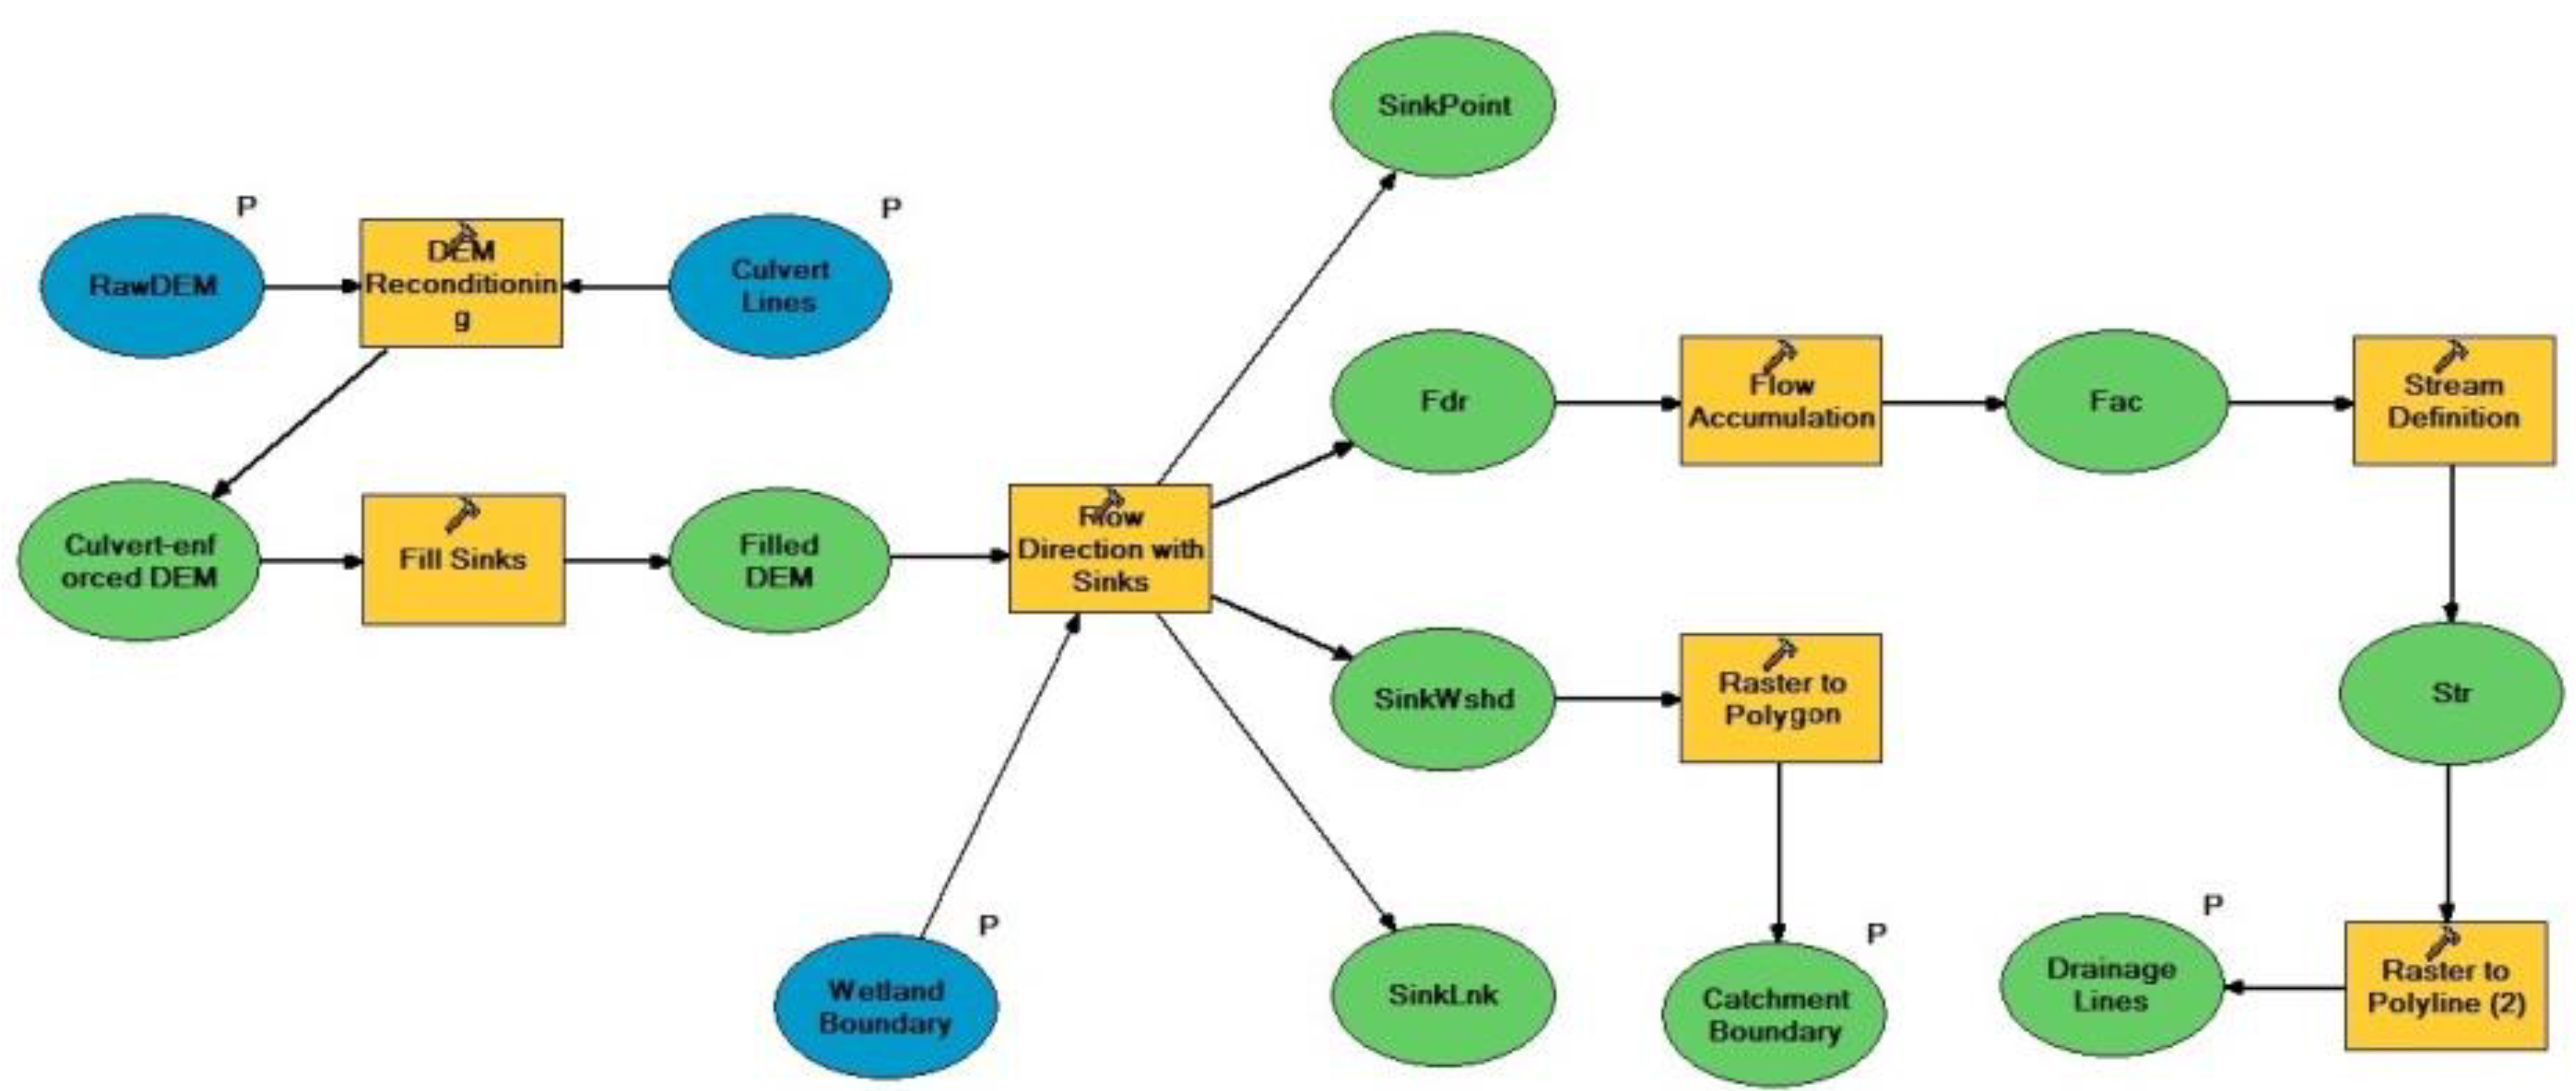
3.3. Data Processing and Modeling
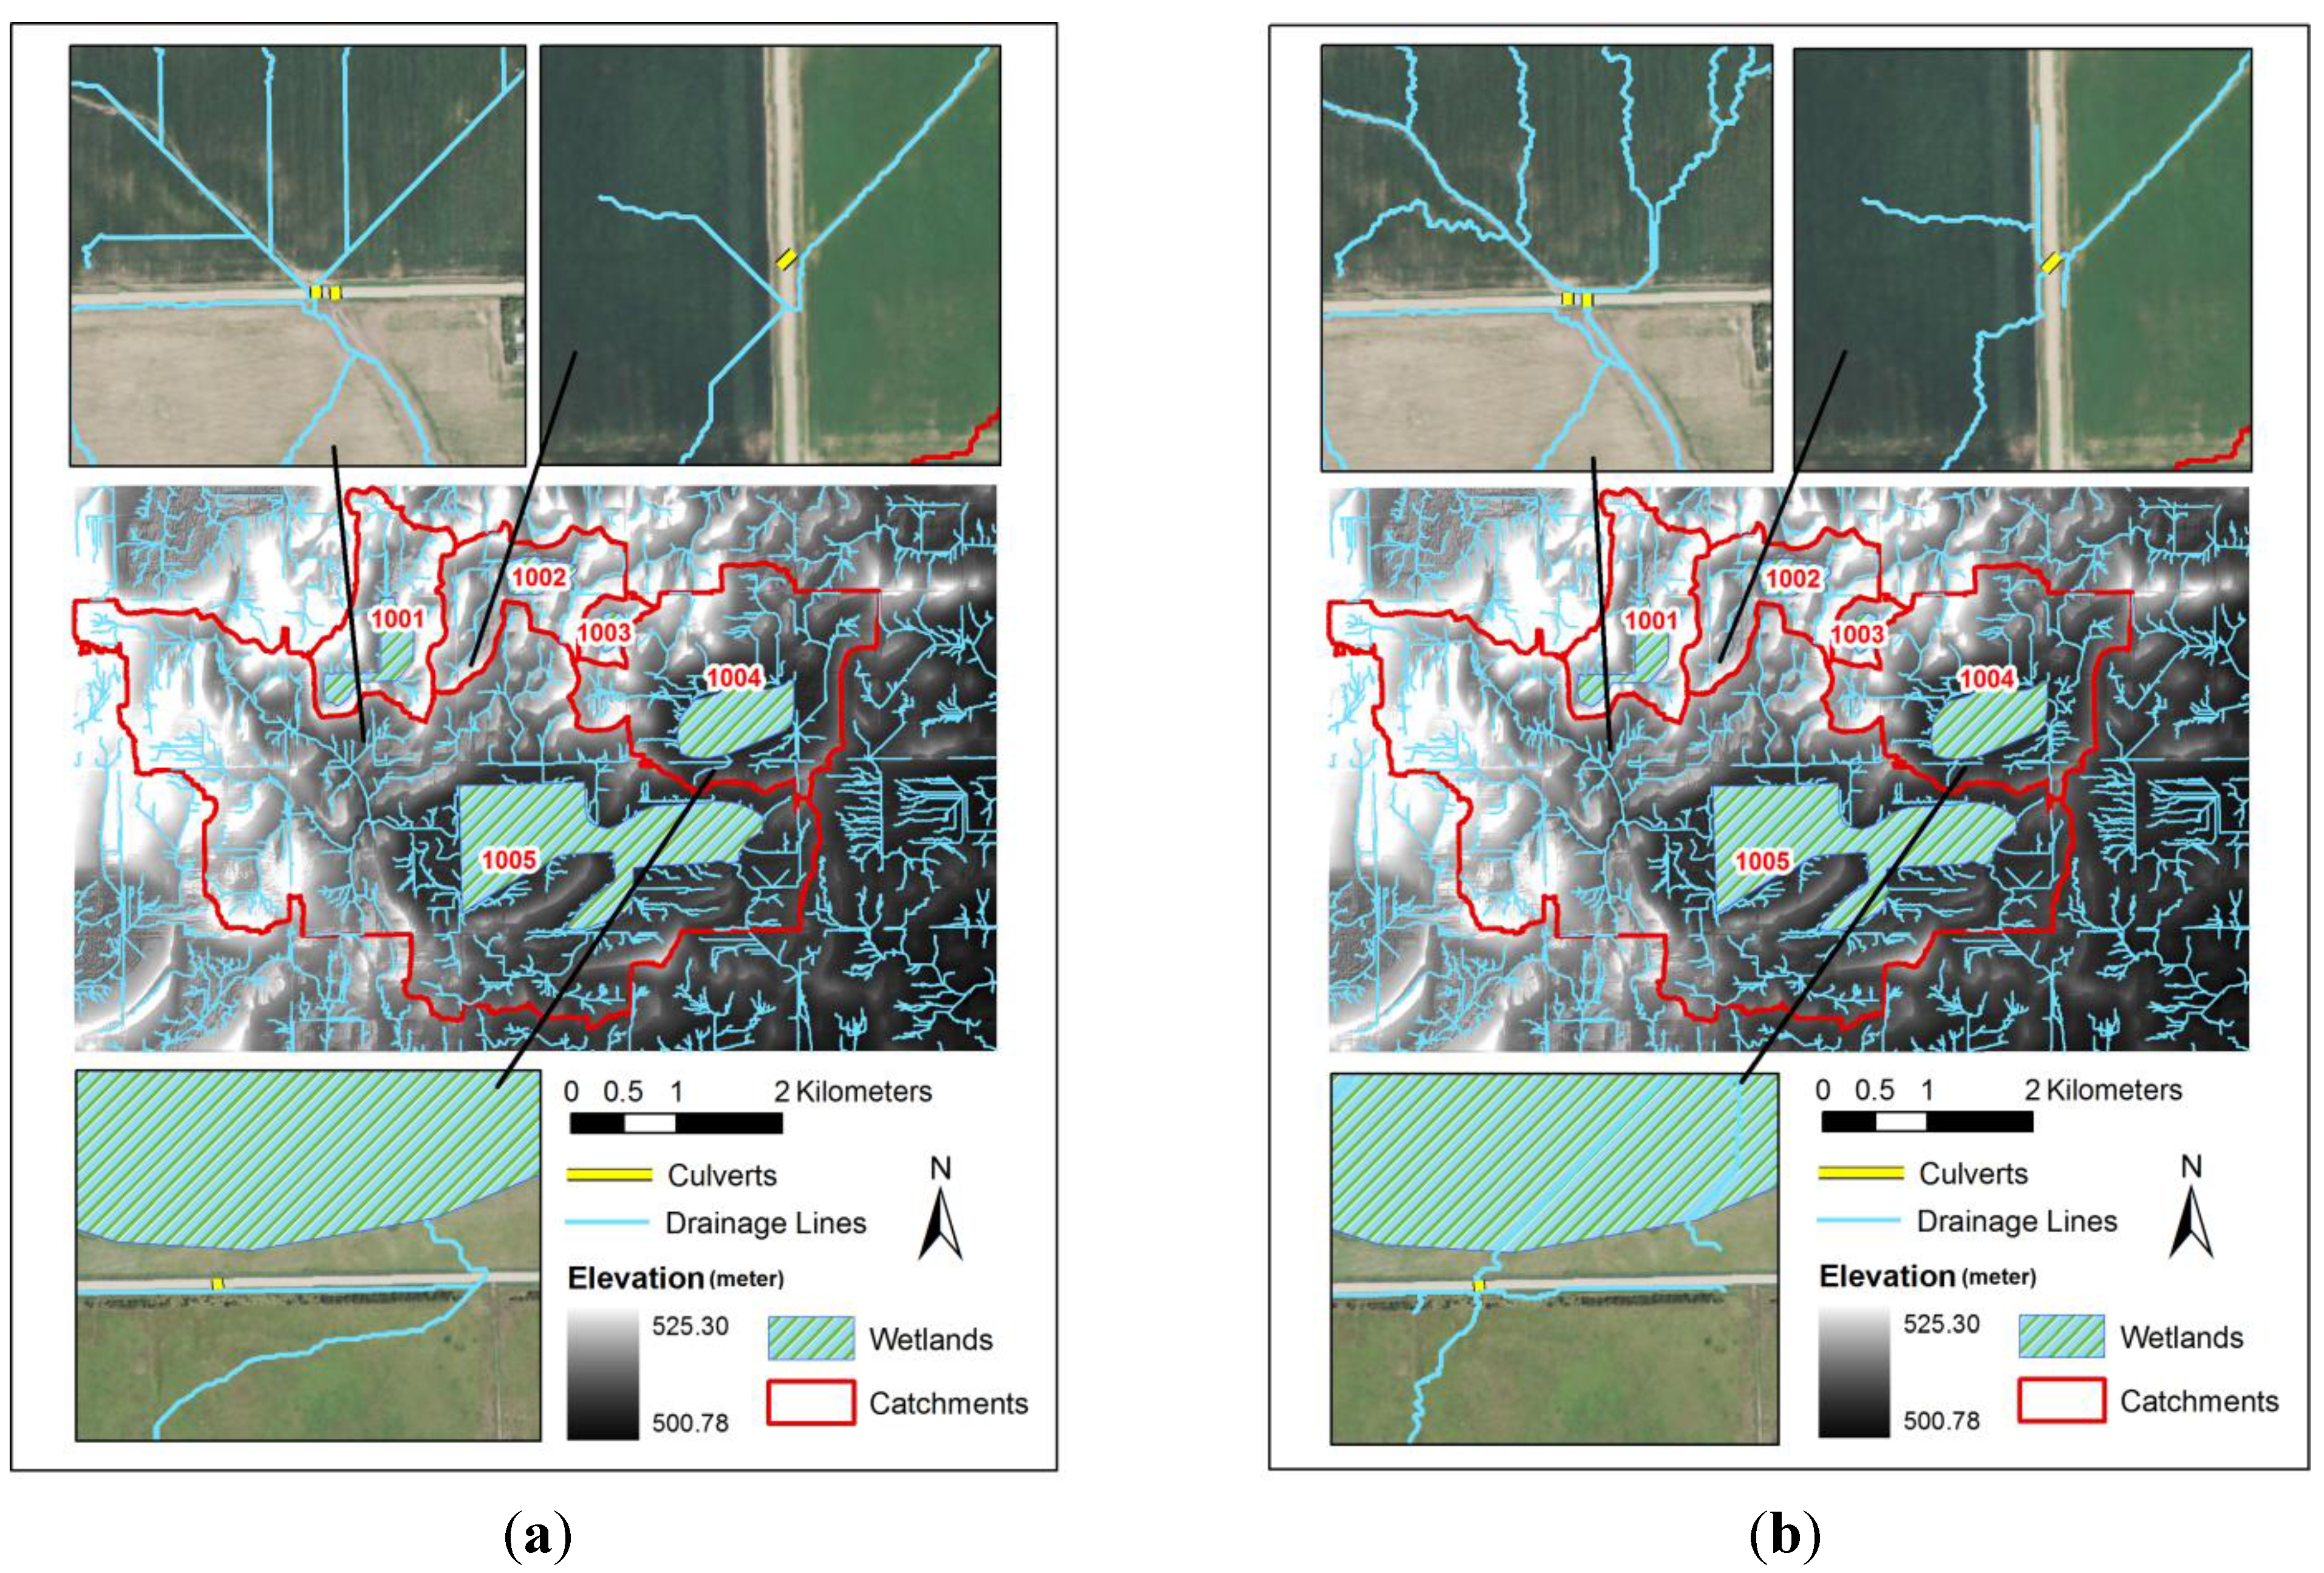
3.4. Results of the Case Study


| Wetland Catchment | Topographic DEM | Hydrologic DEM | Difference |
|---|---|---|---|
| 1,001 | 155 | 155 | 0% |
| 1,002 | 49,908 | 46,644 | −7% |
| 1,003 | 49,299 | 49,299 | 0% |
| 1,004 | 109,035 | 33,124 | −229% |
| 1,005 | 137,851 | 105,812 | −30% |
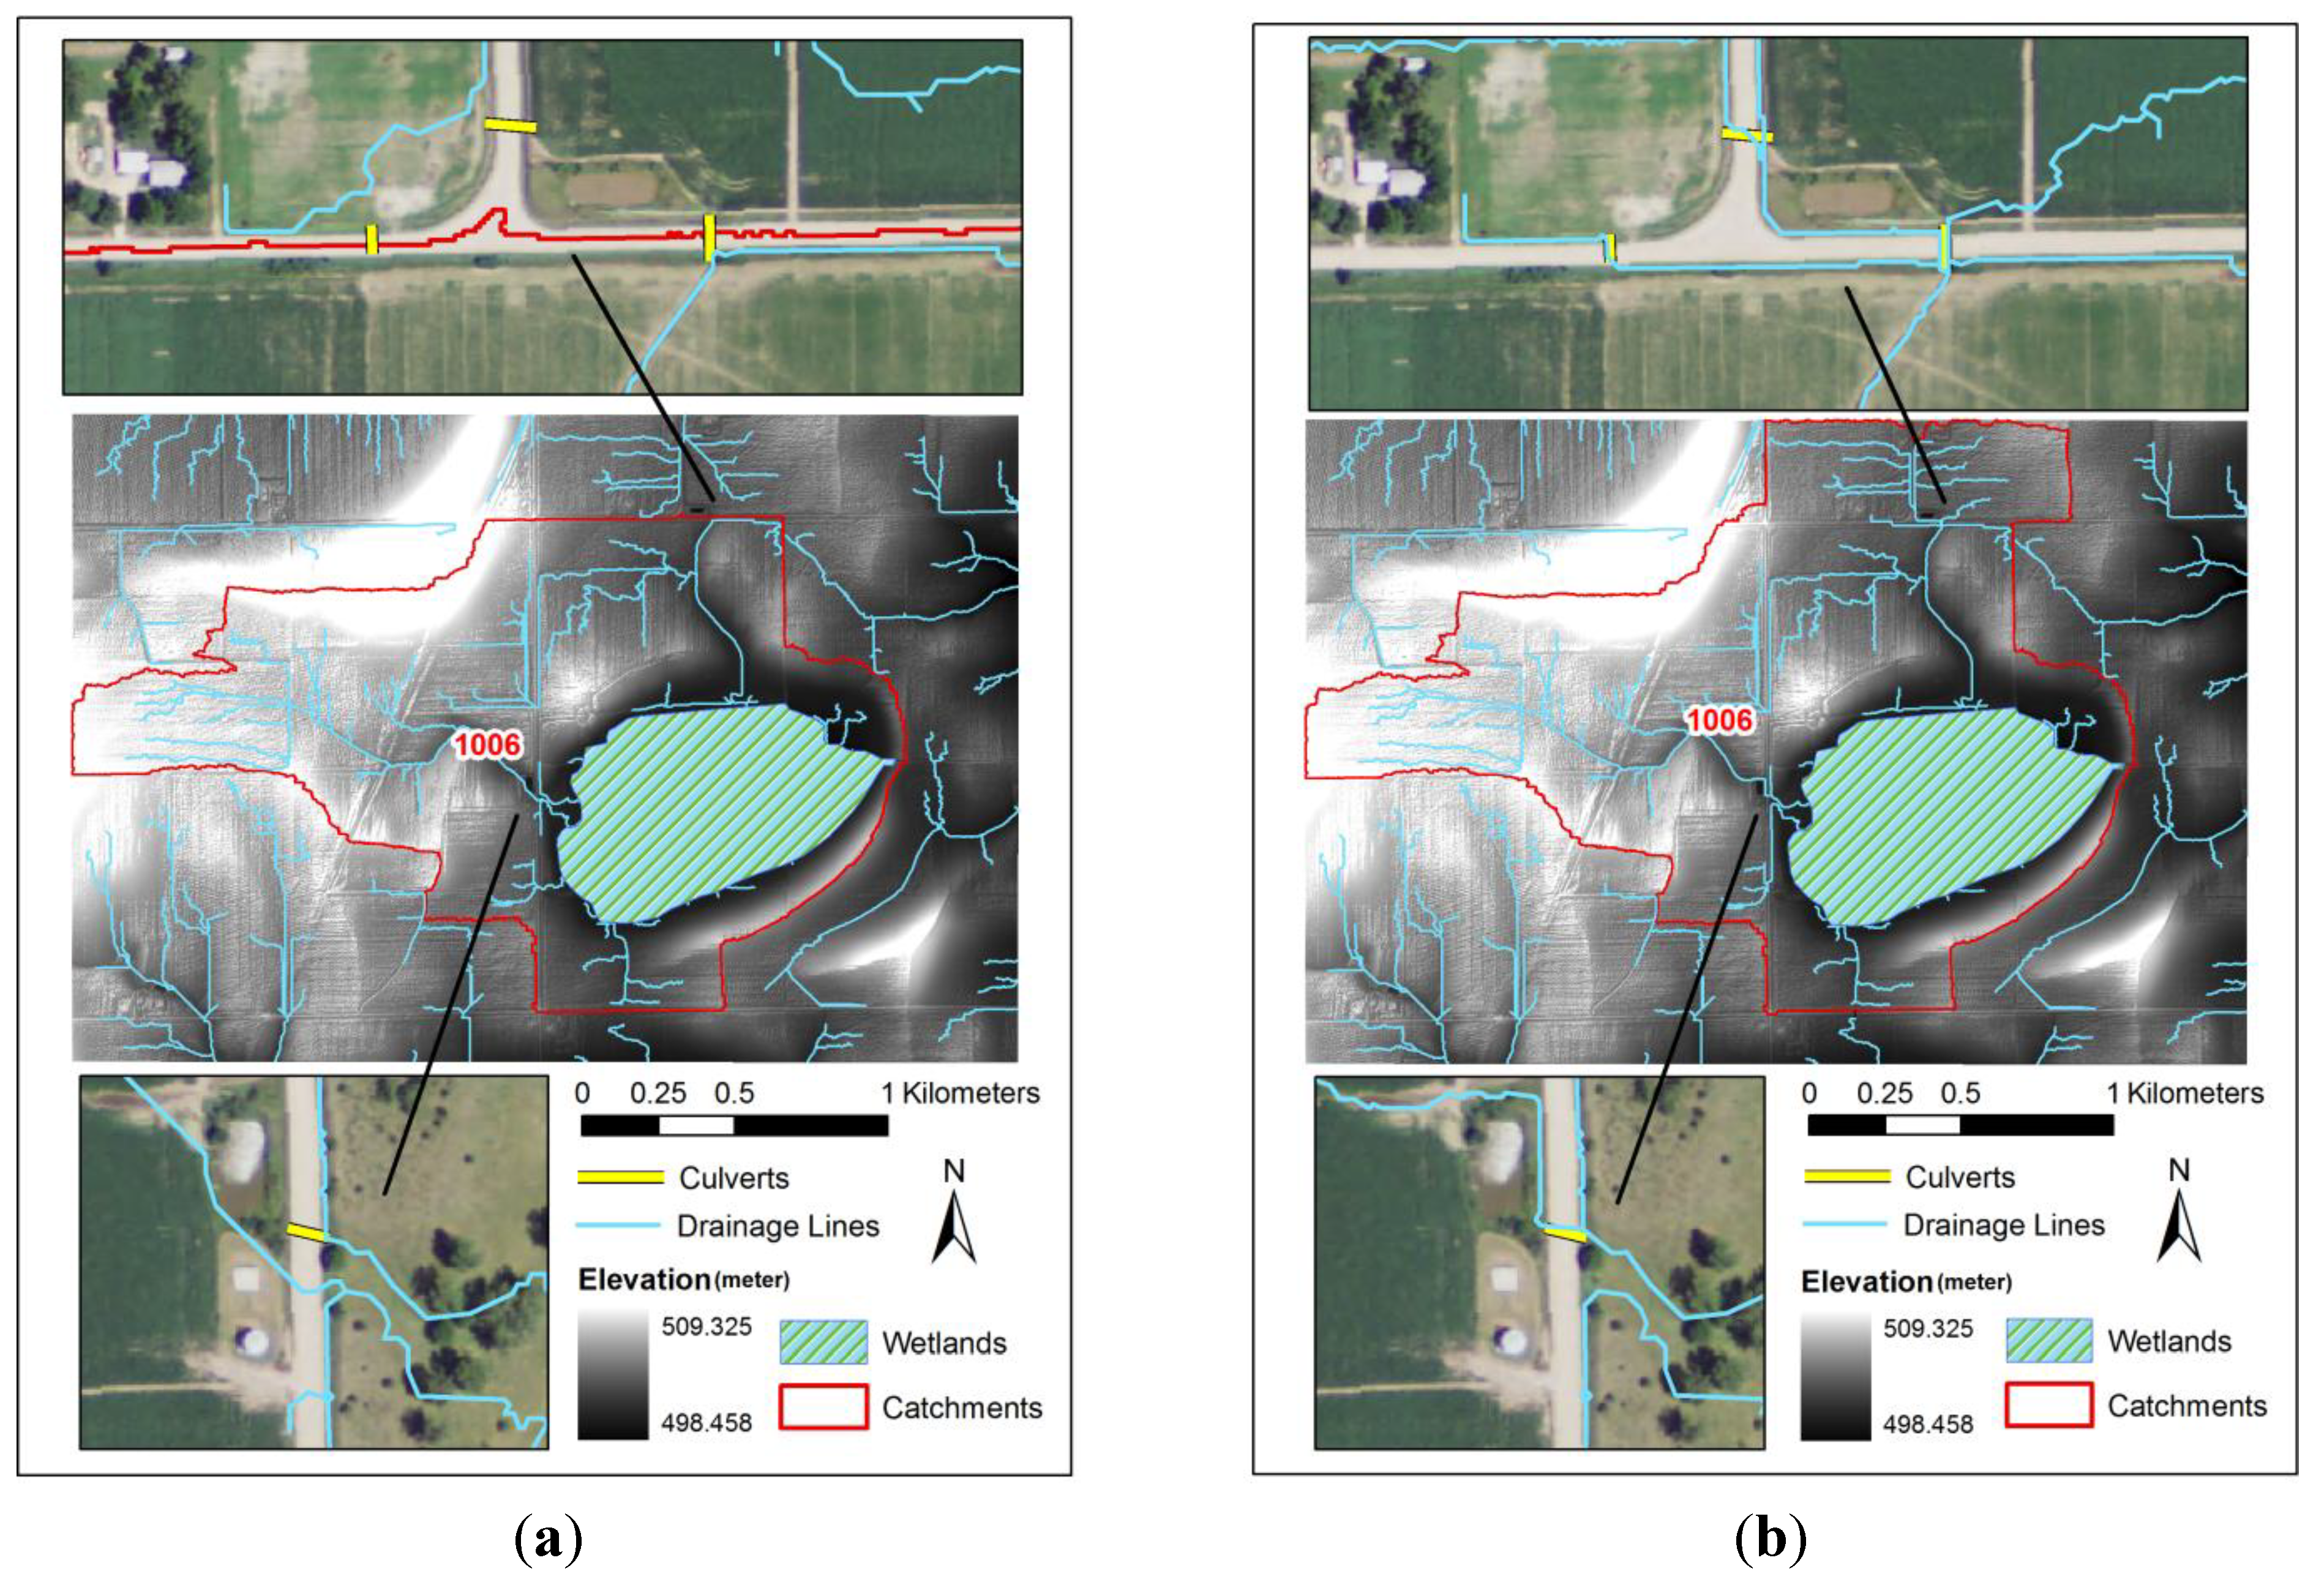
| 1,006 | 16,536 | 12,619 | −31% |
4. Discussions
4.1. The Impacts of Drainage Structures on Hydrologic Modeling
4.2. Potential Ways for Producing LiDAR-Derived Hydrologic DEMs
4.3. Future Perspectives on National or Statewide Drainage Structure Dataset
| Name | Alias | Data Type | Description |
|---|---|---|---|
| ID | Feature ID | Text | Unique ID of the surveyed point |
| Str_ID | Structure ID | Text | Unique ID for each drainage structure |
| Lat | Latitude | Number | Latitude of the surveyed point (Datum: NAD 83) |
| Long | Longitude | Number | Longitude of the surveyed point (Datum: NAD 83) |
| Str_shp | Structure Shape | Text | The shape of a culvert (e.g., round) |
| Str_typ | Structure Type | Text | The type of the drainage structure (e.g., road or bridge) |
| Material | Construction Materials | Text | The material to build the drainage structure |
| Diameter | Structure Diameter | Number | The diameter of a culvert opening or the span of a bridge |
| Depth | Depth to Bottom | Number | Depth of the bottom a culvert opening or the span of a bridge |
| Date | Survey Date | Date | Date of this survey |
| Blocked | Blocked or Not | Number | Different Integer numbers indicate different levels of blockage |
| Comment | Comments | Text | Other comments |
| Hyperlnk | Hyperlink | Text | Links to photos and engineering drawings |
5. Conclusions
Acknowledgments
Conflicts of Interest
References
- Zhang, W.; Montgomery, D.R. Digital elevation model grid size, landscape representation, and hydrologic simulations. Water Resour. Res. 1994, 30, 1019–1028. [Google Scholar] [CrossRef]
- Maidment, D. Arc Hydro : GIS for Water Resources; ESRI Press: Redlands, CA, USA, 2002. [Google Scholar]
- Wechsler, S.P. Uncertainties associated with digital elevation models for hydrologic applications: A review. Hydrol. Earth Syst. Sci. 2007, 11, 1481–1500. [Google Scholar] [CrossRef]
- Kenward, T. Effects of digital elevation model accuracy on hydrologic predictions. Remote Sens. Environ. 2000, 74, 432–444. [Google Scholar] [CrossRef]
- Gesch, D.B. The National Elevation Dataset. In Digital Elevation Model Technologies and Applications: The DEM Users Manual, 2nd ed.; Maune, D., Ed.; American Society for Photogrammetry and Remote Sensing: Bethesda, MD, USA, 2007; pp. 99–118. [Google Scholar]
- Omer, C.R.; Nelson, E.J.; Zundel, A.K. Impact of varied data resolution on hydraulic modeling and floodplain delineation. J. Am. Water Resour. Assoc. 2003, 39, 467–475. [Google Scholar] [CrossRef]
- Barber, C.P.; Shortridge, A. Lidar elevation data for surface hydrologic modeling: Resolution and representation issues. Cartogr. Geogr. Inf. Sci. 2005, 32, 401–410. [Google Scholar] [CrossRef]
- Lane, C.R.; D’Amico, E. Calculating the ecosystem service of water storage in isolated wetlands using LiDAR in North Central Florida, USA. Wetlands 2010, 30, 967–977. [Google Scholar] [CrossRef]
- Jones, K.L.; Poole, G.C.; O’Daniel, S.J.; Mertes, L.A.K.; Stanford, J.A. Surface hydrology of low-relief landscapes: Assessing surface water flow impedance using LIDAR-derived digital elevation models. Remote Sens. Environ. 2008, 112, 4148–4158. [Google Scholar] [CrossRef]
- Lindsay, J.B. Sensitivity of channel mapping techniques to uncertainty in digital elevation data. Int. J. Geogr. Inf. Sci. 2006, 20, 669–692. [Google Scholar] [CrossRef]
- Murphy, P.N.C.; Ogilvie, J.; Meng, F.R.; Arp, P. Stream network modelling using LiDAR and photogrammetric digital elevation models: A comparison and field verification. Hydrol. Process. 2008, 22, 1747–1754. [Google Scholar] [CrossRef]
- Lang, M.; McDonough, O.; McCarty, G.; Oesterling, R.; Wilen, B. Enhanced detection of wetland-stream connectivity using LiDAR. Wetlands 2012, 32, 461–473. [Google Scholar] [CrossRef]
- Gala, T.S.; Melesse, A.M. Monitoring prairie wet area with an integrated LANDSAT ETM+, RADARSAT-1 SAR and ancillary data from LIDAR. CATENA 2012, 95, 12–23. [Google Scholar] [CrossRef]
- Petroselli, A. LIDAR data and hydrological applications at the basin scale. GIScience Remote Sens. 2012, 49, 139–162. [Google Scholar] [CrossRef]
- Poppenga, S.K.; Worstell, B.B.; Stoker, J.M.; Greenlee, S.K. Using Selective Drainage Methods to Extract Continuous Surface Flow from 1-Meter LiDAR-Derived Digital Elevation Data; US Geological Survey Scientific Investigations Report 2010–5059; US Geological Survey: Reston, VA, USA, 2010. [Google Scholar]
- Duke, G.D.; Kienzle, S.W.; Johnson, D.L.; Byrne, J.M. Incorporating ancillary data to refine anthropogenically modified overland flow paths. Hydrol. Process. 2006, 20, 1827–1843. [Google Scholar] [CrossRef]
- Cook, A.; Merwade, V. Effect of topographic data, geometric configuration and modeling approach on flood inundation mapping. J. Hydrol. 2009, 377, 131–142. [Google Scholar] [CrossRef]
- Huang, S.; Young, C.; Feng, M.; Heidemann, K.; Cushing, M.; Mushet, D.M.; Liu, S. Demonstration of a conceptual model for using LiDAR to improve the estimation of floodwater mitigation potential of Prairie Pothole Region wetlands. J. Hydrol. 2011, 405, 417–426. [Google Scholar] [CrossRef]
- Shaw, D.A.; Vanderkamp, G.; Conly, F.M.; Pietroniro, A.; Martz, L. The fill-spill hydrology of prairie wetland complexes during drought and deluge. Hydrol. Process. 2012, 26, 3147–3156. [Google Scholar] [CrossRef]
- Hellweger, R. AGREE—DEM Surface Reconditioning System. Available online: http://www.ce.utexas.edu/prof/maidment/gishydro/ferdi/research/agree/agree.html (accessed 20 July 2013).
- Amoah, J.K.O.; Amatya, D.M.; Nnaji, S. Quantifying watershed surface depression storage: Determination and application in a hydrologic model. Hydrol. Process. 2013, 27, 2401–2413. [Google Scholar] [CrossRef]
- Tang, Z.; Li, R.; Li, X.; Jiang, W.; Hirsh, A. Capturing LiDAR-derived hydrologic spatial parameters to evaluate playa wetlands. J. Am. Water Resour. Assoc. 2013. [Google Scholar] [CrossRef]
- Jenson, S.K.; Domingue, J.O. Extracting topographic structure from digital elevation data for geographical information system analysis. Photogramm. Eng. Remote Sens. 1988, 54, 1593–1600. [Google Scholar]
- Stutheit, R.G.; Gilbert, M.C.; Whited, P.W.; Lawrence, K.L. A Regional Guidebook for Applying the Hydrogeomorphic Approach to Assessing Wetland Functions of Rainwater Basin Depressional Wetlands in Nebraska; Report No. ERDC/EL TR-04-4; US Army Crops of Engineers: Washington, DC, USA, 2004. [Google Scholar]
- LaGrange, T. Guide to Nebraska’s Wetlands and Their Conservation Needs; Nebraska Game and Parks Commission: Lincoln, NE, USA, 1997. [Google Scholar]
- Pezzolesi, T.P.; Zartman, R.E.; Fish, E.B.; Hickey, M.G. Nutrients in a playa wetland receiving wastewater. J. Environ. Qual. 1998. [Google Scholar] [CrossRef]
- Brennan, E.K. Local and Landscape Level Variables Influencing Migratory Bird Abundance, Diversity, Behavior and Community Structure in Rainwater Basin Wetlands. Ph.D. Thesis, Texas Tech University, Lubbock, TX, USA, 2006. [Google Scholar]
- Nebraska Department of Natural Resources. South Central Nebraska—LIDAR 2013. Available online: http://dnr.ne.gov/floodplain/lidar.html (accessed on 12 June 2013).
- US Fish and Wildlife Service. Download Seamless Wetlands Data 2013. Available online: http://www.fws.gov/wetlands/Data/Data-Download.html (accessed on 20 May 2013).
- Tang, Z.; Li., X.; Zhao, N.; Li, R.; Harvey, F.E. Developing a restorable wetland index for the rainwater basin wetlands in South-Central Nebraska: A multi-criteria spatial analysis. Wetlands. 2012, 32, 975–984. [Google Scholar] [CrossRef]
- Duke, G.D.; Kienzle, S.W.; Johnson, D.L.; Byrne, J.M. Improving overland flow routing by incorporating ancillary road data into digital elevation models. J. Spat. Hydrol. 2003, 3, 1–27. [Google Scholar]
- Schiess, P.; Krogstd, F.; Damian, F. Locating Ditch Relief Culverts to Reduce Sediment Delivery to Streams—An Interactive Design Tool. In Proceedings of the 12th International Mountain Logging Conference, Vancouver, BC, Canada, 13–16 June 2004.
- LiDAR Research and Education Subcommittee of the Minnesota Digital Elevation Committee. Interim Guidance on Acquisition of Culvert Geospatial Data 2011. Interim Guidance on Acquisition of Culvert Geospatial Data. Available online: http://www.mngeo.state.mn.us/committee/elevation/research_education/Interim_Guidance_Culvert_Data.pdf (accessed on 20 July 2013).
- Federal Geographic Data Committee. ISO Geospatial Metadata Standards: Status and Relations 2013. Available online: http://www.fgdc.gov/metadata/events/ISO_Implementation_Webinar/pdf/FedISOMetaWebinar_ISOStandardsRelations_Wayne_20130423.pdf (accessed on 20 July 2013).
- Stoker, J.; Harding, D.; Parrish, J. The need for a National Lidar Dataset. Photogramm. Eng. Remote Sens. 2008, 74, 1066–1068. [Google Scholar]
© 2013 by the authors; licensee MDPI, Basel, Switzerland. This article is an open access article distributed under the terms and conditions of the Creative Commons Attribution license (http://creativecommons.org/licenses/by/3.0/).
Share and Cite
Li, R.; Tang, Z.; Li, X.; Winter, J. Drainage Structure Datasets and Effects on LiDAR-Derived Surface Flow Modeling. ISPRS Int. J. Geo-Inf. 2013, 2, 1136-1152. https://doi.org/10.3390/ijgi2041136
Li R, Tang Z, Li X, Winter J. Drainage Structure Datasets and Effects on LiDAR-Derived Surface Flow Modeling. ISPRS International Journal of Geo-Information. 2013; 2(4):1136-1152. https://doi.org/10.3390/ijgi2041136
Chicago/Turabian StyleLi, Ruopu, Zhenghong Tang, Xu Li, and Jessie Winter. 2013. "Drainage Structure Datasets and Effects on LiDAR-Derived Surface Flow Modeling" ISPRS International Journal of Geo-Information 2, no. 4: 1136-1152. https://doi.org/10.3390/ijgi2041136
APA StyleLi, R., Tang, Z., Li, X., & Winter, J. (2013). Drainage Structure Datasets and Effects on LiDAR-Derived Surface Flow Modeling. ISPRS International Journal of Geo-Information, 2(4), 1136-1152. https://doi.org/10.3390/ijgi2041136