User Experience Design in Professional Map-Based Geo-Portals

Abstract
:1. Introduction
- How do previous geo-portal definitions differ, and which aspects does a holistic definition have to comprise?
- What are essential user requirements for professional map-based geo-portals?
- Which user experience design guidelines need to be followed to comply with these requirements?
2. Related Work
3. Methodological Background
3.1. Geo-Portal Definition
3.2. User Experience vs. Usability
3.2.1. Usability
3.2.2. User Experience
3.2.3. Conclusion User Experience vs. Usability in Map-Based Geo-Portals
3.3. Design Dimensions for Map-Based Geo-Portals
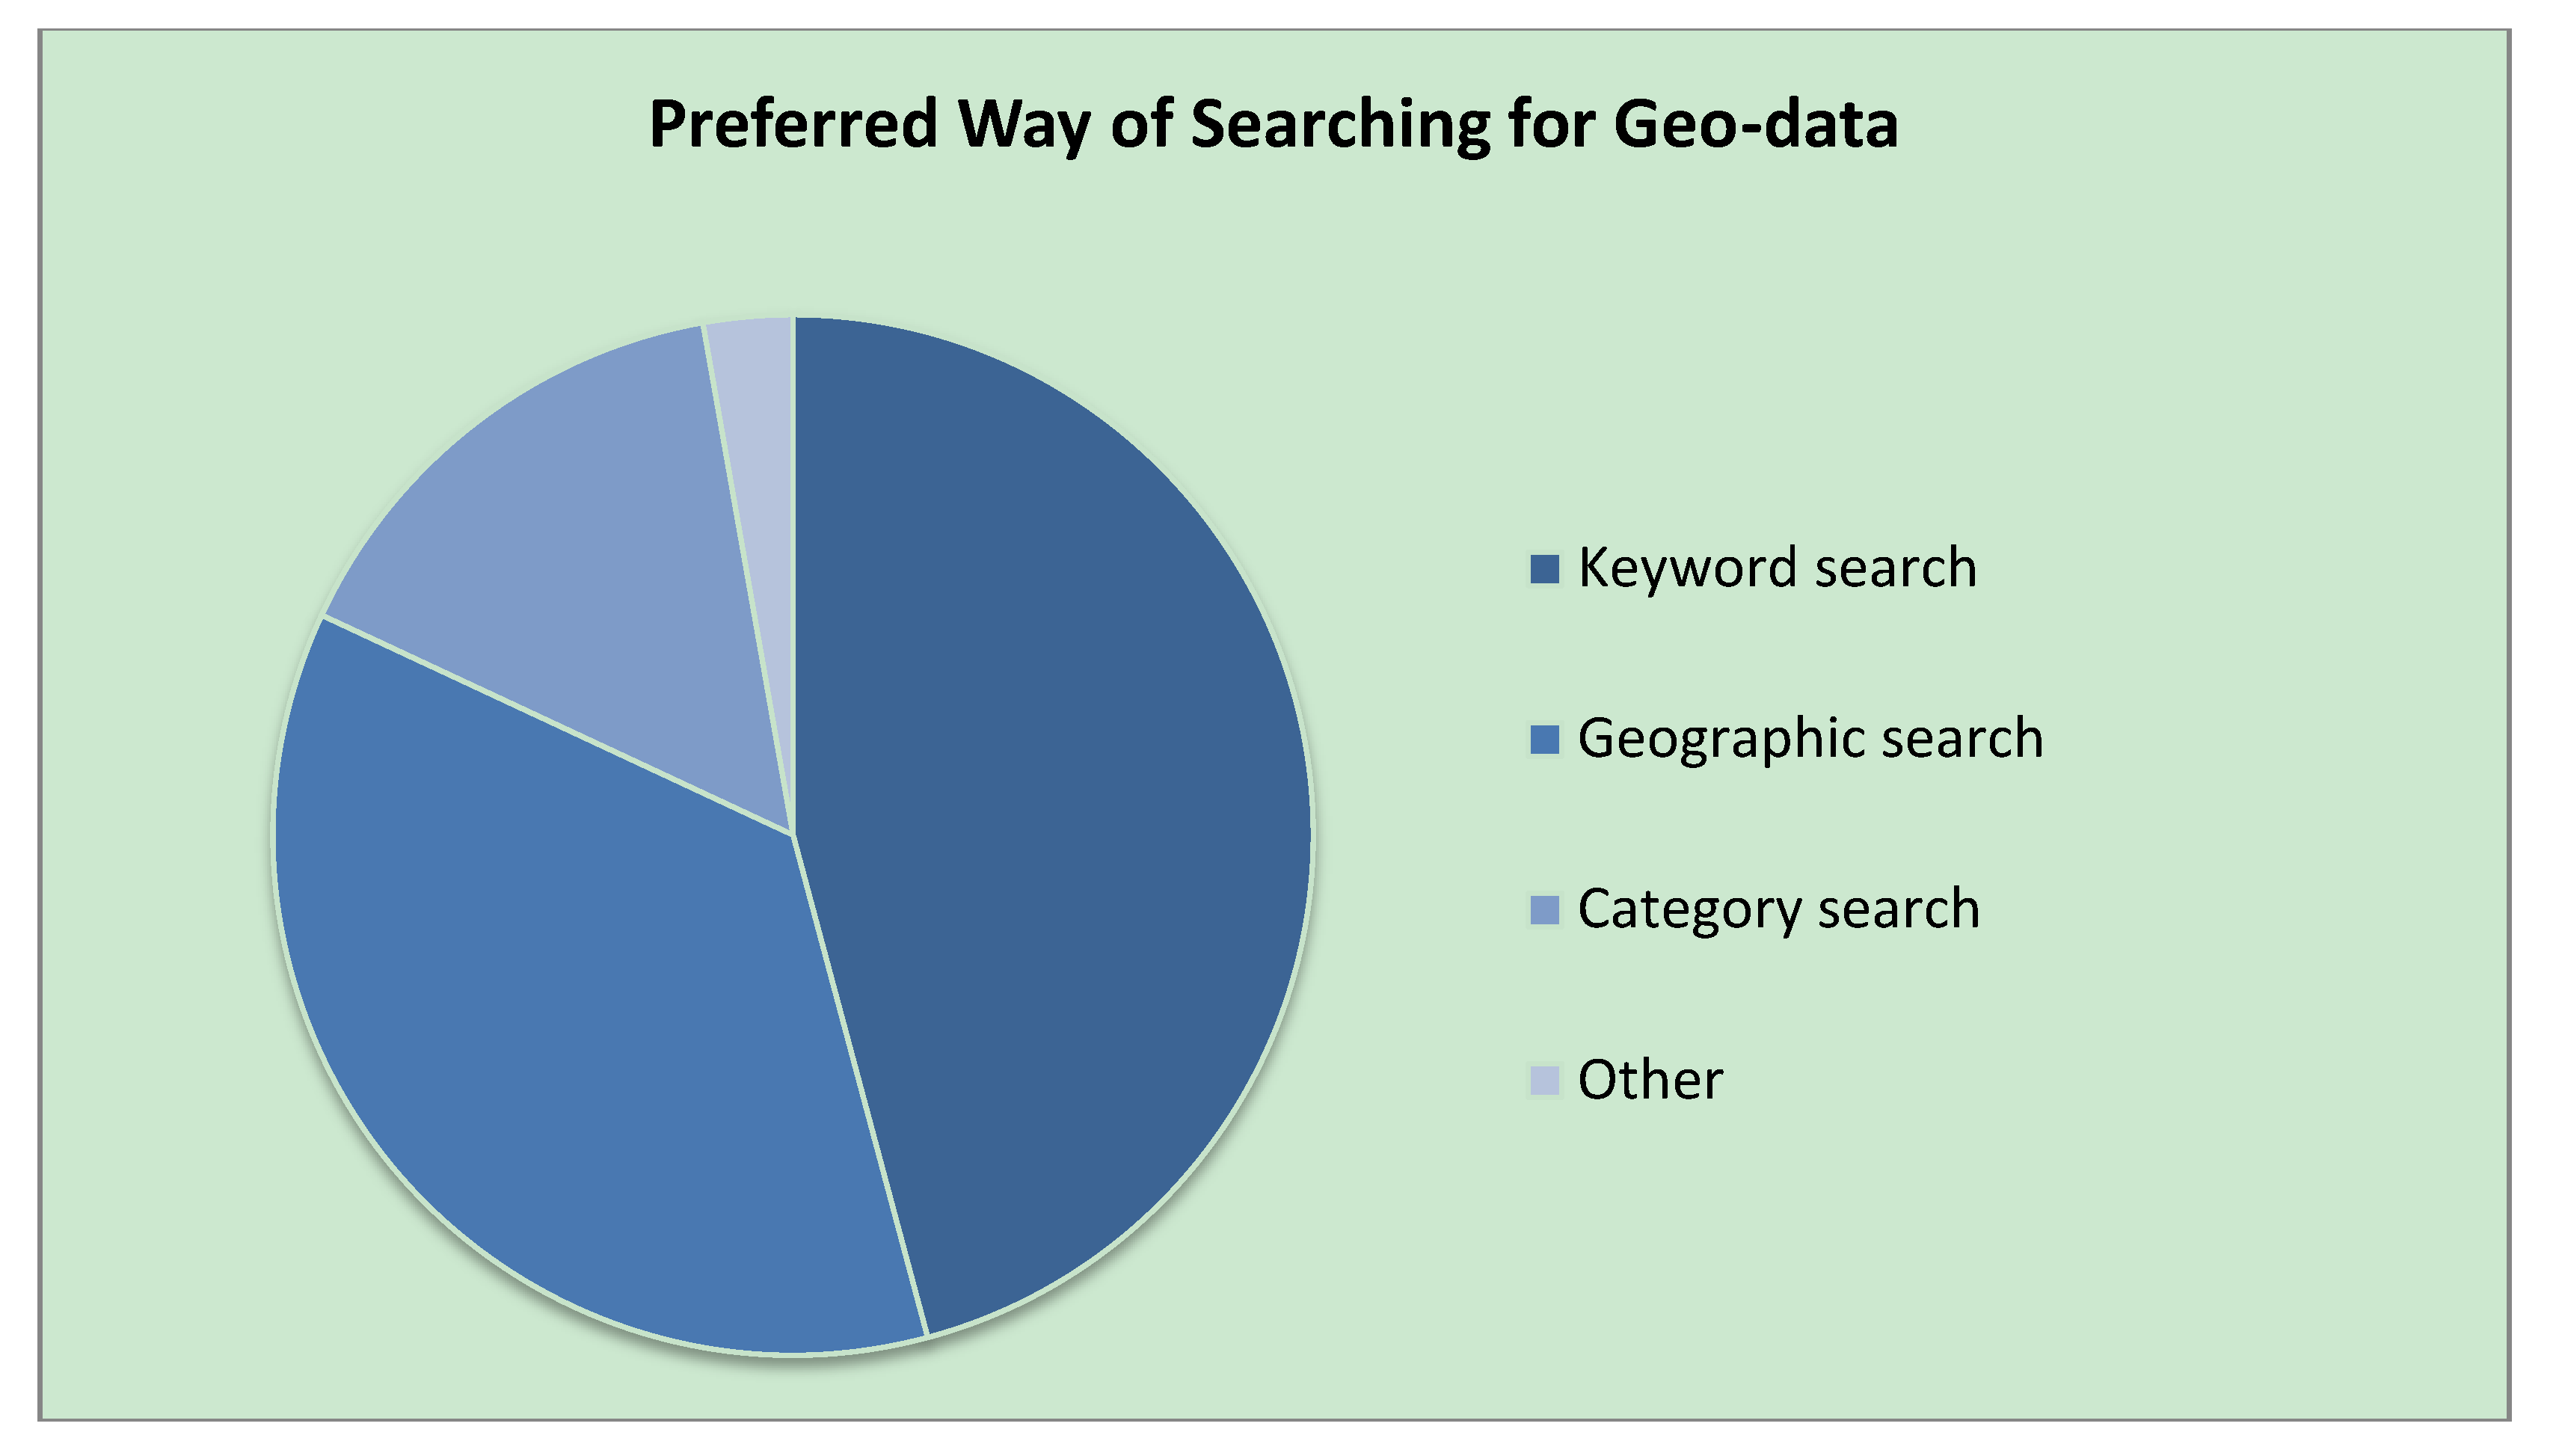
- Free-text search using a text box.
- Spatial search over a geographical area.
- Category-based search.
4. Empirical User Study
4.1. Participants
4.2. User Study
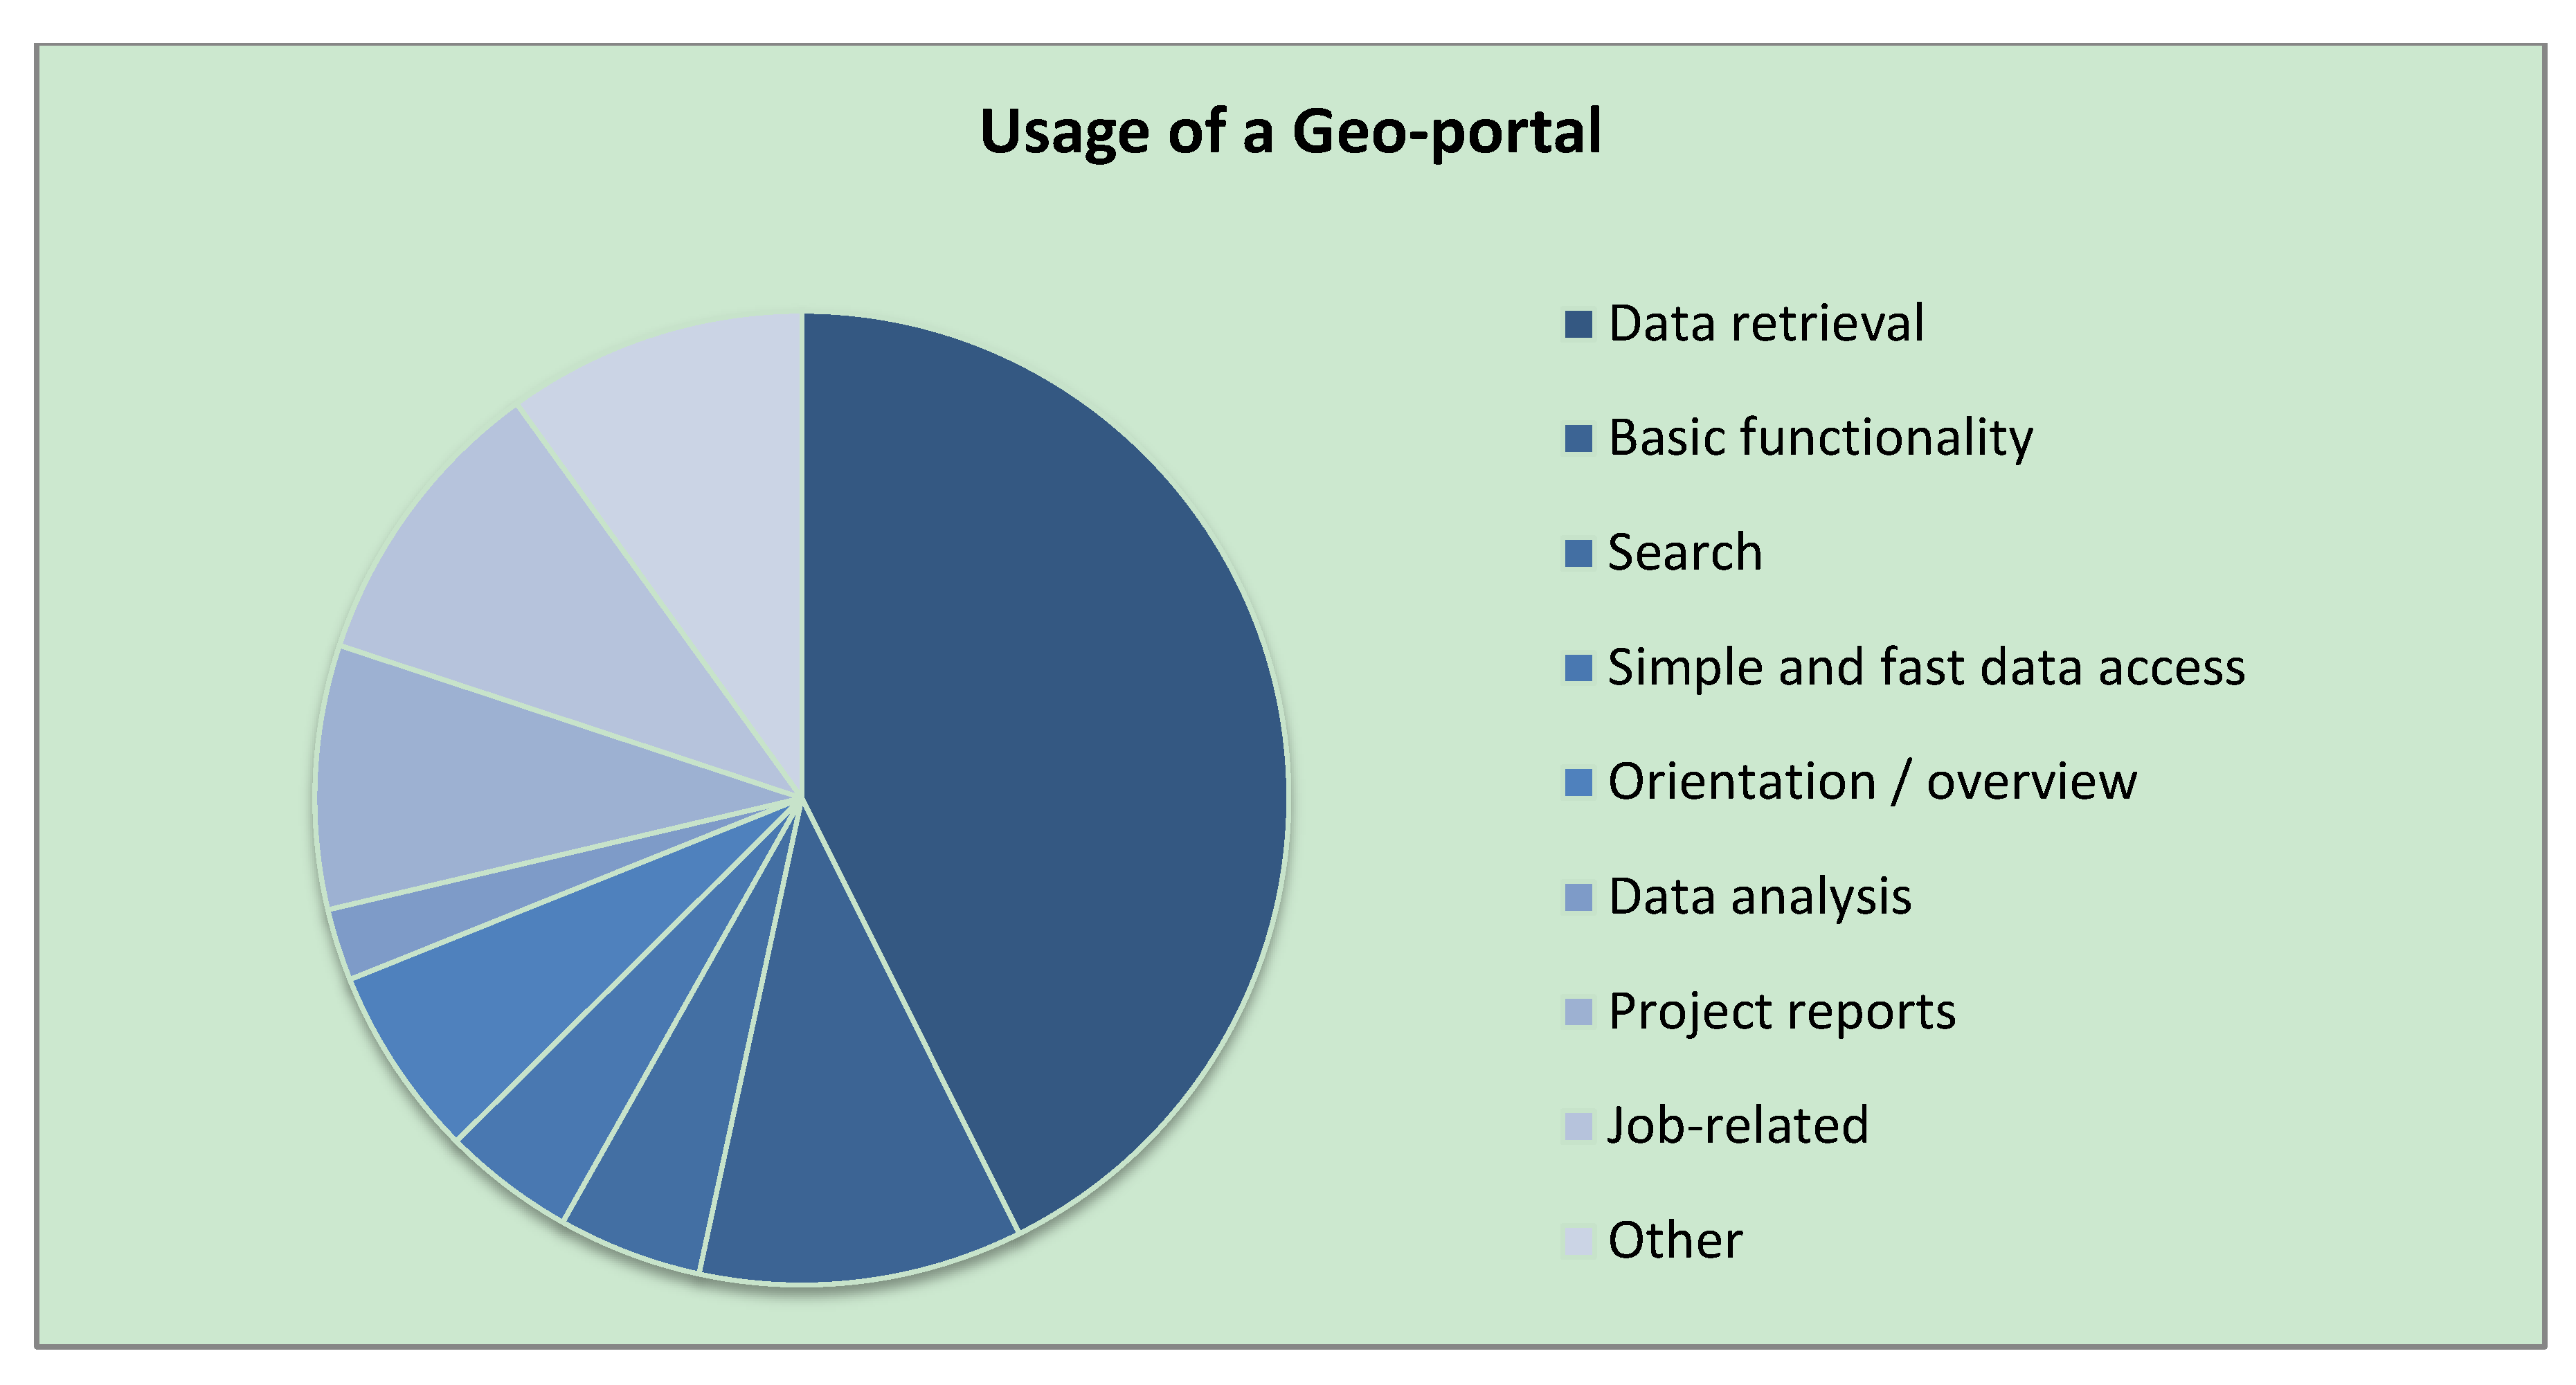
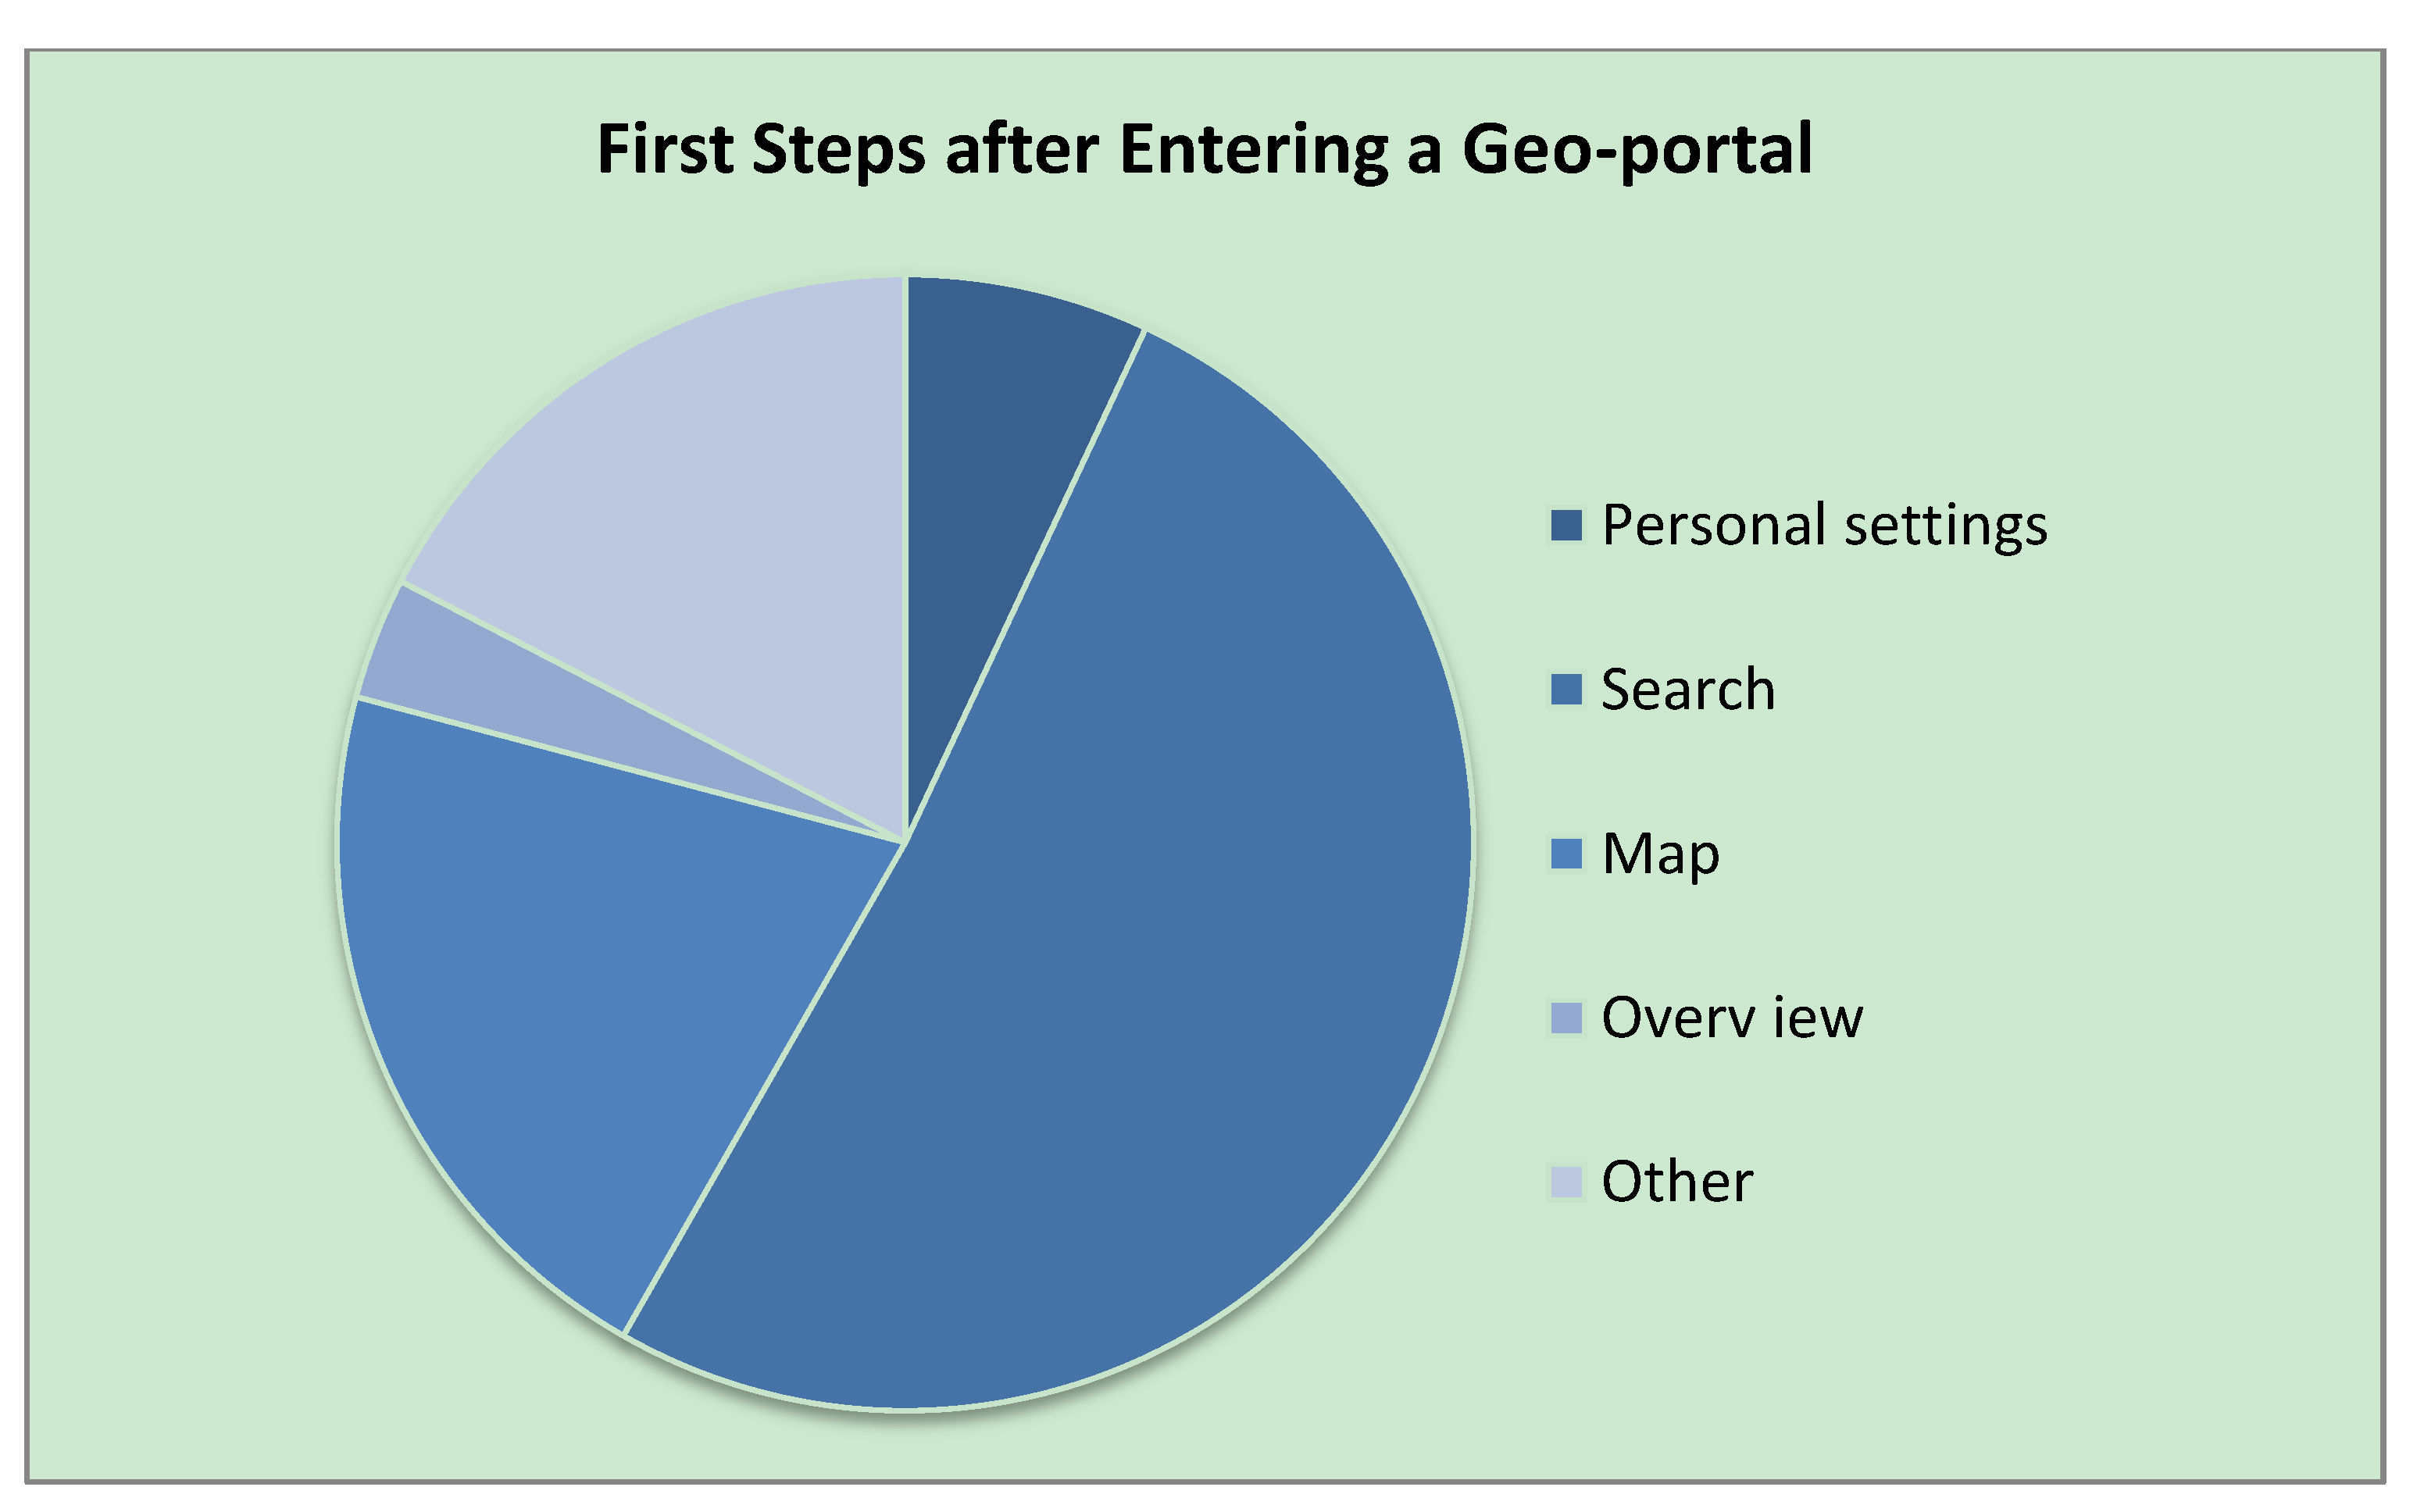
4.2.1. General
4.2.2. Map
4.2.3. Search
4.2.4. Symbologies and Tools
4.2.5. Personal
5. Results: Design Guidelines and User Experience Criteria for Map-Based Geo-Portals
5.1. Result: User Experience for Map-Based Geo-Portals
5.2. Result: Design Considerations
5.2.1. Map
5.2.2. Search
5.2.3. Search Results
5.2.4. Symbols
- The symbol should be clear and accurate.
- The symbol should be easily and correctly interpretable without additional assistance.
- The symbol should give visual feedback if it is currently in use.
5.2.5. Other
- The working environment is restricted.
- Additional windows have to be manually closed by the user.
- Returning to the original page is impeded.
- The current window is obscured.
- They can be used in exceptional cases (e.g., for displaying PDF documents).
6. Conclusion
Acknowledgments
Conflicts of Interest
References
- European Parliament and the Council, Directive 2007/2/EC of the European Parliament and of the Council of 14 March 2007 Establishing an Infrastructure for Spatial Information in the European Community (INSPIRE). Available online: http://inspire.jrc.ec.europa.eu (accessed on 15 October 2012).
- Tait, M.G. Implementing geoportals: Applications of distributed GIS. Comput. Environ. Urban Syst. 2005, 29, 33–47. [Google Scholar]
- Aditya, T.; Kraak, M.J. Reengineering the Geoportal: Applying HCI and Geovisualization Disciplines. In Proceedings of the 11th EC-GI & GIS Workshop, Alghero, Italy, 29 June–1 July 2005.
- Watanabe, M.; Yonemura, S.; Asano, Y. Investigation of Web Usability Based on the Dialogue Principles. In Human Centered Design; Kurosu, M., Ed.; Springer Berlin-Heidelberg: Berlin, Germany, 2009; pp. 825–832. [Google Scholar]
- Nivala, A.M.; Brewster, S.; Sarjakoski, L.T. Usability evaluation of web mapping sites. Cartogr. J. 2008, 45, 129–138. [Google Scholar] [CrossRef]
- Skarlatidou, A.; Haklay, M. Public Web Mapping: Preliminary Usability Evaluation. In Proceedings of GIS Research UK Conference, Nottingham, UK, 5–7 April 2006.
- Hornbaek, K.; Bederson, B.B.; Plaisant, C. Navigation patterns and usability of zoomable user interfaces with and without an overview. ACM Trans. Comput. Hum. Interact. 2002, 9, 362–389. [Google Scholar] [CrossRef]
- Harrower, M.; Sheesley, B. Designing better map interfaces: A framework for panning and zooming. Trans. GIS 2005, 9, 77–89. [Google Scholar] [CrossRef]
- You, M.; Chen, C.W.; Liu, H.; Lin, H. A usability evaluation of web map zoom and pan functions. Int. J. Des. 2007, 1, 15–25. [Google Scholar]
- Kramers, R.E. Interaction with maps on the internet—A user centered design approach for the atlas of Canada. Cartogr. J. 2008, 45, 98–107. [Google Scholar] [CrossRef]
- He, X.; Persson, H.; Östman, A. Geoportal usability evaluation. Int. J. Spat. Data Infrastruct. Res. 2012, 7, 88–106. [Google Scholar]
- Danko, D.M. Geospatial Metadata. In Springer Handbook of Geographic Information; Kresse, W., Danko, D.M., Eds.; Springer Berlin-Heidelberg: Berlin, Germany, 2012; pp. 359–392. [Google Scholar]
- Nielsen, J. Usability Engineering; Academic Press: Boston MA, USA, 1993. [Google Scholar]
- Part 11 Guidance on Usability. In ISO 9241 Ergonomics of Human-System Interaction; International Organization for Standardization: Geneva, Switzerland, 2006.
- Adikari, S.; McDonald, C.; Campbell, J. A Design Science Framework for Designing and Assessing User Experience. In Human-Computer Interaction; Jacko, J.A., Ed.; Springer Berlin-Heidelberg: Berlin, Germany, 2011; pp. 25–34. [Google Scholar]
- Part 210 Human-centered Design for Interactive Systems. In ISO 9241 Ergonomics of Human-System Interaction; International Organization for Standardization: Geneva, Switzerland, 2010.
- Geis, T. Usability und User Experience Unterscheiden. 2012. Available online: http://blog.procontext.com/2010/03/usability-und-user-experienceunterscheiden.html (accessed on 19 July 2013).
- Resch, B.; Zipf, A.; Breuss-Schneeweis, P.; Beinat, E.; Boher, M. Towards the live city—Paving the way to real-time urbanism. Int. J. Adv. Int. Sys. 2012, 5, 470–482. [Google Scholar]
- Resch, B.; Hillen, F.; Reimer, A.; Spitzer, W. Towards 4D cartography—Four-dimensional dynamic maps for understanding spatio-temporal correlations in lightning events. Cartogr. J. 2013, 3, 266–275. [Google Scholar]
- Çöltekin, A.; Heil, B.; Garlandini, S.; Fabrikant, S.I. Evaluating the effectiveness of interactive map interface designs: A case study integrating usability metrics with eye-movement analysis. Cartogr. Geogr. Inf. Sci. 2009, 36, 5–17. [Google Scholar] [CrossRef]
- Haklay, M.; Tobon, C. Usability evaluation and PPGIS: Towards a usercentered design approach. Int. J. Geogr. Inf. Sci. 2003, 17, 577–592. [Google Scholar] [CrossRef]
- Haklay, M.; Zafiri, A. Usability engineering for GIS: Learning from a screenshot. Cartogr. J. 2008, 45, 87–97. [Google Scholar] [CrossRef]
- Sagl, G.; Resch, B.; Mittlboeck, M.; Hochwimmer, B.; Lippautz, M.; Roth, C. Standardised geo-sensor webs and web-based geo-processing for near real-time situational awareness in emergency management. Int. J. Bus. Cont. Risk Man. 2013, 4, 339–358. [Google Scholar]
- Nielsen, J.; Loranger, H. Web Usability; Addison-Wesley: Munich, Germany, 2006. [Google Scholar]
- Fernández-Wyttenbach, A.; Moya-Honduvilla, J.; Álvarez, M.; Bernabé-Poveda, M. First Approaches to the Usability of Digital Map Libraries. In Proceedings of the 3rd International Workshop in Digital Approaches to Cartographic Heritage, Barcelona, Spain, 26–27 June 2008.
- Resch, B.; Blaschke, T.; Mittlboeck, M. Live geography: Interoperable geo-sensor webs facilitating the vision of digital earth. Int. J. Adv. Net. Serv. 2010, 3, 323–332. [Google Scholar]
© 2013 by the authors; licensee MDPI, Basel, Switzerland. This article is an open access article distributed under the terms and conditions of the Creative Commons Attribution license (http://creativecommons.org/licenses/by/3.0/).
Share and Cite
Resch, B.; Zimmer, B. User Experience Design in Professional Map-Based Geo-Portals. ISPRS Int. J. Geo-Inf. 2013, 2, 1015-1037. https://doi.org/10.3390/ijgi2041015
Resch B, Zimmer B. User Experience Design in Professional Map-Based Geo-Portals. ISPRS International Journal of Geo-Information. 2013; 2(4):1015-1037. https://doi.org/10.3390/ijgi2041015
Chicago/Turabian StyleResch, Bernd, and Bastian Zimmer. 2013. "User Experience Design in Professional Map-Based Geo-Portals" ISPRS International Journal of Geo-Information 2, no. 4: 1015-1037. https://doi.org/10.3390/ijgi2041015
APA StyleResch, B., & Zimmer, B. (2013). User Experience Design in Professional Map-Based Geo-Portals. ISPRS International Journal of Geo-Information, 2(4), 1015-1037. https://doi.org/10.3390/ijgi2041015