Antimicrobial Films Based on Nanocomposites of Chitosan/Poly(vinyl alcohol)/Graphene Oxide for Biomedical Applications

 , ,
, ,  , and
, and 
Abstract
:1. Introduction
2. Materials and Methods
2.1. Materials
2.2. Methods
2.2.1. Graphene Oxide Synthesis
2.2.2. Graphene Oxide Characterization
2.2.3. Film Preparation
2.2.4. Film Characterization
Fourier-Transform Infrared Spectroscopy
Scanning Electron Microscopy
The Tensile Strength of Films
Degradation in Simulated Biological Fluid
Antimicrobial Film Assay
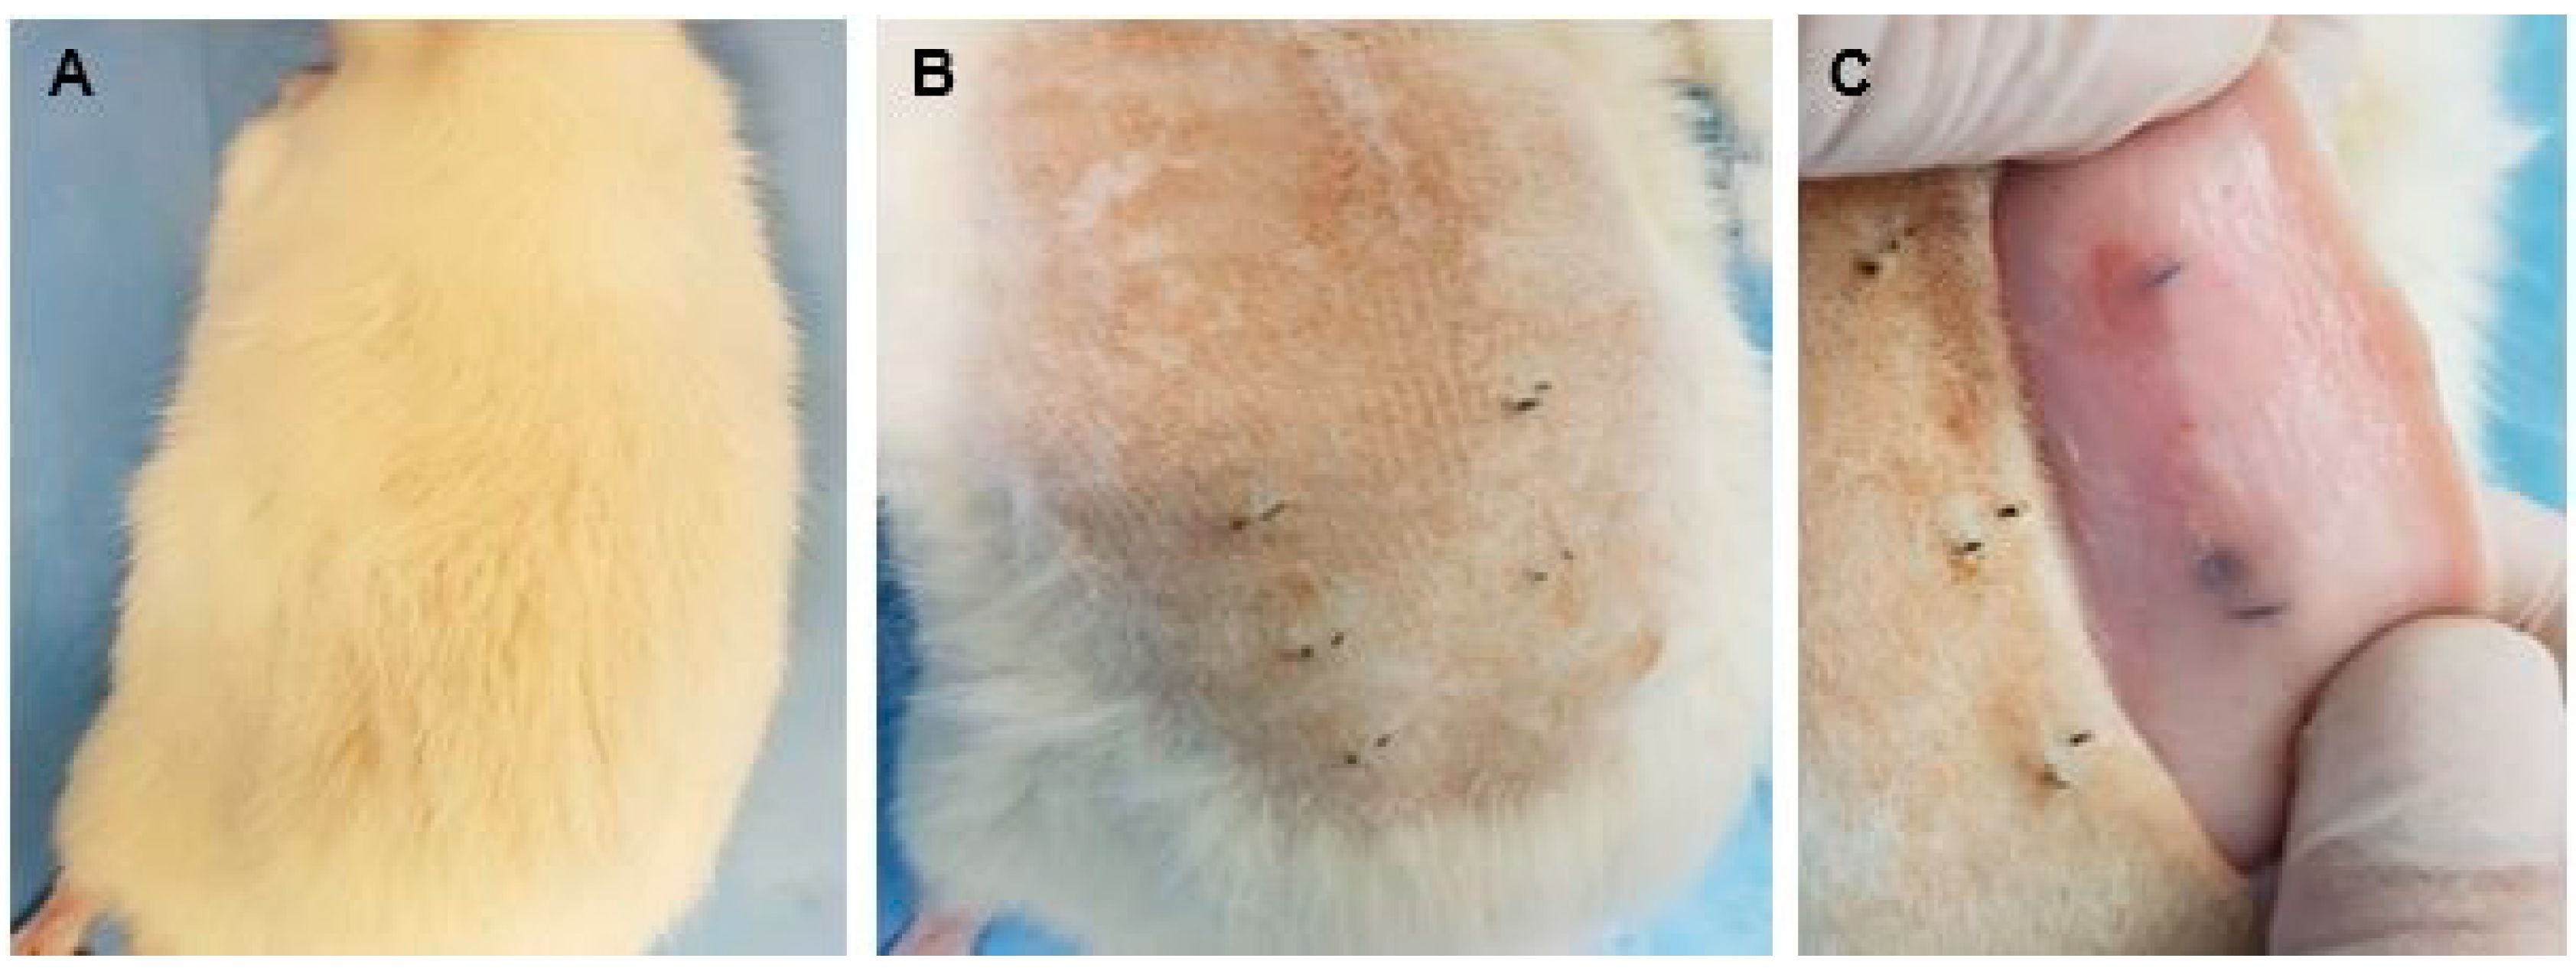
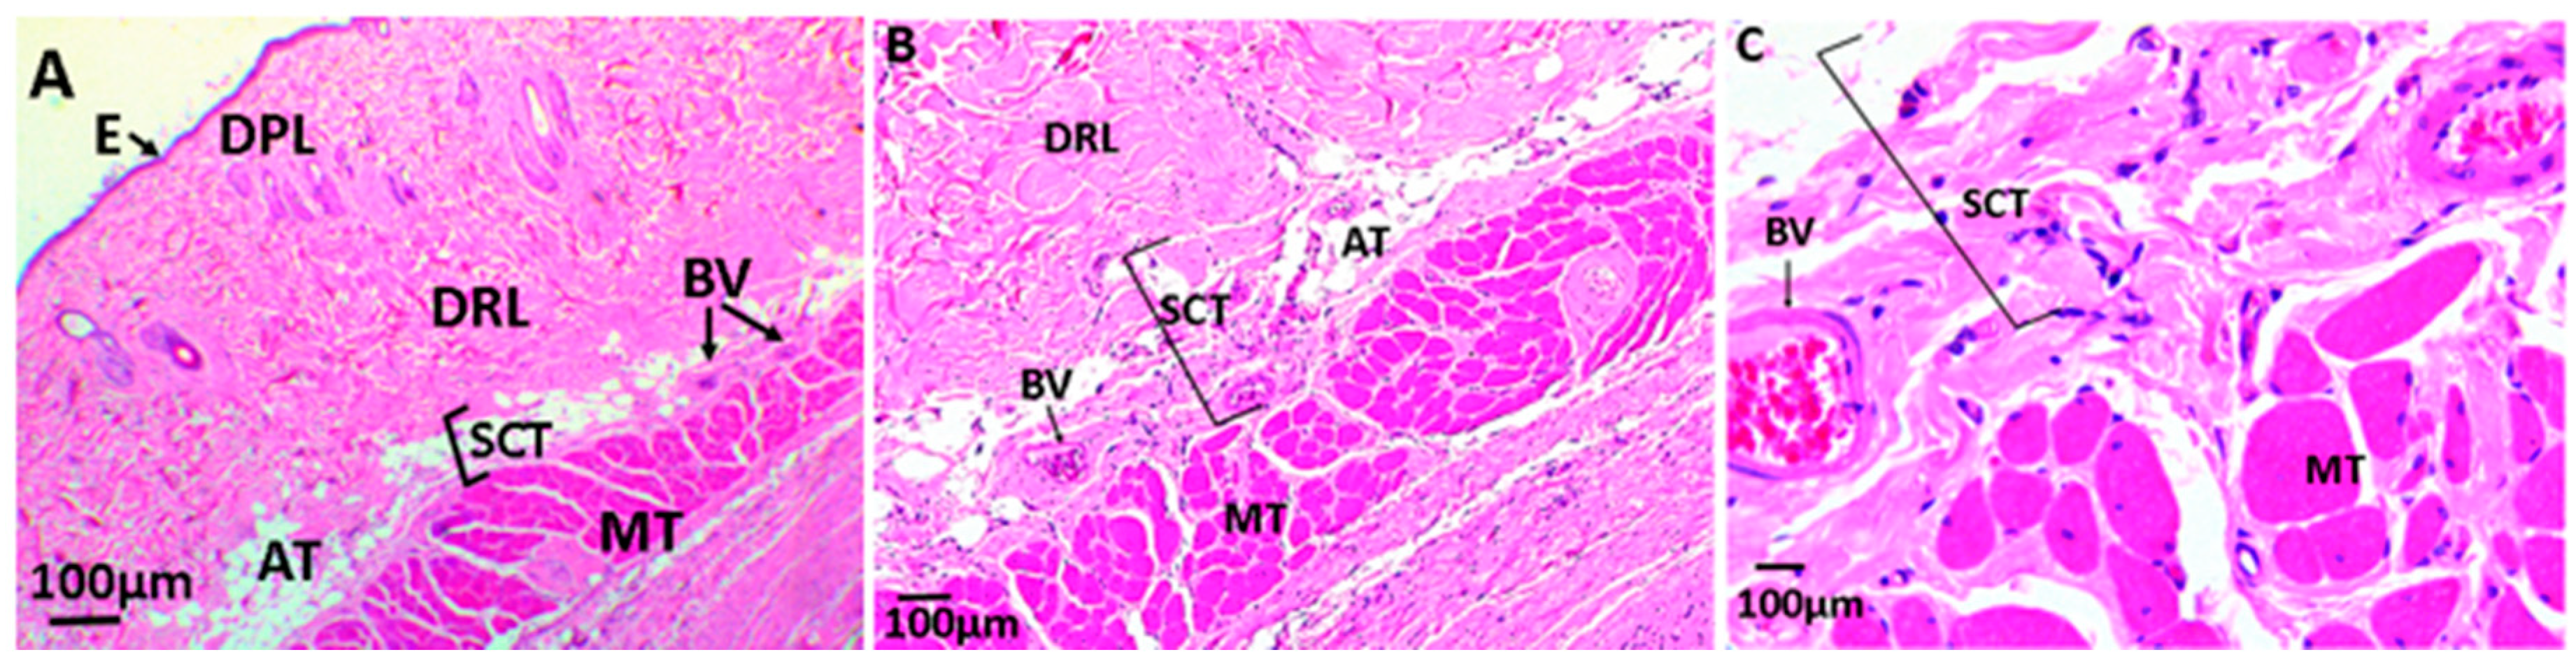
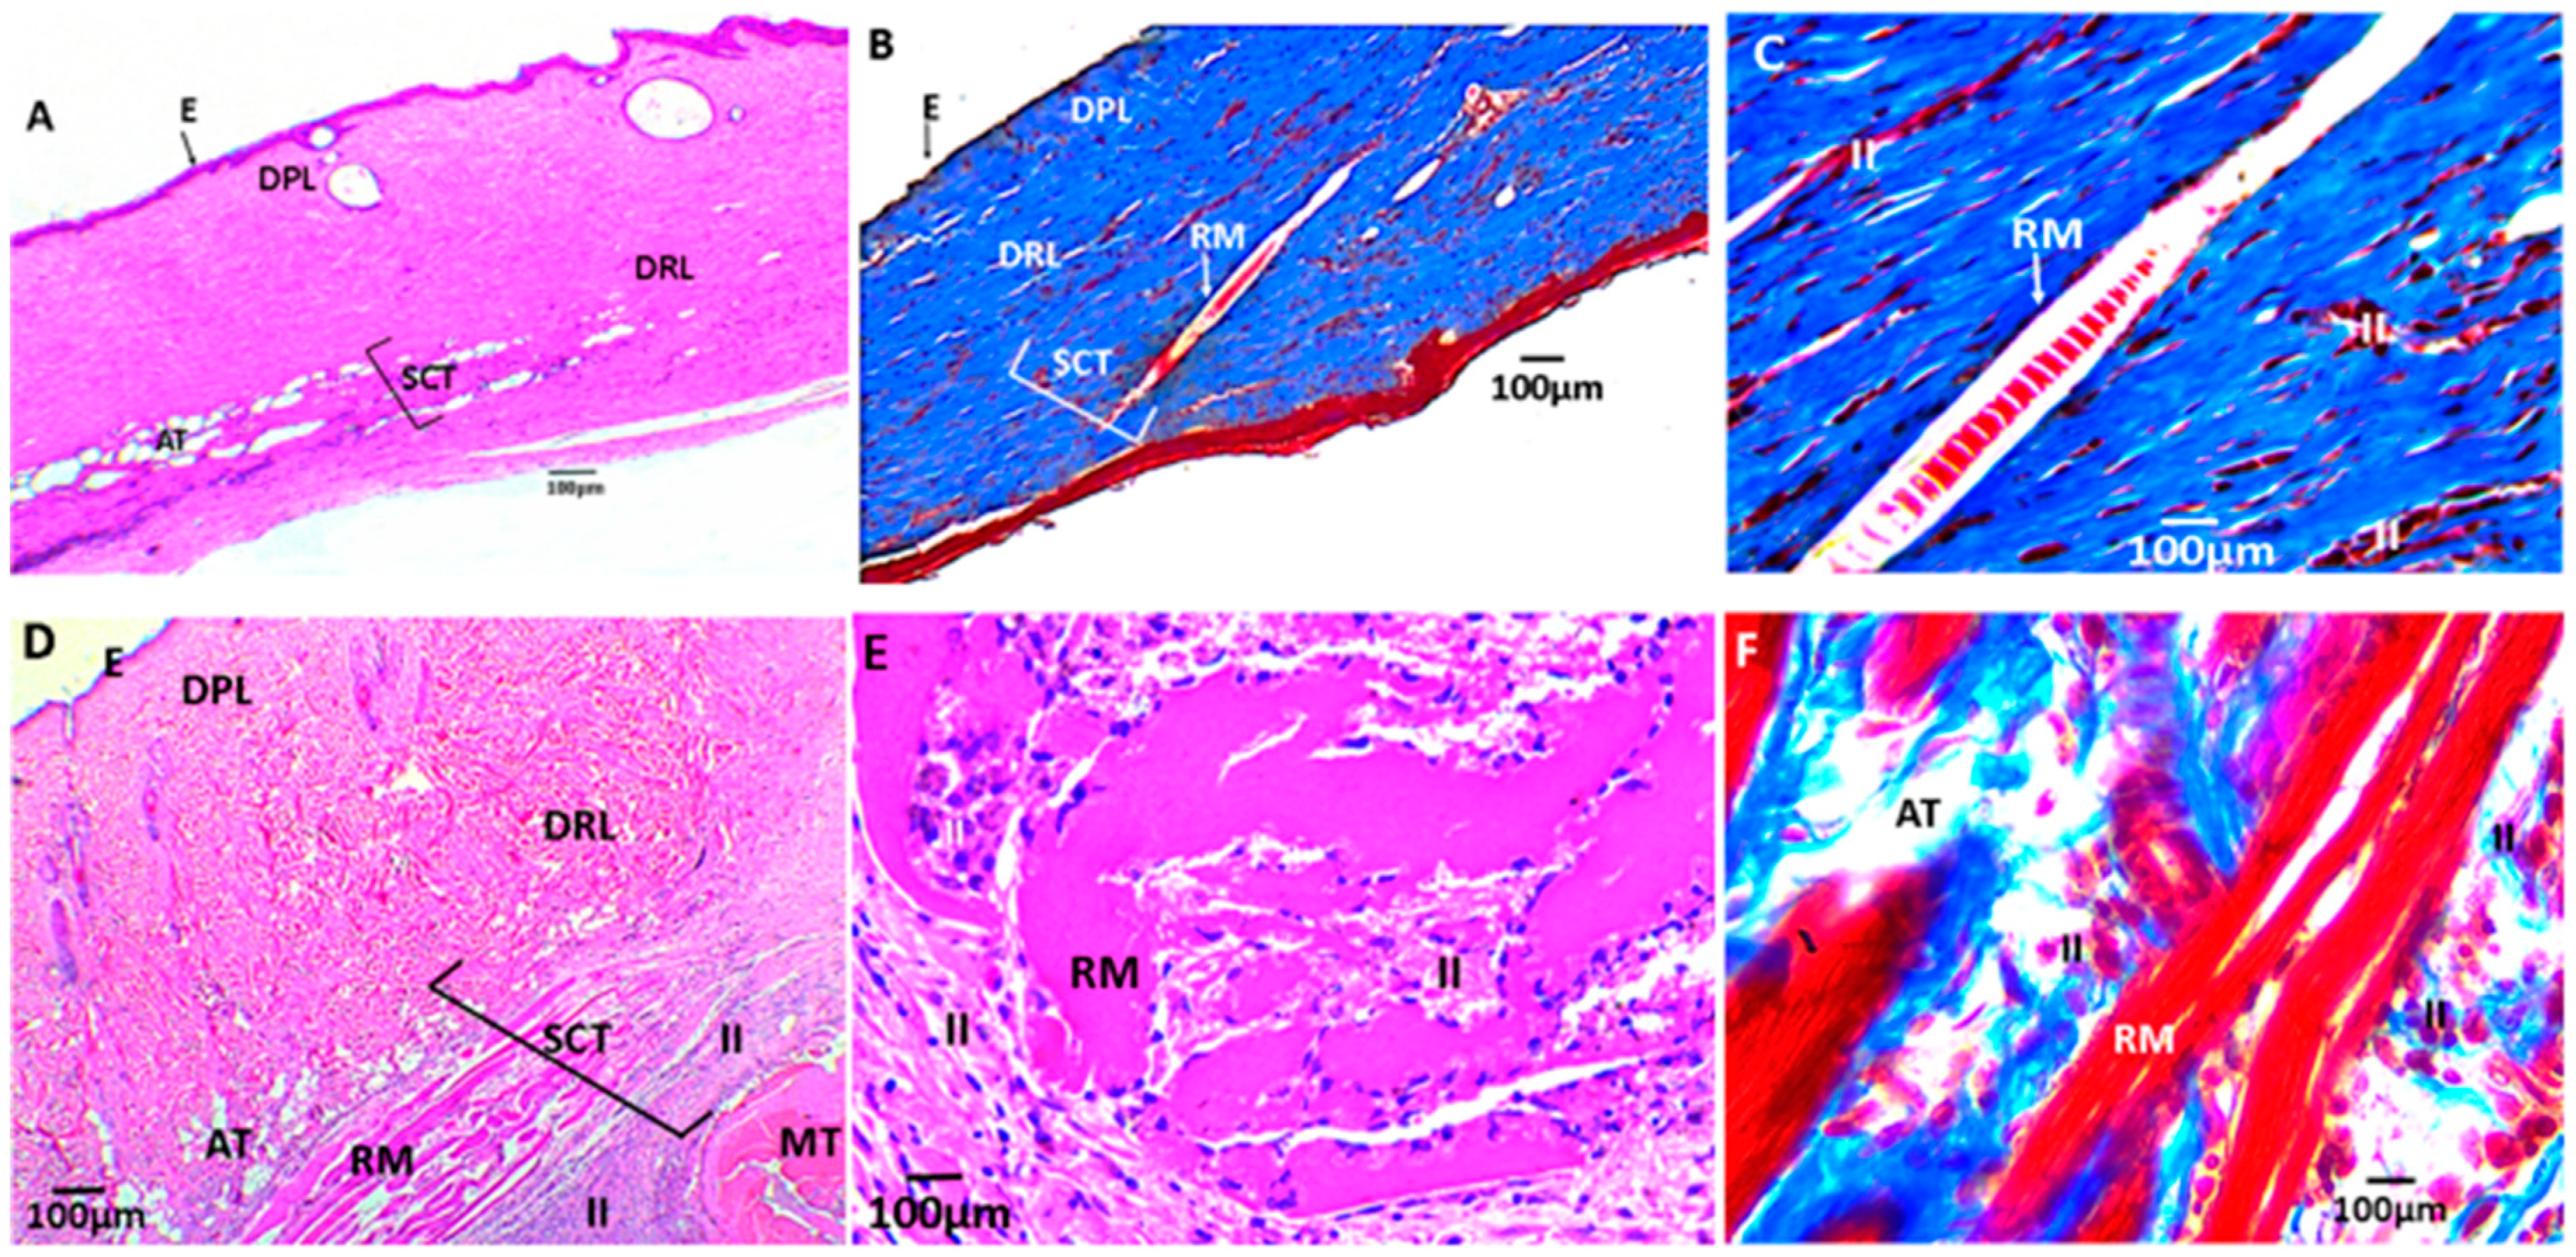
Biomodel Tests In Vivo
3. Results and Discussion
3.1. Graphene Oxide Characterization
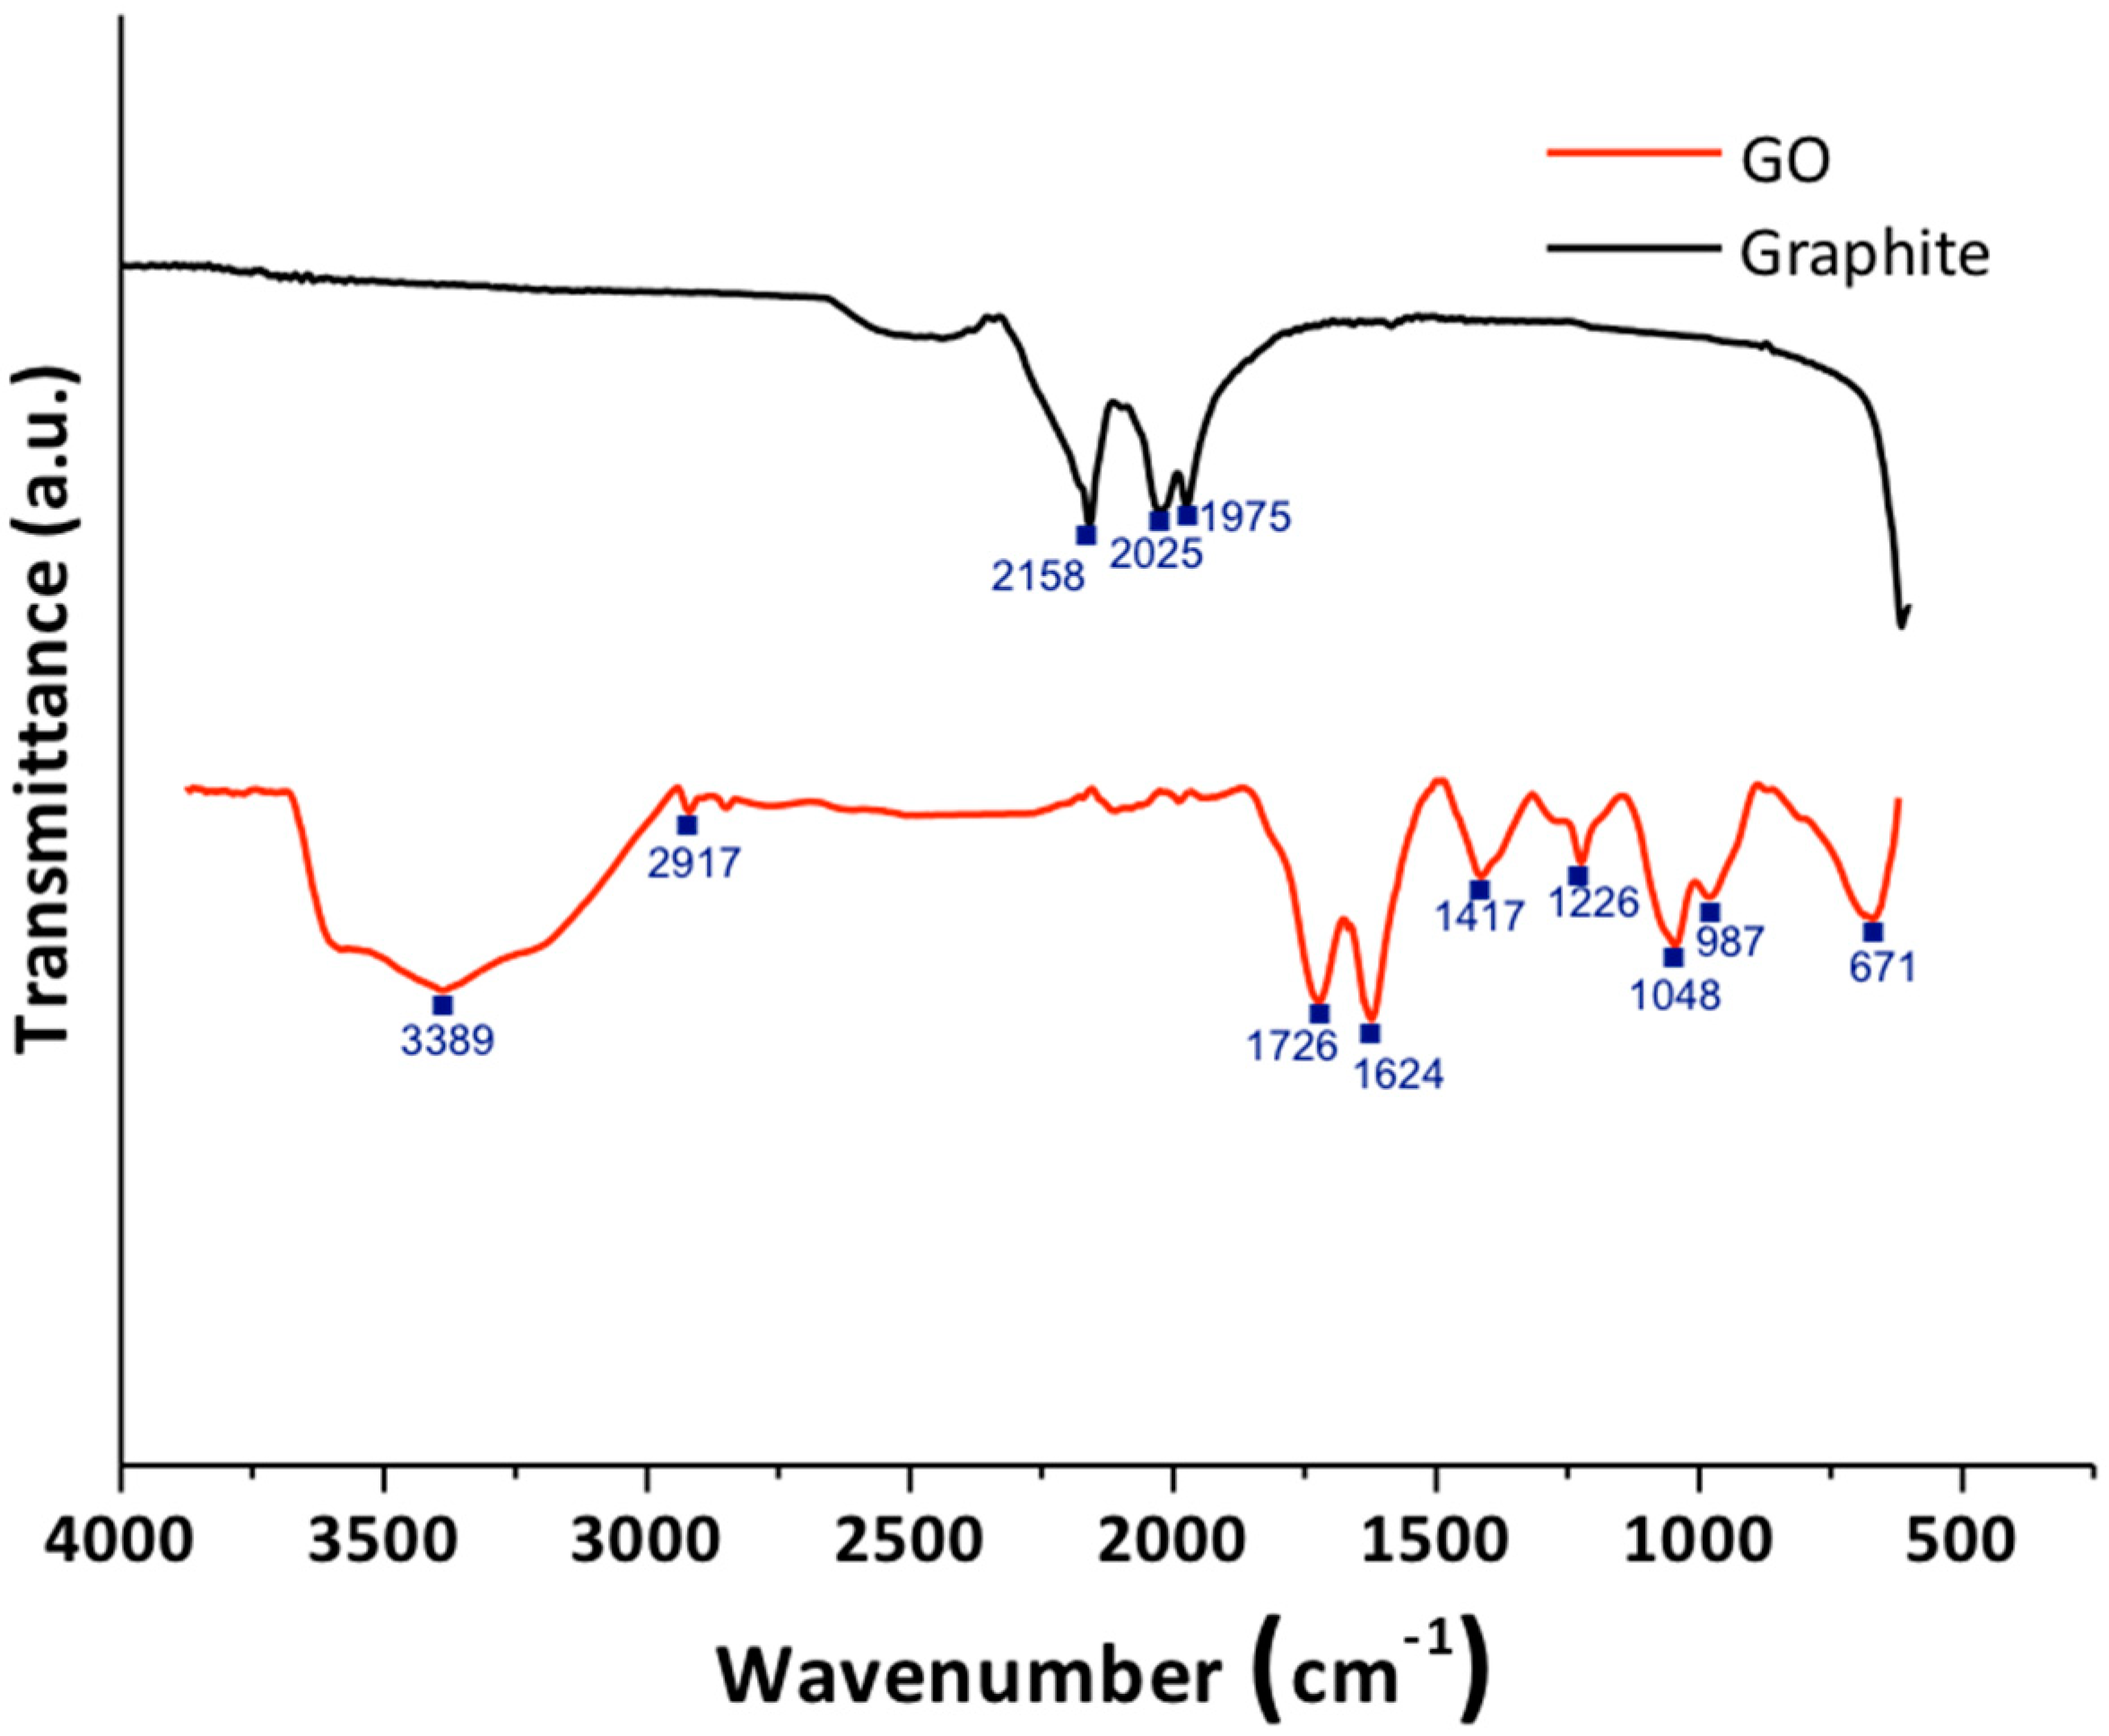
3.1.1. Fourier-Transform Infrared Spectroscopy
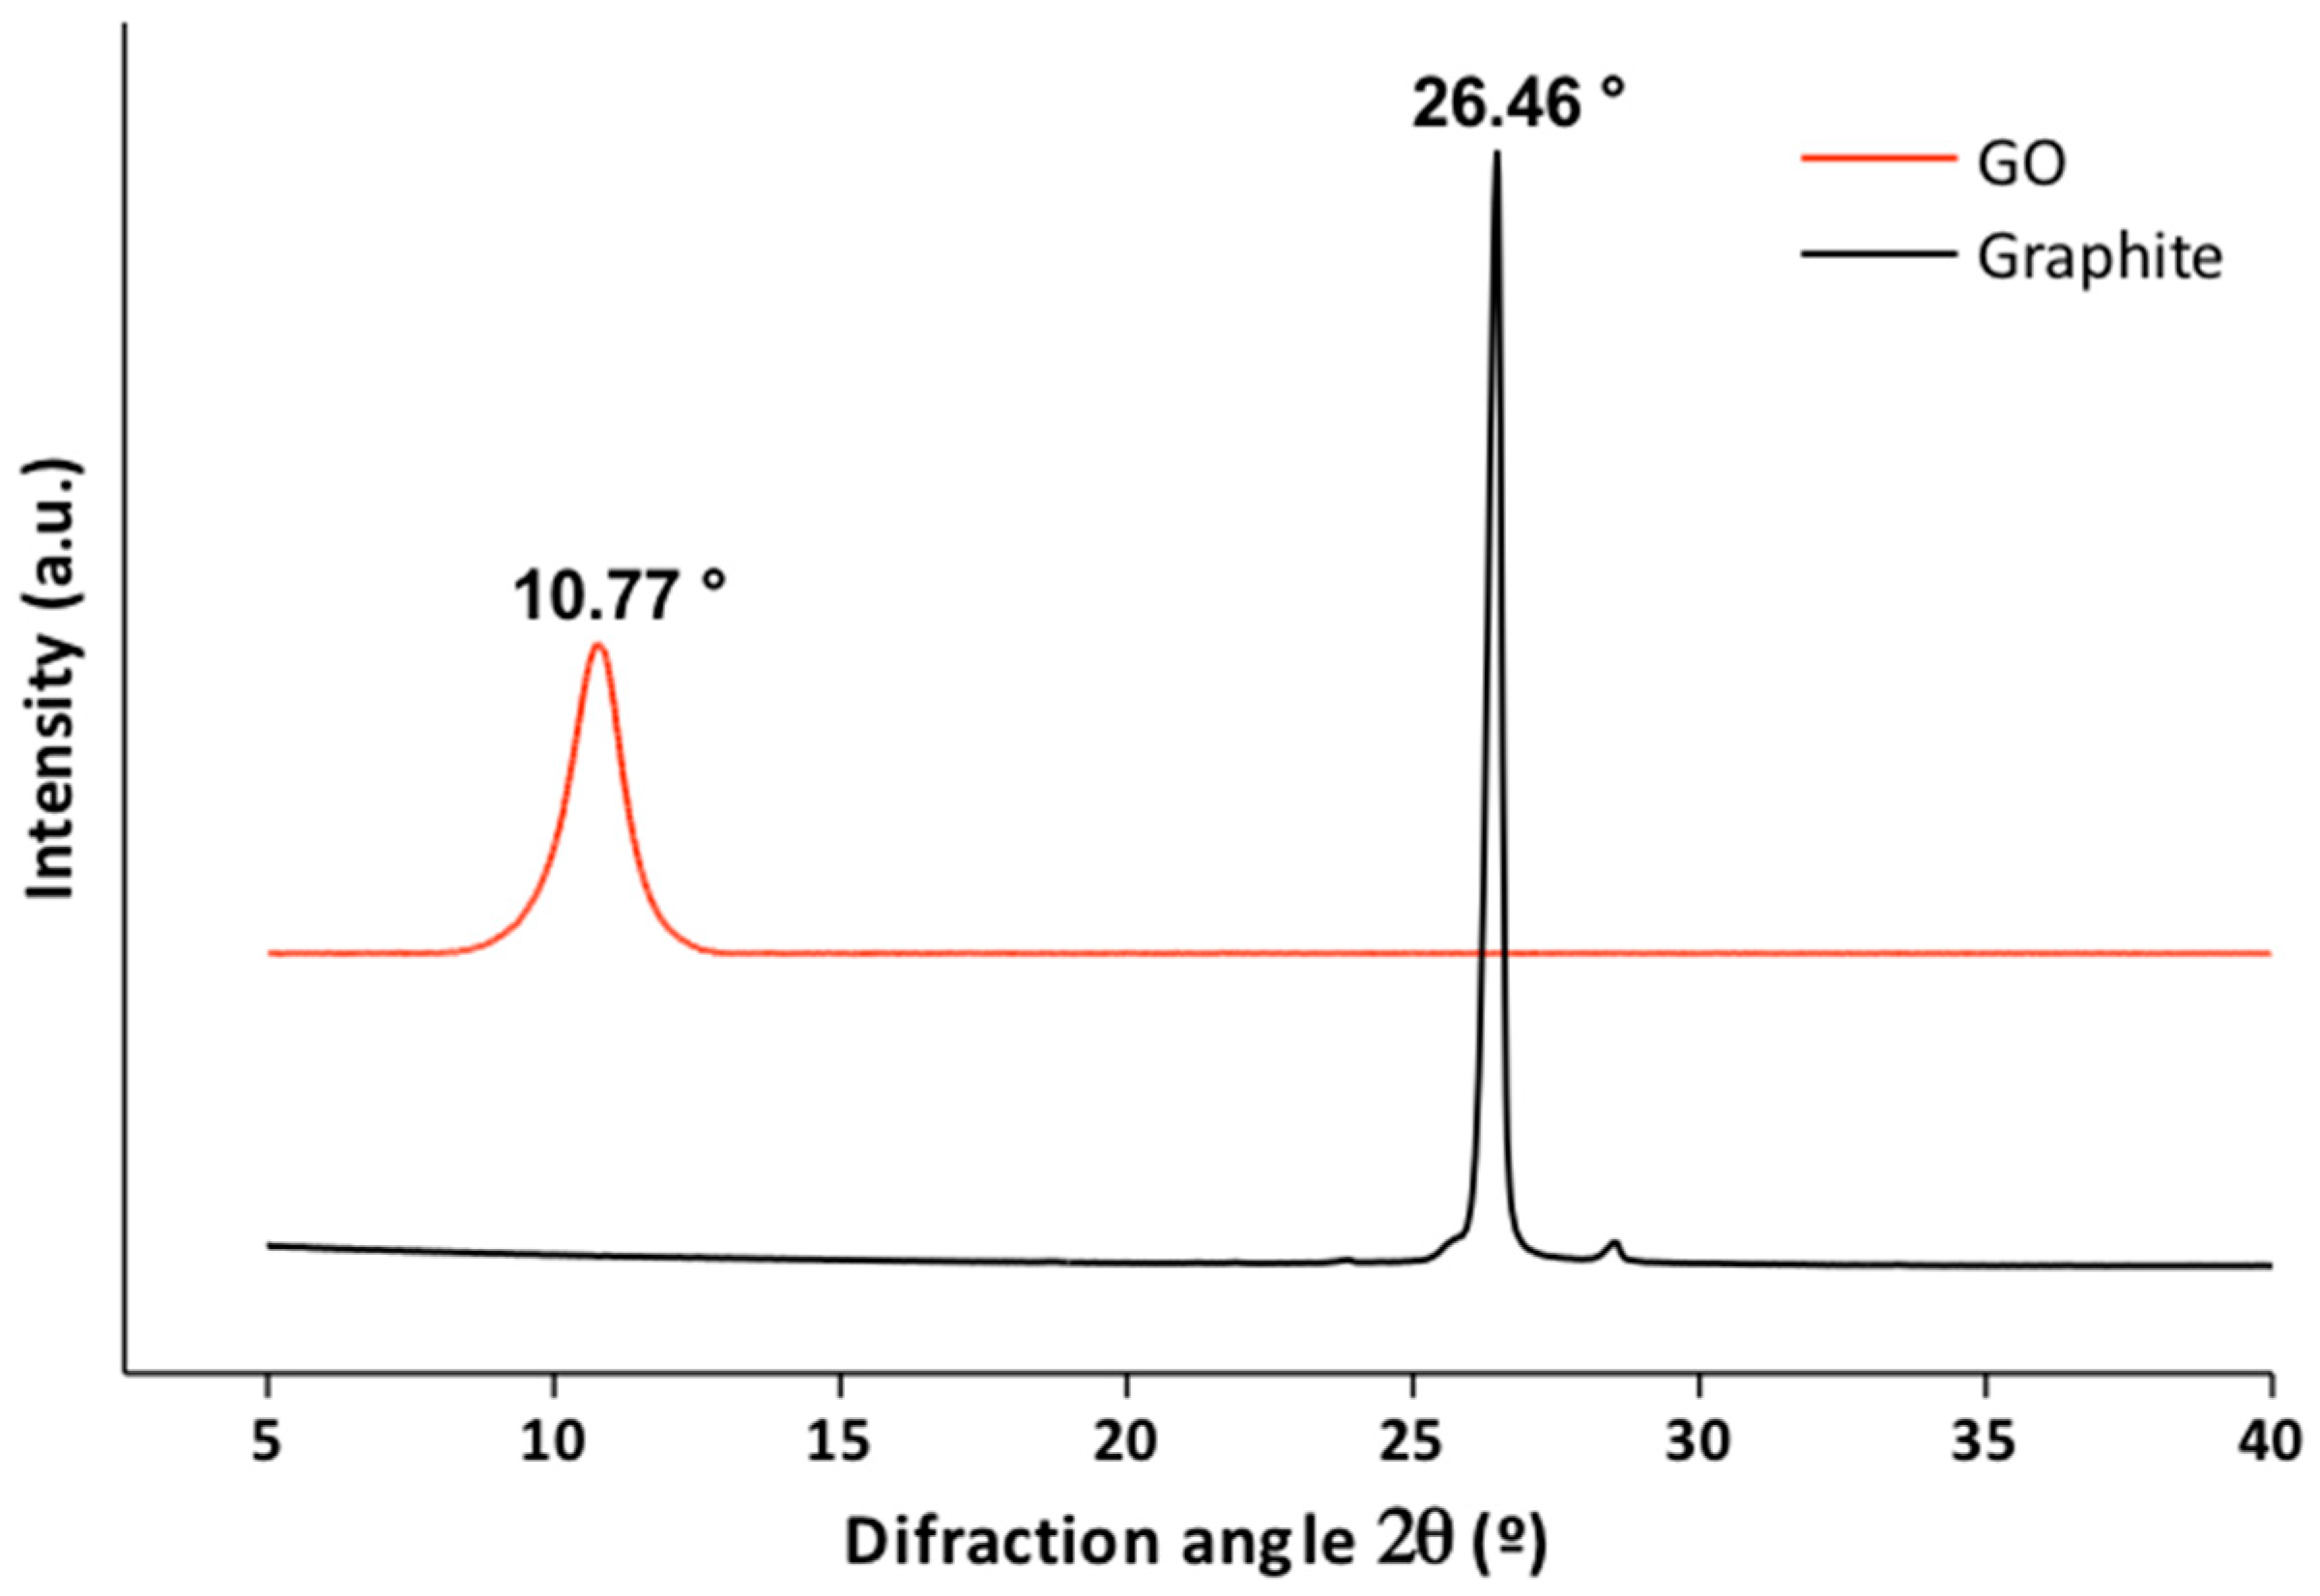
3.1.2. X-Ray Diffraction
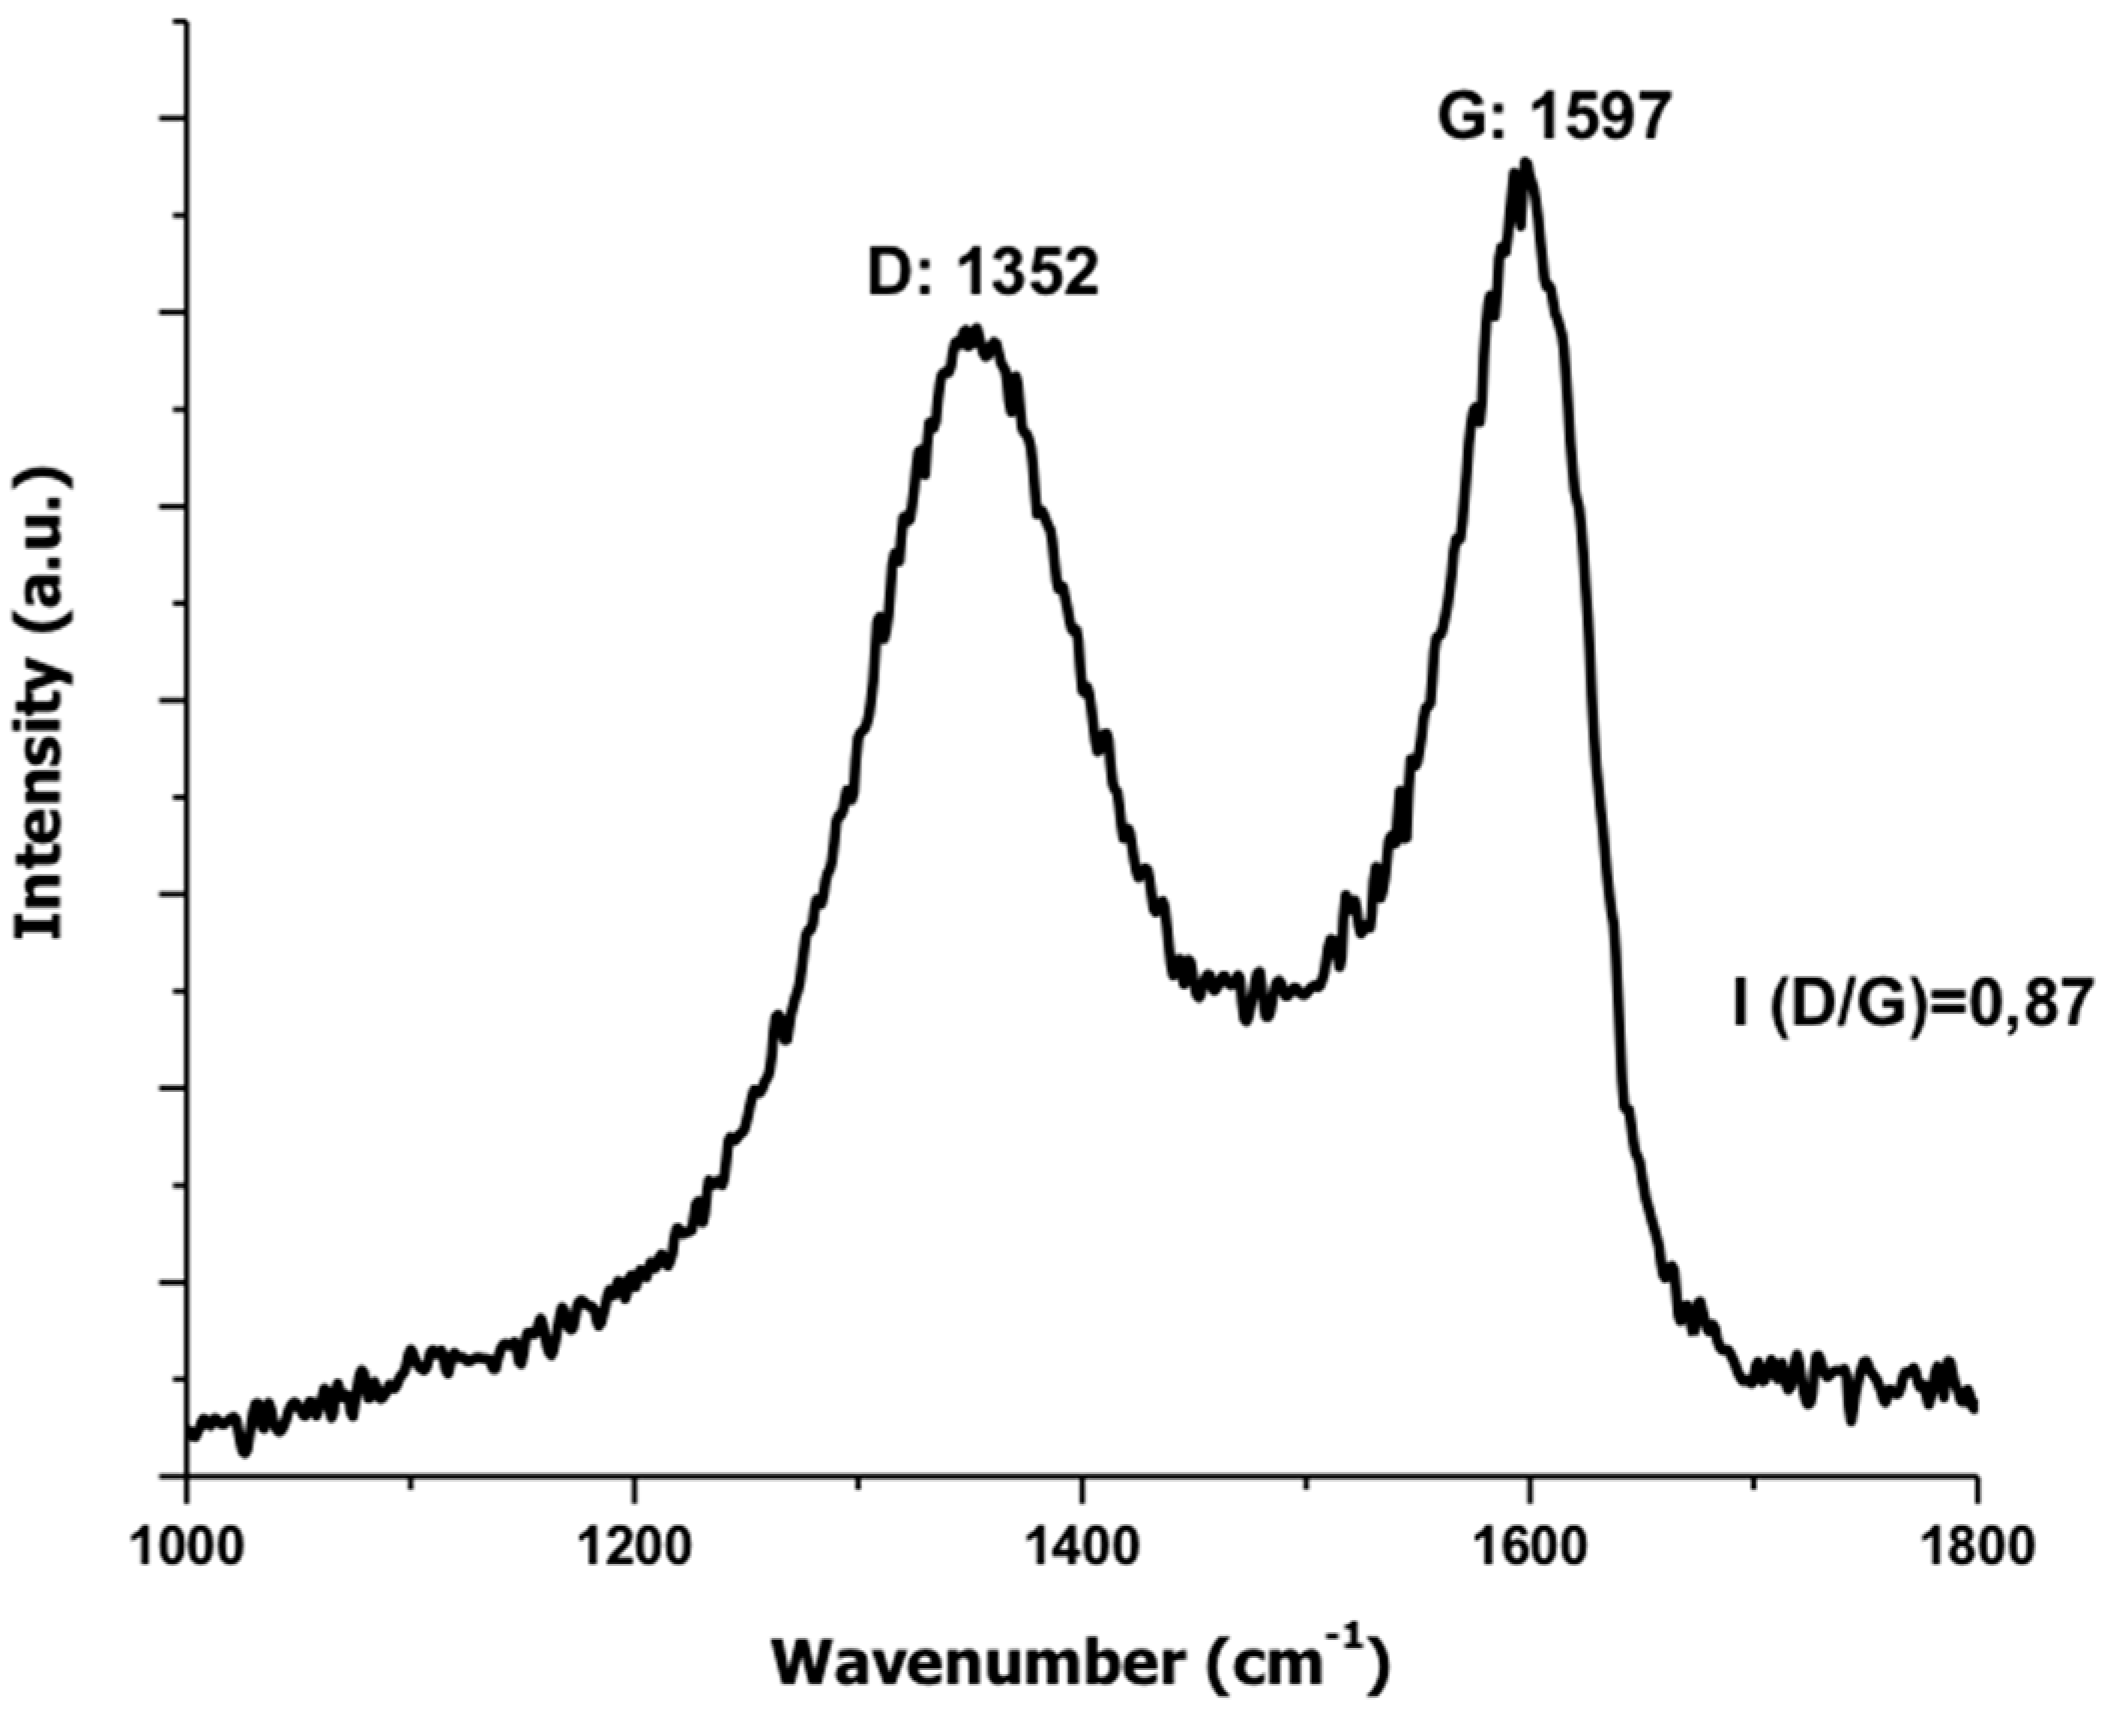
3.1.3. Raman Spectroscopy
3.2. Film Characterization
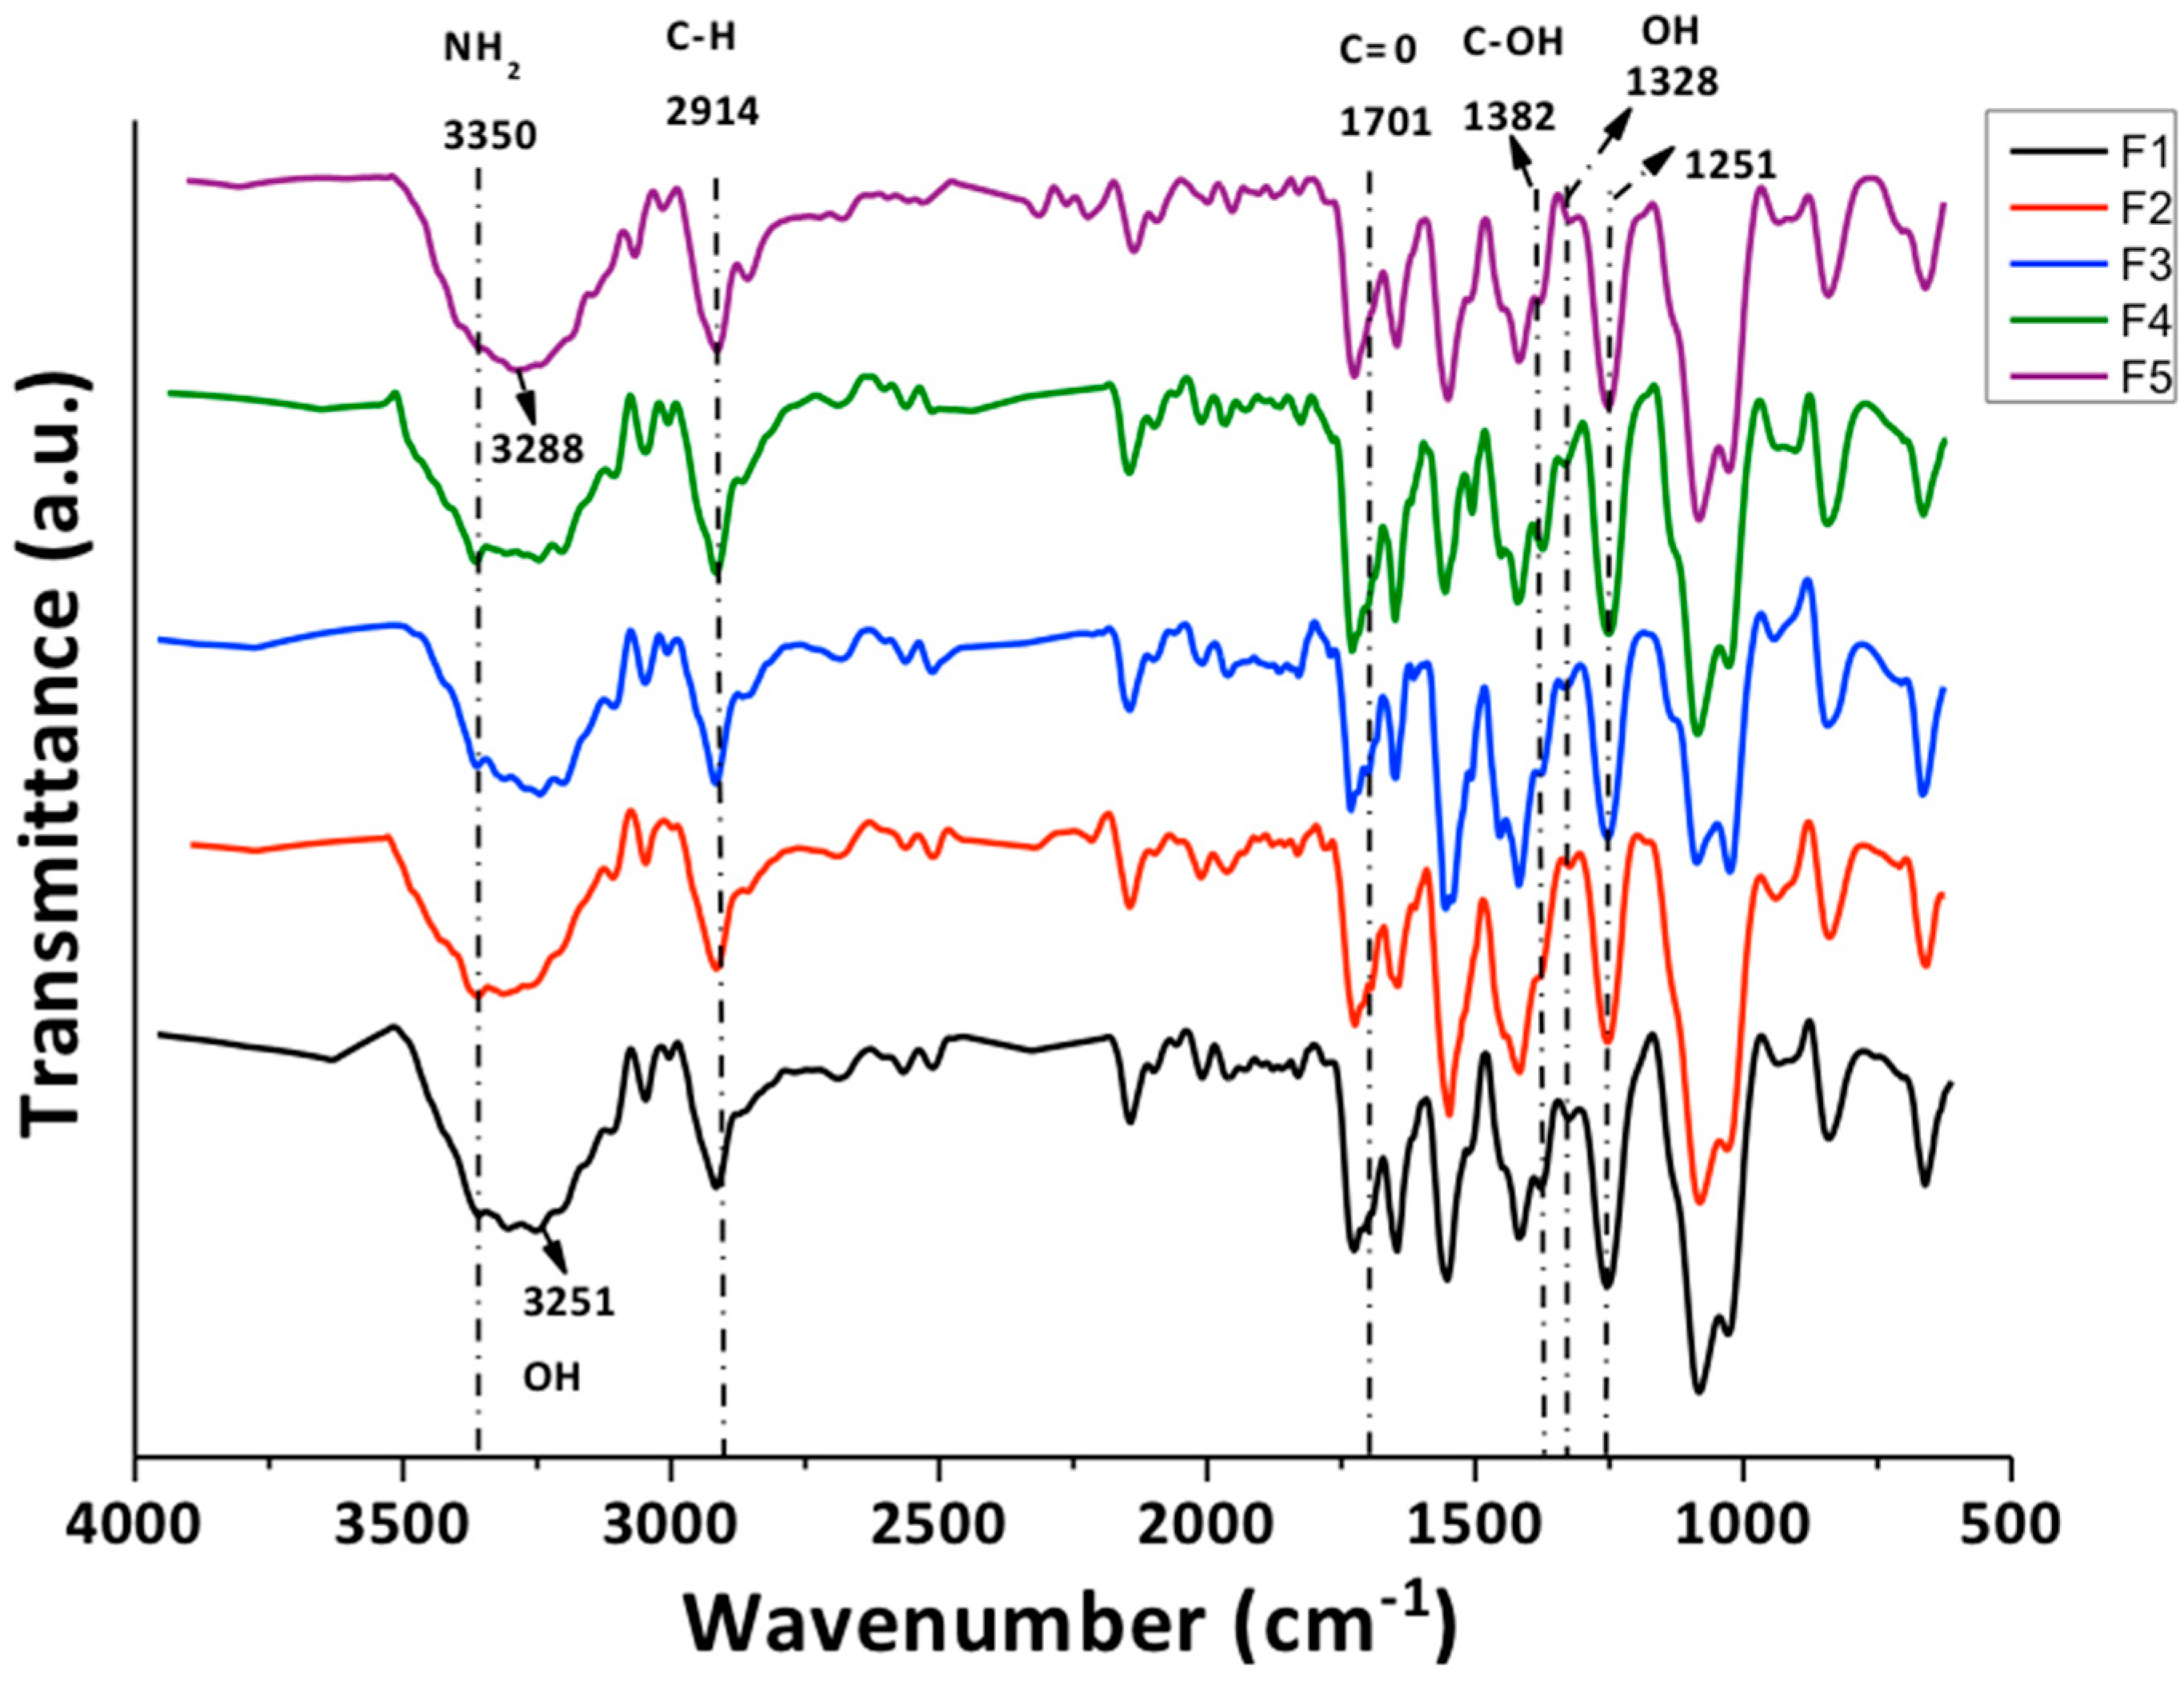
3.2.1. Fourier-Transform Infrared Spectroscopy
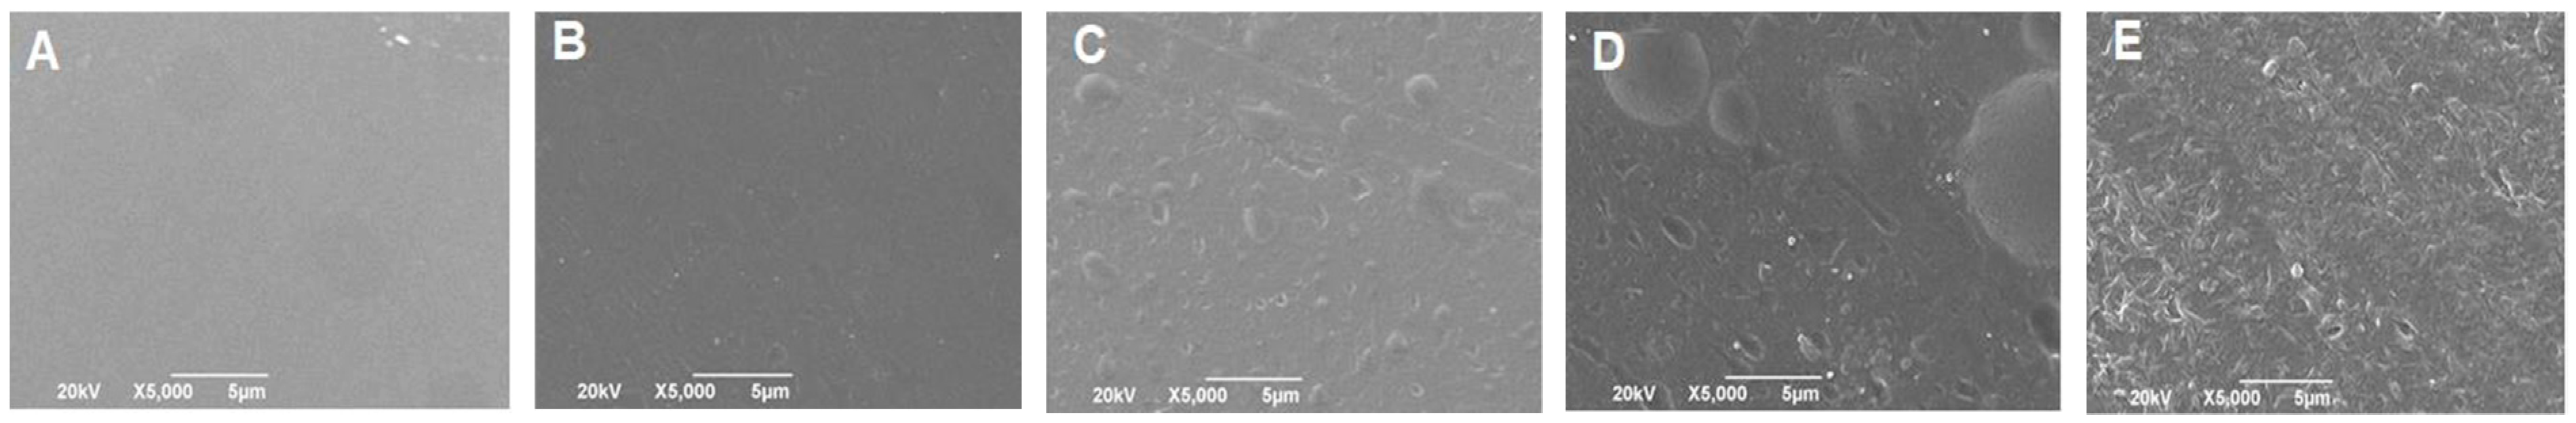
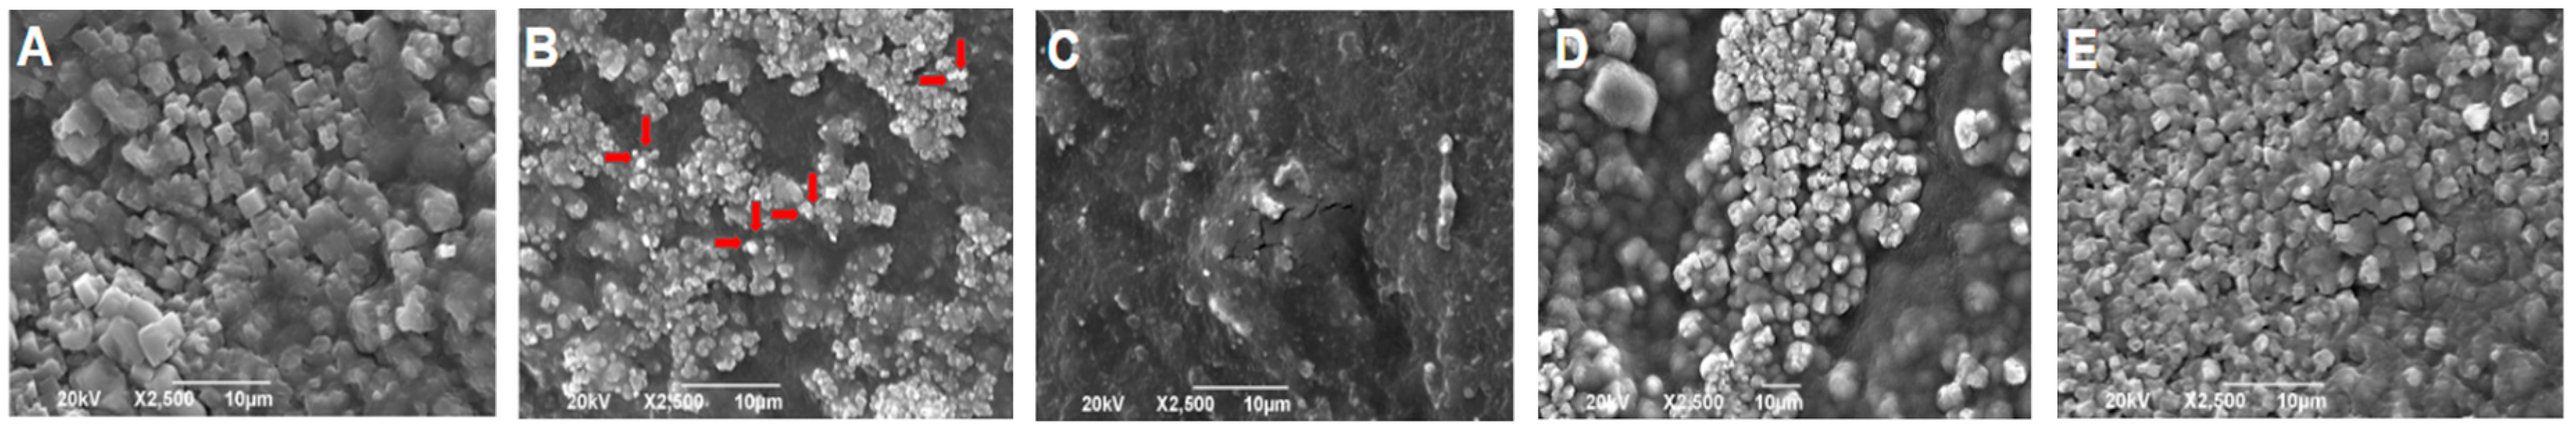
3.2.2. Scanning Electron Microscopy
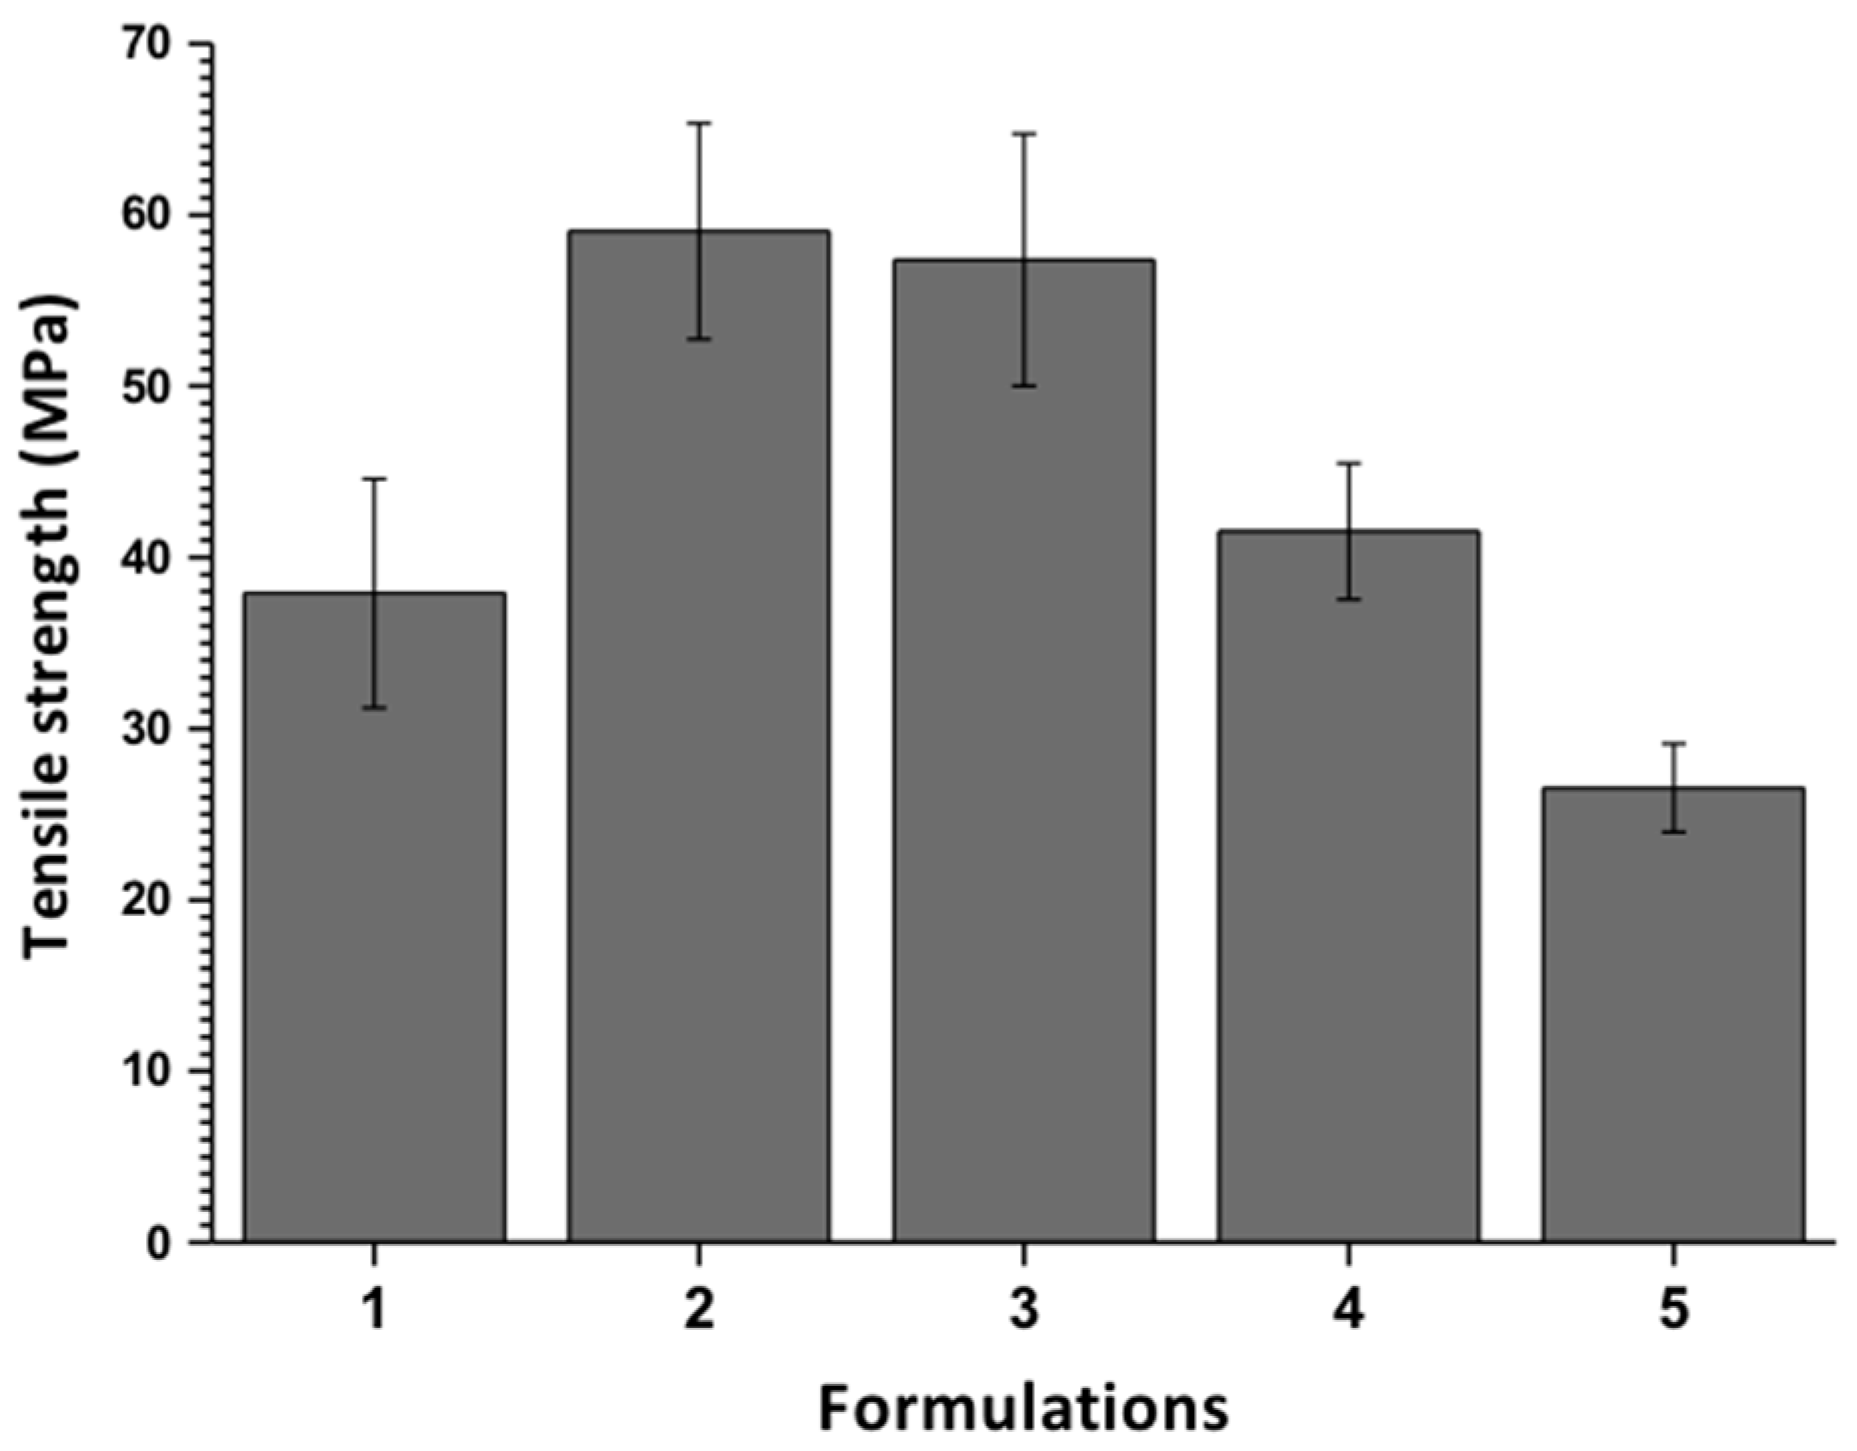
3.2.3. The Tensile Strength of the Films
3.2.4. Degradation in a Simulated Biological Fluid
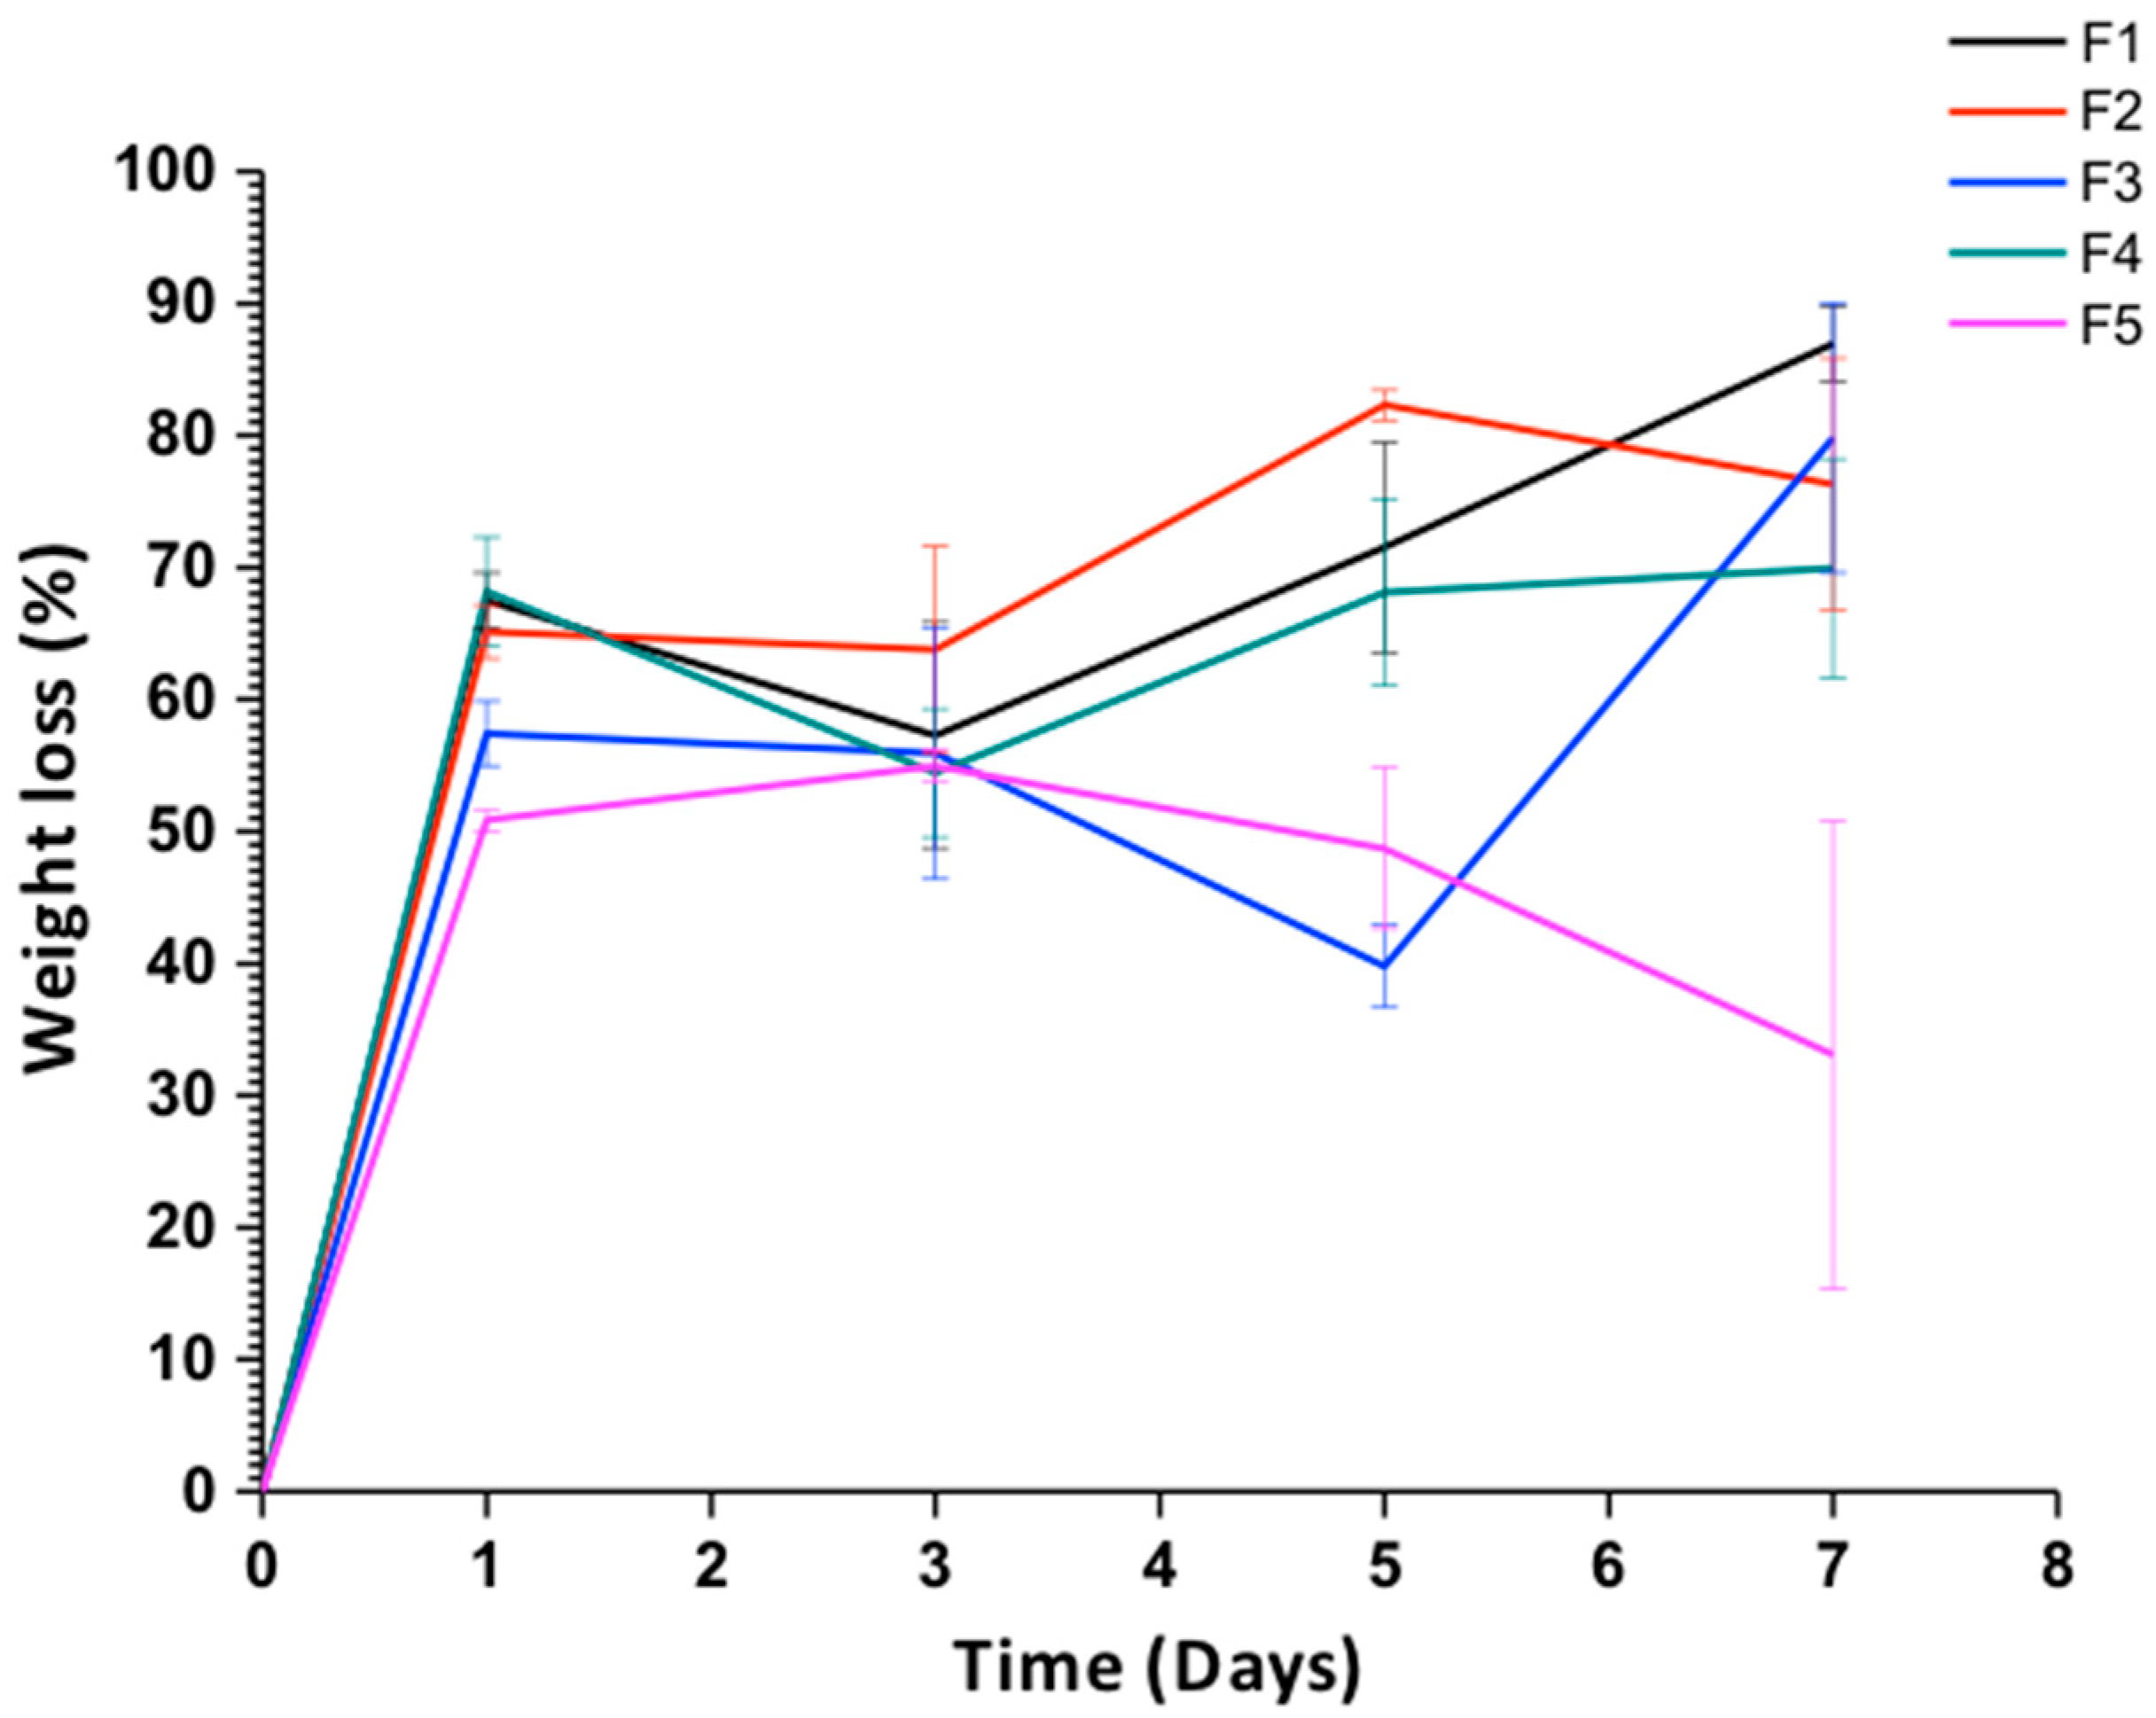
Weight Loss
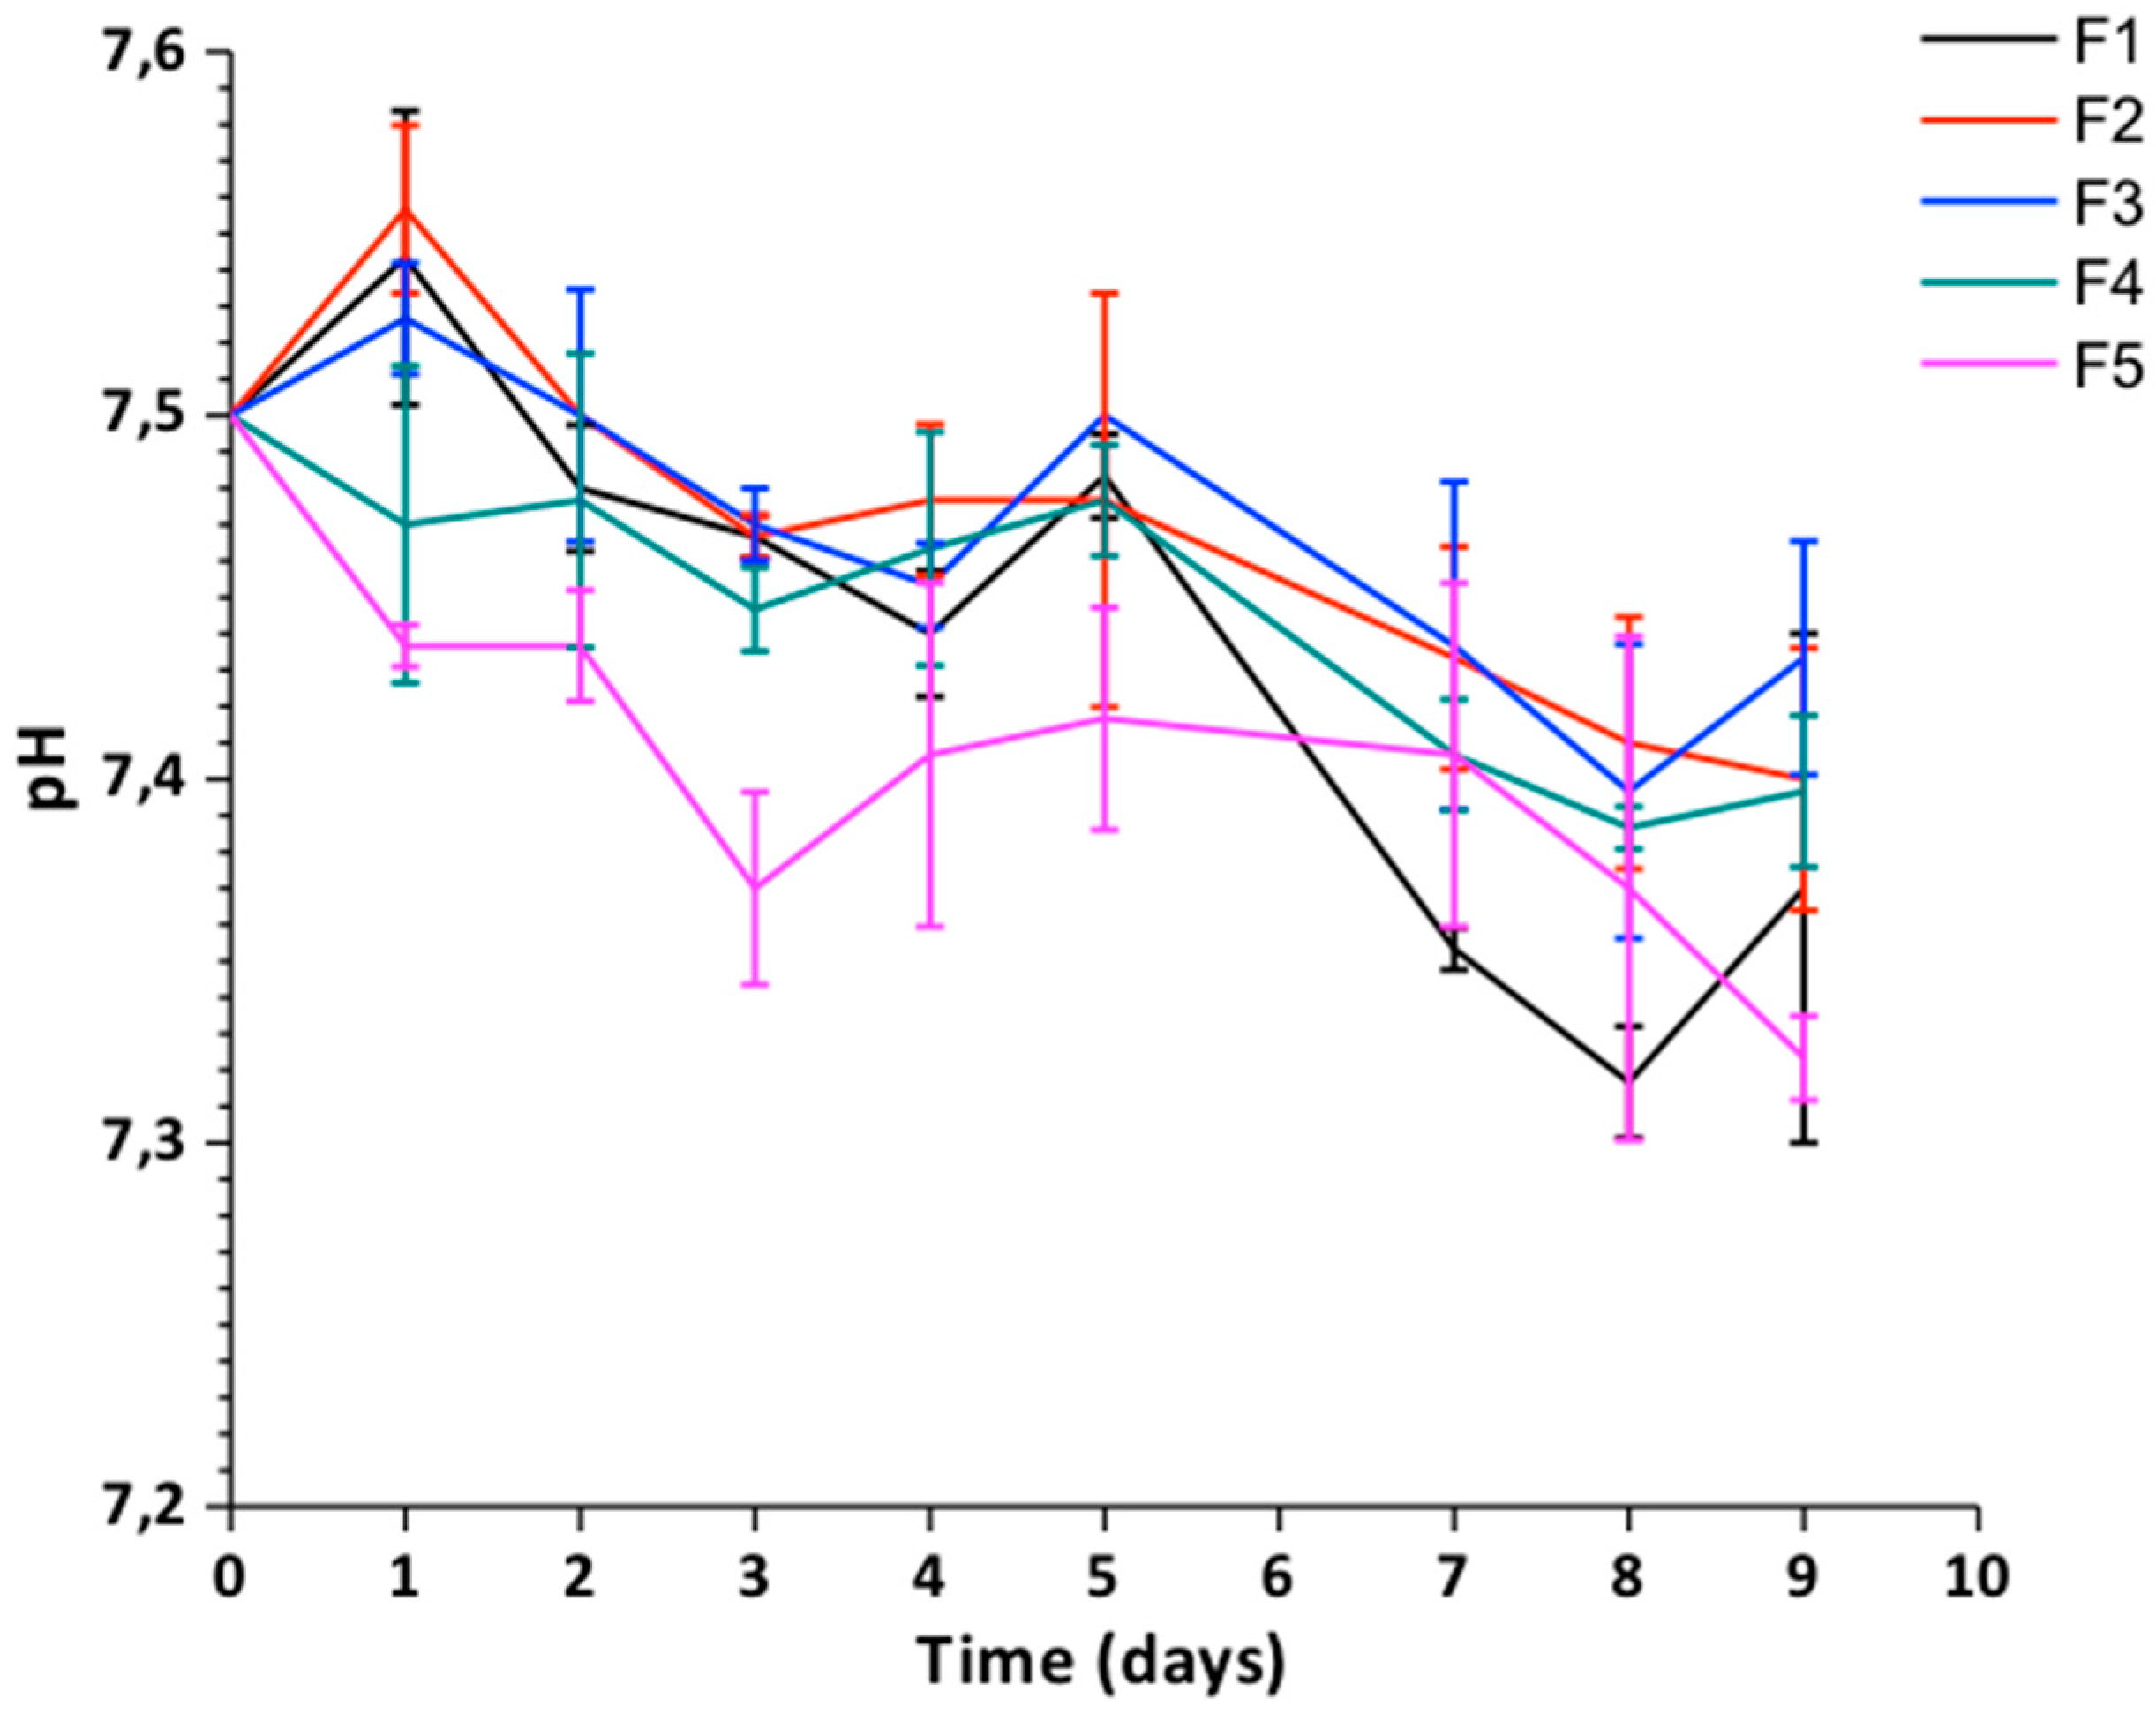
pH Changes
Scanning Electron Microscopy of the Films after Immersion in Simulated Body Fluid
3.2.5. Antibacterial Activity
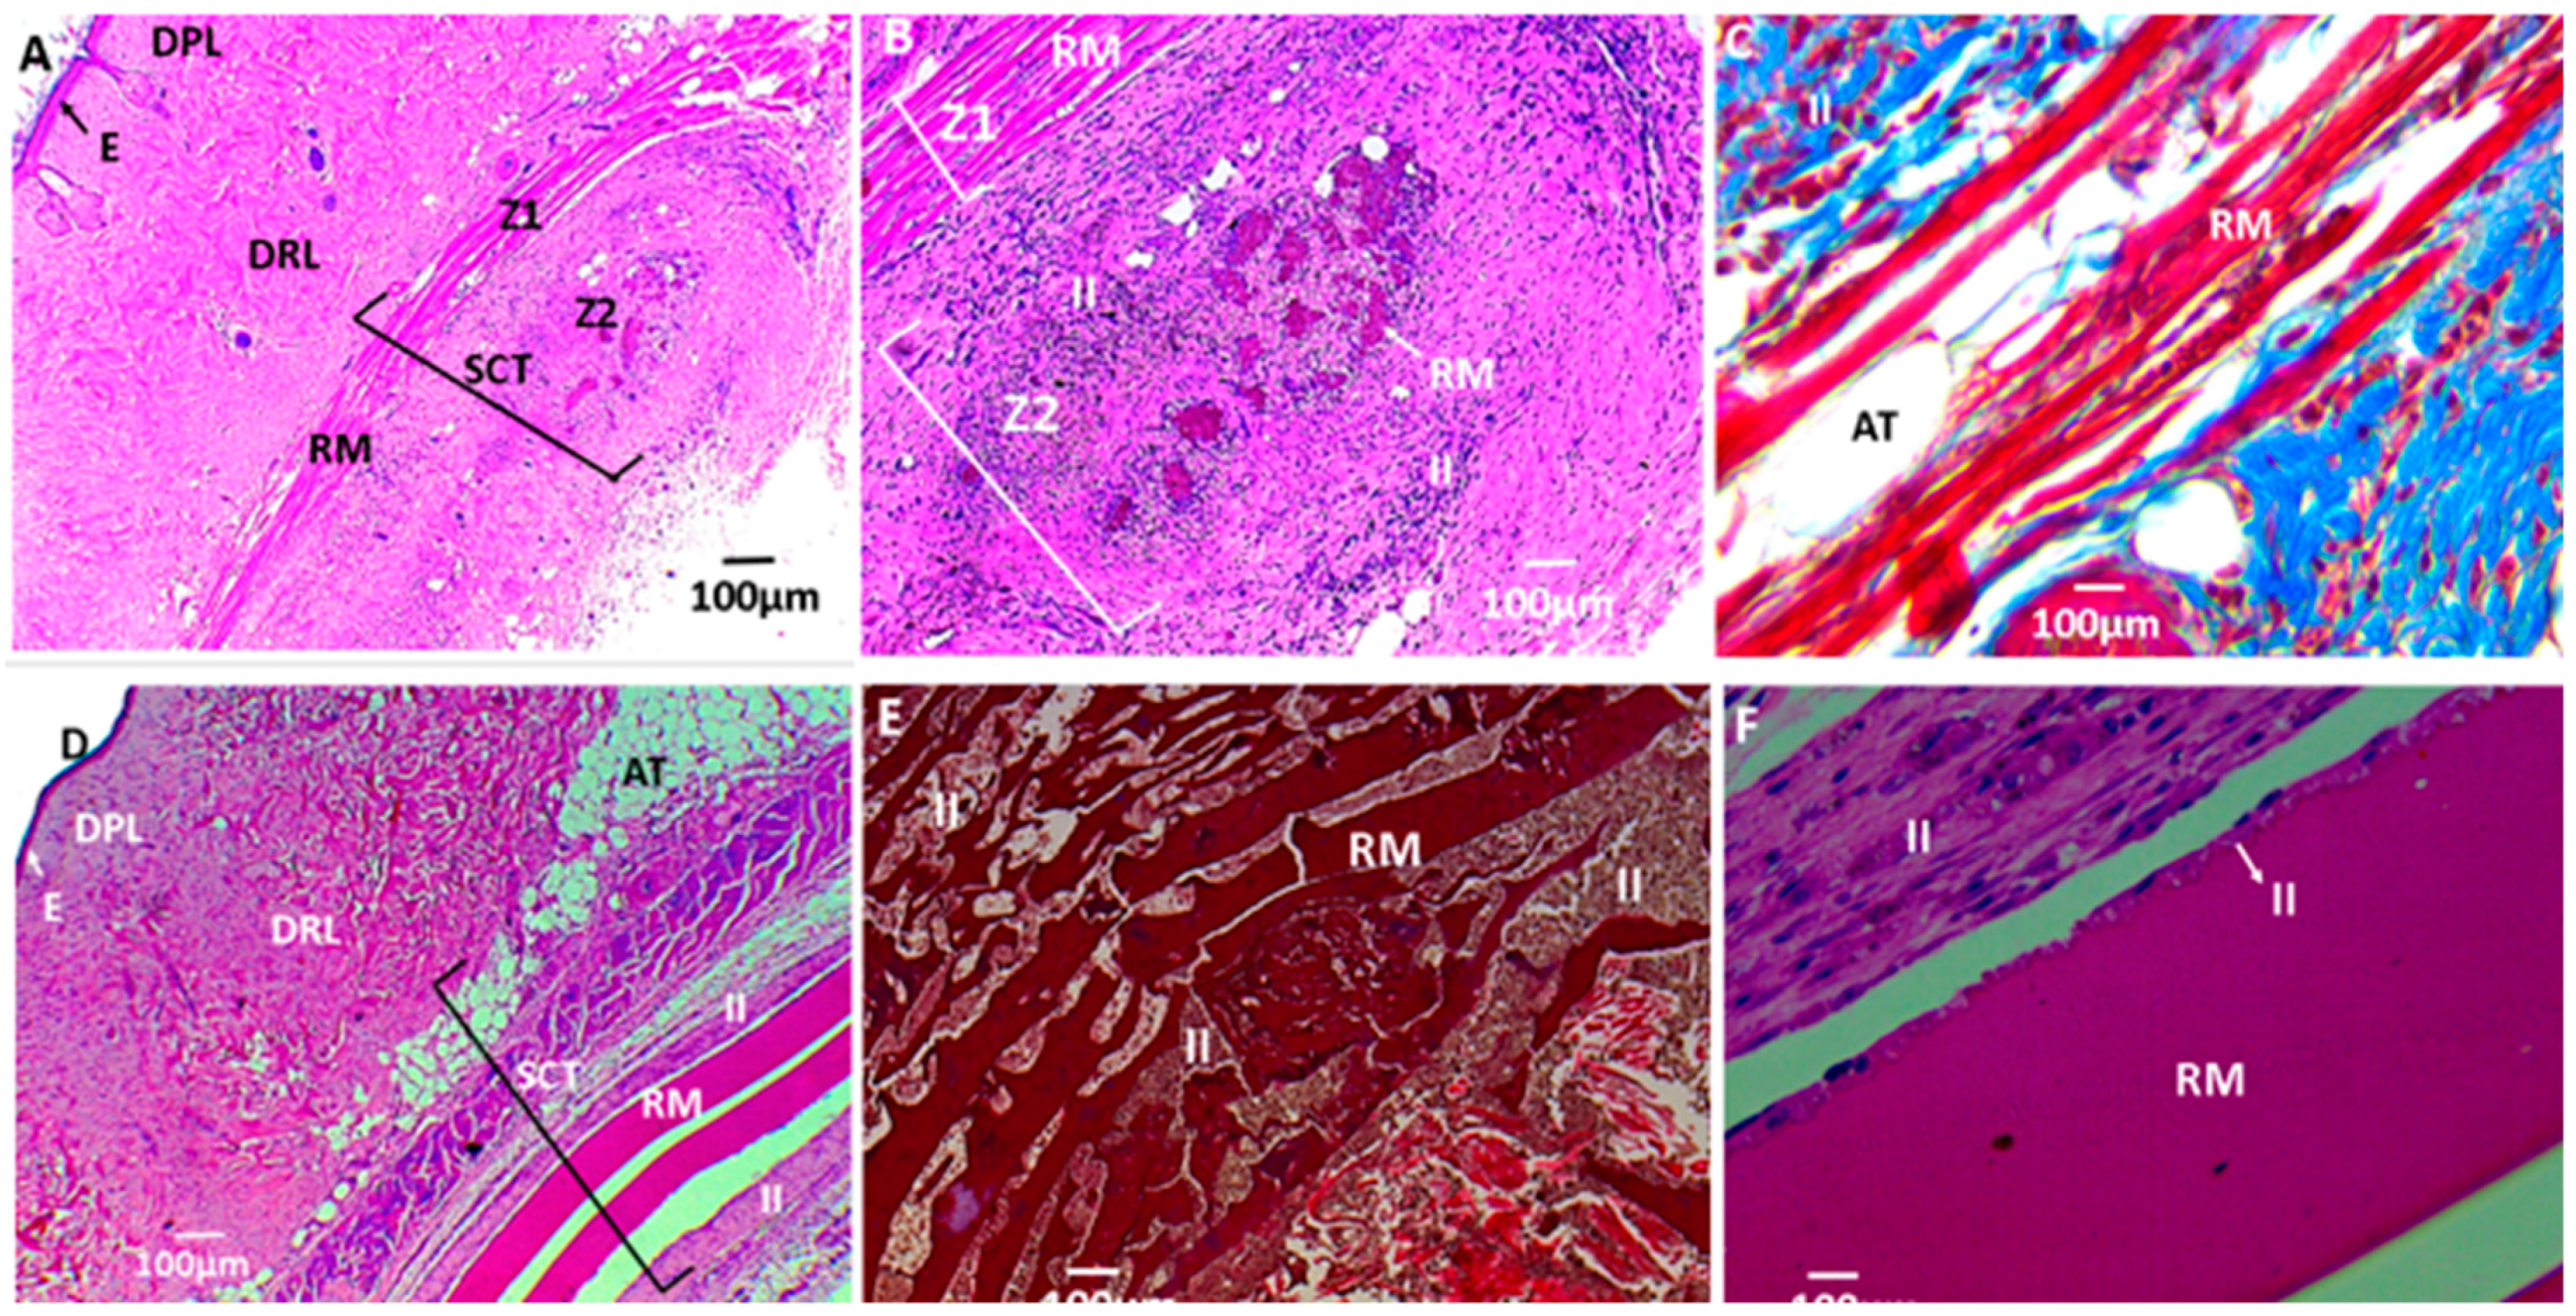
3.2.6. Biomodel Tests In Vivo
4. Conclusions
Supplementary Materials
Author Contributions
Funding
Conflicts of Interest
References
- Yuste, J.R.; del Pozo, J.L.; Quetglás, E.G.; Azanza, J.R. Infecciones más comunes en el paciente trasplantado. Anales del Sistema Sanitario de Navarra 2006, 29 (Suppl. 2), 175–206. [Google Scholar] [CrossRef] [PubMed]
- Gutha, Y.; Pathak, J.L.; Zhang, W.; Zhang, Y.; Jiao, X. Antibacterial and wound healing properties of chitosan/poly(vinyl alcohol)/zinc oxide beads (CS/PVA/ZnO). Int. J. Biol. Macromol. 2017, 103, 234–241. [Google Scholar] [CrossRef] [PubMed]
- Lim, H.N.; Huang, N.M.; Loo, C.H. Facile preparation of graphene-based chitosan films: Enhanced thermal, mechanical and antibacterial properties. J. Non-Cryst. Solids 2012, 358, 525–530. [Google Scholar] [CrossRef]
- Dash, M.; Chiellini, F.; Ottenbrite, R.M.; Chiellini, E. Chitosan—A versatile semi-synthetic polymer in biomedical applications. Prog. Polym. Sci. 2011, 36, 981–1014. [Google Scholar] [CrossRef]
- Rinaudo, M. Chitin and chitosan: Properties and applications. Prog. Polym. Sci. 2006, 31, 603–632. [Google Scholar] [CrossRef]
- Kumar, M.N.R. A review of chitin and chitosan applications. React. Funct. Polym. 2000, 46, 1–27. [Google Scholar] [CrossRef]
- Honarkar, H.; Barikani, M. Applications of biopolymers I: Chitosan. Monatshefte fur Chemie 2009, 140, 1403–1420. [Google Scholar] [CrossRef]
- Szymańska, E.; Winnicka, K. Stability of Chitosan—A Challenge for Pharmaceutical and Biomedical Applications. Mar. Drugs 2015, 13, 1819–1846. [Google Scholar] [CrossRef]
- Anitha, A.; Sowmya, S.; Kumar, P.T.S.; Deepthi, S.; Chennazhi, K.P.; Ehrlich, H.; Tsurkan, M.; Jayakumar, R. Chitin and chitosan in selected biomedical applications. Prog. Polym. Sci. 2014, 39, 1644–1667. [Google Scholar] [CrossRef]
- Shao, L.; Chang, X.; Zhang, Y.; Huang, Y.; Yao, Y.; Guo, Z. Graphene oxide cross-linked chitosan nanocomposite membrane. Appl. Surf. Sci. 2013, 280, 989–992. [Google Scholar] [CrossRef]
- Rodríguez-Vázquez, M.; Vega-Ruiz, B.; Ramos-Zúñiga, R.; Saldaña-Koppel, D.A.; Quiñones-Olvera, L.F. Chitosan and its potential use as a scaffold for tissue engineering in regenerative medicine. Biomed Res. Int. 2015, 2015, 821279. [Google Scholar] [CrossRef]
- Kanimozhi, K.; Basha, S.K.; Kumari, V.S. Processing and characterization of chitosan/PVA and methylcellulose porous scaffolds for tissue engineering. Mater. Sci. Eng. C 2016, 61, 484–491. [Google Scholar] [CrossRef] [PubMed]
- Saber-Samandari, S.; Saber-Samandari, S. Biocompatible nanocomposite scaffolds based on copolymer-grafted chitosan for bone tissue engineering with drug delivery capability. Mater. Sci. Eng. C 2017, 75, 721–732. [Google Scholar] [CrossRef] [PubMed]
- Saravanan, S.; Anjali, C.; Vairamani, M.; Sastry, T.P.; Subramanian, K.S.; Selvamurugan, N. Scaffolds containing chitosan, gelatin and graphene oxide for bone tissue regeneration in vitro and in vivo. Int. J. Biol. Macromol. 2016, 104, 1975–1985. [Google Scholar] [CrossRef]
- Adhikari, U.; Rijal, N.P.; Khanal, S.; Pai, D.; Sankar, J.; Bhattarai, N. Magnesium incorporated chitosan-based scaffolds for tissue engineering applications. Bioact. Mater. 2016, 1, 132–139. [Google Scholar] [CrossRef] [PubMed]
- Ma, Q.; Liang, T.; Cao, L.; Wang, L. Intelligent poly (vinyl alcohol)-chitosan nanoparticles-mulberry extracts films capable of monitoring pH variations. Int. J. Biol. Macromol. 2018, 108, 576–584. [Google Scholar] [CrossRef]
- Wang, C.; Mallela, J.; Garapati, U.S.; Ravi, S.; Chinnasamy, V.; Girard, Y.; Howell, M.; Mohapatra, S. A chitosan-modified graphene nanogel for noninvasive controlled drug release. Nanomedicine 2013, 9, 903–911. [Google Scholar] [CrossRef] [PubMed]
- Simsek, E.B.; Saloglu, D.; Ozcan, N.; Novak, I.; Berek, D. Carbon fiber embedded chitosan/PVA composites for decontamination of endocrine disruptor bisphenol-A from water. J. Taiwan Inst. Chem. Eng. 2017, 70, 291–301. [Google Scholar] [CrossRef]
- Botas, C.; Álvarez, P.; Blanco, P.; Granda, M.; Blanco, C.; Santamaría, R.; Romasanta, L.J.; Verdejo, R.; López-Manchado, M.A.; Menéndez, R. Graphene materials with different structures prepared from the same graphite by the Hummers and Brodie methods. Carbon 2013, 65, 156–164. [Google Scholar] [CrossRef]
- Wang, Y.; Shen, C.; Lou, W.; Shentu, F. Fiber optic humidity sensor based on the graphene oxide/PVA composite film. Opt. Commun. 2016, 372, 229–234. [Google Scholar] [CrossRef]
- Ye, S.; Shao, K.; Li, Z.; Guo, N.; Zuo, Y.; Li, Q.; Lu, Z.; Chen, L.; He, Q.; Han, H. Antiviral activity of graphene oxide: How sharp edged structure and charge matter. ACS Appl. Mater. Interfaces 2015, 7, 21571–21579. [Google Scholar] [CrossRef]
- Mangadlao, J.D.; de Leon, A.C.C.; Felipe, M.J.L.; Cao, P.; Advincula, P.A.; Advincula, R.C. Grafted carbazole-assisted electrodeposition of graphene oxide. ACS Appl. Mater. Interfaces 2015, 7, 10266–10274. [Google Scholar] [CrossRef]
- Liu, M.; Zhou, Y.; Zhang, Y.; Yu, C.; Cao, S. Preparation and structural analysis of chitosan films with and without sorbitol. Food Hydrocoll. 2013, 33, 186–191. [Google Scholar] [CrossRef]
- Kokubo, T.; Takadama, H. How useful is SBF in predicting in vivo bone bioactivity? Biomaterials 2006, 27, 2907–2915. [Google Scholar] [CrossRef]
- Valencia, C.; Valencia, C.; Zuluaga, F.; Valencia, M.; Mina, J.; Grande-Tovar, C. Synthesis and application of scaffolds of chitosan-graphene oxide by the freeze-drying method for tissue regeneration. Molecules 2018, 23, 2651. [Google Scholar] [CrossRef]
- Lopez mata, C.; Aguilar, J.; Peña, Y. Caracterización óptica y morfologica de materiales compuestos de P3OT y nanotubos de carbono funcionalizados. Química Hoy 2012, 2, 18–23. [Google Scholar]
- Nikkhah, S.; Tahermansouri, H.; Chekin, F. Synthesis, characterization, and electrochemical properties of the modified graphene oxide with 4,4′-methylenedianiline. Mater. Lett. 2018, 211, 323–327. [Google Scholar] [CrossRef]
- Saleem, H.; Haneef, M.; Abbasi, H.Y. Synthesis route of reduced graphene oxide via thermal reduction of chemically exfoliated graphene oxide. Mater. Chem. Phys. 2018, 204, 1–7. [Google Scholar] [CrossRef]
- Martínez, V.G.; Lopez, R.M.; Velasco, C.B. Estudio de la Estabilidad del Óxido de Grafeno con el Tiempo. Master’s Thesis, Universidad de Oviedo, Asturias, Spain, 2013. [Google Scholar]
- Goumri, M.; Poilâne, C.; Ruterana, P.; Doudou, B.B.; Wéry, J.; Bakour, A.; Baitoul, M. Synthesis and characterization of nanocomposites films with graphene oxide and reduced graphene oxide nanosheets. Chin. J. Phys. 2017, 55, 412–422. [Google Scholar] [CrossRef]
- Liu, B.; Zhang, D.; Li, X.; He, Z.; Guo, X.; Liu, Z.; Guo, Q. Effect of graphite flakes particle sizes on the microstructure and properties of graphite flakes/copper composites. J. Alloys Compd. 2018, 766, 382–390. [Google Scholar] [CrossRef]
- Bao, C.; Guo, Y.; Song, L.; Hu, Y. Poly(vinyl alcohol) nanocomposites based on graphene and graphite oxide: A comparative investigation of property and mechanism. J. Mater. Chem. 2011, 21, 13942–13950. [Google Scholar] [CrossRef]
- Morimune, S.; Nishino, T.; Goto, T. Poly(vinyl alcohol)/graphene oxide nanocomposites prepared by a simple eco-process. Polym. J. 2012, 44, 1056–1063. [Google Scholar] [CrossRef]
- Ionita, M.; Vasile, E.; Crica, L.E.; Voicu, S.I.; Pandele, A.M.; Dinescu, S.; Predoiu, L.; Galateanu, B.; Hermenean, A.; Costache, M. Synthesis, characterization and in vitro studies of polysulfone/graphene oxide composite membranes. Compos. Part B Eng. 2015, 72, 108–115. [Google Scholar] [CrossRef]
- Pandele, A.M.; Ionita, M.; Crica, L.; Dinescu, S.; Costache, M.; Iovu, H. Synthesis, characterization, and in vitro studies of graphene oxide/chitosan-polyvinyl alcohol films. Carbohydr. Polym. 2014, 102, 813–820. [Google Scholar] [CrossRef]
- Pei, S.; Wei, Q.; Huang, K.; Cheng, H.M.; Ren, W. Green synthesis of graphene oxide by seconds timescale water electrolytic oxidation. Nat. Commun. 2018, 9, 145. [Google Scholar] [CrossRef] [PubMed]
- López-Díaz, D.; Holgado, M.L.; García-Fierro, J.L.; Velázquez, M.M. Evolution of the Raman spectrum with the chemical composition of graphene oxide. J. Phys. Chem. C 2017, 121, 20489–20497. [Google Scholar] [CrossRef]
- Pinotti, A.; García, M.A.; Martino, M.N.; Zaritzky, N.E. Study on microstructure and physical properties of composite films based on chitosan and methylcellulose. Food Hydrocoll. 2007, 21, 66–72. [Google Scholar] [CrossRef]
- Yadav, I.; Nayak, S.K.; Rathnam, V.S.; Banerjee, I.; Ray, S.S.; Anis, A.; Pal, K. Reinforcing effect of graphene oxide reinforcement on the properties of poly (vinyl alcohol) and carboxymethyl tamarind gum based phase-separated film. J. Mech. Behav. Biomed. Mater. 2018, 81, 61–71. [Google Scholar] [CrossRef]
- Khan, Y.H.; Islam, A.; Sarwar, A.; Gull, N.; Khan, S.M.; Munawar, M.A.; Zia, S.; Sabir, A.; Shafiq, M.; Jamil, T. Novel green nanocomposites films fabricated by indigenously synthesized graphene oxide and chitosan. Carbohydr. Polym. 2016, 146, 131–138. [Google Scholar] [CrossRef] [PubMed]
- Ruan, J.; Wang, X.; Yu, Z.; Wang, Z.; Xie, Q.; Zhang, D.; Huang, Y.; Zhou, H.; Bi, X.; Xiao, C.; et al. Enhanced physiochemical and mechanical performance of chitosan-grafted graphene oxide for superior osteoinductivity. Adv. Funct. Mater. 2016, 26, 1085–1097. [Google Scholar] [CrossRef]
- Maldonado, E.F. Degradación Hidrolítica a Diferentes pH de un Material Compuesto Poli(ácido láctico)/Quitosano; Trabajo de Grado, Universidad Simón Bolívar: Sartenejas, Venezuela, 2008. [Google Scholar]
- Depan, D.; Shah, J.S.; Misra, R.D.K. Degradation mechanism and increased stability of chitosan-based hybrid scaffolds cross-linked with nanostructured carbon: Process-structure-functional property relationship. Polym. Degrad. Stab. 2013, 98, 2331–2339. [Google Scholar] [CrossRef]
- American Society of Testing Materials. ASTM F1635-16, Standard Test Method for In Vitro Degradation Testing of Hydrolytically Degradable Polymer Resins and Fabricated Forms for Surgical Implants; American Society of Testing Materials: West Conshohocken, PA, USA, 2016; pp. 1–5. [Google Scholar]
- Fiñana, I.T.; Cejudo, A.G.; Fernández, E. pH y amortiguadores: Tampones fisiológicos. Amortiguadoras 2001, 3, 1–11. [Google Scholar]
- Maruyama, M.; Ito, M. In vitro properties of a chitosan-bonded self-hardening paste with hydroxyapatite granules. J. Biomed. Mater. Res. 1996, 32, 527–532. [Google Scholar] [CrossRef]
- Mokhtari, H.; Ghasemi, Z.; Kharaziha, M.; Karimzadeh, F.; Alihosseini, F. Chitosan-58S bioactive glass nanocomposite coatings on TiO2 nanotube: Structural and biological properties. Appl. Surf. Sci. 2018, 441, 138–149. [Google Scholar] [CrossRef]
- Solís, Y.; Davidenko, N.; Carrodeguas, R.G.; Cruz, J.; Hernández, A.; Cameron, R.E.; Peniche, C. Evaluación in vitro de composites basados en quitosana e hidroxiapatita. IFMBE Proc. 2013, 33, 96–99. [Google Scholar]
- Hall-Stoodley, L.; Costerton, J.W.; Stoodley, P. Bacterial biofilms: From the natural environment to infectious diseases. Nat. Rev. Microbiol. 2004, 2, 95–108. [Google Scholar] [CrossRef] [PubMed]
- Schelegueda, L.I.; Gliemmo, M.; Campos, C.A. Action of chitosan, nisin, and sodium lactate on the inhibition and cell membrane damage of Listeria innocua and Shewanella putrefaciens. In Worldwide Research Efforts in the Fighting against Microbial Pathogens: From Basic Research to Technological Developments; Méndez-Vilas, A., Ed.; Brown Walker Press: Boca Raton, FL, USA, 2013; pp. 3–7. [Google Scholar]
- Zivanovic, S.; Chi, S.; Draughon, A.F. Antimicrobial activity of chitosan films enriched with essential oils. J. Food Sci. 2005, 70, M45–M51. [Google Scholar] [CrossRef]
- Zu, Y.; Zhang, Y.; Zhao, X.; Shan, C.; Zu, S.; Wang, K.; Li, Y.; Ge, Y. Preparation and characterization of chitosan–polyvinyl alcohol blend hydrogels for the controlled release of nano-insulin. Int. J. Biol. Macromol. 2012, 50, 82–87. [Google Scholar] [CrossRef] [PubMed]
- Grande-Tovar, C.D.; Serio, A.; Delgado-Ospina, J.; Paparella, A.; Rossi, C.; Chaves-Lopez, C. Chitosan films incorporated with Thymus capitatus essential oil: Mechanical properties and antimicrobial activity against degradative bacterial species isolated from tuna (Thunnus sp.) and swordfish (Xiphias gladius). J. Food Sci. Technol. 2018, 55, 4256–4265. [Google Scholar] [CrossRef] [PubMed]
- Akhavan, O.; Ghaderi, E. Toxicity of graphene and graphene oxide nanowalls against bacteria. ACS Nano 2010, 4, 5731–5736. [Google Scholar] [CrossRef]
- Chen, H.; Gao, D.; Wang, B.; Zhao, R.F.; Guan, M.; Zheng, L.N.; Zhou, X.Y.; Chai, Z.F.; Feng, W.Y. Graphene oxide as an anaerobic membrane scaffold for the enhancement of B. adolescentis proliferation and antagonistic effects against pathogens E. coli and S. aureus. Nanotechnology 2014, 25, 165101. [Google Scholar] [CrossRef] [PubMed]
- Liu, S.; Zeng, T.H.; Hofmann, M.; Burcombe, E.; Wei, J.; Jiang, R.; Kong, J.; Chen, Y. Antibacterial activity of graphite, graphite oxide, graphene oxide, and reduced graphene oxide: Membrane and oxidative stress. ACS Nano 2011, 5, 6971–6980. [Google Scholar] [CrossRef] [PubMed]
- Kumar, S.; Raj, S.; Kolanthai, E.; Sood, A.K.; Sampath, S.; Chatterjee, K. Chemical functionalization of graphene to augment stem cell osteogenesis and inhibit biofilm formation on polymer composites for orthopedic applications. ACS Appl. Mater. Interfaces 2015, 7, 3237–3252. [Google Scholar] [CrossRef] [PubMed]
- Castrillón, S.R.; Perreault, F.; de Faria, A.F.; Elimelech, M. Interaction of graphene oxide with bacterial cell membranes: Insights from force spectroscopy. Environ. Sci. Technol. Lett. 2015, 2, 112–117. [Google Scholar] [CrossRef]
- Hu, W.; Peng, C.; Luo, W.; Lv, M.; Li, X.; Li, D.; Huang, Q.; Fan, C. Graphene-based antibacterial paper. ACS Nano 2010, 4, 4317–4323. [Google Scholar] [CrossRef]
- Gurunathan, S.; Han, J.W.; Dayem, A.A.; Eppakayala, V.; Kim, J.H. Oxidative stress-mediated antibacterial activity of graphene oxide and reduced graphene oxide in Pseudomonas aeruginosa. Int. J. Nanomed. 2012, 7, 5901–5914. [Google Scholar] [CrossRef] [PubMed]
- Fan, J.; Grande, C.D.; Rodrigues, D.F. Biodegradation of graphene oxide-polymer nanocomposite films in wastewater. Environ. Sci. Nano 2017, 4, 1808–1816. [Google Scholar] [CrossRef]
- Perreault, F.; de Faria, A.F.; Nejati, S.; Elimelech, M. Antimicrobial properties of graphene oxide nanosheets: Why size matters. ACS Nano 2015, 9, 7226–7236. [Google Scholar] [CrossRef] [PubMed]
- Anderson, J.M.; Rodriguez, A.; Chang, D.T. Foreign body reaction to biomaterials. Semin. Immunol. 2008, 20, 86–100. [Google Scholar] [CrossRef]
- Van Putten, S.M.; Ploeger, D.T.A.; Popa, E.R.; Bank, R.A. Macrophage phenotypes in the collagen-induced foreign body reaction in rats. Acta Biomater. 2013, 9, 6502–6510. [Google Scholar] [CrossRef]
- Klopfleisch, R. Macrophage reaction against biomaterials in the mouse model—Phenotypes, functions, and markers. Acta Biomater. 2016, 43, 3–13. [Google Scholar] [CrossRef] [PubMed]
- Qian, Y.; Li, L.; Song, Y.; Dong, L.; Chen, P.; Li, X.; Cai, K.; Germershaus, O.; Yang, L.; Fan, Y. Surface modification of nanofibrous matrices via layer-by-layer functionalized silk assembly for mitigating the foreign body reaction. Biomaterials 2018, 164, 22–37. [Google Scholar] [CrossRef] [PubMed]
- Mariana, I.; Mihail, G.; Aiza, W.; Stefan, I.; Burns, J.S.; Iovu, H. Graphene and functionalized graphene: Extraordinary prospects for nanobiocomposite materials. Compos. Part B 2017, 121, 34–57. [Google Scholar]
- Ryon, S.; Li, Y.C.; Jang, H.L.; Khoshakhlagh, P.; Akbari, M.; Nasajpour, A.; Zhang, Y.S.; Tamayol, A.; Khademhosseini, A. Graphene-based materials for tissue engineering. Adv. Drug Deliv. Rev. 2016, 105, 255–274. [Google Scholar]


| Component | F1 | F2 | F3 | F4 | F5 |
|---|---|---|---|---|---|
| CS (wt %) | 20 | 14.75 | 19.5 | 14.25 | 29 |
| PVA (wt%) | 80 | 85 | 80 | 85 | 70 |
| GO (wt %) | 0 | 0.25 | 0.5 | 0.75 | 1 |
| Material | Diffraction Peak (°) | Interlayer Distance (nm) |
|---|---|---|
| Graphite | 26.46 | 0.336 |
| GO | 10.77 | 0.82 |
| Strain | F1 | F2 | F3 | F4 | F5 |
|---|---|---|---|---|---|
| Bacillus cereus | --- | ++ | ++ | +++ | +++ |
| Staphylococcus aureus | --- | ++ | ++ | +++ | +++ |
| Salmonella spp | --- | -- | ++ | +++ | +++ |
| Escherichia coli | --- | ++ | ++ | +++ | +++ |
© 2019 by the authors. Licensee MDPI, Basel, Switzerland. This article is an open access article distributed under the terms and conditions of the Creative Commons Attribution (CC BY) license (http://creativecommons.org/licenses/by/4.0/).
Share and Cite
Ruiz, S.; Tamayo, J.A.; Delgado Ospina, J.; Navia Porras, D.P.; Valencia Zapata, M.E.; Mina Hernandez, J.H.; Valencia, C.H.; Zuluaga, F.; Grande Tovar, C.D. Antimicrobial Films Based on Nanocomposites of Chitosan/Poly(vinyl alcohol)/Graphene Oxide for Biomedical Applications. Biomolecules 2019, 9, 109. https://doi.org/10.3390/biom9030109
Ruiz S, Tamayo JA, Delgado Ospina J, Navia Porras DP, Valencia Zapata ME, Mina Hernandez JH, Valencia CH, Zuluaga F, Grande Tovar CD. Antimicrobial Films Based on Nanocomposites of Chitosan/Poly(vinyl alcohol)/Graphene Oxide for Biomedical Applications. Biomolecules. 2019; 9(3):109. https://doi.org/10.3390/biom9030109
Chicago/Turabian StyleRuiz, Sebastián, Julián Andrés Tamayo, Johannes Delgado Ospina, Diana Paola Navia Porras, Mayra Eliana Valencia Zapata, José Herminsul Mina Hernandez, Carlos Humberto Valencia, Fabio Zuluaga, and Carlos David Grande Tovar. 2019. "Antimicrobial Films Based on Nanocomposites of Chitosan/Poly(vinyl alcohol)/Graphene Oxide for Biomedical Applications" Biomolecules 9, no. 3: 109. https://doi.org/10.3390/biom9030109
APA StyleRuiz, S., Tamayo, J. A., Delgado Ospina, J., Navia Porras, D. P., Valencia Zapata, M. E., Mina Hernandez, J. H., Valencia, C. H., Zuluaga, F., & Grande Tovar, C. D. (2019). Antimicrobial Films Based on Nanocomposites of Chitosan/Poly(vinyl alcohol)/Graphene Oxide for Biomedical Applications. Biomolecules, 9(3), 109. https://doi.org/10.3390/biom9030109