Cellular and Immunohistochemical Changes in Anaphylactic Shock Induced in the Ovalbumin-Sensitized Wistar Rat Model

Abstract
:1. Introduction
2. Results
2.1. Blood Pressure and Heart Rate After Induction of AS with Ovalbumin Challenge
2.2. Histological Evaluation of H&E-Stained Tissue Sections
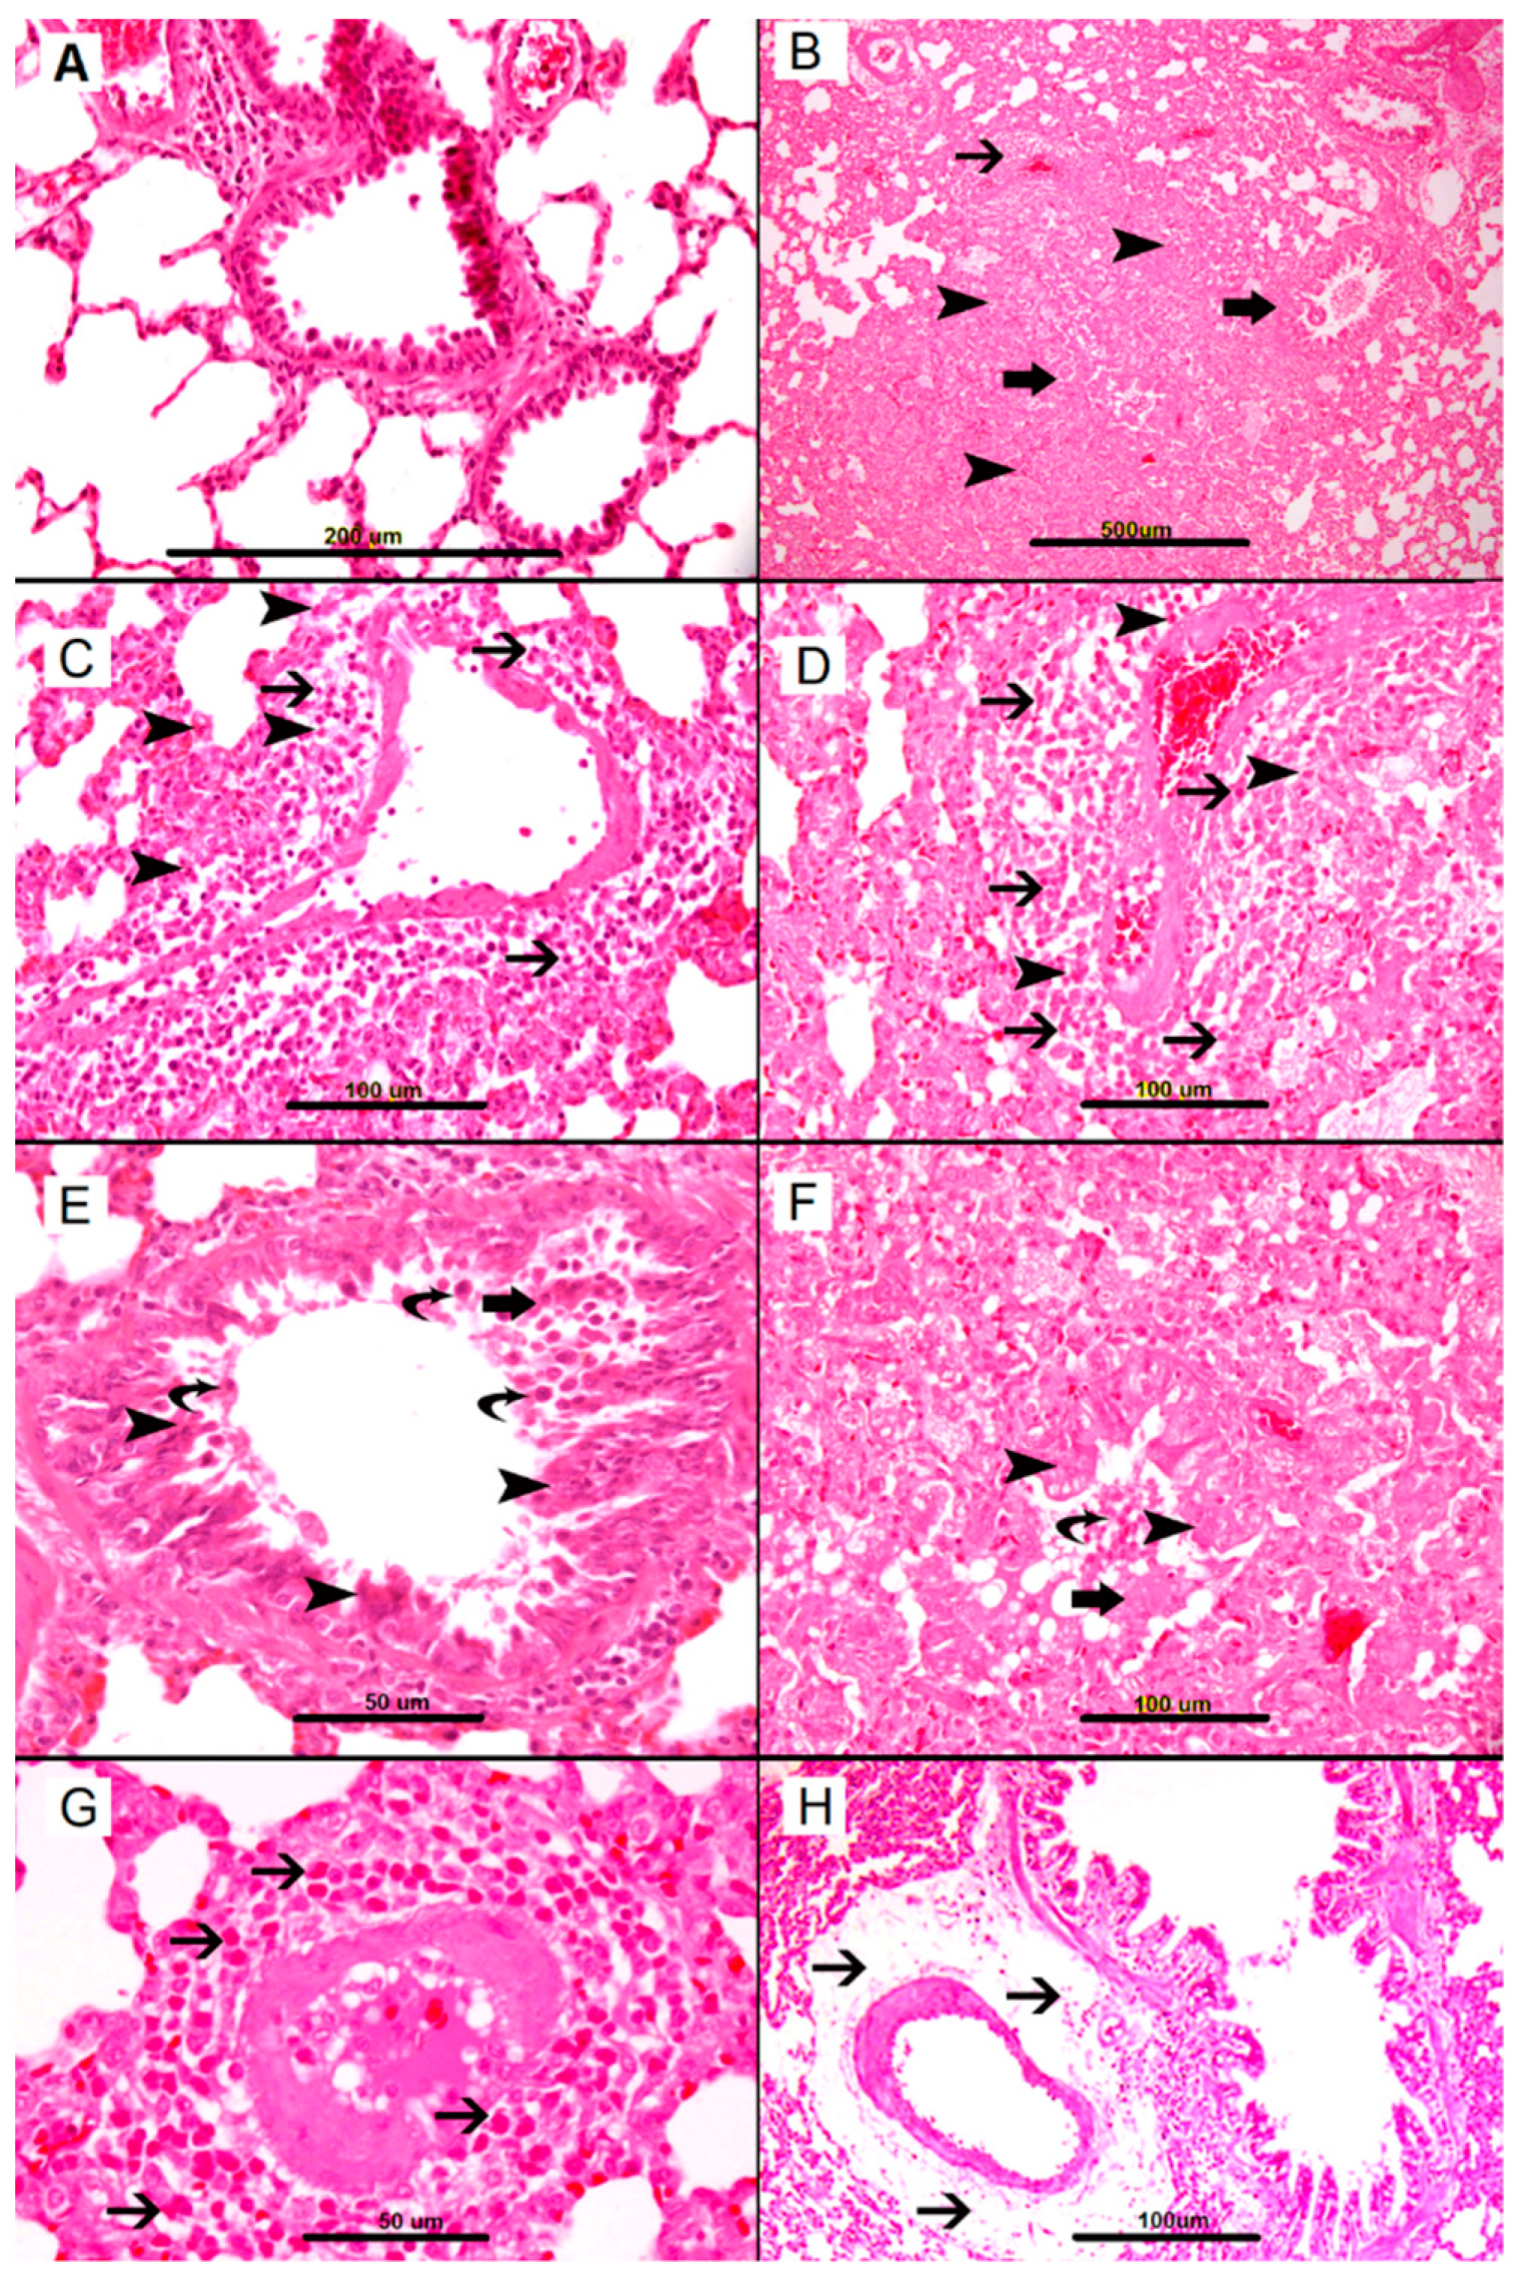
2.2.1. Lungs
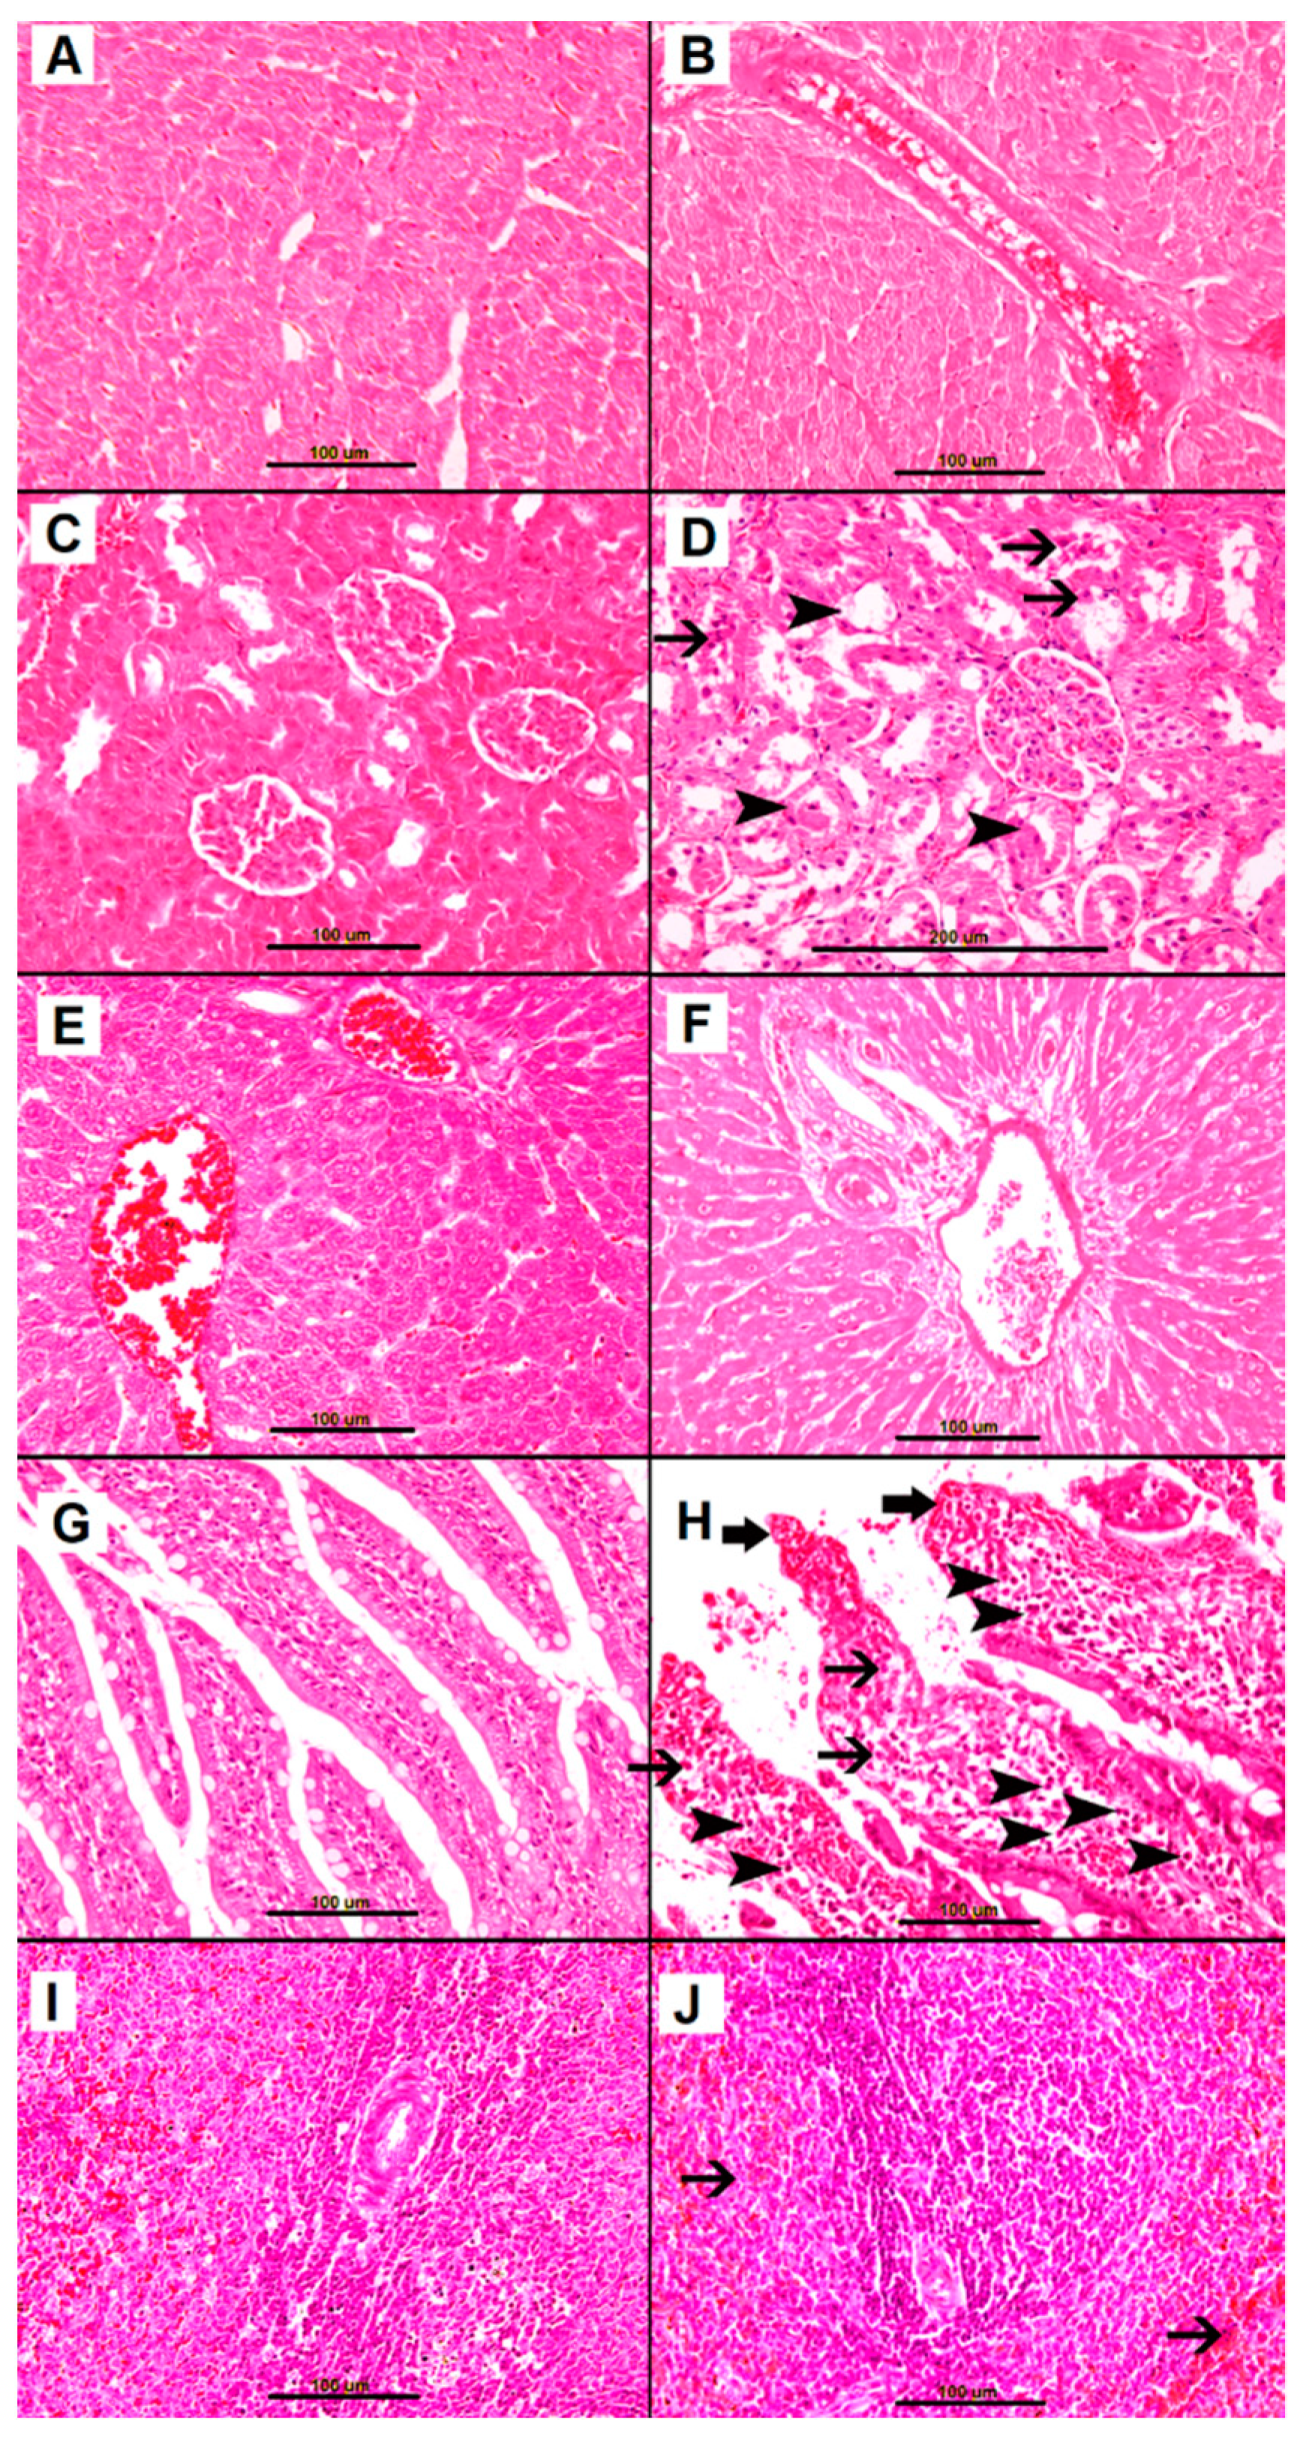
2.2.2. Heart
2.2.3. Kidney
2.2.4. Livers
2.2.5. Small Bowel
2.2.6. Spleen
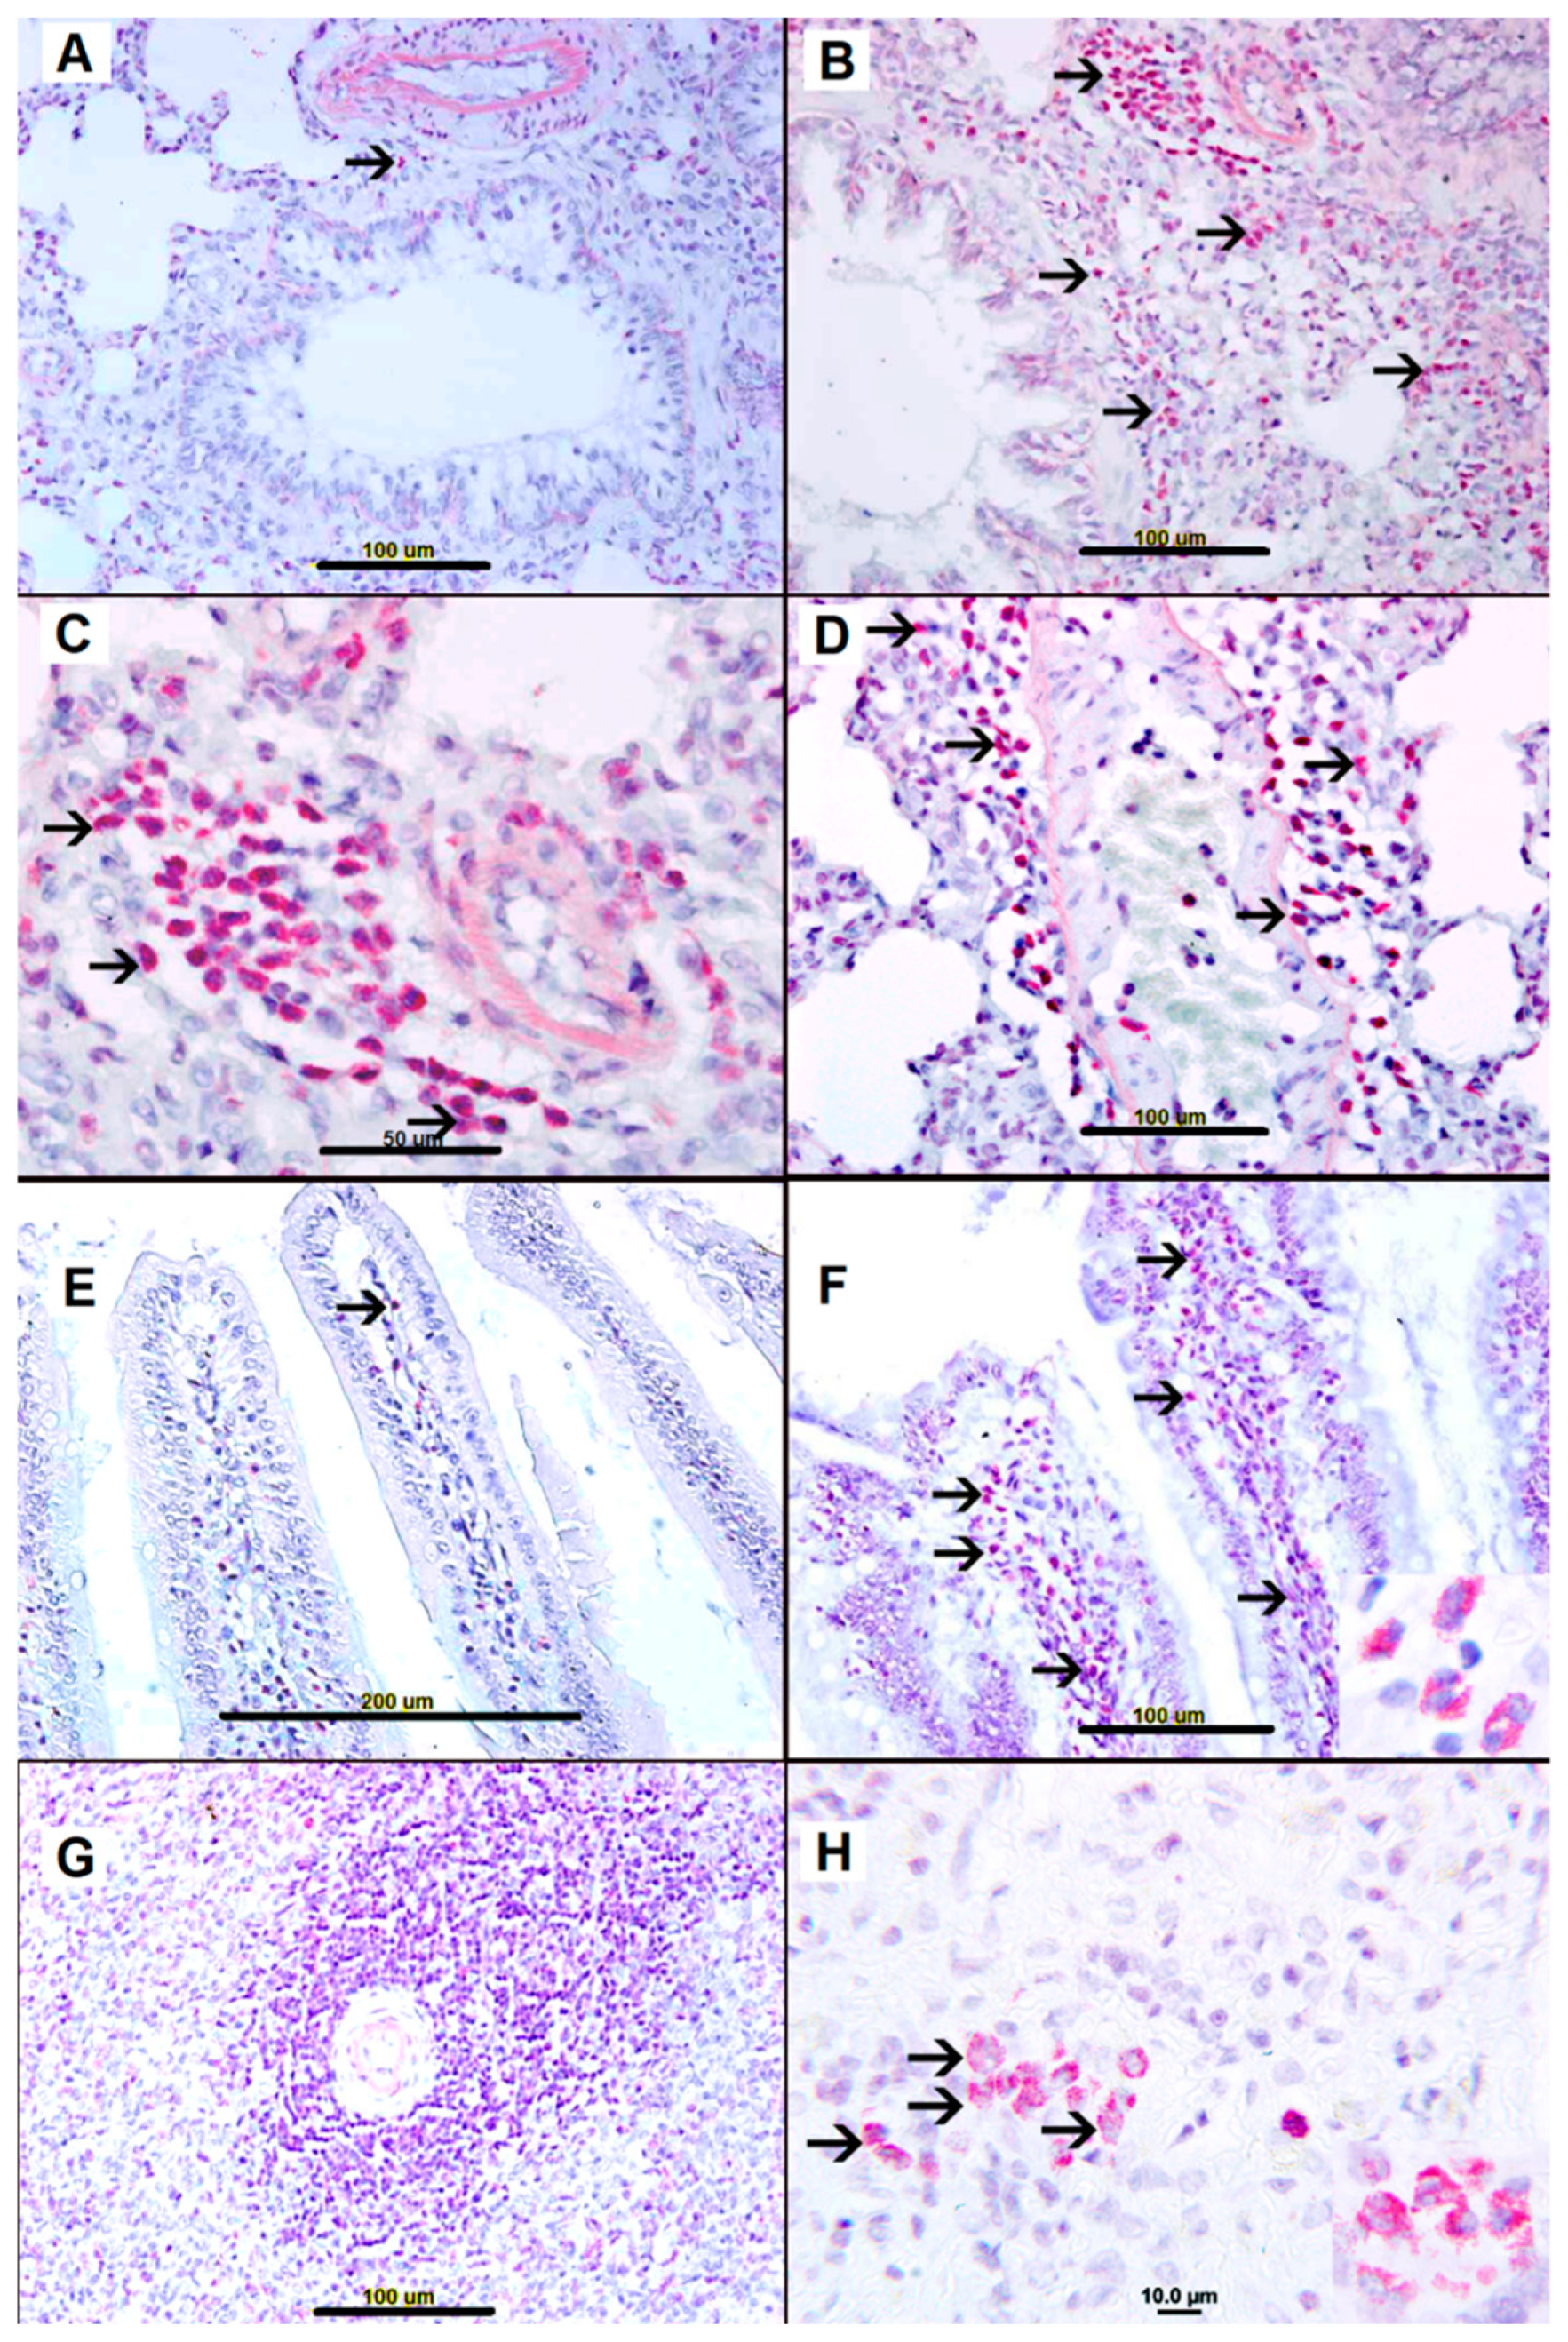
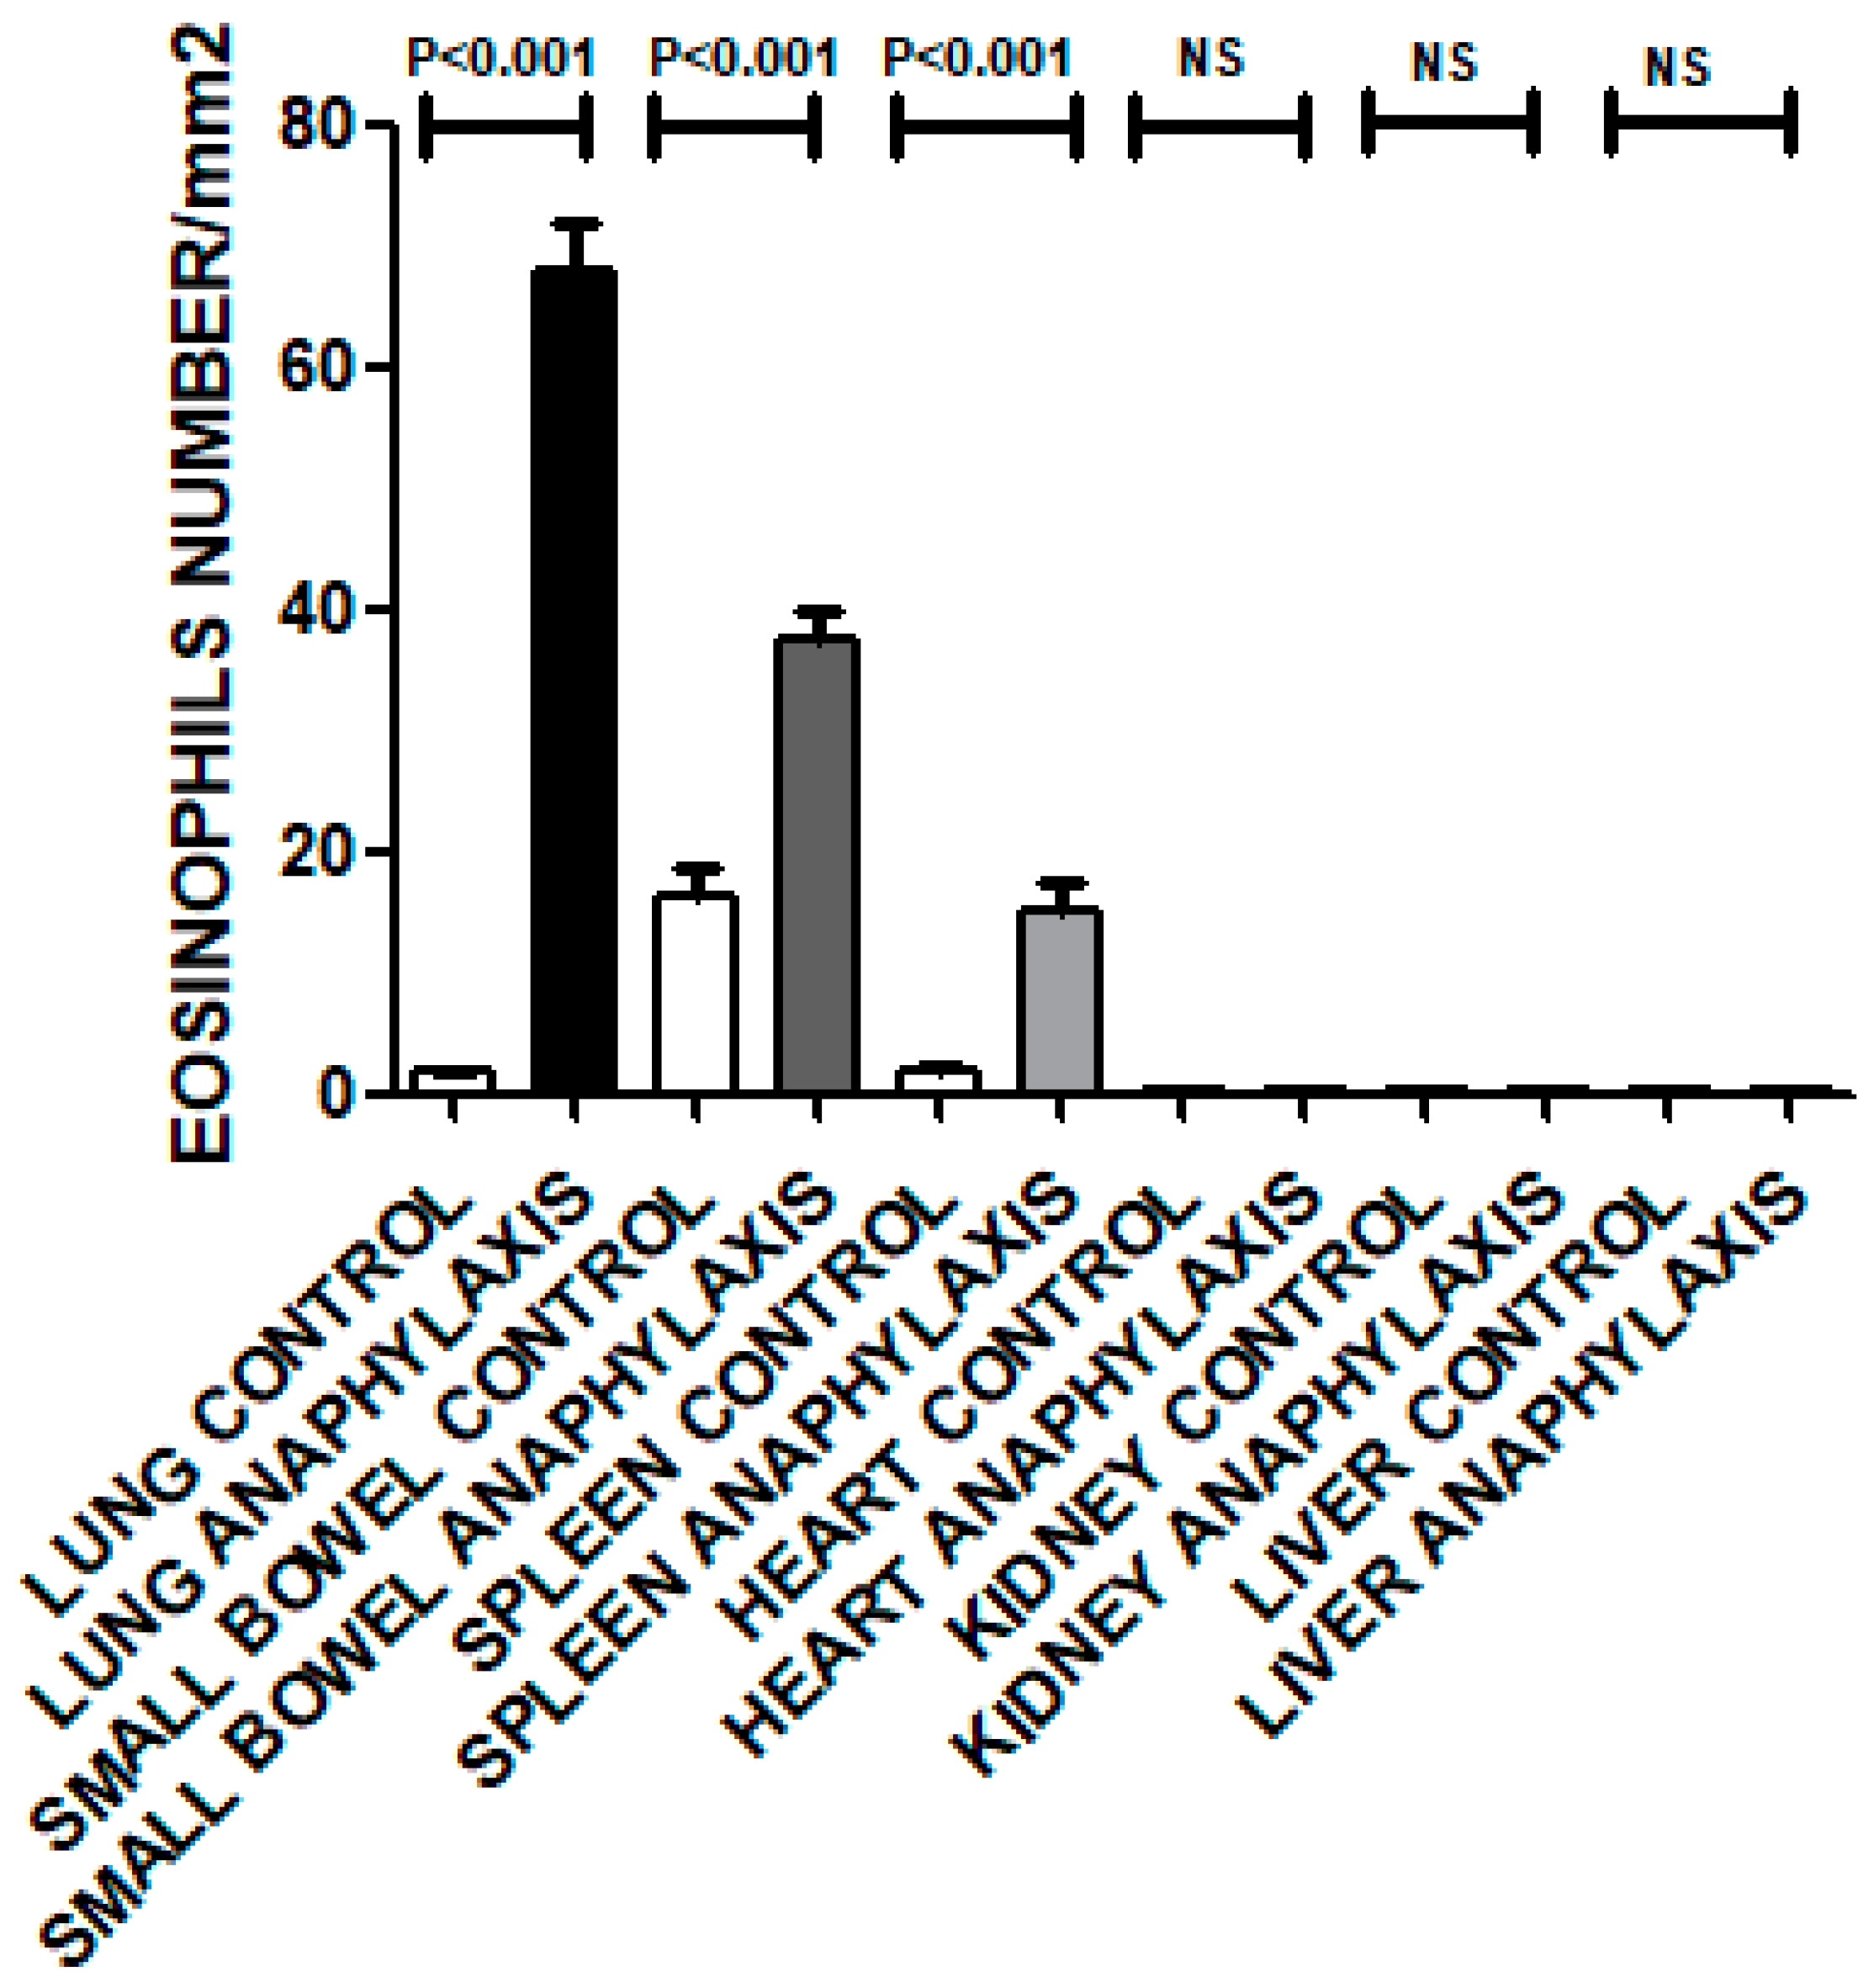
2.3. Sirius Red Staining for Eosinophils
2.4. Immunohistochemistry Studies
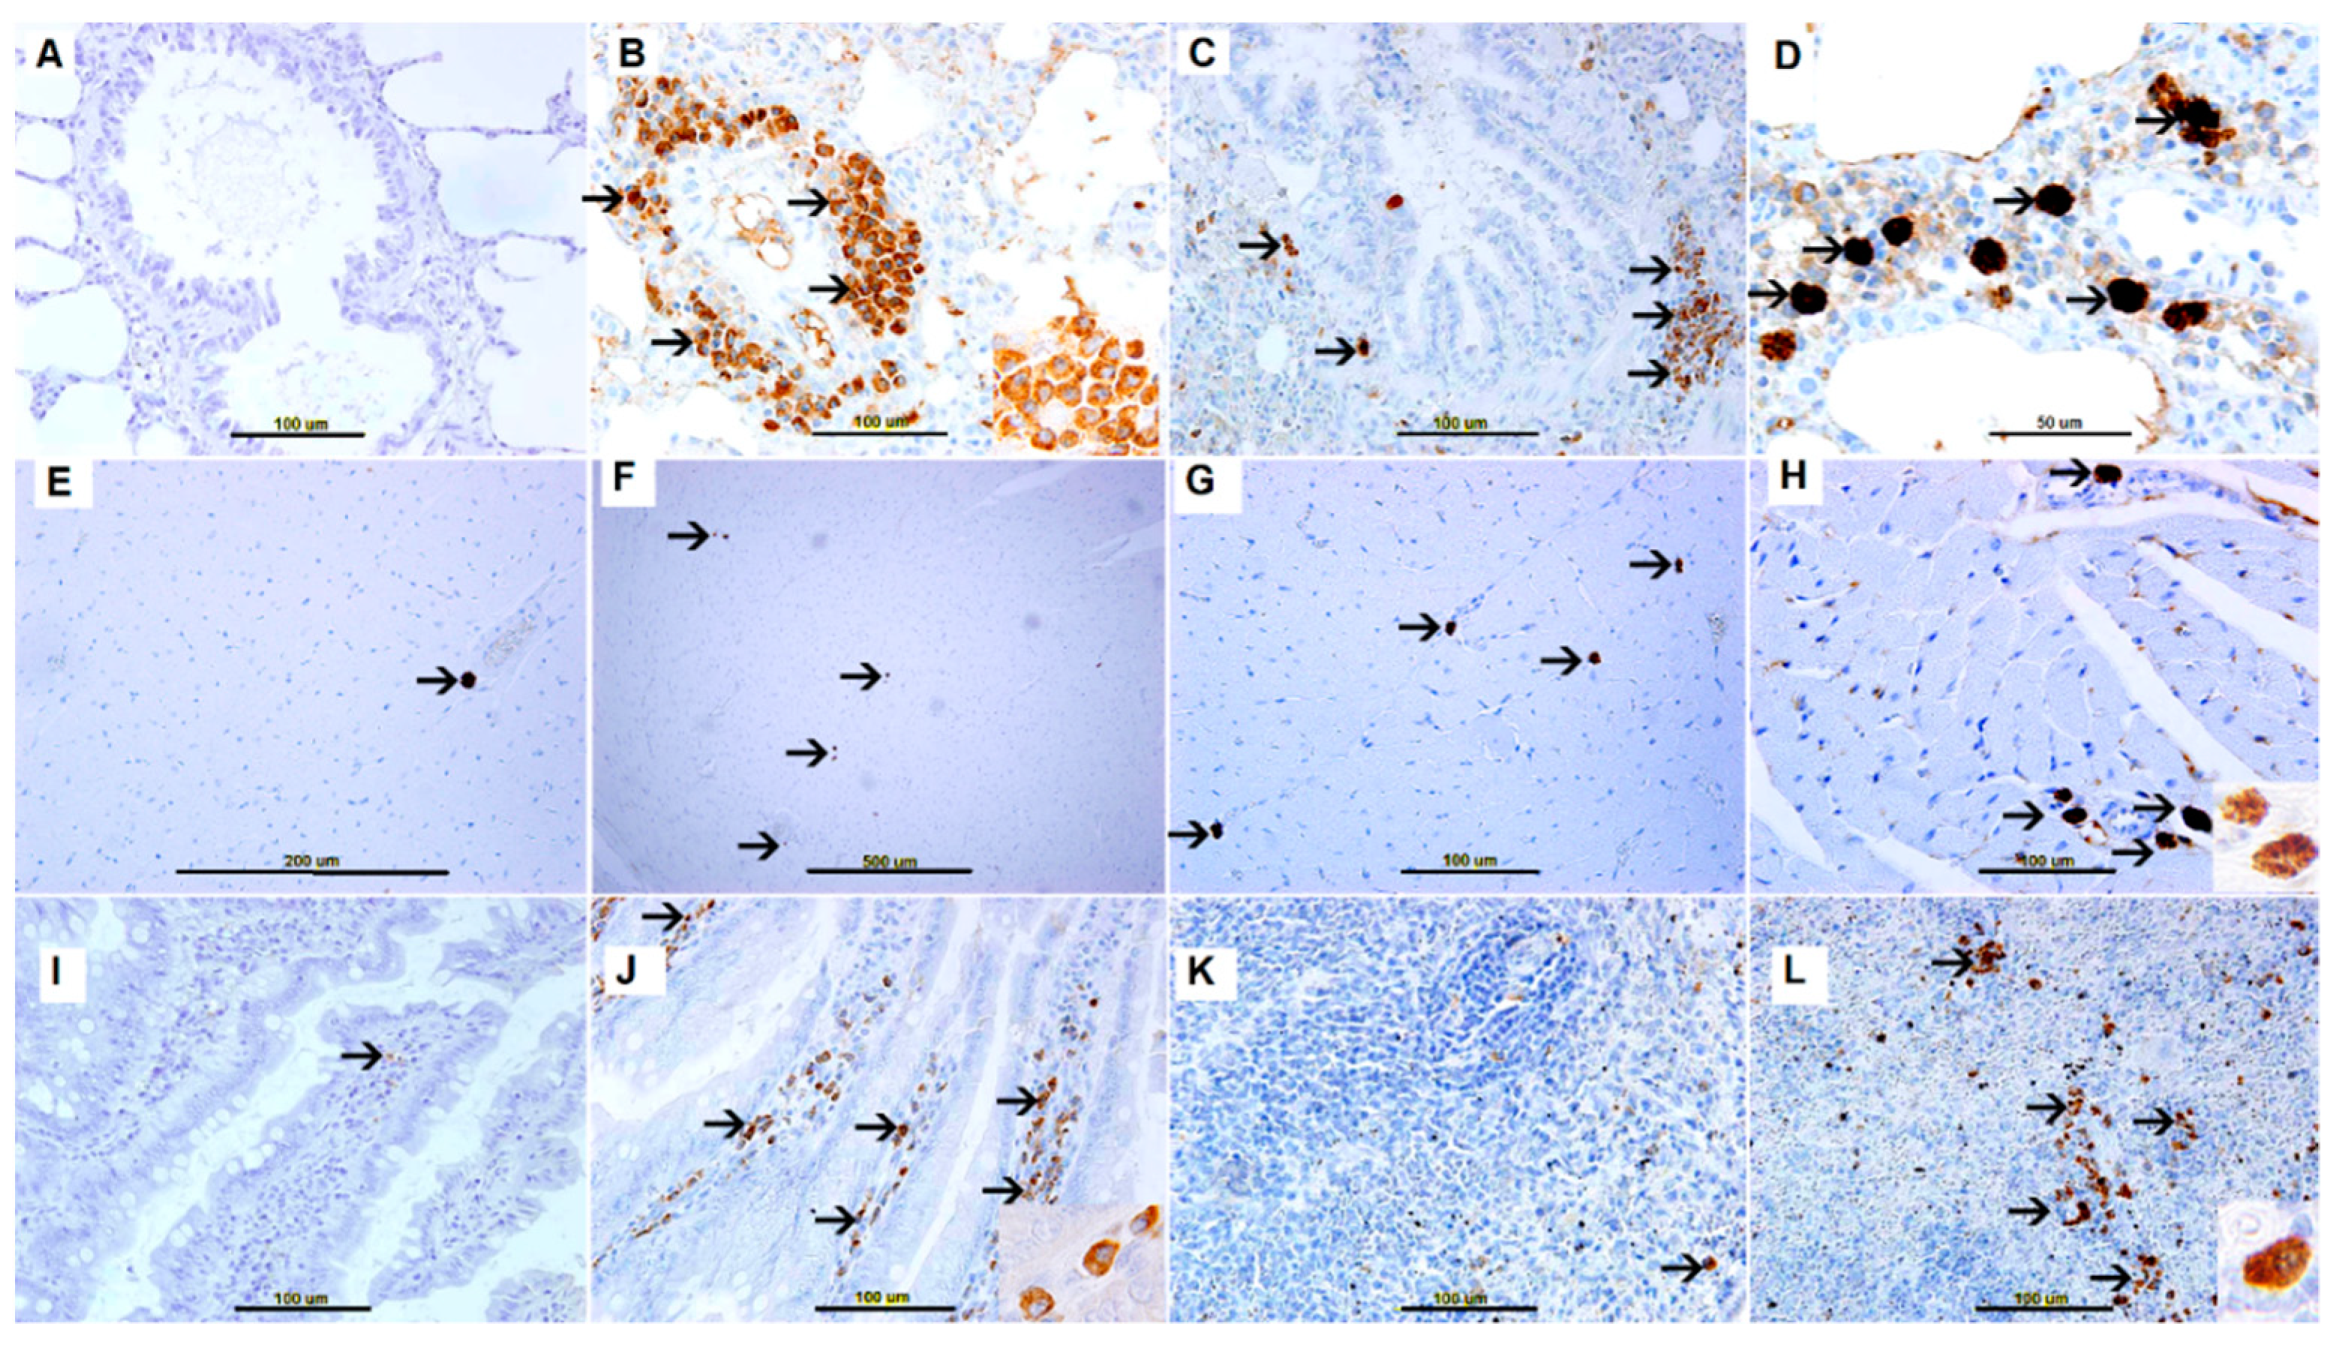
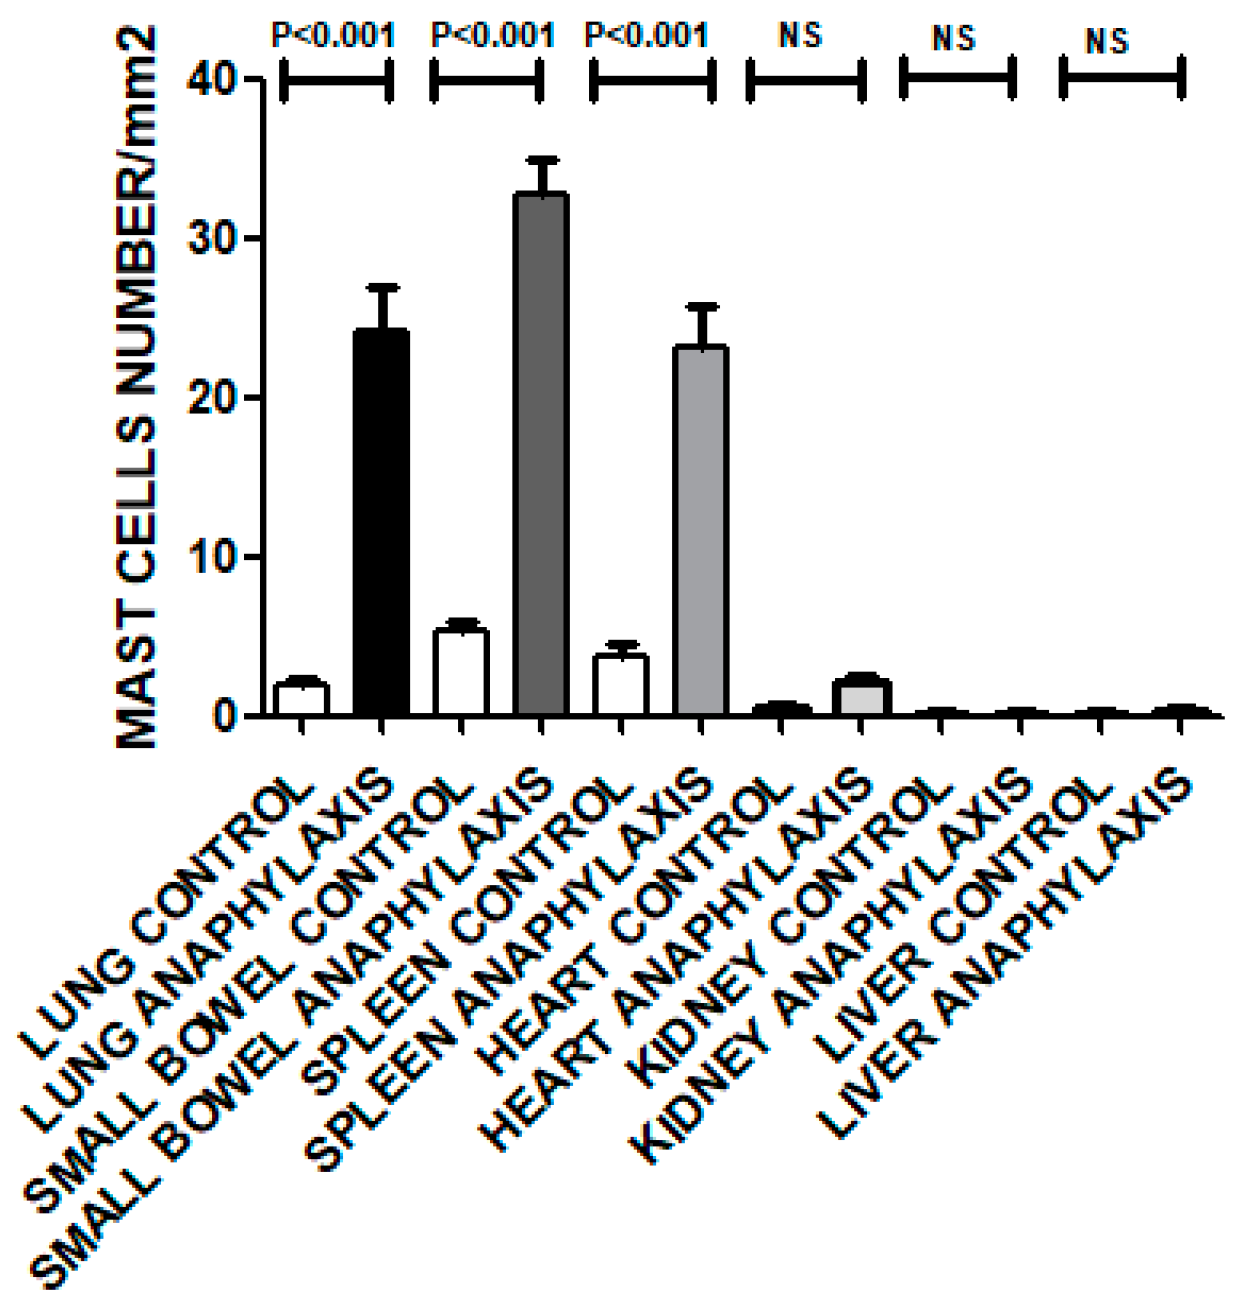
2.4.1. Tryptase Expression
2.4.2. c-KIT Staining
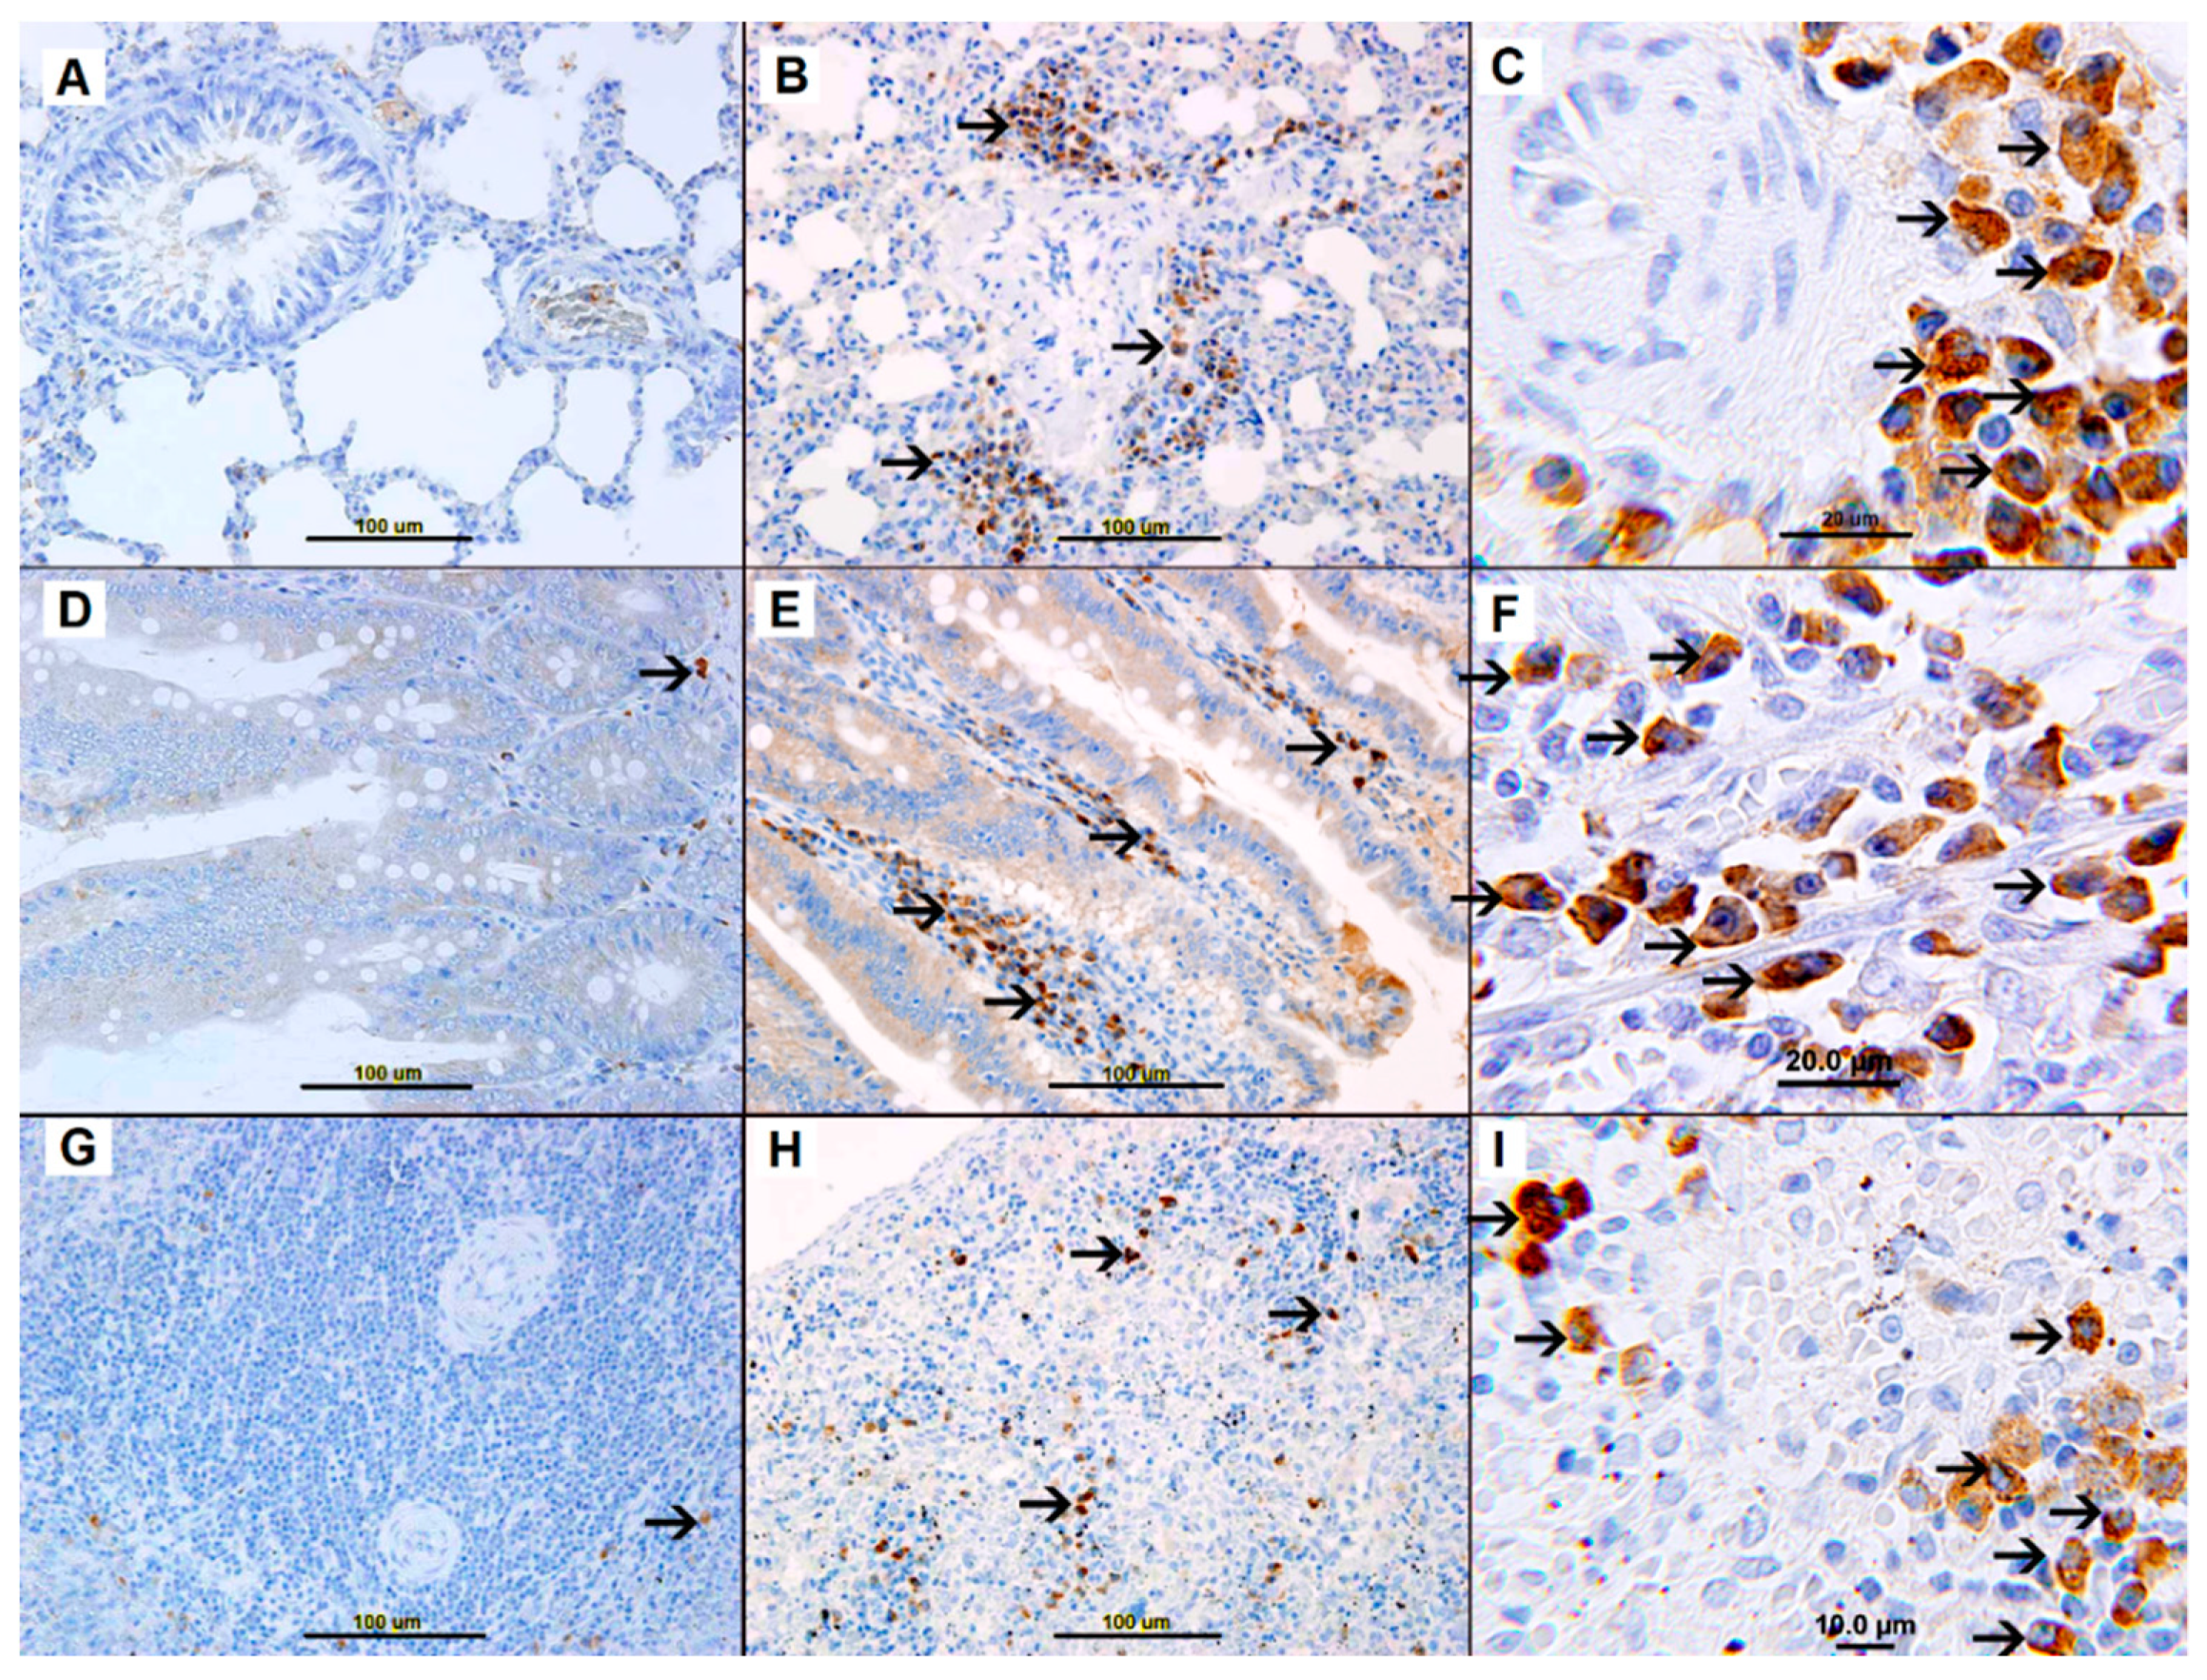
2.4.3. iNOS Staining
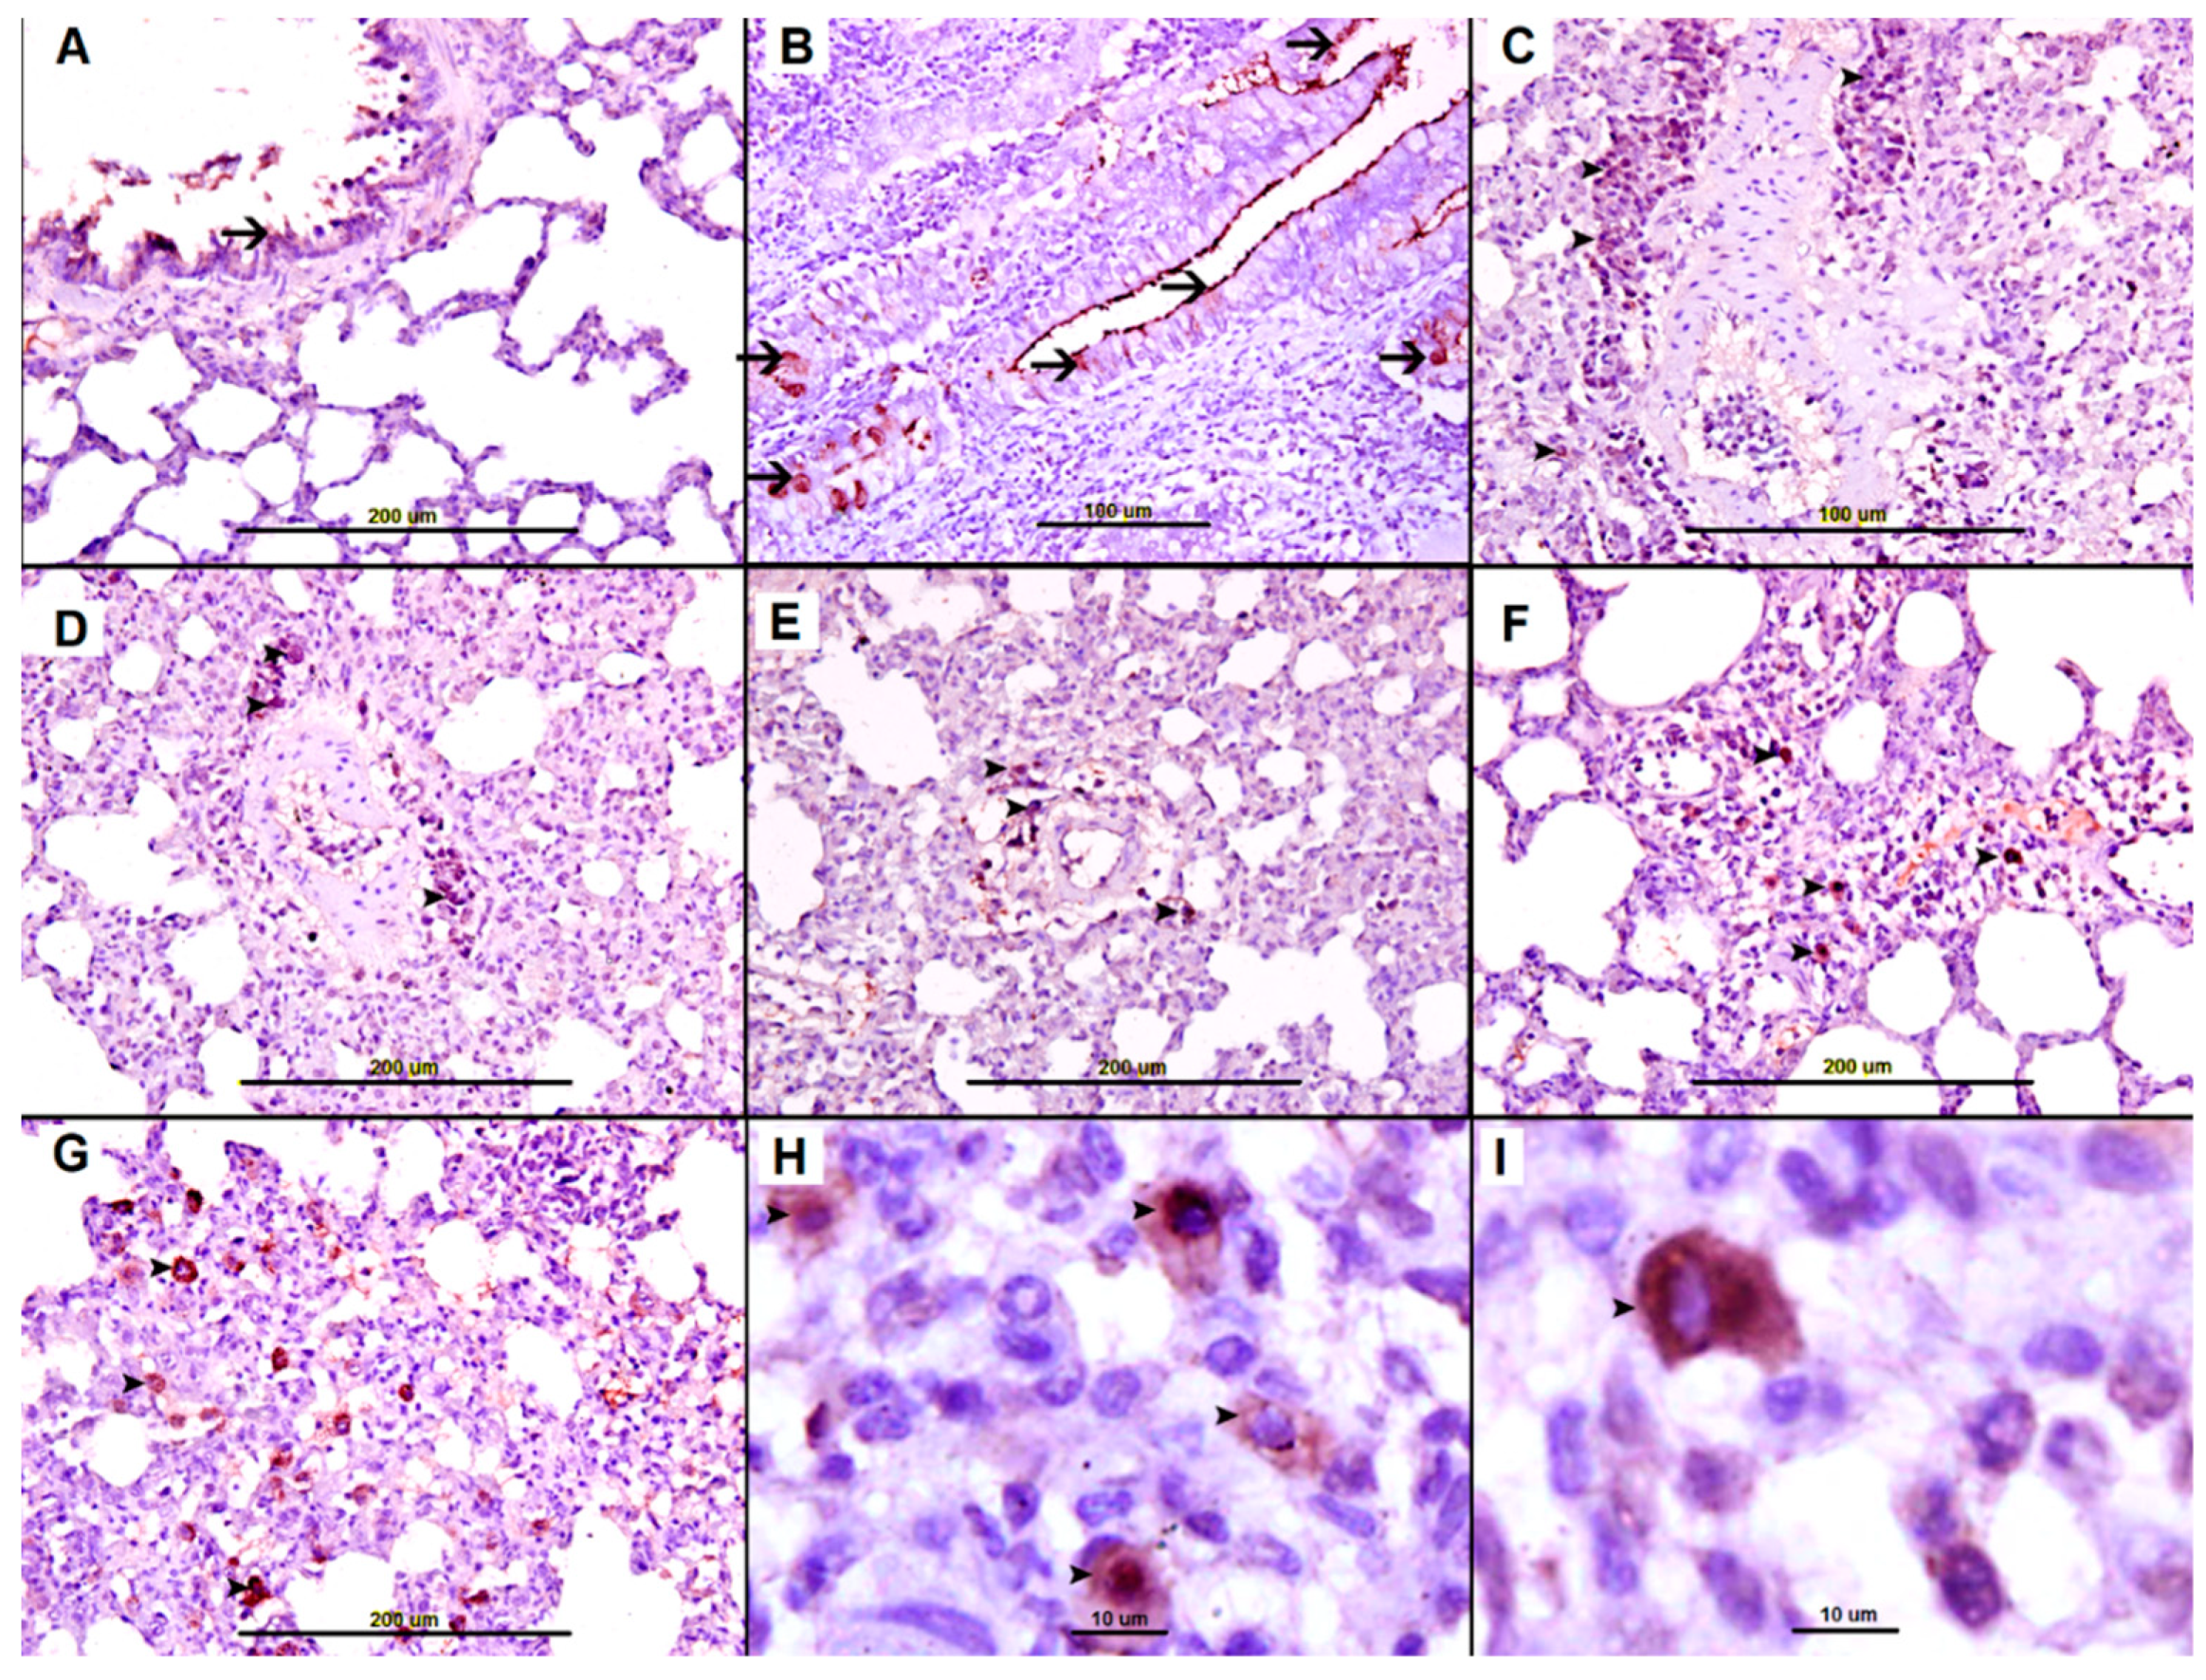
2.4.4. eNOS Staining
3. Discussion
4. Materials and Methods
4.1. Ethical Approval
4.2. Animals and Immunization and Treatment Protocol
4.3. Induction and Monitoring of Anaphylactic Shock
4.4. Tissue Processing
4.5. Immunohistochemistry
4.6. Morphometric Analysis
4.7. Statistical Analysis
5. Conclusions
Supplementary Materials
Author Contributions
Funding
Acknowledgments
Conflicts of Interest
References
- Portier, P.; Richet, C. De L’Action anaphylactique de certains venins. C. R. Séances Soc. Biol. 1902, 54, 170. [Google Scholar]
- Bochner, B.S.; Lichtenstein, L.M. Anaphylaxis. N. Engl. J. Med. 1991, 324, 1785–1790. [Google Scholar] [PubMed]
- Kemp, S.F.; Lockey, R.F. Anaphylaxis: A review of causes and mechanisms. J. Allergy Clin. Immunol. 2002, 110, 341–348. [Google Scholar] [CrossRef] [PubMed]
- Simons, F.E.; Sheikh, A. Anaphylaxis: The acute episode and beyond. BMJ 2013, 346, f602. [Google Scholar] [CrossRef] [PubMed]
- De Bisschop, M.B.; Bellou, A. Anaphylaxis. Curr. Opin. Crit. Care 2012, 18, 308–317. [Google Scholar] [CrossRef] [PubMed]
- Bellou, A.; Manel, J.; Samman-Kaakaji, H.; de Korwin, J.D.; Moneret-Vautrin, D.A.; Bollaert, P.E.; Lambert, H. Spectrum of acute allergic diseases in an emergency department: An evaluation of one years’ experience. Emerg. Med. (Fremantle) 2003, 15, 341–347. [Google Scholar] [CrossRef] [PubMed]
- Grigoras, A.; Kneiling, A.; Kneiling, L.; Bulgaru-Iliescu, D.; Giusca, S.E.; Avadanei, E.R.; Caruntu, I.D.; Amălinei, C. Histopathology findings in anaphylaxis shock. Arch. Clin. Cases 2015, 2, 1–6. [Google Scholar] [CrossRef]
- Kemp, S.F. Anaphylaxis: current concepts in pathophysiology, diagnosis, and management. Immunol. Allergy Clin. N. Am. 2001, 21, 611–634. [Google Scholar] [CrossRef]
- Bellou, A.; Lambert, H.; Gillois, P.; Montémont, C.; Gerard, P.; Vauthier, E.; Sainte-Laudy, J.; Longrois, D.; Guéant, J.L.; Mallié, J.P. Constitutive nitric oxide synthase inhibition combined with histamine and serotonin receptor blockade improves the initial ovalbumin-induced arterial hypotension but decreases the survival time in brown Norway rats anaphylactic shock. Shock 2003, 19, 71–78. [Google Scholar] [CrossRef]
- Osada, S.; Ichiki, H.; Oku, H.; Ishiguro, K.; Kunitomo, M.; Semma, M. Participation of nitric oxide in mouse anaphylactic hypotension. Eur. J. Pharmacol. 1994, 252, 347–350. [Google Scholar] [CrossRef]
- Nathan, C. Inducible nitric oxide synthase: What difference does it make? J. Clin. Investig. 1997, 100, 2417–2423. [Google Scholar] [CrossRef] [PubMed]
- Ihama, Y.; Fukasawa, M.; Ninomiya, K.; Kawakami, Y.; Nagai, T.; Fuke, C.; Miyazaki, T. Anaphylactic shock caused by sting of crown-of-thorns starfish (Acanthaster planci). Forensic Sci. Int. 2014, 236, e5-8. [Google Scholar] [CrossRef] [PubMed]
- Bellou, A.; Al-Hammadi, S.; Aburawi, E.H.; Dhanasekaran, S.; Nemmar, A.; Oulhaj, A.; Shafiuallah, M.; Zerrouki, M.; Yasin, J.; Bellou, L.; et al. 4-Aminopyridine, a blocker of Voltage-dependent K+ channels, restores blood pressure and improves survival in the Wistar rat model of anaphylactic shock. Crit. Care Med. J. 2016, 44, e1082–e1089. [Google Scholar] [CrossRef] [PubMed]
- Dhanasekaran, S.; Nemmar, A.; Aburawi, E.H.; Kazzam, E.E.; Abdulle, A.; Bellou, M.; Bellou, A. Glyburide, a K(+) (ATP) channel blocker, improves hypotension and survival in anaphylactic shock induced in Wistar rats sensitized to ovalbumin. Eur. J. Pharmacol. 2013, 720, 166–173. [Google Scholar] [CrossRef] [PubMed]
- Galli, S.J. The Mast Cell-IgE Paradox: From Homeostasis to Anaphylaxis. Am. J. Pathol. 2016, 186, 212–224. [Google Scholar] [CrossRef] [PubMed]
- Amin, K. The role of mast cells in allergic inflammation. Respir. Med. 2012, 106, 9–14. [Google Scholar] [CrossRef] [PubMed]
- Metcalfe, D.D.; Peavy, R.D.; Gilfillan, A.M. Mechanisms of mast cell signaling in anaphylaxis. J. Allergy Clin. Immunol. 2009, 124, 639–646. [Google Scholar] [CrossRef]
- Unkrig, S.; Hagemeier, L.; Madea, B. Postmortem diagnostics of assumed food anaphylaxis in an unexpected death. Forensic Sci. Int. 2010, 198, e1–e4. [Google Scholar] [CrossRef]
- Pumphrey, R.S.; Roberts, I.S. Postmortem findings after fatal anaphylactic reactions. J. Clin. Pathol. 2000, 53, 273–276. [Google Scholar] [CrossRef]
- Ozdemir, C.; Akdis, M.; Akdis, C.A. T-cell response to allergens. Chem. Immunol. Allergy 2010, 95, 22–44. [Google Scholar]
- Turnbull, L.; Kay, A. Eosinophils and mediators of anaphylaxis. Histamine and imidazole acetic acid as chemotactic agents for human eosinophil leucocytes. Immunology 1976, 31, 797–802. [Google Scholar]
- Wells, P.W.; Eyre, P.; Lumsden, J.H. Hematological and pathological changes in acute systemic anaphylaxis in calves: Effects of pharmacological agents. Can. J. Comp. Med. 1973, 37, 119–129. [Google Scholar] [PubMed]
- Bani, D.; Nistri, S.; Mannaioni, P.F.; Masini, E. Cardiac anaphylaxis: Pathophysiology and therapeutic perspectives. Curr. Allergy Asthma Rep. 2006, 6, 14–19. [Google Scholar] [CrossRef]
- Radhakrishnan, H. Acute kidney injury and rhabdomyolysis due to multiple wasp stings. Indian J. Crit. Care Med. 2014, 18, 470–472. [Google Scholar] [CrossRef]
- Marone, G.; Bova, M.; Detoraki, A.; Onorati, A.M.; Rossi, F.W. Spadaro G Human heart as a shock organ in anaphylaxis. Allergo J. Int. 2014, 23, 60–66. [Google Scholar] [CrossRef] [PubMed]
- Genovese, A.; Rossi, F.W.; Spadaro, G.; Galdiero, M.R.; Marone, G. Human cardiac mast cells in anaphylaxis. Chem. Immunol. Allergy 2010, 95, 98–109. [Google Scholar] [PubMed]
- Patella, V.; Marinò, I.; Lampärter, B.; Arbustini, E.; Adt, M.; Marone, G. Human heart mast cells. Isolation, purification, ultrastructure, and immunologic characterization. J. Immunol. 1995, 154, 2855–2865. [Google Scholar] [PubMed]
- Reisman, R.E. Unusual reactions to insect stings. Curr. Opin. Allergy Clin. Immunol. 2005, 5, 355–358. [Google Scholar] [CrossRef]
- Ahrens, R.; Osterfeld, H.; Wu, D.; Chen, C.Y.; Arumugam, M.; Groschwitz, K.; Strait, R.; Wang, Y.H.; Finkelman, F.D.; Hogan, S.P. Intestinal mast cell levels control severity of oral antigen-induced anaphylaxis in mice. Am. J. Pathol. 2012, 180, 1535–1546. [Google Scholar] [CrossRef]
- Palmiere, C. Postmortem diagnosis of drug-induced anaphylactic death. J. Forensic Leg. Med. 2016, 41, 28–29. [Google Scholar] [CrossRef] [PubMed]
- Kounis, N.G.; Soufras, G.D.; Hahalis, G. Accumulation of eosinophils, mast cells, and basophils in the spleen and the coronary arteries in anaphylactic deaths: Is the Kounis hypersensitivity associated syndrome present? Forensic Sci. Med. Pathol. 2014, 10, 150–151. [Google Scholar] [CrossRef] [PubMed]
- Hiramoto, K.; Kobayashi, H.; Orita, K.; Sato, E.F.; Ishii, M. Inducible nitric oxide synthase plays important roles in allergic reactions of pollinosis in mice sensitized with pollen allergy. J. Clin. Biochem. Nutr. 2013, 52, 17–21. [Google Scholar] [CrossRef] [PubMed]
- Sade, K.; Schwartz, I.F.; Etkin, S.; Schwartzenberg, S.; Levo, Y.; Kivity, S. Expression of inducible nitric oxide synthase in a mouse model of anaphylaxis. J. Investig. Allergol. Clin. Immunol. 2007, 17, 379–385. [Google Scholar] [PubMed]
- Cauwels, A.; Janssen, B.; Buys, E.; Sips, P.; Brouckaert, P. Anaphylactic shock depends on PI3K and eNOS-derived NO. J. Clin. Investig. 2006, 116, 2244–2251. [Google Scholar] [CrossRef]
- Messina, A.; Knight, K.R.; Dowsing, B.J.; Zhang, B.; Phan, L.H.; Hurley, J.V.; Morrison, W.A.; Stewart, A.G. Localization of inducible nitric oxide synthase to mast cells during ischemia/reperfusion injury of skeletal muscle. Lab. Investig. 2000, 80, 423–431. [Google Scholar] [CrossRef] [PubMed]
- Al-Salam, S.; Hashmi, S. Myocardial Ischemia Reperfusion Injury: Apoptotic, Inflammatory and Oxidative Stress Role of Galectin-3. Cell. Physiol. Biochem. 2018, 50, 1123–1139. [Google Scholar] [CrossRef]


© 2019 by the authors. Licensee MDPI, Basel, Switzerland. This article is an open access article distributed under the terms and conditions of the Creative Commons Attribution (CC BY) license (http://creativecommons.org/licenses/by/4.0/).
Share and Cite
Al-Salam, S.; Aburawi, E.H.; Al-Hammadi, S.; Dhanasekaran, S.; Shafiuallah, M.; Yasin, J.; Sudhadevi, M.; Awwad, A.; Alper, S.L.; Kazzam, E.E.; et al. Cellular and Immunohistochemical Changes in Anaphylactic Shock Induced in the Ovalbumin-Sensitized Wistar Rat Model. Biomolecules 2019, 9, 101. https://doi.org/10.3390/biom9030101
Al-Salam S, Aburawi EH, Al-Hammadi S, Dhanasekaran S, Shafiuallah M, Yasin J, Sudhadevi M, Awwad A, Alper SL, Kazzam EE, et al. Cellular and Immunohistochemical Changes in Anaphylactic Shock Induced in the Ovalbumin-Sensitized Wistar Rat Model. Biomolecules. 2019; 9(3):101. https://doi.org/10.3390/biom9030101
Chicago/Turabian StyleAl-Salam, Suhail, Elhadi H. Aburawi, Suleiman Al-Hammadi, Sekhar Dhanasekaran, Mohamed Shafiuallah, Javed Yasin, Manjusha Sudhadevi, Aktham Awwad, Seth L. Alper, Elsadig E. Kazzam, and et al. 2019. "Cellular and Immunohistochemical Changes in Anaphylactic Shock Induced in the Ovalbumin-Sensitized Wistar Rat Model" Biomolecules 9, no. 3: 101. https://doi.org/10.3390/biom9030101