

The Development of LAT1 Efflux Agonists as Mechanistic Probes of Cellular Amino Acid Stress
 , ,
, ,
Abstract
: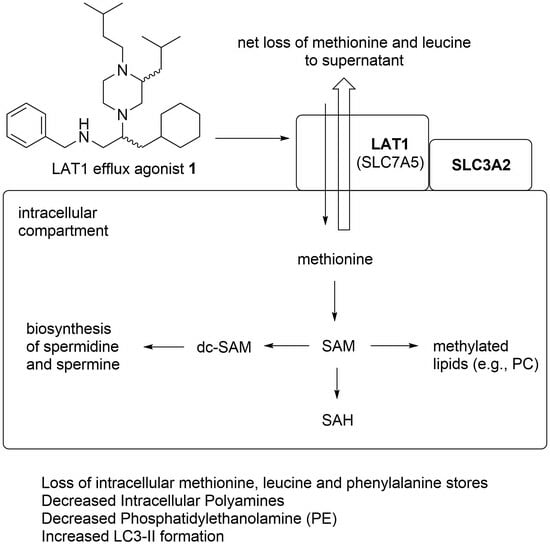
1. Introduction
2. Results and Discussion
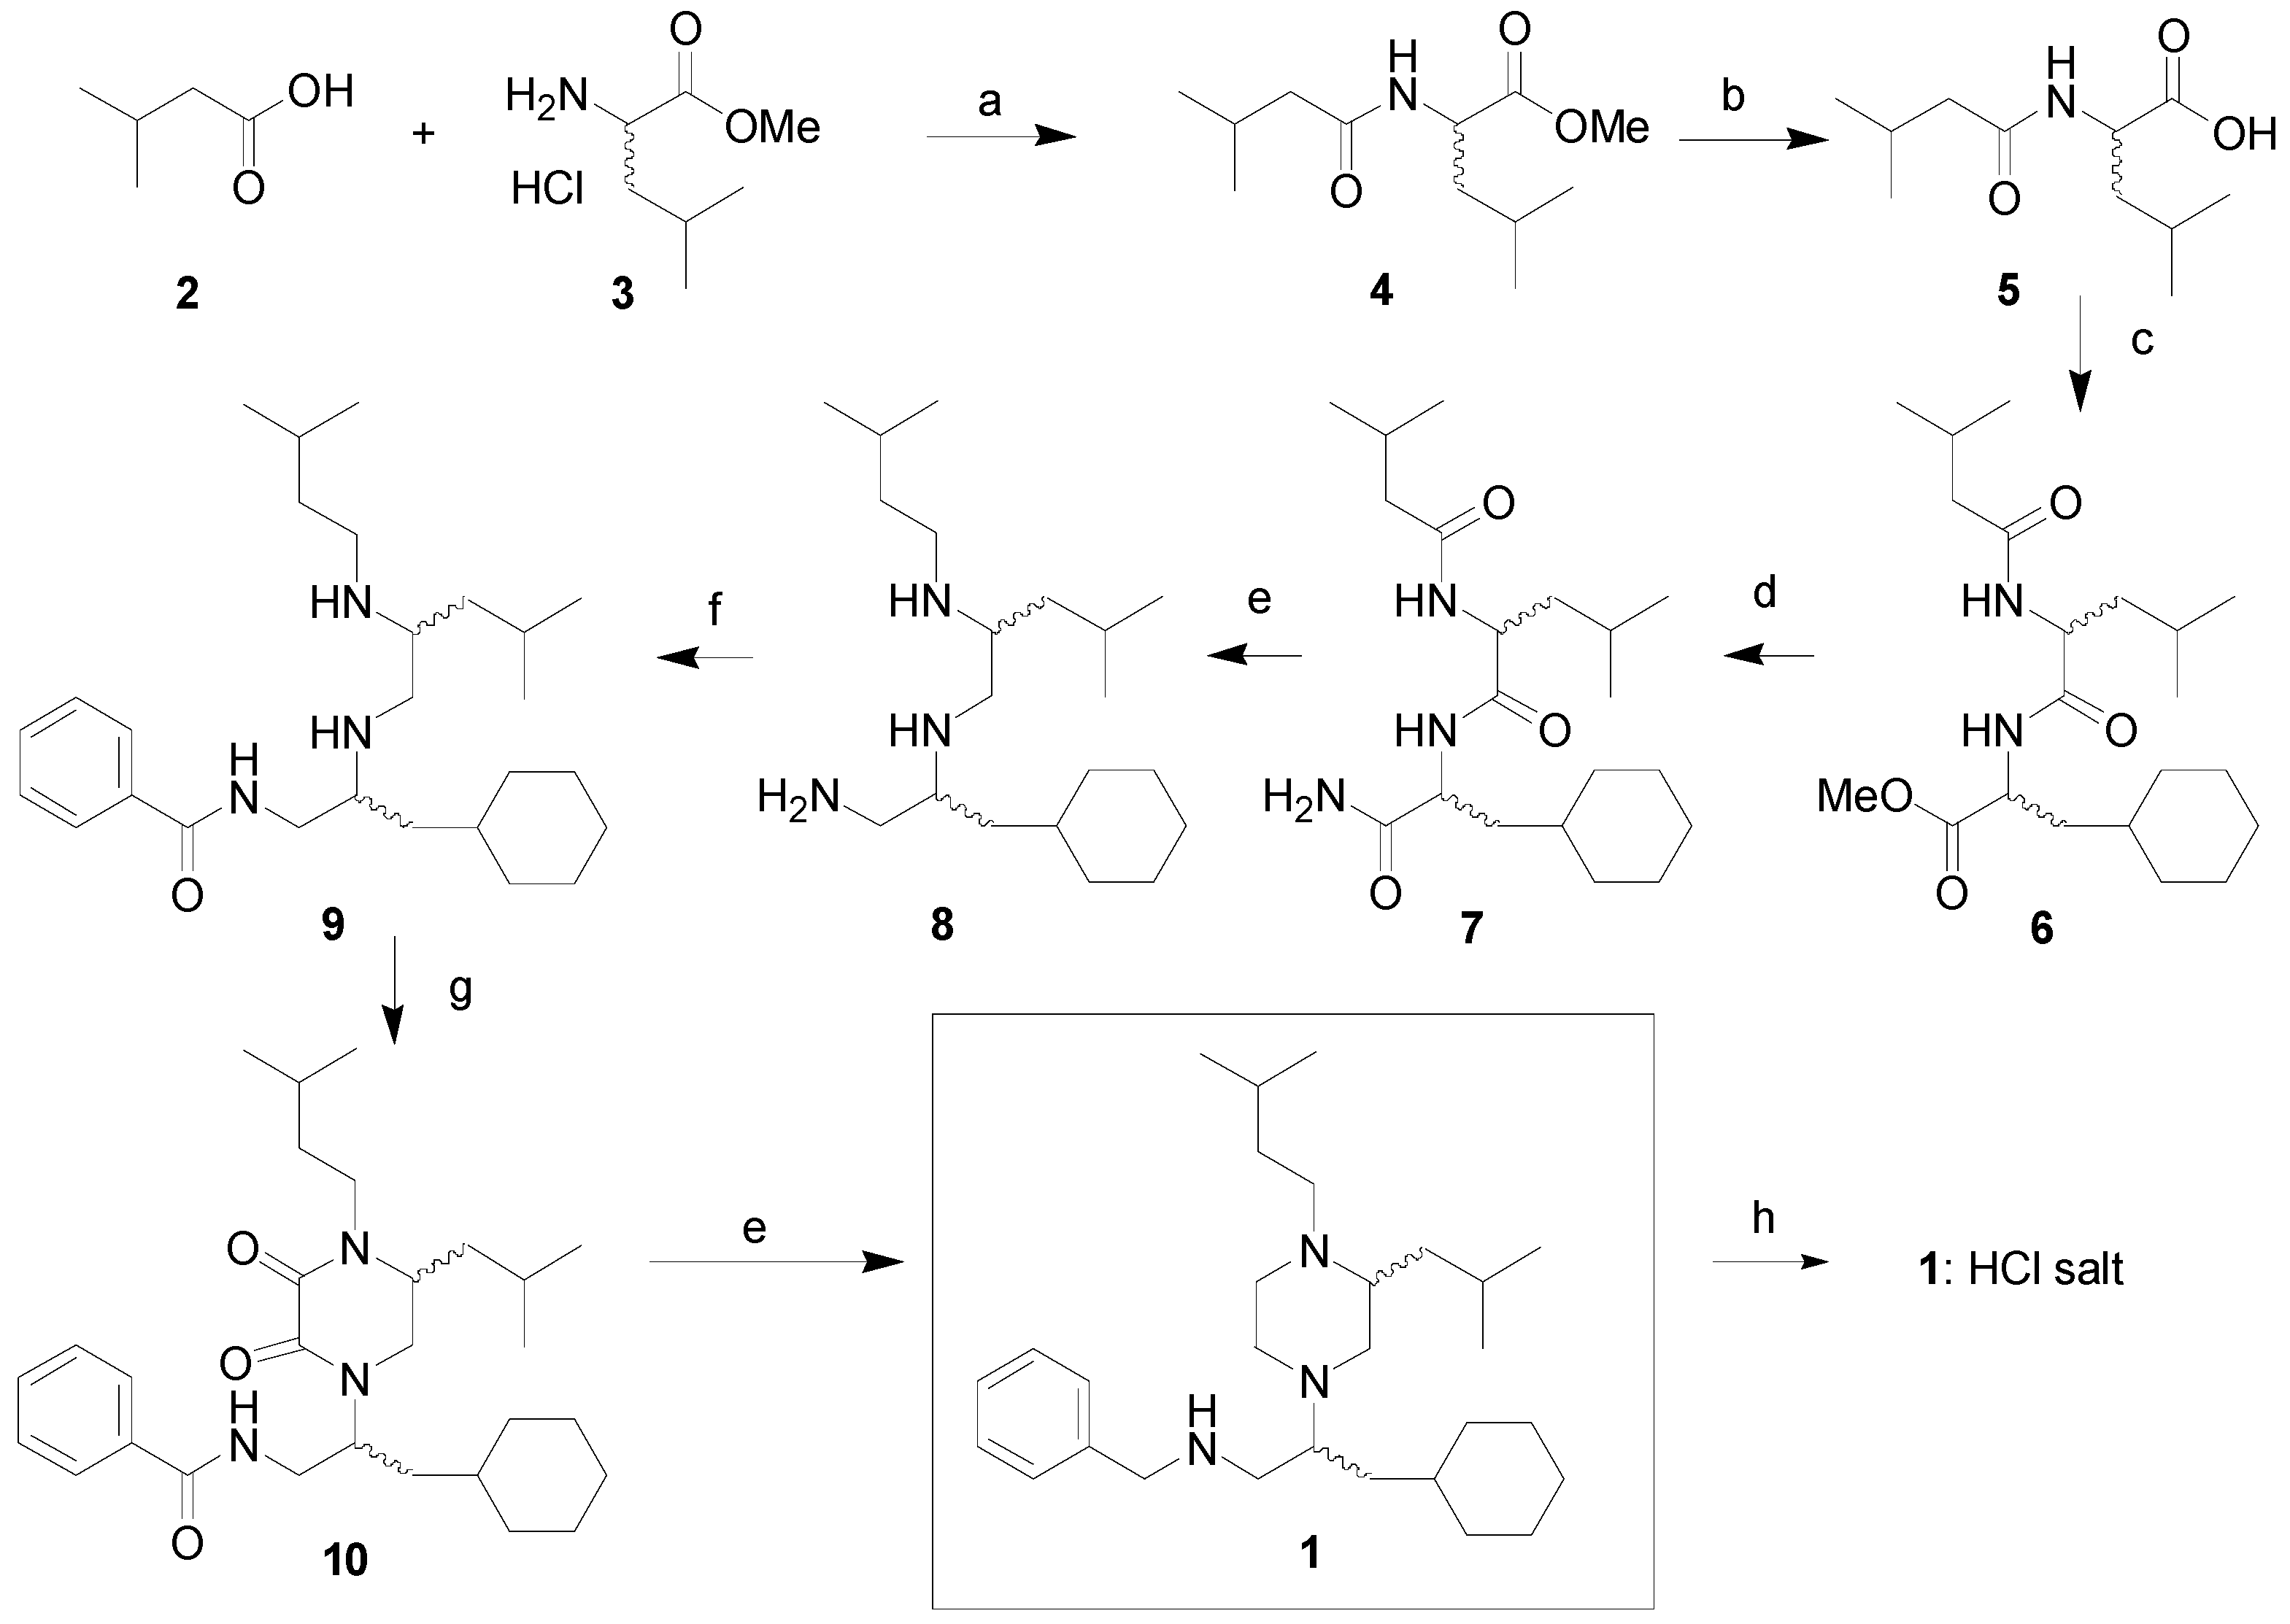
2.1. Synthesis
2.2. Bioevaluation
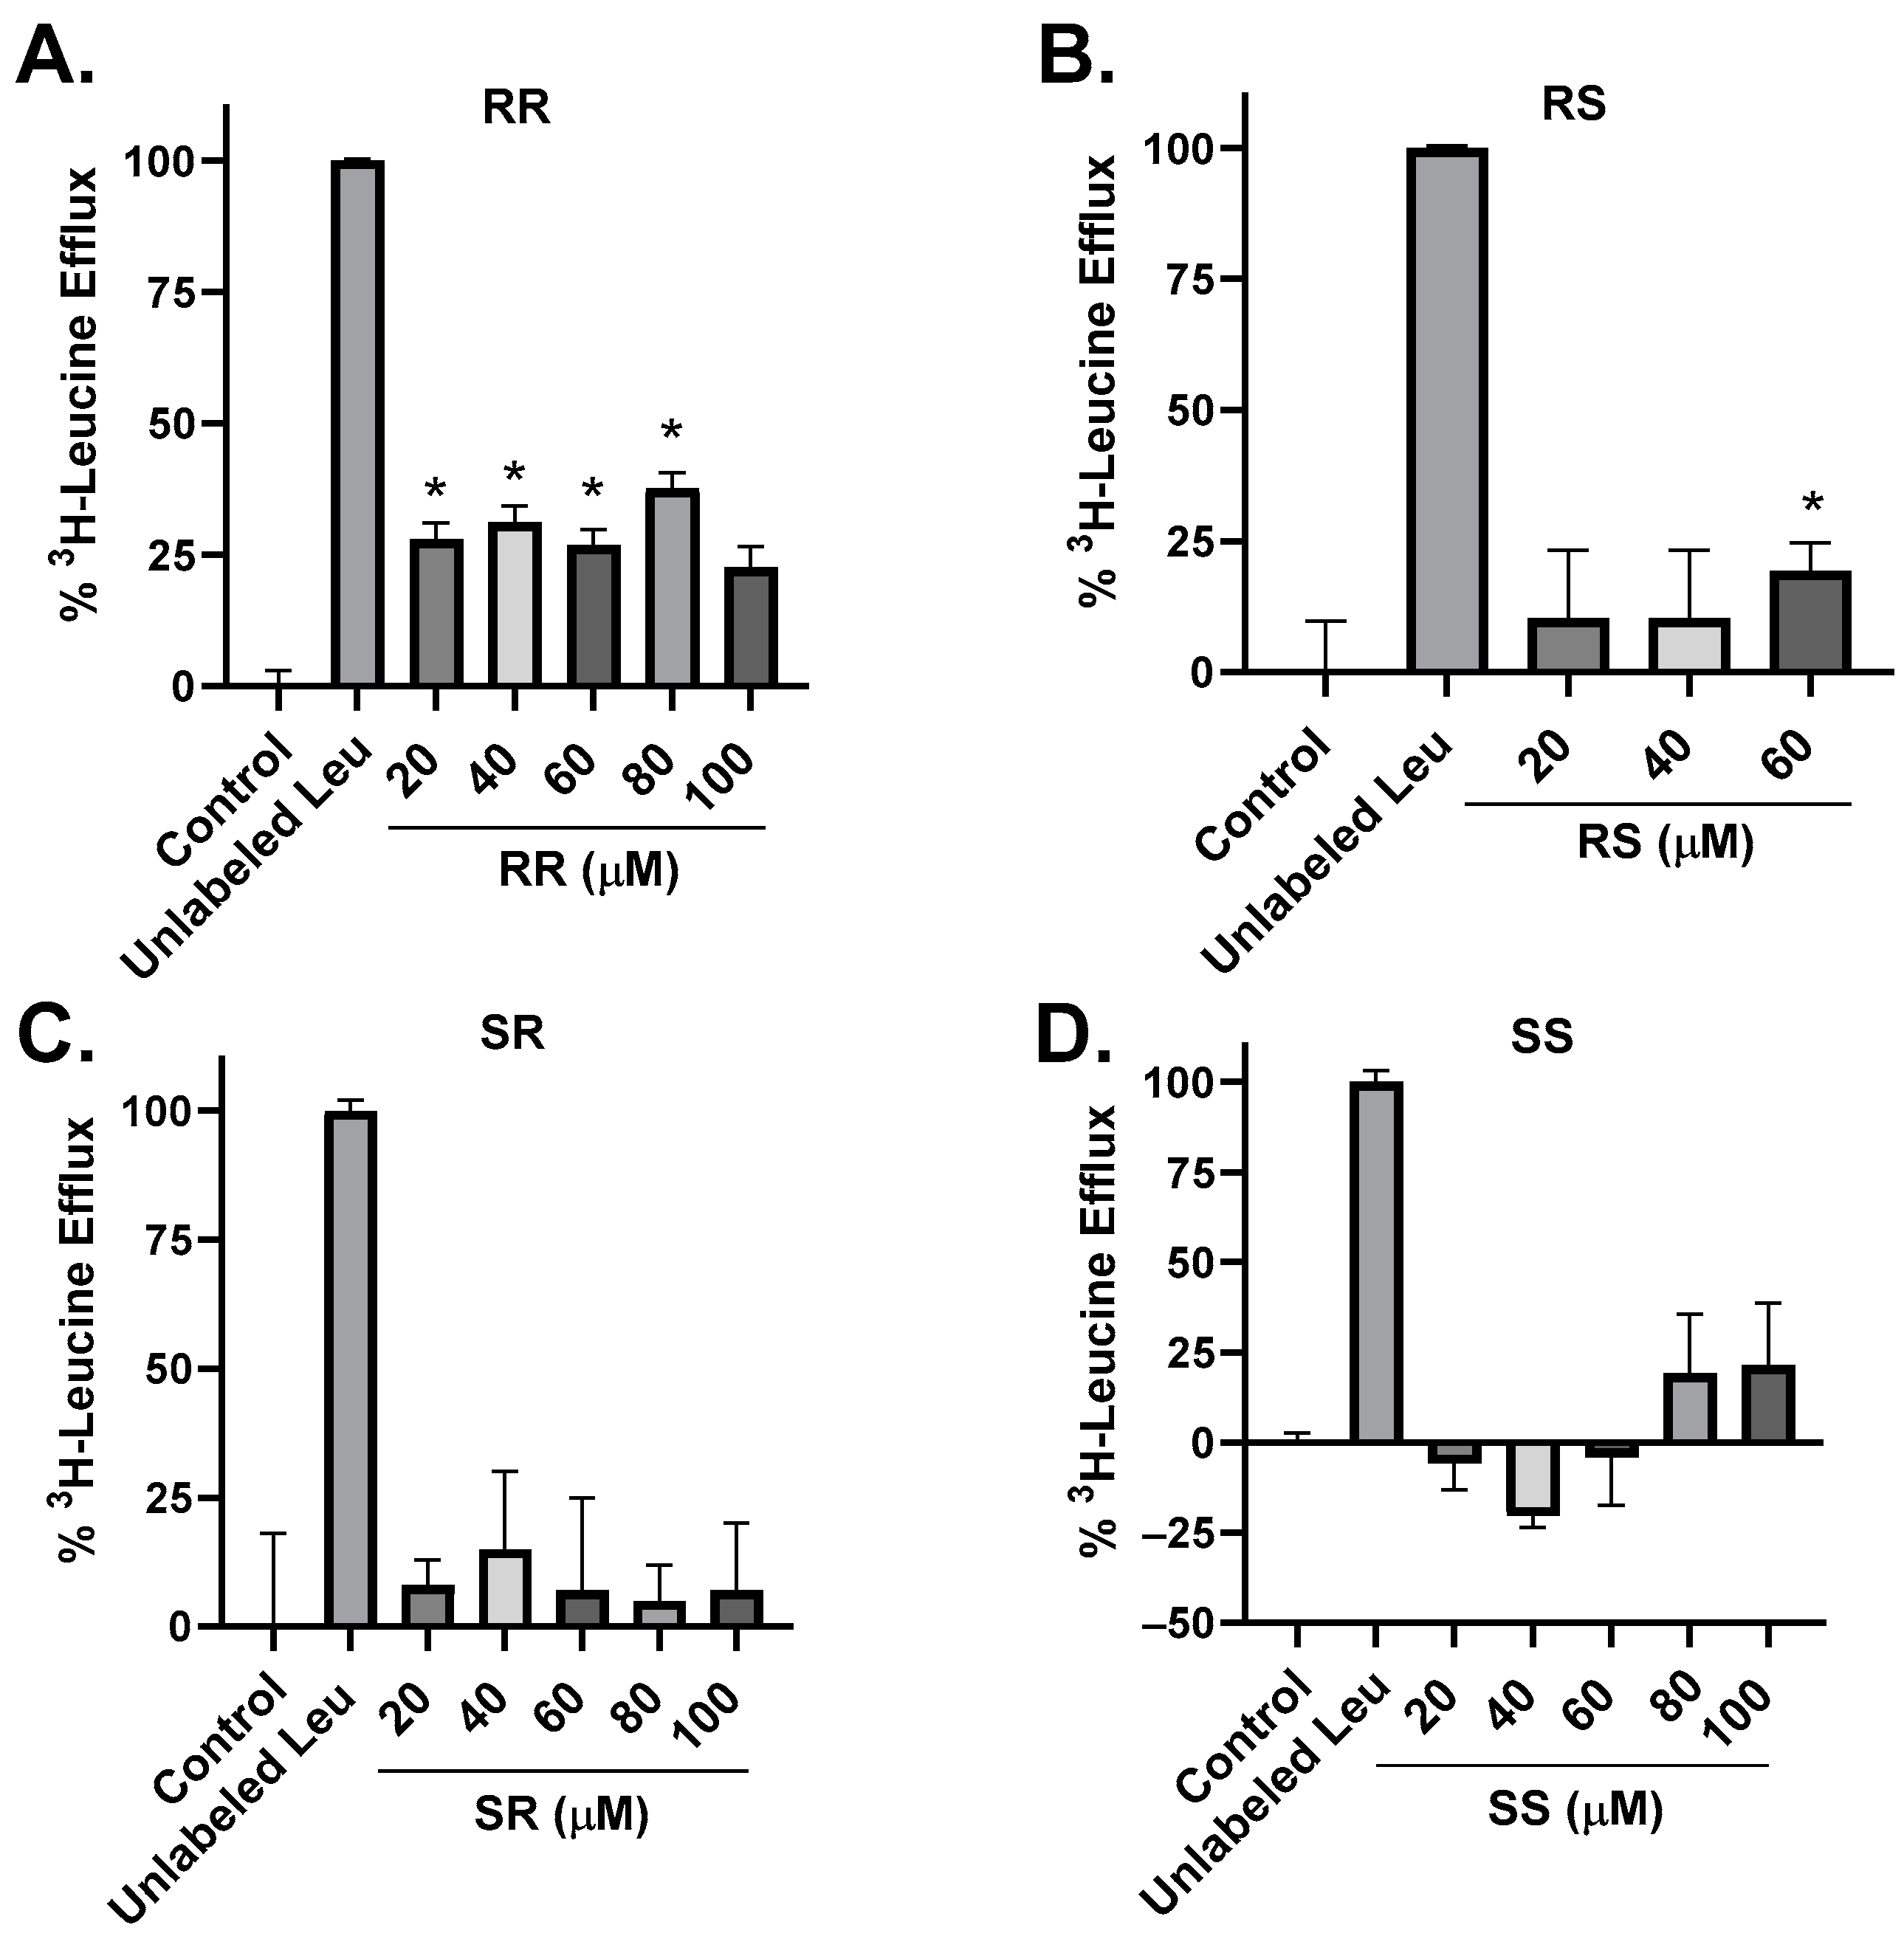
2.3. Amino Acid Transport Studies
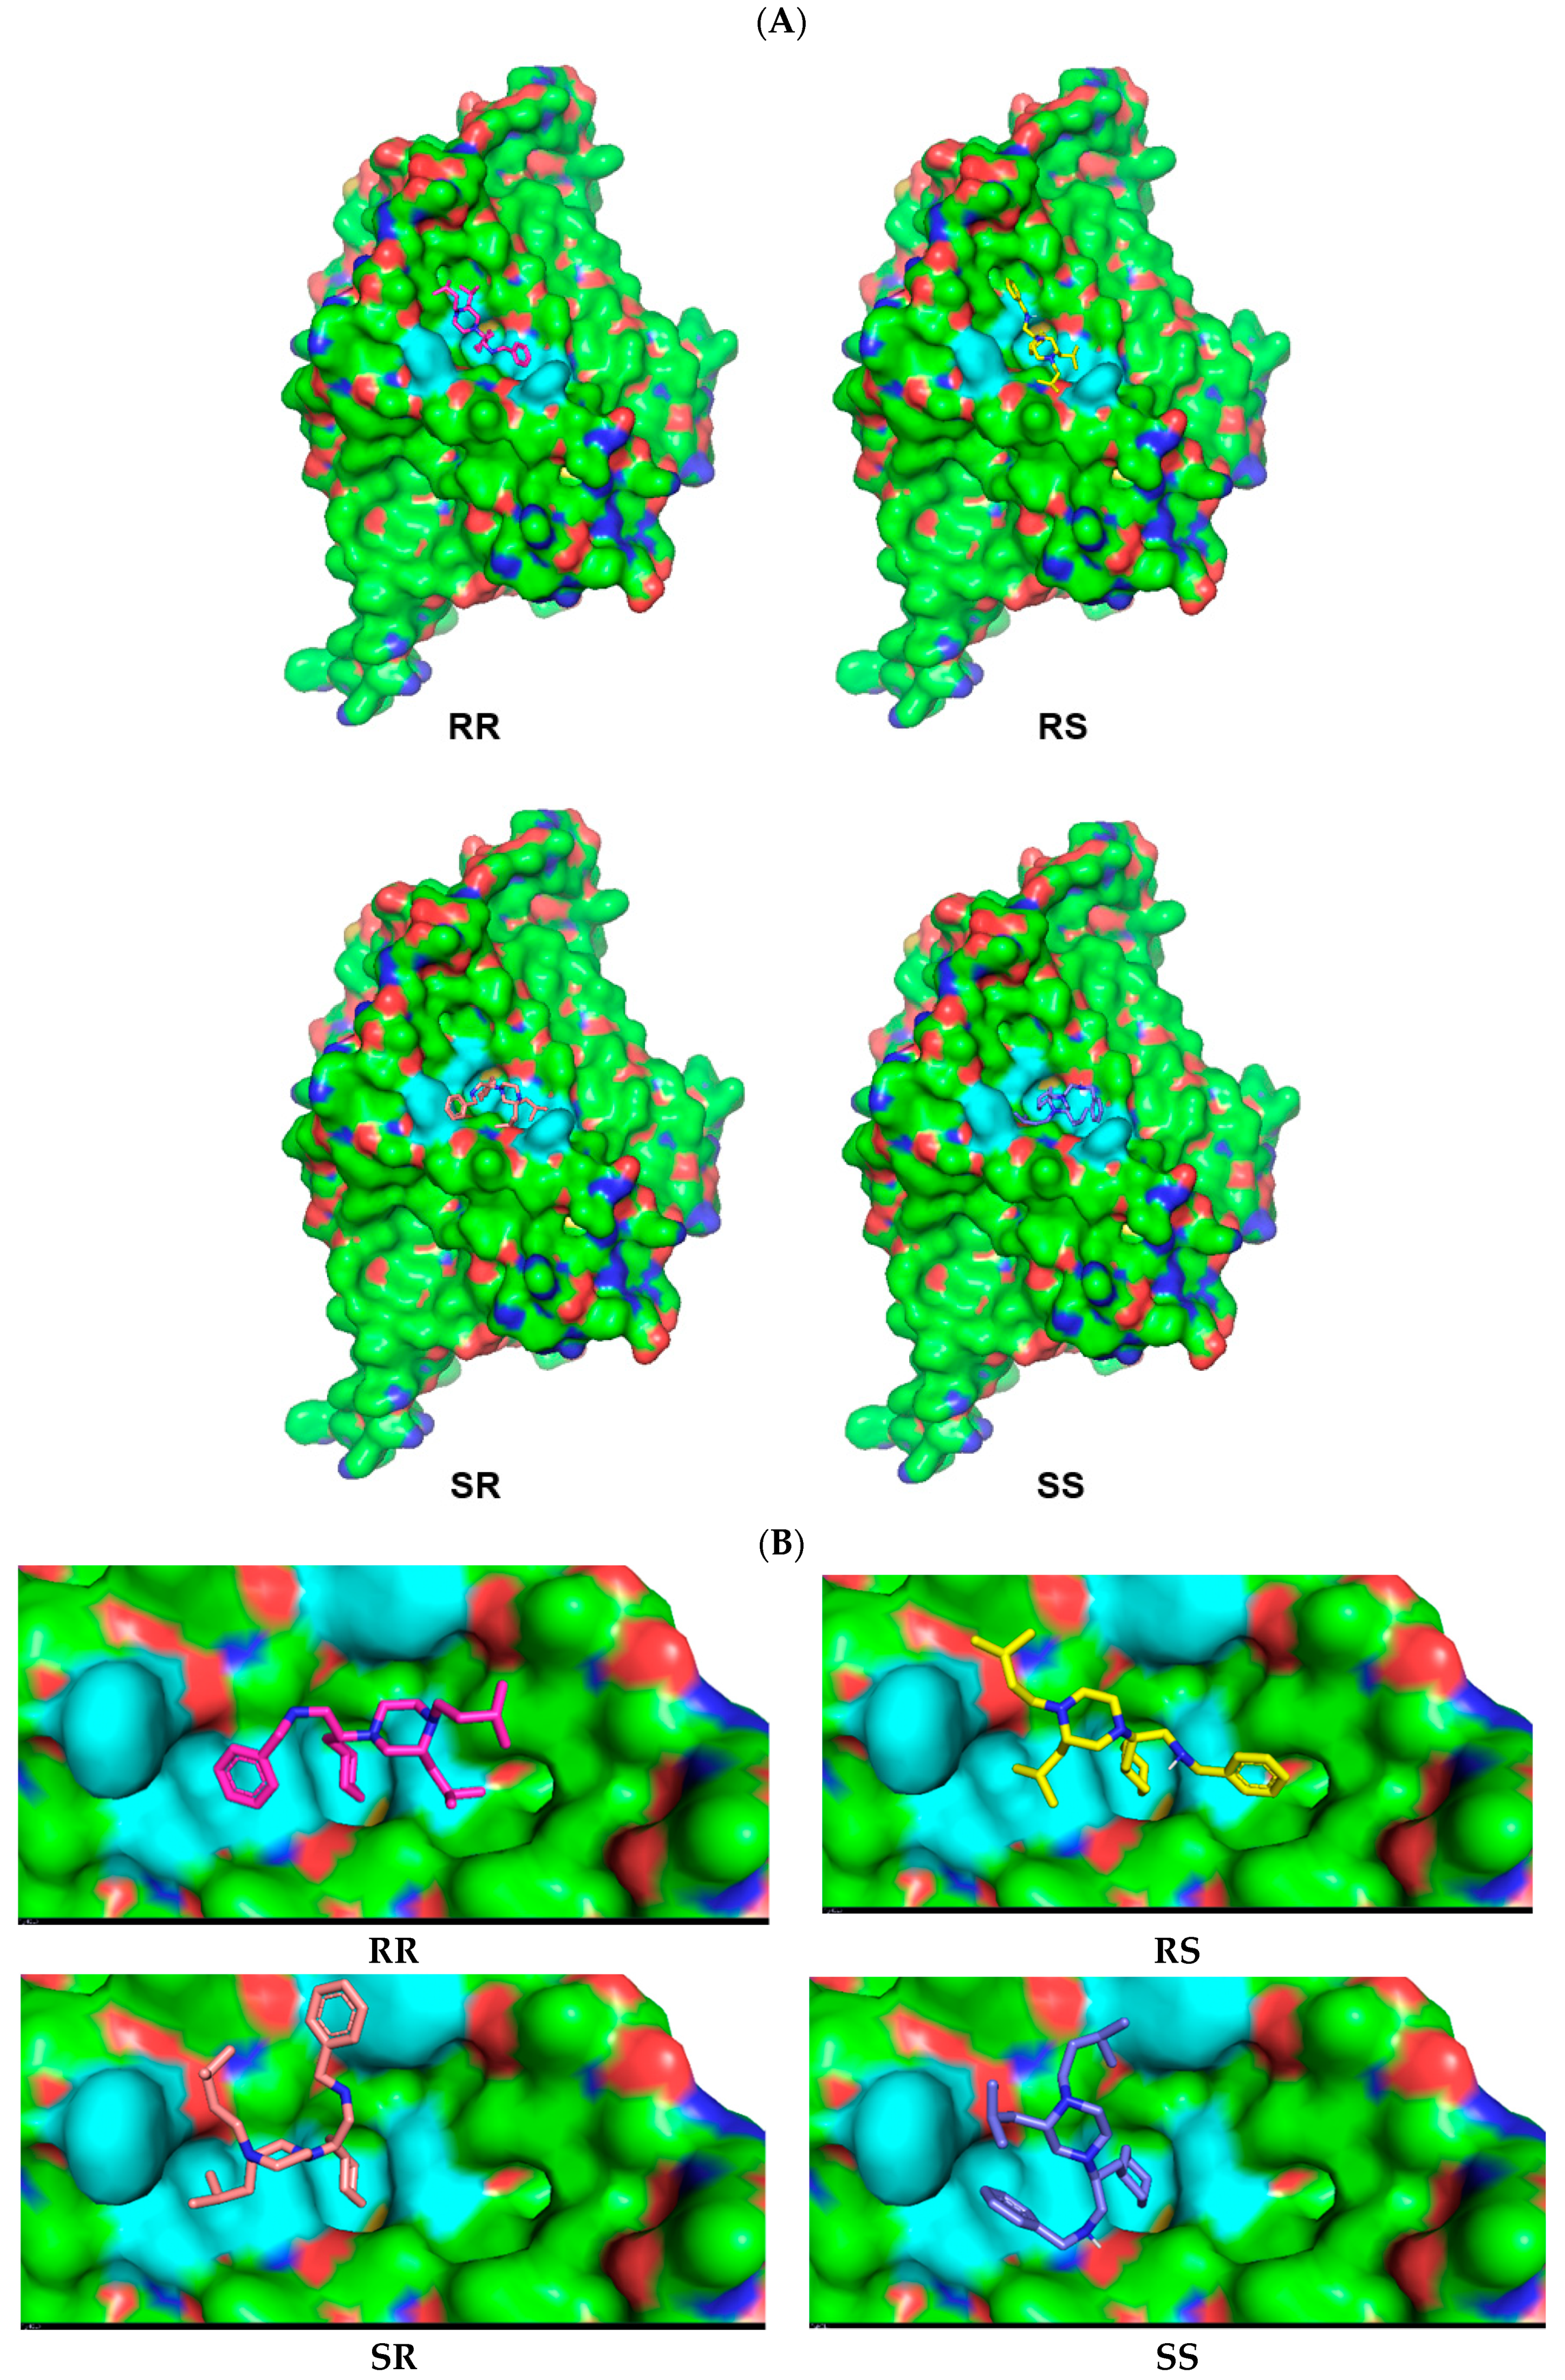
2.4. Molecular Modeling
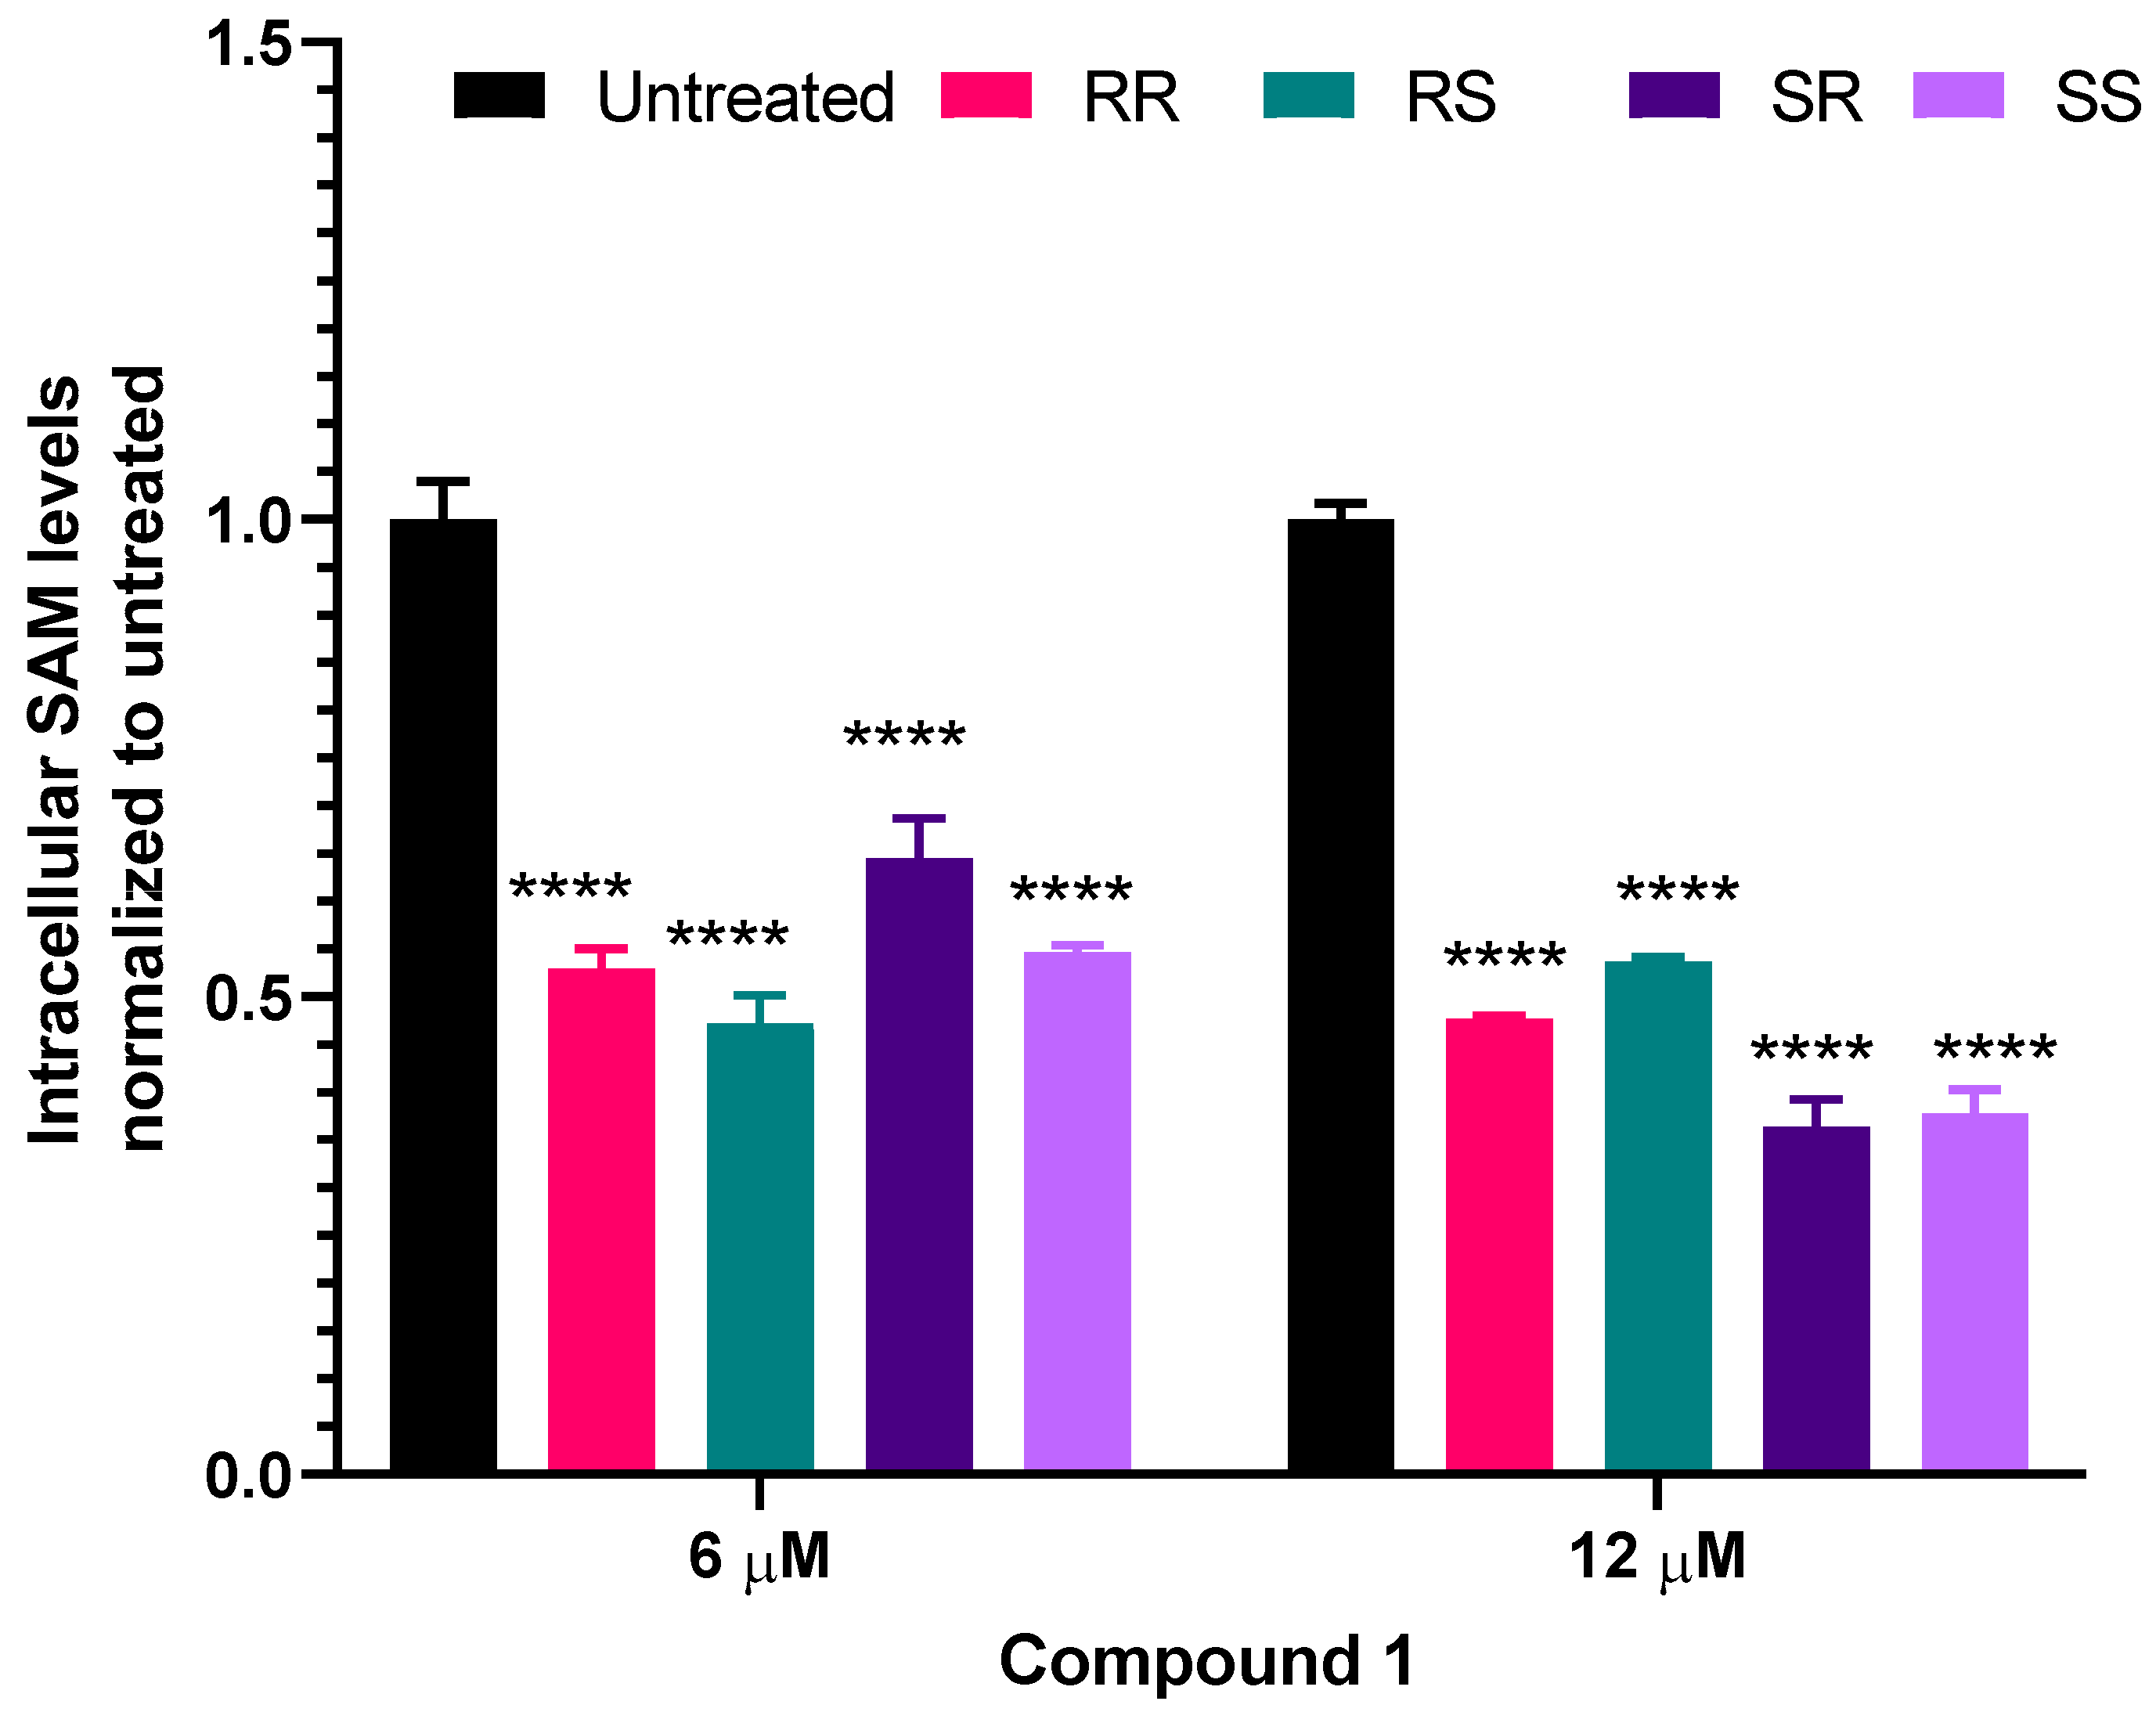
2.5. Intracellular S-adenosylmethionine (SAM) Levels
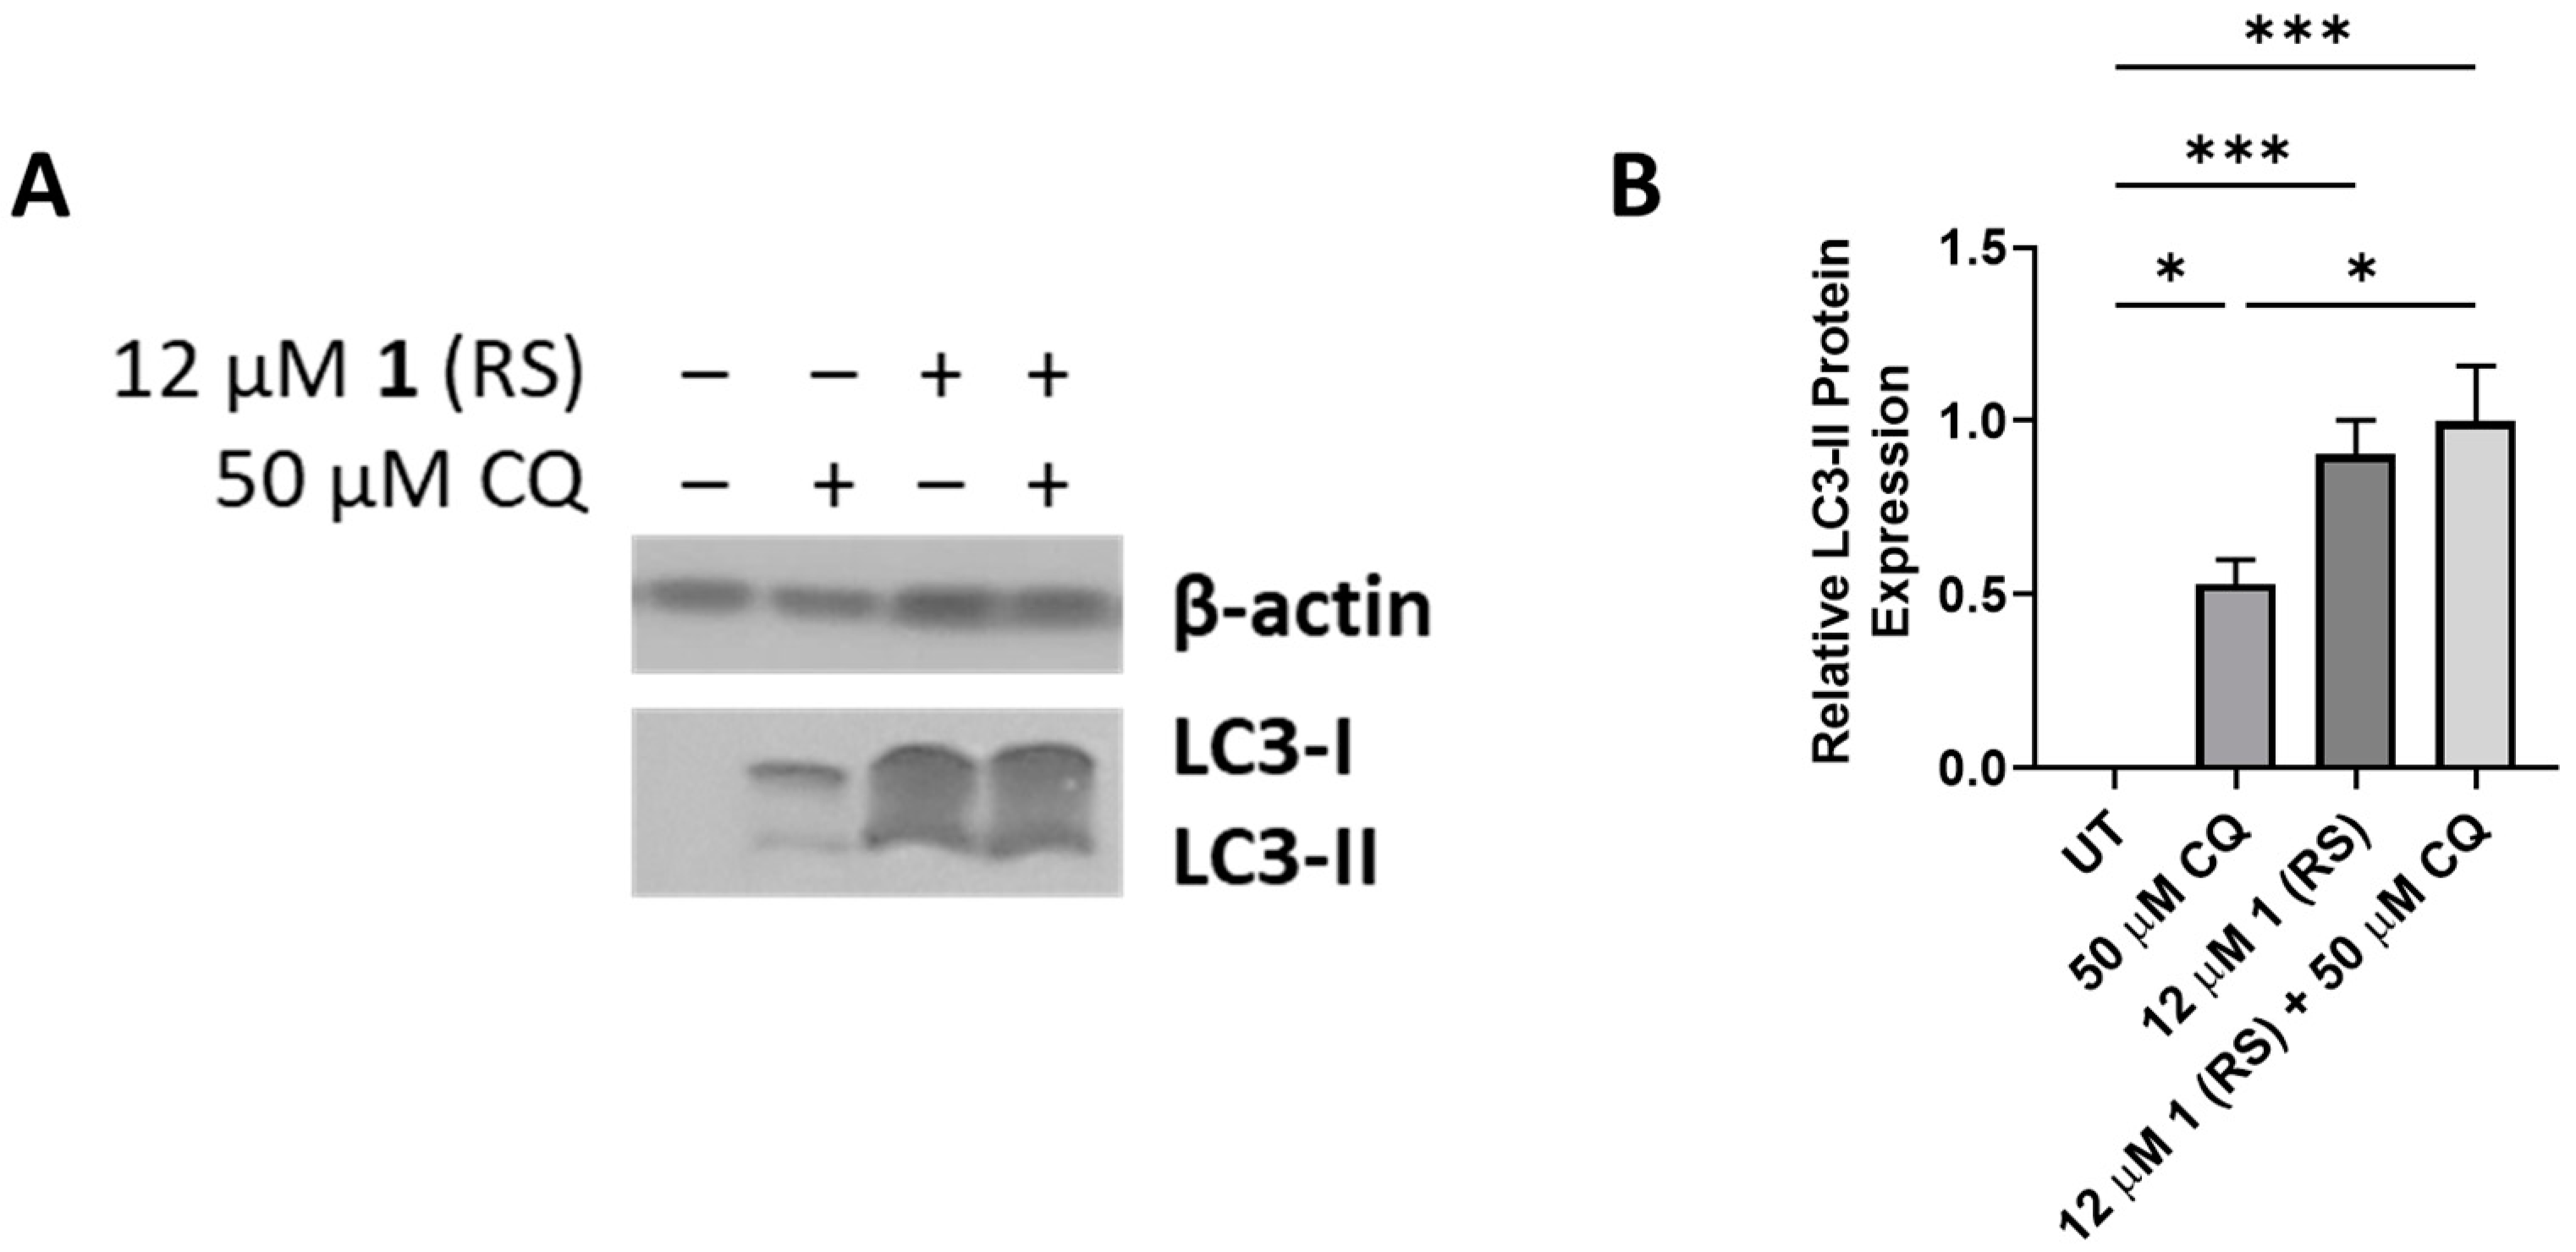
2.6. Autophagy Studies
3. Conclusions
4. Experimental
4.1. Molecular Modeling
4.2. Biological Studies
4.3. IC50 Determination
4.4. Polyamine Level Determination
4.5. Lipidomics Procedure
4.6. Determination of Intracellular SAM Levels
4.7. Immunoblotting
4.8. Radiolabeled Leucine Efflux Assay
4.9. Chloroquine (CQ) Growth Inhibition Assay
4.10. Western Blot
4.11. Statistical Analysis
Supplementary Materials
Author Contributions
Funding
Data Availability Statement
Acknowledgments
Conflicts of Interest
References
- Wanders, D.; Hobson, K.; Ji, X.M. Methionine Restriction and Cancer Biology. Nutrients 2020, 12, 684. [Google Scholar] [CrossRef]
- Cabreiro, F.; Au, C.; Leung, K.Y.; Vergara-Irigaray, N.; Cocheme, H.M.; Noori, T.; Weinkove, D.; Schuster, E.; Greene, N.D.; Gems, D. Metformin retards aging in C. elegans by altering microbial folate and methionine metabolism. Cell 2013, 153, 228–239. [Google Scholar] [CrossRef] [PubMed]
- Troen, A.M.; French, E.E.; Roberts, J.F.; Selhub, J.; Ordovas, J.M.; Parnell, L.D.; Lai, C.Q. Lifespan modification by glucose and methionine in Drosophila melanogaster fed a chemically defined diet. Age 2007, 29, 29–39. [Google Scholar] [CrossRef] [PubMed]
- Lee, B.C.; Kaya, A.; Ma, S.; Kim, G.; Gerashchenko, M.V.; Yim, S.H.; Hu, Z.; Harshman, L.G.; Gladyshev, V.N. Methionine restriction extends lifespan of Drosophila melanogaster under conditions of low amino-acid status. Nat. Commun. 2014, 5, 3592. [Google Scholar] [CrossRef] [PubMed]
- Orentreich, N.; Matias, J.R.; DeFelice, A.; Zimmerman, J.A. Low methionine ingestion by rats extends life span. J. Nutr. 1993, 123, 269–274. [Google Scholar] [CrossRef]
- Richie, J.P., Jr.; Leutzinger, Y.; Parthasarathy, S.; Malloy, V.; Orentreich, N.; Zimmerman, J.A. Methionine restriction increases blood glutathione and longevity in F344 rats. FASEB J. 1994, 8, 1302–1307. [Google Scholar] [CrossRef] [PubMed]
- Miller, R.A.; Buehner, G.; Chang, Y.; Harper, J.M.; Sigler, R.; Smith-Wheelock, M. Methionine-deficient diet extends mouse lifespan, slows immune and lens aging, alters glucose, T4, IGF-I and insulin levels, and increases hepatocyte MIF levels and stress resistance. Aging Cell 2005, 4, 119–125. [Google Scholar] [CrossRef]
- Ravussin, E.; Redman, L.M.; Rochon, J.; Das, S.K.; Fontana, L.; Kraus, W.E.; Romashkan, S.; Williamson, D.A.; Meydani, S.N.; Villareal, D.T.; et al. A 2-Year Randomized Controlled Trial of Human Caloric Restriction: Feasibility and Effects on Predictors of Health Span and Longevity. J. Gerontol. Ser. A Biol. Sci. Med. Sci. 2015, 70, 1097–1104. [Google Scholar] [CrossRef] [PubMed]
- Plummer, J.D.; Johnson, J.E. Extension of Cellular Lifespan by Methionine Restriction Involves Alterations in Central Carbon Metabolism and Is Mitophagy-Dependent. Front. Cell Dev. Biol. 2019, 7, 301. [Google Scholar] [CrossRef]
- Massaro, C.; Thomas, J.; Ikhlef, H.; Dinara, S.; Cronk, S.; Moots, H.; Phanstiel, O. Serendipitous Discovery of Leucine and Methionine Depletion Agents during the Search for Polyamine Transport Inhibitors. J. Med. Chem. 2020, 63, 2814–2832. [Google Scholar] [CrossRef]
- Bothwell, P.J.; Kron, C.D.; Wittke, E.F.; Czerniak, B.N.; Bode, B.P. Targeted Suppression and Knockout of ASCT2 or LAT1 in Epithelial and Mesenchymal Human Liver Cancer Cells Fail to Inhibit Growth. Int. J. Mol. Sci. 2018, 19, 2093. [Google Scholar] [CrossRef] [PubMed]
- Cormerais, Y.; Giuliano, S.; LeFloch, R.; Front, B.; Durivault, J.; Tambutte, E.; Massard, P.A.; de la Ballina, L.R.; Endou, H.; Wempe, M.F.; et al. Genetic Disruption of the Multifunctional CD98/LAT1 Complex Demonstrates the Key Role of Essential Amino Acid Transport in the Control of mTORC1 and Tumor Growth. Cancer Res. 2016, 76, 4481–4492. [Google Scholar] [CrossRef] [PubMed]
- Brunocilla, C.; Console, L.; Rovella, F.; Indiveri, C. Insights into the Transport Cycle of LAT1 and Interaction with the Inhibitor JPH203. Int. J. Mol. Sci. 2023, 24, 4042. [Google Scholar] [CrossRef] [PubMed]
- Hafliger, P.; Graff, J.; Rubin, M.; Stooss, A.; Dettmer, M.S.; Altmann, K.H.; Gertsch, J.; Charles, R.P. The LAT1 inhibitor JPH203 reduces growth of thyroid carcinoma in a fully immunocompetent mouse model. J. Exp. Clin. Cancer Res. 2018, 37, 234. [Google Scholar] [CrossRef] [PubMed]
- Okano, N.; Naruge, D.; Kawai, K.; Kobayashi, T.; Nagashima, F.; Endou, H.; Furuse, J. First-in-human phase I study of JPH203, L-type amino acids transporter 1 inhibitor, in patients with advanced solid tumors. J. Clin. Oncol. 2018, 36. No. 15_suppl. [Google Scholar] [CrossRef]
- Okano, N.; Naruge, D.; Kawai, K.; Kobayashi, T.; Nagashima, F.; Endou, H.; Furuse, J. First-in-human phase I study of JPH203, an L-type amino acid transporter 1 inhibitor, in patients with advanced solid tumors. Investig. New Drugs 2020, 38, 1495–1506. [Google Scholar] [CrossRef] [PubMed]
- Minocha, S.C.; Minocha, R.; Robie, C.A. High-Performance Liquid-Chromatographic Method for the Determination of Dansyl-Polyamines. J. Chromatogr. 1990, 511, 177–183. [Google Scholar] [CrossRef]
- Bodanszky, M.; Bodanszky, A. Racemization in peptide synthesis. Mechanism-specific models. Chem. Commun. 1967, 591–593. [Google Scholar] [CrossRef]
- Carpino, L.A.; Xia, J.; Zhang, C.; El-Faham, A. Organophosphorus and nitro-substituted sulfonate esters of 1-hydroxy-7-azabenzotriazole as highly efficient fast-acting peptide coupling reagents. J. Org. Chem. 2004, 69, 62–71. [Google Scholar] [CrossRef]
- Zhou, W.; Yerkes, N.; Chruma, J.J.; Liu, L.; Breslow, R. Chiral polyamines from reduction of polypeptides: Asymmetric pyridoxamine-mediated transaminations. Bioorg. Med. Chem. Lett. 2005, 15, 1351–1355. [Google Scholar] [CrossRef]
- Nefzi, A.; Giulianotti, M.A.; Houghten, R.A. Solid-Phase Synthesis of Substituted 2,3- Diketopiperazines from Reduced Polyamides. Tetrahedron 2000, 56, 3319–3326. [Google Scholar] [CrossRef]
- Carpino, L.A. 1-Hydroxy-7-Azabenzotriazole—An Efficient Peptide Coupling Additive. J. Am. Chem. Soc. 1993, 115, 4397–4398. [Google Scholar] [CrossRef]
- Bruns, C.J.; Harbison, M.T.; Kuniyasu, H.; Eue, I.; Fidler, I.J. In vivo selection and characterization of metastatic variants from human pancreatic adenocarcinoma by using orthotopic implantation in nude mice. Neoplasia 1999, 1, 50–62. [Google Scholar] [CrossRef] [PubMed]
- Stockert, J.C.; Horobin, R.W.; Colombo, L.L.; Blazquez-Castro, A. Tetrazolium salts and formazan products in Cell Biology: Viability assessment, fluorescence imaging, and labeling perspectives. Acta Histochem. 2018, 120, 159–167. [Google Scholar] [CrossRef] [PubMed]
- Yan, R.; Zhao, X.; Lei, J.; Zhou, Q. Structure of the human LAT1-4F2hc heteromeric amino acid transporter complex. Nature 2019, 568, 127–130. [Google Scholar] [CrossRef]
- Singh, N.; Ecker, G.F. Insights into the Structure, Function, and Ligand Discovery of the Large Neutral Amino Acid Transporter 1, LAT1. Int. J. Mol. Sci. 2018, 19, 1278. [Google Scholar] [CrossRef] [PubMed]
- Sun, Y.; Locasale, J.W. Rethinking the bioavailability and cellular transport properties of S-adenosylmethionine. Cell Stress 2022, 6, 1–5. [Google Scholar] [CrossRef] [PubMed]
- Ruckenstuhl, C.; Netzberger, C.; Entfellner, I.; Carmona-Gutierrez, D.; Kickenweiz, T.; Stekovic, S.; Gleixner, C.; Schmid, C.; Klug, L.; Sorgo, A.G.; et al. Lifespan extension by methionine restriction requires autophagy-dependent vacuolar acidification. PLoS Genet. 2014, 10, e1004347. [Google Scholar] [CrossRef] [PubMed]
- Ye, C.; Sutter, B.M.; Wang, Y.; Kuang, Z.; Tu, B.P. A metabolic function for phospholipid and histone methylation. Mol. Cell 2017, 66, 180–193. [Google Scholar] [CrossRef]
- Goldman, S.D.; Funk, R.S.; Rajewski, R.A.; Krise, J.P. Mechanisms of amine accumulation in, and egress from, lysosomes. Bioanalysis 2009, 1, 1445–1459. [Google Scholar] [CrossRef]
- Mauthe, M.; Orhon, I.; Rocchi, C.; Zhou, X.; Luhr, M.; Hijlkema, K.J.; Coppes, R.P.; Engedal, N.; Mari, M.; Reggiori, F. Chloroquine inhibits autophagic flux by decreasing autophagosome-lysosome fusion. Autophagy 2018, 14, 1435–1455. [Google Scholar] [CrossRef]
- Gottlieb, R.A.; Andres, A.M.; Sin, J.; Taylor, D.P. Untangling autophagy measurements: All fluxed up. Circ. Res. 2015, 116, 504–514. [Google Scholar] [CrossRef]
- Orhon, I.; Reggiori, F. Assays to Monitor Autophagy Progression in Cell Cultures. Cells 2017, 6, 20. [Google Scholar] [CrossRef]
- Alonzi, T.; Petruccioli, E.; Vanini, V.; Fimia, G.M.; Goletti, D. Optimization of the autophagy measurement in a human cell line and primary cells by flow cytometry. Eur. J. Histochem. 2019, 63, 3044. [Google Scholar] [CrossRef] [PubMed]
- Jung, C.H.; Ro, S.H.; Cao, J.; Otto, N.M.; Kim, D.H. mTOR regulation of autophagy. FEBS Lett. 2010, 584, 1287–1295. [Google Scholar] [CrossRef] [PubMed]
- Alexander, E.T.; Mariner, K.; Donnelly, J.; Phanstiel, O.; Gilmour, S.K. Polyamine Blocking Therapy Decreases Survival of Tumor-Infiltrating Immunosuppressive Myeloid Cells and Enhances the Antitumor Efficacy of PD-1 Blockade. Mol. Cancer Ther. 2020, 19, 2012–2022. [Google Scholar] [CrossRef] [PubMed]
- Alexander, E.T.; Minton, A.; Peters, M.C.; Phanstiel, O.; Gilmour, S.K. A novel polyamine blockade therapy activates an anti-tumor immune response. Oncotarget 2017, 8, 84140–84152. [Google Scholar] [CrossRef] [PubMed]
- Hayes, C.S.; Burns, M.R.; Gilmour, S.K. Polyamine blockade promotes antitumor immunity. Oncoimmunology 2014, 3, e27360. [Google Scholar] [CrossRef] [PubMed]
- Hayes, C.S.; Shicora, A.C.; Keough, M.P.; Snook, A.E.; Burns, M.R.; Gilmour, S.K. Polyamine-blocking therapy reverses immunosuppression in the tumor microenvironment. Cancer Immunol. Res. 2014, 2, 274–285. [Google Scholar] [CrossRef]
- Gitto, S.B.; Pandey, V.; Oyer, J.L.; Copik, A.J.; Hogan, F.C.; Phanstiel, O.; Altomare, D.A. Difluoromethylornithine Combined with a Polyamine Transport Inhibitor Is Effective against Gemcitabine Resistant Pancreatic Cancer. Mol. Pharm. 2018, 15, 369–376. [Google Scholar] [CrossRef]
- Trott, O.; Olson, A.J. AutoDock Vina: Improving the speed and accuracy of docking with a new scoring function, efficient optimization, and multithreading. J. Comput. Chem. 2010, 31, 455–461. [Google Scholar] [CrossRef] [PubMed]
- Dallakyan, S.; Olson, A.J. Small-molecule library screening by docking with PyRx. Methods Mol. Biol. 2015, 1263, 243–250. [Google Scholar] [CrossRef]
- Calzada, E.; Avery, E.; Sam, P.N.; Modak, A.; Wang, C.; McCaffery, J.M.; Han, X.; Alder, N.N.; Claypool, S.M. Phosphatidylethanolamine made in the inner mitochondrial membrane is essential for yeast cytochrome bc1 complex function. Nat. Commun. 2019, 10, 1432. [Google Scholar] [CrossRef] [PubMed]
- Baile, M.G.; Sathappa, M.; Lu, Y.W.; Pryce, E.; Whited, K.; McCaffery, J.M.; Han, X.; Alder, N.N.; Claypool, S.M. Unremodeled and remodeled cardiolipin are functionally indistinguishable in yeast. J. Biol. Chem. 2014, 289, 1768–1778. [Google Scholar] [CrossRef] [PubMed]
- Wang, M.; Han, X. Multidimensional mass spectrometry-based shotgun lipidomics. Methods Mol. Biol. 2014, 1198, 203–220. [Google Scholar] [CrossRef]
- Wang, M.; Kim, G.H.; Wei, F.; Chen, H.; Altarejos, J.; Han, X. Improved method for quantitative analysis of methylated phosphatidylethanolamine species and its application for analysis of diabetic-mouse liver samples. Anal. Bioanal. Chem. 2015, 407, 5021–5032. [Google Scholar] [CrossRef]
- Han, X.; Yang, K.; Gross, R.W. Microfluidics-based electrospray ionization enhances the intrasource separation of lipid classes and extends identification of individual molecular species through multi-dimensional mass spectrometry: Development of an automated high-throughput platform for shotgun lipidomics. Rapid Commun. Mass Spectrom. 2008, 22, 2115–2124. [Google Scholar] [CrossRef]
- Wang, M.; Wang, C.; Han, R.H.; Han, X. Novel advances in shotgun lipidomics for biology and medicine. Prog. Lipid Res. 2016, 61, 83–108. [Google Scholar] [CrossRef]
- Yang, K.; Cheng, H.; Gross, R.W.; Han, X. Automated lipid identification and quantification by multidimensional mass spectrometry-based shotgun lipidomics. Anal. Chem. 2009, 81, 4356–4368. [Google Scholar] [CrossRef]
- Birsan, C.; Litescu, S.C.; Cucu, N.; Radu, G.L. Determination of S-Adenosylmethionine and S-Adenosylhomocysteine from Human Blood Samples by HPLC-FL. Anal. Lett. 2008, 41, 1720–1731. [Google Scholar] [CrossRef]


| Compound | 24 h IC50 (µM)—1000 Cells | 24 h IC50 (µM)—3000 Cells |
|---|---|---|
| 1 (RR) | 3.99 ± 0.04 | 5.14 ± 0.05 |
| 1 (RS) | 5.43 ± 0.16 | 7.35 ± 0.18 |
| 1 (SR) | 3.64 ± 0.20 | 4.13 ± 0.05 |
| 1 (SS) | 3.32 ± 0.07 | 4.76 ± 0.14 |
| Phospholipid | Control | JPH203 | RR | RS | SR | SS |
|---|---|---|---|---|---|---|
| Phosphatidyl ethanolamine (PE) | 185.18 ± 5.32 | 177.36 ± 1.96 | 131.04 ± 8.89 | 162.08 ± 17.84 | 149.89 ± 10.21 | 150.7 ± 8.98 |
| % change vs. control | 0% | −4.2% | −29.2% | −12.5% | −19.1% | −18.6% |
| Mono-methylated PE (MMPE) | 0.86 ± 0.15 | 0.85 ± 0.01 | 0.85 ± 0.06 | 0.91 ± 0.09 | 0.84 ± 0.21 | 0.94 ± 0.08 |
| % change vs. control | 0% | −1.1% | −1.1% | +5.8% | −2.3% | +9.3% |
| Di-methylated PE (DMPE) | 1.57 ± 0.17 | 1.39 ± 0.19 | 1.09 ± 0.19 | 1.39 ± 0.12 | 1.43 ± 0.12 | 1.36 ± 0.14 |
| % change vs. control | 0% | −11.4% | −30.6% | −11.4% | −8.9% | −13.3% |
| Phosphatidylcholine (PC) | 137.39 ± 3.18 | 133.26 ± 13.51 | 126.45 ± 10.48 | 141.53 ± 1.53 | 135.20 ± 5.47 | 145.59 ± 4.68 |
| % change vs. control | 0% | −3.0% | −8.0% | +3.0% | −1.6% | +6.0% |
| Total phospholipids measured | 325.0 | 312.9 | 259.4 | 305.9 | 287.4 | 298.7 |
| % change vs. control | 0% | −3.7% | −20.1% | −5.9% | −11.5% | −8.1% |
Disclaimer/Publisher’s Note: The statements, opinions and data contained in all publications are solely those of the individual author(s) and contributor(s) and not of MDPI and/or the editor(s). MDPI and/or the editor(s) disclaim responsibility for any injury to people or property resulting from any ideas, methods, instructions or products referred to in the content. |
© 2024 by the authors. Licensee MDPI, Basel, Switzerland. This article is an open access article distributed under the terms and conditions of the Creative Commons Attribution (CC BY) license (https://creativecommons.org/licenses/by/4.0/).
Share and Cite
Sekhar, V.; Ikhlef, H.; Bunea, A.; Nguyen, V.S.; Joo, J.; Tantak, M.P.; Moots, H.; Phanstiel, O., IV. The Development of LAT1 Efflux Agonists as Mechanistic Probes of Cellular Amino Acid Stress. Biomolecules 2024, 14, 326. https://doi.org/10.3390/biom14030326
Sekhar V, Ikhlef H, Bunea A, Nguyen VS, Joo J, Tantak MP, Moots H, Phanstiel O IV. The Development of LAT1 Efflux Agonists as Mechanistic Probes of Cellular Amino Acid Stress. Biomolecules. 2024; 14(3):326. https://doi.org/10.3390/biom14030326
Chicago/Turabian StyleSekhar, Vandana, Houssine Ikhlef, Alexandra Bunea, Viet S. Nguyen, Johan Joo, Mukund P. Tantak, Holly Moots, and Otto Phanstiel, IV. 2024. "The Development of LAT1 Efflux Agonists as Mechanistic Probes of Cellular Amino Acid Stress" Biomolecules 14, no. 3: 326. https://doi.org/10.3390/biom14030326