Article

Transcriptomic-Based Quantification of the Epithelial-Hybrid-Mesenchymal Spectrum across Biological Contexts

1
Centre for BioSystems Science and Engineering, Indian Institute of Science, Bangalore 560012, India
2
Undergraduate Programme, Indian Institute of Science, Bangalore 560012, India
3
Department of Biological Sciences, Georgia Institute of Technology, Atlanta, GA 30332, USA
4
Department of Biotechnology, Indian Institute of Technology, Kharagpur 721302, India
5
Respiratory Translational Research Group, Department of Laboratory Medicine, School of Health Sciences, College of Health and Medicine, University of Tasmania, Launceston 7248, Australia
6
Departments of Physics and Bioengineering, Northeastern University, Boston, MA 02115, USA
7
Center for Theoretical Biological Physics, Rice University, Houston, TX 77030, USA
*
Authors to whom correspondence should be addressed.
Biomolecules 2022, 12(1), 29; https://doi.org/10.3390/biom12010029
Submission received: 2 December 2021 / Revised: 20 December 2021 / Accepted: 21 December 2021 / Published: 25 December 2021
(This article belongs to the Special Issue New Insights on the Regulation of the Cell Plasticity)

Abstract

:
Epithelial-mesenchymal plasticity (EMP) underlies embryonic development, wound healing, and cancer metastasis and fibrosis. Cancer cells exhibiting EMP often have more aggressive behavior, characterized by drug resistance, and tumor-initiating and immuno-evasive traits. Thus, the EMP status of cancer cells can be a critical indicator of patient prognosis. Here, we compare three distinct transcriptomic-based metrics—each derived using a different gene list and algorithm—that quantify the EMP spectrum. Our results for over 80 cancer-related RNA-seq datasets reveal a high degree of concordance among these metrics in quantifying the extent of EMP. Moreover, each metric, despite being trained on cancer expression profiles, recapitulates the expected changes in EMP scores for non-cancer contexts such as lung fibrosis and cellular reprogramming into induced pluripotent stem cells. Thus, we offer a scoring platform to quantify the extent of EMP in vitro and in vivo for diverse biological applications including cancer.

1. Introduction

Epithelial-Mesenchymal Plasticity (EMP) is an important feature of cancer metastasis and therapy resistance, the two major clinical challenges that claim the majority of cancer-related deaths [1]. EMP involves dynamic and reversible switching among multiple phenotypes along the epithelial-hybrid-mesenchymal spectrum. It encompasses both EMT (Epithelial-to-Mesenchymal Transition) and MET (Mesenchymal-to-Epithelial Transition). Originally considered to be binary transitions, EMT and MET are both now understood as multi-step processes, and cells can execute these programs to varying degrees, enabling one or more hybrid epithelial/mesenchymal (E/M) phenotypes [2,3,4]. EMP usually entails changes in cell–cell adhesion, migration, and invasion; while EMT is often involved with cells escaping the primary tumor and initiating metastasis, MET is thought to be important for colonization, the last step of metastasis. Besides these features, EMP is also implicated in conferring tumor-initiation potential [5,6], immune evasion [7,8,9], and resistance to various chemotherapeutic drugs and targeted therapies [10,11,12]. Thus, EMP can be considered as the “motor of cellular plasticity” [13], which enhances cancer cell fitness in a variety of biological contexts.
Recent preclinical and clinical observations have suggested the high metastatic potential of hybrid E/M phenotypes, and their association with worse patient survival across cancer types [14,15,16,17,18,19,20,21]. Hybrid E/M phenotypes have also been observed in circulating tumor cells (CTCs); their higher frequency is often concomitant with worse clinicopathological features [22,23,24,25]. The ability of hybrid E/M cells to form clusters of CTCs can also escalate their metastatic fitness, given the disproportionately high metastatic burden of CTC clusters [26,27,28]. Given the context-specific diversity of hybrid E/M phenotypes [29], it is imperative that EMP be quantified as a continuum or spectrum, through integrating various experimental and/or computational methods.
At the transcriptomic level, various computational methods have been proposed to quantify the EMP spectrum by calculating the extent to which a given sample has undergone EMT/MET (hereafter, referred to as the “EMT score”). First, using gene expression from non-small cell lung cancer (NSCLC) cell lines and patients, a 76-gene EMT signature was identified and then used to derive a score (hereafter, referred to as the “76GS score”) based on the relative enrichment of expression levels of epithelial-associated genes. The 76GS score is a weighted sum of the expression levels of these 76 genes, with the weight being the correlation coefficient of the corresponding gene with that of E-cadherin (CDH1) levels in the given dataset. Thus, the higher the 76GS score is, the more epithelial a given sample is [30,31]. Second, a two-sample Kolmogorov–Smirnov method was used to calculate a score (hereafter, referred to as the “KS score”) on the interval [-1, +1] to depict the EMP status of cell lines and tumors using a set of around 300 genes containing epithelial and mesenchymal associated ones. The higher the KS score is, the more mesenchymal a sample is [32]. Third, a multinomial logistic regression method implemented on NCI-60 expression data quantified the extent of EMT on the interval [0,2] (hereafter, referred to as the “MLR score”) by calculating the probabilities for a given sample to belong to E, M, or hybrid E/M states [33]. Three predictor genes, together with a few normalizers, are used to predict the EMT status using the MLR metric. Higher MLR scores depict a relatively enriched mesenchymal phenotype. Notably, all these scoring metrics have been originally trained on microarray datasets.
A previous study compared these three methods—each of which utilizes a distinct gene list and algorithm—and observed that these methods were largely well-correlated with one another in terms of quantifying EMP across multiple microarray datasets [34]. This analysis suggested that the EMT scores were concordant among one another, i.e., the 76GS scores correlated negatively with their MLR and KS counterparts, both of which positively correlated with one another (as the higher the 76GS scores are, the more epithelial the samples are, whereas in the case of KS and MLR, it is the opposite, the higher the scores are, the more mesenchymal the samples are). However, the following two key questions remain unanswered: (a) can all three of these scoring metrics quantify the EMP spectrum for bulk and single-cell RNA-seq data with the same level of consistency? (b) can these scores, all constructed on cancer-related datasets, be helpful in estimating the extent of EMP in non-cancer scenarios as well?
Here, we have addressed these limitations by analyzing multiple bulk and single-cell RNA-seq datasets, as well as investigating both microarray and RNA-seq datasets for the following two non-cancer cases where EMP has been reported: (a) lung diseases—chronic obstructive pulmonary disease (COPD) and fibrosis [35,36] and (b) reprogramming induced pluripotent stem cells (iPSCs) [37]. We demonstrate consistency amongst the EMT scoring metrics in quantifying the EMP spectrum across these biological contexts, as well as the heterogeneity of EMP phenotypes in single-cell RNA-seq datasets. Finally, through a pan-cancer analysis of RNA-seq data available via The Cancer Genome Atlas (TCGA), we show that the association of EMP with patient survival is context-specific. Despite using diverse gene-sets and methodology to quantify EMP, a convergence of these three methods suggests commonalities in the different trajectories that cells undergoing EMT/MET can take in a high-dimensional landscape. Moreover, our results offer proof-of-principle that these metrics, all of which were derived based on cancer, can successfully quantify EMP in other useful non-cancer biological contexts too.

2. Materials and Methods

2.1. Software and Datasets

We downloaded high-throughput transcriptomics data (bulk and single cell) from GEO and EMBL-EBI databases. Microarray datasets were downloaded using GEOquery R Bioconductor package [38]. TCGA expression and survival data were obtained from the UCSC Xena browser (https://xena.ucsc.edu/) (accessed on 18 November 2020). Statistical analysis, survival analysis and plots were all conducted in R version 4.0.3. Function ggplot was used for plots.A list of all softwares used and their URL is given in Table S9.

2.2. Preprocessing of Datasets

After downloading the HTS datasets, a quality check was performed using FASTQC [39] (https://www.bioinformatics.babraham.ac.uk/projects/fastqc/, accessed on 18 November 2020). Bulk and single-cell RNA seq data were aligned to reference genome (hg38/mm10, appropriately) using STAR- aligner [40]. Samtools [41] was used to modify alignment files (SAM/BAM), and htseq-count [42] was used to calculated the read counts. Using these read counts, TPM expression was calculated using custom scripts and log2 normalized TPM values were used for calculating the EMT scores. In the case of microarray datasets, they were preprocessed to obtain the gene-wise expression for each sample from probe-wise expression matrix. If there were multiple probes mapping to one gene, then the mean expression of all mapped probes was considered for that gene.

2.3. T-Test

Two-tailed Student’s t-test with unequal variance was performed to compare between samples in many bar plots. Error bars denoted the standard deviation (statistical significance at p < 0.05).

2.4. Calculation of EMT Scores

EMT scores were calculated using all three methods—76GS, KS, and MLR—as previously conducted for microarray datasets [34]. MLR method, which was designed for microarray datasets [33], was adjusted to work for HTS transcriptomics data as well. The KS method has two gene lists—one for cell line, one for tumor. The corresponding gene list was applied, depending on the dataset. A list of genes common among the different scoring metrics is given in Table S8.

2.5. MLR Model Applied to RNA-Seq

We adapted a previously developed method of quantifying EMT spectrum trained on and designed to predict microarray samples [33]. Briefly, VIM, CDH1, and CLDN7 transcripts were identified to maximally predict NCI-60 holdout samples in a leave-one-out assessment utilizing two-dimensional multinomial logistic regression (MLR). These, together with a list of 20 normalizers, enable the assignment of each input (CLDN7, VIM/CDH1) to an ordered triple (PE, PE/M, PM) that characterizes the probability that a signature belongs either to the Epithelial (E), Mesenchymal (M), or hybrid (E/M) group. This ordered triplet is then projected onto the interval [0,2] with 0 designating a fully epithelial signature, 1 maximally hybrid signature, and 2 fully mesenchymal signature.
To apply the microarray based MLR model to RNA-seq data, we utilized transcriptomic data available in both formats on biological replicates [43]. Using the data available in Figure 2 (2 biological replicates for each of 6 time points), we restricted our analysis to the intersection of microarray and RNA-seq transcripts for genes represented in positive abundance for both datasets. Linear regression to the average of each biological replicate, producing a total of 6 slope-intercept pairs:
y F P K M µ A r r a y = [ x F P K M   1 ] [ 1.17 1.19 1.21 1.22 1.22 1.20 6.82 7.04 7.26 7.31 7.10 6.93 ]
y T P M µ A r r a y = [ x T P M   1 ] [ 1.16 1.19 1.21 1.23 1.24 1.20 6.83 7.04 7.26 7.31 7.10 6.93 ]
which were then averaged to be used as the fit parameters for cross-platform assessment:
y ¯ F P K M = [ x ¯ µ A r r a y   1 ] [ 1.21 7.08 ] = [ x ¯ µ A r r a y   1 ] [ m F P K M b F P K M ]
y ¯ T P M = [ x ¯ µ A r r a y   1 ] [ 1.21 7.08 ] = [ x ¯ µ A r r a y   1 ] [ m T P M b T P M ]
From these, unique microarray values, x µ A r r a y , representative of RNA-seq values, may be calculated by the following inversion:
x µ A r r a y = ( y R N A S e q b R N A s e q ) / m R N A S e q .

2.6. Survival Analysis

Different metrics of survival data were obtained from TCGA cohort. All samples were divided into 76GShigh and 76GSlow, MLRhigh and MLRlow, KShigh and KSlow groups based on the mean (or median) of the respective scores of the samples. Kaplan–Meier analysis was performed using R package “survival” and plotted using R package “ggfortify”. A log rank test was used to calculate the p-values. The reported hazard ratio (HR) and confidence interval (95% CI) were estimated using cox regression.

2.7. ssGSEA

Single-sample GSEA (ssGSEA), an extension of Gene Set Enrichment Analysis (GSEA), calculates separate enrichment scores for each pairing of a sample and gene set. Each ssGSEA enrichment score represents the degree to which the genes in a particular gene set are coordinately up- or down-regulated within a sample. We used “HALLMARK_EMT” gene set from The Molecular Signatures Database (MSigDB) database and the scores were calculated using R package “ssgsea”.

3. Results

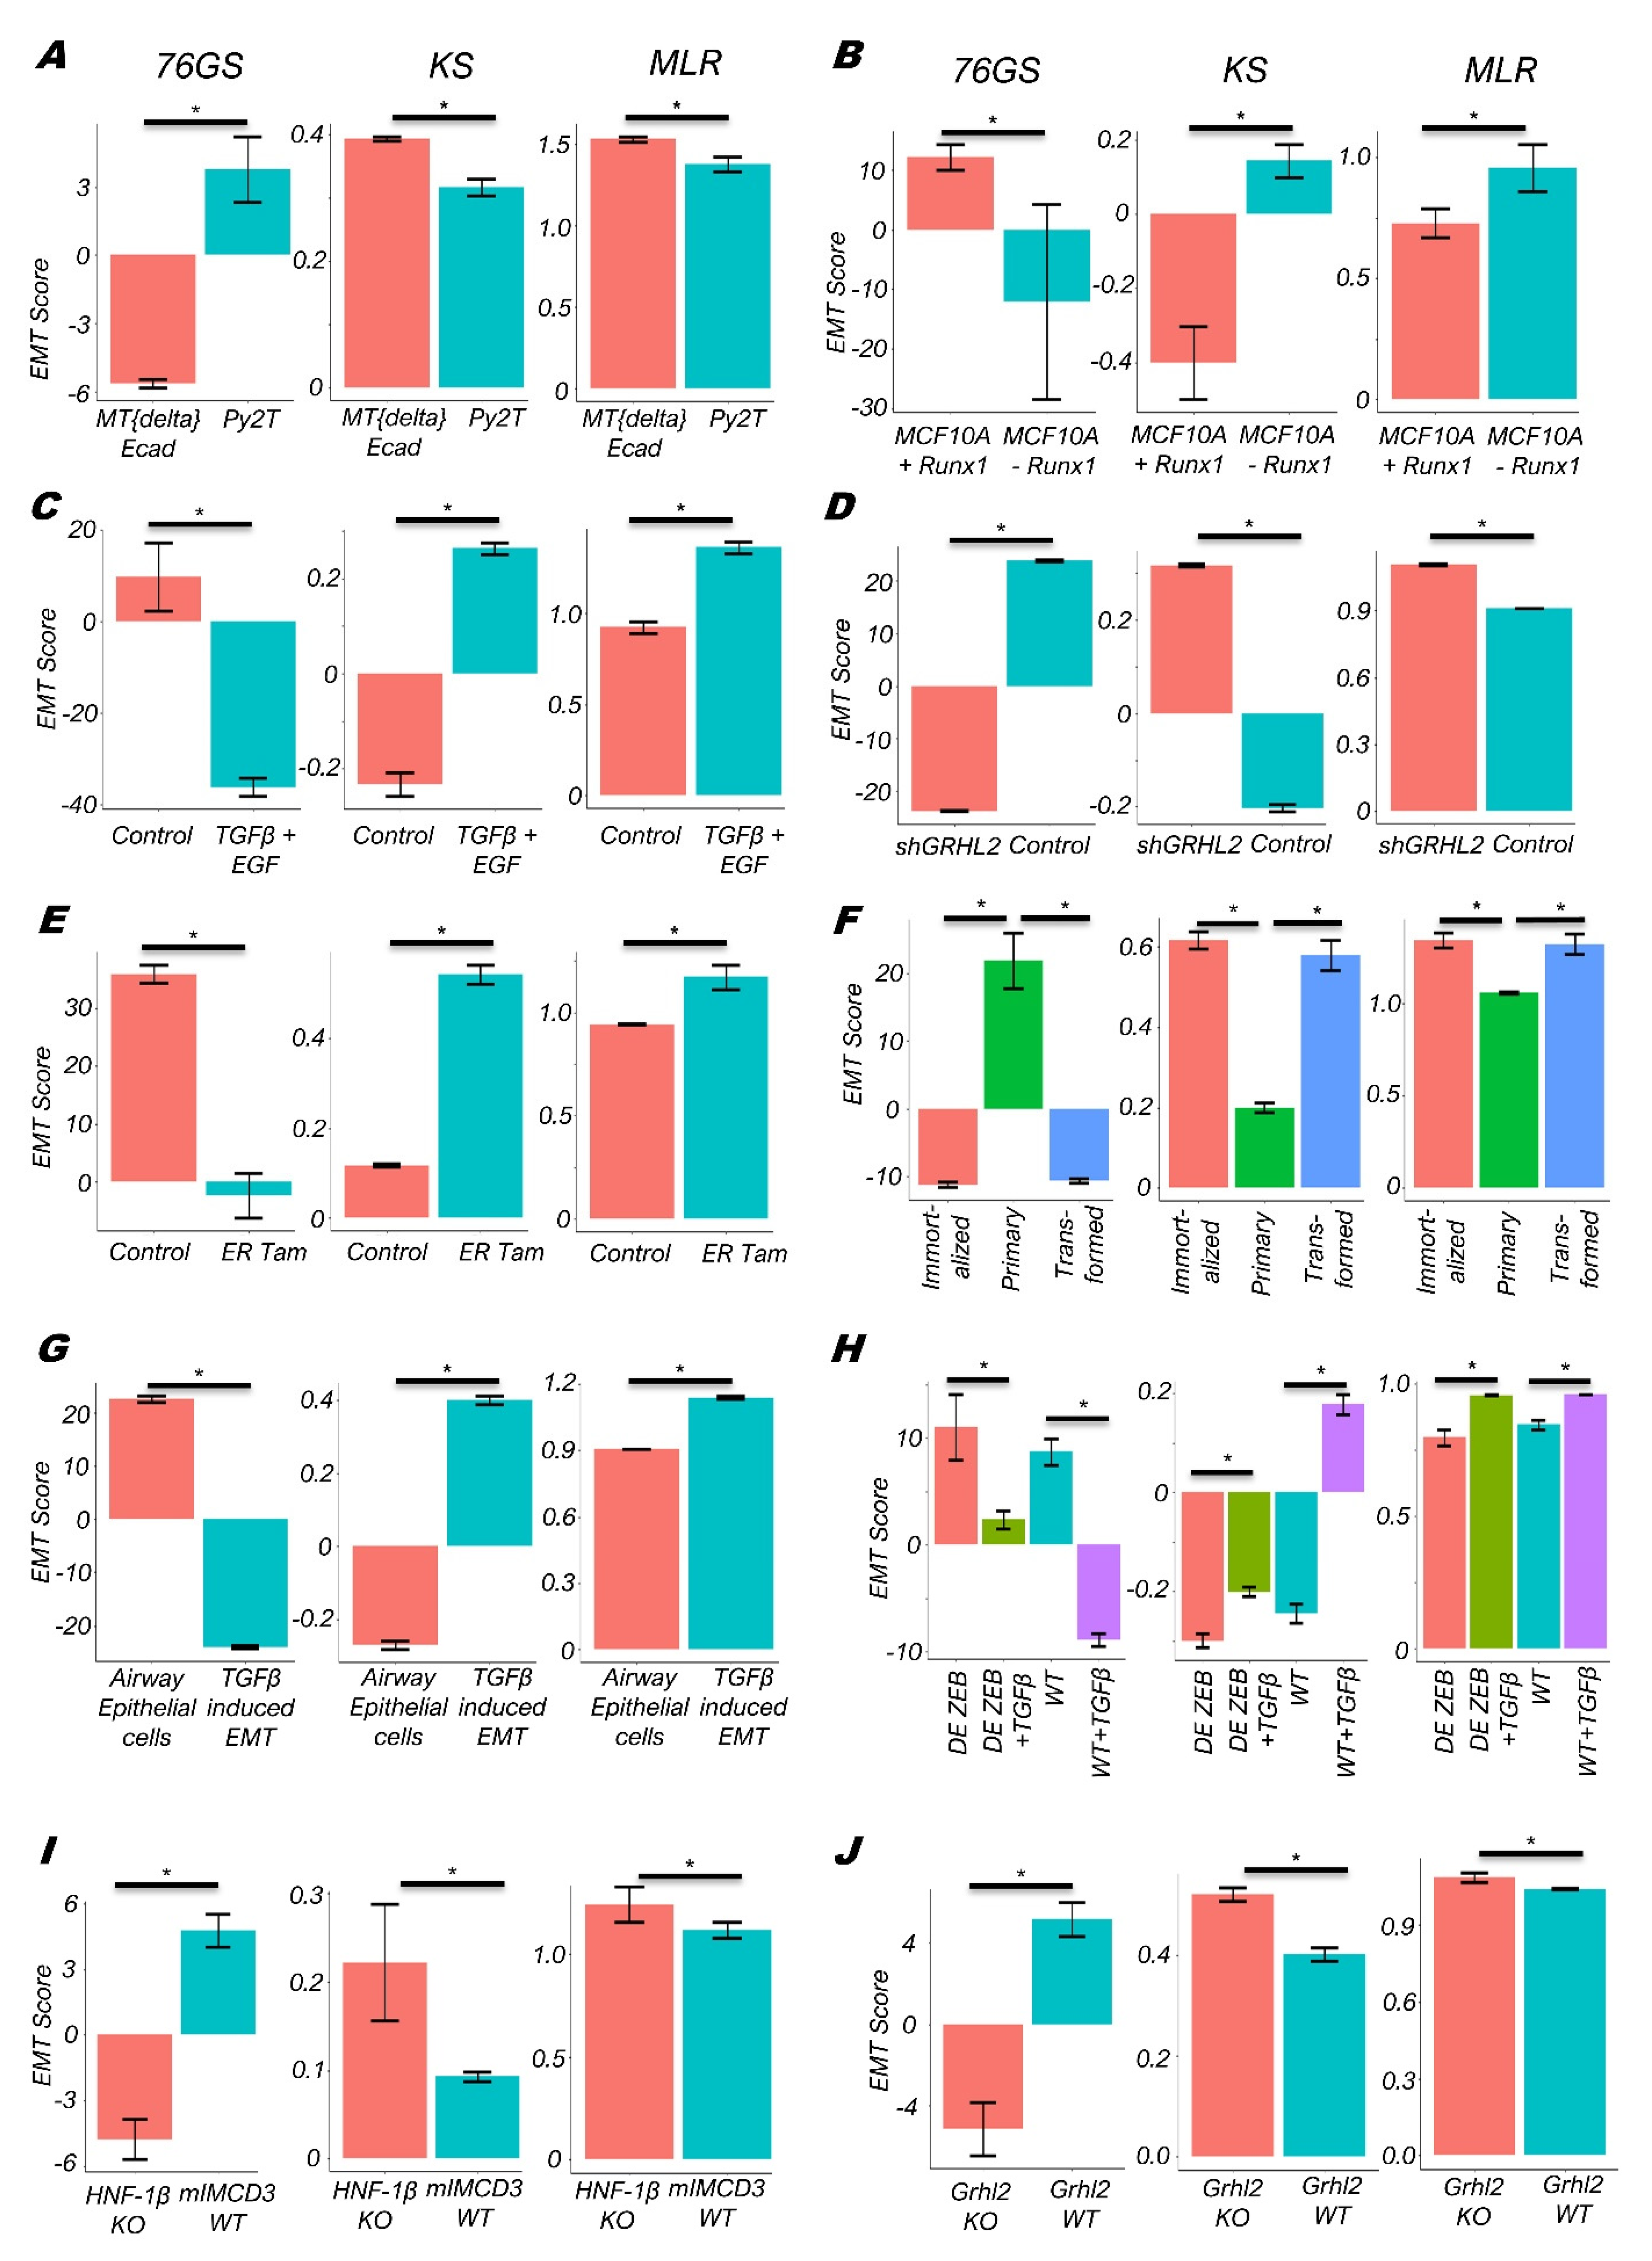
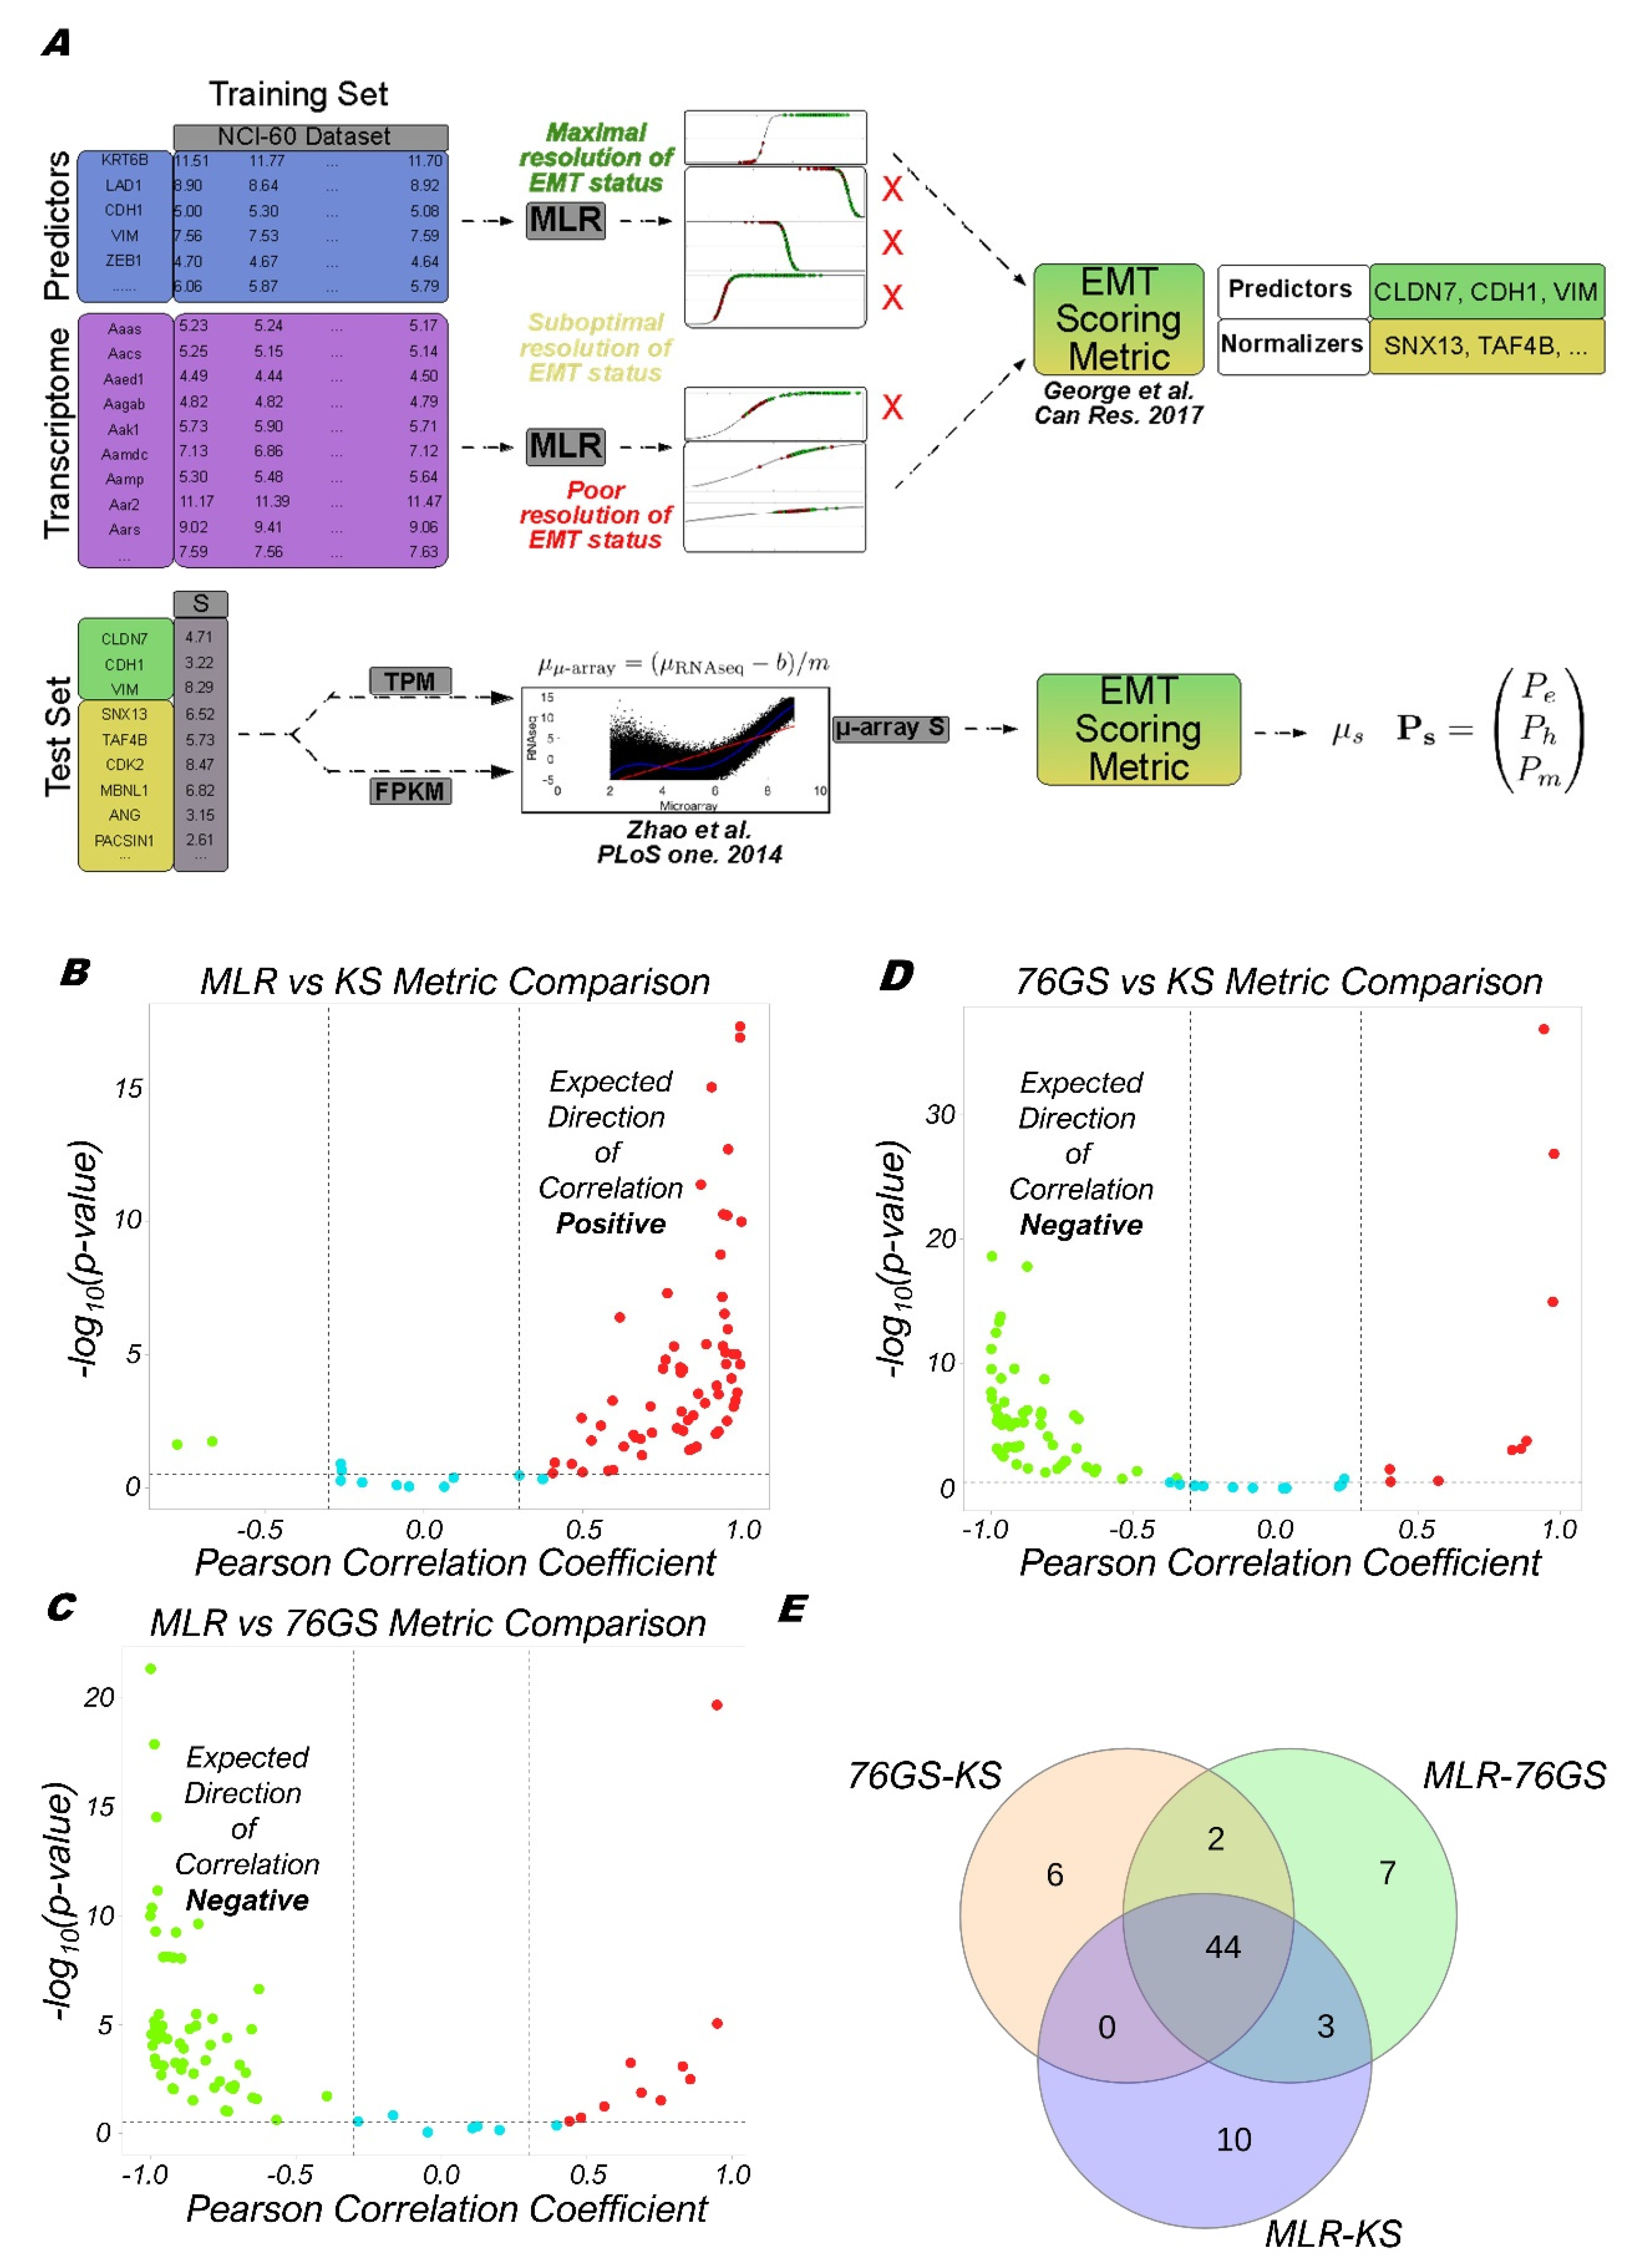
3.1. EMT Scoring Methods Show Concordant Trends across Bulk RNA-Seq Datasets

We used the three different EMT scoring methods—76GS, KS, and MLR—to quantify the extent of EMP in multiple RNA-seq datasets, as was previously conducted for microarray datasets [34]. Each method utilizes a distinct gene signature and underlying algorithm to compute an EMT score. The 76GS score is a weighted sum of the expression of 76 genes, where the weight factor is the correlation coefficient of that gene with the expression levels of CDH1 (E-cadherin), a canonical epithelial marker. Thus, a higher 76GS score corresponds to a more epithelial sample [30,31]. The KS scoring method compares the empirical distribution function to the cumulative distribution function for epithelial and mesenchymal signatures identified in cell lines and tumors. The KS score is constructed by taking the maximal difference in these distributions for each predictor, followed by normalization by the number of predictors, thus taking values between −1 and +1. Positive (resp. negative) KS scores correspond to a relative enrichment of the mesenchymal (resp. epithelial) signature [32]. The Multinomial Logistic Regression-based (MLR) method quantifies the extent of EMT on a scale of 0–2. MLR scores are calculated based on the probability of a given sample being assigned to the E, E/M, and M phenotypes. Thus, the higher the score is, the more mesenchymal the sample is [33]. While KS and 76GS methods operate on gene lists and can therefore be directly applied to both microarray and RNA-seq data, the MLR method utilizes the NCI-60 microarray data as a training set for regression. Therefore, applying these methods for analyzing RNA-seq data needs further customization, especially the MLR method.
We extended the previous MLR framework trained on the microarray-based transcriptomics of NCI-60 series to impute log2-normalized FPKM (Fragments Per Kilobase of transcript per million Mapped reads) or TPM (Transcripts Per Million) RNA-seq data. To achieve this, the log2 RNA-seq values for three predictors (CLDN7 (claudin 7), VIM (Vimentin), CDH1 (E-cadherin)) and 20 normalizers were linearly mapped to their corresponding microarray values (Figure 1A). This mapping was estimated for both FPKM- and TPM-normalized data by averaging over 24 previously published samples [43] where log2 microarray and log2 RNA-seq expression signatures were simultaneously available (Figures S1 and S2). The output of the updated MLR approach assigns a numerical EMT score, S, on the scale of [0,2] based on the probability of a sample’s categorization into one of the following three groups: E, E/M and M.
To check the concordance of these three EMT scoring metrics, we calculated the 76GS, KS, and MLR scores for 77 bulk high-throughput transcriptomics datasets. As expected, we found the 76GS scores to be negatively correlated (r < −0.3; p < 0.05) with the MLR and KS scores and found a positive correlation (r > 0.3; p < 0.05) between the MLR and KS scores across most datasets that contain cell lines and primary tumors across cancer types (Figure 1B–D; Table S1). A total of 44 out of the 77 (57.14%) datasets showed all three trends significantly (KS vs. MLR, MLR vs. 76GS, and 76GS vs. KS). Additionally, 52 (67.53%) cases exhibit the expected trends for 76GS vs. KS, similar to those seen for MLR vs. 76GS-56 (72.72%), and for MLR vs. KS-57 (74.02%) (Figure 1E). Furthermore, 72 datasets (93.5%) show concordance in the calculated EMT status/score in at least two of the three metrics. Thus, the MLR, 76GS, and KS scoring metrics show strong concordance among themselves for these 77 datasets.
Next, among these 77 datasets, we investigated several individual datasets where the EMT/MET phenomenon was induced in different tissues and cell lines. We found that the Py2T murine epithelial tumor cells that exhibit reversible EMT upon treatment with TGF-β in vitro had lower KS and MLR scores but higher 76GS scores as compared to the MTΔEcad cells that represent irreversible EMT murine mammary gland tumor cells (Figure 2A; GSE118612) [44]. Thus, all three EMT scores captured the expected trend of Py2T cells being more epithelial relative to MTΔEcad (murine breast cancer cells with ablated E-cadherin). Further, in mammary epithelial cells (MCF10A), the depletion of Runx1 results in striking morphological changes consistent with EMT [45]. Consistently, Runx1 depleted MCF10A cells had higher KS and MLR scores, but lower 76GS scores (Figure 2B; GSE85857). Similarly, TGF-β-treated primary airway epithelial cells as well as TGF-β- and EGF-treated HeLa cells had a more mesenchymal profile as assessed by 76GS, KS and MLR scores, consistent with their reported experimental trends (Figure 2C,D; GSE72419, GSE61220) [46,47]. These scores were also able to recapitulate in vitro observations that, while TGF-β treatment was able to induce EMT in MCF10A cells, the extent of EMT induced was decreased upon the knockdown of ZEB1 (Figure 2E, GSE1248423) [48], a key EMT-inducing transcription factor in many cancers [49]. ZEB1 forms a mutually inhibitory feedback loop with GRHL2, a crucial MET-inducing factor, and the knockdown of GRHL2 is known to push epithelial or hybrid E/M cells into a more mesenchymal phenotype [50,51,52,53]. Therefore, the OVCA429 cells with GRHL2 knockdown had higher MLR and KS scores, but reduced 76GS scores, as compared to the control, reflective of their more mesenchymal status (Figure 2F, GSE118407) [54]. Similarly, Grhl2-null embryos had reduced levels of other gatekeepers of the epithelial phenotype (Ovol1, Ovol2, and miR-200 family [52,55,56]) and elevated levels of Zeb1, commensurate with their altered KS, 76GS, and MLR scores (Figure 2G, GSE106130) [57]. ZEB1 is directly activated by Twist [58], another well-characterized EMT inducer [59]. Thus, the activation of Twist in HMLE (human mammary gland epithelial cells) corresponded to higher KS and MLR scores and reduced 76GS scores (Figure 2I; GSE139074) [60].
Similarly, these scoring metrics could recapitulate the activation of EMT in pre-malignant immortalized and Ras-transformed HMECs (human mammary epithelial cells) as compared to primary HMECs (GSE110677; Figure 2H). Finally, in the context of renal fibrosis caused by the loss of HNF-1β [61], HNF-1β deficient renal epithelial cells mIMCD3 showed upregulated mesenchymal traits relative to wild-type cells, as again captured by the KS, 76GS, and MLR scores (Figure 2J; GSE97770) (Table S2). Together, these case studies demonstrate that each scoring metric can capture the extent of EMT induced upon various perturbations, consistent with the enrichment of EMT depicted by the Hallmark EMT geneset in MSigDB (Molecular Signature Database) (Figure S3) portal [62], in various cancer types as well as in human and mouse cancer cells.

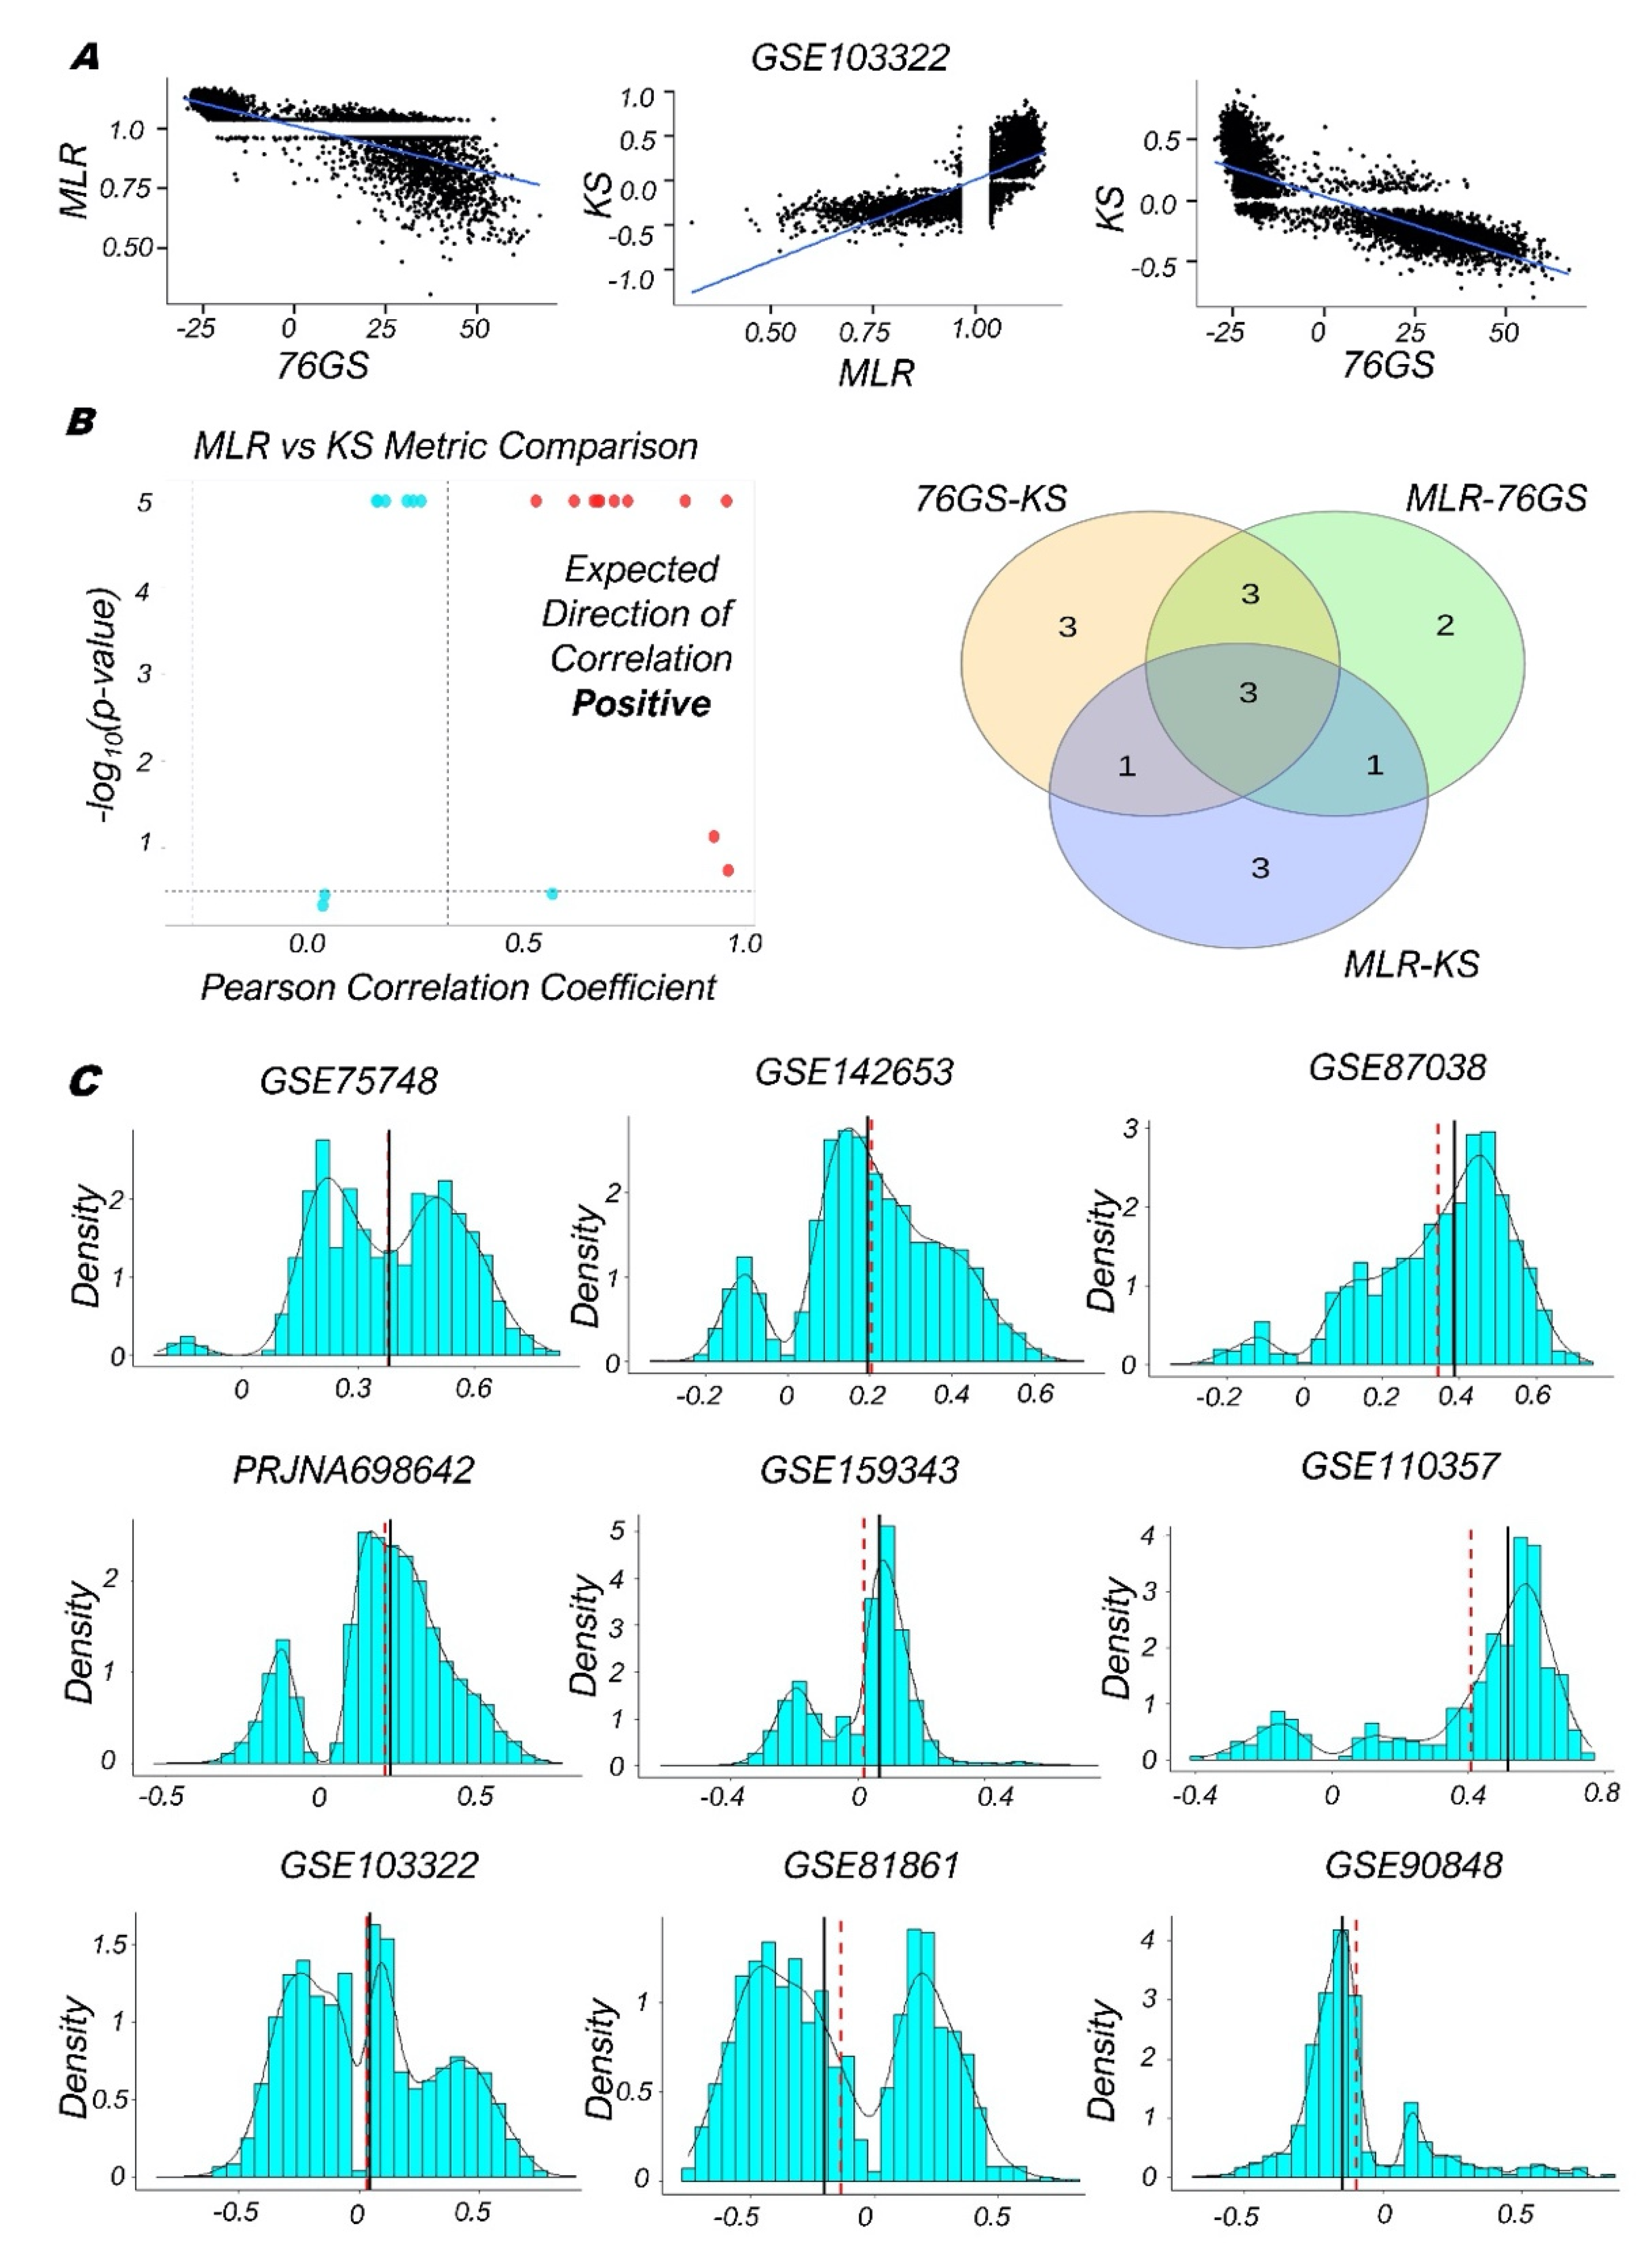
3.2. Single-Cell RNA-Seq Data Analysis Reveals Heterogeneity along the EMP Spectrum

After investigating bulk RNA-seq datasets, we calculated EMT scores for 17 single-cell RNA-seq datasets using 76GS, KS, and MLR metrics. For example, in a dataset containing 5902 single cells isolated from 18 patients with oral cavity tumors (head and neck squamous cell carcinoma), we observed a negative correlation between 76GS and KS scores, and between 76GS and MLR ones, with, however, a positive correlation between the KS and MLR scores (Figure 3A; GSE103322) [17]. This trend was largely seen across other single-cell RNA-seq datasets as well, where, similar to our previous results for bulk RNA-seq datasets, roughly 65% (11/17) of datasets showed a negative correlation for 76GS vs. KS scores, 59% (10/17) of datasets had a negative correlation for MLR vs. 76GS, and 53% (9/17) exhibited a positive correlation for MLR vs. KS (Figure 3B,C and Figure S4A). Thus, the concordant trends observed for these metrics using bulk transcriptomics were found to be conserved for single-cell RNA-seq datasets as well (Table S3).
Next, we plotted the histograms for the EMT scores of various single-cell RNA-seq datasets to decipher the heterogeneity seen along the EMP spectrum across a variety of biological contexts: 1. human embryonic stem-cell-derived progenitor cells differentiating to endoderm (GSE75748) [63]; 2. human fetal pituitary gland development including progenitors of many endocrine cell types and subtypes (GSE142653) [64]; 3. cells from different tissues and organs of E9.5 to E11.5 mouse embryos (GSE87038) [65]; 4. MCF10A cells treated with TGF-β for varying durations and exhibiting a gradual change in their EMT status (PRJNA698642) [66]; 5. murine pancreatic duct cells with variations along the EMP spectrum (GSE159343) [67]; 6. EpCAM+ and EpCAM- squamous skin carcinoma cells with varied epithelial and/or mesenchymal features (GSE110357) [68]; 7. cells from oral cavity tumors/head and neck squamous cell carcinoma (GSE103322) [17]; 8. human colorectal cancer cell lines and tumors (GSE81861) [69], and 9. mouse hair follicle stem cells and transit-amplifying cells (GSE90848) [70]. Across these cases, we observed two distinct peaks in KS scoring metrics (Figure 3C), suggesting the presence of at least two major subpopulations with varied EMT status.
Of note, several plots for the 76GS and MLR metrics appeared saturated, which we hypothesized related to the relative sparsity of the predictor signal in the single cell datasets. For the MLR approach, we then restricted our analysis to datasets with at least 90% of all single-cell samples containing nonzero entries for each predictor, indicating the presence of measurable signal. In these cases, MLR and 76GS metrics were able to recapitulate the trends observed in KS for many such datasets (Figure S5A,B).

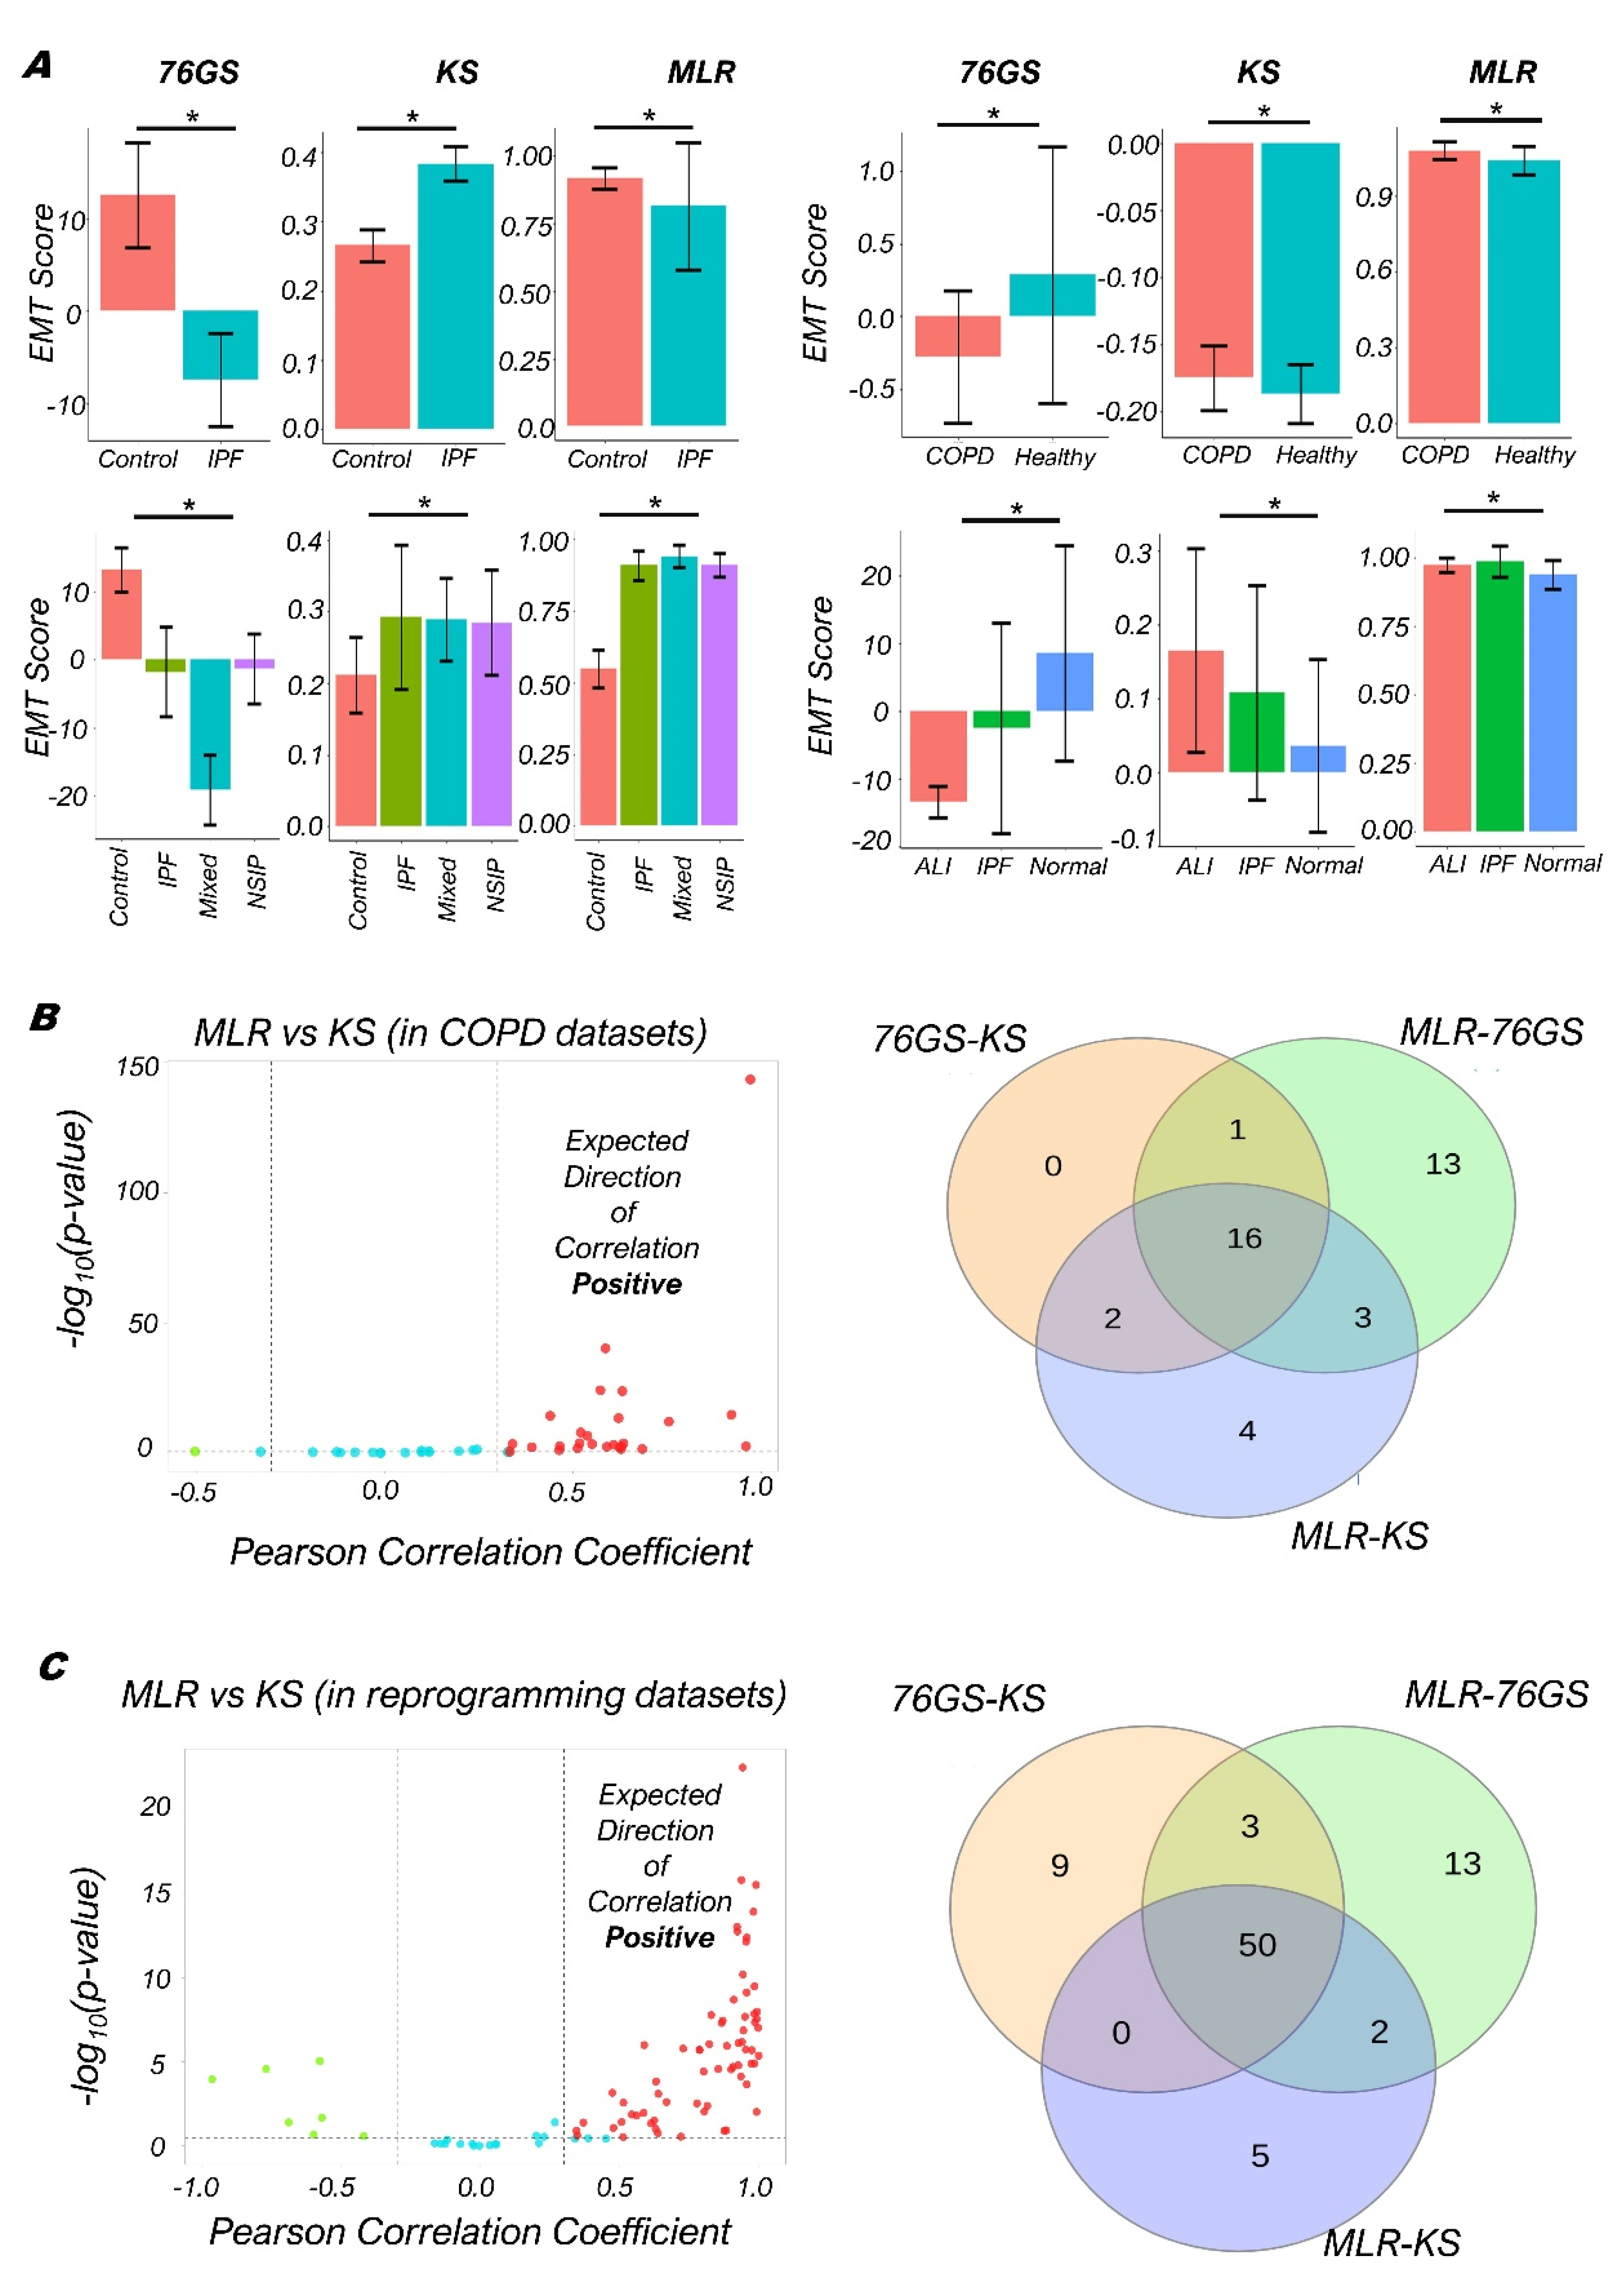
3.3. Quantifying the EMP Spectrum during Lung Diseases and Cellular Reprogramming

All of the three EMT metrics (76GS, KS, MLR) have been designed and/or trained for quantifying the EMT status in cancer samples [30,32,33], but our single-cell RNA-seq data analysis suggests their applicability in various developmental contexts. Thus, we investigated if they can be broadly applied to quantifying the EMT status in biological processes other than cancer. For non-cancer biological contexts, we had not previously looked at EMT score calculations in either microarray or RNA-Seq datasets; thus, for both microarray and RNA-seq datasets (Table S4), we used these metrics to calculate the EMT status for lung diseases including chronic obstructive pulmonary disease (COPD) and idiopathic pulmonary fibrosis (IPF) where EMT is reported to be involved in initiating and/or aggravating the disease [35].
As compared to normal lung tissues, the fibrotic lung tissues from IPF patients had higher KS scores but lower 76GS scores, indicating their enhanced mesenchymal status (Figure 4A, i; GSE72073); however, the MLR scores show opposite trends than expected. Fibrotic lung tissues had reduced levels of USP13, a deubiquitylase that stabilizes PTEN, and in vitro analysis suggested that USP13 deficiency increased the invasive and migratory capacities of fibroblasts, traits usually associated with EMT [71]. Similarly, relative to healthy volunteers, COPD patients showed increased EMT in their bronchoalveolar lavage (BAL) cells (Figure 4A, ii; GSE73395) [72]. Consistently, as compared to normal lung tissue, patients with any of the three lung pathological situations—IPF, non-specific interstitial pneumonia (NSIP) and mixed IPF-NSIP—exhibited trends of enhanced EMT (Figure 4A, iii; GSE110147) [73]. Further, RNA-seq analysis of lung tissues of patients with acute lung injury (ALI) and IPF had higher MLR and KS scores but reduced 76GS scores (Figure 4A, iv; GSE134692), consistent with earlier reports [74,75,76].
After investigating these few examples, we analyzed the trends among the KS, MLR, and 76GS scores obtained for 46 microarray or RNA-seq datasets associated with lung injury. Reinforcing the trends seen for cancer-related datasets, 76GS and MLR scores were negatively correlated in roughly 72% (33/46) of datasets. Similarly, 76GS and KS scores correlated negatively in ~41% (19/46) of datasets. Further, KS and MLR scores correlated positively in ~54% (25/46) of datasets (Figure 4B and Figure S4B). Overall, we see a strong concordance among the three EMT scoring metrics for non-cancerous lung diseases too. Thus, for patients suffering from IPF, COPD, or lung injury, tracking their EMT status can help identify the degree of progression of the disease.
Further, we investigated a set of datasets related to the cellular reprogramming of differentiated cell types to induced pluripotent stem cells (iPSCs), where EMT/MET are reportedly involved [37] (Table S5). Across the 92 datasets for which we calculated the 76GS, KS, and MLR EMT scores, roughly 62% (57/92) showed a positive correlation between MLR and KS, while 67% (62/92) showed a negative correlation between KS and 76GS, and approximately 74% (68/92) showed a negative correlation between the corresponding 76GS and MLR ones. Overall, 54% (50/92) of datasets demonstrated all three pairwise correlations to be strong (Figure 4C and Figure S4C), thus endorsing that these EMT scoring metrics can be quite consistent with one another in terms of identifying the EMP status of cells en route to cellular reprogramming.

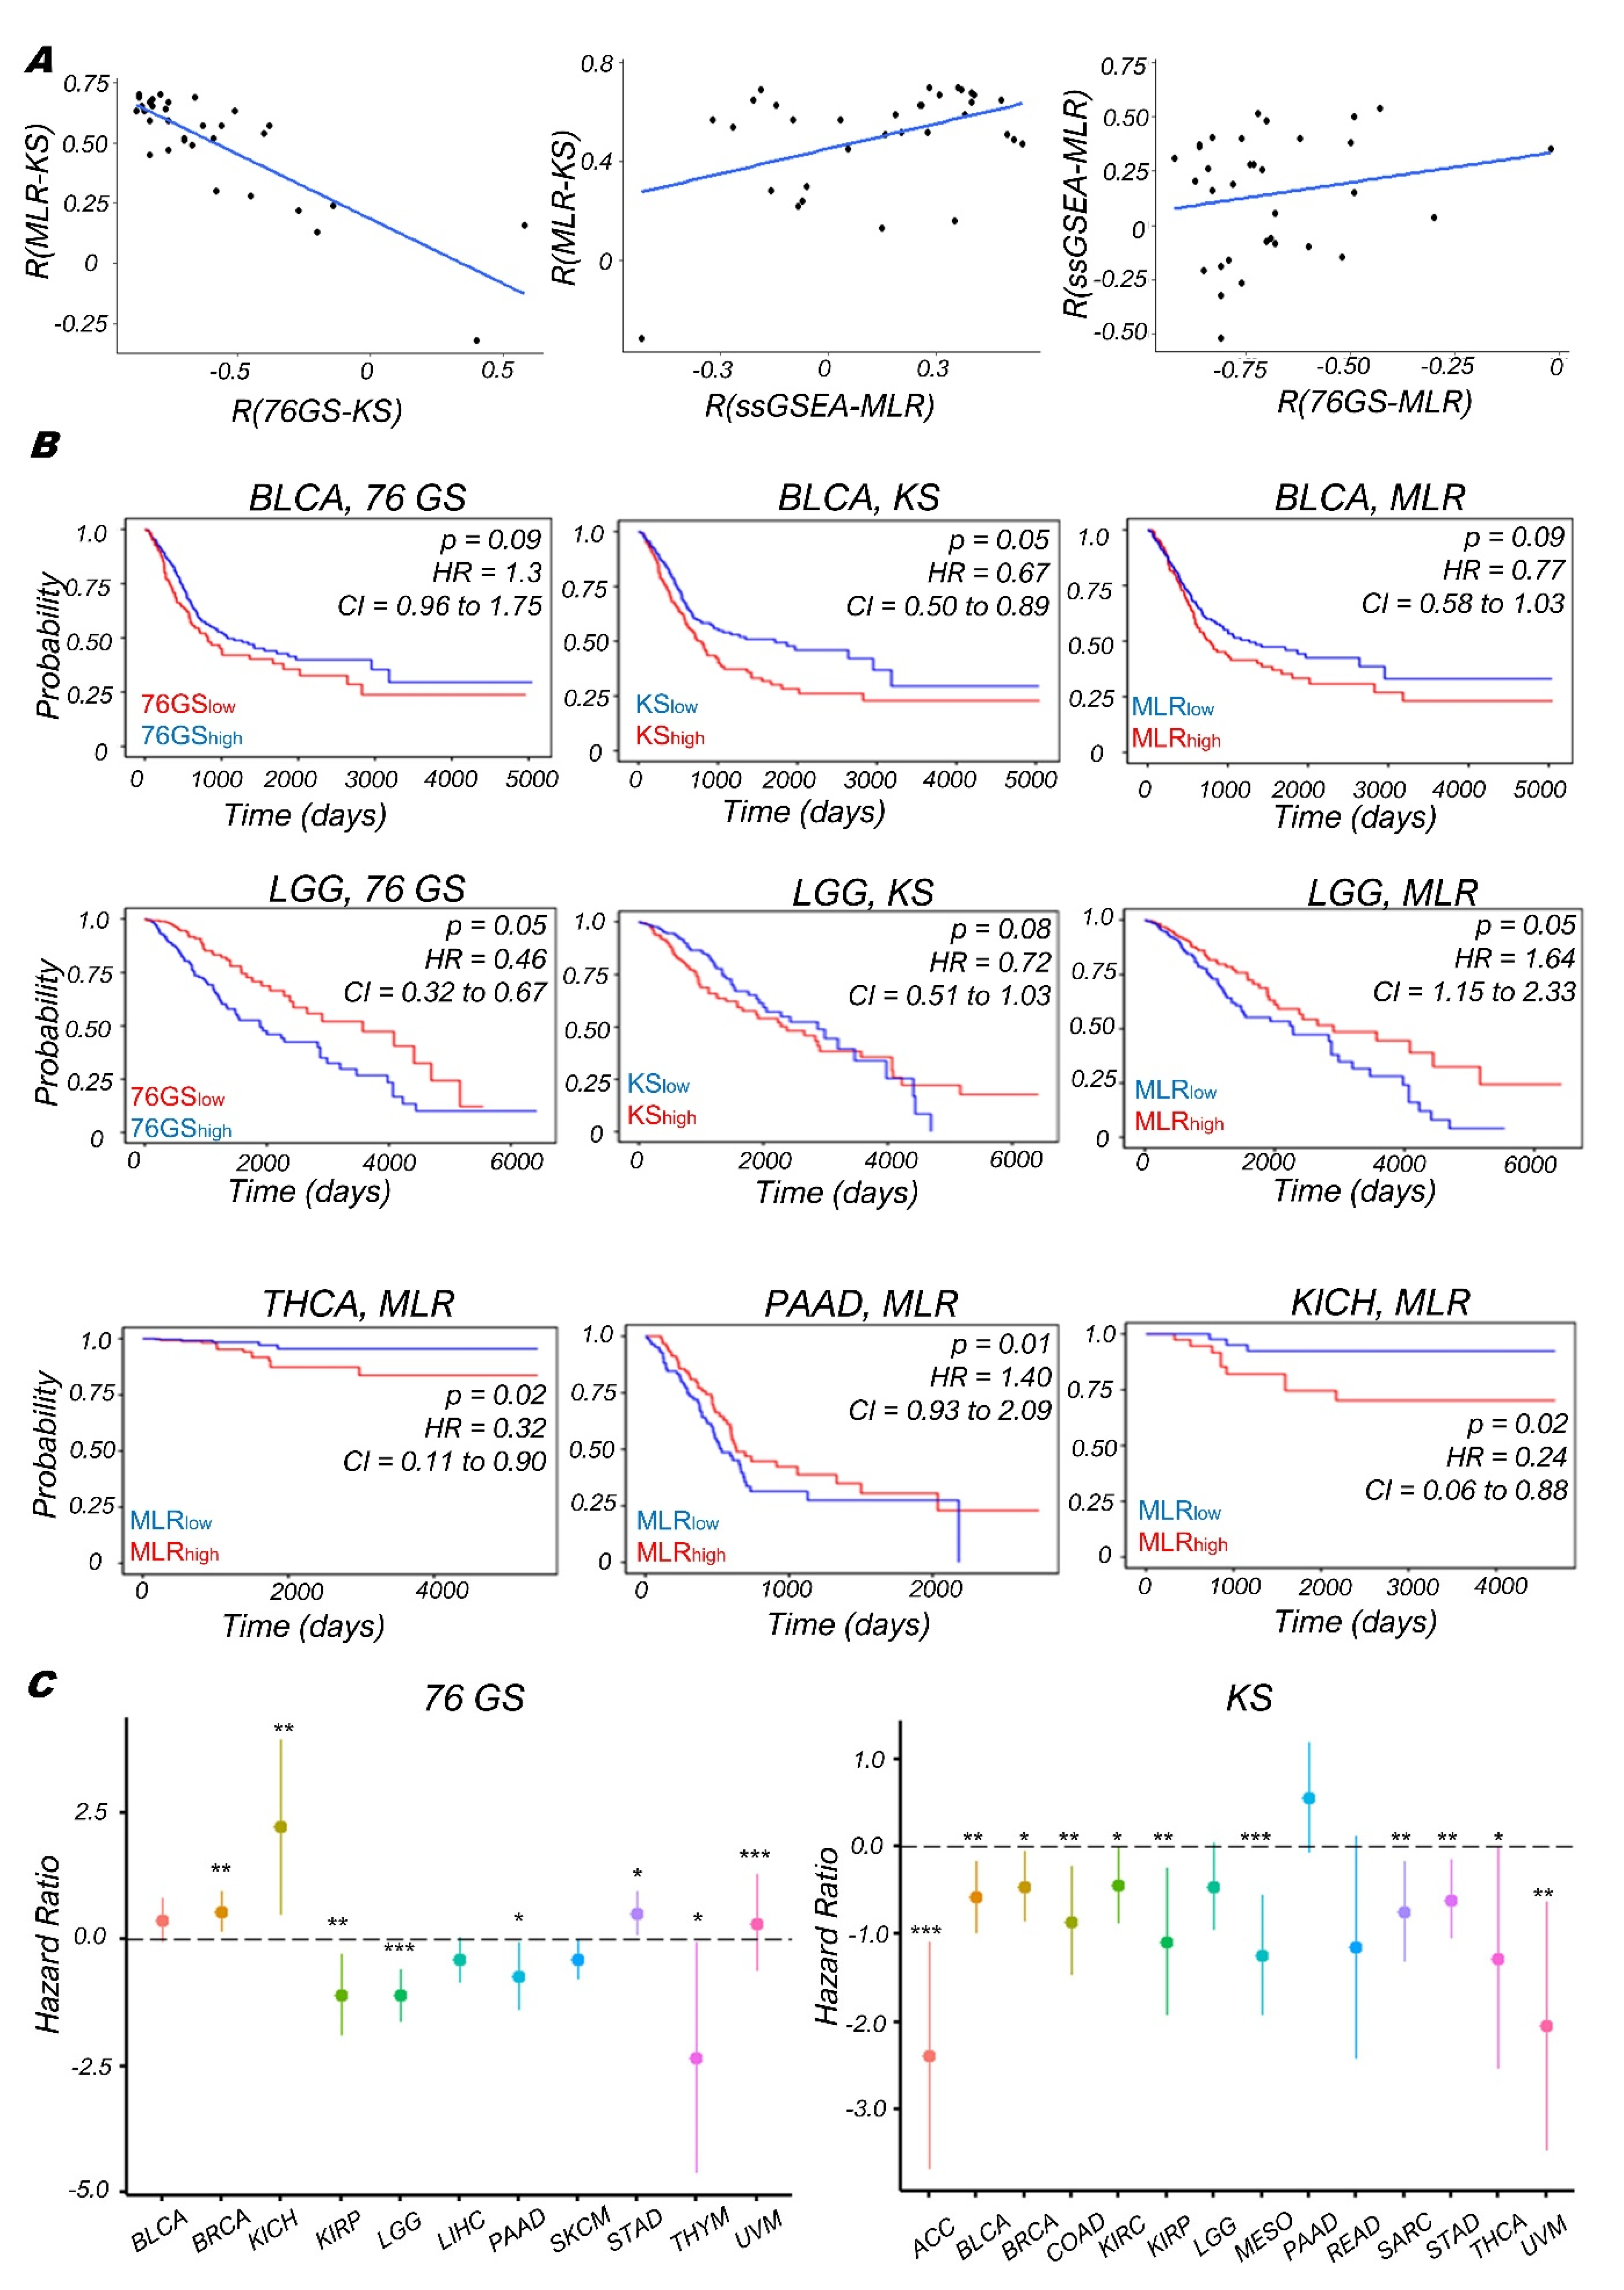
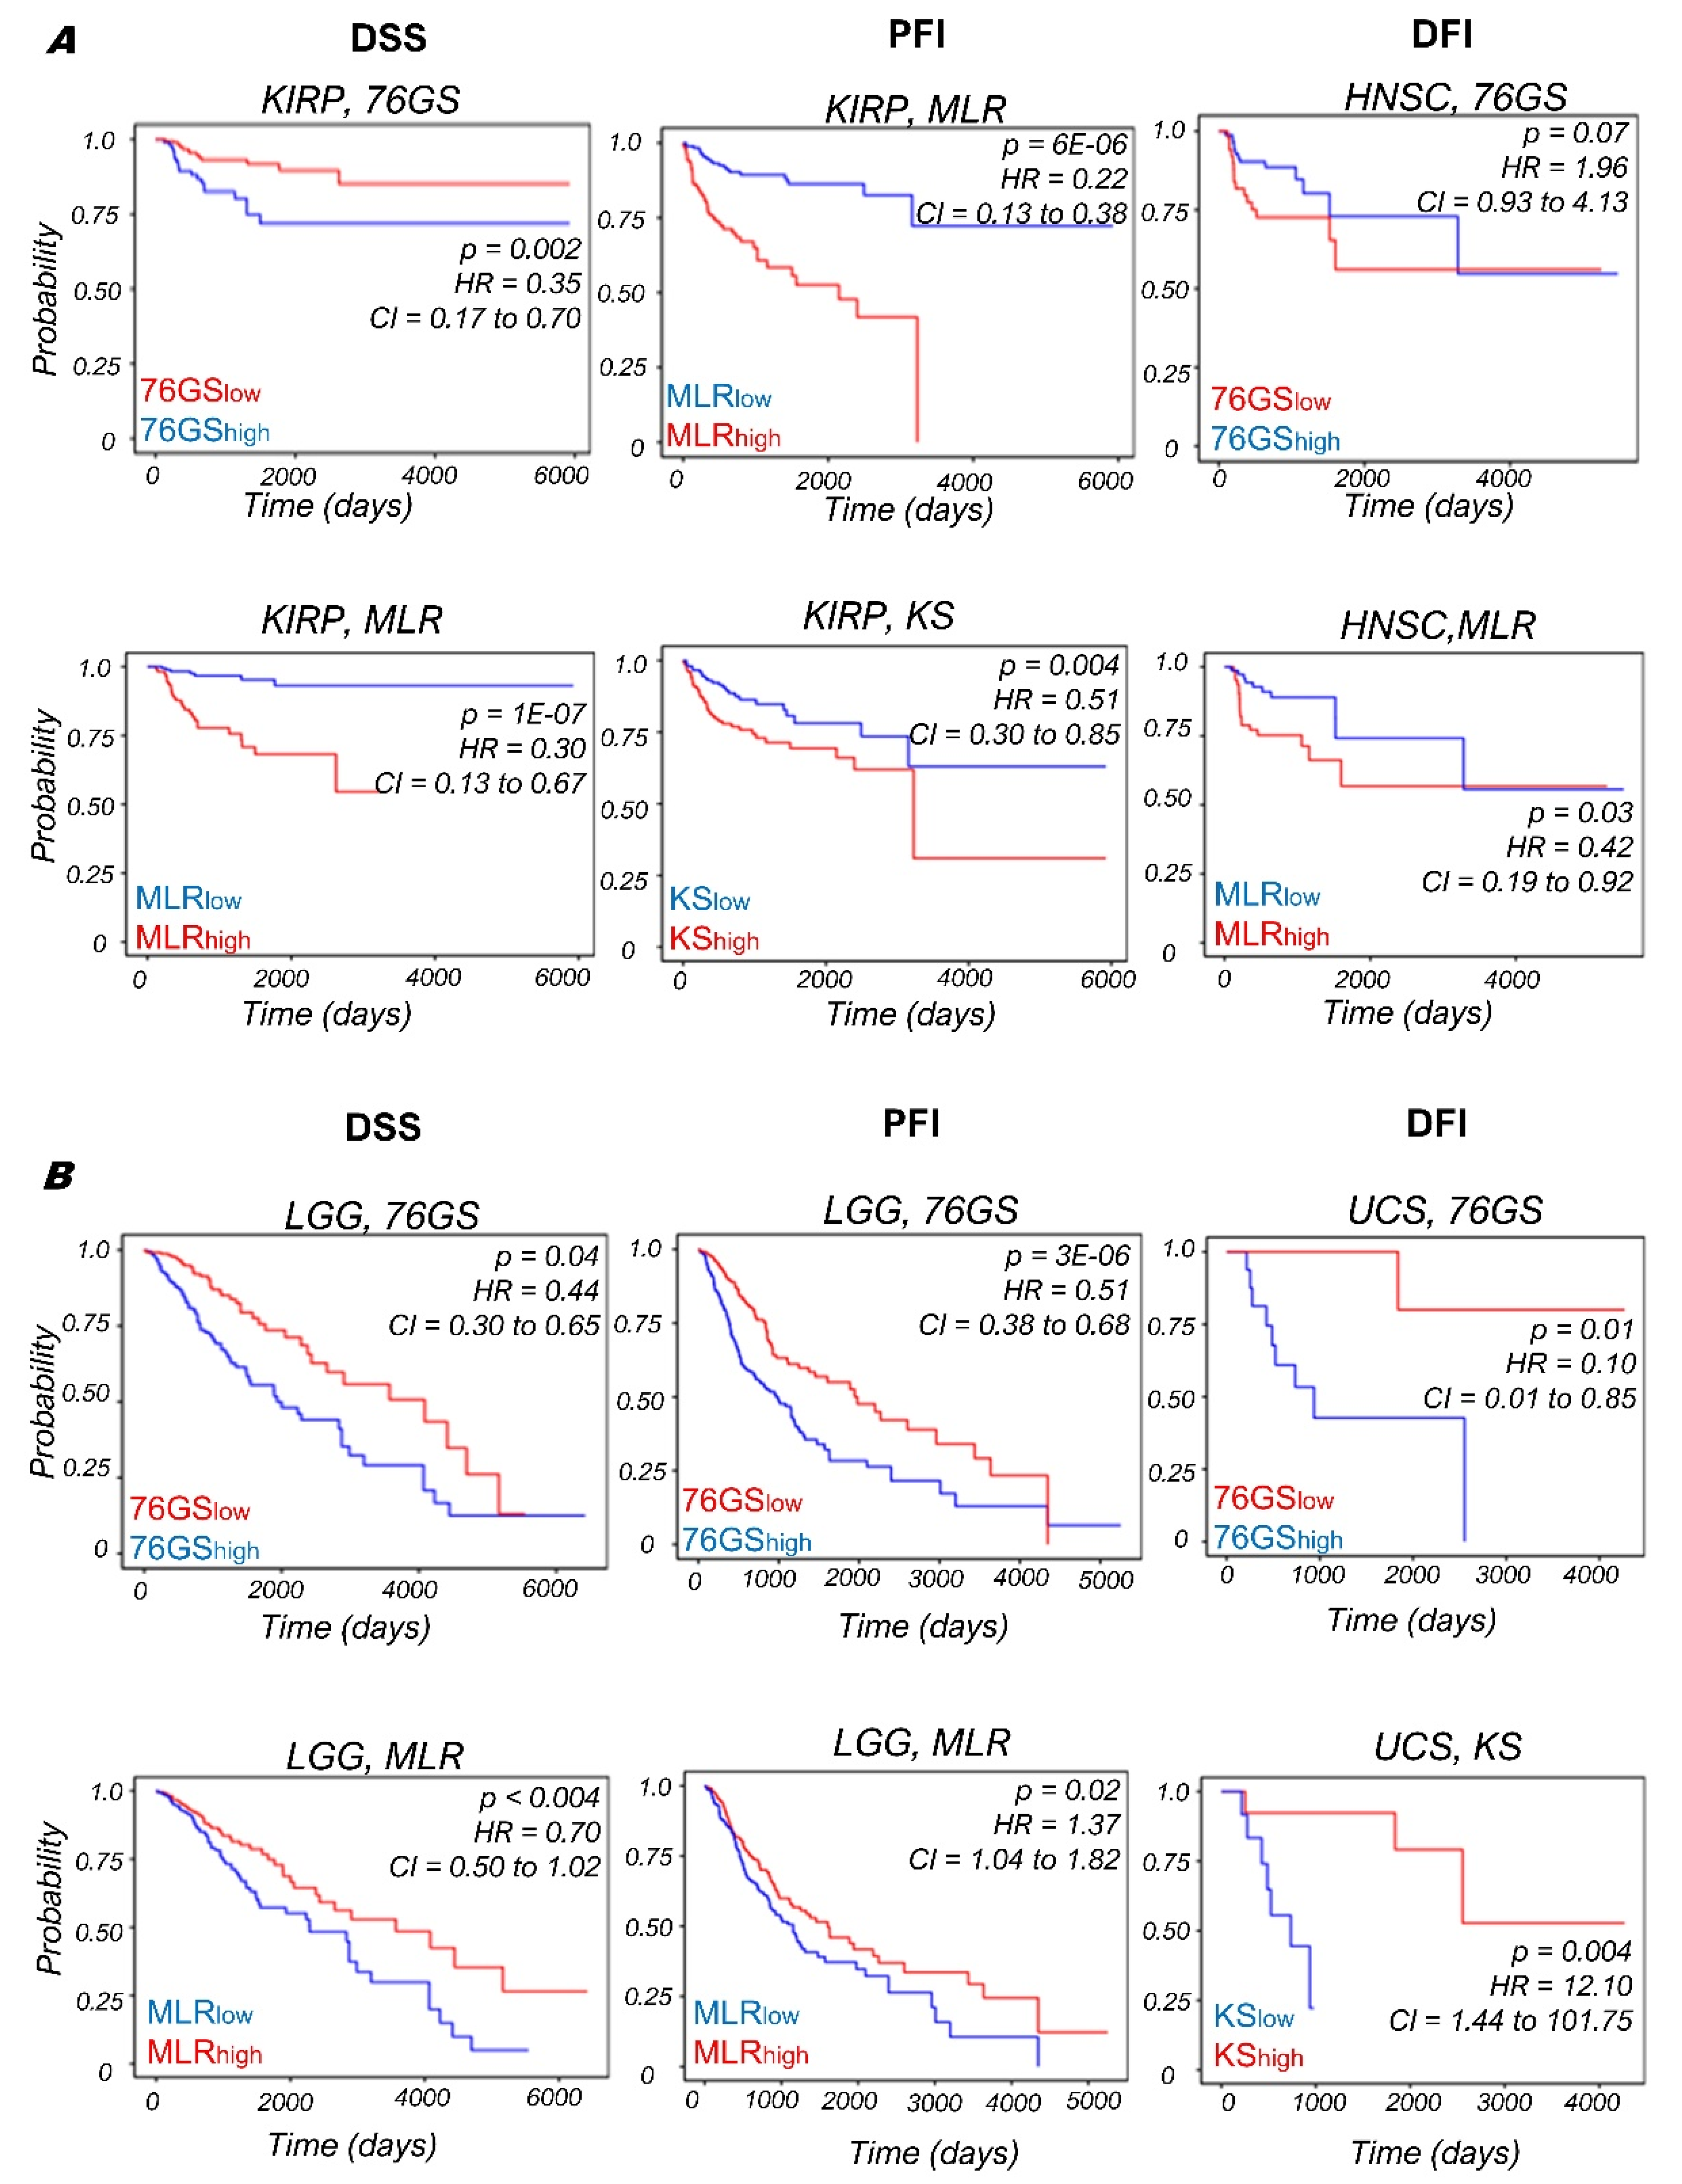
3.4. Context-Specific Association of EMP Status with Patient Survival

Next, we quantified the EMT scores in patient samples using TCGA datasets of various cancer types. Here, also we found the expected trends that the 76GS scores show negative correlation with the MLR and KS scores and KS and MLR scores are positively correlated to each other (Figure 5A), reinforcing our observations for a pan-cancer analysis of microarray datasets (Table S6) [77]. We also calculated Single-set Gene Set Enrichment Analysis (ssGSEA scores) [78] using the EMT gene set from MSigDB [62]. Each ssGSEA enrichment score represents the degree to which the genes in a particular gene set are coordinately regulated within a sample. We find that the ssGSEA scores for EMT show, as expected, a negative correlation with the 76GS scores and a positive correlation with the MLR and KS scores.
We also assessed the association between the EMT scores and patient survival using different survival data types (Overall survival (OS), Disease-Specific Survival (DSS), Progression free interval (PFI), and Disease-free interval (DFI)) in various TCGA cancer cohorts. The samples were scored using all three methods and segregated into high and low groups based on the mean value of each EMT score. The 76GSlow subgroup can be thought of as comparable to the MLRhigh and KShigh groups, given their relatively strong M signature. In bladder cancer (BLCA; Figure 5B, top), we see consistent trends in the case of overall survival (OS) for all three types of EMT scores that the stronger the M phenotype is, the worse the survival probability is; whereas in the case of Low-Grade Glioma (LGG), we see the opposite trend, that is, the stronger the M phenotype is, the better the survival probability is (Figure 5B, middle). Similarly, in Thyroid Cancer (THCA) and Kidney Chromophobe (KICH), higher MLR scores (a more M phenotype) reflect worse survival outcomes, but in pancreatic adenocarcinoma (PAAD), they associate with better outcomes (Figure 5B, bottom), indicating a context-specific association of the extent of EMT with patient survival. A pan-cancer analysis reveals further evidence for this context-specific behavior; hazard ratio (HR) > 1 and HR < 1 scenarios were both observed depending on the cancer subtype in TCGA (Figure 5C and Figure S6). For instance, in breast cancer (BRCA), stomach adenocarcinoma (STAD), and in uveal melanoma (UVM), similar to BLCA, stronger M phenotypes (as identified by KShigh or 76GSlow) corresponded to worse overall survival. However, similar to PAAD, for the cases of kidney renal papillary cell carcinoma (KIRP), thymoma (THYM), and low-grade glioma (LGG), the stronger the M phenotype is (as identified by 76GSlow), the better the survival is.
While the concept of EMP may not as be as stringently applicable to non-epithelial cancers such as LGG, these pan-cancer observations highlight the following two key aspects: (a) the categorization of patient samples with more vs. less M phenotypes is largely consistent across the three scoring metrics used, and (b) the often-assumed association of EMT with worse survival is not a universal feature; instead, it depends on the specific cancer subtype.
After investigating the OS data, we calculated the survival probabilities through other metrics as well—DSS, PFI and DFI, wherever available. For DSS, we found that the KIRP samples with a stronger M phenotype (as identified by MLRhigh or 76GSlow) reflect poorer survival. This trend held for PFI as well (Figure 6A; columns 1, 2); however, this is in contrast to the observations for KIRP for OS earlier. On the other hand, consistent with observations made for OS, for LGG samples, an improved DSS and PFI was associated with a stronger M phenotype (as identified by MLRhigh or 76GSlow) (Figure 6B; columns 1, 2). The DFI for Head and Neck Squamous Cancer (HNSC) indicates a worse prognosis associated with a stronger M phenotype (as identified by MLRhigh or 76GSlow) (Figure 6A; column 3), opposite to that seen for the case of Uterine Carcinosarcoma (UCS) (Figure 6B; column 3), indicating that the UCS samples with enriched M phenotypes correspond to improved disease-free survival. Together, the context-specific association of EMT with patient outcome in cancer types is visible across many clinical metrics—OS, DSS and PFI, suggesting caution in categorizing patients based on EMT for any treatment strategies (Table S7).

4. Discussion

Quantifying the spectrum of epithelial-hybrid-mesenchymal cell states in cancer has garnered recent interest due to a surge in the availability of in vitro and in vivo spatial and/or temporal dynamic and high-throughput data at multiple levels—transcriptomic, proteomic, epigenetic, metabolic, and morphological [66,79,80,81,82,83,84,85,86,87,88]. Phenotypic plasticity and heterogeneity along the EMP spectrum have been postulated to be a more important criteria for defining the survival fitness of a cancer cell population than the predominance of a specific phenotype [89,90], suggesting possible benefits to a more heterogeneous population through cooperation among cancer cells with varying EMP phenotypes [91,92]. For single cells, hybrid E/M phenotypes are believed to be the most plastic relative to their more “extreme” epithelial and mesenchymal counterparts; such plasticity can amplify the tumor-initiation ability [18,93]. Therefore, characterizing the EMP as a continuous spectrum instead of as an “all-or-none” process becomes imperative for an improved understanding of the emergent dynamics of EMT and MET, and their relevance to patient survival.
Here, we used three different EMT transcriptomic-based scoring metrics, each of which was developed using cancer cell lines and/or tumor samples and tested on microarray data previously to quantify the extent of EMT in a continuum—76GS, KS, MLR. Using these metrics, we calculated EMT scores for over 100 RNA-seq datasets—including at bulk and single-cell levels—across multiple biological contexts (cancer (Figure 2 and Figure 3), fibrosis, COPD, and cellular reprogramming to iPSC (Figure 4)). We observed that these methods show a high degree of concordance among themselves in their ability to identify the extent of EMT/MET a sample has undergone, despite using different gene lists and algorithms (Table S8). This concordance suggests an overlap of the core expression patterns central to EMT in a high-dimensional feature space and indicates that these metrics—initially developed for cancer samples—can be applied more generally to a broader range of biological contexts.
Using these metrics in biological contexts where hybrid E/M states have been proposed [35,94,95] may be helpful in mapping the corresponding trajectories of EMT/MET. The hybrid E/M state has been previously documented at both bulk and single-cell levels during various stages of development as well [65,96]; here, we have shown proof of the principle that these scoring metrics can successfully quantify the extent of EMP in mouse models. We are, however, not suggesting that any one particular method is better than the others. These scores are calculated using three different gene sets and different algorithms and still shows concordance in various biological contexts. Our results detail the concordance amongst the three methods on many of the testing examples, and in doing so, illustrate the context-specific strengths of each method. However, whether they can be adapted to adequately investigate the role of EMT in applications for other non-human model organisms remains to be investigated. Another direction of future work includes that given sufficient patient data, the EMT spectrum quantification within a given cancer subtype can provide an early forecast for disease aggressiveness based on historically aggressive EMT signatures.
In our analysis of single-cell RNA-seq data, the resolvability of bimodal distributions consistent with dual sub-populations was optimally characterized using the KS scoring metric. Improvements in the MLR and 76GS approaches were observed when restricting the analysis to datasets with non-zero MLR predictors for a majority (>90%) of the single-cell samples. These scores, while concentrated in the middle of the EMT interval, were able to recover features of the distributions observed via the KS method. Together, this suggests that the development of optimized signal-to-noise criteria, may improve the absolute placement of samples on the EMT MLR spectrum and is the focus of our ongoing research effort, building upon various tools used in the analysis presented here (Table S9). Future efforts should also consider how these metrics can be adapted to investigate different cell-state transition trajectories, for instance, by defining a two-dimensional (2D) EMT score that can deconvolute gains in the mesenchymal program vs. losses in the epithelial one [97]. The three EMT scoring metrics have been helpful in investigating the association of EMT/MET with other aspects of cellular plasticity such as stemness [98], immune evasion [99], and sensitivity to anti-cancer agents [100]. However, future work remains to be conducted on how to connect these data-based metrics with insights from mechanism-based dynamical models of EMT [101,102]. For instance, these data-based metrics can be used to validate whether EMT and MET follow similar trajectories in a high-dimensional landscape; recent transcriptomic and proteomic experiments suggest hysteresis [87,103], as has been identified from mechanism-based models [102].
Intriguingly, the EMT status of primary tumors was not found to be universally correlated with worse patient survival, but instead showed a context-dependent trend (Figure 5 and Figure 6), consistent with previous reports [32]. EMP is a highly dynamic trait. Thus, capturing static snapshots of gene expression profiles may not be sufficient for recapitulating the dynamic dependence of cancer cell fitness on EMT and/or MET. Thus, the EMT status and/or heterogeneity of a primary tumor may not reflect that of circulating tumor cells (CTCs) and their metastatic potential, leading to such observed context-specific trends. Moreover, transcriptomic profiles may not be sufficient to indicate phenotypic variability and incorporate epigenetic and/or metabolic status can elucidate the manifestations of dynamic adaptation during metastasis. Understanding the interplay among EMT, metabolic and epigenetic reprogramming [82,84,104,105,106,107,108] will be key for better patient stratification and therapeutic strategies.

Supplementary Materials

The following supporting information can be downloaded at: https://www.mdpi.com/article/10.3390/biom12010029/s1, Figure S1: Linear regression on log2 FPKM-normalized RNA-seq and log2 microarray correlation plots; Figure S2: Linear regression on log2 TPM-normalized RNA-seq and log2 microarray correlation plots; Figure S3: Bar plots showing ssGSEA scores of different datasets (ref Figure 2) calculated using EMT gene set from MSigDB; Figure S4: Concordance among KS, 76GS, and MLR metrics in multiple biological contexts; Figure S5: Heterogeneity in EMP; Figure S6: Kaplan–Meier analysis. Table S1: Details of 77 bulk RNA-seq datasets (GSE ID, PMID, no. of samples, and pairwise correlation coefficient and p-values); Table S2: Details of sample IDs in individual datasets that have been considered for comparative analysis in Figure 2; Table S3: Details of 19 single-cell RNA-seq datasets (GSE ID, PMID, no. of samples, and pairwise correlation coefficient and p-values); Table S4: Details of 46 RNA-seq and microarray datasets pertaining to COPD, IPF, and other lung diseases (GSE ID, PMID, no. of samples, and pairwise correlation coefficient and p-values); Table S5: Details of 92 RNA-seq and microarray datasets pertaining to cellular reprogramming (GSE ID, PMID, no. of samples, and pairwise correlation coefficient and p-values); Table S6: Details of datasets included in EMT-ome [77] together with pairwise correlation coefficient and p-values among EMT scoring metrics; Table S7: Details of survival analysis of cancer types from TCGA cohort (OS, DFI, DSS and PFI) containing Hazard Ratio (HR), 95% Confidence interval (CI) and corresponding p-values. Red suggests M is worse and Blue suggests E is worse. Dark color represents p < 0.05; light color denotes p < 0.1. Table S8: List of genes common across the three scoring metrics. Table S9: List of software used in this study.

Author Contributions

M.K.J., J.T.G. and H.L. conceived of and designed the research; M.K.J. and J.T.G. supervised the research; S.M., T.T., R.J., S.S. (Syamanthak Srikrishnan) and P.T. performed the research; S.M., T.T., S.S. (Sarthak Sahoo), P.C. and S.S.S. analyzed and interpreted the data. All authors contributed to manuscript writing. All authors have read and agreed to the published version of the manuscript.

Funding

M.K.J. was supported by Ramanujan Fellowship awarded by SERB, DST, Government of India (SB/S2/RJN-049/2018) and by the InfoSys Young Investigator Fellowship awarded by InfoSys Foundation, Bangalore. S.S.S. is supported by grants from Clifford Craig Foundation Launceston General Hospital and Rebecca L Cooper Medical Research Foundation. The work of J.T.G. and H.L. was supported by the National Science Foundation sponsored Center for Theoretical Biological Physics (award PHY-2019745) and by PHY-1605817.

Institutional Review Board Statement

Not applicable.

Data Availability Statement

All codes used in the manuscript are given at https://github.com/sushimndl/EMT_Scoring_RNASeq (accessed on 21 December 2021).

Conflicts of Interest

S.S.S. reports personal fees for lectures from Chiesi, outside the submitted work. All the other authors declare no conflict of interest.

References

  1. Gupta, G.P.; Massague, J. Cancer Metastasis: Building a Framework. Cell 2006, 127, 679–695. [Google Scholar] [CrossRef] [Green Version]
  2. Jolly, M.K.; Levine, H. Computational systems biology of epithelial-hybrid-mesenchymal transitions. Curr. Opin. Syst. Biol. 2017, 3, 1–6. [Google Scholar] [CrossRef]
  3. Nieto, M.A.; Huang, R.Y.; Jackson, R.A.; Thiery, J.P. EMT: 2016. Cell 2016, 166, 21–45. [Google Scholar] [CrossRef] [Green Version]
  4. Pal, A.; Barrett, T.F.; Paolini, R.; Parikh, A.; Puram, S.V. Partial EMT in head and neck cancer biology: A spectrum instead of a switch. Oncogene 2021, 40, 5049–5065. [Google Scholar] [CrossRef] [PubMed]
  5. Morel, A.-P.; Lièvre, M.; Thomas, C.; Hinkal, G.; Ansieau, S.; Puisieux, A. Generation of breast cancer stem cells through epithelial-mesenchymal transition. PLoS ONE 2008, 3, e2888. [Google Scholar] [CrossRef]
  6. Pasani, S.; Sahoo, S.; Jolly, M.K. Hybrid E/M phenotype(s) and stemness: A mechanistic connection embedded in network topology. J. Clin. Med. 2021, 10, 60. [Google Scholar] [CrossRef]
  7. Chen, L.; Gibbons, D.L.; Goswami, S.; Cortez, M.A.; Ahn, Y.H.; Byers, L.A.; Zhang, X.; Yi, X.; Dwyer, D.; Lin, W.; et al. Metastasis is regulated via microRNA-200/ZEB1 axis control of tumour cell PD-L1 expression and intratumoral immunosuppression. Nat. Commun. 2014, 1–12. [Google Scholar] [CrossRef] [PubMed]
  8. Tripathi, S.C.; Peters, H.L.; Taguchi, A.; Katayama, H.; Wang, H.; Momin, A.; Jolly, M.K.; Celiktas, M.; Rodriguez-Canales, J.; Liu, H.; et al. Immunoproteasome deficiency is a feature of non-small cell lung cancer with a mesenchymal phenotype and is associated with a poor outcome. Proc. Natl. Acad. Sci. USA 2016, 113, E1555–E1564. [Google Scholar] [CrossRef] [Green Version]
  9. Dongre, A.; Rashidian, M.; Reinhardt, F.; Bagnato, A.; Keckesova, Z.; Ploegh, H.L.; Weinberg, R.A. Epithelial-to-mesenchymal transition contributes to immunosuppression in breast carcinomas. Cancer Res. 2017, 77, 3982–3989. [Google Scholar] [CrossRef] [PubMed] [Green Version]
  10. Creighton, C.J.; Li, X.; Landis, M.; Dixon, J.M.; Neumeister, V.M.; Sjolund, A.; Rimm, D.L.; Wong, H.; Rodriguez, A.; Herschkowitz, J.I.; et al. Residual breast cancers after conventional therapy display mesenchymal as well as tumor-initiating features. Proc. Natl. Acad. Sci. USA 2009, 106, 13820–13825. [Google Scholar] [CrossRef] [Green Version]
  11. Sahoo, S.; Mishra, A.; Kaur, H.; Hari, K.; Muralidharan, S.; Mandal, S.; Jolly, M.K. A mechanistic model captures the emergence and implications of non-genetic heterogeneity and reversible drug resistance in ER+ breast cancer cells. NAR Cancer 2021, 3, zcab027. [Google Scholar] [CrossRef] [PubMed]
  12. Wang, Z.; Li, Y.; Kong, D.; Banerjee, S.; Ahmad, A.; Azmi, A.S.; Ali, S.; Abbruzzese, J.L.; Gallick, G.E.; Sarkar, F.H. Acquisition of epithelial-mesenchymal transition phenotype of gemcitabine-resistant pancreatic cancer cells is linked with activation of the notch signaling pathway. Cancer Res. 2009, 69, 2400–2407. [Google Scholar] [CrossRef] [PubMed] [Green Version]
  13. Brabletz, S.; Brabletz, T. The ZEB/miR-200 feedback loop--a motor of cellular plasticity in development and cancer? EMBO Rep. 2010, 11, 670–677. [Google Scholar] [CrossRef] [Green Version]
  14. Bierie, B.; Pierce, S.E.; Kroeger, C.; Stover, D.G.; Pattabiraman, D.R.; Thiru, P.; Liu Donaher, J.; Reinhardt, F.; Chaffer, C.L.; Keckesova, Z.; et al. Integrin-β4 identifies cancer stem cell-enriched populations of partially mesenchymal carcinoma cells. Proc. Natl. Acad. Sci. USA 2017, 114, E2337–E2346. [Google Scholar] [CrossRef] [PubMed] [Green Version]
  15. Sahoo, S.; Nayak, S.P.; Hari, K.; Purkait, P.; Mandal, S.; Kishore, A.; Levine, H.; Jolly, M.K. Immunosuppressive traits of the hybrid epithelial/mesenchymal phenotype. Front. Immunol. 2021, 12, 797261. [Google Scholar] [CrossRef]
  16. Godin, L.; Balsat, C.; Van Eycke, Y.; Allard, J.; Royer, C.; Remmelink, M.; Pastushenko, I.; Haene, N.D.; Blanpain, C.; Salmon, I.; et al. A Novel Approach for Quantifying Cancer Cells Showing Hybrid Epithelial/Mesenchymal States in Large Series of Tissue Samples: Towards a New Prognostic Marker. Cancers 2020, 12, 906. [Google Scholar] [CrossRef] [Green Version]
  17. Puram, S.V.; Tirosh, I.; Parikh, A.S.; Patel, A.P.; Yizhak, K.; Gillespie, S.; Rodman, C.; Luo, C.L.; Mroz, E.A.; Emerick, K.S.; et al. Single-Cell Transcriptomic Analysis of Primary and Metastatic Tumor Ecosystems in Head and Neck Cancer. Cell 2017, 171, 1611–1624. [Google Scholar] [CrossRef] [Green Version]
  18. Kröger, C.; Afeyan, A.; Mraz, J.; Eaton, E.N.; Reinhardt, F.; Khodor, Y.L.; Thiru, P.; Bierie, B.; Ye, X.; Burge, C.B.; et al. Acquisition of a hybrid E/M state is essential for tumorigenicity of basal breast cancer cells. Proc. Natl. Acad. Sci. USA 2019, 116, 7353–7362. [Google Scholar] [CrossRef] [Green Version]
  19. Pastushenko, I.; Blanpain, C. EMT Transition States during Tumor Progression and Metastasis. Trends Cell Biol. 2019, 29, 212–226. [Google Scholar] [CrossRef] [Green Version]
  20. Huang, R.Y.-J.; Wong, M.K.; Tan, T.Z.; Kuay, K.T.; Ng, A.H.C.; Chung, V.Y.; Chu, Y.-S.; Matsumura, N.; Lai, H.-C.; Lee, Y.F.; et al. An EMT spectrum defines an anoikis-resistant and spheroidogenic intermediate mesenchymal state that is sensitive to e-cadherin restoration by a src-kinase inhibitor, saracatinib (AZD0530). Cell Death Dis. 2013, 4, e915. [Google Scholar] [CrossRef] [Green Version]
  21. Simeonov, K.P.; Byrns, C.N.; Clark, M.L.; Norgard, R.J.; Martin, B.; Stanger, B.Z.; Shendure, J.; McKenna, A.; Lengner, C.J. Single-cell lineage tracing of metastatic cancer reveals selection of hybrid EMT states. Cancer Cell 2021, 39, 1150–1162. [Google Scholar] [CrossRef] [PubMed]
  22. Yu, M.; Bardia, A.; Wittner, B.S.; Stott, S.L.; Smas, M.E.; Ting, D.T.; Isakoff, S.J.; Ciciliano, J.C.; Wells, M.N.; Shah, A.M.; et al. Circulating breast tumor cells exhibit dynamic changes in epithelial and mesenchymal composition. Science 2013, 339, 580–584. [Google Scholar] [CrossRef] [Green Version]
  23. Saxena, K.; Subbalakshmi, A.R.; Jolly, M.K. Phenotypic heterogeneity in circulating tumor cells and its prognostic value in metastasis and overall survival. EBioMedicine 2019, 46, 4–5. [Google Scholar] [CrossRef] [PubMed] [Green Version]
  24. Lecharpentier, A.; Vielh, P.; Perez-Moreno, P.; Planchard, D.; Soria, J.C.; Farace, F. Detection of circulating tumour cells with a hybrid (epithelial/mesenchymal) phenotype in patients with metastatic non-small cell lung cancer. Br. J. Cancer 2011, 105, 1338–1341. [Google Scholar] [CrossRef] [Green Version]
  25. Bocci, F.; Mandal, S.; Tejaswi, T.; Jolly, M.K. Investigating epithelial-mesenchymal heterogeneity of tumors and circulating tumor cells with transcriptomic analysis and biophysical modeling. Comput. Syst. Oncol. 2021, in press. [Google Scholar] [CrossRef]
  26. Jolly, M.K.; Boareto, M.; Debeb, B.G.; Aceto, N.; Farach-Carson, M.C.; Woodward, W.A.; Levine, H. Inflammatory Breast Cancer: A model for investigating cluster-based dissemination. NPJ Breast Cancer 2017, 3, 21. [Google Scholar] [CrossRef] [Green Version]
  27. Aceto, N.; Bardia, A.; Miyamoto, D.T.; Donaldson, M.C.; Wittner, B.S.; Spencer, J.A.; Yu, M.; Pely, A.; Engstrom, A.; Zhu, H.; et al. Circulating tumor cell clusters are oligoclonal precursors of breast cancer metastasis. Cell 2014, 158, 1110–1122. [Google Scholar] [CrossRef] [Green Version]
  28. Cheung, K.J.; Padmanaban, V.; Silvestri, V.; Schipper, K.; Cohen, J.D.; Fairchild, A.N.; Gorin, M.A.; Verdone, J.E.; Pienta, K.J.; Bader, J.S.; et al. Polyclonal breast cancer metastases arise from collective dissemination of keratin 14-expressing tumor cell clusters. Proc. Natl. Acad. Sci. USA 2016, 113, E854–E863. [Google Scholar] [CrossRef] [Green Version]
  29. Jolly, M.K.; Murphy, R.; Bhatia, S.; Whitfield, H.J.; Redfern, A.; Davis, M.J.; Thompson, E.W. Measuring and Modelling the Epithelial- Mesenchymal Hybrid State in Cancer: Clinical Implications. Cells Tissues Organs 2021, in press. [Google Scholar] [CrossRef]
  30. Byers, L.A.; Diao, L.; Wang, J.; Saintigny, P.; Girard, L.; Peyton, M.; Shen, L.; Fan, Y.; Giri, U.; Tumula, P.K.; et al. An epithelial-mesenchymal transition gene signature predicts resistance to EGFR and PI3K inhibitors and identifies Axl as a therapeutic target for overcoming EGFR inhibitor resistance. Clin. Cancer Res. 2013, 19, 279–290. [Google Scholar] [CrossRef] [Green Version]
  31. Guo, C.C.; Majewski, T.; Zhang, L.; Yao, H.; Bondaruk, J.; Wang, Y.; Zhang, S.; Wang, Z.; Lee, J.G.; Lee, S.; et al. Dysregulation of EMT Drives the Progression to Clinically Aggressive Sarcomatoid Bladder Cancer. Cell Rep. 2019, 27, 1781–1793. [Google Scholar] [CrossRef] [Green Version]
  32. Tan, T.Z.; Miow, Q.H.; Miki, Y.; Noda, T.; Mori, S.; Huang, R.Y.; Thiery, J.P. Epithelial-mesenchymal transition spectrum quantification and its efficacy in deciphering survival and drug responses of cancer patients. EMBO Mol. Med. 2014, 6, 1279–1293. [Google Scholar] [CrossRef]
  33. George, J.T.; Jolly, M.K.; Xu, S.; Somarelli, J.A.; Levine, H. Survival outcomes in cancer patients predicted by a partial EMT gene expression scoring metric. Cancer Res. 2017, 77, 6415–6428. [Google Scholar] [CrossRef] [Green Version]
  34. Chakraborty, P.; George, J.T.; Tripathi, S.; Levine, H.; Jolly, M.K. Comparative Study of Transcriptomics-Based Scoring Metrics for the Epithelial-Hybrid-Mesenchymal Spectrum. Front. Bioeng. Biotechnol. 2020, 8, 220. [Google Scholar] [CrossRef] [PubMed] [Green Version]
  35. Jolly, M.; Ward, C.; Eapen, M.S.; Myers, S.; Hallgren, O.; Levine, H.; Sohal, S.S. Epithelial–mesenchymal transition, a spectrum of states: Role in lung development, homeostasis, and disease. Dev. Dyn. 2018, 247, 346–358. [Google Scholar] [CrossRef] [Green Version]
  36. Sohal, S.S. Epithelial and endothelial cell plasticity in chronic obstructive pulmonary disease (COPD). Respir. Investig. 2017, 55, 104–113. [Google Scholar] [CrossRef]
  37. Lai, X.; Li, Q.; Wu, F.; Lin, J.; Chen, J.; Zheng, H.; Guo, L. Epithelial-Mesenchymal Transition and Metabolic Switching in Cancer: Lessons From Somatic Cell Reprogramming. Front. Cell Dev. Biol. 2020, 8, 760. [Google Scholar] [CrossRef] [PubMed]
  38. Davis, S.; Meltzer, P.S. GEOquery: A bridge between the Gene Expression Omnibus (GEO) and BioConductor. Bioinformatics 2007, 23, 1846–1847. [Google Scholar] [CrossRef] [PubMed] [Green Version]
  39. Andrews, S. FastQC: A Quality Control Tool for High Throughput Sequence Data 2010. Available online: https://www.bioinformatics.babraham.ac.uk/projects/ (accessed on 18 November 2020).
  40. Dobin, A.; Davis, C.A.; Schlesinger, F.; Drenkow, J.; Zaleski, C.; Jha, S.; Batut, P.; Chaisson, M.; Gingeras, T.R. STAR: Ultrafast universal RNA-seq aligner. Bioinformatics 2013, 29, 15–21. [Google Scholar] [CrossRef]
  41. Li, H.; Handsaker, B.; Wysoker, A.; Fennell, T.; Ruan, J.; Homer, N.; Marth, G.; Abecasis, G.; Durbin, R. The Sequence Alignment/Map format and SAMtools. Bioinformatics 2009, 25, 2078–2079. [Google Scholar] [CrossRef] [Green Version]
  42. Anders, S.; Pyl, P.T.; Huber, W. HTSeq-A Python framework to work with high-throughput sequencing data. Bioinformatics 2015, 31, 166–169. [Google Scholar] [CrossRef]
  43. Zhao, S.; Fung-Leung, W.P.; Bittner, A.; Ngo, K.; Liu, X. Comparison of RNA-Seq and microarray in transcriptome profiling of activated T cells. PLoS ONE 2014, 9, e78644. [Google Scholar] [CrossRef]
  44. Ishay-Ronen, D.; Diepenbruck, M.; Kalathur, R.K.R.; Sugiyama, N.; Tiede, S.; Ivanek, R.; Bantug, G.; Morini, M.F.; Wang, J.; Hess, C.; et al. Gain Fat—Lose Metastasis: Converting Invasive Breast Cancer Cells into Adipocytes Inhibits Cancer Metastasis. Cancer Cell 2019, 35, 17–32. [Google Scholar] [CrossRef] [Green Version]
  45. Hong, D.; Messier, T.L.; Tye, C.E.; Dobson, J.R.; Fritz, A.J.; Sikora, K.R.; Browne, G.; Stein, J.L.; Lian, J.B.; Stein, G.S. Runx1 stabilizes the mammary epithelial cell phenotype and prevents epithelial to mesenchymal transition. Oncotarget 2017, 8, 17610–17627. [Google Scholar] [CrossRef] [Green Version]
  46. Tripathi, V.; Sixt, K.M.; Gao, S.; Xu, X.; Huang, J.; Weigert, R.; Zhou, M.; Zhang, Y.E. Direct Regulation of Alternative Splicing by SMAD3 through PCBP1 Is Essential to the Tumor-Promoting Role of TGF-β. Mol. Cell 2016, 64, 549–564. [Google Scholar] [CrossRef] [PubMed] [Green Version]
  47. Tian, B.; Li, X.; Kalita, M.; Widen, S.G.; Yang, J.; Bhavnani, S.K.; Dang, B.; Kudlicki, A.; Sinha, M.; Kong, F.; et al. Analysis of the TGFβ-induced program in primary airway epithelial cells shows essential role of NF-κB/RelA signaling network in type II epithelial mesenchymal transition. BMC Genom. 2015, 16, 529. [Google Scholar] [CrossRef] [PubMed] [Green Version]
  48. Watanabe, K.; Panchy, N.; Noguchi, S.; Suzuki, H.; Hong, T. Combinatorial perturbation analysis reveals divergent regulations of mesenchymal genes during epithelial-to-mesenchymal transition. NPJ Syst. Biol. Appl. 2019, 5, 21. [Google Scholar] [CrossRef] [Green Version]
  49. Drápela, S.; Bouchal, J.; Jolly, M.K.; Culig, Z. ZEB1: A Critical Regulator of Cell Plasticity, DNA Damage Response, and Therapy Resistance. Front. Mol. Biosci. 2020, 7, 36. [Google Scholar] [CrossRef]
  50. Jolly, M.K.; Tripathi, S.C.; Jia, D.; Mooney, S.M.; Celiktas, M.; Hanash, S.M.; Mani, S.A.; Pienta, K.J.; Ben-Jacob, E.; Levine, H. Stability of the hybrid epithelial/mesenchymal phentoype. Oncotarget 2016, 7, 27067–27084. [Google Scholar] [CrossRef] [PubMed] [Green Version]
  51. Cieply, B.; Farris, J.; Denvir, J.; Ford, H.L.; Frisch, S.M. Epithelial-Mesenchymal Transition and Tumor Suppression Are Controlled by a Reciprocal Feedback Loop between ZEB1 and Grainyhead-like-2. Cancer Res. 2013, 73, 6299–6309. [Google Scholar] [CrossRef] [Green Version]
  52. Chung, V.Y.; Tan, T.Z.; Tan, M.; Wong, M.K.; Kuay, K.T.; Yang, Z.; Ye, J.; Muller, J.; Koh, C.M.; Guccione, E.; et al. GRHL2-miR-200-ZEB1 maintains the epithelial status of ovarian cancer through transcriptional regulation and histone modification. Sci. Rep. 2016, 6, 19943. [Google Scholar] [CrossRef] [Green Version]
  53. Mooney, S.M.; Talebian, V.; Jolly, M.K.; Jia, D.; Gromala, M.; Levine, H.; McConkey, B.J. The GRHL2/ZEB Feedback Loop—A Key Axis in the Regulation of EMT in Breast Cancer. J. Cell. Biochem. 2017, 118, 2559–2570. [Google Scholar] [CrossRef]
  54. Chung, V.Y.; Tan, T.Z.; Ye, J.; Huang, R.-L.; Lai, H.-C.; Kappei, D.; Wollmann, H.; Guccione, E.; Huang, R.Y.-J. The role of GRHL2 and epigenetic remodeling in epithelial–mesenchymal plasticity in ovarian cancer cells. Commun. Biol. 2019, 2, 272. [Google Scholar] [CrossRef] [Green Version]
  55. Aue, A.; Hinze, C.; Walentin, K.; Ruffert, J.; Yurtdas, Y.; Werth, M.; Chen, W.; Rabien, A.; Kilic, E.; Schulzke, J.D.; et al. A grainyhead-like 2/Ovo-like 2 pathway regulates renal epithelial barrier function and lumen expansion. J. Am. Soc. Nephrol. 2015. [Google Scholar] [CrossRef] [Green Version]
  56. Jia, D.; Jolly, M.K.; Boareto, M.; Parsana, P.; Mooney, S.M.; Pienta, K.J.; Levine, H.; Ben-Jacob, E. OVOL guides the epithelial-hybrid-mesenchymal transition. Oncotarget 2015, 6, 15436–15448. [Google Scholar] [CrossRef] [Green Version]
  57. Carpinelli, M.R.; de Vries, M.E.; Auden, A.; Butt, T.; Deng, Z.; Partridge, D.D.; Miles, L.B.; Georgy, S.R.; Haigh, J.J.; Darido, C.; et al. Inactivation of Zeb1 in GRHL2-deficient mouse embryos rescues mid-gestation viability and secondary palate closure. Dis. Model. Mech. 2020, 13, dmm042218. [Google Scholar] [CrossRef] [Green Version]
  58. Dave, N.; Guaita-Esteruelas, S.; Gutarra, S.; Frias, A.; Beltran, M.; Peiro, S.; de Herreros, A.G. Functional cooperation between Snail1 and twist in the regulation of ZEB1 expression during epithelial to mesenchymal transition. J. Biol. Chem. 2011, 286, 12024–12032. [Google Scholar] [CrossRef] [Green Version]
  59. Yang, J.; Mani, S.A.; Donaher, J.L.; Ramaswamy, S.; Itzykson, R.A.; Come, C.; Savagner, P.; Gitelman, I.; Richardson, A.; Weinberg, R.A.; et al. Twist, a master regulator of Morphogenesis, plays an essential role in tumor metastasis. Cell 2004, 117, 927–939. [Google Scholar] [CrossRef] [PubMed] [Green Version]
  60. Hu, X.; Harvey, S.E.; Zheng, R.; Lyu, J.; Grzeskowiak, C.L.; Powell, E.; Piwnica-Worms, H.; Scott, K.L.; Cheng, C. The RNA-binding protein AKAP8 suppresses tumor metastasis by antagonizing EMT-associated alternative splicing. Nat. Commun. 2020, 11, 486. [Google Scholar] [CrossRef] [PubMed]
  61. Chan, S.C.; Zhang, Y.; Shao, A.; Avdulov, S.; Herrera, J.; Aboudehen, K.; Pontoglio, M.; Igarashi, P. Mechanism of Fibrosis in HNF1B-Related Autosomal Dominant Tubulointerstitial Kidney Disease. J. Am. Soc. Nephrol. 2018, 29, 2493–2509. [Google Scholar] [CrossRef] [PubMed] [Green Version]
  62. Liberzon, A.; Subramanian, A.; Pinchback, R.; Thorvaldsdóttir, H.; Tamayo, P.; Mesirov, J.P. Molecular signatures database (MSigDB) 3.0. Bioinformatics 2011, 27, 1739–1740. [Google Scholar] [CrossRef] [PubMed]
  63. Chu, L.F.; Leng, N.; Zhang, J.; Hou, Z.; Mamott, D.; Vereide, D.T.; Choi, J.; Kendziorski, C.; Stewart, R.; Thomson, J.A. Single-cell RNA-seq reveals novel regulators of human embryonic stem cell differentiation to definitive endoderm. Genome Biol. 2016, 17, 173. [Google Scholar] [CrossRef] [PubMed] [Green Version]
  64. Zhang, S.; Cui, Y.; Ma, X.; Yong, J.; Yan, L.; Yang, M.; Ren, J.; Tang, F.; Wen, L.; Qiao, J. Single-cell transcriptomics identifies divergent developmental lineage trajectories during human pituitary development. Nat. Commun. 2020, 11, 5275. [Google Scholar] [CrossRef] [PubMed]
  65. Dong, J.; Hu, Y.; Fan, X.; Wu, X.; Mao, Y.; Hu, B.; Guo, H.; Wen, L.; Tang, F. Single-cell RNA-seq analysis unveils a prevalent epithelial/mesenchymal hybrid state during mouse organogenesis. Genome Biol. 2018, 19, 31. [Google Scholar] [CrossRef] [Green Version]
  66. Deshmukh, A.P.; Vasaikar, S.V.; Tomczak, K.; Tripathi, S.; Den Hollander, P.; Arslan, E.; Chakraborty, P.; Soundararajan, R.; Jolly, M.K.; Rai, K.; et al. Identification of EMT signaling cross-talk and gene regulatory networks by single-cell RNA sequencing. Proc. Natl. Acad. Sci. USA 2021, 118, e2102050118. [Google Scholar] [CrossRef]
  67. Hendley, A.M.; Rao, A.A.; Leonhardt, L.; Ashe, S.; Smith, J.A.; Giacometti, S.; Peng, X.L.; Jiang, H.; Berrios, D.I.; Pawlak, M.; et al. Single-cell transcriptome analysis defines heterogeneity of the murine pancreatic ductal tree. Elife 2021, 10, e67776. [Google Scholar] [CrossRef]
  68. Pastushenko, I.; Brisebarre, A.; Sifrim, A.; Fioramonti, M.; Revenco, T.; Boumahdi, S.; Van Keymeulen, A.; Brown, D.; Moers, V.; Lemaire, S.; et al. Identification of the tumour transition states occurring during EMT. Nature 2018, 556, 463–468. [Google Scholar] [CrossRef]
  69. Li, H.; Courtois, E.T.; Sengupta, D.; Tan, Y.; Chen, K.H.; Goh, J.J.L.; Kong, S.L.; Chua, C.; Hon, L.K.; Tan, W.S.; et al. Reference component analysis of single-cell transcriptomes elucidates cellular heterogeneity in human colorectal tumors. Nat. Genet. 2017, 49, 708–718. [Google Scholar] [CrossRef]
  70. Yang, H.; Adam, R.C.; Ge, Y.; Hua, Z.L.; Fuchs, E. Epithelial-Mesenchymal Micro-niches Govern Stem Cell Lineage Choices. Cell 2017, 169, 483–496. [Google Scholar] [CrossRef] [Green Version]
  71. Geng, J.; Huang, X.; Li, Y.; Xu, X.; Li, S.; Jiang, D.; Liang, J.; Jiang, D.; Wang, C.; Dai, H. Down-regulation of USP13 mediates phenotype transformation of fibroblasts in idiopathic pulmonary fibrosis. Respir. Res. 2015, 16, 124. [Google Scholar] [CrossRef] [PubMed] [Green Version]
  72. Prasse, A.; Binder, H.; Schupp, J.C.; Kayser, G.; Bargagli, E.; Jaeger, B.; Hess, M.; Rittinghausen, S.; Vuga, L.; Lynn, H.; et al. BAL Cell Gene Expression Is Indicative of Outcome and Airway Basal Cell Involvement in Idiopathic Pulmonary Fibrosis. Am. J. Respir. Crit. Care Med. 2019, 199, 622–630. [Google Scholar] [CrossRef] [PubMed]
  73. Cecchini, M.J.; Hosein, K.; Howlett, C.J.; Joseph, M.; Mura, M. Comprehensive gene expression profiling identifies distinct and overlapping transcriptional profiles in non-specific interstitial pneumonia and idiopathic pulmonary fibrosis. Respir. Res. 2018, 19, 153. [Google Scholar] [CrossRef] [PubMed]
  74. Sivakumar, P.; Thompson, J.R.; Ammar, R.; Porteous, M.; McCoubrey, C.; Cantu, E.; Ravi, K.; Zhang, Y.; Luo, Y.; Streltsov, D.; et al. RNA sequencing of transplant-stage idiopathic pulmonary fibrosis lung reveals unique pathway regulation. ERJ Open Res. 2019, 5, 00117–02019. [Google Scholar] [CrossRef] [Green Version]
  75. Cabrera-benítez, N.E.; Parotto, M.; Post, M.; Han, B.; Spieth, P.M.; Cheng, W.-E.; Valladares, F.; Villar, J.; Liu, M.; Sato, M.; et al. Mechanical stress induces lung fibrosis by epithelial- mesenchymal transition (EMT). Crit. Care Med. 2012, 40, 510–517. [Google Scholar] [CrossRef] [PubMed] [Green Version]
  76. Gouda, M.M.; Shaikh, S.B.; Bhandary, Y.P. Inflammatory and Fibrinolytic System in Acute Respiratory Distress Syndrome. Lung 2018, 196, 609–616. [Google Scholar] [CrossRef]
  77. Vasaikar, S.V.; Deshmukh, A.P.; den Hollander, P.; Addanki, S.; Kuburich, N.A.; Kudaravalli, S.; Joseph, R.; Chang, J.T.; Soundararajan, R.; Mani, S.A. EMTome: A resource for pan-cancer analysis of epithelial-mesenchymal transition genes and signatures. Br. J. Cancer 2021, 124, 259–269. [Google Scholar] [CrossRef] [PubMed]
  78. Subramanian, A.; Tamayo, P.; Mootha, V.K.; Mukherjee, S.; Ebert, B.L.; Gillette, M.A.; Paulovich, A.; Pomeroy, S.L.; Golub, T.R.; Lander, E.S.; et al. Gene set enrichment analysis: A knowledge-based approach for interpreting genome-wide expression profiles. Proc. Natl. Acad. Sci. USA 2005, 102, 15545–15550. [Google Scholar] [CrossRef] [Green Version]
  79. McFaline-Figueroa, J.L.; Hill, A.J.; Qiu, X.; Jackson, D.; Shendure, J.; Trapnell, C. A pooled single-cell genetic screen identifies regulatory checkpoints in the continuum of the epithelial-to-mesenchymal transition. Nat. Genet. 2019, 51, 1389–1398. [Google Scholar] [CrossRef]
  80. Johnson, K.S.; Hussein, S.; Chakraborty, P.; Muruganantham, A.; Mikhail, S.; Gonzalez, G.; Song, S.; Jolly, M.K.; Toneff, M.J.; Benton, M.L.; et al. Epithelial-mesenchymal plasticity through loss of CTCF motif accessibility and protein expression. bioRxiv 2021, 447526. [Google Scholar] [CrossRef]
  81. Stylianou, N.; Lehman, M.L.; Wang, C.; Fard, A.T.; Rockstroh, A.; Fazli, L.; Jovanovic, L.; Ward, M.; Sadowski, M.C.; Kashyap, A.S.; et al. A molecular portrait of epithelial–mesenchymal plasticity in prostate cancer associated with clinical outcome. Oncogene 2019, 38, 913–934. [Google Scholar] [CrossRef]
  82. Jia, W.; Deshmukh, A.; Mani, S.A.; Jolly, M.K.; Levine, H. A possible role for epigenetic feedback regulation in the dynamics of the Epithelial-Mesenchymal Transition (EMT). Phys. Biol. 2019, 16, 066004. [Google Scholar] [CrossRef] [Green Version]
  83. Cook, D.P.; Vanderhyden, B.C. Context specificity of the EMT transcriptional response. Nat. Commun. 2020, 11, 2142. [Google Scholar] [CrossRef]
  84. Serresi, M.; Kertalli, S.; Li, L.; Schmitt, M.J.; Dramaretska, Y.; Wierikx, J.; Hulsman, D.; Gargiulo, G. Functional antagonism of chromatin modulators regulates epithelial-mesenchymal transition. Sci. Adv. 2021, 7, eabd7974. [Google Scholar] [CrossRef] [PubMed]
  85. Wang, W.; Douglas, D.; Zhang, J.; Kumari, S.; Enuameh, M.S.; Dai, Y.; Wallace, C.T.; Watkins, S.C.; Shu, W.; Xing, J. Live-cell imaging and analysis reveal cell phenotypic transition dynamics inherently missing in snapshot data. Sci. Adv. 2020, 6, eaba9319. [Google Scholar] [CrossRef] [PubMed]
  86. Devaraj, V.; Bose, B. Morphological State Transition Dynamics in EGF-Induced Epithelial to Mesenchymal Transition. J. Clin. Med. 2019, 8, 911. [Google Scholar] [CrossRef] [Green Version]
  87. Karacosta, L.G.; Anchang, B.; Ignatiadis, N.; Kimmey, S.C.; Benson, J.A.; Shrager, J.B.; Tibshirani, R.; Bendall, S.C.; Plevritis, S.K. Mapping Lung Cancer Epithelial-Mesenchymal Transition States and Trajectories with Single-Cell Resolution. Nat. Commun. 2019, 10, 5587. [Google Scholar] [CrossRef] [PubMed] [Green Version]
  88. Bocci, F.; Gearhart-Serna, L.; Boareto, M.; Riberio, M.; Ben-Jacob, E.; Devi, G.R.; Levine, H.; Onuchic, J.N.; Jolly, M.K. Toward understanding cancer stem cell heterogeneity in the tumor microenvironment. Proc. Natl. Acad. Sci. USA 2019, 116, 148–157. [Google Scholar] [CrossRef] [PubMed] [Green Version]
  89. Brown, M.S.; Abdollahi, B.; Wilkins, O.M.; Chakraborty, P.; Ognjenovic, N.B.; Muller, K.E.; Kumar Jolly, M.; Hassanpour, S.; Pattabiraman, D.R. Dynamic plasticity within the EMT spectrum, rather than static mesenchymal traits, drives tumor heterogeneity and metastatic progression of breast cancers. bioRxiv 2021, 434993. [Google Scholar] [CrossRef]
  90. Chakraborty, P.; George, J.T.; Woodward, W.A.; Levine, H.; Jolly, M.K. Gene expression profiles of inflammatory breast cancer reveal high heterogeneity across the epithelial-hybrid-mesenchymal spectrum. Transl. Oncol. 2021, 14, 101026. [Google Scholar] [CrossRef]
  91. Tsuji, T.; Ibaragi, S.; Shima, K.; Hu, M.G.; Katsurano, M.; Sasaki, A.; Hu, G.F. Epithelial-mesenchymal transition induced by growth suppressor p12 CDK2-AP1 promotes tumor cell local invasion but suppresses distant colony growth. Cancer Res. 2008, 68, 10377–10386. [Google Scholar] [CrossRef] [Green Version]
  92. Neelakantan, D.; Zhou, H.; Oliphant, M.U.J.; Zhang, X.; Simon, L.M.; Henke, D.M.; Shaw, C.A.; Wu, M.F.; Hilsenbeck, S.G.; White, L.D.; et al. EMT cells increase breast cancer metastasis via paracrine GLI activation in neighbouring tumour cells. Nat. Commun. 2017, 8, 15773. [Google Scholar] [CrossRef] [PubMed]
  93. Ruscetti, M.; Dadashian, E.L.; Guo, W.; Quach, B.; Mulholland, D.J.; Park, J.W.; Tran, L.M.; Kobayashi, N.; Bianchi-Frias, D.; Xing, Y.; et al. HDAC inhibition impedes epithelial-mesenchymal plasticity and suppresses metastatic, castration-resistant prostate cancer. Oncogene 2016, 35, 3781–3795. [Google Scholar] [CrossRef] [PubMed] [Green Version]
  94. Grande, M.T.; Sánchez-Laorden, B.; López-Blau, C.; De Frutos, C.A.; Boutet, A.; Arévalo, M.; Rowe, R.G.; Weiss, S.J.; López-Novoa, J.M.; Nieto, M.A. Snail1-induced partial epithelial-to-mesenchymal transition drives renal fibrosis in mice and can be targeted to reverse established disease. Nat. Med. 2015, 21, 989–997. [Google Scholar] [CrossRef] [Green Version]
  95. Aban, C.; Lombardi, A.; Neiman, G.; Biani, M.C.; La Greca, A.; Walsman, A.; Moro, L.N.; Sevlever, G.; Miriuka, S.; Luzzani, C. Downregulation of E-cadherin in pluripotent stem cells triggers partial EMT. Sci. Rep. 2021, 11, 2048. [Google Scholar] [CrossRef] [PubMed]
  96. Leroy, P.; Mostov, K.E. Slug Is Required for Cell Survival during Partial Epithelial-Mesenchymal Transition of HGF-induced tubulogenesis. J. Cell Sci. 2007, 18, 1943–1952. [Google Scholar] [CrossRef]
  97. Foroutan, M.; Bhuva, D.D.; Lyu, R.; Horan, K.; Cursons, J.; Davis, M.J. Single sample scoring of molecular phenotypes. BMC Bioinformatics 2018, 19, 404. [Google Scholar] [CrossRef] [Green Version]
  98. Bocci, F.; Jolly, M.K.; George, J.T.; Levine, H.; Onuchic, J.N. A mechanism-based computational model to capture the interconnections among epithelial-mesenchymal transition, cancer stem cells and Notch-Jagged signaling. Oncotarget 2018, 9, 29906–29920. [Google Scholar] [CrossRef] [Green Version]
  99. Li, X.; Jolly, M.K.; George, J.T.; Pienta, K.J.; Levine, H. Computational Modeling of the Crosstalk Between Macrophage Polarization and Tumor Cell Plasticity in the Tumor Microenvironment. Front. Oncol. 2019, 9, 1–12. [Google Scholar] [CrossRef]
  100. Wang, P.; Zhou, R.; Thomas, P.; Zhao, L.; Zhou, R.; Mandal, S.; Jolly, M.K.; Richard, D.J.; Rehm, B.H.A.; Ostrikov, K.; et al. Epithelial-to-mesenchymal transition enhances cancer cell sensitivity to cytotoxic effects of zcold atmospheric plasmas in breast and bladder cancer systems. Cancers 2021, 13, 2889. [Google Scholar] [CrossRef]
  101. Ling, J.; Nie, Q.; Li, C. Landscape and kinetic path quantify critical transitions in epithelial-mesenchymal transition. Biophys. J. 2021, 120, 4484–4500. [Google Scholar] [CrossRef]
  102. Tripathi, S.; Levine, H.; Jolly, M.K. The Physics of Cellular Decision-Making during Epithelial-Mesenchymal Transition. Annu. Rev. Biophys. 2020, 49, 1–18. [Google Scholar] [CrossRef] [PubMed] [Green Version]
  103. Celià-Terrassa, T.; Bastian, C.; Liu, D.D.; Ell, B.; Aiello, N.M.; Wei, Y.; Zamalloa, J.; Blanco, A.M.; Hang, X.; Kunisky, D.; et al. Hysteresis control of epithelial-mesenchymal transition dynamics conveys a distinct program with enhanced metastatic ability. Nat. Commun. 2018, 9, 5005. [Google Scholar] [CrossRef] [PubMed]
  104. Jia, D.; Park, J.H.; Kaur, H.; Jung, K.H.; Yang, S.; Tripathi, S.; Galbraith, M.; Deng, Y.; Jolly, M.K.; Kaipparettu, B.A.; et al. Towards decoding the coupled decision-making of metabolism and epithelial-to-mesenchymal transition in cancer. Br. J. Cancer 2021, 124, 1902–1911. [Google Scholar] [CrossRef]
  105. Dumont, N.; Wilson, M.B.; Crawford, Y.G.; Reynolds, P.A.; Sigaroudinia, M.; Tlsty, T.D. Sustained induction of epithelial to mesenchymal transition activates DNA methylation of genes silenced in basal-like breast cancers. Proc. Natl. Acad. Sci. USA 2008, 105, 14867–14872. [Google Scholar] [CrossRef] [PubMed] [Green Version]
  106. Peixoto, P.; Etcheverry, A.; Aubry, M.; Missey, A.; Lachat, C.; Perrard, J.; Hendrick, E.; Delage-Mourroux, R.; Mosser, J.; Borg, C.; et al. EMT is associated with an epigenetic signature of ECM remodeling genes. Cell Death Dis. 2019, 10. [Google Scholar] [CrossRef] [Green Version]
  107. Epithelial-Mesenchymal Transition Is the Main Driver of Intrinsic Metabolism in Cancer Cell Lines. Available online: https://www.biorxiv.org/content/10.1101/2021.11.02.466992v1.full (accessed on 18 December 2021).
  108. Quantifying the Patterns of Metabolic Plasticity and Heterogeneity along the Epithelial-Hybrid-Mesenchymal Spectrum in Cancer. Available online: https://www.biorxiv.org/content/10.1101/2021.12.18.473275v1 (accessed on 18 December 2021).
Figure 1. Schematic of the interconversion of MLR microarray and MLR RNA-seq scores and pairwise correlation plots of the three EMT scoring metrics. (A) Adaptation of microarray-based MLR approach to predict RNA-seq-based input. Predictors (resp. normalizers) in the NCI-60 microarray training set were selected as performed previously, based on their ability (resp. inability) to resolve the EMT status of the training set. Poor candidates (red X) in each case were omitted from inclusion in the proctor and normalizer set. Histograms (teal bars) and corresponding spline interpolate density function estimates (black curves). Linear regression between RNA-seq and microarray data given in Zhao et al. 2014 was used to relate a unique value of RNA-seq signal to the microarray-based model, conducted for both FPKM and TPM values. (BD) Plots showing the pairwise correlation of EMT scoring metrics across 77 bulk RNA-Seq datasets, and for each sample –log10 (p-value) is plotted as a function of Pearson’s correlation coefficient. Thresholds considered for correlation (R < −0.3 (green points) or R > 0.3 (red points); vertical dashed grey lines) and p-values (p < 0.05; horizontal dashed grey lines) are denoted. Cyan points represent cases for which R > −0.3 and R < 0.3. (E) Venn diagram depicting the overlap of pairwise and full concordance for datasets that are significantly correlated in the expected direction.
Biomolecules 12 00029 g001
Figure 2. KS, 76GS, and MLR scores for different EMT associated datasets. (A) Py2T long term cells and mesenchymal breast cancer cells (MTΔECad) treated with different inhibitors (GSE118612). (B) MCF10A cells with or without depletion of Runx1 (GSE85857). (C) EMT induction in Hela cells by TGF-β + EGF (GSE72419) treatment. (D) EMT induction in small airway epithelial cells by TGF-β (GSE61220). (E) MCF10A cells with/without ZEB1 knocked out (KO) untreated or treated with TGF-β (GSE124843). (F) OVCA4209 cells with/without GRHL2 knockdown (GSE118407). (G) Grhl2 KO and wild type (WT) mice (GSE106130). (H) Primary, pre-malignant immortalized, and Ras-transformed human mammary epithelial cells (GSE110677). (I) EMT induction in HMLE/Twist-ER cells by tamoxifen (GSE139074). (J) EMT status in HNF-1β-deficient mIMCD3 cell lines (GSE97770). *: p <0.05 for Students’ t-test.
Biomolecules 12 00029 g002
Figure 3. Concordance across EMT scoring methods in single cell RNA-Seq datasets. (A) Scatter plot of pairwise correlation estimated by linear regression (blue) in GSE103322 dataset. (B) (Left) Plots showing the correlation of MLR vs. KS EMT scoring metrics for different single-cell RNA-Seq datasets, for each sample −log10 (p-value) is plotted as a function of Pearson’s correlation coefficient. Thresholds for correlation (R < −0.3 (green points) or R > 0.3 (red points); vertical dashed grey lines) and p-values (p < 0.05; horizontal dashed grey lines) are indicated. Cyan points denote the cases for which R > −0.3 or R < 0.3. (Right) Venn diagram depicting the common datasets across three pairwise comparisons that are significantly correlated in the expected direction. (C) Histograms (teal bars) and corresponding spline interpolate density function estimates (black curves); however, the MLR scores show opposite trends than expected of KS scores in various datasets. Red dashed line and black solid line depicts mean and median, respectively.
Biomolecules 12 00029 g003
Figure 4. Concordance across all three EMT scoring methods in COPD/IPF and reprogramming datasets. (A) Bar plots showing EMT scores of different datasets calculated using three EMT scoring methods—(i) Lung tissues of healthy cases and IPF patients (GSE72073), (ii) EMT status in BAL cells of healthy volunteers and COPD patients (GSE73395), (iii) Lung tissues of IPF, NSIP, and Mixed IPF/NSIP patients, as well as healthy lung tissue (GSE110147), (iv) EMT status in lung tissues of Normal, ALI, and IPF patients (GSE134692). (B) (Left) Plots of the correlation of MLR vs. KS EMT scoring metrics across 46 datasets. For each sample, −log10 (p-value) is plotted as a function of Pearson’s correlation coefficient. Thresholds for correlation (R < −0.3 or R > 0.3; vertical dashed grey lines) and p-values (p < 0.05; horizontal dashed grey lines) are shown. (Right) Venn diagram depicting the common datasets across all pairwise comparisons that are significantly correlated in the expected direction. (C) Same as (B) but for reprogramming associated datasets. *: p < 0.05 for Students’ t-test.
Biomolecules 12 00029 g004
Figure 5. EMT scoring in TCGA datasets and survival analysis using patient samples. (A) Scatter plot of pairwise correlation estimated using linear regression (blue) in TCGA datasets. (B) Correlation between EMT score (high vs. low) and overall survival (OS) in various TCGA datasets. Kaplan–Meier survival analysis is performed to estimate differences in survival for different EMT metrics. p-values (p) reported are based on log rank test. The values of Hazard ratio (HR) with 95% confidence interval (CI) values are included. (C) Plot of log2 hazard ratio (HR; mean ± 95% confidence interval) comparing overall survival (OS) of 76GS (left) and KS (right) EMT scoring metrics on different TCGA cancers and cohorts. p-values are based on log-rank test, and those with significant differences (p < 0.05) are marked with a star (*); **: p < 0.01; ***: p < 0.001.
Biomolecules 12 00029 g005
Figure 6. Correlation between EMT score (high vs. low) and various survival types (DSS, PFI, and DFI) in various TCGA datasets. Kaplan–Meier survival analysis is performed to estimate differences in survival for different EMT metrics. p-values (p) reported are based on the log rank test. The values of Hazard ratio (HR) with 95% confidence interval (CI) values are included. (A) Plots for (kidney renal papillary cell carcinoma (KIRP) and Head and Neck Squamous Cancer (HNSC). (B) Plots for low-grade glioma (LGG) and uterine carcinosarcoma (UCS).
Biomolecules 12 00029 g006
Publisher’s Note: MDPI stays neutral with regard to jurisdictional claims in published maps and institutional affiliations.

