
From Clusters to Proto-Clusters: The Infrared Perspective on Environmental Galaxy Evolution


1
Steward Observatory, University of Arizona, 933 N. Cherry Avenue, Tucson, AZ 85721-0065, USA
2
School of Earth and Space Exploration, Arizona State University, Tempe, AZ 85287-1404, USA
3
Beus Center for Cosmic Foundations, Arizona State University, Tempe, AZ 85287-1404, USA
*
Author to whom correspondence should be addressed.
Universe 2022, 8(11), 554; https://doi.org/10.3390/universe8110554
Submission received: 3 September 2022
/
Revised: 6 October 2022
/
Accepted: 11 October 2022
/
Published: 25 October 2022
(This article belongs to the Special Issue Recent Advances in Infrared Galaxies and AGN)
Abstract
:Environment is one of the primary drivers of galaxy evolution; via multiple mechanisms, it can control the critical process of transforming galaxies from star forming to quiescent, commonly termed “quenching”. Despite its importance, however, we still do not have a clear view of how environmentally-driven quenching proceeds even in the most extreme environments: galaxy clusters and their progenitor proto-clusters. Recent advances in infrared capabilities have enabled transformative progress not only in the identification of these structures but in detailed analyses of quiescence, obscured star formation, and molecular gas in (proto-)cluster galaxies across cosmic time. In this review, we will discuss the current state of the literature regarding the quenching of galaxies in (proto-)clusters from the observational, infrared perspective. Our improved understanding of environmental galaxy evolution comes from unique observables across the distinct regimes of the near-, mid-, and far-infrared, crucial in the push to high redshift where massive galaxy growth is dominated by highly extinct, infrared-bright galaxies.
1. Introduction
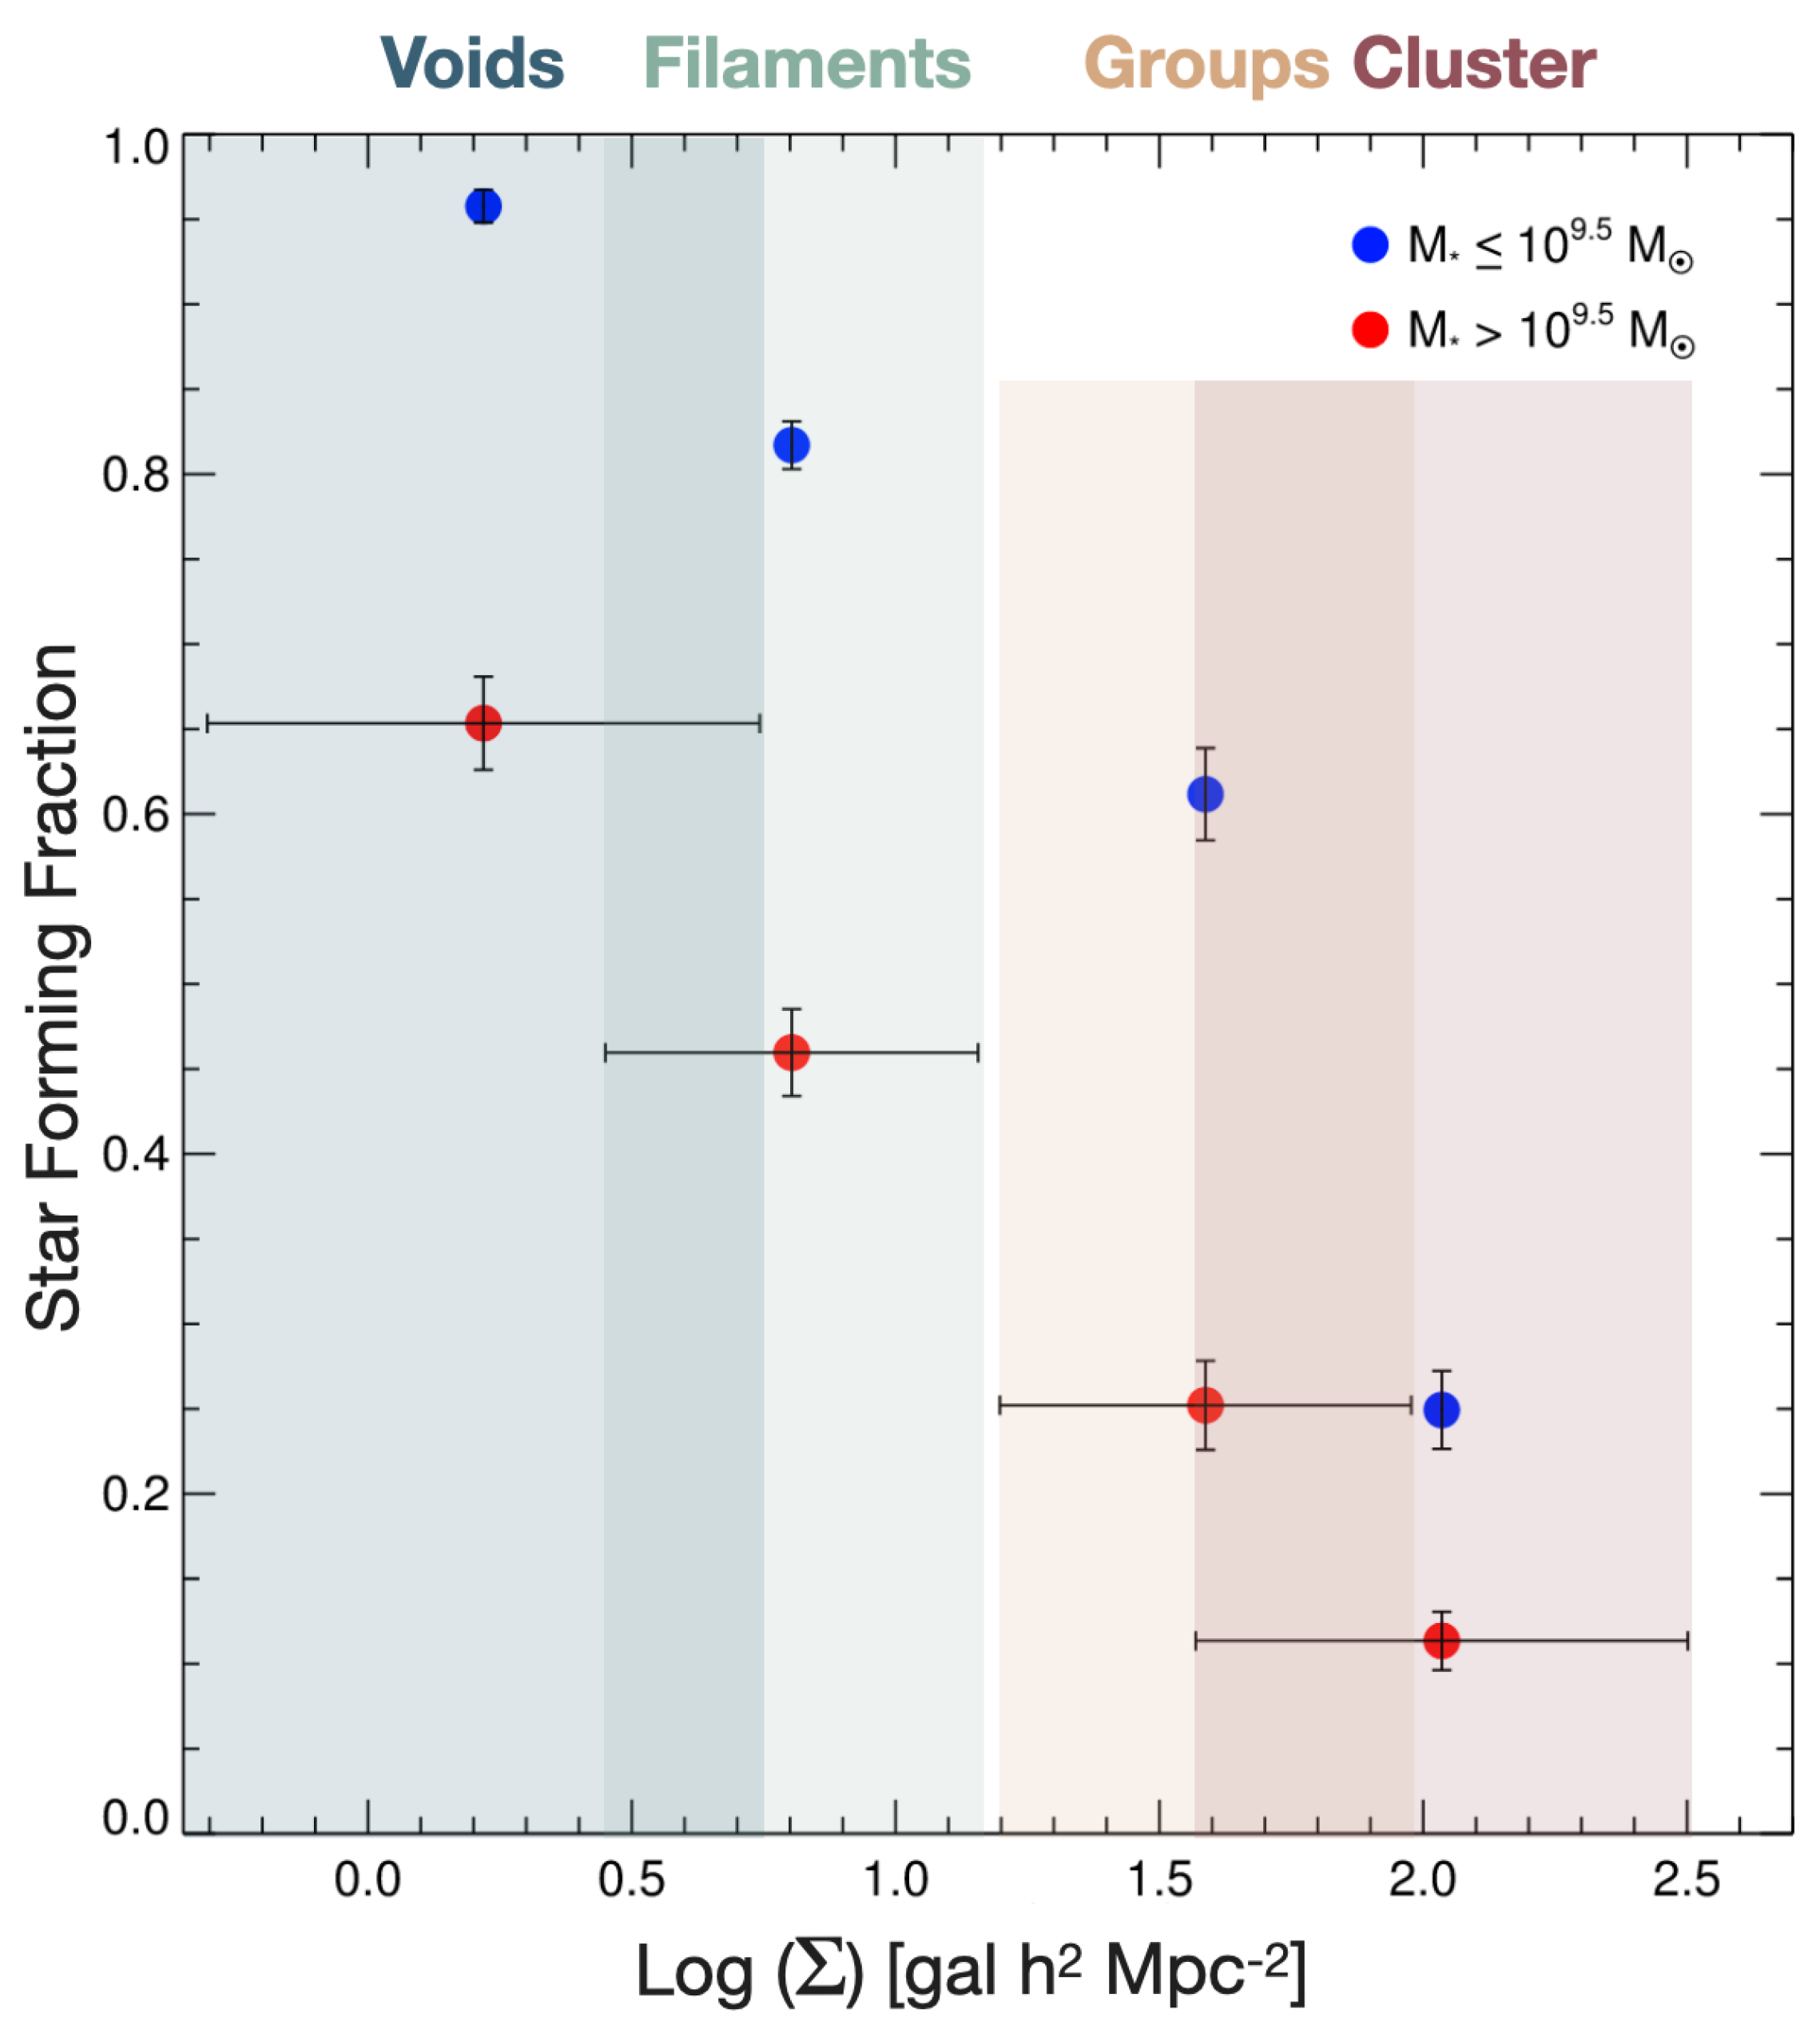
In the four decades since Dressler [1] presented the morphological properties of galaxies in local galaxy clusters, a rich literature has emerged on the connection between galaxy evolution and environment. We have now firmly established that high-density regions exhibit both a morphology-density relation (e.g., [1,2,3]) and a star formation rate (SFR)-density relation (e.g., [4,5,6]) with local clusters preferentially hosting early-type, quiescent galaxies (QGs). Star-forming galaxies (SFGs) in clusters typically contain low atomic (e.g., [7,8,9,10]) and molecular (e.g., [11,12]) gas content. Correspondingly, as molecular gas is the fuel for forming stars, their star formation (SF) activity is also lower (see Boselli and Gavazzi [13] for a review). As demonstrated by the Coma Supercluster region, these systematic differences occur continuously with increasing galaxy density, from voids to filaments to groups to clusters, over a wide range in stellar mass (Figure 1; Cybulski et al. [14], see also [15,16]). From this, we can infer progressively divergent pathways for the evolution of galaxies from star forming to quenched as a function of environment.
Underscoring the importance of understanding this environmentally-driven galaxy evolution, a quarter to half of all massive galaxies live in groups or low-mass clusters up to (e.g., [17,18,19,20]) and recent simulations suggest that galaxies living in proto-clusters (the early formation stage of galaxy clusters) at contributed up to half of the cosmic star formation rate density (SFRD; [21]). Massive galaxy clusters (log ) host a far smaller percentage of the overall massive galaxy population ( (<5%) at ( 1–1.5) for log ; [20]); however, they provide the best astrophysical laboratories for exploring environmental processes and establishing the boundary conditions of environmentally-driven quenching and morphological transformation. Indeed, detailed observational studies support a complex interplay of multiple quenching mechanisms, internal and external, driving the evolution of local galaxies over a wide range in galaxy density (e.g., [22,23], and references therein).
The relationship between galaxies and environment has been extensively studied and reviewed (e.g., [4,12,13,24,25]) and the availability of new datasets continues to push the state of the art in the local Universe. The infrared-to-submillimeter regime alone has produced a wealth of observations over low-redshift cluster galaxies, including: the Herschel Virgo Cluster Survey (HeViCS; [26]); the Virgo Environment Traced in CO survey (VERTICO; [27,28]); the ALMA Fornax Cluster Survey (AlFoCS; [29]); the GAs Stripping Phenomena in galaxies survey (GASP; [30,31]); and references therein. In parallel, we have established that this relationship evolves with cosmic time—for example, the fraction of optically blue galaxies increases with increasing redshift (the Butcher-Oemler Effect; [32])—and on through to the epoch dominated by proto-clusters (; see Overzier [33] for a review). The subsequent emerging picture contains many complexities, but can be broken roughly into three epochs. From , galaxy populations in massive clusters remain largely quenched, comparable to their local counterparts (e.g., [34,35]), though with evidence for a diversity in evolutionary pathways from galaxy-to-galaxy. The epoch z = 1–2 sees the end of ubiquitous quiescence, with some clusters showing a breakdown or reversal in the local SFR-density relation. To establish the largely quenched populations by , environmentally-driven rapid quenching has to ramp up in these systems during this epoch [34,36]. The last epoch at is largely populated by proto-clusters, highly-extended (10–30) structures in the process of collapse, which host substantial star formation.
Infrared observations (1 μm–3 mm) are increasingly playing a critical role in our understanding of (proto-)cluster evolution due to the remarkable rise in observational capabilities, starting with IRAS in the 1980s through the recent successful launch of the James Webb Space Telescope (JWST; [37]) in 2021. Four decades of space-based IR missions (e.g., IRAS, ISO, Spitzer, WISE, Herschel, AKARI, Planck1 have provided a range of sensitivities, resolutions, and mapping speeds with low background levels and at wavelengths that are not achievable on earth due to low atmospheric transmission. From the ground, bolometer arrays (e.g., SCUBA, SCUBA-2, AzTEC, LABOCA)2 on single-dish observatories (e.g., JCMT, LMT, SPT, ACT)3 have delivered low-resolution surveys over large areas, while interferometric facilities (e.g., NOEMA, PdBI, ALMA, JVLA)4 have enabled unparalleled sensitivity and resolution for detailed targeted studies. The extragalactic discovery space opened by these facilities includes the characterization of significant, sometimes dominant, populations of moderate to extremely dust-obscured galaxies. For an expanded discussion of infrared facilities, see Casey et al. [57], Farrah et al. [58].
In this review, we present an overview of our current understanding of galaxy populations in (proto-)clusters from the infrared perspective, followed by pressing open questions and the future outlook. Other relevant reviews in this Special Issue include “The Role of AGN in Luminous Infrared Galaxies from the Multiwavelength Perspective”, U [59]; “Infrared Spectral Energy Distribution and Variability of Active Galactic Nuclei: Clues to the Structure of Circumnuclear Material”, Lyu and Rieke [60]; “The Past and Future of Mid-Infrared Studies of AGN”, Sajina et al. [61]; “Dust-obscured star formation: observational constraints from the last decade”, Zavala & Casey 2022, in prep.; “ALPINE: A Large Survey to Understand Teenage Galaxies”, Faisst et al. [62].
1.1. Overview of Environment and Environmental Processes
1.1.1. Defining Environment
The definition of environment is not homogeneous across the literature (see Muldrew et al. [63]). One common approach is to focus on the “global” environment via large scale structures like galaxy clusters (or groups), while another is to define the “local” environment in terms of the local galaxy density field (using a technique such as nearest neighbors, e.g., [64,65]). Caution is warranted when comparing results using these different definitions as they may probe different populations and pathways. For example, centrals, the most massive galaxy in a given halo, and satellites are thought to follow different evolutionary tracks (e.g., [6,66,67]). Global studies focus on satellite populations by design (minus the group/cluster central known as the Brightest Group/Cluster Galaxy, BGG or BCG), while local environment studies may include both centrals and satellites and are sensitive to the scale used to measure the galaxy overdensity, which can complicate interpretation of the observed trends [68]. Additionally, environmental effects are usually identified via comparison to a control or “field” sample, the nature of which can influence the results [69]. Global studies typically adopt regions from surrounding “blank” fields, which will include voids, groups, and filaments, while local studies often compare to their lowest density bin, excluding intermediate densities.
In this review, we will focus mainly on studies using the global definition. We define a galaxy cluster as a relaxed or unrelaxed (or merging) gravitationally-bound structure with a halo mass (at time of observation) of log , acknowledging that many works refer to systems with log as groups. The definition of proto-cluster is even less clear in the literature; here we define a proto-cluster as an extended overdensity at which will collapse into a cluster by . The redshift boundary is adopted for convenience as in reality the line is very blurred: the extended structure around clusters at may not have completely collapsed even by [70] and proto-cluster cores at may have properties more typically associated with clusters (i.e., quenched populations, X-ray emission; [71], but see [72]).
1.1.2. Environment Quenching Mechanisms
In a simplified schematic, galaxies are surrounded by a hot halo of ionized gas, the circumgalactic medium, which cools onto an extended reservoir of neutral hydrogen surrounding the disk. This Hi gas subsequently condenses onto the disk of the galaxy, forming clouds of molecular gas (H), which are the nurseries for star formation. Outflows in the form of stellar winds, jets, and/or galactic fountains [73] can deliver material back out into the halo of the galaxy, forming a cosmic recycling of gas and material for the next generation of stars. This baryon cycle in galaxies is often viewed as a “bathtub" equilibrium model (e.g., [74,75,76]), where gas content is regulated by inflows and depleted through outflows and star formation consumption. Importantly, in order to form stars on long timescales, galaxies require their disk gas reservoir to be replenished not only by gas recycling, but by external sources, e.g., cold mode gas accretion (e.g., [74]) or gas-rich mergers. See Hatch [77], Tacconi et al. [78], and Saintonge and Catinella [79] for recent reviews.
In galaxy clusters, several environmental processes have been identified that may act on galaxies to enhance or shut down star formation. They fall broadly into three categories. The first, hydrodynamical processes, depletes a galaxy’s gas reservoirs though interaction with the hot (– K), dense ( cm) intracluster medium (ICM; [80]), often at high speeds (∼500–1000 km s). Starvation (also known as strangulation; [81,82]) heats or strips the diffuse hot halo of a galaxy upon entering the ICM, halting this replenishment of disk gas. The effect of this process on a galaxy’s SFR is generally thought to be slow, taking several Gyr (e.g., [12,83]) and may start far from the cluster center (up to five times the virial radius, ; e.g., [84]). More aggressive hydrodynamical processes—ram pressure stripping (RPS; [85]), viscous stripping [86], and thermal evaporation [87]—act directly to heat or strip the cold molecular gas tightly bound in a galaxy’s disk. Of these, we will focus on RPS5 in this review, which can range from mild to strong, gradually stripping the extended cold gas in a galaxy’s outskirts to rapidly removing a significant portion of the central disk gas on short timescales. The timescale to effect star formation similarly varies. For extensive reviews on RPS, see Boselli et al. [20], Cortese et al. [88]. Regardless of the specifics, quenching from hydrodynamical processes generally proceeds outside-in, affecting the galaxy outskirts first.
The second category is gravitational mechanisms, either galaxy-to-galaxy interactions or perturbations induced by the halo, called tidal interactions. Galaxy interactions can take place in the form of mergers (major or minor, gas-rich or gas-poor), interactions, or fly-bys, with the cumulative effect of multiple high-speed fly-bys called harassment [89,90,91]. These processes are capable of inducing instabilities in the disk, which may drive gas inflows to the nucleus. In the local Universe, mergers are likely responsible for triggering central starbursts and Active Galactic Nuclei (AGN) that drive the quenching of extremely luminous galaxies (e.g., [92]). The ability of mergers and interactions to trigger or quench starbursts or AGN at higher redshift, however, is still highly debated in the literature (e.g., [93,94,95]). Potentially separate from quenching, gravitational processes may drive morphological transformation (e.g., [96,97]), though the role of major mergers in forming ellipticals at high redshift is also highly uncertain (e.g., [98,99]). We will focus on the observational evidence for quenching by gravitational mechanisms; a full treatment of the role of interactions in morphological change in (proto-)cluster galaxies is beyond the scope of this review.
Finally, internal processes that operate in isolated galaxies occur and may even be enhanced or happen at earlier times in overdense environments. This includes disk instabilities and stellar feedback as well as AGN feedback, which can heat and/or expel gas and is particularly relevant in quenching massive galaxies (log ; [13,100,101,102,103,104]). Luminous AGN may rapidly remove gas from galaxy centers (e.g., [92,105]) while less luminous AGN activity may aid in starvation via modest outflows moving gas into the galaxy outskirts or hot halo (e.g., [101,102,106,107]). Overdense environments can result in overconsumption (e.g., [35,108])—the depletion of gas via the combined effects of starvation, consumption by star formation, and modest feedback. This incorporates internal processes with environmentally-driven suppression of fresh gas accretion and recycling to effect quenching over a range of timescales, depending on SFR and feedback strength. Unlike hydrodynamical processes, these mechanisms likely quench inside-out.
How can we look for and separate these mechanism(s) in overdense environments? Resolved studies (e.g., [109,110,111,112]) can look for signatures of quenching across the disk, separating outside-in from inside-out processes, as well as disturbed morphologies, ram-pressure stripped tails, and faint tidal features indicating interactions. These studies, however, are still in their infancy, particularly at high redshift. Aggregate studies of populations can instead look for trends in galaxy properties (stellar mass, SFR, AGN fraction, gas content) with environmental proxies (projected radius, local galaxy density, halo mass) over cosmic time. This allows for the quantification of properties such as: SFG and QG fractions; stellar mass functions; environmental quenching efficiencies (EQE); SFRs and deviations from the star-forming Main Sequence6 (MS); and gas depletion timescales and gas fractions. These will be discussed in Section 4, Section 5 and Section 6 and then placed in the context of the mechanisms described here in Section 8.
1.2. What Do We Learn from the Infrared?
The infrared is traditionally broken into three regimes: the near-infrared (NIR), mid-infrared (MIR), and far-infrared (FIR), the latter of which includes the so-called submillimeter (submm) wavelengths. This wavelength range contains a wealth of information, tracing stellar to star formation to gas properties. Here we summarize the relevant observables and why they are important for (proto-)cluster studies.
1.2.1. Near-Infrared
In galaxies, the NIR is dominated by evolved stellar populations, the end product of galaxy growth via star formation and/or mergers. Continuum emission from low-mass stars produces a ubiquitous stellar bump feature peaked at 1.6 μm, seen in all galaxies with established stellar populations (by ∼10 Myr after a young starburst; [118]), with the exception of luminous AGN hosts where the NIR is dominated by the hot dust continuum (see Lyu and Rieke [60] for a review). NIR constraints near rest-frame 1 μm therefore provide a robust measure of the total stellar mass—with uncertainties largely driven by systematics (∼0.3 dex; [119])—as well as sizes, morphologies, and tidal features7. Crucially for (proto-)cluster studies, the near-IR also provides a long wavelength anchor for color selections intended to separate SFG and QG populations. The most widely used is the rest-frame UVJ color selection [121], which uses rest J band (∼1 m) to break the degeneracy between stellar age and dust attenuation (e.g., [122,123,124]) with low (10–30%) contamination in quiescent color space from SFGs [125,126,127]. From this, the relative SFG and QG fractions and environmental quenching efficiencies can be derived (see Section 4).
1.2.2. Mid- to Far-Infrared
Moving to longer wavelengths, the M/FIR regime is dominated by the reprocessed stellar light emitted in the infrared by small to large dust grains that are pervasive within (and between) (proto-)cluster galaxies (see Galliano et al. [128] for a review). Within galaxies, dust is primarily heated by recent star formation, producing aromatic emission features in the MIR and a broad continuum peaked at ∼70–100 m in the FIR [129]. Luminous AGN can additionally generate a hot dust continuum in the N/MIR up to ∼30 m. Dust-obscured star formation is the dominant component in massive (log ) galaxies at high redshift, with ultraviolet (UV) and optical emission (direct SF tracers) heavily attenuated [130]. As a result, direct star formation tracers in the UV/optical can severely underestimate the true SFR and dust corrections can have large uncertainties. In these obscured galaxies, the mid and far-IR near the dust peak provide robust SFR tracers (Kennicutt and Evans [131], and references therein).
In this review, we will refer to various classes of dusty SFGs (DSFGs): luminous infrared galaxies (LIRGs, ), ultra-luminous infrared galaxies (ULIRGs; ) and submillimeter galaxies (SMGs; mJy, see Casey et al. [57] for review). These populations are the most difficult to detect in the UV/optical and can even be challenging into the short wavelength near-infrared (e.g., [132,133,134,135]). For (proto-)cluster studies, this primarily affects our ability to establish cluster membership and measure SFRs [136,137,138,139,140]. This challenge is strongly amplified in studies at cosmic noon ( 1–3) where star formation and black hole accretion activity peaks and the majority of star formation is obscured (e.g., [141,142] Zavala & Casey, in prep). Obscured AGN likewise are best identified in the MIR (e.g., [60,143,144]).
1.2.3. Far-Infrared to Submillimeter/Millimeter
The cold molecular phase of the ISM is traced by longer-wavelength emission in the FIR-to-submm regime. However, since molecular hydrogen (H) is symmetric and therefore has no permanent dipole8, optically-thin dust continuum and the rotational transitions of carbon monoxide (CO) have become the favored means of observing this gas phase; see reviews by Solomon and Vanden Bout [145], Carilli and Walter [146], Tacconi et al. [78], and Saintonge and Catinella [79]. Well past the FIR dust peak (m), dust emission becomes optically-thin and is proportional to the bulk cold (∼25 K; [147]) dust mass. Given the dust temperature, dust-to-gas ratio (DGR), and dust opacity, the gas mass can be derived from this emission; a standard conversion has been calibrated for the molecular gas mass in massive (field) galaxies (e.g., [147,148]). This method is particularly efficient at high redshift, given the strong negative K-correction. The submm is also home to multiple CO transitions; as the next most abundant molecule, CO serves as a robust proxy for cold H emission, though calibrations may change at low metallicity (e.g., [149]). In the local Universe, CO emission is often observed in conjunction with atomic Hi emission in the radio to track the molecular+atomic gas reservoir. At higher redshifts (), where galaxies are more gas-rich, ISM conditions are expected to result in the molecular gas dominating over negligible atomic gas (see Schreiber and Wuyts [117] and references therein). As molecular gas is the fuel for star formation, quenching processes are expected to act directly to perturb, or possibly even remove, the molecular gas reservoir in galaxies; as such, it is a key observable in assessing the drivers of galaxy evolution. CO emission lines additionally provide robust spectroscopic redshifts (spec-zs), effective for establishing (proto-)cluster membership for dusty galaxies.
2. Scope, Definitions, and Outline
This review discusses recent advances in the studies of (typical) galaxy populations in (proto-)clusters—with an emphasis on high-redshift ( 0.5–7) works—using NIR (∼1–5 m), MIR (∼5–30 m), and FIR (∼30 –3 mm) observations. The range ≳ 500 m will often interchangeably be referred to as the submillimeter (submm) for historical reasons. Our focus will be on progress toward understanding galaxy evolution in overdense environments, particularly quenching and the role of quenching mechanisms introduced in Section 1. A notable exception: due to the explosion in progress in infrared studies of (proto-)clusters, this review cannot cover all relevant advances and we will leave a full treatment of infrared studies of cluster galaxy sizes, morphologies, and morphological transformation to another review. In addition, we will not cover Brightest Cluster Galaxies (BCGs), an evolutionarily distinct population that deserves separate consideration. For discussions of BCGs, we refer the reader to, e.g., Overzier [33], De Lucia and Blaizot [150], Donahue and Voit [151] and references therein.
An overview of environment and definitions of galaxy clusters and proto-clusters were given in Section 1.1. Throughout this review, we will characterize clusters by their virial radius, (≡, the radius enclosing 200 times the critical density of the Universe at a given redshift) and the corresponding virial mass, . and are also commonly used in the literature, where 9. We will use where appropriate given the convention in the literature. We adopt a concordance cosmology, (, , h) = (0.7, 0.3, 0.7), and a Kroupa [153] IMF unless otherwise noted.
This review is structured as follows: Section 3 begins with a brief review of (proto-)cluster selection using near- and far-infrared surveys to highlight the available and upcoming datasets. Section 4 reviews current analyses of cluster populations using the near-infrared, covering stellar mass functions and quenched fractions and quenching efficiencies to . In Section 5, we present the current state of the literature regarding (obscured) star formation in (proto-)cluster galaxies from low to high redshift using M/FIR observations. Section 5.4 diverges from this to give a brief summary of AGN activity in clusters. Progress on FIR and submillimeter measurements of dust and molecular gas in (proto-)cluster galaxies is presented in Section 6. Section 7 discusses the revival of the “total light” stacking technique—measuring the averaged properties of large (proto-)cluster samples—through examples in the areas of intracluster dust (ICD), dust in cluster populations, and cluster galaxy concentrations. A discussion tying the reviewed studies to quenching in cluster galaxies is presented in Section 8 and a summary of open questions and important upcoming surveys and facilities is presented in Section 9.
3. Identifying (Proto-)Clusters in the Infrared: Current and Future Large Surveys
Statistical samples of galaxy (proto-)clusters—covering a large range in halo mass, dynamical state, and redshift—are necessary for both the use of clusters as probes of cosmology (see Allen et al. [154] for a review) and as astrophysical laboratories for galaxy evolution [4,13]. (Proto-)cluster selection is done via multiple techniques, such as tracing galaxy populations to identify galaxy overdensities, using rare sources as signposts of massive halos, or observations of the hot gas (– K) of an established ICM. For the latter, X-ray emission, as a direct observable of the ICM, has been a widely successful tool in building cluster samples; however, surface brightness dimming results in this selection being most effective at low to moderate redshifts (see Rosati et al. [155] for a review). Optical imaging surveys typically identify overdensities of red early-type galaxies (ETGs) through filters that bracket the 4000 Å break (Red Sequence (RS) selection, e.g., [156,157]); however, this selection is sensitive to projection effects, favors evolved clusters, lacks a direct halo mass proxy, and is limited to lower redshifts. These drawbacks can be mitigated by incorporating imaging in the near-infrared, which can extend the selection of red galaxies to higher redshifts and/or be used to derive robust photometric redshifts (photo-zs) for both optically blue and red galaxies. At longer wavelengths, the Sunyaev-Zel’dovich Effect (SZ; [158]) provides an indirect detection of the ICM, while at higher redshifts the nature of rare populations such as luminous IR sources can be used to select massive halos. In this section, we give a broad overview of clusters selected using near-infrared and submillimeter imaging, including existing and future large cluster surveys. This is followed by a discussion of infrared selection of proto-clusters.
3.1. Cluster Selection in the Near-Infrared
The introduction of sensitive, wide-field near-infrared imaging surveys10 has greatly expanded the use of selecting clusters as NIR overdensities, with pioneering work pushing to [164,165,166,167,168,169,170]. This generally takes a few forms: optical-NIR colors can be used to span the 4000 Å break at [171,172] expanding Red Sequence selection [156] to higher redshifts, while NIR-only color cuts [173] or two color optical-NIR cuts (“Stellar Bump Sequence”; [174]) can isolate higher redshift overdensities. With multi-band optical+NIR imaging, overdensities are now also often identified in photometric redshift space, using full photo-z probability distribution functions to identify clusters and create cluster member catalogs (e.g., [169,175]).
Notably, the rest NIR traces stellar mass, allowing for mass-selected cluster catalogs. NIR selection techniques further benefit from a negative K-correction, with the observed flux density at 4.5 m nearly redshift-independent over –2.5 [169,176]. NIR selection has successfully identified clusters out to (Figure 2), though, like X-ray, its effectiveness starts to drop around –1.5 given the current sensitivities of near-infrared surveys and the need for good coverage of stellar features. Unlike X-ray, NIR selection may identify more disturbed and young, actively accreting clusters [177]. As with optical selection, the main limitations on this method are a lack of direct halo mass proxy and projection effects (e.g., [178]), which can result in the false detection or mis-characterization of a cluster. For optically or NIR-selected clusters, the halo mass-richness relation [179,180]—where richness is the number of cluster members above some magnitude—is used to infer the halo mass from the galaxy component. Richness estimators have been developed with low scatter (∼0.1–0.2 dex; [181,182,183]), though contamination or incompleteness in the cluster membership can still bias the derived halo mass [184].
Here we list some notable NIR-based cluster surveys (Table 1). The Spitzer Adaptation of the Red-Sequence Cluster Survey (SpARCS; [171,172,185]) identified clusters using m color selection at over 42 deg with multi-wavelength coverage and was the basis of follow-up optical spectroscopic campaigns for the well-studied Gemini Cluster Astrophysics Spectroscopic Survey (GCLASS; 10 clusters at ; [34]) and Gemini Observations of Galaxies in Rich Early Environments (GOGREEN; 21 groups and clusters at ; [186]) samples, which will be discussed extensively in Section 4. The IRAC Shallow and Distant Cluster Surveys (ISCS/IDCS; [169,187]) used extensive multi-wavelength coverage in the 8.5 deg Boötes field to identify >300 log cluster candidates from as overdensities using robust photometric redshifts [165]. Spectroscopy from the AGN and Galaxy Evolution Survey (AGES; [188]) and targeted follow-up [165,169,175,189,190,191,192] were used to confirm >120 clusters in this sample and halo mass measurements were made using X-ray, SZ, and weak lensing as well as statistical arguments [187,190,193,194,195,196,197,198]. Substantial M/FIR follow-up was obtained for this sample as well, adding to the available X-ray to NIR photometry [199]; this survey will be discussed extensively in Section 5. We note two additional surveys covering up to ∼100 deg: ∼1,000 group and low-mass cluster candidates were identified using the Red Sequence cluster finder redMapper [200] in the 24 degSpitzer-HETDEX Exploratory Large Area survey (SHELA; [201]) and 279 cluster candidates at were identified using color selection in the 94 deg Spitzer South Pole Telescope Deep Field survey (SSDF; [202]).

Table 1.
A(n Incomplete) List of Large Cluster Surveys Incorporating Near-Infrared Observations (Section 3.1).
Table 1.
A(n Incomplete) List of Large Cluster Surveys Incorporating Near-Infrared Observations (Section 3.1).
| Survey | Method | Cluster | Confirmed | Area | Redshift | log | References |
|---|---|---|---|---|---|---|---|
| Candidates | Clusters | [deg] | (Median) | [] (Median) | |||
| ISCS/IDCS | Photo-z Overdensities | >300 | >120 | 8.5 | 0.1–2 | (13.8) | E08, S12 |
| SHELA | RS | 1082 | − | 24 | 0.5–1.2 | 13.9 | P16, F21 |
| SpARCS | RS | >200 | >10 | 42 | 0.6–1.5 | − | G00, G05, M09, W09, M12 |
| SSDF | Color Selection | 279 | − | 94 | >1.3 | 14.1 | R14 |
| HSC + unWISE | Overdensities around BGC Candidates | 21,661 | − | 800 | 0.1–2 | ≥13.8 | WH21 |
| DES + unWISE | Overdensities around BGC Candidates | 151,244 | − | 5000 | 0.1–1.5 (0.7) | − | WH22 |
| MaDCoWS | Color Selection | 2683 | 38 | 10,000 | 0.7–1.5 (1.06) | (14.2) | G19 |
| SDSS+WISE | Overdensities around BGC Candidates | 1959 | − | 10,000 | 0.7–1 | >14.4 | WH18 |
| 2MASS+WISE | Overdensities around BGC Candidates | 47,600 | − | 28,000 | 0.025–0.3 | ≳14.5 | W18 |
| Projected | |||||||
| Roman | Photo-z Overdensities | 40,000 | − | 2200 | <3 | >14 | S15 |
| MaDCoWS2 | Color Selection | − | − | ≳10,000 | ∼0.5–2 | − | T., in prep. |
| Euclid | Photo-z Overdensities | 2,000,000 | − | 15,000 | <2 | >13.8 | S16, A17, R18, E19 |
Note—This list of cluster surveys incorporating NIR observations is not exhaustive and the surveys listed are not mutually exclusive. Surveys are listed in order of increasing area covered. A dash indicates information not readily available in the literature. Redshifts and masses are given as ranges and/or medians, the latter indicated by parentheses, unless otherwise noted. a Redshift range and average mass for the 70 highest richness cluster candidates in SHELA, stacked in SZ [203]. b 15,614 previously unknown [204]. c 76,826 previously unknown [205]. d 26,125 previously unknown [206]. References: A17: [207]; E08: [169]; E19: [208]; F21: [203]; G00: [156]; G05: [157]; G19: [209]; M09: [172]; M12: [34]; P16: [201]; R14: [202]; R18: [210]; S12: [187]; S15: [211]; S16: [212]; T, in prep: Thongkham et al, in prep.; W09: [171]; W18: [206]; WH18: [213]; WH21: [204]; WH22: [205].
More recently, substantially larger cluster surveys have been assembled taking advantage of wide-field optical surveys combined with WISE all-sky coverage, identifying rare, massive systems over thousands of square degrees11. The Massive and Distant Clusters of WISE Survey (MaDCoWS; [209]) combined Pan-STARRS and SuperCOSMOS with WISE over ∼10,000 deg to identify 2433 cluster candidates at (Table 1). Targeted Spitzer follow-up was obtained for 1723 of these candidates, from which photometric redshifts and richnesses were measured. Halo masses derived from SZ were used to calibrate the mass-richness relation. A follow-up catalog, MaDCoWS2, will expand the redshift range to using deeper DeCaLS+CatWISE2020 imaging over again ∼10,000 deg (Thongkham, in prep.). Similarly, using 2MASS+SuperCOSMOS+WISE [206], SDSS+WISE [213], HSC-SSP+unWISE [204] and DES+unWISE [205], over 150,000 cluster candidates were identified over by searching for photo-z overdensities around massive galaxies, presumed to be current or future BCGs. Mass-richness relations for these surveys were calibrated using overlap with X-ray and SZ surveys. Figure 2 shows the -redshift distribution of available large catalogs, which span nearly two orders of magnitude in halo mass.
Future faculties are projected to increase NIR-selected cluster candidates by another order of magnitude (Table 1), in conjunction with wide-field optical surveys from, i.e., DES and the Vera C. Rubin Observatory [222]. Euclid [223], a wide-field UV to NIR surveyor, will image 15,000 deg in YJH bands to moderate depths and is anticipated to identify two million cluster candidates up to [207,208,210,212]. The Nancy Grace Roman Space Telescope will survey 2200 deg with deep (H = 26.5AB) NIR imaging and slitless spectroscopy, pushing the limits of massive (log ) (proto)-cluster detection to [211].
3.2. Cluster Selection via the SZ Effect
Similar to X-ray selection, the hot ICM of galaxy clusters can be detected, albeit indirectly, though its interaction with the Cosmic Microwave Background (CMB) via inverse Compton-scattering, termed the thermal12 SZ Effect (see Carlstrom et al. [224] for a review). This interaction causes a distortion in the CMB, suppressing the spectrum below (rest) 218 GHz (∼1.4 mm) and enhancing it above. The magnitude of this effect relative to the CMB is constant with redshift, meaning SZ selection of clusters has the advantage of being largely redshift independent, yielding roughly (within a factor of 2–3; [224]) mass-limited cluster catalogs [225]. As such, it has been proposed as a promising avenue for finding large samples of high-redshift () clusters; however, the exact cluster counts will depend strongly on instrument resolution and the nuances in the evolving relationship between the SZ observable, , and (e.g., [226,227]). The latter arises from the SZ signal’s proportionality to the ICM column density (weighted by temperature); this provides a halo mass proxy with low scatter, relatively (but not entirely) insensitive to the detailed physics of heating and cooling processes as well as structural asymmetries [225]. This capability plays an important role in the calibration of mass-richness relations for the current and future optical/NIR surveys discussed in the previous section [209,228].
Table 2.
A(n Incomplete) List of (Proto-)Cluster Surveys Incorporating FIR and Submm Observations (Section 3.3).
Table 2.
A(n Incomplete) List of (Proto-)Cluster Surveys Incorporating FIR and Submm Observations (Section 3.3).
| Survey | Method | Cluster | Confirmed | Area | Redshift | log | References |
|---|---|---|---|---|---|---|---|
| Candidates | Clusters | [deg] | (Median) | [] (Median) | |||
| Clusters | |||||||
| SPTpol | SZ | 89 | 81 | 500 | (0.6) | (14.6) | B14, H20 |
| SPT-SZ 2500 deg | SZ | 677 | 516 | 2500 | (0.55) | (14.4) | B15 |
| SPT-ECS | SZ | 448 | 408 | 2770 | (0.49) | (14.8) | B20 |
| AdvACT DR5 | SZ | 4195 | 4195 | 13,211 | 0.04–1.91 (0.52) | >14.6 | H18, H21 |
| Planck PSZ1/PSZ2 | SZ | 1653 | 1203 | 34,487 | <1 | 14.5 | P14, P16a |
| Proto-clusters | |||||||
| Planck PHz | Color Selection | 2151 | − | 10,725 | (∼2.5 ) | − | P16b |
| Projected | |||||||
| SPT-3G | SZ | ∼10,000 | − | 1500 | (0.7) | (>14.1) | B14, S22 |
| Simons Obs | SZ | 26,445 | − | 16,500 | (0.7) | (14.3) | A19a, R22 |
| CCAT-prime | SZ | 16,000 | − | ∼20,000 | <2.5 | >14 | C21 |
| CMB-HD | SZ | 514,530 | − | 20,600 | (0.9) | (13.8) | S19, R22 |
| CMB-S4 Wide | SZ | 107,747 | − | 27,600 | (0.8) | (14.2) | A19b, R22 |
| PICO | SZ | 150,000–200,000 | − | All-Sky | <3–4.5 | >14.3 | H19 |
Note—This list of cluster surveys incorporating submm observations is not exhaustive and the surveys listed are not necessarily mutually exclusive. Surveys are listed in order of increasing area covered. A dash indicates information not readily available in the literature. Confirmed clusters refers to confirmation via another wavelength regime and/or via spectroscopy. Redshifts and masses are given as ranges and/or medians, the latter indicated by parentheses. a Assuming T K [229]. References: A19a: [230]; A19b: [231]; B14: [232]; B15: [233]; B20: [228]; C21: [234]; H18: [235]; H19: [236]; H20: [237]; H21: [238]; P14: [239]; P16a: [240]; P16b: [229]; R22: [241]; S19: [242]; S22: [243].
The last two decades have seen great strides in SZ surveys, which have now identified over 6000 cluster candidates. Large SZ surveys have been conducted by the South Pole Telescope [50], ACT [244] and Planck [239]; the individual surveys and their references are listed in Table 2 and the redshift and mass distributions of these surveys can be seen in Figure 2. Current SZ surveys identify fairly massive clusters at due to sensitivity and resolution limitations. The next major step forward will come from SPT-3G, which began a multi-year 1500 deg survey in 2018 and is expected to identify up to 10,000 cluster candidates above log at a median redshift [241,243]. Future improvements in sensitivity/mapping speed via the Simons Observatory [230], CMB-S4 [231], and CMB-HD [242] experiments are expected to increase the number of known SZ clusters by orders of magnitude. Projections based on expected improvements in noise and cluster masking techniques (Raghunathan [241]) predict identification of greater than 600,000 SZ clusters with signal-to-noise (S/N) , with >80,000 at 1.5–2 and >20,000 at over of the sky, assuming a Tinker et al. [245] halo mass function (Table 2). Upcoming facilities such as the ground-based telescope CCAT-prime [234] and the Probe of Inflation and Cosmic Origins (PICO) satellite [236] are additionally projected to use SZ to great effect in (proto-)cluster selection to high redshift. In addition to 150,000 SZ clusters to , PICO’s all-sky survey is anticipated to identify 50,000 proto-clusters to .
3.3. Proto-Cluster Selection in the Infrared
Though proto-clusters can in principle be identified even as modest density contrasts above the general dark matter distribution out to high redshift (; see Overzier [33] for a review), their nature presents several challenges to detection. Proto-clusters are rare overdensities likely located at the conjunctions of filaments (e.g., [70,246,247]) and can span 10–30 on the sky. By definition, a proto-cluster will collapse into a cluster by ; however, in its pre-collapsed state, proto-clusters often have not yet heated their ICM sufficiently to detect via X-ray or SZ and have not yet established a telltale RS population. Establishing overdensities of “normal” galaxies in this epoch () requires very deep surveys over 10 cMpc scales [248], and preferably spectroscopic or narrow band surveys which mitigate the risk of mistaking structures overlapping in the line-of-sight for bona fide proto-clusters. However, “normal” galaxies over such large scales manifest a small density contrast and the expense of such surveys can make them better suited to follow-up of likely proto-cluster candidates, which can be identified using alternative rare populations as biased13 tracers.
3.3.1. Luminous DSFGs, Obscured AGN, and Ultra-Massive Galaxies as Signposts of Proto-Clusters
Rare galaxy populations which preferentially inhabit the most massive halos at a given epoch, such as luminous radio galaxies (e.g., [176,249,250]), have long been used as relatively inexpensive tracers to identify proto-cluster candidates [33]. In the IR, DSFGs, luminous obscured AGN [251,252,253,254], and, recently, Ultra-Massive Galaxies (UMGs) have been explored as such populations. First, we will discuss DSFGs (often identified in the submm and called SMGs), which are highly star-forming (SFR yr) galaxies thought to be the progenitors of the most massive ellipticals (e.g., [92,255,256,257]), which likely formed in bursts of star formation at 2–3 (e.g., [258,259]). Whether SMGs live in the most massive halos has been a controversial topic, however, with early studies suggesting that they live in a range of environments (e.g., [260]). Additional arguments have been made that the short-lived nature of the burst phase (∼100 Myr; [57]) and early quenching due to downsizing make SMGs a poor tracer of proto-clusters due to large scatter in the number of SMGs for a fixed dark matter overdensity ([261,262,263], but see [264]).
There are two lines of observational evidence, however, that suggest DSFGs/SMGs are useful signposts of proto-clusters (see Chiang et al. [70] for arguments from the theoretical perspective). First, we can consider clustering, which links galaxy populations to their dark matter halos [265,266,267]. The clustering of SMGs has historically been difficult to measure due to projection effects (e.g., [268,269]) and the large beamsizes (>) of single-dish submm telescopes, which can blend multiple submm sources (see, e.g., Casey et al. [57], Hodge and da Cunha [270] for reviews). Recently, however, studies with high-resolution ALMA imaging (e.g., [256,257]) have mitigated the blending issue and found that the clustering of the most luminous SMGs ( mJy) is consistent with SMGs inhabiting very massive halos at (see also [264], for clustering of DSFGs around high-redshift, massive quasars, a likely tracer of massive halos). This is supported by emerging evidence of extreme massive, IR-luminous SFGs at very high redshift, which can likely only form in the largest halos in such an early epoch (; [271]). This makes very luminous SMGs promising candidates as signposts for the most massive halos at high-z [272], expected to collapse into log clusters at . The fate of halos hosting moderately luminous SMGs is less clear, however.
Second, early submm surveys quickly discovered significant DSFG overdensities in known structures such as a proto-cluster in GOODS-N [260,272] and SSA22 at [273,274,275]. These and three other such overdensities (a proto-cluster in COSMOS14 at , MRC 1138-256 at , and PCL2001 at ) discovered in ∼3 deg of submm surveys, were found to have >5–10 DSFGs over 10–30 scales (Casey et al. [277] and references therein). Assuming a short lifetime of 100 Myr, Casey [278] showed that the probability of randomly observing >5 (>10) rare sources over a proto-cluster volume of cMpc is <6% (<0.01%). They further showed that given the 3 deg area of the submm surveys, these proto-clusters match the number density of massive clusters at , albeit with large uncertainties. These observations and arguments support specifically that overdensities of >5 DSFGs are robust signposts of proto-clusters. Subsequently, DSFG overdensities in >20 proto-clusters have been identified and characterized in the literature; an incomplete list including their redshift, observing window, total SFR, projected volume, and projected halo mass is shown in Table 3. FIR/submm surveys additionally have generated large catalogs of proto-cluster candidates identified as DSFG overdensities (see the next section, e.g., [229,279,280,281]). The nature of these proto-clusters will be discussed further in Section 5.3.
Beyond DSFGs, there are two populations identified using infrared observations that are gaining momentum as signposts for proto-clusters. The first is extreme, hyper-luminous obscured AGN, the so-called hot dust-obscured galaxies (Hot DOGs; [251,252]) and other WISE-selected bright populations15 [253]. These rare sources (there are Hot DOGs over the full sky) appear to be signposts of massive halos, with Hot DOGs observed to reside in overdense regions as traced by Ly [282] and infrared/submm [254,283,284,285,286]. Hot DOGs may be powered by prodigious merger activity [287] and have low molecular gas reserves [288]. This population, which can be radio-quiet [254,288], presents an interesting counterpoint to overdense environments which host radio-loud AGN (e.g., [176]), which are associated with massive jets and thus strong feedback. However, the populations of these proto-cluster candidates have yet to be studied in detail.
The second population is log galaxies at , termed Ultra-Massive Galaxies. UMGs at high redshift may be the intermediate step between DSFGs and cluster ellipticals and/or BCGs and are expected to inhabit massive halos given their extreme mass build-up by . Identifying these galaxies requires wide-field NIR capabilities to obtain the rest-frame optical and measure a stellar mass, with NIR spectroscopic follow-up to confirm (e.g., [127,289,290,291,292,293,294,295,296]). McConachie et al. [297] recently presented spectroscopically-confirmed overdensities around two UMGs at from the Massive Ancient Galaxies At NEar-infrared (MAGAZ3NE) survey [298,299], which will be discussed further in Section 5.3. Additional investigation of the environments around UMGs is needed to confirm their utility as a proto-cluster signpost.
Table 3.
An Incomplete List of Proto-clusters in the Literature with DSFG Overdensities.
| Name | Redshift | Observing | SFR | Volume | log | log | References | |
|---|---|---|---|---|---|---|---|---|
| Window | [ yr] | [cMpc] | [] | [] | ||||
| GOODS-N proto-cluster | 1.99 | 6 | 10 × 10 | 2600 ± 300 | 9000 | 13.8 ± 0.2 | ≳14.5–15 | B04, C09, C16 |
| COSMOS proto-cluster | 2.10 | 8 | 8 × 20 | 15,000 | ≳15 | S12, Y14, H16, C16, Z19 | ||
| MRC 1138-256 (PKS1138) | 2.16 | 5 | 6 × 9 | 8000 | ∼14 | ≳15 | K00, P00, K11, V13, R14, D14, S14, C16, E16, E18, Z18, T19, J21 | |
| PHz G237.0+42.5 | 2.16 | 4 | 10 × 11 | 18,500 | ∼14 | ∼15 | K21a, P21 | |
| HELAISS02 (core) | 2.171 | 4 | − | − | − | G19 | ||
| 2QZCluster (core) | 2.2 | 7 | 1000 | 138 | − | − | K16 | |
| BOSS1244 (core) | 2.24 | 0 | 6720 | 2000 | − | − | Z22 | |
| BOSS1542 (core) | 2.24 | 0 | 6300 | 2000 | − | − | Z22 | |
| HS1700+64 | 2.3 | 4 | 8 × 8 (core) | 1200 (core) | 6900 130 (core) | ∼14 | ≳15 | Ch15, K16, L19, H19 |
| PCL1002 e | 2.47 | 7 | 14 × 14 | 15,000 | ≳13.5 | ≳14.5–15 | D15, C15a, C15b, C16, Z19, C21 | |
| HXMM20 (core) | 2.602 | 5 | − | − | − | G19 | ||
| HS1549+19 | 2.85 | 4 | 50 (core) | 12,500 ± 2800 (core) | 10,600 240 (core) | ∼14 | ≳15 | L19 |
| SSA22 | 3.09 | 12 | 20 × 30 | 21,000 | S98, S00, H04, C05, G05, T09, L09, U12, K13, U14, U15, K15, A16, K16, C16, U17, K21b | |||
| SPT2018-45 (core) | 3.2 | 0 | 9200 | 2000 | − | − | W21 | |
| SPT0303-59 (core) | 3.3 | 0 | 15,700 | 2050 | − | − | W21 | |
| SPT0457-49 (core) | 3.988 | 0 | 7800 | 2600 | − | − | W21 | |
| Distant Red Core (core) | 4.002 | 10 | 0.6 × 0.7 | 6500 | 876.5 | ≳15 | L18, O18, L20 | |
| SPT2052-56 (core) | 4.257 | 0 | 7400 | 2800 | W21 | |||
| SPT2349-56 (core) | 4.302 | 23 | 4480 | 128 | ∼13–13.4 | ≳15 | M18, H20, R21, W21 | |
| SPT2335-53 (core) | 4.756 | 0 | 7000 | 3200 | − | − | W21 | |
| SPT0553-50 (core) | 5.323 | 0 | 10,500 | 3500 | − | − | W21 | |
| z57OD | 5.692 | 0 | − | − | − | ≳14.7 | O05, J18, H19 | |
| SPT0348-62 (core) | 5.654 | 0 | 7800 | 3800 | − | − | W21 | |
| z66OD | 6.585 | 0 | − | − | − | ∼14.5 | H19 | |
| SPT0311-58 (core) | 6.9011 | 0 | 10,900 | 4500 | − | − | W21 |
Note—This list of proto-clusters with DSFG overdensities is not exhaustive. Proto-clusters are listed in order of increasing redshift. The primary references that contain the information listed in this table are bolded. Quantities measured over a limited central area designed the “core” are labeled as such. A dash indicates information not readily available in the literature. a Observing window is listed as the full survey area or effective area (in arcmin2) assumed for the proto-cluster core in the relevant reference. b Summed SFR of DSFG and/or other identified proto-clusters members, see listed references for details. c The comoving volume is derived from the listed observing window and and/or taken from the relevant reference. d Proto-cluster numbers are the SFR and area of spec-z confirmed SMGs. Core numbers are from the summed SFR of all (unconfirmed) 24 m and 850 m source in the core region as described in Lacaille et al. [300]. e A nearby structure, CL1002-0220 at has been argued to be both a high-z, potentially virialized cluster [71,301] and a filament that will merge with PCL1002 [72]. Its gas properties will be discussed in Section 6.2.4. References: A06: [302]; B04: [272]; C05: [273]; C09: [260]; C15a: [303]; C15b: [277]; C16: [278]; Ch15: [304]; C21: [72]; E16: [305]; E18: [306]; D14: [307]; D15: [308]; G05: [274]; G19: [309]; H04: [310]; H16: [311]; H19: [312]; H20: [313]; K00: [314]; K11: [315]; K13: [316]; K15: [317]; K16: [318]; K21a: [319]; K21b: [320]; J18: [321]; J21: [322]; L09: [323]; L18: [324]; L19: [300]; L20: [325]; M18: [326]; O05: [327]; O18: [328]; P00: [329]; P21: [330]; R14: [331]; R21: [332]; S98: [333]; S00: [334]; S12: [335]; S14: [336]; T09: [275]; T19: [337]; U12: [338]; U14: [339]; U15: [340]; U17: [341]; V13: [342]; W16: [301]; W21: [343]; Y14: [344]; Z18: [345]; Z19: [346]; Z22: [347].
3.3.2. Selecting DSFG Overdensities in Shallow, Wide (or All-Sky) Submm Surveys
Even given the comparatively large area over which FIR/submm data is available from ground-based facilities and Herschel, the rarity of proto-clusters [21,278] presents a challenge in building statistical samples. Low-resolution, wide-field or all-sky submm surveys can integrate the emission from multiple DSFGs (e.g., [326,328,348]), while multi-band wavelength coverage can identify “cold” submm sources, i.e., those whose dust peak has redshifted into the ∼350–500 m range, placing them at 1.5–3 (modulo the dust temperature; e.g., [349]). This can provide a catalog of proto-cluster candidates in a relatively unbiased way, while taking advantage of the negative K-correction in the submm [350]. Here we present the recent results from Planck as an example.
The Planck All-Sky survey catalogued compact sources (with a beamsize of 4–5 at 100–857 GHz, Mpc at ) in the Planck Early Release Compact Source Catalog (ERCSC; [351]), Catalogue of Compact Sources (PCCS; [352]), and Second Catalogue of Compact Sources ([PCCS2; [281]). Early analyses of these catalogs identified numerous proto-cluster candidates which were then compared with Herschel surveys (e.g., [279,353,354]), where half of the Planck compact sources resolved into multiple discrete Herschel sources [355]. A subsequent list of 2151 cold, compact sources was constructed via color selection using 217–857 GHz + 3 THz IRIS data [356] to isolate high-redshift (, median assuming T K) sources in the cleanest 26% of the sky (PHz catalog; [229]). Herschel follow-up of 228 of these cold sources [280] revealed 93% were associated with on average 10 red Herschel sources (the rest were lensed DSFGs), with stacked 350 m extended emission consistent with expected proto-cluster sizes (Figure 3, see [357] for Spitzer/IRAC follow-up). Unlike using a straight catalog of compact sources, this color selection rejects Galactic sources, low-z contaminants, and low-z clusters with strong SZ (see also [355,357]).
Are Planck “cold” sources robust proto-cluster candidates? Several works have now confirmed submm overdensities among the PCCS sources [357,360,361,362,363]. On the other hand, the source density of PHz “cold” sources is 0.21 deg, more than three orders of magnitude higher than predicted for proto-clusters in a standard cosmological framework [348,364,365]. This discrepancy can be resolved if multiple unrelated high-z proto-clusters fall into the Planck beam, as predicted by semi-analytic simulations [365] and observed in limited spectroscopic follow-up [330,360,366,367]. Recently, Lammers et al. [368] cross-matched 187 PHz sources with Herschel SPIRE17 imaging compiled in the Herschel Extragalactic Legacy Project (HELP; [370]), finding that are associated with >3 SPIRE overdensities, a higher fraction than the PCCS sample (). Revisiting the Negrello et al. [365] simulations, they determined the average number of line-of-slight overdensities in a Planck source was four, but that the ratio of the flux of the brightest overdensity was 3× higher than the second brightest overdensity in of cases, signaling that one candidate proto-cluster dominates. Gouin et al. [371] examined star formation in massive halos in IllustrisTNG [372], finding that theoretical Planck cold sources largely consist of one large SF halo plus smaller halos of background/foreground interlopers. They predict ∼70% of their simulated Planck sources will evolve into massive (log ) clusters by , though they note that the simulations continue to underestimate galaxy SFRs relative to observations [364,373]. In rough support of our discussion in the previous section, they find that the number of SFGs (>7 with SFR yr) can discriminate Planck sources more likely to evolve into clusters.
The discussion is ongoing but there is compelling evidence that a significant fraction of submm cold sources are selecting proto-clusters at 2–4. Techniques will have to be developed to mitigate contamination and wide-field narrow-band imaging (e.g., [374]), spectroscopy, and/or statistical techniques (Section 7) are needed to take advantage of future large proto-cluster candidate samples. In the next several sections, we turn our focus from (proto-)cluster surveys to the (proto-)cluster galaxy populations, exploring what we have learned in the near-, mid/far-IR, and submm regimes.
4. The Near-Infrared: Stellar Mass Functions and Quenched Populations
Absent external influences, galaxies stop forming stars (i.e., quench) via secular processes (supernovae, stellar winds, AGN feedback; e.g., [375,376,377]), often termed mass- (or self-)quenching. A long standing question is whether mass-quenching is separable from environmental-quenching [6]: in other words, does mass-quenching operate independently of environment and does environmental-quenching operate independently of stellar mass? Mass-quenching is strongly stellar mass-dependent, with higher mass galaxies quenching first (i.e., downsizing; [378,379,380,381]). Low-mass galaxies mass-quench on longer timescales; at log , this timescale exceeds the Hubble time and such galaxies have not yet quenched in the field (with rare exceptions, e.g., [382]) as seen in the high star-forming fraction in the void regions in Figure 1. This makes low-mass galaxies an ideal population to address the role of environmental quenching. Higher mass galaxies cannot be neglected, however, as they may be effected by different environmental processes.
In this section, we review the current literature using NIR to characterize the stellar populations in clusters, with the goal of addressing how galaxies in extreme environments quench over cosmic time. As described in the introduction, two key tools are provided by the NIR: the stellar masses of cluster members and the division of cluster members into SFG and QG populations using UVJ (or equivalent) color selection. In Section 4.1, we discuss what we know about stellar mass functions (SMFs) in clusters and as a function of local galaxy density; the latter has been pushed to low masses. In Section 4.2, we define and examine the environmental quenching efficiency—excess quenching due to environmental processes—to high redshift and beyond the virial radius.
4.1. The Stellar Mass Function in Overdense Environments
A fundamental characterization of a galaxy population is the stellar mass function, the number distribution of galaxies in bins of stellar mass, which encodes information on the processes that have contributed to and impede stellar mass growth. The SMFs of most galaxy populations18 are well described by a single or double Schechter function [385], parameterized by shape [characteristic mass (), low-mass slope ()] and overall normalization (). In the field, the shape of the SMF changes little to while its normalization evolves, driven by mass-quenching increasing the QG population (e.g., [386,387]).
If we assume that the field SMF is dominated by mass-quenching, differences in the SMF in overdense environments can be attributed to environmental quenching. These differences have been searched for using both “global”19 and “local” definitions of environment, as traced by different proxies (e.g., cluster-centric radius vs. local galaxy density). The distinction may not be trivial: early work in Vulcani et al. [389] and Vulcani et al. [390] examined the stellar mass function down to log using both local and global definitions on optical cluster surveys20. They found differences from the field SMF only when considering local environment, illustrating that caution should be taken in comparing works using inhomogenous definitions of environment.
Subsequent (global) cluster studies incorporating the NIR (and often going to lower mass limits) largely find that the total SMF in clusters has a clear environmental dependence up to ([388,394,395,396,397], but see [390,398]). Figure 4 (right panel) compares the shape of the SMF function compiled from 11 galaxy clusters at from the GOGREEN survey to a coeval field sample [388]. The cluster total SMF reflects an overabundance of massive galaxies, with a deficit at the lower-mass end relative to the field. Remarkably, however, when the galaxy populations are split into star-forming and quiescent (using UVJ colors), the shapes of the SFG and QG SMFs become independent of environment (Figure 4, left and middle panels). This characteristic behavior of the SMF in overdense environments has been observed in low ( 0.2–0.4; [394,395]) and intermediate-redshift clusters21 ( 0.5–1.2; [388,396,397,399]), in low-mass cluster/group scale halos [401], and in local environment studies [400,402]. They suggest that (1) environmental quenching is mass-independent at log , in order to maintain the shape of the SFG SMF, and (2) differences in cluster total SMFs are driven by an excess in the quenched galaxy fraction. In support of the latter, QGs are found to dominate the cluster galaxy counts to survey mass limits (log ; [35,397]), in sharp contrast to the field and consistent with the local SFR-density relation extending to at least .
Environmental dependence in the shape of the SFG and QG SMFs, however, becomes apparent at lower stellar masses. For example, van der Burg et al. [397], observing 21 Planck-selected clusters at to log , found that the QG SMF has a significantly flatter low-mass slope in the clusters than the field, indicating an excess of low-mass quenched galaxies. This flatter was also observed for log 9–10 QGs in group-scale overdensities over [400] and up to cluster-scales in the local environment ORELSE survey22 over [402]. While van der Burg et al. [397] found no environmental-dependence in shape of the SFG SMF, Tomczak et al. [402] reported a strong dependence in their highest density bin (see also the local environment studies by [404,405,406]), indicating mass-dependent quenching. The importance of quantifying the low-mass slope was demonstrated by Papovich et al. [400], who convolved their SFG and QG SMFs derived in regions of low galaxy density with constant and mass-dependent quenching (Figure 5). Due to the extremely steep slope of the field SFG SMF at low mass (panel b), mass-independent environmental quenching (panel c) would result in the equivalent strong upturn in the low-mass slope of the QF SMF (panel d). Even a modest mass-dependence in environmental quenching, however, can more easily replicate the flat observed in overdense environments. This effect is even more pronounced at 1–1.5 where the they find an even shallower low-mass slope. Notably both constant and mass-dependent quenching toy models can reproduce the high-mass end; as such, pushing to log and lower provides the most discriminating power in quantifying the evolution of the SMF with environment.
In summary, there is a general consensus that SMF studies reveal a clear environmental influence driving the quenched galaxy fraction to dominate at all stellar masses probed (or in other words an increase in the QG SMF normalization) which modifies the shape of the total SMF in favor of excess massive (quenched) galaxies. At the same time, the separate QG and SFG SMFs at the high-mass end show no evolution in shape, which can be achieved via quenching that is independent or moderately-dependent on stellar mass. At the low-mass end, on the other hand, where secular mass-quenching is largely absent, a flattened slope in the QG SMF strongly suggests a mass-dependent environmental quenching efficiency.
4.2. The Quenched Fraction and Environmental Quenching Efficiency
A more direct look at environmental quenching can be achieved using the quenched fraction () and the environmental quenching efficiency ( or EQE; e.g., [6]),
which quantifies how many galaxies are quenched in an overdense environment, , that would not have been quenched in a low-density environment, . By accounting for the field, in principle removes mass quenching (though there is some evidence of excess mass quenching in overdense environments; [407]). This quantity has also been referred to in the literature as the “transition fraction” (e.g., [67]), the “conversion fraction” (e.g., [35,381]), and the “quenched fraction excess” (e.g., [388,408,409]). We use “environmental quenching efficiency” instead of “transition fraction” or “conversion fraction” as they imply a relationship between the galaxy populations being compared (i.e., that the control or “field” sample will become the cluster sample) that may not be accurate, as we will discuss in this section.
4.2.1. The Multi-Dimensional Dependencies of Quenching at
Quenched galaxies are well known to dominate cluster populations in the local Universe. As discussed in Section 4.1, separation of the cluster SFG and QG populations using UVJ colors revealed that the total cluster SMF is dominated by quenched galaxies over a wide range in mass up to [397] and likely even up to . To demonstrate this, Balogh et al. [35] examined the fraction of QGs and EQE in 10 GCLASS massive clusters at relative to coeval low-mass clusters/groups and the field as well as SDSS clusters at (Figure 6, left). The SFR-density relation is clearly in place to , with the log GCLASS clusters showing similar quenched fractions as local clusters for log . The comparison to log 13–14.5 GEEC2 low-mass clusters/groups [410] and the Ultravista [387] field further illustrates the halo mass dependence of environmental quenching (see also [401,411]), with low-mass clusters/groups showing less deviation from the field.
In addition to halo mass, EQE decreases with increasing cluster-centric radius [397,407], a result that builds on earlier studies of the radial dependence of optically blue and red galaxy fractions in clusters (e.g., [412,413]). These dependencies join the possible stellar mass dependence discussed previously in the context of SMFs (Section 4.1), though we note again that some works report a mass-dependence at [35,388,400] while others report none [69,397,414], which may be a function of stellar mass survey limits. Further complicating our view of quenching is the still-open question of the inter-dependency of mass- and environmental-quenching.
There is therefore a pressing need for studies which probe these multi-dimensional dependencies simultaneously over a range in redshift. Pintos-Castro et al. [407] recently capitalized on new Hyper Suprime Cam imaging of 209 NIR-selected SpARCS clusters at to compile a large sample of galaxies that could be binned by redshift, stellar mass, and cluster-centric radius simultaneously. Using UVJ, they calculated the star-forming fraction () as well as as in Equation (1). As expected given environmental quenching, is found to decrease from into the cluster cores. In addition, they define the mass quenching efficiency as , where is the stellar mass at which most galaxies are still forming stars at a given radius (in practice this is driven by their stellar mass completeness limit). Using to define the stellar mass at which quenching “starts” () and “ends” () in the cluster cores (), outskirts (), and field (), they observe accelerated quenching in that both and occur at lower stellar masses (by 0.3–0.4) in the cores relative to the outskirts/field, a difference which increases from (accelerated downsizing). In other words, is more efficient in the cluster cores and thus not independent of environment.
Likewise, they find that (Equation (1)) depends on stellar mass. Figure 6 (right) shows a compilation of measurements in massive clusters across . Broken into multiple stellar mass bins, environmental quenching in the Pintos-Castro et al. [407] sample displays a strong dependence on both stellar mass and redshift: for low-mass galaxies, EQE starts as relatively negligible at () but rises by a factor of by . EQE in higher mass galaxies starts at a higher base, but shows a similar rise over Gyr. At , the GOGREEN clusters (stars in Figure 6, right; [388]) have a comparable to the SpARCS sample in matched stellar mass bins, with a higher reported for their higher mass galaxies, demonstrating a stellar mass dependence in EQE. At redshift , on the other hand, van der Burg et al. [397] measured for Planck-selected clusters using similar radial and stellar mass bins as Pintos-Castro et al. [407]. This high quenching efficiency was observed to have no stellar mass dependence. A possible explanation for this difference is the halo masses of the samples. The SpARCS sample covers a range in halo mass with an average log based on richness measurements (I. Pintos-Castro, private communication), comparable to the GOGREEN clusters. The Planck-selected sample has a higher typical halo mass of log . Furthermore, low-mass cluster/group studies find lower, stellar-mass dependent EQEs than either cluster survey [401,411]. Could different quenching mechanisms be dominating in the most massive halos? This comparison underscores the need for analysis that controls for halo mass as well as stellar mass, cluster-centric radius, and redshift, as quenching processes likely depend on all four parameters.
4.2.2. The Role of Pre-Processing to High Redshift
To date, the results we have discussed have focused on the quenched fraction and EQE within to . In the local Universe, however, quenching and morphological transformations have been observed well beyond the cluster virial radius (3–5; [5,14,408,418,419,420,421,422,423]), which requires environmental effects to start the quenching processes during infall. This is generally termed pre-processing (e.g., [14,424,425,426,427,428,429,430,431]), where quenching begins in the lower-density group environment23 [400,434]. For context, 20–40% of local clusters’ stellar mass is expected to accrete in the form of groups [429]. Outside the local Universe, a non-zero EQE has been observed beyond the virial radius in clusters at 0.5–1, converging on a value as high as in very high-mass clusters [388,397]. Pintos-Castro et al. [407] found that was flat from for all stellar masses up to (see also [421]), suggesting that if pre-processing is occurring, it starts at very large radii.
Recently, a study by Werner et al. [69] demonstrated that the choice of the “field” in global environment studies can obfuscate environmental signatures. Using GOGREEN and GCLASS clusters at , they compared the quenched fraction and in the cluster (), infall regions (), and field (outside the cluster and infall regions). They note that the backsplash24 population is expected to be small at these redshifts (e.g., [436]). They found that the infall region contains a higher fraction of massive QGs and twice as many satellites per central galaxy at fixed stellar mass compared to the field region, indicating it is populated by more massive halos. Comparing the cluster and infall regions suggests that nearly all log and half of all log galaxies are quenched prior to crossing by . Similarly, local environment studies find high quenched fractions in group-scale overdensities, supporting groups as the dominant site for quenching [381,400,429]. Werner et al. [69] calculated the EQE separately using the field plus infall regions (probing pre-processing) and the infall plus cluster regions (probing cluster quenching), finding that the former is strongly mass-dependent, while the latter shows only a weak stellar mass dependence. This suggests different processes dominating in the group vs. cluster environments and that the “field" control samples chosen impact the measured EQE. This has yet to be reconciled with the studies discussed in the previous section.
Can all pre-processing be attributed to group processes? A major hindrance to current discussions of pre-processing is understanding the range of influence of the primary halo relative to the effects of the local (group) environment. An open question is where to place the boundary of a cluster; this is commonly assumed to be the virial radius for convenience but recent works suggest a more physically motivated “edge” in the splashback radius [435,437,438,439], based on the fall-off of the matter density profile. Furthermore, the influence of the ICM may reach even further as suggested by recent simulations (e.g., [440,441,442]) which show gas stripping at large radii, likely associated with virial accretion shocks [443,444]. This adds to the multi-dimensional quenching dependencies (stellar mass, halo mass, cluster-centric radius, redshift) outlined in the previous section, indicating simultaneous measures of both the global and local environment may be necessary to disentangle the quenching processing arising from cluster and group environments. Quenching in the group environment and this evidence of extended cluster influence will be discussed in more detail in Section 8.3.1.
4.2.3. Strongly Evolving Quenching Efficiency at High Redshift?
Moving further into the epoch of z = 1–2, the picture of quenching in individual clusters becomes one of large variation from system to system over a relatively small set of observations. There are several examples of clusters with substantial quenched populations at 1.5–2 [415,445,446,447,448,449,450,451], which contrasts with increasing evidence for significant star formation activity in cluster cores during this epoch (see Section 5). Lee-Brown et al. [415] analysed IRC 0218, a low-mass cluster at , in comparison to a similarly low-mass cluster at [451], and a high-mass X-ray cluster JKCS 041 at [450]. With large uncertainties, all three clusters show a stellar mass-dependent quenched fraction (Figure 6; left), with nearly all high-mass galaxies (log ) quenched. The quenched fraction drops to the field level by log . Comparing with clusters at from Balogh et al. [35], Lee-Brown et al. [415] concluded there is at most a modest evolution in environmental quenching efficiency (at the low-mass end) from indicated by these three systems.
Conversely, statistical evidence has pointed to a strong evolution. Construction of the IRAC m and m luminosity functions (LFs) of ISCS cluster galaxies over found a strong deviation from the characteristic luminosity predicted from passive evolution models at [452,453], indicating an era of substantial stellar mass growth above this redshift. Nantais et al. [416] later found a strong rise in the EQE from using 14 confirmed SpARCS clusters. For cluster galaxies with log , the average in three clusters was consistent with zero (though with large variation between the clusters). The environmental quenching efficiency then rises abruptly (Figure 6, right) and the quenched fraction increases from 42% at (consistent with the field) to 80% by (see also [388,396,401], for elevated environmental quenching at ), an evolution requiring rapid quenching over <1 Gyr. These results suggest that some massive clusters may undergo a significant transition between , where environment-specific quenching mechanisms “turn on” and then efficiently produce substantial quenched populations by . What drives this transition is not yet known, though the variation from cluster-to-cluster appears to be intrinsic rather than a selection effect. This is demonstrated in Figure 6 (right, open squares) through a sample of 5 SPT clusters at relatively fixed halo mass (log ) at , where significant variation is observed in the environmental quenching of a specific population: high-mass (log ) galaxies in the cluster cores (; [417]).
The strong redshift evolution in in the Nantais et al. [416] sample is reminiscent of the redshift evolution seen earlier in the Pintos-Castro et al. [407] clusters (and seen in cluster SFGs, see Section 5.2.2), with a significant shift in the epoch in which quenching ramps up. Massive halos are more likely to complete their collapse and virialization during the epoch of 1.5–2 [21,454] and it is not unreasonable to assume the ramp up of efficient quenching starts earlier in more massive halos. Although both drawn from the SpARCS survey, the higher redshift Nantais et al. [416] clusters are likely already of similar mass as the lower redshift Pintos-Castro et al. [407] sample on average, consistent with this hypothesis. A more direct demonstration was presented in Reeves et al. [401], which found a strong dependence of EQE on halo (and stellar) mass by comparing X-ray and spectroscopically-selected low mass clusters/groups to GOGREEN clusters at fixed redshift (). This again stresses the need to control for halo mass in these analyses.
4.3. Summary
In summary, NIR studies of SMFs, quenched fractions, and environmental quenching efficiencies in clusters and high-density environments confirm an excess in quenched populations attributed to environmentally-driven processes. The picture of quenching is complex, however, and different processes may mix or dominate in different epochs, as well as depend on halo and stellar mass. Stellar mass dependence in particular can constrain specific quenching mechanisms (see Section 8) and stellar mass-dependent quenching is strongly supported by the low-mass slope of cluster SMFs and EQE analysis in large studies where environment and stellar mass can be treated simultaneously. This is not universally observed, however, and can be complicated by our still developing understanding of the role of pre-processing. In terms of redshift, quenched fractions among massive galaxies remain comparable to the local Universe up to , though an evolving EQE is observed over large redshift baselines, increasing by a factor of over . Above , a large variation is seen in the quenched populations in (small numbers of) massive clusters, with again evidence for an evolving EQE where a large redshift range is probed. A field-like quenched fraction and EQE consistent with zero in clusters at suggests a transition epoch, wherein a rapid ramp up in environmental quenching processes occurs in massive halos completing their initial collapse during this epoch.
As a final note, rest-frame UVJ colors have been invaluable (and relatively inexpensive method) for separating the star-forming and quenched populations in overdense environments. However, this separation is not without contamination and results can be sensitive to the exact UVJ boundaries chosen [407]. UVJ also does not provide a robust proxy for (specific)-SFR without additional (in)direct tracers at UV and/or IR wavelengths [124]. In the next section, we examine (obscured) star formation directly from the M/FIR regime.
5. The Mid- to Far-Infrared: Dust-Obscured Star Formation and AGN
As stated in the introduction, it has long been established that the morphology-density relation observed in local clusters [1] is accompanied by a SFR-density relation [4], whereby cluster populations have a significantly lower SFG fraction than populations in lower density environments. Subsequently, this relation was found to evolve over time, with the optically blue cluster SFG fractions increasing with redshift (the Butcher-Oemler Effect; [32]). This evolution was later observed in IR-selected populations as well, including a rise in the (U)LIRG fraction [138,170,378,419,421,455,456,457,458,459,460,461,462,463,464,465,466], mirroring the steep rise in SF in the field to (e.g., [142], Zavala & Casey, in prep.), though with a lower normalization. The nature of this evolution provides a vital complement to the studies focused on quenched populations discussed in Section 4.
In this section, we break the discussion of M/FIR observations of (proto-)cluster galaxies into a few topics. In Section 5.1 and Section 5.2, we examine galaxy clusters at and , respectively, in terms of the observed (obscured) star-forming fraction () and cluster galaxy SFRs and specific-SFRs (SSFR ) as a function of cluster-centric radius (out to the infall regions well beyond ) and normalized by halo mass. In general, these sections will be cast in a framework of looking for evidence of slow (few to several Gyr) versus rapid (<100–500 Myr) environmental quenching. The former will produce a signature of suppressed SSFRs, distinguishing cluster SFGs from the field MS, while the latter will manifest itself primarily in . Environmental quenching mechanisms and their timescales were introduced in Section 1.1. Additionally, our discussion of clusters will consider whether the SFR-density relation is weakened or even reversed during this epoch.
In Section 5.3, we explore the current M/FIR observations of proto-cluster galaxies at , outlining the challenges in working with limited data and resolution over the large areas and volumes typical of proto-clusters (>10–30, ∼10– cMpc; [21,70,248]). From these observations, vigorous total SFRs have been measured and we place them in context of halo mass (observed and at ) and the cosmic SFRD, with the caveats of large uncertainties. We then discuss DSFG-rich proto-clusters in the context of the full proto-cluster population, relative to our understanding of gas availability at high redshift and emerging evidence for early quenching populations. Finally, Section 5.4 presents a brief overview of AGN in (proto-)clusters and the importance of identifying obscured AGN using current and future MIR capabilities. M/FIR emission due to intracluster dust is saved for Section 7.1.
5.1. Low Redshift (): Evidence for Multiple Quenching Mechanisms Operating in Clusters
5.1.1. The IR Butcher-Oemler Effect
We start by looking at SFG populations in clusters at low to intermediate redshift for evidence of environmental processes. A natural first question is whether the IR Butcher-Oemler Effect is driven by the evolution in the (obscured) star formation of the infalling field population, which strongly decreases over . Webb et al. [467] explored this issue using Spitzer/MIPS25 24 m imaging to study the IR population in 42 massive (log = 14–15) red-sequence selected clusters [156,157] at . Using statistical background subtraction—which avoids selection bias due to requiring an optical counterpart to identify cluster membership—they quantified the redshift evolution of the halo mass-normalized total SFR () in cluster galaxies, fitting a redshift evolution (Figure 7). Given the uncertainties, this is consistent with the evolution of field galaxies (; e.g., [469,470,471,472]). A similar analysis and conclusion was reached in Haines et al. [465], studying the star-forming fraction in the lower redshift () LoCuSS26 cluster sample using background subtraction. The same was again concluded by Popesso et al. [474], who used group [475] and cluster (e.g., [138,466,476,477]) IR LFs to integrate to low luminosities (log ).
An evolution in that is the same between clusters and the field, however, is inconsistent with the non-zero environmental quenching efficiency discussed in Section 4. Follow-up studies of the LoCuSS clusters using spectroscopy (identifying cluster members via optical emission lines) found a steeper evolution in the (obscured) star-forming fraction (; see also [336,456,463,481,482]), which they attributed to more accurate sampling of the cluster population over their previous study using background subtraction [421]. After controlling for the field, a residual evolution on order (1 + z) remained up to , indicating sub-dominant but significant environmental quenching. Similarly, a residual evolution in the average cluster galaxy SFR on order (1 + z) was found in Alberts et al. [197] over . Figure 7 presents a compilation of these studies compared with example redshift evolutions and a shallower relation proposed by Popesso et al. [483]. The latter better captures the uniquely steep evolution at low redshift observed by Haines et al. [421], which provides the strongest evidence for a deviation from the evolution of the field (infalling) population up to .
In addition to studying the evolution with redshift, Webb et al. [467] examined the dependence of the mass-normalized total SFR on halo mass, finding (see also [474]). In Figure 7, we scale the relation (dark teal dot-dash line) by this mass dependency to low-mass clusters (log ; light teal dot-dash line), assuming the original Webb et al. [467] sample has an average mass of log (as do [466,474], on average). The result is roughly consistent with the low-mass cluster samples presented in Popesso et al. [474] (thin diamonds) and stacked in Alberts et al. [197] (white squares), confirming qualitatively a halo mass dependence. As in the measurement of quenched populations (Section 4), halo mass should therefore not be ignored in examining the total SFR budget in clusters.
5.1.2. The Global (Radial) Dependence of the Obscured SFR
In further support of environmental-specific quenching mechanisms are two observational characteristics of cluster SFG populations at . First, the overall fraction of IR luminous galaxies is a strong function of cluster-centric radius and suppressed below the field fraction out to large radii (3–5; [138,419,420,421,466,484]). Second, systematic suppression of SSFRs at fixed mass and redshift in massive (log ) star-forming cluster galaxies is observed at the level of ∼0.2–0.3 dex up to [137,197,421,466,484,485]. In the LoCuSS sample, these suppressed SFGs are kinematically separate, intermediate in phase space27 between quenched cluster members in the cores and those forming stars at unsuppressed rates in the outskirts (Figure 8, left; [421]). Such separation could point to a slow quenching mechanism such as starvation, the gradual stripping of the diffuse hot halo and cessation of new gas accretion on entering the cluster ICM [81,491]. Conversely, a strong radial gradient in in the same sample is best reproduced with a delayed quenching model28 with a high quenching efficiency, in which SF was able to continue for 0.3–2 Gyr on crossing before quenching (Figure 8, right; [421]). Given that both suppressed SFRs and a strongly spatially evolving are seen, both slow and rapid quenching might be operating simultaneously. Out to large radii (), a persistent 20% deficit in (see also [407], discussed in Section 4.2) requires pre-processing, likely in the group environment (Figure 8, right; see [434] for a LoCuSS group study). As such, the Haines et al. [421] analyses indicate environmental quenching is occurring via multiple processes in the LoCuSS clusters.
At higher redshift, a MIPS-selected population in SpARCS J161314+564930 (; [484]) was observed to have a bimodal nature, including both normal SFGs on the star-forming Main Sequence as well as sub-Main Sequence SFGs with optical spectra more consistent with passive galaxies (see also [420]). When placed on a phase space diagram, the sub-MS SFGs occupy the same region as a virialized or backsplash population. Compared to recently-accreted SFGs, their SSFGs are suppressed by ∼0.9 dex, echoing the kinematic separation by SSFR found by Haines et al. [421]. While these suppressed SFRs again point to slow quenching, a strong radial dependence in the MIPS-detected fraction suggests rapid quenching is also occurring. The combination of slow and rapid quenching is further supported over a long redshift baseline () in local environment studies with ORELSE [493] and in the ISCS cluster sample ([197], see also [485]). Stacked mass-limited ISCS cluster catalogs (containing both SFGs and quiescent galaxies) reveal a strong evolution relative to the field (Figure 7). However, by splitting off the optically blue population (an incomplete stand-in for the SFG population only), Alberts et al. [197] found suppressed SFRs with at most a weak trend relative to the field evolution with redshift. This indicates that the change in the mass-limited sample is driven by a swiftly changing , found by Alberts et al. [197] to be roughly consistent with RPS models [494] up to , occurring simultaneously with slower quenching that suppresses SFRs.
5.2. Intermediate Redshift ( 1–2): A Transition Epoch for Massive Clusters
Despite the strong evolution in SF activity seen relative to the field discussed in the previous section, the quenching efficiency remains high for massive galaxies in massive clusters to (Section 4) and the local SFR-density relation appears to be in place [34,35,467,484]. Early optical and NIR analysis of cluster populations predicted that cluster galaxies formed at high redshift in short bursts, quenched, and evolved passively since [169,170,495,496,497,498,499,500,501]. Infrared studies moving to , however, quickly provided evidence of a deviation from passive evolution in the NIR LFs (see Section 4) and significant SF activity, weakening (or even reversing) the SFR-density relation, in both local environment studies [115,502] and down into cluster cores (e.g., [139,140,192,464,503,504,505,506,507,508,509,510,511,512]). However, evolved massive clusters with quenched cores have also been identified at these high redshifts (e.g., [346,415,445,447,448,449,450,451]).
5.2.1. Is There a(n Infrared) Reversal in the SFR-Density Relation?
A true reversal in the SFR-density relation at high redshift would signal that environmental processes are capable of driving an excess of star formation in addition to quenching it—a distinct scenario from the disappearance of the SFR-density relation due to the ramping down of environmental quenching as seen in Section 4. An enhancement of SF in massive structures is consistent with hierarchical growth [513] and galaxy interactions and/or RPS could drive instabilities that trigger nuclear starbursts ([20] and references therein). Early evidence for a reversal was presented in local environment studies [115,502] and for massive (log ) clusters XMMXCS J2215.9-1738 (; [504]) and ClG J0218.3-0510 (; Tran et al. [464], but see Tran et al. [514]) based on an increase in the fraction of DSFGs with increasing local density, into the cluster cores. Conversely, XMMU J2235.2-2557 at [448], a more massive cluster, was found to show no reversal.
The difficulty in establishing a change in the SFR-density relation is illustrated nicely by ClG J0218.3-0510 [464,515,516]. Quadri et al. [446] examined this cluster using a mass-limited (log ) catalog and defining the environment using the nearest neighbors technique. Quiescent galaxies were separated from SFGs using color-selection plus MIPS 24 m imaging and, from this, the quenched fraction and EQE (see Section 4) were both found to be in excess over the field, albeit with large uncertainty, signaling the SFR-density relation is still in place (see also [415], using UVJ selection). By way of contrast, Santos et al. [139] examined the same cluster as a function of cluster-centric radius out to large radii ( Mpc) in optical to FIR imaging, with membership based on spec-zs and photo-zs. Quiescent cluster galaxies were identified using a cut on SSFR, from spectral energy distribution (SED) fitting, with a field sample drawn from the same data. From this, they found that the was statistically identical between the cluster (Mpc) and field, with an excess of SFGs in the infall region (1–3 Mpc). This excess may be due to an overabundance of high-mass SFGs in the infall region [69], while the lack of excess within 1 Mpc (or a potential deficit in the core, see [482]) may be consistent with the positive quenching efficiency noted by Quadri et al. [446]. However, the lack of environmental dependence of the SFG SMF (Section 4.1) and the field-like in the cluster, drawn from the same data, suggests the SFR-density relation is no longer in place [139]. These studies, mass-limited versus luminosity-limited, with different definitions of environment and different field comparison samples, demonstrate the challenges in interpreting the data.
Like Santos et al. [139], Ma et al. [140] and Santos et al. [511] interpreted a high halo mass-normalized SFR in XMMXCS J2215.9-1738 () and XDCP J0044.0-2033 () as evidence for a reversal in the SF-density relation (Figure 7). Smith et al. [517] examined a low-mass cluster with an emerging Red Sequence at [518] using SCUBA-2, ALMA, and JVLA imaging. They found the SFR per unit area in the cluster core to be orders of magnitude greater than the field; together with a high mass-normalized SFR, they reported a reversal. However, the increase in SFR density paralleled the increase in galaxy density, so this effect can likely be explained without environmental enhancement of star formation. This was also demonstrated for ClG J0218.3-0510 in Tran et al. [514]; using H SFRs, they found that the SFR per galaxy still decreased slightly into the cluster cores, ruling out a reversal. Taken together, though individual cluster studies prove that vigorous star formation is starting to be evident in some 1–2 massive clusters, perhaps weakening the SFR-density relation, differences in cluster selection and cluster membership identification, constraints on SF, and intrinsic variations make it difficult to establish or refute a true reversal.
5.2.2. The Transition to Efficient (Rapid) Quenching at in Clusters
Both targeted and survey imaging with Spitzer/MIPS, Herschel/PACS29 and SPIRE, and SCUBA-2 have been used to move beyond single cluster M/FIR studies in a limited number of cluster samples at 1–2. Noble et al. [520] obtained deep PACS imaging of 3 SpARCS/GCLASS clusters at , using optical spectroscopy to place IR luminous cluster galaxies in phase space and look at trends in SFR. A significant drop in the SFR, SSFR, and of the (optically-confirmed) IR population was found in the intermediate (between infalling and core) and cluster core regions of phase space. This is consistent with the environmental signatures observed in optical studies of the full GCLASS samples (10 clusters at 0.85–1.2) in Muzzin et al. [34].
Very few cluster samples with FIR covering a longer redshift baseline are available. Extensive M/FIR imaging in the Boötes field was used to examine the ∼300 ISCS/IDCS cluster candidates over 0.3–2 [169,187], including Herschel/SPIRE from HerMES over nearly the full survey and follow-up deep Spitzer/MIPS and Herschel/PACS for a confirmed subset at 1–2 (see Section 3.1 for further details on the ISCS/IDCS). Analyzing 16 spectroscopically-confirmed massive (log ) ISCS clusters at 1–1.5 with MIPS 24 m imaging, Brodwin et al. [175] measured the field-relative and SSFR of log cluster galaxies as a function of cluster-centric radius, using their largest radial bin ( Mpc) as a proxy for the field (see also [521]). Figure 9 (panel a) shows a rapid evolution over the redshift range probed (∼1.5 Gyr), with the lower redshift end showing the expected decrease in with decreasing radius. At , however, the ISCS clusters reveal an increase in the MIPS-derived and a flattening of the field-relative SSFR (panel b). Supporting this, Alberts et al. [197] stacked on mass-limited (log ) cluster member catalogs from 274 ISCS clusters from 0.3–1.5 using shallow Herschel/SPIRE imaging, finding that the stacked (average) 250 m luminosity in their highest redshift bin draws even with and may even be in excess over the stacked (average) 250 m luminosity of coeval field galaxies.
Subsequent studies of the ISCS/IDCS clusters paint a similar picture. Looking at visually-classified early-type galaxies, Wagner et al. [522] observed significant residual star formation at , which declined by . Using deep Herschel/PACS imaging of 11 ISCS/IDCS clusters over , Alberts et al. [523] established that this transition holds at the bright end. Figure 9 (panels a–c) shows again that the and average SSFR of PACS-detected cluster (U)LIRGs are independent of environment at , though the uncertainties and use of projected radii could hide a weak trend. Stacking on mass-limited cluster member catalogs on PACS images confirms no radial dependence at (panel d). The average SFR is likewise independent of environment at all redshifts probed, giving no indication that slow quenching has had time to act (panel c). Accounting for the IR luminous population (log ) only, the halo mass-normalized total SF draws even with the field at these redshifts (Figure 7), though with significant cluster-to-cluster variation even at fixed halo mass [175,523] that spans the range of suggested redshift trends . An analysis of SCUBA-2 850 m sources in 8 X-ray selected clusters at higher mass (log ) likewise shows large scatter at the same epoch [524]. Weak excesses in the SFR at high redshift () or in galaxies (Figure 9, panel b) in the ISCS/IDCS cluster cores may support a reversal; however, this sample is not large enough to split by redshift and stellar mass simultaneously.
An important consideration in redshift evolution studies is whether one is working with progenitor samples, at fixed halo mass, or with no halo mass accounting. The ISCS/IDCS studies just discussed are at roughly fixed halo mass; the full ISCS catalog has roughly log over while the targeted ISCS/IDCS clusters at are more massive at log 14.3–14.7. The wide redshift baseline studies of both the full catalog and targeted clusters reveal that the ISCS clusters are undergoing a transition at roughly at approximately fixed halo mass, above which quenching is inefficient and a true SFR-density reversal is possible, suggesting the quenching ramp up is not solely a function of halo collapse or growth. On the other hand, a comparison of the halo mass-normalized SFR budget (Figure 7) demonstrates a dependence of the bulk star formation properties on halo mass. As we have seen that is inversely correlated with halo mass (Figure 7; see [467]), we can speculate that this transition will be earlier (later) for higher (lower) mass halos. The redshift bins in the ISCS targeted and full catalog studies, however, prevent a direct comparison and this type of analysis has not been done in any progenitor samples. A transition scenario, however, mirrors NIR studies of environmental quenching efficiency, which see a drop at ([416], see Section 4).
So has a true reversal in the SFR-density relation been observed? Both NIR and M/FIR studies have found that the local SFR-density relation is significantly weakened, or even negligible, at 1.4–1.6 in samples of massive clusters, though with significant scatter likely including an order of magnitude intrinsic variation in the total SF at relatively fixed cluster properties (selection, halo mass, epoch; Figure 7). Evidence for an excess of (obscured) SF in the cluster environment is more tenuous, owing to small samples and large uncertainties that preclude, i.e., the ability to separately account for stellar mass and environment over the relevant redshift range. Compelling evidence for a reversal has been recently provided, however, by both local environment studies and simulations. Lemaux et al. [525] examined the SFR-density relation over 2–5 in spectroscopic samples divided by local density from the VIMOS Ultra Deep Survey (VUDS; [526]). Probing up to proto-cluster core densities (including the area containing the Hyperion supercluster; [527]), they found a significant trend of increasing SFR (derived from UV-NIR SED) with increasing local density at , driven mostly by an excess of log galaxies in overdense regions. The trend was still significantly detected, however, when stellar mass differences across density bins were accounted for, signaling a true SFR-density reversal (but see [528], for a conflicting result using an overlapping dataset). While a flattening, not a reversal, was observed at 2–3, the VUDS spectroscopic sample lacks DSFGs, which dominate the total star formation during this epoch, and so the onset of this reversal remains an open question. On the simulation front, Hwang et al. [529] used the IllustrisTNG [372] cosmological hydrodynamic simulation to study the SFR-density relation over from the cluster (log at ) to the field environment (see also [21,530]). A true reversal was observed in all intermediate- to high-density bins, with excess star formation in intermediate-density (group) environments at and in clusters from (see also [531]). This simulated reversal holds at fixed stellar mass, indicating it is environment driven. Conversely, the (simulated) molecular gas mass always decreases with increasing local density, suggesting that mechanisms that accelerate the consumption of gas may drive the steep evolution in the star formation in clusters.
5.2.3. Summary
To summarize these two sections on galaxy clusters, obscured SFGs in galaxy clusters at provide evidence for a mix of slow and rapid environmental quenching in the suppression of their (S)SFRs and . These effects depend on cluster-centric radius (or location in phase space) and halo mass, but in general widespread quenching of the cluster SFG population persists to . In the era, however, the SFR-density relation is observed to weaken in some cluster samples, though quenched clusters are also observed throughout this epoch, signaling a large intrinsic cluster-to-cluster variation (often compounded by non-intrinsic variation caused by inhomogeneous datasets and techniques). At these redshifts, evolutionary trends of the total SFR normalized by halo mass with redshift start to diverge and there are indications of an accelerated evolution compared to the field (Figure 7); however, limited cluster samples with IR data that cover a range in redshift limit our ability to robustly pin down the redshift evolution for the dusty populations that make up the bulk of the total SFR. Evidence for a true reversal of the SFR-density relation is likewise tenuous at best, though it is supported by simulations. Nevertheless, in good agreement with NIR studies that see a drop in the EQE at (Section 4), M/FIR studies of cluster samples over a similar redshift range find field-like star formation activity at this epoch, necessitating rapid quenching of their populations by . This indicates that the dominant quenching mechanism(s) likely evolve over cosmic time (see Section 8).
5.3. High Redshift (): The Realm of Proto-Clusters
Now we move into the realm of infrared studies of proto-clusters. In Section 3.3, we discussed the evidence for luminous DSFGs (often synonymous with SMGs) as signposts of early massive halos, potentially proto-clusters in the phase of vigorous star formation that builds up massive cluster ellipticals (e.g., [532]). Significant DSFG overdensities have been identified in over 20 individual proto-clusters (confirmed and candidates) from 2–7 (Table 3) and wide, shallow submm surveys are a promising source of new proto-cluster candidates. In this section, we examine the nature of (obscured) star formation in proto-clusters (see Overzier [33] for a general proto-cluster review).
5.3.1. The Nature of (Obscured) Star Formation in Proto-clusters
Proto-clusters subtend large areas on the sky (>; [21,70,248,278]) and correspondingly fill large cosmic volumes (10 cMpc), theoretically existing at the nodes of filaments. Recent semi-analytic modeling from Chiang et al. [21] provides a rough framework for how star formation may proceed in these early environments: at , proto-clusters experience inside-out growth, establishing a core as the primary halo(s) reach by , the halo mass at which star formation efficiency (SFE) peaks (see Wechsler and Tinker [533] for a review). This is followed by a period of more spatially extended star formation over the full proto-cluster volume, as secondary halos grow to peak SFE. High SFRs are enabled in this environment (∼1000 yr), building ∼65% of the stellar mass in massive clusters [21]. The epoch of then sees the final transition to collapsed clusters and widespread quenching, roughly consistent with the observational literature presented in previous sections.
Testing this framework has made slow progress due to the large areas and high redshifts involved. For DSFGs, wide-field surveys with single-dish submm telescopes and/or Herschel have paved the way for targeted follow-up with ALMA and spectroscopic campaigns. FIR or submm spectroscopy is often necessary to confirm the most dusty sources (e.g., [534,535]). Early work associated single or a few extreme DSFGs with galaxy overdensities at 4–5 such as GN20 [534,536,537]; HDF850.1 [535]; AzTEC-3 [538]; and CRLE [539]. Subsequently, DSFGs have been both associated with known proto-clusters and used directly in proto-cluster identification when detected in large numbers (>5) over an appropriate area (Section 3.3). As an example of the former, a correlation between Lyman- Emitters (LAEs) and red SMGs has tentatively been detected in an LAE overdensity at [312]. Furthermore, for the latter, spectroscopic follow-up of SPT-2349-56 confirmed 14 DSFGs at using [CII] and CO emission lines, with a combined SFR of 6000 yr [262]. Ten of these DSFGs occupy a region with a 19 (130 kpc) diameter, signaling a core in the process of rapid assembly, which will likely collapse to form the BCG. Single-dish submm and wider ALMA observations suggest a surrounding extended structure [313], consistent with our nominal theoretical framework.
Teasing out the detailed nature of these DSFG overdensities requires high-resolution follow-up. Figure 10 illustrates the power of ALMA in characterizing these proto-cluster cores as well as the difficulties in characterizing the full structure. The Distant Red Core (DRC; [324,325,328]) was targeted as the brightest source (A/B) in an overdensity of LABOCA 870 m sources. Moving from 27 to ∼ resolution reveals the extended LABOCA emission to be comprised of 11 blended DSFGs, 10 of which form a proto-cluster core at (see also SSA22; [341]). Occupying an area of 260 kpc × 310 kpc, these DSFG have a combined 6500 yr, with the majority of this provided by just three members. Furthermore, imaging at resolution reveals that even these galaxies may be blends; DR-1 is comprised of three clumps with extreme SFR densities of ∼800–2000 yr kpc. Expanded follow-up of the full structure could recover up to 14,400 yr if all LABOCA sources are associated with the proto-cluster. Interestingly, MUSE30 observations of the central 1× 1 area found an associated Lyman blob but no LAEs; it is unclear if this is due to, i.e., suppression of Ly in proto-cluster cores [541] or a dearth of unobscured SFGs. As an example with wider coverage, the core of SSA22 () hosts an overdensity of DSFGs, at the node of 30 Mpc-scale filaments traced by LAEs in narrow band imaging (e.g., [310,542]). Again, this appears consistent with our theoretical framework, but these studies also serve to emphasize that the available current rich datasets still give an incomplete view.
Large surveys over areas of the expected size of proto-clusters (∼10) have been conducted in a few fields with good spectroscopic coverage. This has yielded proto-clusters with total SFRs of ∼1500–6500 yr at 2–4, with ∼ 4–14 spectroscopically-confirmed DSFGs per structure (Table 3; e.g., [277,278,326,328,330]). Importantly, these total SFRs are formally lower limits due to spectroscopic incompleteness in lower luminosity SFGs. Individually, the DSFGs are forming stars at hundreds to thousands of solar masses per year. Despite this, DSFGs in proto-clusters largely lie on the field MS at [311,330,346] and [325], with few examples of true starbursts (4× above the MS).
Ideally, we would like to understand this activity in the context of a proto-cluster’s current structure and its evolution to ; however, this is a challenging task. As described in Long et al. [325], halo masses of proto-clusters are estimated using various methods based on summing the halos of individual members using halo abundance matching [544]. This includes a host of uncertainties; for example, understanding the bias of the population being observed, double counting halos due to overlap, and corrections for spatial and/or spectral incompleteness. Some attempts that have been made in the literature for dusty proto-clusters are listed in Table 3 and in Figure 7, we show the halo mass-normalized total SFRs in comparison with lower redshift clusters. The dusty proto-clusters largely favor the steepest trend in of (1 + z) (see discussion in Section 5.1 and Section 5.2); however, are these proto-clusters representative? Given a halo mass and redshift, the final halo mass of a proto-cluster can be estimated from simulations (albeit subject to the uncertainties outlined above as well as uncertainties from intrinsic scatter in proto-cluster properties and the simulation assumptions; e.g., [70,248,433,454,545]). Following Chiang et al. [70], most of the proto-clusters with infrared observations discussed here will evolve into Coma-like structures with log . It remains to be shown whether lower mass proto-clusters with DSFG overdensities are common and also favor a steep rise in the halo mass-normalized total SFR.
An alternative measure of star formation activity that has become common in the literature is to estimate the SFR density compared to that of the field. This has been done in an inhomogeneous way, however, with some studies adopting the survey area to estimate the proto-cluster volume (e.g., [278]) and others adopting a smaller effective area around the main DSFG overdensity (Table 3). We will refer to the latter as proto-cluster “cores”, given that the volumes estimated are much smaller than the predicted total volume [21,70] and likely only represent the primary halo. In Figure 11, we compile the SFRDs of the proto-clusters (shown as lower limits due to spec-z incompleteness) and proto-cluster “cores” listed in Table 3. The volumes used have been converted to comoving where necessary for a fair comparison to the field SFRD, which is dominated by halos that have not detached from the Hubble flow.
In addition to the observations, we include the theoretical SFRD predicted for a log halo from Chiang et al. [21] (dashed red line), perhaps representing more typical proto-clusters to our Coma progenitors. The dusty proto-cluster SFRDs largely sit above the coeval field relation in Figure 11 but being lower limits, we are prevented from a meaningful comparison with the simulated lower mass halo. The proto-cluster “cores” largely sit 1–2 orders of magnitude above the proto-clusters, though their specific relative positions are likely inaccurate due to inhomogeneous definitions of effective area and again spectroscopic incompleteness (or uncertain or no background subtraction when spec-zs are unavailable). High-density central halos appear to persist to [343]. Deriving a robust, comparable measure of proto-cluster volume and improving spectroscopic (or narrow band imaging) coverage would allow us to assess the star formation in these central halos relative to the extended proto-cluster structure. This would be a compelling tool in constraining the build-up of stellar mass in proto-clusters.
5.3.2. Placing Dusty Proto-Clusters in Context: A More Ubiquitous or Atypical Phase?
As discussed in the previous section, the DSFG-rich proto-clusters most well studied to date likely inhabit the most massive halos in their respective epochs, with projected masses at comparable to the Coma Supercluster. Placing these dusty proto-clusters into the broader context of all proto-clusters and ultimately structure growth is complicated by several factors. Primarily, we are limited by our ability to spectroscopically confirm the rising number of DSFG-rich proto-cluster candidates from shallow, wide field surveys (Section 3.3.2). Similarly, not all known proto-clusters have the infrared data necessary to identify or rule out a DSFG population.
Despite these limitations, we can consider what the nature of DSFGs themselves tells us about the prevalence of DSFG-rich proto-clusters. As alluded to in Section 3.3.1, the typical lifetimes of rare sources provide key constraints. In the field, DSFGs are thought to be a phase of short (10–150 Myr) bursty star formation, triggered by gas-rich mergers/interactions or disk instabilities, and regulated by the resulting feedback (e.g., [546,547]). However, steady gas infall may prolong this phase, sustaining high SFRs for almost a gigayear (e.g., [548]). As discussed earlier, DSFG-rich proto-clusters may be preferentially located at the nodes of massive filaments, which are predicted to contain ∼60% of all gas at [549]. An example of this might be the DSFG-rich proto-clusters PCL1002 (; [72,277,278,303,308,346]) and a secondary structure containing DSFGs at (CL J1001+022031; [71,72,301,309]), which are part of the proto-super cluster “Hyperion” [527], a structure containing seven high-density peaks connected by filaments. Recently, Umehata et al. [550] directly traced such filaments via Ly emission in the intergalactic medium of SSA22, finding that SMGs and AGN were coincident with the gas in both projected and velocity space (Figure 12). These filaments, which connect the DSFGs and AGN in SSA22 over large scales, may be capable of funneling gas into these active galaxies, prolonging their lifetimes. Direct evidence in support of such inflowing gas into massive halos was presented in Daddi et al. [551], which analyzed three Ly filaments leading into the center of mass of a DSFG-rich group at . Definitively identifying inflows is difficult, however (see the discussion in [551]). Likewise, filamentary structures have only been mapped in a few systems, and as such we can not yet rule out DSFGs outside these concentrated nodes or determine the importance of filaments in extending DSFG activity. See Section 6.2.4 for further discussion of submm observations of molecular gas in proto-cluster galaxies relative to filaments.
In favor of shorter lifetimes, molecular gas studies of proto-cluster DSFGs (see Section 6.2.4) point to short gas depletion timescales32 (≲200–500 Myr; [328,330,346], but see [337]) and therefore rapid quenching in the absence of new (cold) gas accretion and/or gas recycling (e.g., [76,552,553]). Sustained gas accretion (via filaments or otherwise) is at odds with models that project massive halos enter a shock-heated regime at [444], which throttles fresh gas accretion via starvation (but see the work by Daddi et al. [551] on gas inflows into massive halos discussed in the previous paragraph). Even at its high redshift, the mass of the DRC puts it in a “cold in hot” regime (see Figure 9 in [325], as well as Figure 19 in [330] for more examples) where cold gas streams established prior to virial shock heating would need to penetrate an otherwise hot halo ([444,554], and references therein). Consistent with this picture, [CI] and CO mapping of the molecular gas halo around the Spiderweb Galaxy (central to the Spiderweb proto-cluster) support growth via recycled gas rather than pristine gas inflows [306]. This would seem to favor DSFGs as a short-lived phase.
As discussed extensively in Casey [278], statistical arguments and predictions can be made for both possibilities. As mentioned in Section 3.3.1, they found the volume density of DSFG-rich proto-clusters to be consistent with the population of low-redshift, massive (>) clusters, albeit with large uncertainties. If accurate, and assuming a long lifetime due to cold gas accretion, they predict that most proto-clusters should be observed in a DSFG-rich phase33. Conversely, they estimated that 20–40% of proto-clusters should be observed in a DSFG-rich phase in a short lifetime scenario, assuming a 100 Myr lifetime and 4–8 bursts of 5–10 DSFGs to build the log cluster galaxies observed at [388]. An interesting question posed by Casey [278] is whether, in the scenario of observing >5 short-lived DSFG simultaneously, a common triggering mechanism is required. Hypothetically, star formation triggering on large scales could be facilitated by filaments [550] or by optimal conditions for mergers and interactions [341]; however, both the ability of these processes to trigger star formation (Section 8.3.2) and the nature of DSFGs in proto-clusters need further investigation.
Are DSFGs (observationally) ubiquitous in proto-clusters given our current datasets? Recently, McConachie et al. [297] identified two proto-clusters at as overdensities associated with UMGs (see Section 3.3.1) in a survey covering 0.84 deg. Using UVJ color selection to separate star-forming and quiescent galaxies, they established an elevated quenched fraction over the field for log galaxies (see also [320,528,555]), suggesting (in the absence of submm data) that these proto-clusters are being observed post- or in between bursts, given that the UMG was likely assembled in a dusty star-forming phase [298,299]. On the other hand, non-detections in ALMA established significant gas-poor, massive galaxy populations in two proto-clusters with DSFG overdensities (COSMOS and PCL1002, Table 3, [346]). Along with the vigorous dusty star formation, these proto-clusters have an EQE of ∼0.45 (Figure 6 [right]), comparable to clusters at lower redshift. Understanding the universality of the DSFG-rich phase in proto-clusters will require large, unbiased proto-cluster surveys combined with improved sensitivity, resolution, and wide-field capabilities in the submm (such as with LMT/TolTEC, see Section 9).
5.4. Obscured AGN in Clusters
Supermassive black holes are thought to be ubiquitous in massive galaxies, and in their actively accreting phase (termed Active Galactic Nuclei or AGN) may play a crucial role in the regulation of galaxy growth via feedback [59,556]. In overdense environments, AGN may influence both (proto-)cluster galaxy evolution and the halo ecosystem through injection of energy into the ICM [557]. Hyper-luminous, heavily obscured AGN may also serve as signposts for proto-clusters, as discussed in Section 3.3.1.
The current literature on AGN in (proto-)clusters has established a deficit of luminous AGN in local and low-redshift clusters relative to the field (i.e., [558,559,560]). The fraction of AGN in clusters rises rapidly with redshift, however, reaching field levels by 1–2 [523,561,562,563,564,565]. In fact, there is some evidence that AGN fractions may even be enhanced in high-redshift clusters [523,562] and in proto-clusters ([316,323,566,567,568], but see [569]). This suggests an important role for AGN in overdense environments, however, our current picture is hindered by both the current unclear nature of the relationship between AGN and galaxy growth [570,571] and our ability to account for all AGN in a given population.
AGN are notoriously difficult to survey in a complete manner; they can be identified by their emission in the X-ray through the radio, though no one single wavelength selection returns a full census of AGN (e.g., [572,573,574]). By far the most elusive AGN population is that of heavily dust-obscured and Compton-thick (CT) AGN. These AGN can be so deeply embedded in dust (columns of cm) that they can be missed even in the hard X-ray bands. Their emission, however, cannot help but escape in the mid-infrared. With current capabilities, the luminous end of this population has been identified using infrared colors via Spitzer (e.g., [575,576]) and WISE [577] or through SED fitting of the optical-infrared (e.g., [144,199,523,574,578,579]). These techniques have not captured the faint end of the population, however, and estimates based on local samples poorly constrain the percentage of heavily obscured AGN at 10–50% of the total AGN population (e.g., [580,581,582,583]). For a recent review of what we know about heavily obscured AGN, see Lyu and Rieke [60] in this special issue.
Few cluster studies have examined MIR AGN. Using WISE color selection, Mishra and Dai [584] confirmed a lower fraction of MIR AGN in clusters than in the field at low redshift, in good agreement with AGN studies in other wavelength regimes. The clustering of MIR AGN is likewise known to be weak relative to X-ray and radio AGN at low redshift (; [585]), but rises rapidly to , suggesting that MIR AGN are increasingly associated with high-z clusters [586,587]. The fraction of color-selected MIR AGN in the ISCS cluster sample was found to rise to field levels by 1–1.5 [561,564]. Alberts et al. [523] expanded this analysis using SED fitting to classify galaxies as AGN or host-dominated as a function of cluster-centric radius, finding at an excess of AGN-dominated galaxies in the cluster cores relative to the field drawn at . This suggests triggering of AGN in the cluster environment, possibly through increased merger activity. This connection has not been established however, as the relationship between AGN and mergers in the field is still unclear at high redshift (e.g., [95]), despite compelling evidence in the local Universe (e.g., [588,589,590,591,592]). It is important to note that mergers may be preferentially associated with the obscured AGN phase (e.g., [593,594,595,596]) and so our understanding in both the field and in clusters will likely undergo a dramatic shift with upcoming surveys by JWST, which can robustly identify obscured AGN to low luminosities (e.g., [144]).
6. The Far-Infrared to Submillimeter: Dust and Gas Measurements
While our previous sections have primarily focused on the consequences of environmental quenching—as observed through changes to the stellar populations and star formation rates at near-IR and mid-IR wavelengths—we now shift our focus to the underlying cause for these changes, namely the role of the cold molecular phase of gas in cluster galaxies. As discussed in Section 1.2, cold H cannot be observed directly and therefore CO rotational transitions and dust continuum emission, observed at FIR-to-submm wavelengths, are instead used as proxies. This important gas phase provides the direct fuel for star formation and is linked to the evolution of the cosmic SFRD (i.e., [142]), with the cosmic molecular gas density mirroring the shape of the SFRD, peaking at 1–3 and declining by almost an order of magnitude to the present day (e.g., [147,597,598]). This strongly suggests that molecular gas is fundamental to the process of quenching and therefore a key component in investigating the link between quenching and environment. However, whether the molecular gas in galaxies is affected by the cluster environment has long been debated.
In this section, we discuss the progress that has been made over the last 40 years on quantifying the (molecular) gas content in cluster galaxies. As context for these studies, we start by briefly reviewing the state of gas scaling relations in the field and the major techniques and uncertainties in molecular gas analysis. In Section 6.2, we cover gas measurements from low-z clusters to proto-clusters. We start from a historical perspective: early integrated CO studies in cluster galaxies suggested that the dense molecular gas phase was impenetrable to environmental effects. More recent work, however, using the revolutionary capabilities of ALMA, NOEMA, and the JVLA over a wider range of redshifts, cluster environments, and gas proxies has shown a broader spread of behaviors, from depleted to enhanced molecular gas contents. Finally, we end with a discussion of spatially-resolved gas studies, which have the potential to provide the greatest insight into quenching mechanisms. In low-redshift cluster galaxies, environmental effects on the molecular gas have become evident through perturbed and asymmetric gas features, but spatially-resolved molecular gas studies are still few and far between beyond the local Universe.
6.1. Gas Scaling Relations
The cold interstellar medium, as observed through dust and molecular gas, has emerged as a primary focus of galaxy evolution studies. Before we jump into environmental effects, however, we first briefly review efforts using field galaxies to quantify the global correlations between SFR and molecular gas content, both of which have been shown to be redshift- and mass-dependent (e.g., [76,599,600,601,602,603]). There has been considerable effort in trying to understand the origin and evolution of the star-forming MS, in particular through the “bathtub" equilibrium model (e.g., [75,604]), where gas content is regulated through inflows, outflows, and star formation. For example, the tightness of the MS can be attributed to variations in the molecular gas content and the SFE (or its inverse, the gas depletion timescale, /SFR). In other words, a galaxy’s SFR offset from the MS correlates with these quantities, with galaxies above the MS having shorter depletion timescales and higher molecular gas-to-stellar mass ratios [605,606].
At low redshift, the global scaling relations34 between star formation and the cold molecular gas content are primarily due to large-scale efforts to measure these properties over a wide dynamic range within a homogeneous, unbiased sample of galaxies. The IRAM 30-m telescope35 has been critical in this effort through mass-selected surveys such as the CO Legacy Database for GASS (COLD GASS; [611]) and its extension, xCOLD GASS, [606], with CO () observations of ∼500 galaxies down to in the local Universe (see also [78], for a tabulated list of field surveys using CO and dust continuum).
At higher redshifts (typically ), increased sensitivity and resolution are paramount, and therefore more distant surveys require the use of interferometers, such as PdBI, NOEMA, and ALMA. The Plateau de Bure High-z Blue Sequence Surveys (PHIBSS1 and 2; [612,613]) represent the largest pointed CO surveys in the distant Universe, consisting of ∼130 SFGs (SFR ) with CO () or CO () detections in three distinct redshift slices over . Averaging on-source integration times of 25 and 12 h, respectively, [78], PHIBSS1 and 2 targeted sources on or above the MS in order to ensure a high probability of a CO detection, and thus have a slight bias against sub-MS galaxies with potentially lower CO luminosities. Moreover, ALMA observations of the Rayleigh–Jeans dust continuum emission ( mm) exist for ∼600 galaxies in the COSMOS field, selected from m and Herschel priors, with a similar bias toward more massive and IR-bright SFGs [148]. Nevertheless, these surveys, along with a host of supplementary CO and dust continuum samples, have provided the best means to empirically extend the integrated molecular gas scaling relations to using hundreds of galaxies ([147,148,602,603], and references therein). This has yielded functional forms for both the molecular gas-to-stellar mass ratio and molecular gas depletion timescale in terms of the products of power laws with three separable variables: redshift, stellar mass, and offset from the MS. The outcome of these scaling relations has revealed that the depletion timescale and molecular gas-to-stellar mass ratio vary slowly and steeply with redshift, respectively, as well as strong dependencies for both with location on the star-forming MS plane [78,614]. Despite this progress, there remain gaps in our understanding due to observational limitations (e.g., sample incompleteness at low SFR and stellar mass) and uncertainties associated with the H proxies used to measure the gas mass. We discuss the latter briefly below.
6.1.1. Caveats for Molecular Gas Mass Measurements
The exploitation of CO transitions and dust continuum observations has paved the way for molecular gas studies, but not without several limitations and assumptions. The derivation of a total molecular gas mass from either the CO line luminosity or dust mass depends on various parameters, namely the CO excitation and the CO-to-H conversion factor () for the former, and the mass-weighted dust temperature (),36 the dust opacity, and the dust-to-gas ratio for the latter. A detailed discussion of the assumptions used to estimate these parameters can be found in Bolatto et al. [615], Carilli and Walter [146], Genzel et al. [602] and Scoville et al. [148]; here we summarize the main caveats and current outlook.
As briefly introduced in Section 1.2.3, carbon monoxide is the second most abundant molecule in the ISM, with a ratio of one CO molecule to every ∼10,000 hydrogen molecules. Given its low excitation potential, which primarily occurs through collisions with H, it is easily observed from ground-based facilities, thus making it a convenient molecular gas tracer. The global CO excitation produces a ladder of populated energy levels, with the relative strengths of the observed rotational transitions quantified in CO spectral line energy distributions (SLEDs). The SLED is dependent on gas properties such as temperature and critical density, with higher rotational transitions tracing denser molecular gas. In the case of thermalized excitation, the CO line luminosity is constant for all energy levels; however, in the more likely case of subthermalized excitation, a correction is required to account for the conversion of a line intensity to the ground state in order to infer a total gas mass. This is typically expressed as a CO line brightness temperature (e.g., r = ). There are large uncertainties associated with excitation corrections, particularly as the rotational number J increases, with the exact SLED shape strongly dependent on the galaxy type and gas excitation properties (see detailed discussions in [146,615,616]). Indeed, beyond the local Universe, most surveys rely on these mid-to-higher order CO rotational transitions, due to their frequency and brighter flux at a given redshift (), and thus suffer from potentially large systematic uncertainties when estimating the ground-state emission from higher excitation lines.
An even greater source of uncertainty arises from the conversion of the CO luminosity into a molecular gas mass, known as , where . This factor depends on a host of ISM conditions, such as the gas density, temperature, and velocity dispersion, as well as a strong dependence on metallicity (e.g., [149]). In the Milky Way, can be determined directly through the virial mass technique with the observation of spatially-resolved giant molecular clouds. By measuring their sizes and kinematics, and under the common assumption that the CO () line emission is optically thick, one can obtain a relationship between CO luminosity and gas mass. This has yielded a Galactic value of = 4.3 , with ∼0.1 dex uncertainty (see detailed review by Bolatto et al. [615]).
Outside the local Universe, direct determination of is challenging, and studies typically rely on spectral line modeling of multiple transitions and isotopologues of CO (such as CO, e.g., [617]) to determine gas conditions, or use optically-thin dust emission to estimate a gas mass (see below). Therefore, it is common for the Galactic to be adopted for star-forming disk galaxies with approximately solar metallicity on the MS. However, various factors could contribute to deviations from this value. For example, galaxies with molecular gas at higher temperatures or with increased velocity dispersion (e.g., due to turbulent motion, outflows, ram-pressure, mergers, starbursts) would require a lower value of as higher energy states are excited, yielding larger CO luminosities [618]. These factors will somewhat influence the in high-metallicity galaxies, with a much more dramatic influence on lower-metallicity galaxies, as less dust is available to shield CO from photodissociating, necessitating a higher value for [619]. Many studies attempt to account for this with a metallicity-dependent correction, though often based on a mass-metallicity relationship. Thus, measurements for can vary from ∼1 to 4 to 12 for starbursts, Milky Way-like, and low-metallicity galaxies, respectively, making direct comparisons of gas masses over heterogeneous samples difficult.
A comparatively inexpensive alternative to CO, submm continuum emission in the optically-thin regime (m) is proportional to the total dust mass, which can be related to the gas mass37 via a minimal number of parameters. The first, the mass-weighted dust temperature, has an observed range of 15–30 K in local to high-redshift (MS to starburst) field galaxies (e.g., [621]). While it can be robustly measured in individual galaxies with adequate coverage of the FIR, studies are often working off of a single continuum band, particularly beyond the low-redshift Universe. In these cases, it is common to adopt a constant K38 (e.g., [147]). This assumption was recently tested in Dunne et al. [622], which found that, despite a significant correlation between and , using a constant and individually-measured produced consistent results for massive, MS galaxies.
In addition to , deriving a gas mass from requires the dust opacity (a function of grain properties; [128]) and the dust-to-gas ratio (proportional to metallicity; e.g., [621,623]), both of which are often unavailable. This has limited most studies to massive, high-metallicity galaxies, for which the DGR can be reasonably assumed to be in the range 100–150 (e.g., [621,623,624]). Dust opacity, on the other hand, is difficult to measure outside the Milky Way and so, given that we expect reasonably small ranges for and the DGR, empirical calibrations between and have been derived through comparisons with CO both locally and at high redshift [78,147,148,625,626], with the uncertainties for CO-based gas masses described above. Using these calibrations, dust continuum and CO- (and [Ci]-)based gas masses are found to be in good agreement across a range of redshift and luminosity (e.g., [78,622,627]), with dust-based gas masses having modest systematics (secondary dependencies on, e.g., / ratio, SFR) at the 20% level [620,622]. We note that these calibrations should only be applied to the global submm flux; and the DGR ratio vary on smaller spatial scales [120,628].
Thus, while systematics remain in our gas measurements and we can expect our calibrations to break down in the low-mass, low-metallicity regime, both CO and dust provide robust, comparable gas tracers in the field. Whether this holds as a function of environment, however, is largely untested. Particularly at high redshift, it is unknown if cluster galaxies have similar dust properties as their counterparts in the field. Likewise, we can expect that environmental quenching processes effect both gas and dust and potentially in different ways. Dust and molecular gas are often co-spatial, as H requires dust grain surfaces to form [629,630]. However, ram pressure stripping, for example, could strip dust and molecular gas at different rates, depending on their distribution within the disk [631]. In the other direction, preliminary studies suggest that RPS can also compress Hi within a galaxy, triggering the transformation to H. The enhanced molecular gas fractions (e.g., [632]) observed may require commensurate grain growth during this process [633]. Until we do a thorough, simultaneous study of CO and dust across environments, our interpretation of gas masses will be limited.
6.2. Environmental Effects on the Galaxy-Integrated Molecular Gas Content
6.2.1. An Historical Perspective
Studies of environmental effects on the cold ISM of galaxies were pioneered at radio wavelengths, focusing on atomic hydrogen (Hi). This is the dominant gas component of the ISM at low redshifts, often extending beyond the optical disk in typical galaxies and therefore not as strongly bound to the gravitational potential well (e.g., [13,634]). The resounding consensus from these studies was that cluster environments host a unique population of “anemic” or Hi-deficient galaxies; this depletion of atomic hydrogen presented the first observational signature of the removal of a galaxy’s ISM due to environmental effects (e.g., [635,636,637]). As technological advances paved the way for shorter wavelength observations in the infrared and submillimeter regimes, molecular gas studies within clusters searched for similar environmental signs through CO emission lines. Although molecular gas makes up a smaller budget of the ISM than Hi in low-redshift disk galaxies, it is more directly linked to the formation of stars (e.g., [638]) and therefore could be a more straightforward probe into environmental quenching. However, it is also a denser phase of gas and more tightly bound to the inner disk.
The Virgo cluster, nearby and containing a significant number of Hi-deficient galaxies, was the breeding ground for some of the first studies on environmental effects of molecular gas. Following in the footsteps of atomic gas cluster studies, the molecular gas content has often been analyzed within the context of the Hi-deficient cluster galaxies. Initial studies found this population to exhibit high molecular to atomic gas mass ratios and contain typical (field-like) CO gas reservoirs [639,640,641], even after accounting for mass and morphology dependencies [639] and probing to low luminosities [642]. Other cluster studies followed suit, finding comparable CO gas contents in isolated field galaxies to those associated with the rich Coma supercluster, where environmental effects might be more extreme [643]. This was confirmed not only in FIR-selected galaxies, which could be biased against low star formation rates [644], but also in optically-selected galaxies in both the Coma [645] and Fornax [646]39 clusters. Conversely, after reanalyzing distances to Virgo galaxies and comparing to a small field CO sample from Young et al. [647], Rengarajan and Iyengar [648] concluded there was evidence for H deficiencies in the Kenney and Young [639] cluster data, though the field galaxies were infrared-selected and thus favored a more gas-rich population given the strong correlation between gas mass and infrared luminosity [645]. Indeed, Fumagalli et al. [11] later quantified that the average infrared luminosity of gas-deficient galaxies (defined as having both low Hi and H contents) was ∼ lower than that of normal galaxies, signifying the importance of probing down the luminosity function to the same flux completeness when comparing isolated and cluster galaxies.
These initial studies were also plagued by a lack of large-field CO surveys, rendering comparisons between cluster and isolated populations incomplete. In 1995, the Five College Radio Astronomy Observatory Extragalactic CO Survey [649]40 presented one of the first CO surveys that sampled ∼300 galaxies spanning a range of parameters (e.g., morphologies, optical sizes, environments), though the survey was not complete in a flux-limited sense [649] and favored FIR-bright (and thus CO-bright) galaxies [645,651]. Utilizing this survey along with other nearby field galaxies from Sage [652], and compiling molecular gas observations of cluster galaxies from the literature, Casoli et al. [651] investigated statistical comparisons of environmental effects on molecular gas. They defined a CO deficiency parameter normalized to the optical size of the galaxy and analogous to prior Hi studies. Even after attempting to account for non-detections of CO using a survival analysis, they still found no evidence for significant CO deficiencies in nearby cluster cores. These early results thus lead to the general interpretation that processes like strangulation and ram-pressure stripping can effectively remove the atomic gas on relatively short timescales of ∼a few hundred Myr (e.g., [653,654]), while the denser, and often centrally peaked, molecular gas [655] is left unaltered and shielded from hydrodynamical effects [639,649,650] over ∼Gyr periods, comparable to cluster crossing times (e.g., [639]).
6.2.2. Low-Redshift () Cluster Trends
As sample sizes have increased and sensitivity limits have decreased, the picture has now become more nuanced, with low-redshift cluster studies typically finding depleted molecular gas reservoirs in cluster galaxies. Many of the aforementioned pioneering studies suffered from small sample sizes, biased selections, heterogeneous data sets, and large uncertainties on the total CO fluxes and gas masses (see also discussions in [11,13]). With recent technological advances, there has been a resurgence of CO surveys over the last ∼15 years, allowing environmental comparison studies to partially mitigate some of these issues in the nearby Universe. For example, Fumagalli et al. [11] attempted to homogenize the recovered CO flux measurements in 47 nearby spiral galaxies within Virgo, Coma, groups, and in the field, after finding a weak correlation between molecular and atomic gas depletion in Virgo-only cluster galaxies [656]. They utilized the BIMA41 and Nobayama CO [658] surveys, which had similar sensitivities and analysis techniques that yielded estimated gas mass dispersions of <0.4 dex. Despite missing gas-poor galaxies due to infrared selections, they detected a global depletion of molecular gas in a significant subset of Hi-deficient galaxies, and a notable lack of H deficiency in Hi-normal galaxies; this presented some of the first evidence for indirect environmental effects on the molecular gas in cluster galaxies. A similar trend was observed in Abell 1367, part of the Coma Supercluster, using 19 optically-selected spiral galaxies with CO () and () detections from the IRAM 30-m telescope [659]. Classifying the galaxies according to their evolutionary stage, with more evolved states defined as higher levels of Hi deficiency and redder optical colors [660], they found larger H deficiencies in spirals with more advanced evolutionary states, in addition to a few abnormal gas morphologies (see also Section 6.3).
The launch of Herschel ushered in a number of dedicated surveys at far-infrared wavelengths, spanning galaxies over a wide range of environments, morphologies, and masses. As in the pioneering molecular gas studies from the 1980s, the Virgo cluster has been a ubiquitous target, for example, in both the Herschel Virgo Cluster Survey (HeViCS, [26]) and the volume-limited Herschel Reference Survey (HRS, [661]). Providing estimates of obscured SFRs and dust masses, these surveys offered suitable samples for studying environmental trends on dust and molecular gas in combination with new CO follow-up studies and archival programs. With a magnitude-limited sample of 35 Virgo spiral galaxies from HeViCS, Corbelli et al. [662] investigated correlations between stellar mass, Hi, cold dust, and molecular gas contents. They found that as Hi deficiency increases, the dust-to-stellar mass and molecular gas-to-stellar mass ratios decrease, while the dust-to-total gas and molecular-to-total gas ratios increase, with a more pronounced correlation in the dust component. This provides evidence that both dust and molecular gas can indeed be affected by the cluster environment, but to a lesser extent than the Hi gas, likely due to H being more tightly confined in the central disk. Studies using the mass-selected HRS confirmed this result and further differentiated Virgo cluster galaxies from a field sample selected with similar criteria, totaling ∼200 galaxies for statistical comparisons. Homogenizing various CO measurements and defining a control sample of field galaxies with low Hi-deficiencies, Boselli et al. [663] found that Hi-deficient cluster galaxies also have depleted molecular gas contents for a given stellar mass, with the level of H-deficiency weakly but significantly increasing with Hi-deficiency. Cortese et al. [631] similarly measured a notable depletion of Hi, H, and dust contents in the Virgo cluster population. Each of these results was robust to systematic uncertainties in the CO-to-H conversion factor (Section 6.1.1), using both a constant and a luminosity- or metallicity-dependent . Taken together, these Virgo studies hint at a possible differential quenching or stripping efficiency of each ISM component (see also [664]), from molecular gas to dust to atomic gas, likely due to their decreasing concentration within the disk (i.e., increasing scale length). This is consistent with outside-in quenching, as expected from hydrodynamical mechanisms such as ram-pressure stripping [631,663].
Recently, additional studies have attempted to holistically characterize the Virgo cluster environment through phase-space diagrams, local galaxy density, and filament analyses, out to large radial extents. Morokuma-Matsui et al. [665] used a mass-limited sample (log ) of ∼170 galaxies with CO-detections (or upper limits) from the literature, with accompanying stellar mass and SFR estimates, in order to investigate molecular gas deficiencies relative to isolated galaxies as a function of a variety of environmental definitions. They found that not only do cluster galaxies have lower SFRs (as discussed extensively in Section 5) and lower molecular gas fractions than field galaxies on average, but there is also a radial/accretion history dependence when normalizing for stellar mass (see Figure 13). Both quantities decrease and further deviate from the field quantities with decreasing clustercentric radius, increasing projected local galaxy density, and earlier accretion epoch as based on the position in the phase-space diagram, quantified as . Moreover, they find the radial dependence transitions more sharply at ∼, which they interpret as a sign of possible ram-pressure stripping, given it occurs roughly where they expect the boundary to exist between the recent infall and virialized populations. The CO gas masses, SFRs, and stellar masses for Virgo galaxies that were assembled in Morokuma-Matsui et al. [665], in addition to our own literature compilation of distant clusters, are included in Figure 14, where we plot molecular gas mass and the gas fraction offset from the scaling relations as a function of redshift.
Castignani et al. [666] further identified 245 galaxies within large-scale filamentary structures in Virgo, presenting an intermediate environment to contrast to the isolated field and denser core. They detect a significant fraction of gas-deficient (Hi, H, or both) galaxies in filaments, and a steady decrease in SFRs and gas contents as galaxies progress from the field to filaments to the cluster core (see also the similar monotonic decrease in the fraction of SFGs in increasing density within the Coma cluster shown in Figure 1), while the correlation is stronger for Hi than the molecular gas, 84% of early-type galaxies, which tend to live in the densest group-like filamentary regions, have depleted reservoirs, possibly due to starvation and/or group preprocessing. Conversely, late-type galaxies within Virgo, selected from the JCMT Nearby Galaxies Legacy Survey (NGLS; [667]), have higher H gas masses and longer depletion timescales than similarly-selected group galaxies on average [668]; this result holds even when accounting for CO non-detections with upper limits using a survival analysis. Given the lower Hi-masses of the cluster galaxies, this could imply a more efficient conversion of Hi gas into H gas in rich clusters compared to group environments (see also Section 6.2.3). It has also been suggested that disturbed and non-virialized clusters similarly represent intermediate environments. For example, galaxies within the nearby merging Antlia Cluster contain typical molecular gas reservoirs for their mass and SFR, implying that the less-dense ICM in the disturbed cluster does not significantly effect the molecular gas component [669].
The molecular gas content of galaxies as a function of environment has now been investigated beyond the local Universe, both in the infall [457,670] and virialized [671,672] regions of clusters out to with CO, and to [673] using dust continuum (see also Section 6.2.3 and Section 6.2.4 for examples at ). From Figure 14 (left panel) it is apparent that galaxies in overdense environments follow the same general trend as field galaxies: the molecular gas mass for MS galaxies rises with increasing redshift and stellar mass. In detail, however, the picture is more complicated. Using a prescription for based on SFR, Castignani et al. [672] measured no effect on the molecular gas content in 17 FIR-selected cluster LIRGs at , while Jablonka et al. [671] concluded that three cluster galaxies had a lower CO luminosity at fixed stellar mass or infrared luminosity. However, these studies primarily focused on LIRGs above the star-forming main-sequence to maximize CO detectability, and thus potentially suffer from selection effects, such as Eddington and Malmquist biases [670]. The Spatially Extended EDisCS Survey (SEEDisCS; [674,675]) instead targeted 49 star-forming galaxies on the main-sequence (72% of the sample is within 0.3 dex) in two clusters within 5. Matched in color, stellar mass, and redshift to PHIBSS2 field galaxies, the cluster sample comprises a unique population of galaxies with low gas-to-stellar mass ratios that is absent in the field comparison (see points in right panel of Figure 14); there is a slight preference for this subset to be located along the cluster infall regions, again hinting at an environmental dependence on molecular gas properties. Supporting this, Betti et al. [673] stacked dust continuum measurements of mostly MS galaxies at as a function of local environment in COSMOS, from which they derived low molecular gas content in their intermediate and high galaxy density bins. Thus, at ,42 environmental studies seem to be converging on the idea that the integrated molecular gas content is on average depleted compared to isolated field galaxies, though with some evidence for elevated gas masses in Virgo spirals (e.g., [632,668]).
6.2.3. Intermediate-Redshift () Cluster Trends
The picture emerging at is still preliminary, primarily due to large scatter from small samples, and the time-intensive nature of probing to sufficiently low CO flux limits at high redshift. Many early studies thus focused on molecular gas in only one or two, often unique, (proto-)cluster galaxies, e.g.: an infrared luminous AGN in the outskirts of a cluster at [683]; a bright AGN within a galaxy overdensity around a central radio source [685]; and a potentially interacting cluster galaxy pair at [686]. Other studies have instead used high-redshift clusters to conduct pseudo-blind CO surveys, exploiting the high density of galaxies over a narrow redshift range to target numerous galaxies simultaneously due to the availability of wide receiver bandwidths and large primary beams [304,512,676,677,678,679,681,682,684,687,688]. For example, Aravena et al. [684] pointed at a candidate galaxy cluster, covering four spectroscopically-confirmed sources at a similar redshift. Using the JVLA, they detected CO () in two of the confirmed members, as well as in two serendipitous galaxies with optical counterparts. The galaxies had SFEs consistent with high-redshift SFGs, demonstrating the utility of using overdense environments to efficiently target CO in typical distant galaxies in a reasonable integration time (∼20 h on source). Similarly, Rudnick et al. [678] pointed the JVLA at the peak location of MIPS cluster members in the well-known star-forming cluster ClG J0218.3-0510 at (see Section 5.2.1). In 100-hours of integration time, only two out of 6 (9) confirmed members through spectroscopic (grism) redshifts resulted in significant CO () emission, both 24 m detected. Despite one source having a SFR an order of magnitude below the MS, the molecular gas fractions are consistent with the field-scaling relations from Genzel et al. [602], and stacking on the star-forming members without CO detections did not yield any signal.
With the increased sensitivity of ALMA, cluster surveys are now observing molecular gas reservoirs with even higher efficiency, detecting CO or dust in ≳10 galaxies with a mere few hours of integration time. The results have been puzzling. The majority of CO studies have measured integrated molecular gas fractions that are enhanced (or consistent with but systematically above) the field-scaling relations [602,603] for a given stellar mass and SFR (see solid circles at in right panel of Figure 14). Using CO (), this has been shown in a seemingly heterogeneous sample of clusters, from three rich NIR-detected SpARCS clusters (J0225, J0224, J0330) at [676,677], a mature X-ray cluster at (XMMXCS J2215.9–1738) with an overdensity of SMGs in the core [679,687], and a lower-mass X-ray cluster at [681]. It has been postulated that these enhanced gas fractions could result from various effects, for example: (1) an environmental pressure that increases the formation of molecular gas through compression of the ISM [689]; (2) a preferential location that is conducive to efficient gas inflows (e.g., [444,690,691]); (3) a mechanism that perturbs the gas such that a smaller fraction of it is available to form stars; (4) a selection effect; or (5) an environmental dependence on the conversion factor between CO and H (; see Section 6.1.1). The latter two possibilities are unlikely the sole causes. Indeed, Hayashi et al. [679] accounted for metallicity effects using a mass-dependent . Moreover, Noble et al. [676] found a higher fraction of cluster galaxies offset from the scaling relations than non-detections, and Hayashi et al. [679] stacked 12 quiescent galaxies with no measurable gas content down to . Perhaps more surprisingly, there are very few CO-detected galaxies at this redshift that lie >1 dex above the MS, and some of the most elevated gas fractions are in fact in galaxies >0.5 dex below the MS (see right panel of Figure 14). Furthermore, subsequently deeper CO observations, down to an rms of ∼0.1–0.2 mJy/beam over 50 km/s channels, have not produced a population of cluster galaxies with reduced gas reservoirs compared to the field-scaling relations in these clusters [677,681].
Conversely, some studies have found evidence of significant gas deficits at high redshift, particularly when using dust continuum as a molecular gas tracer. Alberts et al. [680] derived the average (stacked) gas content of 126 cluster galaxies across 11 ISCS clusters at . Performing a comparison to stacked field samples and field-scaling relations, they found that cluster SFGs (on or above the MS) have on average 2–4× lower molecular gas masses and fractions than the field (shown as stars at in right panel of Figure 14). This result holds out to , suggesting gas loss starting outside the cluster virial radius as the cause of the rapid quenching motivated in Section 5 for this epoch (see discussion in Section 8.3.1). However, this work must be reconciled with CO studies before a robust interpretation can be made. While both CO and dust continuum are established as robust gas tracers in the field, this has not been tested in overdense environments. As noted earlier, in the local Universe both dust and CO show signs of depletion likely due to stripping but not at the level of more extended Hi content, suggesting both are more tightly bound in the central disk [662]. Cortese et al. [631] found a tentative increase in the ratio of molecular gas to dust mass in Hi-deficient Virgo galaxies by ∼, suggesting that dust is more easily stripped (see Section 6.2.2). This result, however, was only significant at the level. Since ISM conditions at high redshift significantly differ from the local Universe, resolving this disconnect will require both measurements of CO and dust in a statistical sample of high-redshift cluster galaxies.
Do any CO studies find gas deficits? One study of a X-ray-detected cluster (Cl J1449+0856) has measured molecular gas fractions on or slightly below the field-scaling relations using gas masses from CO () in three main-sequence BzK galaxies [682].43 Notably, this is not due to reaching a low CO flux limit, as the ALMA observations used in the Coogan et al. [682] study are appreciably shallower than than those of Noble et al. [677] and Williams et al. [681]. One important feature of Cl J1449+0856, which is NIR-selected and X-ray detected, is that it contains a significant quiescent population in the core [692]. In contrast, the three NIR-selected clusters with high gas fractions in Noble et al. [676], Noble et al. [677] have low quenching efficiencies ([399,416], see also Section 4.2.3). This indicates that significant cluster-to-cluster variation is likely a culprit for some of the seemingly heterogeneous results at high redshift, where sample sizes are still small. It is also interesting to note that using multiple CO transitions (, , and ), Coogan et al. [682] found that many of the galaxies in the cluster displayed starburst-like excitation in the SLEDs, with substantial amounts of denser molecular gas44. Similarly, an independent study of the cluster XMMXCS J2215.9–1738 found a significant fraction of dense CO () gas compared to field galaxies [512]. This could suggest that using a larger ratio of the CO line brightness temperatures (e.g., r = ) might be more appropriate for these high-redshift cluster galaxies, which would bring down the gas fractions when estimated from higher-order rotational transitions (see also Section 6.1.1). The current ALMA receiver bands only permit CO () to be observed up to ; however, this will change with the full installment of receiver Band 1 over 35–50 GHz [694] which recently had a successful first light run and will enable sensitive observations of CO () out to in a reasonable integration time and permit studies of environmentally dependencies on CO excitation.
6.2.4. High Redshift () Proto-Cluster Trends
The question raised in the previous section of the distribution of CO among different transitions becomes even more salient at higher redshifts. At , many studies rely on higher excitation transitions () to probe molecular gas contents with ALMA, and/or use the lower frequency receivers available with, e.g., JVLA for CO ( observations, albeit with less sensitivity compared to ALMA. Again, early studies focused on a few token galaxies in proto-clusters (e.g., SMGs at [534,537,538]); both the central radio source (MRC 1138-262; [305]) and an H-emitter (HAE229; [695]) belonging to the Spiderweb conglomeration at ; and a single detection of an infrared-bright, optically-faint galaxy in the dense core of HS1700+64 at [304]. Proto-cluster studies of molecular gas have now expanded to a handful of systems, namely PCL1002 (and other structures associated with Hyperion), 4C23, SSA22, USS1558, GN20, SPT2349-56, and the Distant Red Core (see Table 3 for details on those detected with DSFG overdensities). Extended gas reservoirs and high gas fractions have been measured for galaxies within many of these proto-clusters [71,72,304,305,306,309,337,367,537,538,695]. For example, detecting CO () in 16 H emitting galaxies (on or above the main-sequence) over three proto-cluster fields from , Tadaki et al. [337] found a mass-dependent effect: less massive proto-cluster galaxies () harbor slightly enhanced gas fractions (though consistent within errors) and longer depletion timescales relative to their isolated counterparts, while more massive members are similar to the coeval field (albeit based on only three CO detections with log ). They propose that accelerated gas accretion along cosmic filaments might replenish the gas reservoirs and sustain star formation over long periods in lower-mass galaxies (e.g., [74]), while the gas could be heated by virial shocks or AGN in the more massive systems (see discussion in Section 5.3.2).
Studies of filaments associated with the Hyperion proto-supercluster at have yielded similar results. Using CO (), Champagne et al. [72] detected a slight enhancement in the gas fractions of galaxies within PCL1002, yet also measured a integrated SFE that is comparable to the field. A nearby structure (CLJ1001) was analyzed by Wang et al. [301] as a proto-cluster core due to its extended X-ray emission (but see [72], which characterized this structure as a filament). Using phase-space diagrams, they investigated the gas content of massive SFGs as a function of their accretion history. They found that the molecular gas reservoirs are reduced from the infall region to the center within a single radial orbit, hinting at fast quenching mechanisms like tidal or ram-pressure stripping. Gómez-Guijarro et al. [309] utilized a variety of observatories to target multiple CO transitions in the Hyperion overdensity, as well as reporting the discovery of two new gas-rich proto-cluster cores at and . They also propose a mass-dependent trend in gas properties, finding low-mass member galaxies with high gas fractions but main-sequence SFEs.
As in the cluster studies, dust continuum measurements of proto-cluster galaxies typically estimate lower gas masses than those from CO emission lines. For example, Aoyama et al. [696] contend that CO fluxes overestimate the gas masses in proto-cluster USS1558-003 due to higher than expected gas excitation, while the ALMA dust continuum measurements at 1.1 mm suggest the large gas reservoirs are actually consistent with the field-scaling relations. In the proto-cluster 4C23.562, CO emission also produced higher gas mass estimates compared to those from 1.1 mm dust continuum and optically-thin [Ci] line emission by ∼0.15 dex on average, but only in 2 galaxies, while the remaining 3 galaxies displayed consistent measurements from all three tracers [697]. Zavala et al. [346] similarly measured field-like gas masses from 1.3 mm continuum observations, and additionally discovered a population of gas-poor members at the high-mass end. These studies highlight the importance of obtaining CO SLEDs in a large number of high-z proto-cluster galaxies to constrain gas excitation. A recent survey of 10 highly star-forming Herschel sources in Planck high-z (PHz) proto-cluster candidate fields from has measured multiple CO transitions, finding the SLEDs to peak at quantum rotation number , implying low excitation [367]. Increased samples sizes are needed to provide further calibration of CO gas and dust masses in high-z (proto)-cluster fields.
Additionally, some surveys are placing the first constraints on the CO luminosity function and cosmic gas density in high-redshift overdense environments. Using five CO ()-detected sources in a proto-cluster (4C23.56; [698]), Lee et al. [699] estimated a cosmic gas density that is ∼6–20× higher than field estimates (e.g., [700]). They measured a lower limit of 1–5 Mpc, depending on the redshift range considered for the volume ( or ). A low-resolution mosaic on the Spiderweb proto-cluster with the Australia Compact Array (ATCA) has similarly exposed an enhanced CO luminosity function that is ∼tens of times higher than blank fields [322]. Studies of gas and dust in proto-cluster members at have found a similarly high number of gas-rich and starburst galaxies, including: the DRC at [325,328]; GN20 at [534,536,537]; SPT2349-56 at [313,326]; and AzTEC-3 at [538]. These studies establish proto-clusters as sites of rapid stellar mass growth at early times.
In summary, a rich dataset of integrated molecular gas properties in galaxies within (proto-)cluster environments has emerged out to , covering a dex range in stellar masses and SFRs along the Main Sequence (Figure 14). Low-redshift cluster members display a wide range of gas fractions, including a clear population of Main Sequence galaxies with depleted gas reservoirs compared to coeval field galaxies. CO-based studies at have instead discovered numerous gas-rich galaxies, with a notable absence of galaxies below the field gas scaling relations, despite probing galaxies down to low SFRs. Dust continuum tracers, however, paint a different picture, with stacked measurements estimating gas fractions that are a few times below the field. While the enhanced gas fractions at are intriguing, we have yet to conclusively determine what drives them. Resolving the molecular gas spatially and kinematically is the first step toward answering this, as various quenching mechanisms are expected to have different effects on the gas.
6.3. Lessons from Spatially-Resolved Studies
Spatially-resolved studies of molecular gas are now providing insight into how the gas is affected by the cluster environment, particularly through detailed studies of CO radial profiles, morphologies, and kinematics of low-redshift cluster galaxies. For example, mapping CO and far-infrared continuum in Virgo spirals from the HeViCS with the IRAM-30 m telescope, Pappalardo et al. [701] measured steeper molecular gas and dust profiles in Hi-deficient galaxies. Fumagalli et al. [11] similarly showed that while not all Hi-deficient galaxies have reduced molecular gas contents, galaxies do have depleted CO when the Hi is removed from within the optical disk, indicating that molecular gas is more tightly bound. Virgo studies have also found molecular gas disks to be truncated compared to field populations [28,702]. Moreover, the spatial extent of CO and dust is correlated with the level of Hi depletion, with truncated molecular gas [12] and dust [703] disks present in more Hi-deficient galaxies, as well as decreasing CO-to-optical diameter ratios (i.e., becoming more gas deficient) with decreasing Hi-to-optical diameters [704]. On the other hand, observing a higher CO transition of () with the JCMT, Mok et al. [705] found no truncation of molecular gas sizes in Hi-flux selected Virgo spirals, but did measure steeper CO profiles with enhanced central surface densities in the cluster sample. These many results all suggest that the environment removes gas from the outside-in, and can potentially further increase H formation in the galaxy center. Simulations have shown that moderate ram-pressure stripping could result in this behavior [706].
The mapping of CO morphologies in low-redshift cluster galaxies similarly supports the idea that ram-pressure can affect the molecular gas, though tidal stripping features can also produce similar signatures (e.g., [707]). Both in Coma and the merging cluster Abell 1367 (part of the Coma Supercluster), molecular gas with asymmetric and complex distributions has been revealed in member spiral and irregular galaxies [659,708,709]. Furthermore, in two cases, the CO was significantly offset from the optical centroid, indicative of perturbed gas from ram pressure stripping. Even in the Fornax cluster, which is less massive and should therefore have less efficient ram-pressure stripping, many low-mass galaxies (≲) have disturbed molecular gas morphologies, including some with gas tails that are aligned with the cluster center [29]. Molecular gas asymmetries have further been identified within lower-density group environments through peculiar CO distributions [710], suggesting some amount of pre-processing might also be occurring.
While these studies show great progress and are reaching some consensus, they have been limited by small sample sizes, marginal spatial resolution, heterogeneous comparisons, or some combination thereof. Large cluster programs on ALMA will transform this. For example, the Virgo Environment Traced in CO (VERTICO) survey [27] has observed CO (), as well as other CO isotopologues and gas tracers, at an exquisite resolution of ∼700 pc in 51 Virgo galaxies over a broad range of SFRs and stellar masses, with ancillary Hi imaging [711]. Using a homogeneously-selected and analyzed sample of spatially-resolved field galaxies from HERACLES45, VERTICO uncovered an identical molecular gas mass-size relation in both samples, concluding that any environmental effects on the molecular gas act equally on the integrated gas mass and resolved gas distribution. They also highlighted the low scatter in the relationship when using isodensity radii sizes as opposed to 90% flux-percentage radii. Zabel et al. [28] further investigated the shapes of the CO radial profiles in VERTICO, finding more compact and steeper H profiles in cluster galaxies with larger Hi deficiencies, partially echoing the results in prior Virgo studies [12,705]. They interpret these findings as evidence for ram-pressure stripping, and additionally identify several Virgo galaxies with clear morphological signatures of stripping events that have normal-to-enhanced amounts of molecular gas but depleted of Hi. Further kinematic studies of the molecular gas in ram-pressure stripped galaxies are necessary to fully characterize the effect on this denser gas phase, and are the motivation behind the ALMA JELLY large program (PI: Jachym), which currently has observations underway.
In the meantime, dedicated studies of gas kinematics and morphologies in individual ram-pressure stripped galaxies have provided the clearest picture of environmental effects on the molecular gas component. Large amounts of extraplanar CO (including CO; [713]) have now been detected in tail-like features of low-redshift cluster galaxies (e.g., [29,714,715,716]), sometimes seen kiloparsecs away from the disk (e.g., [31,717,718,719,720]). In particular, much focus has been on some of the most obvious ram-pressure stripped candidates, known as jellyfish galaxies due to their long tentacle-like tails of ionized gaseous debris [721,722], often with knots of star formation (e.g., [723,724,725]). For example, ESO 137-001 in the Norma cluster (Abell 3627) is an exquisite example of ram-pressure stripping in action; diffuse H emission, discrete HII regions, and shock-excited molecular gas—revealed through MIR rotational transitions of warm H with Spitzer/IRS46 [727,728]—are embedded within a ∼80 kpc long X-ray tail that emanates from a undisturbed spiral disk [729,730]. CO was detected in the tail out to ∼60 kpc, with the amount of gas decreasing along the length of tail [717]. High-spatial resolution observations of CO () at 350 pc with ALMA (Figure 15) revealed both filamentary and clumpy CO, including clouds of CO at the heads of streams of young stars [731], known as “fireballs” [732]. Jáchym et al. [731] argue that these different CO structures represent different evolutionary stages of stripping, with the filamentary structures within the tail forming in situ (potentially from stripped Hi), while some CO clumps might have been stripped directly from the disk.
In concert with the morphological evidence for molecular gas in tails, the kinematics of CO in ram-pressure stripped galaxies has also provided insight into how this denser gas phase is affected. For example, studies have now revealed direct evidence for a marked influence on molecular gas in the Virgo cluster galaxy NGC 4402 through disturbed CO morphology with the SMA [733] and kinematics with ALMA at ∼100 pc resolution [719]. The CO in the stripped plume, on the leading side of the galaxy, has a clear velocity offset of up to 60 from the galaxy’s normal rotation [719]. The kinematic disturbance exhibits a radial gradient, with the velocity offset increasing with distance from the nucleus. This is a strong indication of the influence of ram pressure, consistent with stripping acting from the outside-in, and potentially removing the more diffuse molecular gas [720,733,734]. Moreover, compressed CO gas along the leading edge [719] of NGC 4402 is coincident with enhanced star formation traced by UV [733] emission (Figure 16). Compressed gas has additionally been observed in other ram-pressure stripped galaxies [720,735], and can also result in an increase in the molecular gas fraction [736,737]. Therefore, ram pressure can possibly trigger star formation enhancement during the stripping phase, and prior to ultimate quenching [738].
Spatially-resolved kinematic studies of the molecular gas component in distant galaxies (within the field and clusters) are still in their infancy, with most high-redshift studies targeting single (typically star-bursting) galaxies in CO (e.g., [537,739,740,741,742,743]). In particular, there are only a handful of higher-resolution (primary beam of a ∼few kiloparsecs) CO detections in main-sequence field galaxies at [744,745]. Instead, efficient multiplexing over dense clusters has resulted in spatially-resolved CO observations of multiple cluster galaxies at high redshift; there are currently 8 CO () detections within a single ALMA field-of-view (FOV) over a cluster [677], 11 CO () detections of H emitters within a proto-cluster [746], and 14 cluster galaxies with spatially-resolved CO kinematics [747], all at ∼3 kpc resolution. Lee et al. [746] found cluster galaxies to have broader CO line widths by 50% compared to field galaxies, despite having similar CO intensities. They attributed this to increased merger events. Noble et al. [677] reported the first tentative evidence for molecular gas stripping at through the presence of asymmetric molecular gas tails and truncated gas disks. There is also a clear offset between the gas and stellar disk centroids in a handful of galaxies, indicative of perturbed gas. One galaxy stands out in particular (right panels in Figure 16), due to an elongated gas tail that extends well beyond the optical stellar disk. Moreover, the gas kinematics of this cluster galaxy display the most glaring evidence for RPS, as the tail gas is accelerated from the base to the tip. Modeling the CO rotation in 13 additional galaxies within the same SpARCS clusters, Cramer et al. [747] further measured a high degree of kinematic asymmetry in the molecular gas. These signatures, in tandem with elevated gas fractions compared to field galaxies [676], are indicative of environmental processes acting on the gas component. These results might indicate that cluster galaxies are undergoing modest ram pressure stripping, which could explain the apparently high gas fractions: if the stripping causes the gas to become compressed at the leading edge, it could cause an efficient conversion of neutral hydrogen into the molecular phase (see also [737]).
7. Total Emission from (Proto-)Clusters: “Total Light” Stacking
In the previous three sections, we discussed detailed studies of the galaxy populations in (proto-)clusters using near- to far-infrared (submm) observations. These studies often involved expensive spectroscopic and photometric follow-up to confirm cluster galaxy membership and perform individual multi-wavelength characterization. This kind of follow-up is impractical on the scale of the thousands of (proto-)cluster candidates we are identifying in current and future wide-field and all-sky surveys (Section 3 and Section 9). Furthermore, we are often confined by current capabilities to studying the most luminous populations; for example, galaxies need to be bright in the optical/NIR to obtain a secure spectroscopic or photometric redshift. Though capabilities are growing in terms of detecting and characterizing challenging populations such as low-mass and heavily dust-obscured galaxies, the expense of confirming individual (proto-)cluster membership remains high. These issues combined with (1) a large intrinsic range in cluster properties (i.e., halo mass, dynamical state), (2) selection bias from different cluster selection techniques, and (3) intrinsic variations in cluster populations even in similarly selected, similar mass clusters (e.g., [175,523]) highlight the need for complementary statistical analyses that can recover cluster properties in large cluster catalogs. A statistical approach may in fact be the only way to take full advantage of future large (proto-)cluster surveys.
In this section, we discuss the renewed interested in using (image) stacking (e.g., [748]) of full (proto-)cluster systems, in which all emission is considered without first identifying individual constituents. Stacking boosts the collective signal over the background noise fluctuations, which often dominate over the signal of individual clusters in wide, but shallow surveys. These “total light” stacks47 measure the average or median flux (after background subtraction) of the (proto-)cluster sample at a given wavelength, which represents the typical integrated light from all cluster components, as well as the radial profile of that emission, given moderate spatial resolution. In Section 3.3.2, we saw how this technique was used to characterize Planck “cold sources”, i.e., compact sources in the 4Planck beam which were resolved into extended emission in stacks at m (25 beam; Figure 3). We start our discussion with an overview of the history of this technique in looking for intracluster dust (ICD) and then showcase two recent examples of analyses characterizing the dust/star formation properties and concentrations of cluster populations.
7.1. Intracluster Dust
An early demonstration of the power of stacking large samples of clusters was presented in Kelly and Rieke [749], who observed a strong, evolving stacked signal in the 60 m emission of 71 clusters over 0.3–0.9 using IRAS. This summed MIR emission was expected to originate from two components of clusters: intracluster dust and cluster galaxies (via star formation and/or AGN). Here we give a brief overview of ICD in the context of infrared studies. For an in-depth review of ICD, we refer the reader to Shchekinov et al. [750]. We discuss the second component, cluster galaxies, in the next section.
Since early confirmations of heavy elements in the hot ICM from X-ray spectroscopy [80,751], it has been expected that dust grains—stripped or ejected from cluster galaxies—are collisionally heated by X-ray-emitting gas, producing diffuse FIR emission [752]. The lifetime, and thus the observability, of this dust remains unclear, however. Dust destruction via sputtering is expected to occur on the order of to years, depending on grain properties and gas density [753,754]. Despite this potentially short lifetime, ICD may play a major role in cluster evolution, facilitating the cooling of intracluster gas (e.g., [752,755,756,757,758]) and affecting scaling relations [759]. This diffuse component, however, has proven difficult to observe. One common technique is to analyze the reddening of optical sources behind the clusters (e.g., [760,761,762,763,764]). Another is direct observations in the infrared, which have been carried out on a few local clusters (e.g., [765,766,767,768]). Generally speaking, however, this diffuse, faint signal is lost in the large fluctuations of the cosmic infrared background. As such, stacking studies provide a promising alternative, albeit with the requirement that the ICD and galaxy components need to be separated.
Further stacking studies using IRAS [769,770,771] found that IR SEDs built from the total stacked emission were consistent with galaxy spectra, with an evolution in IR luminosity that mimicked the global cosmic evolution of star formation. Comparing the total IR emission to X-ray indicated an extreme gas-to-dust ratio if cluster IR emission is dominated by ICD [770], inconsistent with limits set by reddening studies (e.g., [761,762]). Expanded coverage of the dust peak through the combination of IRAS and Planck 100–857 GHz (3 mm–m) imaging of 645 low-redshift (median ) SZ-selected clusters [772] enabled the modeling of the total IR emission with a modified blackbody ( where )48. Even with no ability to remove point sources due to low resolution, the best fit model ( and K) was found to be consistent with thermal emission from coeval field galaxies [776,777]. Given the best-fit , they derived dust masses and dust-to-gas mass ratios consistent with previous literature (; [769,770]). Using higher resolution Herschel coverage of 327 clusters, Gutiérrez and López-Corredoira [778] subtracted the contribution from (detected) point sources and set a 95% upper limit on the surface brightness of ICD of , , and MJy sr at 250, 350, and 500m, implying a strong deficiency in intracluster dust (see also [768]). Together with reddening studies and simulations, these IR studies help paint the current picture that ICD is a small component of the ICM, with on the order of ∼0.1–3% of the dust abundance in the ISM of the Milky Way. However, this small amount of dust may still be non-negligible in the cooling of the cluster ICM [764] and there remain uncertainties in the spectral index (up to 20%) and dust opacity (up to 50%; see Section 4.2.1 in [772]) used to calculate the dust mass. Given these, ICD has not been ruled out as an important contributor in cluster evolution.
7.2. Total Emission from Cluster Galaxy Populations
Given the stringent upper limits placed on the ICD component of the total IR emission discussed in the previous section, we can now consider the use of “total light” stacking in studying the other component of the IR emission: the (proto-)cluster galaxy populations, including traditionally hard to observed populations such as low-mass and heavily obscured galaxies. In this section, we look at recent analyses using total stacking in the M/FIR, measuring dust-obscured star formation and/or AGN activity. Recent works have also expanded “total light” stacking to the near-infrared (measuring the total stellar mass; [568,779]) and the UV (measuring unobscured star formation; [780]). Given the moderate resolution (compared to the cluster radius) of all-sky or wide-field surveys from GALEX, WISE, Spitzer, and Herschel, a radial profile analysis can be done in addition to looking at the integrated light.
7.2.1. The Integrated Light of Cluster Galaxies: Dust Emission and the Contribution from Low Mass Galaxies
As discussed extensively in Section 4 and Section 5, infrared observations of quenched populations and (obscured) SF activity in clusters have provided evidence for a transition epoch at , above which significant star formation is found in some massive clusters, indicating the local SFR-density relation is no longer in place. “Total light” stacking can expand this analysis beyond the relatively luminous cluster populations to examine the typical SED of all constituent galaxies. This includes low-mass (log ) cluster galaxies, which we have discussed play a unique role in identifying environmental quenching as their mass-quenching timescale can exceed the Hubble time.
Here we consider the total stacked emission in multiple bands in the M/FIR, which can be used to construct the average IR SED of cluster galaxies (neglecting the ICD component) and measure the dust temperature. As mentioned in Section 7.1, Planck Collaboration et al. [772] carried out this analysis on SZ-selected, massive clusters at , finding a relatively cold (average) dust temperature of ∼24 K, coinciding with a lack of warm dust in the MIR. This lack of warm dust has also been observed in the stacking of less massive (log ) ISCS clusters from , with average effective temperatures ranging from 30 to 36 K, increasing with increasing redshift [779]. By way of comparison, massive field galaxies have a typical of 42 K [781]. Modeling the IR SED instead with a two component fit, Alberts et al. [779] reported ratios of cold to warm dust of / over , only reaching parity with the field at high redshift (/ at in the field; [781]). If we assume massive (log ) cluster galaxies have effective dust temperatures comparable to their field counterparts (e.g., [520,523]) and given that increases with (e.g., [57,782]), this suggests that the cluster “total light” IR SED has a significant contribution from low-luminosity, low-mass galaxies, which increases with decreasing redshift. We note, however, that there are studies that support both colder (e.g., [783]) and warmer (e.g., [680,784]) FIR SEDs in massive cluster galaxies, and the full diversity of the FIR SED in overdense environments in not yet well constrained.
This lack of warm dust may also signal that (luminous and obscured) AGN activity is not a significant component in the total cluster emission, though the rise in effective temperature with redshift qualitatively parallels the rise in AGN fractions in clusters (Section 5.4), as well as rising SFRs. The trend toward warmer stacked SEDs continues into the proto-cluster regime: Planck Collaboration et al. [280] stacked 228 “cold sources” (see Section 3.3.2, Figure 3)—proto-cluster candidates probably at 2–4—which may have warm effective temperatures. Dust temperature and redshift are degenerate in their analysis; however, in the likely redshift range of 2–3 from Herschel colors, they measure 35–45 K. Similarly, Kubo et al. [568] reported high temperatures and a stacked IR SED best modeled with a very warm temperature component in their sample of 179 HSC proto-clusters at . They conclude this warm component is only explainable by luminous AGN.
Can we disentangle the low-mass galaxy (or AGN) component from the total emission stacks? Alberts et al. [779] compared the average “total light” stacked SSFRs of the ISCS clusters in four redshift bins over to their previous stacks on individual galaxies in mass-limited cluster member catalogs (log ; [197]). They found that the average SSFRs of both the total and high-mass populations were consistent within the uncertainties, rising with redshift to draw even with the field by . This could be interpreted two ways: (1) the SSFR is dominated by the massive galaxies, at odds with the relatively cold SEDs discussed above, or (2) the low-mass cluster galaxies are being effectively quenched at similar rates as their high-mass neighbors.
To test this, Alberts et al. [779] quantified the ratio of the 250m flux from massive galaxies to total (stacked) emission, removing any model assumptions in deriving the SSFRs. In the field, this ratio is ∼60–80% for log = 10–11 galaxies, derived from SPIRE observations [785] and simulations [786]. This is consistent with low-mass galaxies having low obscuration (<30% of SF is obscured at log ; [130]). Shockingly, however, the ratio for log = 10–11 ISCS cluster galaxies to the total stacked emission is, averaged over all redshifts, ! This suggests an improbably large contribution from low-mass galaxies to the total cluster FIR emission, given that we expect low obscuration. Several explanations seem unlikely: the similarity between SFG SMFs in clusters and field (Section 4) rules out a vastly higher ratio of low- to high-mass galaxies in clusters. Low-mass cluster galaxies appear to be on the MS [787], not preferentially starbursting. One might argue that massive, highly obscured cluster galaxies are simply missing, due to the difficulties in confirming membership; however, at the highest redshift, accounting for a significant amount of missing SF would require a strong reversal in the SFR-density relation [779]. Likewise the observed total SF from massive galaxies (Section 5) and drop in quenching efficiency at high redshift (e.g., [416]) rule out that the massive galaxies have simply quenched. A few studies [788,789,790] have put forth tentative evidence that cluster galaxies may be more dusty then their field counterparts; however, follow-up “total light” stacking of the ISCS sample in the UV found the unobscured SFR was consistent with field-like obscuration in low-mass cluster galaxies ([780], see also [514]). Further work characterizing the dust properties in cluster galaxies is needed to resolve this mystery.
These studies, deriving averaged dust temperatures and star formation properties in large cluster samples, showcase the potential of total stacking in recovering the integrated emission from the full cluster population. In the next section, we discuss an example that takes advantage of resolving this total emission.
7.2.2. Radial Profiles and the c- Relation
When total emission stacks are more extended than the imaging beamsize (and of sufficient S/N), the (observed) radial profile can be quantified. In current studies, the extent of the stacked stellar and dust emission in clusters seems to trace the overall Dark Matter (DM) mass distribution, as measured by stacked SZ [772] or the cluster velocity dispersion [779]. Recently, the Herschel profile of stacked Planck-selected proto-clusters was found to extend to ∼6–8 [368], roughly comparable to the expected area covered by proto-clusters [70]. Pushing this analysis further, we can infer the intrinsic radial profile to measure the distribution of the baryons and compare to the cluster halo. Given hierarchical structure formation, DM haloes are expected to be described by a self-similar, universal density profile over scales of 10 kpc to 10 Mpc [791,792], parameterized by the magnitude of the overdensity (halo mass) and a scale radius, . The Navarro-Frenk-White (NFW) profile [793,794] is often assumed as a fiducial model.
A consequence of the supposition that the density structure of halos can be parameterized by halo mass and scale radius alone and is universal means the halo mass and scale radius must be correlated. This is often expressed as the concentration-mass relation (where concentration ). The relation for DM has been both modeled via simulations and observed via halo mass tracers such as weak lensing, with a general lack of consensus. At the high-mass end (log ), simulations disagree on whether the relation is relatively flat [795] or shows a sharp upturn [796,797], possibly depending on whether relaxed or unrelaxed clusters are considered ([798,799], but see [796]). The observed relation for DM has an even wider range of results (see Figure 6 in [800]).
In the near-infrared, the galaxy or stellar mass distribution is the observable, not the DM halo. Though these distributions have been successfully modeled using NFW, again there is wide disagreement in , reflecting the complicated effects of cooling, feedback, and gravitational interactions with the DM halo on the baryons (e.g., [801,802,803]). Stacking provides a statistical way to measure the extent of cluster emission and the relation over large samples, informing our models of cluster baryonic evolution. With stacking, information on sub-structure in individual clusters is lost; however, this provides a more robust measure of the typical concentration [804].
Figure 17 shows the concentrations derived from observations of the stellar mass density [384] and galaxy number density [805,806,807,808,809,810,811]. Overlaid are predictions from Correa et al. [799] and Diemer and Joyce [812] of the - relation for DM halos49, showing the flat relation and upturn, respectively, for Planck2015 cosmology ([814], other cosmologies give similar trends). In general, galaxies seem to be less concentrated than the DM as a function of both redshift and halo mass, with several exceptions in individual clusters [805,808] and with Hennig et al. [811] reporting a range of concentrations at fixed halo mass.
How do these compare to the average concentration stacked over many clusters? Alberts et al. [779] fit the stacked near-IR and far-IR emission from 232 clusters with NFW profiles, applying corrections for the observation beamsize and cluster centroiding to recover the intrinsic profile. From the corrected profiles, they found that both the near- and far-IR could be described by an NFW profile50 with a high concentration () at relatively fixed halo mass (log , see [169,175,523]) and across a wide redshift range ( 0.5–1.5). This result suggests the total stellar mass concentration is higher than DM, at odds with the majority of concentrations derived from galaxy populations in individual clusters. Applying this stacking technique to large, well chosen cluster samples, controlling for halo mass, dynamical state, etc., is needed to resolve this contention.
In summary, the “total light” stacking technique is a promising way to perform statistical analyses on the large cluster samples enabled by current and upcoming wide-field and all-sky surveys. Here we have overviewed just three examples, looking at ICD, the total M/FIR emission from galaxy populations in (proto-)clusters, and the relation, each of which has highlighted the need for further statistical analysis in these areas.
8. Quenching in (Proto-)Cluster Galaxies (the Infrared Perspective)
In the preceding sections, we have presented the current state of the literature regarding infrared observations of galaxy populations in (proto-)cluster environments. From this, a complex (and still developing) picture has been painted of environmentally-driven galaxy evolution and quenching. In this section, we discuss this IR picture in the context of potential (qualitative) quenching pathways (Figure 18), and tabulate some of the primary quenching mechanisms with their supporting signatures and IR observations in Figure 19. Environmental quenching mechanisms—hydrodynamical, gravitational, and internal—were introduced in Section 1.1.
8.1. All Scenarios: Starvation
We commence with starvation—likely the most universal and potentially ubiquitous process—starting in intermediate density regions (– cm). The efficiency of new gas accretion via cold streams is expected to be a strong function of halo mass, decreasing as halos enter the shocked heated regime at > (e.g., [74,444]). In the group or cluster environment, the hot intragroup medium (IGrM) or ICM accelerates this process by further heating or stripping51 existing halo gas. This process is likely slow, stripping hot halo gas on timescales longer than a Gyr [815,816,817] and its influence on star formation, fueled by cold, molecular disk gas, can occur over a few to several Gyr. In Figure 18, this is depicted as infalling galaxies losing some or all of their hot halo (yellow circle) on the crossing into the ICM (some, particularly low-mass, group galaxies may have also lost their hot halos). Though the boundary is shown as sharp in the schematic, in reality the ICM is not smooth and the effects of starvation may begin at very large radii (up to ∼; e.g., [84,442,665,690,818]).
As discussed in Section 5, slow quenching characteristic of starvation may present as mild to moderately suppressed SSFRs. A bimodal distribution (MS and sub-MS) has been observed in the (dusty) SFG populations of clusters at , with sub-MS galaxies having lived in the cluster longer than the MS SFGs according to phase space diagnostics [421,466,484]. This suppression (in the SSFR of massive cluster galaxies) appears to be independent of redshift (on average) at least up to at fixed halo mass [197]. Starvation is a plausible mechanism for creating this population. Some molecular gas studies additionally support this, as evidenced by a gradual depletion of gas compared to field galaxies in Virgo from ∼ to the core, and as a function of accretion history (e.g., [665], see Figure 13).
Is there evidence against starvation? Surviving hot halos have been observed in local cluster galaxies (e.g., [819,820]), though typically in very massive galaxies with deep potential wells. A radial analysis of Abell 1795 places galaxies with surviving halos on the outskirts of the cluster, with a clear decrease in occurrences into the cluster center [821]. Still, a recent simulation suggests that not only is gas stripping ineffective for both the hot and cold gas components, but that the hot ICM can feed the hot halo [822]. This seems inconsistent with infrared observations of a sub-MS population unless that hot halo gas remains heated and unavailable for future cooling onto the disk, which would fall under our definition of starvation. On the other hand, suppressed (obscured) SSFRs are not observed at 1–1.5 (Figure 9), and molecular gas masses may be on par with or surpass field levels (Figure 14), supporting that the nature of quenching in clusters changes over cosmic time and starvation alone may be sub-dominant to more rapid mechanisms (or not have enough time to act) at higher redshifts.
8.2. Scenario A: Combined Hydrodynamical and Internal Quenching
We continue under the assumption that starvation operates on the majority of galaxies that fall into massive clusters and, given enough time, is reflected in their SFRs and (molecular) gas properties. We will now consider additional quenching mechanisms—both hydrodynamical and internal – first in the context of a representative intermediate-mass (log 10–11) SFG on a radial orbit during its initial infall onto the cluster core (Figure 18, Scenario A). We will then consider how the efficacy of each mechanism may vary as a function of stellar mass and orbital trajectory, outlining possible variations/combinations of these processes in Scenarios A.1–A.3.
8.2.1. Ram Pressure Stripping and Overconsumption in “Typical” Intermediate-Mass Cluster Galaxies
Ram-Pressure Stripping
As previously discussed, an intermediate-mass galaxy eventually loses access to its hot halo upon entering the hot ICM, with stripping and/or heating preventing the gas from cooling onto the disk. As it moves deeper into the cluster at high speeds, it encounters increasing ram pressure which may eventually affect its colder, more tightly bound gas reservoir. The magnitude of this effect is still under debate and likely depends on several parameters (i.e., stellar mass, orbit, inclination, halo mass; [822,823,824,825,826]). Semi-analytic models and hydrodynamic cosmological simulations generally support effective cold gas stripping on timescales much shorter than the crossing time (∼2 Gyr at ; see discussion in [20]). Detailed simulations that take into account, for example, an inhomogenous ICM with multiple gas phases support even more rapid timescales [706,826].
In the local Universe, RPS events have been directly observed as truncated gas disks and/or stripped tails (i.e., jellyfish galaxies, see Section 6), strongly suggesting that gas stripping is an important quenching mechanism at late times ([13,827,828,829], see also Boselli et al. [20], Cortese et al. [88] for thorough reviews). However, the picture beyond the local Universe is much less clear. Up to , aggregate infrared studies of cluster populations may indirectly support RPS in a few ways. Just as suppressed SSFRs may be a signature of slow quenching at , the strong radial dependence of the star-forming fraction signals concurrent rapid quenching (Section 5), with galaxies preferentially quenched in the cluster cores where RPS should be most effective (due to high ICM densities, ∼– cm, and high galaxy velocities, e.g., [85,440,830]). Along similar lines, the effectiveness of RPS increases with decreasing stellar mass and could plausibly produce the flattened low-mass slope observed in cluster QG SMFs (Section 4.1). More tentatively, the halo mass dependence of the EQE suggested by the comparison of different cluster samples (Figure 6, right) could be consistent with RPS. The increased velocities and ICM densities in more massive halos should enhance RPS; however, turbulence also increases with halo mass (and perhaps redshift) and may act to weaken RPS (e.g., [831,832]).
At , the observed abrupt evolution in both the and EQE requires that rapid quenching dominate, building up a substantial portion of the quenched population from (Section 4 and Section 5). Cluster SFGs during this epoch are observed to live on the MS; as outside-in quenching, RPS intrinsically allows for the “delayed, then rapid” scenario (e.g., [492]), wherein star formation will continue unaffected in the central disk for some delay timescale. Integrated gas studies at are decidedly mixed on the gas properties of cluster galaxies at high redshift, however. Averaged (stacking) studies of MS cluster SFGs (using dust continuum) indicate strong molecular gas deficits, while individual CO studies find high or enhanced gas fractions, seemingly inconsistent with significant (cold gas) stripping. Resolved studies, on the other hand, show preliminary signs of perturbed gas, which may explain both the high gas fractions and point to the occurrence of stripping (see Section 6).
Resolved studies are likely key to solidifying the role of cold gas stripping across cosmic time. High-resolution optical studies of local [109,112] and galaxies [36] have observed evidence for outside-in quenching using optical SFR tracers, a result consistent with RPS (and/or starvation). In the IR, local studies find centrally concentrated molecular gas (e.g., [705]) and at high-z, there is tentative evidence for a jellyfish galaxy at [833,834] and perturbed molecular gas disks at [677] which suggest RPS at early epochs; however, spatially-resolved submm studies at high redshifts are difficult and have been limited to a few sources. As a population study, Finn et al. [835] examined the MIPS 24 m sizes of local galaxies relative to their stellar mass distribution as a function of both global and local environment. They found that galaxies in overdense environments tend to have more centrally concentrated star formation, a trend that correlated with increased HI deficiency. Centrally concentrated SF has also been observed in a cluster [836].
For a representative, intermediate-mass galaxy, RPS may proceed outside-in and produce differential stripping of the various gas and dust components due to their varying scale lengths (e.g., [631]). However, it is unlikely to be able to completely strip the disk gas given the deep potential well at log [88] and may even compress the disk gas [705], driving it into the nucleus (e.g., [706,837]) and enhancing H formation [633]. This could boost the central SFE—as seen in jellyfish galaxies (e.g., [722,738,838,839]) and some cluster galaxies [836]—and/or feed AGN activity (a contentious issue in jellyfish, see Section 4.3 in [20], for a full discussion). Copious starbursting activity is ruled out by cluster galaxies being largely on or just below the MS; however, star formation enhancements may be too small to detect easily [840]. On the other hand, there is tentative evidence for an enhanced MIR AGN fraction in clusters at high redshift (see Section 5.4), which would require a trigger mechanism. This leads back to the redshift dependence of RPS, which is currently an open question [73,494,841]. We can speculate that the increase in galaxy compactness [842] and gas fractions [601,843,844] at high redshift may render RPS generally less effective. For some galaxies at , then, overconsumption is a sound alternative or addition.
Overconsumption
The effectiveness of overconsumption—quenching due to concurrent starvation, star formation, and modest feedack—is a strong function of a galaxy’s SFR and feedback strength. In the local Universe, low SFRs mean long quenching timescales (∼10 Gyr), while at higher redshift (), high SFRs and strong feedback in massive galaxies can quench on timescales shorter than the dynamical time [35,108]. From obscured SFR studies in the infrared (Section 5), we have seen that cluster galaxy SFRs at can be comparable to field galaxies prior to (rapid) quenching, with short or comparable gas depletion timescales (∼0.1–3 Gyr; Section 6). In MS galaxies, star formation (and feedback) scale with stellar mass, consistent with the evidence for a mass-dependent EQE (Section 4). Overconsumption could therefore plausibly provide the rapid quenching required at 1–2; however, it is difficult to explain a weakening (or reversal) in the SFR-density relation in massive clusters at (Section 5.2.1) if overconsumption is the dominant or sole quenching mechanism. As with RPS, resolved studies, looking for inside-out quenching, would provide strong evidence for processes such as overconsumption. Inside-out quenching, however, appears to be more characteristic of quenching centrals, rather than satellites [112].
Scenario A Summary
Which, then, is the dominant mechanism quenching our representative galaxy? It is apparent that no single quenching mechanism stands out as an obvious fit to the infrared observations. Moreover, it is likely that the primary mechanism changes with cosmic time. At , starvation and RPS are likely both operating alongside mass-quenching. At , RPS and overconsumption could combine to effect rapid quenching after a delay time. Though conventionally RPS is thought to be most effective in cluster cores, eccentric orbits [723], inhomogenities in the ICM, and/or group membership could lead to RPS in the cluster outskirts (or beyond, see Section 8.2.2 and Section 8.3.2). Weaker RPS, stripping the more diffuse material of an extended atomic or molecular gas disk, could also be a key player and could combine with overconsumption by removing material heated or ejected by feedback from galactic fountains [73,845] or AGN [846,847]. As such, it is unclear if a single mechanism dominates, and we conjecture that it varies from galaxy-to-galaxy which mix of quenching processes is driving the evolution in Scenario A.
8.2.2. Deviations from Scenario A in other stellar mass regimes
Near-infrared studies have provided strong evidence for a stellar mass-dependence of EQE (Section 4, Figure 6, right), which emphasizes that we should examine the fates of galaxies outside of the representative mass regime that was discussed in the previous section.
High-mass Cluster Galaxies (Scenario A.1)
We start with high-mass (log 10.5–11) galaxies, for which we consider two sub-pathways: pre-quenching outside the cluster (Figure 18, A.1, red quenched disk) and mass- or environmental-quenching within the cluster (Figure 18, A.1, spiral with yellow halo, orange disk gas, and star). Mass-quenching in high-mass galaxies is largely thought to be regulated by AGN feedback (e.g., [100,105,848,849,850,851]), which is likely the dominant quenching mechanism for this population at least up to group scales at [6]. Via infrared studies, we have seen that the high-mass end of the SMF of cluster SFGs and QGs maintains the same shape as the field SMFs (e.g., [388]), which could indicate similar evolutionary paths. In the GCLASS and GOGREEN clusters, high-mass cluster galaxies are quenched at the same percentage as the field at (Figure 6, e.g., [35]) and, at slightly higher redshift, the cluster infall regions are found to contain an overabundance of massive halos, with nearly all high-mass galaxies quenched before crossing [69]. The deficit of AGN in clusters (Section 5.4) limits the amount of mass-quenching via AGN feedback that can be witnessed in the cluster environment. These observations may support the pre-quenched pathway, i.e., that high-mass galaxies quench prior to entering cluster environments (as seen in simulations, e.g., [852]). This pathway may include quenching in groups (see Scenario B) or early quenching in proto-clusters, potentially due to environmentally-driven differences in the star formation histories of massive galaxies [853]. Both DSFGs, the likely progenitors of massive cluster ellipticals, and high-mass quenched galaxies have been observed in some systems.
On the other hand, FIR observations have identified obscured, high-mass SFGs in cluster cores at , which are largely on the MS (e.g., [523]). Is environmental quenching (as opposed to mass-quenching) effective once these massive SFGs fall into the cluster? Their deep potential wells suggest gas stripping may be weak or ineffective, (e.g., [88,822]); however, even weak heating or stripping in conjunction with high SFRs and feedback would drive overconsumption in excess of pure mass-quenching (e.g., [73,407]), as discussed in the main Scenario A. This is potentially consistent with the enhanced mass-quenching efficiency at low cluster-centric radii observed in cluster galaxies at 0.3–1 (see Figure 13 in [407]), though we note their mass bin spans log = 10–11.2 rather than isolating very massive galaxies. Thus, as with our representative cluster galaxy, infrared studies support a diverse range of scenarios for high-mass (proto-)cluster galaxies, potentially involving a combination of environmental and mass-quenching across field, group, cluster, and proto-cluster environments.
Low-Mass Cluster Galaxies: Stripping (Scenario A.2) or Overconsumption (Scenario A.3)?
At the other extreme, low-mass galaxies represent a key population in testing environmental quenching, as their quenching time in isolation can exceed the Hubble time (e.g., [382]). Gas stripping is expected to be effective on timescales much shorter than the gas depletion timescale for log 9–10 galaxies, given even moderate ram pressure and/or tidal interactions (e.g., [73,830,854,855,856,857,858]). Locally, outside-in quenching has been tentatively observed for this population (e.g., [112]) and NIR observations of the QG SMF low-mass slope and nonzero EQE strongly support environmental quenching at low masses (Section 4). In Figure 18, A.2, we show that low-mass galaxies can likely undergo near complete gas stripping and quenching before first passage of the cluster core (e.g., [20], and discussion therein).
On the other hand, RPS also depends on both orbital parameters and halo mass. RPS is most effective on radial orbits that bring galaxies into high-density areas at high speeds (e.g., [859]). For cluster galaxies on eccentric orbits, there is some evidence that gradual, long timescale RPS can occur [723], but also evidence from simulations that stripping is generally ineffective at quenching galaxies on eccentric orbits, even at low mass [822,859]. In this scenario (Figure 18, A.3), could low-mass galaxies quench via overconsumption? Even at high redshift, field low-mass galaxies maintain SFRs of ≲ yr (e.g., [130]). On the other hand, stellar feedback in dwarf galaxies has been invoked to reconcile the mismatch in dwarf galaxy abundance between simulations and observations [860]. Additionally, there is observational evidence of winds and galactic fountains in some dwarf galaxies (e.g., [861]), but the effectiveness and timescales are still unclear. From the infrared, environmental- and mass-quenching appear inter-dependent within for galaxies up to (Section 4.2; [407]), suggesting they should be treated simultaneously. Given the unique role of environment in quenching low-mass galaxies in general, this population warrants a renewed focus in light of the increased capabilities of future facilities (e.g., JWST; see Section 9).
The hydrodynamical and internal quenching mechanisms and their required conditions discussed in this section are listed in Figure 19 alongside a summary of supporting infrared evidence and open questions.
8.3. Scenario B: Pre-Processing and Galaxy Interactions
In the previous section, we discussed mock pathways in which hydrodynamical and internal processes operate on infalling and cluster galaxies over a range of stellar masses. Here we explore pre-processing and gravitational quenching mechanisms. These processes should not be thought of as wholly unrelated to hydrodynamical or internal quenching. As we are discovering, the (infrared) observational data can accommodate complex quenching pathways and, as such, we will continue to refer to mechanisms like stripping in this section’s discussion.
8.3.1. The Environment beyond the Virial Radius
Twenty to forty per cent of the galaxies in clusters at were likely accreted as a group or low-mass cluster [20,429]. In infrared observations, the star-forming fraction remains well below the field to large cluster-centric radii [407,421] and a low has been directly observed in groups falling into the LoCuSS clusters at [434]. Similarly, at , galaxies in the infall regions of clusters are found to live in comparatively massive halos with a overabundance of satellites and a high quenched fraction [69].
In Scenario B (Figure 18), we consider the conditions in a group halo that will eventually merge with a massive cluster. In the group environment, galaxies experience lower relative velocities, which could facilitate mergers and interactions. Group halos are within the shock heated regime (>), though the IGrM presents less extreme conditions (density, temperature) than in the ICM. Nevertheless, starvation is likely effective [83,815,862], particularly for low-mass galaxies with shallow potential wells. RPS may also occur, though observations are currently mixed: some works find gas stripping in groups [710,838,845,863] while others find none, even of the more extended HI reservoir [864,865]. The effects of gas stripping would likely take longer to realize in groups (∼3 Gyr for stripping, up to ≳5 Gyr for the SSFR; [866,867]), but could combine with overconsumption to speed along the process in high-mass galaxies.
Group pre-processing or extended cluster influence? (Scenario B.1)
That environmental quenching occurs in groups seems well supported by the observations (e.g., [434,838]), even if the mechanism remains unclear. However, as discussed in Section 4.2.2, we should be careful about ascribing all environmental effects outside the cluster to pre-processing in the group environment. It is common to define the virial radius as the “edge” of cluster influence; however, this assumption is not physically well motivated [868]. Recently, the steep dropoff in cluster matter density profiles has been termed the splashback radius (; [435,437,438,439]), a physically-motivated radius at which bound particles reach the apocenter52 of their orbit after first infall [869]. depends on the matter accretion rate onto the halo as well as redshift, such that slowly (rapidly) accreting halos at low-z (high-z) have a splashback radius up to 2× (1×) [439].
Is the splashback radius the boundary we should consider when separating cluster quenching from pre-processing? At low redshift, this is complicated by the backsplash population, which may be found up to 2–2.5 [436]. An additional complication is the unknown range of influence of the ICM. Gas infalling onto massive halos is expected to compress and form shocks (termed virial accretion shocks, e.g., [443,444]), which we consider in Figure 18, Scenario B.1. Such shocks are now supported by observational evidence in the form of high-energy gamma-ray rings around local clusters [870,871,872]. Using high-resolution, zoom-in simulations of 16 clusters, Zinger et al. [440] found that at virial accretion shocks were present out to 2–3 (see also [873,874,875,876,877,878,879]), and were effective at starting the process of starvation (see also [84,818,880,881]), with the effect of quenching some galaxies before crossing . They concluded that early starvation could dominate over pre-processing as a quenching mechanism in the infall regions [84,882,883]. Subsequent simulations suggest an even more dramatic effect, that RPS associated with virial accretion shocks can deplete molecular gas directly [441]. In the infrared, there is tentative evidence for molecular gas depletion out to at high redshift [680], which would lend itself to this scenario. However, the gas properties of cluster galaxies in that epoch are still poorly understood (see Section 6). Further complicating this picture are potential shocks from cluster mergers [884], and gas streams and cold fronts permeating the ICM [690,691]. As such, we must move forward cautiously in disentangling the effects of group pre-processing from cluster influence beyond the virial radius.
8.3.2. Gravitational Quenching in Group and Cluster Environments
Our last consideration is the role of gravitational quenching, facilitated by tidal interactions, fly-bys (harassment) and strong interactions, or major and minor mergers. Of these, the most well-studied is (major) mergers, and enhanced merger fractions have been reported across several cluster studies out to high redshift ([682,885,886,887,888,889], but see [890]). The causal link between mergers and quenching has been difficult to establish, however. In the field, local (gas-rich) mergers are thought to trigger starbursts (e.g., [891,892,893]) and AGN (e.g., [588,589,590,591,592]) by driving gas inflows into the nucleus, though the ability of a merger to drive inflows depends strongly on the details of the encounter ([894], see [59] in this Special Issue for a review on the local merger-AGN relationship). At high redshift, a link between mergers and AGN activity has not been cleanly established [93,94,95], which could be due to changing ISM conditions and enhanced gas fractions (e.g., [895,896]). It could also be due to the difficulties in merger identification, which is sensitive to the technique used and often biased against late-stage mergers, particularly at high redshift [897]. As AGN activity is expected to peak in the late stages of a merger (e.g., [96,898]) and is likely to be heavily obscured [593,594,595,596,899,900] or even Compton thick [901,902], we may be missing the connection with current capabilities. Harassment and interactions are even more difficult to establish, requiring high-resolution imaging to establish the presence of features such as asymmetries, bars, warped disks, which are then not unique signatures of harassment but point only to some perturbing force (i.e., RPS, tidal interactions).
In Figure 18, Scenario B, we consider a group, with some pre-processing, on infall into a cluster. Compared to gas stripping, the conditions for interactions/mergers are favorable in groups due to low relative velocities (e.g., [903,904,905]), and we postulate that some of the group members may merge before infall. By contrast, the high velocities in clusters may suppress merger activity while facilitating high speed fly-bys that accumulate into harassment. This is not entirely clear-cut, however. Recent analysis of the hydrodynamical simulation Illustris showed that, compared to isolated infalling galaxies, infalling group members retain lower relative velocities [906], which may facilitate mergers in cluster outskirts (e.g., [887]). As such, our Scenario B includes two group galaxies destined to merge after passing the cluster .
Will merging quench these galaxies? As stated earlier, the end result of merger activity is unclear; however, we can gain some context based on infrared observations. In terms of triggering star formation, as in local mergers, copious starbursting activity is disallowed as we typically observe cluster galaxies at all redshifts to be on or below the MS (Section 5). On the other hand, there is tentative evidence of an excess in the MIR AGN fraction in clusters at high redshift [523], for which a triggering mechanism is needed (Section 5.4). Enhanced interaction/merger fractions would be a natural explanation for this triggering and potential subsequent quenching by AGN feedback (e.g., [175]). Similarly, the centrally concentrated star formation and molecular gas observed in resolved studies of both local and high-redshift clusters [835,836] could be driven by gravitational mechanisms; however, Ikeda et al. [836] found no correlation between enhanced central SFE and close galaxy pairs.
Progress in understanding quenching by gravitational mechanisms will require more high-resolution studies and improved infrared capabilities, such as with JWST, in identifying merger and AGN activity in more obscured phases. Gravitational mechanisms in overdense environments likely also need to be invoked to explain morphological changes in cluster galaxies; however, that is a topic for another review. As in the previous section, pre-processing and gravitational quenching mechanisms and their required conditions are listed in Figure 19 with a summary of supporting infrared evidence and open questions.
9. Conclusions and Future Prospects
This review has presented the state of infrared studies investigating environmental influences on galaxy evolution in the most extreme regions, clusters and proto-clusters, out to high redshift. While the resounding conclusion is that environment plays an important role in driving quenching in excess of secular processes, it is also clear that current infrared evidence can accommodate a variety of quenching scenarios, with multiple mechanisms potentially acting concurrently, and with the dominant mechanism(s) likely changing over cosmic time. In Figure 19, we attempt to summarize the possible scenarios (discussed in some detail in Section 8) in terms of the more robust signatures from IR observations, along with listing some of the many open questions. As surveys and capabilities continue to expand and selection biases are mitigated, we will refine our understanding of these quenching pathways. While there is still much work to be done, the near-, mid-, and far-infrared regimes have provided unique perspectives, including quantifying quenching efficiencies, measuring radially-dependent obscured star formation rates, and probing spatially-resolved molecular gas reservoirs. Expanding on this work and continuing to unite it with powerful observables in other wavelength regimes is necessary to address the pressing questions that remain.
Thankfully, the future prospects for infrared studies of environment are promising, from cluster detection to cluster population analyses. In Section 3.1 and Section 3.2, we briefly mentioned some of the upcoming surveys and facilities that will expand the number of (proto-)cluster candidates selected in the NIR and via SZ and submm colors by orders of magnitude. These surveys will greatly broaden the dynamic range of our group and (proto-)cluster surveys and allow considerable binning by cluster properties, breaking the degeneracies between halo properties and galaxy properties discussed throughout this review. Overlap in (optical/)NIR and SZ selections will produce large samples with known redshifts and halo masses.
The sheer number of (proto-)cluster candidates will necessitate confirmation from wide-field spectroscopic surveys and analyses using statistical techniques such as the total light stacking, discussed in Section 7. Upcoming spectroscopic facilities with multiplexing and/or slitless capabilities (e.g., MOONS53 and ERIS54 on the Very Large Telescope (VLT), JWST, Euclid, Roman, and future Extreme Large Telescopes) will provide confirmation (and detailed characterization, see below) of populations in a moderate sample of clusters. On the more distant horizon, two proposed space missions would provide wide-field NIR spectroscopic follow-up: SPHEREx55 and ISCEA56. SPHEREx will conduct an all-sky spectral survey at ∼1–5 m, providing spectroscopic redshifts of known clusters up to [907]. ISCEA, funded for a NASA mission concept study, has the science goal of mapping large scale structure at cosmic noon and would observe 50 proto-cluster fields on >10 Mpc scales, gathering spectra for ∼1000 galaxies per field over 1–2 m and mapping the 3D cosmic web with better than 50 km s resolution [908]. In the redshift range ∼1–2, ISCEA would measure the H and H emission lines to a few solar masses per year in SFR, mitigating the effects of dust extinction discussed throughout this review.
Targeted follow-up will continue to play an outsized role in understanding cluster populations. Of particular importance in disentangling environmental processes is understanding the behavior of gas, particularly the cold molecular gas that fuels star formation. Interferometers such as ALMA and NOEMA will continue to be invaluable on this front, particularly via resolved studies; however, it is imperative that we also utilize the more wide-field capabilities of single-dish submm observatories [909]. For example, the 50-m Large Millimeter Telescope (LMT) will offer 5 spatial resolution at 1–2 mm via its new bolometer camera TolTEC57, with fast mapping speeds (see also NIKA258 on IRAM, MUSTANG2 on GBT59, and the proposed Atacama Large Aperture Submillimeter Telescope (AtLAST; [912])). This will enable us to quantify the dust in cluster galaxies to and obscured star formation at higher redshift. Resolving the contention in the gas-to-dust ratio in overdense environments and the gas and dust scale lengths relevant for stripping processes (Section 6) is then paramount to (re-)calibrate dust as a molecular gas proxy and/or establish cold dust content as a unique signature of stripping.
There are other areas where we are poised to make great strides. Slit and slitless spectroscopy (and narrow/medium band imaging) via
JWST and sensitive, large FOV ground-based NIR spectrographs will return highly complete cluster catalogs; for example, JWST can detect and spatially resolve the Pa or Pa emission lines − robust SFR tracers with minimal dust extinction—to a few solar masses per year in just a few hours at 1–260. This will account for previously missed obscured and low-mass cluster members. Indeed, we have emphasized in several contexts that low-mass galaxies (and populations like AGN) may be key to understanding environmental quenching. With the successful launch and commissioning of JWST, we now have a unique opportunity to efficiently carry out global and local environmental studies to . In a similar vein, JWST’s mid-infrared capabilities will revolutionize our understanding of AGN populations by revealing and characterizing obscured supermassive black holes to cosmic noon and beyond. JWST further provides the high-resolution (0.06–0.1), sensitive rest-frame NIR imaging needed to robustly quantify merger and interaction rates and tie these processes to the triggering of star formation and AGN across different environments and spanning cosmic time. Given our current and upcoming capabilities, the infrared will continue to deliver a wealth of information regarding the role of environment in shaping the evolution of galaxies.
Author Contributions
The overall conceptualization and formulation of section content was done in discussion between both authors. S.A. was primarily responsible for the writing, with A.N. writing Section 6 and substantially contributing to Section 1, Section 4, Section 5 and Section 8, as well as overall editing. All authors have read and agreed to the published version of the manuscript.
Funding
This research received no external funding.
Institutional Review Board Statement
Not applicable.
Informed Consent Statement
Not applicable.
Data Availability Statement
Not applicable.
Acknowledgments
The authors first thank Anna Sajina and Asantha Cooray for organizing this Special Issue, as well as Yi-Kuan Chiang, Anthony Gonzalez, Kyoung-Soo Lee, Adam Muzzin, Irene Pintos-Castro, Alex Pope, George Rieke, Alex Van Engelen, Tracy Webb, and Jorge Zavala for valuable content editing, discussions, and suggestions. We further thank Jianwei Lyu, Kana Morokuma-Matui, Alex Pigarelli, Irene Pintos-Castro, and Damien Spérone-Longin for assistance with data catalogs and figures. We are also grateful to the original authors of many of the figures shown here for giving us permission to reproduce their work for this review. S.A. acknowledges support from the James Webb Space Telescope (JWST) Mid-Infrared Instrument (MIRI) Science Team Lead, grant 80NSSC18K0555, from NASA Goddard Space Flight Center to the University of Arizona. A.N. gratefully acknowledges support from the Beus Center for Cosmic Foundations at Arizona State University, from the NSF through award SOSPA7-025 from the NRAO, and from HST program number GO-16300. Support for program number GO-16300 was provided by NASA through grants from the Space Telescope Science Institute, which is operated by the Association of Universities for Research in Astronomy, Incorporated, under NASA contract NAS5-26555. This review made use of the following software: NumPy [913], Matplotlib [914], Astropy [915], pandas [916], seaborn [917], CMasher [918], a3cosmos-gas-evolution [919].
Conflicts of Interest
The authors declare no conflict of interest.
Abbreviations
The following abbreviations are used in this manuscript:
| 2MASS | Two Micron All Sky Survey |
| ACT | Atacama Cosmology Telescope |
| AGES | Spectroscopy from the AGN and Galaxy Evolution Survey |
| AGN | Active Galactic Nuclei |
| AlFoCS | ALMA Fornax Cluster Survey |
| ALMA | Atacama Large Millimeter Array |
| ATCA | Australia Compact Array |
| AtLAST | Atacama Large Aperture Submillimeter Telescope |
| BCG | Brightest Cluster Galaxy |
| BGG | Brightest Group Galaxy |
| BIMA | Berkeley Illinois Maryland Association |
| [Ci] | Neutral Atomic Carbon |
| CO | Carbon Monoxide |
| COLD GASS | CO Legacy Database for GASS |
| COSMOS | Cosmic Evolution Survey |
| CT | Compton-thick (AGN) |
| DECaLS | Dark Energy Camera Legacy Survey |
| DES | Dark Energy Survey |
| DGR | Dust-to-Gas Ratio |
| DM | Dark Matter |
| (Hot) DOGs | (Hot) Dust-obscured Galaxies |
| DRC | Distant Red Core |
| EDisCs | ESO Distant Cluster Survey |
| EQE | Environmental Quenching Efficiency |
| ERCSC | Planck Early Release Compact Source Catalog |
| ERIS | Enhanced Resolution Imager and Spectrograph |
| ETG | Early-Type Galaxy |
| FOV | Field-of-view |
| GASP | GAs Stripping Phenomena in galaxies survey |
| GBT | Green Bank Telescope |
| GCLASS | Gemini Cluster Astrophysics Spectroscopic Survey |
| GOGREEN | Gemini Observations of Galaxies in Rich Early Environments |
| H | Molecular Hydrogen |
| HERACLES | HERA CO-Line Extragalactic Survey |
| HerMES | Herschel Multi-tiered Extragalactic Survey |
| HeViCS | Herschel Virgo Cluster Survey |
| [Hi] | Neutral Atomic Hydrogen |
| HRS | Herschel Reference Survey |
| HSC-SSP | Hyper-Surprime Cam-Subaru Strategic Program |
| ICBS | IMACS Cluster Building Survey |
| ICD | Intra-cluster Dust |
| ICM | Intra-cluster Medium |
| IGrM | Intra-group Medium |
| IMF | Initial Mass Function |
| (N/M/F)IR | (Near/Mid/Far-)Infrared |
| IRAM | Institut de Radioastronomie Millimètrique |
| IRAS | InfraRed Astronomy Satellite |
| IRS | InfraRed Spectrograph |
| ISCS/IDCS | IRAC Shallow and Distant Cluster Surveys |
| ISO | Infrared Space Observatory |
| ISS | IRAC Shallow Survey |
| JCMT | James Clerk Maxwell Telescope |
| JVLA | Karl G. Jansky Very Large Array |
| JWST | James Webb Space Telescope |
| LAE | Lyman- Emitter |
| LABOCA | Large Apex BOlometer CAmera |
| LF | Luminosity Function |
| LMT | Large Millimeter Telescope/Gran Telescopio Milimétrico Alfonso Serrano |
| LoCuSS | Local Cluster Substructure Survey |
| MaDCoWS | Massive and Distant Clusters of WISE Survey |
| MAGAZ3NE | Massive Ancient Galaxies At z > 3 NEar-infrared |
| MIPS | Multi-Band Imaging Photometer |
| MOONS | Multi-Object Optical and Near-infrared Spectrograph for Spitzer |
| MS | Main Sequence |
| MUSE | Multi-Unit Spectroscopic Explorer |
| NDWFS | NOAO Deep Wide-Field Survey |
| NFW | Navarro-Frenk-White (profile) |
| NGLS | Nearby Galaxies Legacy Survey |
| NIKA2 | New IRAM KID Arrays 2 |
| NOEMA | NOrthern Extended Millimeter Array |
| NMBS | NEWFIRM Medium-Band Survey |
| ORELSE | Observations of Redshift Evolution in Large-Scale Environments |
| PACS | Photodetector Array Camera & Spectrometer |
| Pan-STARRS | Panoramic Survey Telescope and Rapid Response System |
| PCCS(2) | (Second) Planck Catalogue of Compact Sources |
| PdBI | Plateau de Bure Interferometer |
| PHIBSS | Plateau de Bure High-z Blue Sequence Survey |
| PICO | Probe of Inflation and Cosmic Origins |
| Photo-z | Photometric Redshift |
| QG | Quiescent Galaxy |
| RPS | Ram Pressure Stripping |
| RS | Red Sequence |
| SCUBA | Submillimeter Common-User Bolometer Array |
| SDSS | Sloan Digital Sky Survey |
| SDWFS | Spitzer Deep Wide-field Survey |
| SED | Spectral Energy Distribution |
| SEEDisCS | Spatially Extended EDisCS Survey |
| SF | Star Formation |
| SFE | Star Formation Efficiency |
| (D)SFG | (Dusty) Star-Forming Galaxy |
| SFR | Star Formation Rate |
| SFRD | Star Formation Rate Density |
| SHELA | Spitzer-HETDEX Exploratory Large Area survey |
| SLED | Spectral Line Energy Distribution |
| SMG | Sub-Millimeter Galaxy |
| SMF | Stellar Mass Function |
| Spec-z | Spectroscopic Redshift |
| SpARCS | Spitzer Adaptation of the Red-sequence Cluster Survey |
| SPIRE | Spectral and Photometric Imaging REceiver |
| SPT | South Pole Telescope |
| SSDF | Spitzer South Pole Telescope Deep Field |
| SSFR | Specific-Star Formation Rate |
| Submm | Submillimeter |
| SWIRE | Spitzer Wide-area InfraRed Extragalactic survey |
| SZ | Sunyaev-Zel’dovich (Effect) |
| (U)LIRG | (Ultra-)Luminous Infrared Galaxy |
| UMG | Ultra-Massive Galaxy |
| UV | Ultraviolet |
| VERTICO | Virgo Environment Traced in CO survey |
| VLT | Very Large Telescope |
| WINGS | WIde-Field Nearby Galaxy-cluster Survey |
| WISE | Wide-field Infrared Survey Explorer |
| 1 | |
| 2 | |
| 3 | |
| 4 | |
| 5 | We note that starvation is likely a form of mild RPS that effects hot halo gas and not a fully distinct process. However, for convenience, we refer to stripping of cold disk gas as RPS throughout this review. |
| 6 | The star-forming Main Sequence (MS; [113,114,115,116]) is the observed correlation between the star formation and stellar mass of a galaxy, which exhibits low scatter (∼0.3 dex) and a trend in the SFR per unit mass which increases with increasing redshift. The latter results in the SFR for a MS galaxy rising by two orders of magnitude from to (see Schreiber and Wuyts [117] and references therein). |
| 7 | Sizes, morphologies, and disturbed features (indicating galaxy interactions) can be identified in the rest-NIR up to with the current capabilities of HST. These measurements, however, are known to be sensitive to dust at the short wavelengths typically probed (e.g., [120]); this uncertainty will be addressed by upcoming observations with JWST (Section 9). As such, we will not attempt a full overview of these measurements in this review, though they may be discussed in supporting contexts. |
| 8 | H can emit radiation through the quadrupole moment, but these transitions have low probabilities and require high excitation energies. |
| 9 | Assuming an NFW profile with a concentration [152]. See Section 7.2.2 for an expanded definition of the NFW profile and concentration parameter. |
| 10 | |
| 11 | Referenced Surveys: the Massive and Distant Clusters of WISE Survey (MaDCoWS; [209], the Panoramic Survey Telescope and Rapid Response System (Pan-STARRS; [214])), SuperCOSMOS [215], the Dark Energy Camera Legacy Survey (DECaLS; PI: D. Schlegel and A. Dey), CatWISE2020 [216], the Two Micron All Sky Survey (2MASS; [217]), the Sloan Digital Sky Survey (SDSS; [218]), unWISE [219], the Hyper-Surprime Cam-Subaru Strategic Program (HSC-SSP; [220]), and the Dark Energy Survey (DES; [221]). |
| 12 | The SZ effect is comprised of two components: the thermal component due to the random thermal motions of electrons and a kinetic component from the bulk gas motion relative to the CMB. For galaxy clusters, the thermal component dominates and as such as we will not discuss the kinetic SZ. |
| 13 | Galaxy bias is the statistical relation between the spatial distribution of a galaxy population and the underlying dark matter density field. Bias is strongly dependent on the galaxy population being observed. |
| 14 | Cosmic Evolution Survey (COSMOS; [276]). |
| 15 | |
| 16 | The Herschel Multi-tiered Extragalactic Survey (HerMES; [359]). |
| 17 | Spectral and Photometric Imaging Receiver (SPIRE [369]). |
| 18 | |
| 19 | |
| 20 | |
| 21 | |
| 22 | Observations of Redshift Evolution in Large-Scale Environments (ORELSE; [403]). |
| 23 | |
| 24 | Backsplash galaxies are gravitationally-bound cluster members that have completed their first pass of the cluster center and are on orbits taking them back into the cluster outskirts and infall regions [435]. |
| 25 | Multi-Band Imaging Photometer for Spitzer (MIPS; [468]). |
| 26 | The Local Cluster Substructure Survey (LoCuSS; [473]). |
| 27 | An observational (projected) caustic or phase space diagram uses the line-of-sight velocities relative to the cluster velocity dispersion and cluster-centric radii relative to the virial radius of a cluster population to kinematically separate galaxies by their time since infall (e.g., [486,487,488]). Simulations show projected phase space is in good agreement with theoretical full 3D phase space diagrams (e.g., [489,490]). |
| 28 | A “delayed, then rapid” model, in which SFRs are unaltered for some delay time upon infall followed by quenching on short timescales, was first proposed in Wetzel et al. [492]. |
| 29 | Photodetector Array Camera & Spectrometer (PACS; [519]). |
| 30 | Multi-Unit Spectroscopic Explorer (MUSE; [540]). |
| 31 | |
| 32 | We note the uncertainties that arise from the CO-H conversion could result in increased , see Section 6. |
| 33 | Given a high individual SFRs (> yr, discussed in Section 5.3), a “long” lifetime would be limited to <500 Myr so as not to exceed a final mass of log . |
| 34 | |
| 35 | Institut de Radioastronomie Millimétrique (IRAM; [610]). |
| 36 | The mass-weighted dust temperature represents the temperature of the dominant (by mass) cold dust component. It is typically lower than the luminosity-weighted temperature measured from the peak of the FIR SED. |
| 37 | Local studies have shown that the dust mass is a good tracer of total (Hi+H) gas mass in Hi dominated galaxies [620]. As Hi cannot yet be observed beyond low redshift, high-redshift calibrations of dust as a gas proxy are largely based on CO and are often stated to represent the molecular component. This is likely reasonable as high-z galaxies are thought to be dominated by H (see Schreiber and Wuyts [117] and references therein); however, this remains an unknown systematic. |
| 38 | This calibration may no longer be valid at high redshifts where the cosmic background boosts galaxy dust temperatures. |
| 39 | There was some evidence that Fornax cluster galaxies in Horellou et al. [646] had weaker CO emission compared to the atomic gas content, but the amount was typical given their low star formation rates. |
| 40 | See also Young and Scoville [650] for a compilation of individual detections at that time. |
| 41 | Berkeley Illinois Maryland Association (BIMA; [657]). |
| 42 | There is a deficit of CO cluster studies from , which might be partially due to broad oxygen and water vapor absorption bands at 120 and 183 GHz, limiting continuous coverage of CO () and () at 0.8–0.9. |
| 43 | CO () was detected in 8 galaxies total in the Coogan et al. [682] study, but some lacked stellar masses and SFR estimates in order to determine how their gas fractions compare to the field-scaling relations. |
| 44 | See also Daddi et al. [693] for starburst-like excitation in CO within BzK field galaxies. |
| 45 | HERA CO-Line Extragalactic Survey (HERACLES; [712]). |
| 46 | InfraRed Spectrograph (IRS; [726]). |
| 47 | Total light stacking is the stacking of image cutouts large enough to contain entire (proto-)cluster structures, rather than stacking on individual galaxies within the (proto)clusters. |
| 48 | A note of caution: in reality MIR/FIR emission is a summation of a series of blackbodies at different temperatures representing different dust grain sizes and compositions. The observed dust temperature, however, is usually reported as a single, luminosity-weighted temperature or a more robust two-temperature model including “warm” and “cold” components [773]. In this review, we primarily discuss the commonly-used effective dust temperature, , derived from modeling a modified blackbody plus MIR power law [621,774,775]. |
| 49 | Simulation predictions were calculated using the Colossus python toolkit [813]; http://www.benediktdiemer.com/code/colossus/, accessed on 16 April 2022. |
| 50 | To be accurate, an NFW profile was found to fit the far-IR at ≳0.3 Mpc, with a relative deficit at smaller radii relative to the near-IR profile [779]. |
| 51 | We note that many studies refer to this stripping as ram pressure stripping. For ease of discussion, we have defined and refer to starvation as heating and/or removal (i.e., through stripping, tidal interactions, evaporation) of the hot halo gas and RPS as the (ram pressure) stripping of cold atomic or molecular disk gas. |
| 52 | The apocenter is the point of an orbit farthest from the center of attraction. |
| 53 | Multi-Object Optical and Near-infrared Spectrograph; https://vltmoons.org/, accessed on 2 September 2022. |
| 54 | Enhanced Resolution Imager and Spectrograph; https://www.eso.org/sci/facilities/develop/instruments/eris.html, accessed on 2 September 2022. |
| 55 | SPHEREx; https://spherex.caltech.edu/, accessed on 2 September 2022. |
| 56 | Infrared Satellite for Cluster Evolution Astrophysics; https://iscea.ipac.caltech.edu/, accessed on 2 September 2022. |
| 57 | Commissioning in 2022, http://toltec.astro.umass.edu/, accessed on 2 September 2022. |
| 58 | New IRAM KID Arrays 2 (NIKA2; [910]). |
| 59 | MUSTANG2 [911], Green Bank Telescope (GBT). |
| 60 | For example, see JWST Cycle 1 GO Program 1572 https://www.stsci.edu/jwst/science-execution/program-information.html?id=1572, accessed on 2 September 2022. |
References
- Dressler, A. Galaxy Morphology in Rich Clusters: Implications for the Formation and Evolution of Galaxies. Astrophys. J. 1980, 236, 351–365. [Google Scholar] [CrossRef]
- Postman, M.; Geller, M.J. The Morphology-Density Relation—The Group Connection. Astrophys. J. 1984, 281, 95–99. [Google Scholar] [CrossRef]
- Dressler, A.; Oemler, A., Jr.; Couch, W.J.; Smail, I.; Ellis, R.S.; Barger, A.; Butcher, H.; Poggianti, B.M.; Sharples, R.M. Evolution since z = 0.5 of the Morphology-Density Relation for Clusters of Galaxies. Astrophys. J. 1997, 490, 577–591. [Google Scholar] [CrossRef] [Green Version]
- Dressler, A. The Evolution of Galaxies in Clusters. Annu. Rev. Astron. Astrophys. 1984, 22, 185. [Google Scholar] [CrossRef]
- Lewis, I.; Balogh, M.; De Propris, R.; Couch, W.; Bower, R.; Offer, A.; Bland-Hawthorn, J.; Baldry, I.K.; Baugh, C.; Bridges, T.; et al. The 2dF Galaxy Redshift Survey: The Environmental Dependence of Galaxy Star Formation Rates near Clusters. Mon. Not. R. Astron. Soc. 2002, 334, 673–683. [Google Scholar] [CrossRef]
- Peng, Y.j.; Lilly, S.J.; Kovač, K.; Bolzonella, M.; Pozzetti, L.; Renzini, A.; Zamorani, G.; Ilbert, O.; Knobel, C.; Iovino, A.; et al. Mass and environment as drivers of galaxy evolution in sdss and zcosmos and the origin of the schechter function. Astrophys. J. 2010, 721, 193–221. [Google Scholar] [CrossRef]
- Solanes, J.M.; Manrique, A.; García-Gómez, C.; González-Casado, G.; Giovanelli, R.; Haynes, M.P. The H I Content of Spirals. II. Gas Deficiency in Cluster Galaxies. Astrophys. J. 2001, 548, 97–113. [Google Scholar] [CrossRef] [Green Version]
- Gavazzi, G.; Boselli, A.; van Driel, W.; O’Neil, K. Completing H I Observations of Galaxies in the Virgo Cluster. Astron. Astrophys. 2005, 429, 439–447. [Google Scholar] [CrossRef]
- Catinella, B.; Schiminovich, D.; Cortese, L.; Fabello, S.; Hummels, C.B.; Moran, S.M.; Lemonias, J.J.; Cooper, A.P.; Wu, R.; Heckman, T.M.; et al. The GALEX Arecibo SDSS Survey—VIII. Final Data Release. The Effect of Group Environment on the Gas Content of Massive Galaxies. Mon. Not. R. Astron. Soc. 2013, 436, 34–70. [Google Scholar] [CrossRef] [Green Version]
- Jaffé, Y.L.; Verheijen, M.A.W.; Haines, C.P.; Yoon, H.; Cybulski, R.; Montero-Castaño, M.; Smith, R.; Chung, A.; Deshev, B.Z.; Fernández, X.; et al. BUDHIES—III: The Fate of H I and the Quenching of Galaxies in Evolving Environments. Mon. Not. R. Astron. Soc. 2016, 461, 1202–1221. [Google Scholar] [CrossRef]
- Fumagalli, M.; Krumholz, M.R.; Prochaska, J.X.; Gavazzi, G.; Boselli, A. Molecular Hydrogen Deficiency in H I-poor Galaxies and Its Implications for Star Formation. Astrophys. J. 2009, 697, 1811–1821. [Google Scholar] [CrossRef]
- Boselli, A.; Gavazzi, G. On the Origin of the Faint-End of the Red Sequence in High-Density Environments. Astron. Astrophys. Rev. 2014, 22, 74. [Google Scholar] [CrossRef] [Green Version]
- Boselli, A.; Gavazzi, G. Environmental Effects on Late-Type Galaxies in Nearby Clusters. Publ. Astron. Soc. Pac. 2006, 118, 517–559. [Google Scholar] [CrossRef]
- Cybulski, R.; Yun, M.S.; Fazio, G.G.; Gutermuth, R.A. From Voids to Coma: The Prevalence of Pre-Processing in the Local Universe. Mon. Not. R. Astron. Soc. 2014, 439, 3564–3586. [Google Scholar] [CrossRef] [Green Version]
- Gavazzi, G.; Fumagalli, M.; Cucciati, O.; Boselli, A. A Snapshot on Galaxy Evolution Occurring in the Great Wall: The Role of Nurture at z = 0. Astron. Astrophys. 2010, 517, A73. [Google Scholar] [CrossRef] [Green Version]
- Mahajan, S.; Haines, C.P.; Raychaudhury, S. Star Formation, Starbursts and Quenching across the Coma Supercluster. Mon. Not. R. Astron. Soc. 2010, 404, 1745–1760. [Google Scholar] [CrossRef] [Green Version]
- Gerke, B.F.; Newman, J.A.; Davis, M.; Coil, A.L.; Cooper, M.C.; Dutton, A.A.; Faber, S.M.; Guhathakurta, P.; Konidaris, N.; Koo, D.C.; et al. The deep2 galaxy redshift survey: The voronoi-delaunay method catalog of galaxy groups. Astrophys. J. 2012, 751, 50. [Google Scholar] [CrossRef] [Green Version]
- Knobel, C.; Lilly, S.J.; Iovino, A.; Kovač, K.; Bschorr, T.J.; Presotto, V.; Oesch, P.A.; Kampczyk, P.; Carollo, C.M.; Contini, T.; et al. THE zCOSMOS 20k GROUP CATALOG. Astrophys. J. 2012, 753, 121. [Google Scholar] [CrossRef] [Green Version]
- Tempel, E.; Kipper, R.; Tamm, A.; Gramann, M.; Einasto, M.; Sepp, T.; Tuvikene, T. Friends-of-Friends Galaxy Group Finder with Membership Refinement. Application to the Local Universe. Astron. Astrophys. 2016, 588, A14. [Google Scholar] [CrossRef] [Green Version]
- Boselli, A.; Fossati, M.; Sun, M. Ram pressure stripping in high-density environments. Annu. Rev. Astron. Astrophys. 2022, 30, 3. [Google Scholar] [CrossRef]
- Chiang, Y.K.; Overzier, R.A.; Gebhardt, K.; Henriques, B. Galaxy Protoclusters as Drivers of Cosmic Star Formation History in the First 2 Gyr. Astrophys. J. 2017, 844, L23. [Google Scholar] [CrossRef] [Green Version]
- Fraser-McKelvie, A.; Brown, M.J.I.; Pimbblet, K.; Dolley, T.; Bonne, N.J. Multiple Mechanisms Quench Passive Spiral Galaxies. Mon. Not. R. Astron. Soc. 2018, 474, 1909–1921. [Google Scholar] [CrossRef]
- Coccato, L.; Jaffé, Y.L.; Cortesi, A.; Merrifield, M.; Johnston, E.; Rodríguez del Pino, B.; Haeussler, B.; Chies-Santos, A.L.; Mendes de Oliveira, C.L.; Sheen, Y.K.; et al. Formation of S0s in Extreme Environments I: Clues from Kinematics and Stellar Populations. Mon. Not. R. Astron. Soc. 2020, 492, 2955–2972. [Google Scholar] [CrossRef] [Green Version]
- De Lucia, G. How ‘Heredity’ and ‘Environment’ Shape Galaxy Properties. Cosm. Front. ASP Conf. Ser. 2007, 379, 257. [Google Scholar]
- Blanton, M.R.; Moustakas, J. Physical Properties and Environments of Nearby Galaxies. Annu. Rev. Astron. Astrophys. 2009, 47, 159. [Google Scholar] [CrossRef] [Green Version]
- Davies, J.I.; Baes, M.; Bendo, G.J.; Bianchi, S.; Bomans, D.J.; Boselli, A.; Clemens, M.; Corbelli, E.; Cortese, L.; Dariush, A.; et al. The Herschel Virgo Cluster Survey. I. Luminosity Function. Astron. Astrophys. 2010, 518, L48. [Google Scholar] [CrossRef] [Green Version]
- Brown, T.; Wilson, C.D.; Zabel, N.; Davis, T.A.; Boselli, A.; Chung, A.; Ellison, S.L.; Lagos, C.D.P.; Stevens, A.R.H.; Cortese, L.; et al. VERTICO: The Virgo Environment Traced in CO Survey. Astrophys. J. Suppl. Ser. 2021, 257, 21. [Google Scholar] [CrossRef]
- Zabel, N.; Brown, T.; Wilson, C.D.; Davis, T.A.; Cortese, L.; Parker, L.C.; Boselli, A.; Catinella, B.; Chown, R.; Chung, A.; et al. VERTICO II: Effects of HI-identified Environmental Mechanisms on Molecular Gas. Astrophys. J. 2022, 933, 10. [Google Scholar] [CrossRef]
- Zabel, N.; Davis, T.A.; Smith, M.W.L.; Maddox, N.; Bendo, G.J.; Peletier, R.; Iodice, E.; Venhola, A.; Baes, M.; Davies, J.I.; et al. The ALMA Fornax Cluster Survey I: Stirring and Stripping of the Molecular Gas in Cluster Galaxies. Mon. Not. R. Astron. Soc. 2019, 483, 2251–2268. [Google Scholar] [CrossRef] [Green Version]
- Poggianti, B.M.; Moretti, A.; Gullieuszik, M.; Fritz, J.; Jaffé, Y.; Bettoni, D.; Fasano, G.; Bellhouse, C.; Hau, G.; Vulcani, B.; et al. GASP. I. Gas Stripping Phenomena in Galaxies with MUSE. Astrophys. J. 2017, 844, 48. [Google Scholar] [CrossRef] [Green Version]
- Moretti, A.; Paladino, R.; Poggianti, B.M.; Serra, P.; Roediger, E.; Gullieuszik, M.; Tomičić, N.; Radovich, M.; Vulcani, B.; Jaffé, Y.L.; et al. GASP. XXII. The Molecular Gas Content of the JW100 Jellyfish Galaxy at z ∼ 0.05: Does Ram Pressure Promote Molecular Gas Formation? Astrophys. J. 2020, 889, 9. [Google Scholar] [CrossRef]
- Butcher, H.; Oemler, A., Jr. The Evolution of Galaxies in Clusters. V. A Study of Populations since Z 0.5. Astrophys. J. 1984, 285, 426–438. [Google Scholar] [CrossRef]
- Overzier, R.A. The Realm of the Galaxy Protoclusters: A Review. Astron. Astrophys. Rev. 2016, 24, 14. [Google Scholar] [CrossRef]
- Muzzin, A.; Wilson, G.; Yee, H.K.C.; Gilbank, D.; Hoekstra, H.; Demarco, R.; Balogh, M.; van Dokkum, P.; Franx, M.; Ellingson, E.; et al. The gemini cluster astrophysics spectroscopic survey (gclass): The role of environment and self-regulation in galaxy evolution at z ∼ 1. Astrophys. J. 2012, 746, 188. [Google Scholar] [CrossRef] [Green Version]
- Balogh, M.L.; McGee, S.L.; Mok, A.; Muzzin, A.; van der Burg, R.F.J.; Bower, R.G.; Finoguenov, A.; Hoekstra, H.; Lidman, C.; Mulchaey, J.S.; et al. Evidence for a Change in the Dominant Satellite Galaxy Quenching Mechanism at z = 1. Mon. Not. R. Astron. Soc. 2016, 456, 4364–4376. [Google Scholar] [CrossRef] [Green Version]
- Matharu, J.; Muzzin, A.; Brammer, G.B.; Nelson, E.J.; Auger, M.W.; Hewett, P.C.; van der Burg, R.; Balogh, M.; Demarco, R.; Marchesini, D.; et al. HST/WFC3 Grism Observations of z 1 Clusters: Evidence for Rapid Outside-in Environmental Quenching from Spatially Resolved Hα Maps. Astrophys. J. 2021, 923, 222. [Google Scholar] [CrossRef]
- Gardner, J.P.; Mather, J.C.; Clampin, M.; Doyon, R.; Greenhouse, M.A.; Hammel, H.B.; Hutchings, J.B.; Jakobsen, P.; Lilly, S.J.; Long, K.S.; et al. Science with the James Webb space telescope. In Proceedings of the SPIE, Orlando, FL, USA, 16 June 2006; Mather, J.C., MacEwen, H.A., de Graauw, M.W.M., Eds.; SPIE: Bellingham, WA, USA, 2006; Volume 6265, p. 62650N. [Google Scholar] [CrossRef] [Green Version]
- Neugebauer, G.; Habing, H.J.; van Duinen, R.; Aumann, H.H.; Baud, B.; Beichman, C.A.; Beintema, D.A.; Boggess, N.; Clegg, P.E.; de Jong, T.; et al. The Infrared Astronomical Satellite (IRAS) Mission. Astrophys. J. 1984, 278, L1–L6. [Google Scholar] [CrossRef] [Green Version]
- Kessler, M.F.; Steinz, J.A.; Anderegg, M.E.; Clavel, J.; Drechsel, G.; Estaria, P.; Faelker, J.; Riedinger, J.R.; Robson, A.; Taylor, B.G.; et al. The Infrared Space Observatory (ISO) Mission. Astron. Astrophys. 1996, 315, L27–L31. [Google Scholar] [CrossRef]
- Werner, M.W.; Roellig, T.L.; Low, F.J.; Rieke, G.H.; Rieke, M.; Hoffmann, W.F.; Young, E.; Houck, J.R.; Brandl, B.; Fazio, G.G.; et al. The Spitzer Space Telescope Mission. Astrophys. J. Suppl. Ser. 2004, 154, 1–9. [Google Scholar] [CrossRef] [Green Version]
- Wright, E.L.; Eisenhardt, P.R.M.; Mainzer, A.K.; Ressler, M.E.; Cutri, R.M.; Jarrett, T.; Kirkpatrick, J.D.; Padgett, D.; McMillan, R.S.; Skrutskie, M.; et al. The Wide-field Infrared Survey Explorer (WISE): Mission Description and Initial On-orbit Performance. Astron. J. 2010, 140, 1868–1881. [Google Scholar] [CrossRef]
- Pilbratt, G.L.; Riedinger, J.R.; Passvogel, T.; Crone, G.; Doyle, D.; Gageur, U.; Heras, A.M.; Jewell, C.; Metcalfe, L.; Ott, S.; et al. Herschel Space Observatory. An ESA Facility for Far-Infrared and Submillimetre Astronomy. Astron. Astrophys. 2010, 518, L1. [Google Scholar] [CrossRef] [Green Version]
- Murakami, H.; Baba, H.; Barthel, P.; Clements, D.L.; Cohen, M.; Doi, Y.; Enya, K.; Figueredo, E.; Fujishiro, N.; Fujiwara, H.; et al. The Infrared Astronomical Mission AKARI*. Publ. Astron. Soc. Jpn. 2007, 59, S369–S376. [Google Scholar] [CrossRef] [Green Version]
- Planck Collaboration; Ade, P.A.R.; Aghanim, N.; Arnaud, M.; Ashdown, M.; Aumont, J.; Baccigalupi, C.; Baker, M.; Balbi, A.; Banday, A.J.; et al. Planck Early Results. I. The Planck Mission. Astron. Astrophys. 2011, 536, A1. [Google Scholar] [CrossRef] [Green Version]
- Holland, W.S.; Robson, E.I.; Gear, W.K.; Cunningham, C.R.; Lightfoot, J.F.; Jenness, T.; Ivison, R.J.; Stevens, J.A.; Ade, P.A.R.; Griffin, M.J.; et al. SCUBA: A Common-User Submillimetre Camera Operating on the James Clerk Maxwell Telescope. Mon. Not. R. Astron. Soc. 1999, 303, 659–672. [Google Scholar] [CrossRef] [Green Version]
- Holland, W.S.; Bintley, D.; Chapin, E.L.; Chrysostomou, A.; Davis, G.R.; Dempsey, J.T.; Duncan, W.D.; Fich, M.; Friberg, P.; Halpern, M.; et al. SCUBA-2: The 10,000 Pixel Bolometer Camera on the James Clerk Maxwell Telescope. Mon. Not. R. Astron. Soc. 2013, 430, 2513–2533. [Google Scholar] [CrossRef]
- Wilson, G.W.; Austermann, J.E.; Perera, T.A.; Scott, K.S.; Ade, P.A.R.; Bock, J.J.; Glenn, J.; Golwala, S.R.; Kim, S.; Kang, Y.; et al. The AzTEC Mm-Wavelength Camera. Mon. Not. R. Astron. Soc. 2008, 386, 807–818. [Google Scholar] [CrossRef] [Green Version]
- Siringo, G.; Kreysa, E.; Kovács, A.; Schuller, F.; Weiß, A.; Esch, W.; Gemünd, H.P.; Jethava, N.; Lundershausen, G.; Colin, A.; et al. The Large APEX BOlometer CAmera LABOCA. Astron. Astrophys. 2009, 497, 945. [Google Scholar] [CrossRef]
- Hughes, D.H.; Jáuregui Correa, J.C.; Schloerb, F.P.; Erickson, N.; Romero, J.G.; Heyer, M.; Reynoso, D.H.; Narayanan, G.; Perez-Grovas, A.S.; Souccar, K.; et al. The Large Millimeter Telescope. In Proceedings of the Ground-based and Airborne Telescopes III; Stepp, L.M., Gilmozzi, R., Hall, H.J., Eds.; SPIE: Bellingham, WA, USA, 2010; Volume 7733, p. 773312. Available online: https://spie.org/Publications/Proceedings/Volume/7733 (accessed on 2 September 2022). [CrossRef]
- Carlstrom, J.E.; Ade, P.A.R.; Aird, K.A.; Benson, B.A.; Bleem, L.E.; Busetti, S.; Chang, C.L.; Chauvin, E.; Cho, H.M.; Crawford, T.M.; et al. The 10 Meter South Pole Telescope. Publ. Astron. Soc. Pac. 2011, 123, 568. [Google Scholar] [CrossRef] [Green Version]
- Hincks, A.D.; Acquaviva, V.; Ade, P.A.R.; Aguirre, P.; Amiri, M.; Appel, J.W.; Barrientos, L.F.; Battistelli, E.S.; Bond, J.R.; Brown, B.; et al. The atacama cosmology telescope (act): Beam profiles and first sz cluster maps. Astrophys. J. Suppl. Ser. 2010, 191, 423–438. [Google Scholar] [CrossRef]
- Chenu, J.Y.; Navarrini, A.; Bortolotti, Y.; Butin, G.; Fontana, A.L.; Mahieu, S.; Maier, D.; Mattiocco, F.; Serres, P.; Berton, M.; et al. The Front-End of the NOEMA Interferometer. IEEE Trans. Terahertz Sci. Technol. 2016, 6, 223–237. [Google Scholar] [CrossRef]
- Krips, M.; Castro-Carrizo, A.; Neri, R.; Pietu, V. NOEMA: How One Million Lines of Code Make the Optically Dark Universe Visible. Astron. Soc. Pac. Conf. Ser. 2022, 532, 313. [Google Scholar]
- Guilloteau, S.; Delannoy, J.; Downes, D.; Greve, A.; Guelin, M.; Lucas, R.; Morris, D.; Radford, S.J.E.; Wink, J.; Cernicharo, J.; et al. The IRAM Interferometer on Plateau de Bure. Astron. Astrophys. 1992, 262, 624. [Google Scholar] [CrossRef] [Green Version]
- Wootten, A.; Thompson, A.R. The Atacama Large Millimeter/Submillimeter Array. IEEE Proc. 2009, 97, 1463–1471. [Google Scholar] [CrossRef] [Green Version]
- Perley, R.A.; Chandler, C.J.; Butler, B.J.; Wrobel, J.M. The Expanded Very Large Array: A New Telescope for New Science. Astrophys. J. 2011, 739, L1. [Google Scholar] [CrossRef] [Green Version]
- Casey, C.M.; Narayanan, D.; Cooray, A. Dusty Star-Forming Galaxies at High Redshift. Phys. Rep. 2014, 541, 45–161. [Google Scholar] [CrossRef] [Green Version]
- Farrah, D.; Smith, K.E.; Ardila, D.; Bradford, C.M.; Dipirro, M.; Ferkinhoff, C.; Glenn, J.; Goldsmith, P.; Leisawitz, D.; Nikola, T.; et al. Review: Far-Infrared Instrumentation and Technological Development for the next Decade. J. Astron. Telesc. Instrum. Syst. 2019, 5, 020901. [Google Scholar] [CrossRef] [Green Version]
- Vivian, U. The Role of AGN in Luminous Infrared Galaxies from the Multiwavelength Perspective. Universe 2022, 8, 392. [Google Scholar] [CrossRef]
- Lyu, J.; Rieke, G. Infrared Spectral Energy Distribution and Variability of Active Galactic Nuclei: Clues to the Structure of Circumnuclear Material. Universe 2022, 8, 304. [Google Scholar] [CrossRef]
- Sajina, A.; Lacy, M.; Pope, A. The Past and Future of Mid-Infrared Studies of AGN. Universe 2022, 8, 356. [Google Scholar] [CrossRef]
- Faisst, A.L.; Yan, L.; Béthermin, M.; Cassata, P.; Dessauges-Zavadsky, M.; Fudamoto, Y.; Ginolfi, M.; Gruppioni, C.; Jones, G.; Khusanova, Y.; et al. ALPINE: A Large Survey to Understand Teenage Galaxies. Universe 2022, 8, 314. [Google Scholar] [CrossRef]
- Muldrew, S.I.; Croton, D.J.; Skibba, R.A.; Pearce, F.R.; Ann, H.B.; Baldry, I.K.; Brough, S.; Choi, Y.Y.; Conselice, C.J.; Cowan, N.B.; et al. Measures of Galaxy Environment—I. What Is ’Environment’? Mon. Not. R. Astron. Soc. 2012, 419, 2670–2682. [Google Scholar] [CrossRef] [Green Version]
- Kovač, K.; Lilly, S.J.; Cucciati, O.; Porciani, C.; Iovino, A.; Zamorani, G.; Oesch, P.; Bolzonella, M.; Knobel, C.; Finoguenov, A.; et al. The Density Field of the 10k zCOSMOS Galaxies. Astrophys. J. 2010, 708, 505–533. [Google Scholar] [CrossRef]
- Scoville, N.; Arnouts, S.; Aussel, H.; Benson, A.; Bongiorno, A.; Bundy, K.; Calvo, M.A.A.; Capak, P.; Carollo, M.; Civano, F.; et al. Evolution of Galaxies and Their Environments at z = 0.1–3 in COSMOS. Astrophys. J. Suppl. Ser. 2013, 206, 3. [Google Scholar] [CrossRef] [Green Version]
- Hogg, D.W.; Blanton, M.R.; Eisenstein, D.J.; Gunn, J.E.; Schlegel, D.J.; Zehavi, I.; Bahcall, N.A.; Brinkmann, J.; Csabai, I.; Schneider, D.P.; et al. The Overdensities of Galaxy Environments as a Function of Luminosity and Color. Astrophys. J. 2003, 585, L5–L9. [Google Scholar] [CrossRef]
- van den Bosch, F.C.; Aquino, D.; Yang, X.; Mo, H.J.; Pasquali, A.; McIntosh, D.H.; Weinmann, S.M.; Kang, X. The Importance of Satellite Quenching for the Build-up of the Red Sequence of Present-Day Galaxies. Mon. Not. R. Astron. Soc. 2008, 387, 79–91. [Google Scholar] [CrossRef] [Green Version]
- Woo, J.; Dekel, A.; Faber, S.M.; Noeske, K.; Koo, D.C.; Gerke, B.F.; Cooper, M.C.; Salim, S.; Dutton, A.A.; Newman, J.; et al. Dependence of Galaxy Quenching on Halo Mass and Distance from Its Centre. Mon. Not. R. Astron. Soc. 2013, 428, 3306–3326. [Google Scholar] [CrossRef] [Green Version]
- Werner, S.V.; Hatch, N.A.; Muzzin, A.; van der Burg, R.F.J.; Balogh, M.L.; Rudnick, G.; Wilson, G. Satellite Quenching Was Not Important for z 1 Clusters: Most Quenching Occurred during Infall. Mon. Not. R. Astron. Soc. 2022, 510, 674–686. [Google Scholar] [CrossRef]
- Chiang, Y.K.; Overzier, R.; Gebhardt, K. Ancient light from young cosmic cities: Physical and observational signatures of galaxy proto-clusters. Astrophys. J. 2013, 779, 127. [Google Scholar] [CrossRef] [Green Version]
- Wang, T.; Elbaz, D.; Daddi, E.; Liu, D.; Kodama, T.; Tanaka, I.; Schreiber, C.; Zanella, A.; Valentino, F.; Sargent, M.; et al. Revealing the Environmental Dependence of Molecular Gas Content in a Distant X-Ray Cluster at z = 2.51. Astrophys. J. 2018, 867, L29. [Google Scholar] [CrossRef] [Green Version]
- Champagne, J.B.; Casey, C.M.; Zavala, J.A.; Cooray, A.; Dannerbauer, H.; Fabian, A.; Hayward, C.C.; Long, A.S.; Spilker, J.S. Comprehensive Gas Characterization of a z = 2.5 Protocluster: A Cluster Core Caught in the Beginning of Virialization? Astrophys. J. 2021, 913, 110. [Google Scholar] [CrossRef]
- Bahé, Y.M.; McCarthy, I.G. Star Formation Quenching in Simulated Group and Cluster Galaxies: When, How, and Why? Mon. Not. R. Astron. Soc. 2015, 447, 969–992. [Google Scholar] [CrossRef]
- Dekel, A.; Birnboim, Y.; Engel, G.; Freundlich, J.; Goerdt, T.; Mumcuoglu, M.; Neistein, E.; Pichon, C.; Teyssier, R.; Zinger, E. Cold Streams in Early Massive Hot Haloes as the Main Mode of Galaxy Formation. Nature 2009, 457, 451–454. [Google Scholar] [CrossRef] [PubMed] [Green Version]
- Bouché, N.; Dekel, A.; Genzel, R.; Genel, S.; Cresci, G.; Förster Schreiber, N.M.; Shapiro, K.L.; Davies, R.I.; Tacconi, L. The Impact of Cold Gas Accretion Above a Mass Floor on Galaxy Scaling Relations. Astrophys. J. 2010, 718, 1001–1018. [Google Scholar] [CrossRef] [Green Version]
- Lilly, S.J.; Carollo, C.M.; Pipino, A.; Renzini, A.; Peng, Y. Gas Regulation of Galaxies: The Evolution of the Cosmic Specific Star Formation Rate, the Metallicity-Mass-Star-formation Rate Relation, and the Stellar Content of Halos. Astrophys. J. 2013, 772, 119. [Google Scholar] [CrossRef] [Green Version]
- Hatch, N. Galaxy Formation through Cosmic Recycling. Science 2016, 354, 1102–1103. [Google Scholar] [CrossRef]
- Tacconi, L.J.; Genzel, R.; Sternberg, A. The Evolution of the Star-Forming Interstellar Medium Across Cosmic Time. Annu. Rev. Astron. Astrophys. 2020, 58, 157. [Google Scholar] [CrossRef]
- Saintonge, A.; Catinella, B. The Cold Interstellar Medium of Galaxies in the Local Universe. Annu. Rev. Astron. Astrophys. 2022, 60, 319. [Google Scholar] [CrossRef]
- Sarazin, C.L. X-Ray Emission from Clusters of Galaxies. Rev. Mod. Phys. 1986, 58, 1–115. [Google Scholar] [CrossRef] [Green Version]
- Larson, R.B.; Tinsley, B.M.; Caldwell, C.N. The Evolution of Disk Galaxies and the Origin of S0 Galaxies. Astrophys. J. 1980, 237, 692–707. [Google Scholar] [CrossRef]
- Balogh, M.L.; Navarro, J.F.; Morris, S.L. The Origin of Star Formation Gradients in Rich Galaxy Clusters. Astrophys. J. 2000, 540, 113–121. [Google Scholar] [CrossRef]
- Peng, Y.j.; Maiolino, R.; Cochrane, R. Strangulation as the Primary Mechanism for Shutting down Star Formation in Galaxies. Nature 2015, 521, 192–195. [Google Scholar] [CrossRef] [Green Version]
- Bahé, Y.M.; McCarthy, I.G.; Balogh, M.L.; Font, A.S. Why Does the Environmental Influence on Group and Cluster Galaxies Extend beyond the Virial Radius? Mon. Not. R. Astron. Soc. 2013, 430, 3017–3031. [Google Scholar] [CrossRef] [Green Version]
- Gunn, J.E.; Gott, J.R., III. On the Infall of Matter Into Clusters of Galaxies and Some Effects on Their Evolution. Astrophys. J. 1972, 176, 1. [Google Scholar] [CrossRef]
- Nulsen, P.E.J. Transport Processes and the Stripping of Cluster Galaxies. Mon. Not. R. Astron. Soc. 1982, 198, 1007–1016. [Google Scholar] [CrossRef] [Green Version]
- Cowie, L.L.; Songaila, A. Thermal Evaporation of Gas within Galaxies by a Hot Intergalactic Medium. Nature 1977, 266, 501–503. [Google Scholar] [CrossRef]
- Cortese, L.; Catinella, B.; Smith, R. The Dawes Review 9: The Role of Cold Gas Stripping on the Star Formation Quenching of Satellite Galaxies. Publ. Astron. Soc. Aust. 2021, 38, e035. [Google Scholar] [CrossRef]
- Moore, B.; Katz, N.; Lake, G.; Dressler, A.; Oemler, A. Galaxy Harassment and the Evolution of Clusters of Galaxies. Nature 1996, 379, 613–616. [Google Scholar] [CrossRef] [Green Version]
- Smith, R.; Davies, J.I.; Nelson, A.H. How Effective Is Harassment on Infalling Late-Type Dwarfs? Mon. Not. R. Astron. Soc. 2010, 405, 1723–1735. [Google Scholar] [CrossRef] [Green Version]
- Bialas, D.; Lisker, T.; Olczak, C.; Spurzem, R.; Kotulla, R. On the Occurrence of Galaxy Harassment. Astron. Astrophys. 2015, 576, A103. [Google Scholar] [CrossRef] [Green Version]
- Hopkins, P.F.; Cox, T.J.; Kereš, D.; Hernquist, L. A Cosmological Framework for the Co-Evolution of Quasars, Supermassive Black Holes, and Elliptical Galaxies. II. Formation of Red Ellipticals. Astrophys. J. Suppl. Ser. 2008, 175, 390–422. [Google Scholar] [CrossRef]
- Kocevski, D.D.; Faber, S.M.; Mozena, M.; Koekemoer, A.M.; Nandra, K.; Rangel, C.; Laird, E.S.; Brusa, M.; Wuyts, S.; Trump, J.R.; et al. CANDELS: Constraining the AGN-Merger Connection with Host Morphologies at z ~ 2. Astrophys. J. 2012, 744, 148. [Google Scholar] [CrossRef] [Green Version]
- Mechtley, M.; Jahnke, K.; Windhorst, R.A.; Andrae, R.; Cisternas, M.; Cohen, S.H.; Hewlett, T.; Koekemoer, A.M.; Schramm, M.; Schulze, A.; et al. Do the Most Massive Black Holes at z = 2 Grow via Major Mergers? Astrophys. J. 2016, 830, 156. [Google Scholar] [CrossRef] [Green Version]
- Shah, E.A.; Kartaltepe, J.S.; Magagnoli, C.T.; Cox, I.G.; Wetherell, C.T.; Vanderhoof, B.N.; Calabro, A.; Chartab, N.; Conselice, C.J.; Croton, D.J.; et al. Investigating the Effect of Galaxy Interactions on the Enhancement of Active Galactic Nuclei at 0.5 < z < 3.0. Astrophys. J. 2020, 904, 107. [Google Scholar] [CrossRef]
- Springel, V.; Di Matteo, T.; Hernquist, L. Black Holes in Galaxy Mergers: The Formation of Red Elliptical Galaxies. Astrophys. J. 2005, 620, L79–L82. [Google Scholar] [CrossRef]
- Feldmann, R.; Carollo, C.M.; Mayer, L. The Hubble Sequence in Groups: The Birth of the Early-type Galaxies. Astrophys. J. 2011, 736, 88. [Google Scholar] [CrossRef] [Green Version]
- Kaviraj, S.; Cohen, S.; Ellis, R.S.; Peirani, S.; Windhorst, R.A.; O’Connell, R.W.; Silk, J.; Whitmore, B.C.; Hathi, N.P.; Ryan, R.E.; et al. Newborn Spheroids at High Redshift: When and How Did the Dominant, Old Stars in Today’s Massive Galaxies Form? Mon. Not. R. Astron. Soc. 2013, 428, 925–934. [Google Scholar] [CrossRef] [Green Version]
- Lofthouse, E.K.; Kaviraj, S.; Conselice, C.J.; Mortlock, A.; Hartley, W. Major Mergers Are Not Significant Drivers of Star Formation or Morphological Transformation around the Epoch of Peak Cosmic Star Formation. Mon. Not. R. Astron. Soc. 2017, 465, 2895–2900. [Google Scholar] [CrossRef] [Green Version]
- Wylezalek, D.; Zakamska, N.L. Evidence of Suppression of Star Formation by Quasar-Driven Winds in Gas-Rich Host Galaxies at z < 1? Mon. Not. R. Astron. Soc. 2016, 461, 3724–3739. [Google Scholar] [CrossRef] [Green Version]
- Vogelsberger, M.; Genel, S.; Springel, V.; Torrey, P.; Sijacki, D.; Xu, D.; Snyder, G.; Bird, S.; Nelson, D.; Hernquist, L. Properties of Galaxies Reproduced by a Hydrodynamic Simulation. Nature 2014, 509, 177–182. [Google Scholar] [CrossRef] [Green Version]
- Vogelsberger, M.; Genel, S.; Springel, V.; Torrey, P.; Sijacki, D.; Xu, D.; Snyder, G.; Nelson, D.; Hernquist, L. Introducing the Illustris Project: Simulating the Coevolution of Dark and Visible Matter in the Universe. Mon. Not. R. Astron. Soc. 2014, 444, 1518–1547. [Google Scholar] [CrossRef]
- Henriques, B.M.B.; White, S.D.M.; Thomas, P.A.; Angulo, R.; Guo, Q.; Lemson, G.; Springel, V.; Overzier, R. Galaxy Formation in the Planck Cosmology—I. Matching the Observed Evolution of Star Formation Rates, Colours and Stellar Masses. Mon. Not. R. Astron. Soc. 2015, 451, 2663–2680. [Google Scholar] [CrossRef] [Green Version]
- Henriques, B.M.B.; White, S.D.M.; Lilly, S.J.; Bell, E.F.; Bluck, A.F.L.; Terrazas, B.A. The Origin of the Mass Scales for Maximal Star Formation Efficiency and Quenching: The Critical Role of Supernovae. Mon. Not. R. Astron. Soc. 2019, 485, 3446–3456. [Google Scholar] [CrossRef]
- Di Matteo, T.; Springel, V.; Hernquist, L. Energy Input from Quasars Regulates the Growth and Activity of Black Holes and Their Host Galaxies. Nature 2005, 433, 604–607. [Google Scholar] [CrossRef] [Green Version]
- Schaye, J.; Crain, R.A.; Bower, R.G.; Furlong, M.; Schaller, M.; Theuns, T.; Dalla Vecchia, C.; Frenk, C.S.; McCarthy, I.G.; Helly, J.C.; et al. The EAGLE Project: Simulating the Evolution and Assembly of Galaxies and Their Environments. Mon. Not. R. Astron. Soc. 2015, 446, 521–554. [Google Scholar] [CrossRef]
- Zinger, E.; Pillepich, A.; Nelson, D.; Weinberger, R.; Pakmor, R.; Springel, V.; Hernquist, L.; Marinacci, F.; Vogelsberger, M. Ejective and Preventative: The IllustrisTNG Black Hole Feedback and Its Effects on the Thermodynamics of the Gas within and around Galaxies. Mon. Not. R. Astron. Soc. 2020, 499, 768–792. [Google Scholar] [CrossRef]
- McGee, S.L.; Bower, R.G.; Balogh, M.L. Overconsumption, Outflows and the Quenching of Satellite Galaxies. Mon. Not. R. Astron. Soc. 2014, 442, L105–L109. [Google Scholar] [CrossRef] [Green Version]
- Schaefer, A.L.; Croom, S.M.; Allen, J.T.; Brough, S.; Medling, A.M.; Ho, I.T.; Scott, N.; Richards, S.N.; Pracy, M.B.; Gunawardhana, M.L.P.; et al. The SAMI Galaxy Survey: Spatially Resolving the Environmental Quenching of Star Formation in GAMA Galaxies. Mon. Not. R. Astron. Soc. 2017, 464, 121–142. [Google Scholar] [CrossRef]
- Fossati, M.; Mendel, J.T.; Boselli, A.; Cuillandre, J.C.; Vollmer, B.; Boissier, S.; Consolandi, G.; Ferrarese, L.; Gwyn, S.; Amram, P.; et al. A Virgo Environmental Survey Tracing Ionised Gas Emission (VESTIGE). II. Constraining the Quenching Time in the Stripped Galaxy NGC 4330. Astron. Astrophys. 2018, 614, A57. [Google Scholar] [CrossRef] [Green Version]
- Poggianti, B.M.; Ignesti, A.; Gitti, M.; Wolter, A.; Brighenti, F.; Biviano, A.; George, K.; Vulcani, B.; Gullieuszik, M.; Moretti, A.; et al. GASP XXIII: A Jellyfish Galaxy as an Astrophysical Laboratory of the Baryonic Cycle. Astrophys. J. 2019, 887, 155. [Google Scholar] [CrossRef] [Green Version]
- Bluck, A.F.L.; Maiolino, R.; Piotrowska, J.M.; Trussler, J.; Ellison, S.L.; Sánchez, S.F.; Thorp, M.D.; Teimoorinia, H.; Moreno, J.; Conselice, C.J. How Do Central and Satellite Galaxies Quench?—Insights from Spatially Resolved Spectroscopy in the MaNGA Survey. Mon. Not. R. Astron. Soc. 2020, 499, 230–268. [Google Scholar] [CrossRef]
- Brinchmann, J.; Charlot, S.; White, S.D.M.; Tremonti, C.; Kauffmann, G.; Heckman, T.; Brinkmann, J. The Physical Properties of Star-Forming Galaxies in the Low-Redshift Universe. Mon. Not. R. Astron. Soc. 2004, 351, 1151–1179. [Google Scholar] [CrossRef] [Green Version]
- Noeske, K.G.; Weiner, B.J.; Faber, S.M.; Papovich, C.; Koo, D.C.; Somerville, R.S.; Bundy, K.; Conselice, C.J.; Newman, J.A.; Schiminovich, D.; et al. Star Formation in AEGIS Field Galaxies since Z = 1.1: The Dominance of Gradually Declining Star Formation, and the Main Sequence of Star-forming Galaxies. Astrophys. J. 2007, 660, L43–L46. [Google Scholar] [CrossRef] [Green Version]
- Elbaz, D.; Daddi, E.; Le Borgne, D.; Dickinson, M.; Alexander, D.M.; Chary, R.R.; Starck, J.L.; Brandt, W.N.; Kitzbichler, M.; MacDonald, E.; et al. The Reversal of the Star Formation-Density Relation in the Distant Universe. Astron. Astrophys. 2007, 468, 33. [Google Scholar] [CrossRef] [Green Version]
- Daddi, E.; Dickinson, M.; Morrison, G.; Chary, R.; Cimatti, A.; Elbaz, D.; Frayer, D.; Renzini, A.; Pope, A.; Alexander, D.M.; et al. Multiwavelength Study of Massive Galaxies at Z~2. I. Star Formation and Galaxy Growth. Astrophys. J. 2007, 670, 156–172. [Google Scholar] [CrossRef] [Green Version]
- Schreiber, N.M.F.; Wuyts, S. Star-Forming Galaxies at Cosmic Noon. Annu. Rev. Astron. Astrophys. 2020, 58, 661–725. [Google Scholar] [CrossRef]
- Sorba, R.; Sawicki, M. Using the 1.6 Mm Bump to Study Rest-frame Near-infrared-selected Galaxies at Redshift 2. Astrophys. J. 2010, 721, 1056–1078. [Google Scholar] [CrossRef]
- Conroy, C. Modeling the Panchromatic Spectral Energy Distributions of Galaxies. Annu. Rev. Astron. Astrophys. 2013, 51, 393. [Google Scholar] [CrossRef] [Green Version]
- Popping, G.; Pillepich, A.; Calistro Rivera, G.; Schulz, S.; Hernquist, L.; Kaasinen, M.; Marinacci, F.; Nelson, D.; Vogelsberger, M. The Dust-Continuum Size of TNG50 Galaxies at z = 1-5: A Comparison with the Distribution of Stellar Light, Stars, Dust, and H2. Mon. Not. R. Astron. Soc. 2022, 510, 3321–3334. [Google Scholar] [CrossRef]
- Williams, R.J.; Quadri, R.F.; Franx, M.; van Dokkum, P.; Labbé, I. Detection of Quiescent Galaxies in a Bicolor Sequence from Z = 0–2. Astrophys. J. 2009, 691, 1879–1895. [Google Scholar] [CrossRef] [Green Version]
- Whitaker, K.E.; van Dokkum, P.G.; Brammer, G.; Momcheva, I.G.; Skelton, R.; Franx, M.; Kriek, M.; Labbé, I.; Fumagalli, M.; Lundgren, B.F.; et al. Quiescent Galaxies in the 3D-HST Survey: Spectroscopic Confirmation of a Large Number of Galaxies with Relatively Old Stellar Populations at z ~ 2. Astrophys. J. 2013, 770, L39. [Google Scholar] [CrossRef]
- Fumagalli, M.; Labbé, I.; Patel, S.G.; Franx, M.; van Dokkum, P.; Brammer, G.; da Cunha, E.; Förster Schreiber, N.M.; Kriek, M.; Quadri, R.; et al. How Dead Are Dead Galaxies? Mid-infrared Fluxes of Quiescent Galaxies at Redshift 0.3 < z < 2.5: Implications for Star Formation Rates and Dust Heating. Astrophys. J. 2014, 796, 35. [Google Scholar] [CrossRef] [Green Version]
- Leja, J.; Tacchella, S.; Conroy, C. Beyond UVJ: More Efficient Selection of Quiescent Galaxies with Ultraviolet/Mid-infrared Fluxes. Astrophys. J. 2019, 880, L9. [Google Scholar] [CrossRef] [Green Version]
- Belli, S.; Genzel, R.; Förster Schreiber, N.M.; Wisnioski, E.; Wilman, D.J.; Wuyts, S.; Mendel, J.T.; Beifiori, A.; Bender, R.; Brammer, G.B.; et al. KMOS3D Reveals Low-level Star Formation Activity in Massive Quiescent Galaxies at 0.7 < z < 2.7. Astrophys. J. 2017, 841, L6. [Google Scholar] [CrossRef] [Green Version]
- Díaz-García, L.A.; Cenarro, A.J.; López-Sanjuan, C.; Ferreras, I.; Cerviño, M.; Fernández-Soto, A.; González Delgado, R.M.; Márquez, I.; Pović, M.; San Roman, I.; et al. Stellar Populations of Galaxies in the ALHAMBRA Survey up to z ∼ 1. II. Stellar Content of Quiescent Galaxies within the Dust-Corrected Stellar Mass-Colour and the UVJ Colour-Colour Diagrams. Astron. Astrophys. 2019, 631, A156. [Google Scholar] [CrossRef] [Green Version]
- Schreiber, C.; Elbaz, D.; Pannella, M.; Ciesla, L.; Wang, T.; Franco, M. Dust Temperature and Mid-to-Total Infrared Color Distributions for Star-Forming Galaxies at 0 <z< 4. Astron. Astrophys. 2018, 609, A30. [Google Scholar] [CrossRef] [Green Version]
- Galliano, F.; Galametz, M.; Jones, A.P. The Interstellar Dust Properties of Nearby Galaxies. Annu. Rev. Astron. Astrophys. 2018, 56, 673. [Google Scholar] [CrossRef] [Green Version]
- Draine, B.T. Interstellar Dust Grains. Annu. Rev. Astron. Astrophys. 2003, 41, 241. [Google Scholar] [CrossRef] [Green Version]
- Whitaker, K.E.; Pope, A.; Cybulski, R.; Casey, C.M.; Popping, G.; Yun, M.S. The Constant Average Relationship between Dust-obscured Star Formation and Stellar Mass from z = 0 to z = 2.5. Astrophys. J. 2017, 850, 208. [Google Scholar] [CrossRef] [Green Version]
- Kennicutt, R.C.; Evans, N.J. Star Formation in the Milky Way and Nearby Galaxies. Annu. Rev. Astron. Astrophys. 2012, 50, 531. [Google Scholar] [CrossRef] [Green Version]
- Williams, C.C.; Labbe, I.; Spilker, J.; Stefanon, M.; Leja, J.; Whitaker, K.; Bezanson, R.; Narayanan, D.; Oesch, P.; Weiner, B. Discovery of a Dark, Massive, ALMA-only Galaxy at z ∼ 5–6 in a Tiny 3 Mm Survey. Astrophys. J. 2019, 884, 154. [Google Scholar] [CrossRef]
- Yamaguchi, Y.; Kohno, K.; Hatsukade, B.; Wang, T.; Yoshimura, Y.; Ao, Y.; Caputi, K.I.; Dunlop, J.S.; Egami, E.; Espada, D.; et al. ALMA 26 Arcmin 2 Survey of GOODS-S at 1 Mm (ASAGAO): Near-infrared-dark Faint ALMA Sources. Astrophys. J. 2019, 878, 73. [Google Scholar] [CrossRef] [Green Version]
- Smail, I.; Dudzevičiūtė, U.; Stach, S.M.; Almaini, O.; Birkin, J.E.; Chapman, S.C.; Chen, C.C.; Geach, J.E.; Gullberg, B.; Hodge, J.A.; et al. An ALMA Survey of the S2CLS UDS Field: Optically Invisible Submillimetre Galaxies. Mon. Not. R. Astron. Soc. 2021, 502, 3426–3435. [Google Scholar] [CrossRef]
- Manning, S.M.; Casey, C.M.; Zavala, J.A.; Magdis, G.E.; Drew, P.M.; Champagne, J.B.; Aravena, M.; Béthermin, M.; Clements, D.L.; Finkelstein, S.L.; et al. Characterization of Two 2 Mm Detected Optically Obscured Dusty Star-forming Galaxies. Astrophys. J. 2022, 925, 23. [Google Scholar] [CrossRef]
- Duc, P.A.; Poggianti, B.M.; Fadda, D.; Elbaz, D.; Flores, H.; Chanial, P.; Franceschini, A.; Moorwood, A.; Cesarsky, C. Hidden Star-Formation in the Cluster of Galaxies Abell 1689. Astron. Astrophys. 2002, 382, 60–83. [Google Scholar] [CrossRef]
- Vulcani, B.; Poggianti, B.M.; Finn, R.A.; Rudnick, G.; Desai, V.; Bamford, S. Comparing the Relation Between Star Formation and Galaxy Mass in Different Environments. Astrophys. J. 2010, 710, L1–L6. [Google Scholar] [CrossRef] [Green Version]
- Finn, R.A.; Desai, V.; Rudnick, G.; Poggianti, B.; Bell, E.F.; Hinz, J.; Jablonka, P.; Milvang-Jensen, B.; Moustakas, J.; Rines, K.; et al. Dust-obscured star formation in intermediate redshift galaxy clusters. Astrophys. J. 2010, 720, 87–98. [Google Scholar] [CrossRef] [Green Version]
- Santos, J.S.; Altieri, B.; Tanaka, M.; Valtchanov, I.; Saintonge, A.; Dickinson, M.; Foucaud, S.; Kodama, T.; Rawle, T.D.; Tadaki, K. Star Formation in the Cluster CLG0218.3-0510 at z = 1.62 and Its Large-Scale Environment: The Infrared Perspective. Mon. Not. R. Astron. Soc. 2014, 438, 2565–2577. [Google Scholar] [CrossRef] [Green Version]
- Ma, C.J.; Smail, I.; Swinbank, A.M.; Simpson, J.M.; Thomson, A.P.; Chen, C.C.; Danielson, A.L.R.; Hilton, M.; Tadaki, K.; Stott, J.P.; et al. Dusty starbursts and the formation of elliptical galaxies: A scuba-2 survey of a z = 1.46 CLUSTER. Astrophys. J. 2015, 806, 257. [Google Scholar] [CrossRef] [Green Version]
- Silverman, J.D.; Green, P.J.; Barkhouse, W.A.; Kim, D.W.; Kim, M.; Wilkes, B.J.; Cameron, R.A.; Hasinger, G.; Jannuzi, B.T.; Smith, M.G.; et al. The Luminosity Function of X-Ray-selected Active Galactic Nuclei: Evolution of Supermassive Black Holes at High Redshift. Astrophys. J. 2008, 679, 118–139. [Google Scholar] [CrossRef] [Green Version]
- Madau, P.; Dickinson, M. Cosmic Star Formation History. Annu. Rev. Astron. Astrophys. 2014, 52, 415–486. [Google Scholar] [CrossRef]
- Hickox, R.C.; Alexander, D.M. Obscured Active Galactic Nuclei. Annu. Rev. Astron. Astrophys. 2018, 56, 625. [Google Scholar] [CrossRef] [Green Version]
- Alberts, S.; Rujopakarn, W.; Rieke, G.H.; Jagannathan, P.; Nyland, K. Completing the Census of AGN in GOODS-S/HUDF: New Ultradeep Radio Imaging and Predictions for JWST. Astrophys. J. 2020, 901, 168. [Google Scholar] [CrossRef]
- Solomon, P.M.; Vanden Bout, P.A. Molecular Gas at High Redshift. Annu. Rev. Astron. Astrophys. 2005, 43, 677. [Google Scholar] [CrossRef] [Green Version]
- Carilli, C.; Walter, F. Cool Gas in High Redshift Galaxies. Annu. Rev. Astron. Astrophys. 2013, 51, 105–161. [Google Scholar] [CrossRef] [Green Version]
- Scoville, N.; Sheth, K.; Aussel, H.; Vanden Bout, P.; Capak, P.; Bongiorno, A.; Casey, C.M.; Murchikova, L.; Koda, J.; Álvarez-Márquez, J.; et al. ISM Masses and the Star Formation Law at Z = 1 to 6: ALMA Observations of Dust Continuum in 145 Galaxies in the COSMOS Survey Field. Astrophys. J. 2016, 820, 83. [Google Scholar] [CrossRef] [Green Version]
- Scoville, N.; Lee, N.; Vanden Bout, P.; Diaz-Santos, T.; Sanders, D.; Darvish, B.; Bongiorno, A.; Casey, C.M.; Murchikova, L.; Koda, J.; et al. Evolution of Interstellar Medium, Star Formation, and Accretion at High Redshift. Astrophys. J. 2017, 837, 150. [Google Scholar] [CrossRef]
- Cormier, D.; Madden, S.C.; Lebouteiller, V.; Hony, S.; Aalto, S.; Costagliola, F.; Hughes, A.; Rémy-Ruyer, A.; Abel, N.; Bayet, E.; et al. The Molecular Gas Reservoir of 6 Low-Metallicity Galaxies from the Herschel Dwarf Galaxy Survey. A Ground-Based Follow-up Survey of CO(1-0), CO(2-1), and CO(3-2). Astron. Astrophys. 2014, 564, A121. [Google Scholar] [CrossRef] [Green Version]
- De Lucia, G.; Blaizot, J. The Hierarchical Formation of the Brightest Cluster Galaxies. Mon. Not. R. Astron. Soc. 2007, 375, 2–14. [Google Scholar] [CrossRef] [Green Version]
- Donahue, M.; Voit, G.M. Baryon Cycles in the Biggest Galaxies. Phys. Rep. 2022, 973, 1–109. [Google Scholar] [CrossRef]
- White, M. The Mass of a Halo. Astron. Astrophys. 2001, 367, 27. [Google Scholar] [CrossRef]
- Kroupa, P. On the Variation of the Initial Mass Function. Mon. Not. R. Astron. Soc. 2001, 322, 231–246. [Google Scholar] [CrossRef]
- Allen, S.W.; Evrard, A.E.; Mantz, A.B. Cosmological Parameters from Observations of Galaxy Clusters. Annu. Rev. Astron. Astrophys. 2011, 49, 409. [Google Scholar] [CrossRef] [Green Version]
- Rosati, P.; Borgani, S.; Norman, C. The Evolution of X-Ray Clusters of Galaxies. Annu. Rev. Astron. Astrophys. 2002, 40, 539–577. [Google Scholar] [CrossRef] [Green Version]
- Gladders, M.D.; Yee, H.K.C. A New Method For Galaxy Cluster Detection. I. The Algorithm. Astron. J. 2000, 120, 2148–2162. [Google Scholar] [CrossRef] [Green Version]
- Gladders, M.D.; Yee, H.K.C. The Red-Sequence Cluster Survey. I. The Survey and Cluster Catalogs for Patches RCS 0926+37 and RCS 1327+29. Astrophys. J. Suppl. Ser. 2005, 157, 1–29. [Google Scholar] [CrossRef] [Green Version]
- Sunyaev, R.A.; Zeldovich, Y.B. The Velocity of Clusters of Galaxies Relative to the Microwave Background—The Possibility of Its Measurement. Mon. Not. R. Astron. Soc. 1980, 190, 413–420. [Google Scholar] [CrossRef]
- Jannuzi, B.T.; Dey, A. The NOAO Deep Wide-Field Survey. Astron. Soc. Pac. Conf. Ser. 1999, 193, 258. [Google Scholar]
- Whitaker, K.E.; Labbé, I.; van Dokkum, P.G.; Brammer, G.; Kriek, M.; Marchesini, D.; Quadri, R.F.; Franx, M.; Muzzin, A.; Williams, R.J.; et al. The NEWFIRM Medium-band Survey: Photometric Catalogs, Redshifts, and the Bimodal Color Distribution of Galaxies out to z ~ 3. Astrophys. J. 2011, 735, 86. [Google Scholar] [CrossRef] [Green Version]
- Eisenhardt, P.R.; Stern, D.; Brodwin, M.; Fazio, G.G.; Rieke, G.H.; Rieke, M.J.; Werner, M.W.; Wright, E.L.; Allen, L.E.; Arendt, R.G.; et al. The Infrared Array Camera (IRAC) Shallow Survey. Astrophys. J. Suppl. Ser. 2004, 154, 48–53. [Google Scholar] [CrossRef] [Green Version]
- Ashby, M.L.N.; Stern, D.; Brodwin, M.; Griffith, R.; Eisenhardt, P.; Kozłowski, S.; Kochanek, C.S.; Bock, J.J.; Borys, C.; Brand, K.; et al. The Spitzer Deep, Wide-field Survey. Astrophys. J. 2009, 701, 428–453. [Google Scholar] [CrossRef] [Green Version]
- Lonsdale, C.J.; Smith, H.E.; Rowan-Robinson, M.; Surace, J.; Shupe, D.; Xu, C.; Oliver, S.; Padgett, D.; Fang, F.; Conrow, T.; et al. SWIRE: The SIRTF Wide-Area Infrared Extragalactic Survey. Publ. Astron. Soc. Pac. 2003, 115, 897–927. [Google Scholar] [CrossRef]
- Stanford, S.A.; Romer, A.K.; Sabirli, K.; Davidson, M.; Hilton, M.; Viana, P.T.P.; Collins, C.A.; Kay, S.T.; Liddle, A.R.; Mann, R.G.; et al. The XMM Cluster Survey: A Massive Galaxy Cluster at z = 1.45. Astrophys. J. 2006, 646, L13–L16. [Google Scholar] [CrossRef] [Green Version]
- Brodwin, M.; Brown, M.J.I.; Ashby, M.L.N.; Bian, C.; Brand, K.; Dey, A.; Eisenhardt, P.R.; Eisenstein, D.J.; Gonzalez, A.H.; Huang, J.S.; et al. Photometric Redshifts in the IRAC Shallow Survey. Astrophys. J. 2006, 651, 791–803. [Google Scholar] [CrossRef] [Green Version]
- van Breukelen, C.; Cotter, G.; Rawlings, S.; Readhead, T.; Bonfield, D.; Clewley, L.; Ivison, R.; Jarvis, M.; Simpson, C.; Watson, M. Spectroscopic Follow-up of a Cluster Candidate at z = 1.45. Mon. Not. R. Astron. Soc. 2007, 382, 971–984. [Google Scholar] [CrossRef] [Green Version]
- Zatloukal, M.; Röser, H.J.; Wolf, C.; Hippelein, H.; Falter, S. Distant Galaxy Clusters in the COSMOS Field Found by HIROCS. Astron. Astrophys. 2007, 474, L5. [Google Scholar] [CrossRef] [Green Version]
- Krick, J.E.; Surace, J.A.; Thompson, D.; Ashby, M.L.N.; Hora, J.L.; Gorjian, V.; Yan, L. Galaxy Clusters in the IRAC Dark Field. I. Growth of the Red Sequence. Astrophys. J. 2008, 686, 918–926. [Google Scholar] [CrossRef] [Green Version]
- Eisenhardt, P.R.M.; Brodwin, M.; Gonzalez, A.H.; Stanford, S.A.; Stern, D.; Barmby, P.; Brown, M.J.I.; Dawson, K.; Dey, A.; Doi, M.; et al. Clusters of Galaxies in the First Half of the Universe from the IRAC Shallow Survey. Astrophys. J. 2008, 684, 905–932. [Google Scholar] [CrossRef] [Green Version]
- Muzzin, A.; Wilson, G.; Lacy, M.; Yee, H.K.C.; Stanford, S.A. The Evolution of Dusty Star Formation and Stellar Mass Assembly in Clusters: Results from the IRAC 3.6, 4.5, 5.8, and 8.0 Mm Cluster Luminosity Functions. Astrophys. J. 2008, 686, 966–994. [Google Scholar] [CrossRef] [Green Version]
- Wilson, G.; Muzzin, A.; Yee, H.K.C.; Lacy, M.; Surace, J.; Gilbank, D.; Blindert, K.; Hoekstra, H.; Majumdar, S.; Demarco, R.; et al. Spectroscopic Confirmation of a Massive Red-Sequence-Selected Galaxy Cluster at z = 1.34 in the SpARCS-South Cluster Survey. Astrophys. J. 2009, 698, 1943–1950. [Google Scholar] [CrossRef] [Green Version]
- Muzzin, A.; Wilson, G.; Yee, H.K.C.; Hoekstra, H.; Gilbank, D.; Surace, J.; Lacy, M.; Blindert, K.; Majumdar, S.; Demarco, R.; et al. Spectroscopic Confirmation of Two Massive Red-Sequence-Selected Galaxy Clusters at z ~ 1.2 in the SpARCS-North Cluster Survey. Astrophys. J. 2009, 698, 1934–1942. [Google Scholar] [CrossRef] [Green Version]
- Papovich, C. The Angular Clustering of Distant Galaxy Clusters. Astrophys. J. 2008, 676, 206–217. [Google Scholar] [CrossRef]
- Muzzin, A.; Wilson, G.; Demarco, R.; Lidman, C.; Nantais, J.; Hoekstra, H.; Yee, H.K.C.; Rettura, A. Discovery of a Rich Cluster at z = 1.63 Using the Rest-frame 1.6 Mm “Stellar Bump Sequence” Method. Astrophys. J. 2013, 767, 39. [Google Scholar] [CrossRef] [Green Version]
- Brodwin, M.; Stanford, S.A.; Gonzalez, A.H.; Zeimann, G.R.; Snyder, G.F.; Mancone, C.L.; Pope, A.; Eisenhardt, P.R.; Stern, D.; Alberts, S.; et al. The era of star formation in galaxy clusters. Astrophys. J. 2013, 779, 138. [Google Scholar] [CrossRef]
- Wylezalek, D.; Galametz, A.; Stern, D.; Vernet, J.; De Breuck, C.; Seymour, N.; Brodwin, M.; Eisenhardt, P.R.M.; Gonzalez, A.H.; Hatch, N.; et al. Galaxy Clusters around Radio-loud Active Galactic Nuclei at 1.3 < z < 3.2 as Seen by Spitzer. Astrophys. J. 2013, 769, 79. [Google Scholar] [CrossRef] [Green Version]
- Willis, J.P.; Ramos-Ceja, M.E.; Muzzin, A.; Pacaud, F.; Yee, H.K.C.; Wilson, G. X-Ray versus Infrared Selection of Distant Galaxy Clusters: A Case Study Using the XMM-LSS and SpARCS Cluster Samples. Mon. Not. R. Astron. Soc. 2018, 477, 5517–5535. [Google Scholar] [CrossRef] [Green Version]
- Costanzi, M.; Rozo, E.; Rykoff, E.S.; Farahi, A.; Jeltema, T.; Evrard, A.E.; Mantz, A.; Gruen, D.; Mandelbaum, R.; DeRose, J.; et al. Modelling Projection Effects in Optically Selected Cluster Catalogues. Mon. Not. R. Astron. Soc. 2019, 482, 490–505. [Google Scholar] [CrossRef]
- Girardi, M.; Borgani, S.; Giuricin, G.; Mardirossian, F.; Mezzetti, M. Optical Luminosities and Mass-to-Light Ratios of Nearby Galaxy Clusters. Astrophys. J. 2000, 530, 62–79. [Google Scholar] [CrossRef] [Green Version]
- Lin, Y.T.; Mohr, J.J.; Stanford, S.A. Near-Infrared Properties of Galaxy Clusters: Luminosity as a Binding Mass Predictor and the State of Cluster Baryons. Astrophys. J. 2003, 591, 749–763. [Google Scholar] [CrossRef]
- Andreon, S. Making the Observational Parsimonious Richness a Working Mass Proxy. Astron. Astrophys. 2015, 582, A100. [Google Scholar] [CrossRef]
- Rozo, E.; Rykoff, E.S.; Bartlett, J.G.; Melin, J.B. redMaPPer—III. A Detailed Comparison of the Planck 2013 and SDSS DR8 redMaPPer Cluster Catalogues. Mon. Not. R. Astron. Soc. 2015, 450, 592–605. [Google Scholar] [CrossRef] [Green Version]
- Old, L.J.; Wojtak, R.; Mamon, G.A.; Skibba, R.A.; Pearce, F.R.; Croton, D.; Bamford, S.; Behroozi, P.; de Carvalho, R.; Muñoz-Cuartas, J.C.; et al. Galaxy Cluster Mass Reconstruction Project—II. Quantifying Scatter and Bias Using Contrasting Mock Catalogues. Mon. Not. R. Astron. Soc. 2015, 449, 1897–1920. [Google Scholar] [CrossRef]
- Wojtak, R.; Old, L.; Mamon, G.A.; Pearce, F.R.; de Carvalho, R.; Sifón, C.; Gray, M.E.; Skibba, R.A.; Croton, D.; Bamford, S.; et al. Galaxy Cluster Mass Reconstruction Project—IV. Understanding the Effects of Imperfect Membership on Cluster Mass Estimation. Mon. Not. R. Astron. Soc. 2018, 481, 324–340. [Google Scholar] [CrossRef] [Green Version]
- Demarco, R.; Wilson, G.; Muzzin, A.; Lacy, M.; Surace, J.; Yee, H.K.C.; Hoekstra, H.; Blindert, K.; Gilbank, D. Spectroscopic Confirmation of Three Red-sequence Selected Galaxy Clusters at z = 0.87, 1.16, and 1.21 from the SpARCS Survey. Astrophys. J. 2010, 711, 1185–1197. [Google Scholar] [CrossRef] [Green Version]
- Balogh, M.L.; Gilbank, D.G.; Muzzin, A.; Rudnick, G.; Cooper, M.C.; Lidman, C.; Biviano, A.; Demarco, R.; McGee, S.L.; Nantais, J.B.; et al. Gemini Observations of Galaxies in Rich Early Environments (GOGREEN) I: Survey Description. Mon. Not. R. Astron. Soc. 2017, 470, 4168–4185. [Google Scholar] [CrossRef] [Green Version]
- Stanford, S.A.; Brodwin, M.; Gonzalez, A.H.; Zeimann, G.; Stern, D.; Dey, A.; Eisenhardt, P.R.; Snyder, G.F.; Mancone, C. IDCS J1426.5+3508: Discovery of a Massive, Infrared-selected Galaxy Cluster at z = 1.75. Astrophys. J. 2012, 753, 164. [Google Scholar] [CrossRef] [Green Version]
- Kochanek, C.S.; Eisenstein, D.J.; Cool, R.J.; Caldwell, N.; Assef, R.J.; Jannuzi, B.T.; Jones, C.; Murray, S.S.; Forman, W.R.; Dey, A.; et al. AGES: The AGN and Galaxy Evolution Survey. Astrophys. J. Suppl. Ser. 2012, 200, 8. [Google Scholar] [CrossRef] [Green Version]
- Stanford, S.A.; Eisenhardt, P.R.; Brodwin, M.; Gonzalez, A.H.; Stern, D.; Jannuzi, B.T.; Dey, A.; Brown, M.J.I.; McKenzie, E.; Elston, R. An IR-selected Galaxy Cluster at z = 1.41. Astrophys. J. 2005, 634, L129–L132. [Google Scholar] [CrossRef]
- Brodwin, M.; Stern, D.; Vikhlinin, A.; Stanford, S.A.; Gonzalez, A.H.; Eisenhardt, P.R.; Ashby, M.L.N.; Bautz, M.; Dey, A.; Forman, W.R.; et al. X-Ray Emission from Two Infrared-selected Galaxy Clusters at z > 1.4 in the IRAC Shallow Cluster Survey. Astrophys. J. 2011, 732, 33. [Google Scholar] [CrossRef]
- Elston, R.J.; Gonzalez, A.H.; McKenzie, E.; Brodwin, M.; Brown, M.J.I.; Cardona, G.; Dey, A.; Dickinson, M.; Eisenhardt, P.R.; Jannuzi, B.T.; et al. The FLAMINGOS Extragalactic Survey. Astrophys. J. 2006, 639, 816–826. [Google Scholar] [CrossRef] [Green Version]
- Zeimann, G.R.; Stanford, S.A.; Brodwin, M.; Gonzalez, A.H.; Mancone, C.; Snyder, G.F.; Stern, D.; Eisenhardt, P.; Dey, A.; Moustakas, J. Hα Star Formation Rates of z > 1 Galaxy Clusters in the IRAC Shallow Cluster Survey. Astrophys. J. 2013, 779, 137. [Google Scholar] [CrossRef] [Green Version]
- Brodwin, M.; Gonzalez, A.H.; Moustakas, L.A.; Eisenhardt, P.R.; Stanford, S.A.; Stern, D.; Brown, M.J.I. Galaxy Cluster Correlation Function to Z~1.5 in the IRAC Shallow Cluster Survey. Astrophys. J. 2007, 671, L93–L96. [Google Scholar] [CrossRef]
- Jee, M.J.; Dawson, K.S.; Hoekstra, H.; Perlmutter, S.; Rosati, P.; Brodwin, M.; Suzuki, N.; Koester, B.; Postman, M.; Lubin, L.; et al. Scaling Relations and Overabundance of Massive Clusters at z > 1 from Weak-lensing Studies with the Hubble Space Telescope. Astrophys. J. 2011, 737, 59. [Google Scholar] [CrossRef] [Green Version]
- Brodwin, M.; Gonzalez, A.H.; Stanford, S.A.; Plagge, T.; Marrone, D.P.; Carlstrom, J.E.; Dey, A.; Eisenhardt, P.R.; Fedeli, C.; Gettings, D.; et al. IDCS J1426.5+3508: Sunyaev-Zel’dovich Measurement of a Massive Infrared-selected Cluster at z = 1.75. Astrophys. J. 2012, 753, 162. [Google Scholar] [CrossRef] [Green Version]
- Lin, Y.T.; Brodwin, M.; Gonzalez, A.H.; Bode, P.; Eisenhardt, P.R.M.; Stanford, S.A.; Vikhlinin, A. The Stellar Mass Growth of Brightest Cluster Galaxies in the IRAC Shallow Cluster Survey. Astrophys. J. 2013, 771, 61. [Google Scholar] [CrossRef] [Green Version]
- Alberts, S.; Pope, A.; Brodwin, M.; Atlee, D.W.; Lin, Y.T.; Dey, A.; Eisenhardt, P.R.M.; Gettings, D.P.; Gonzalez, A.H.; Jannuzi, B.T.; et al. The Evolution of Dust-Obscured Star Formation Activity in Galaxy Clusters Relative to the Field over the Last 9 Billion Years72. Mon. Not. R. Astron. Soc. 2014, 437, 437–457. [Google Scholar] [CrossRef] [Green Version]
- Brodwin, M.; McDonald, M.; Gonzalez, A.H.; Stanford, S.A.; Eisenhardt, P.R.; Stern, D.; Zeimann, G.R. IDCS J1426.5+3508: The Most Massive Galaxy Cluster at z > 1.5. Astrophys. J. 2016, 817, 122. [Google Scholar] [CrossRef]
- Chung, S.M.; Kochanek, C.S.; Assef, R.; Brown, M.J.I.; Stern, D.; Jannuzi, B.T.; Gonzalez, A.H.; Hickox, R.C.; Moustakas, J. A UV to Mid-IR Study of AGN Selection. Astrophys. J. 2014, 790, 54. [Google Scholar] [CrossRef] [Green Version]
- Rykoff, E.S.; Rozo, E.; Busha, M.T.; Cunha, C.E.; Finoguenov, A.; Evrard, A.; Hao, J.; Koester, B.P.; Leauthaud, A.; Nord, B.; et al. redMaPPer. I. Algorithm and SDSS DR8 Catalog. Astrophys. J. 2014, 785, 104. [Google Scholar] [CrossRef]
- Papovich, C.; Shipley, H.V.; Mehrtens, N.; Lanham, C.; Lacy, M.; Ciardullo, R.; Finkelstein, S.L.; Bassett, R.; Behroozi, P.; Blanc, G.A.; et al. The Spitzer-HETDEX Exploratory Large-area Survey. Astrophys. J. Suppl. Ser. 2016, 224, 28. [Google Scholar] [CrossRef] [Green Version]
- Rettura, A.; Martinez-Manso, J.; Stern, D.; Mei, S.; Ashby, M.L.N.; Brodwin, M.; Gettings, D.; Gonzalez, A.H.; Stanford, S.A.; Bartlett, J.G. Candidate Clusters of Galaxies at z > 1.3 Identified in the Spitzer South Pole Telescope Deep Field Survey. Astrophys. J. 2014, 797, 109. [Google Scholar] [CrossRef] [Green Version]
- Fuzia, B.J.; Kawinwanichakij, L.; Mehrtens, N.; Aiola, S.; Battaglia, N.; Ciardullo, R.; Devlin, M.; Finkelstein, S.L.; Gralla, M.; Hilton, M.; et al. The Atacama Cosmology Telescope: SZ-based Masses and Dust Emission from IR-selected Cluster Candidates in the SHELA Survey. Mon. Not. R. Astron. Soc. 2021, 502, 4026–4038. [Google Scholar] [CrossRef]
- Wen, Z.L.; Han, J.L. Photometric Redshifts for Galaxies in the Subaru Hyper Suprime-Cam and unWISE and a Catalogue of Identified Clusters of Galaxies. Mon. Not. R. Astron. Soc. 2021, 500, 1003–1017. [Google Scholar] [CrossRef]
- Wen, Z.L.; Han, J.L. Clusters of Galaxies up to Z = 1.5 Identified from Photometric Data of the Dark Energy Survey and unWISE. Mon. Not. R. Astron. Soc. 2022, 513, 3946–3959. [Google Scholar] [CrossRef]
- Wen, Z.L.; Han, J.L.; Yang, F. A Catalogue of Clusters of Galaxies Identified from All Sky Surveys of 2MASS, WISE, and SuperCOSMOS. Mon. Not. R. Astron. Soc. 2018, 475, 343–352. [Google Scholar] [CrossRef]
- Ascaso, B.; Mei, S.; Bartlett, J.G.; Benítez, N. Apples to Apples A2—II. Cluster Selection Functions for next-Generation Surveys. Mon. Not. R. Astron. Soc. 2017, 464, 2270–2280. [Google Scholar] [CrossRef] [Green Version]
- Planck Collaboration; Adam, R.; Vannier, M.; Maurogordato, S.; Biviano, A.; Adami, C.; Ascaso, B.; Bellagamba, F.; Benoist, C.; Cappi, A.; et al. Euclid Preparation. III. Galaxy Cluster Detection in the Wide Photometric Survey, Performance and Algorithm Selection. Astron. Astrophys. 2019, 627, A23. [Google Scholar] [CrossRef] [Green Version]
- Gonzalez, A.H.; Gettings, D.P.; Brodwin, M.; Eisenhardt, P.R.M.; Stanford, S.A.; Wylezalek, D.; Decker, B.; Marrone, D.P.; Moravec, E.; O’Donnell, C.; et al. The Massive and Distant Clusters of WISE Survey. I. Survey Overview and a Catalog of >2000 Galaxy Clusters at z ≃ 1. Astrophys. J. Suppl. Ser. 2019, 240, 33. [Google Scholar] [CrossRef] [Green Version]
- Rettura, A.; Chary, R.; Krick, J.; Ettori, S. Mass-Richness Relations for X-Ray and SZE-selected Clusters at 0.4 < z < 2.0 as Seen by Spitzer at 4.5 Mm. Astrophys. J. 2018, 867, 12. [Google Scholar] [CrossRef] [Green Version]
- Spergel, D.; Gehrels, N.; Baltay, C.; Bennett, D.; Breckinridge, J.; Donahue, M.; Dressler, A.; Gaudi, B.S.; Greene, T.; Guyon, O.; et al. Wide-Field InfrarRed Survey Telescope-Astrophysics Focused Telescope Assets WFIRST-AFTA 2015 Report. arXiv 2015, arXiv:150303757S. [Google Scholar]
- Sartoris, B.; Biviano, A.; Fedeli, C.; Bartlett, J.G.; Borgani, S.; Costanzi, M.; Giocoli, C.; Moscardini, L.; Weller, J.; Ascaso, B.; et al. Next Generation Cosmology: Constraints from the Euclid Galaxy Cluster Survey. Mon. Not. R. Astron. Soc. 2016, 459, 1764–1780. [Google Scholar] [CrossRef] [Green Version]
- Wen, Z.L.; Han, J.L. A Sample of 1959 Massive Galaxy Clusters at High Redshifts. Mon. Not. R. Astron. Soc. 2018, 481, 4158–4168. [Google Scholar] [CrossRef] [Green Version]
- Chambers, K.C.; Magnier, E.A.; Metcalfe, N.; Flewelling, H.A.; Huber, M.E.; Waters, C.Z.; Denneau, L.; Draper, P.W.; Farrow, D.; Finkbeiner, D.P.; et al. The Pan-STARRS1 Surveys. arXiv 2016, arXiv:161205560C. [Google Scholar]
- Peacock, J.A.; Hambly, N.C.; Bilicki, M.; MacGillivray, H.T.; Miller, L.; Read, M.A.; Tritton, S.B. The SuperCOSMOS All-Sky Galaxy Catalogue. Mon. Not. R. Astron. Soc. 2016, 462, 2085–2098. [Google Scholar] [CrossRef]
- Marocco, F.; Eisenhardt, P.R.M.; Fowler, J.W.; Kirkpatrick, J.D.; Meisner, A.M.; Schlafly, E.F.; Stanford, S.A.; Garcia, N.; Caselden, D.; Cushing, M.C.; et al. The CatWISE2020 Catalog. Astrophys. J. Suppl. Ser. 2021, 253, 8. [Google Scholar] [CrossRef]
- Skrutskie, M.F.; Cutri, R.M.; Stiening, R.; Weinberg, M.D.; Schneider, S.; Carpenter, J.M.; Beichman, C.; Capps, R.; Chester, T.; Elias, J.; et al. The Two Micron All Sky Survey (2MASS). Astron. J. 2006, 131, 1163–1183. [Google Scholar] [CrossRef]
- York, D.G.; Adelman, J.; Anderson, J.E., Jr.; Anderson, S.F.; Annis, J.; Bahcall, N.A.; Bakken, J.A.; Barkhouser, R.; Bastian, S.; Berman, E.; et al. The Sloan Digital Sky Survey: Technical Summary. Astron. J. 2000, 120, 1579–1587. [Google Scholar] [CrossRef]
- Schlafly, E.F.; Meisner, A.M.; Green, G.M. The unWISE Catalog: Two Billion Infrared Sources from Five Years of WISE Imaging. Astrophys. J. Suppl. Ser. 2019, 240, 30. [Google Scholar] [CrossRef] [Green Version]
- Aihara, H.; Arimoto, N.; Armstrong, R.; Arnouts, S.; Bahcall, N.A.; Bickerton, S.; Bosch, J.; Bundy, K.; Capak, P.L.; Chan, J.H.H.; et al. The Hyper Suprime-Cam SSP Survey: Overview and Survey Design. Publ. Astron. Soc. Jpn. 2018, 70, S4. [Google Scholar] [CrossRef]
- Abbott, T.M.C.; Abdalla, F.B.; Allam, S.; Amara, A.; Annis, J.; Asorey, J.; Avila, S.; Ballester, O.; Banerji, M.; Barkhouse, W.; et al. The Dark Energy Survey: Data Release 1. Astrophys. J. Suppl. Ser. 2018, 239, 18. [Google Scholar] [CrossRef]
- Ivezić, Ž.; Kahn, S.M.; Tyson, J.A.; Abel, B.; Acosta, E.; Allsman, R.; Alonso, D.; AlSayyad, Y.; Anderson, S.F.; Andrew, J.; et al. LSST: From Science Drivers to Reference Design and Anticipated Data Products. Astrophys. J. 2019, 873, 111. [Google Scholar] [CrossRef]
- Laureijs, R.; Amiaux, J.; Arduini, S.; Auguères, J.L.; Brinchmann, J.; Cole, R.; Cropper, M.; Dabin, C.; Duvet, L.; Ealet, A.; et al. Euclid Definition Study Report. arXiv 2011, arXiv:1110.3193. [Google Scholar]
- Carlstrom, J.E.; Holder, G.P.; Reese, E.D. Cosmology with the Sunyaev-Zel’dovich Effect. Annu. Rev. Astron. Astrophys. 2002, 40, 643–680. [Google Scholar] [CrossRef] [Green Version]
- Motl, P.M.; Hallman, E.J.; Burns, J.O.; Norman, M.L. The Integrated Sunyaev-Zeldovich Effect as a Superior Method for Measuring the Mass of Clusters of Galaxies. Astrophys. J. 2005, 623, L63–L66. [Google Scholar] [CrossRef] [Green Version]
- Andersson, K.; Benson, B.A.; Ade, P.A.R.; Aird, K.A.; Armstrong, B.; Bautz, M.; Bleem, L.E.; Brodwin, M.; Carlstrom, J.E.; Chang, C.L.; et al. X-Ray Properties of the First Sunyaev-Zel’dovich Effect Selected Galaxy Cluster Sample from the South Pole Telescope. Astrophys. J. 2011, 738, 48. [Google Scholar] [CrossRef]
- Henden, N.A.; Puchwein, E.; Sijacki, D. The Redshift Evolution of X-ray and Sunyaev-Zel’dovich Scaling Relations in the FABLE Simulations. Mon. Not. R. Astron. Soc. 2019, 489, 2439–2470. [Google Scholar] [CrossRef]
- Bleem, L.E.; Bocquet, S.; Stalder, B.; Gladders, M.D.; Ade, P.A.R.; Allen, S.W.; Anderson, A.J.; Annis, J.; Ashby, M.L.N.; Austermann, J.E.; et al. The SPTpol Extended Cluster Survey. Astrophys. J. Suppl. Ser. 2020, 247, 25. [Google Scholar] [CrossRef]
- Planck Collaboration; Ade, P.A.R.; Aghanim, N.; Arnaud, M.; Aumont, J.; Baccigalupi, C.; Banday, A.J.; Barreiro, R.B.; Bartolo, N.; Battaner, E.; et al. Planck Intermediate Results. XXXIX. The Planck List of High-Redshift Source Candidates. Astron. Astrophys. 2016, 596, A100. [Google Scholar] [CrossRef] [Green Version]
- Ade, P.; Aguirre, J.; Ahmed, Z.; Aiola, S.; Ali, A.; Alonso, D.; Alvarez, M.A.; Arnold, K.; Ashton, P.; Austermann, J.; et al. The Simons Observatory: Science Goals and Forecasts. J. Cosmol. Astropart. Phys. 2019, 2019, 056. [Google Scholar] [CrossRef]
- Abazajian, K.; Addison, G.; Adshead, P.; Ahmed, Z.; Allen, S.W.; Alonso, D.; Alvarez, M.; Anderson, A.; Arnold, K.S.; Baccigalupi, C.; et al. CMB-S4 Science Case, Reference Design, and Project Plan. arXiv 2019, arXiv:190704473A. [Google Scholar]
- Benson, B.A.; Ade, P.A.R.; Ahmed, Z.; Allen, S.W.; Arnold, K.; Austermann, J.E.; Bender, A.N.; Bleem, L.E.; Carlstrom, J.E.; Chang, C.L.; et al. SPT-3G: A Next-Generation Cosmic Microwave Background Polarization Experiment on the South Pole Telescope. arXiv 2014, arXiv:1407.2973. [Google Scholar] [CrossRef] [Green Version]
- Bleem, L.E.; Stalder, B.; de Haan, T.; Aird, K.A.; Allen, S.W.; Applegate, D.E.; Ashby, M.L.N.; Bautz, M.; Bayliss, M.; Benson, B.A.; et al. Galaxy Clusters Discovered via the Sunyaev-Zel’dovich Effect in the 2500-Square-Degree SPT-SZ Survey. Astrophys. J. Suppl. Ser. 2015, 216, 27. [Google Scholar] [CrossRef]
- CCAT Collaboration, C.P.; Aravena, M.; Austermann, J.E.; Basu, K.; Battaglia, N.; Beringue, B.; Bertoldi, F.; Bigiel, F.; Bond, J.R.; Breysse, P.C.; et al. CCAT-prime Collaboration: Science Goals and Forecasts with Prime-Cam on the Fred Young Submillimeter Telescope. arXiv 2021, arXiv:2107.10364. [Google Scholar]
- Hilton, M.; Hasselfield, M.; Sifón, C.; Battaglia, N.; Aiola, S.; Bharadwaj, V.; Bond, J.R.; Choi, S.K.; Crichton, D.; Datta, R.; et al. The Atacama Cosmology Telescope: The Two-season ACTPol Sunyaev–Zel’dovich Effect Selected Cluster Catalog. Astrophys. J. Suppl. Ser. 2018, 235, 20. [Google Scholar] [CrossRef] [Green Version]
- Hanany, S.; Alvarez, M.; Artis, E.; Ashton, P.; Aumont, J.; Aurlien, R.; Banerji, R.; Barreiro, R.B.; Bartlett, J.G.; Basak, S.; et al. PICO: Probe of Inflation and Cosmic Origins. arXiv 2019, arXiv:190210541H. [Google Scholar]
- Huang, N.; Bleem, L.E.; Stalder, B.; Ade, P.A.R.; Allen, S.W.; Anderson, A.J.; Austermann, J.E.; Avva, J.S.; Beall, J.A.; Bender, A.N.; et al. Galaxy Clusters Selected via the Sunyaev–Zel’dovich Effect in the SPTpol 100-Square-Degree Survey. Astron. J. 2020, 159, 110. [Google Scholar] [CrossRef] [Green Version]
- Hilton, M.; Sifón, C.; Naess, S.; Madhavacheril, M.; Oguri, M.; Rozo, E.; Rykoff, E.; Abbott, T.M.C.; Adhikari, S.; Aguena, M.; et al. The Atacama Cosmology Telescope: A Catalog of >4000 Sunyaev–Zel’dovich Galaxy Clusters. Astrophys. J. Suppl. Ser. 2021, 253, 3. [Google Scholar] [CrossRef]
- Planck Collaboration; Ade, P.A.R.; Aghanim, N.; Armitage-Caplan, C.; Arnaud, M.; Ashdown, M.; Atrio-Barandela, F.; Aumont, J.; Aussel, H.; Baccigalupi, C.; et al. Planck 2013 Results. XXIX. The Planck Catalogue of Sunyaev-Zeldovich Sources. Astron. Astrophys. 2014, 571, A29. [Google Scholar] [CrossRef]
- Planck Collaboration; Ade, P.A.R.; Aghanim, N.; Arnaud, M.; Ashdown, M.; Aumont, J.; Baccigalupi, C.; Banday, A.J.; Barreiro, R.B.; Barrena, R.; et al. Planck 2015 Results: XXVII. The Second Planck Catalogue of Sunyaev-Zeldovich Sources. Astron. Astrophys. 2016, 594, A27. [Google Scholar] [CrossRef] [Green Version]
- Raghunathan, S. Assessing the Importance of Noise from Thermal Sunyaev-Zel’dovich Signals for CMB Cluster Surveys and Cluster Cosmology. Astrophys. J. 2022, 928, 16. [Google Scholar] [CrossRef]
- Sehgal, N.; Aiola, S.; Akrami, Y.; Basu, K.; Boylan-Kolchin, M.; Bryan, S.; Clesse, S.; Cyr-Racine, F.Y.; Di Mascolo, L.; Dicker, S.; et al. CMB-HD: An Ultra-Deep, High-Resolution Millimeter-Wave Survey Over Half the Sky. arXiv 2019, arXiv:1906.10134. [Google Scholar]
- Sobrin, J.A.; Anderson, A.J.; Bender, A.N.; Benson, B.A.; Dutcher, D.; Foster, A.; Goeckner-Wald, N.; Montgomery, J.; Nadolski, A.; Rahlin, A.; et al. The Design and Integrated Performance of SPT-3G. Astrophys. J. Suppl. Ser. 2022, 258, 42. [Google Scholar] [CrossRef]
- Swetz, D.S.; Ade, P.A.R.; Amiri, M.; Appel, J.W.; Battistelli, E.S.; Burger, B.; Chervenak, J.; Devlin, M.J.; Dicker, S.R.; Doriese, W.B.; et al. Overview of the Atacama Cosmology Telescope: Receiver, Instrumentation, and Telescope Systems. Astrophys. J. Suppl. Ser. 2011, 194, 41. [Google Scholar] [CrossRef]
- Tinker, J.; Kravtsov, A.V.; Klypin, A.; Abazajian, K.; Warren, M.; Yepes, G.; Gottlöber, S.; Holz, D.E. Toward a Halo Mass Function for Precision Cosmology: The Limits of Universality. Astrophys. J. 2008, 688, 709–728. [Google Scholar] [CrossRef]
- Boylan-Kolchin, M.; Springel, V.; White, S.D.M.; Jenkins, A.; Lemson, G. Resolving Cosmic Structure Formation with the Millennium-II Simulation. Mon. Not. R. Astron. Soc. 2009, 398, 1150–1164. [Google Scholar] [CrossRef] [Green Version]
- Overzier, R.A.; Guo, Q.; Kauffmann, G.; De Lucia, G.; Bouwens, R.; Lemson, G. ΛCDM Predictions for Galaxy Protoclusters—I. The Relation between Galaxies, Protoclusters and Quasars at z ~ 6. Mon. Not. R. Astron. Soc. 2009, 394, 577–594. [Google Scholar] [CrossRef] [Green Version]
- Lovell, C.C.; Thomas, P.A.; Wilkins, S.M. Characterising and Identifying Galaxy Protoclusters. Mon. Not. R. Astron. Soc. 2018, 474, 4612–4628. [Google Scholar] [CrossRef]
- Venemans, B.P.; Kurk, J.D.; Miley, G.K.; Röttgering, H.J.A.; van Breugel, W.; Carilli, C.L.; De Breuck, C.; Ford, H.; Heckman, T.; McCarthy, P.; et al. The Most Distant Structure of Galaxies Known: A Protocluster at Z = 4.1. Astrophys. J. 2002, 569, L11–L14. [Google Scholar] [CrossRef]
- Miley, G.; De Breuck, C. Distant Radio Galaxies and Their Environments. Astron. Astrophys. Rev. 2008, 15, 67. [Google Scholar] [CrossRef]
- Eisenhardt, P.R.M.; Wu, J.; Tsai, C.W.; Assef, R.; Benford, D.; Blain, A.; Bridge, C.; Condon, J.J.; Cushing, M.C.; Cutri, R.; et al. The First Hyper-luminous Infrared Galaxy Discovered by WISE. Astrophys. J. 2012, 755, 173. [Google Scholar] [CrossRef] [Green Version]
- Wu, J.; Tsai, C.W.; Sayers, J.; Benford, D.; Bridge, C.; Blain, A.; Eisenhardt, P.R.M.; Stern, D.; Petty, S.; Assef, R.; et al. Submillimeter Follow-up of WISE-selected Hyperluminous Galaxies. Astrophys. J. 2012, 756, 96. [Google Scholar] [CrossRef] [Green Version]
- Lonsdale, C.J.; Lacy, M.; Kimball, A.E.; Blain, A.; Whittle, M.; Wilkes, B.; Stern, D.; Condon, J.; Kim, M.; Assef, R.J.; et al. Radio Jet Feedback and Star Formation in Heavily Obscured, Hyperluminous Quasars at Redshifts ∼ 0.5-3. I. ALMA Observations. Astrophys. J. 2015, 813, 45. [Google Scholar] [CrossRef] [Green Version]
- Jones, S.F.; Blain, A.W.; Assef, R.J.; Eisenhardt, P.; Lonsdale, C.; Condon, J.; Farrah, D.; Tsai, C.W.; Bridge, C.; Wu, J.; et al. Overdensities of SMGs around WISE-selected, Ultraluminous, High-Redshift AGNs. Mon. Not. R. Astron. Soc. 2017, 469, 4565–4577. [Google Scholar] [CrossRef] [Green Version]
- Toft, S.; Smolčić, V.; Magnelli, B.; Karim, A.; Zirm, A.; Michalowski, M.; Capak, P.; Sheth, K.; Schawinski, K.; Krogager, J.K.; et al. Submillimeter Galaxies as Progenitors of Compact Quiescent Galaxies. Astrophys. J. 2014, 782, 68. [Google Scholar] [CrossRef] [Green Version]
- Stach, S.M.; Smail, I.; Amvrosiadis, A.; Swinbank, A.M.; Dudzevičiūtė, U.; Geach, J.E.; Almaini, O.; Birkin, J.E.; Chen, C.C.; Conselice, C.J.; et al. An ALMA Survey of the SCUBA-2 Cosmology Legacy Survey UKIDSS/UDS Field: Halo Masses for Submillimetre Galaxies. Mon. Not. R. Astron. Soc. 2021, 504, 172–184. [Google Scholar] [CrossRef]
- García-Vergara, C.; Hodge, J.; Hennawi, J.F.; Weiss, A.; Wardlow, J.; Myers, A.D.; Hickox, R. The Clustering of Submillimeter Galaxies Detected with ALMA. Astrophys. J. 2020, 904, 2. [Google Scholar] [CrossRef]
- Nelan, J.E.; Smith, R.J.; Hudson, M.J.; Wegner, G.A.; Lucey, J.R.; Moore, S.A.W.; Quinney, S.J.; Suntzeff, N.B. NOAO Fundamental Plane Survey. II. Age and Metallicity along the Red Sequence from Line-Strength Data. Astrophys. J. 2005, 632, 137–156. [Google Scholar] [CrossRef] [Green Version]
- De Lucia, G.; Springel, V.; White, S.D.M.; Croton, D.; Kauffmann, G. The Formation History of Elliptical Galaxies. Mon. Not. R. Astron. Soc. 2006, 366, 499–509. [Google Scholar] [CrossRef]
- Chapman, S.C.; Blain, A.; Ibata, R.; Ivison, R.J.; Smail, I.; Morrison, G. Do Submillimeter Galaxies Really Trace the Most Massive Dark-Matter Halos? Discovery of a High-z Cluster in a Highly Active Phase of Evolution. Astrophys. J. 2009, 691, 560–568. [Google Scholar] [CrossRef]
- Hayward, C.C.; Narayanan, D.; Kereš, D.; Jonsson, P.; Hopkins, P.F.; Cox, T.J.; Hernquist, L. Submillimetre Galaxies in a Hierarchical Universe: Number Counts, Redshift Distribution and Implications for the IMF. Mon. Not. R. Astron. Soc. 2013, 428, 2529–2547. [Google Scholar] [CrossRef] [Green Version]
- Miller, T.B.; Hayward, C.C.; Chapman, S.C.; Behroozi, P.S. The Bias of the Submillimetre Galaxy Population: SMGs Are Poor Tracers of the Most-Massive Structures in the z ∼ 2 Universe. Mon. Not. R. Astron. Soc. 2015, 452, 878–883. [Google Scholar] [CrossRef] [Green Version]
- Danielson, A.L.R.; Swinbank, A.M.; Smail, I.; Simpson, J.M.; Casey, C.M.; Chapman, S.C.; da Cunha, E.; Hodge, J.A.; Walter, F.; Wardlow, J.L.; et al. An ALMA Survey of Submillimeter Galaxies in the Extended Chandra Deep Field South: Spectroscopic Redshifts. Astrophys. J. 2017, 840, 78. [Google Scholar] [CrossRef] [Green Version]
- Hall, K.R.; Crichton, D.; Marriage, T.; Zakamska, N.L.; Mandelbaum, R. Downsizing of Star Formation Measured from the Clustered Infrared Background Correlated with Quasars. Mon. Not. R. Astron. Soc. 2018, 480, 149–181. [Google Scholar] [CrossRef] [Green Version]
- Cole, S.; Kaiser, N. Biased Clustering in the Cold Dark Matter Cosmogony. Mon. Not. R. Astron. Soc. 1989, 237, 1127–1146. [Google Scholar] [CrossRef] [Green Version]
- Mo, H.J.; Jing, Y.P.; White, S.D.M. The Correlation Function of Clusters of Galaxies and the Amplitude of Mass Fluctuations in the Universe. Mon. Not. R. Astron. Soc. 1996, 282, 1096–1104. [Google Scholar] [CrossRef] [Green Version]
- Cooray, A.; Sheth, R. Halo Models of Large Scale Structure. Phys. Rep. 2002, 372, 1–129. [Google Scholar] [CrossRef] [Green Version]
- Williams, C.C.; Giavalisco, M.; Porciani, C.; Yun, M.S.; Pope, A.; Scott, K.S.; Austermann, J.E.; Aretxaga, I.; Hatsukade, B.; Lee, K.S.; et al. On the Clustering of Submillimeter Galaxies. Astrophys. J. 2011, 733, 92. [Google Scholar] [CrossRef]
- Hickox, R.C.; Wardlow, J.L.; Smail, I.; Myers, A.D.; Alexander, D.M.; Swinbank, A.M.; Danielson, A.L.R.; Stott, J.P.; Chapman, S.C.; Coppin, K.E.K.; et al. The LABOCA Survey of the Extended Chandra Deep Field-South: Clustering of Submillimetre Galaxies. Mon. Not. R. Astron. Soc. 2012, 421, 284–295. [Google Scholar] [CrossRef] [Green Version]
- Hodge, J.A.; da Cunha, E. High-Redshift Star Formation in the Atacama Large Millimetre/Submillimetre Array Era. R. Soc. Open Sci. 2020, 7, 200556. [Google Scholar] [CrossRef]
- Marrone, D.P.; Spilker, J.S.; Hayward, C.C.; Vieira, J.D.; Aravena, M.; Ashby, M.L.N.; Bayliss, M.B.; Béthermin, M.; Brodwin, M.; Bothwell, M.S.; et al. Galaxy Growth in a Massive Halo in the First Billion Years of Cosmic History. Nature 2018, 553, 51–54. [Google Scholar] [CrossRef] [Green Version]
- Blain, A.W.; Chapman, S.C.; Smail, I.; Ivison, R. Clustering of Submillimeter-selected Galaxies. Astrophys. J. 2004, 611, 725–731. [Google Scholar] [CrossRef] [Green Version]
- Chapman, S.C.; Blain, A.W.; Smail, I.; Ivison, R.J. A Redshift Survey of the Submillimeter Galaxy Population. Astrophys. J. 2005, 622, 772–796. [Google Scholar] [CrossRef] [Green Version]
- Geach, J.E.; Matsuda, Y.; Smail, I.; Chapman, S.C.; Yamada, T.; Ivison, R.J.; Hayashino, T.; Ohta, K.; Shioya, Y.; Taniguchi, Y. A Submillimetre Survey of Lyman α Haloes in the SA22 Protocluster at z = 3.1. Mon. Not. R. Astron. Soc. 2005, 363, 1398–1408. [Google Scholar] [CrossRef] [Green Version]
- Tamura, Y.; Kohno, K.; Nakanishi, K.; Hatsukade, B.; Iono, D.; Wilson, G.W.; Yun, M.S.; Takata, T.; Matsuda, Y.; Tosaki, T.; et al. Spatial Correlation between Submillimetre and Lyman-alpha Galaxies in the SSA 22 Protocluster. Nature 2009, 459, 61–63. [Google Scholar] [CrossRef] [Green Version]
- Scoville, N.; Aussel, H.; Brusa, M.; Capak, P.; Carollo, C.M.; Elvis, M.; Giavalisco, M.; Guzzo, L.; Hasinger, G.; Impey, C.; et al. The Cosmic Evolution Survey (COSMOS): Overview. Astrophys. J. Suppl. Ser. 2007, 172, 1–8. [Google Scholar] [CrossRef]
- Casey, C.M.; Cooray, A.; Capak, P.; Fu, H.; Kovac, K.; Lilly, S.; Sanders, D.B.; Scoville, N.Z.; Treister, E. A massive, distant proto-cluster at z = 2.47 caught in a phase of rapid formation? Astrophys. J. 2015, 808, L33. [Google Scholar] [CrossRef] [Green Version]
- Casey, C.M. The ubiquity of coeval starbursts in massive galaxy cluster progenitors. Astrophys. J. 2016, 824, 36. [Google Scholar] [CrossRef] [Green Version]
- Clements, D.L.; Braglia, F.G.; Hyde, A.K.; Pérez-Fournon, I.; Bock, J.; Cava, A.; Chapman, S.; Conley, A.; Cooray, A.; Farrah, D.; et al. Herschel Multitiered Extragalactic Survey: Clusters of Dusty Galaxies Uncovered by Herschel★ and Planck†. Mon. Not. R. Astron. Soc. 2014, 439, 1193–1211. [Google Scholar] [CrossRef] [Green Version]
- Planck Collaboration; Aghanim, N.; Altieri, B.; Arnaud, M.; Ashdown, M.; Aumont, J.; Baccigalupi, C.; Banday, A.J.; Barreiro, R.B.; Bartolo, N.; et al. Planck Intermediate Results: XXVII. High-redshift Infrared Galaxy Overdensity Candidates and Lensed Sources Discovered by Planck and Confirmed by Herschel-SPIRE★. Astron. Astrophys. 2015, 582, A30. [Google Scholar] [CrossRef]
- Planck Collaboration; Ade, P.A.R.; Aghanim, N.; Argüeso, F.; Arnaud, M.; Ashdown, M.; Aumont, J.; Baccigalupi, C.; Banday, A.J.; Barreiro, R.B.; et al. Planck 2015 Results: XXVI. The Second Planck Catalogue of Compact Sources. Astron. Astrophys. 2016, 594, A26. [Google Scholar] [CrossRef] [Green Version]
- Bridge, C.R.; Blain, A.; Borys, C.J.K.; Petty, S.; Benford, D.; Eisenhardt, P.; Farrah, D.; Griffith, R.L.; Jarrett, T.; Lonsdale, C.; et al. A New Population of High-z, Dusty Lyα Emitters and Blobs Discovered by WISE: Feedback Caught in the Act? Astrophys. J. 2013, 769, 91. [Google Scholar] [CrossRef] [Green Version]
- Jones, S.F.; Blain, A.W.; Stern, D.; Assef, R.J.; Bridge, C.R.; Eisenhardt, P.; Petty, S.; Wu, J.; Tsai, C.W.; Cutri, R.; et al. Submillimetre Observations of WISE-selected High-Redshift, Luminous, Dusty Galaxies. Mon. Not. R. Astron. Soc. 2014, 443, 146–157. [Google Scholar] [CrossRef] [Green Version]
- Jones, S.F.; Blain, A.W.; Lonsdale, C.; Condon, J.; Farrah, D.; Stern, D.; Tsai, C.W.; Assef, R.J.; Bridge, C.; Kimball, A.; et al. Submillimetre Observations of WISE/Radio-Selected AGN and Their Environments. Mon. Not. R. Astron. Soc. 2015, 448, 3325–3338. [Google Scholar] [CrossRef] [Green Version]
- Assef, R.J.; Eisenhardt, P.R.M.; Stern, D.; Tsai, C.W.; Wu, J.; Wylezalek, D.; Blain, A.W.; Bridge, C.R.; Donoso, E.; Gonzales, A.; et al. Half of the Most Luminous Quasars May Be Obscured: Investigating the Nature of WISE-Selected Hot Dust-Obscured Galaxies. Astrophys. J. 2015, 804, 27. [Google Scholar] [CrossRef]
- Penney, J.I.; Blain, A.W.; Wylezalek, D.; Hatch, N.A.; Lonsdale, C.; Kimball, A.; Assef, R.J.; Condon, J.J.; Eisenhardt, P.R.M.; Jones, S.F.; et al. The Environments of Luminous Radio-WISE Selected Infrared Galaxies. Mon. Not. R. Astron. Soc. 2019, 483, 514–528. [Google Scholar] [CrossRef] [Green Version]
- Fan, L.; Han, Y.; Fang, G.; Gao, Y.; Zhang, D.; Jiang, X.; Wu, Q.; Yang, J.; Li, Z. The Most Luminous Heavily Obscured Quasars Have a High Merger Fraction: Morphological Study of WISE-selected Hot Dust-obscured Galaxies. Astrophys. J. 2016, 822, L32. [Google Scholar] [CrossRef] [Green Version]
- Penney, J.I.; Blain, A.W.; Assef, R.J.; Diaz-Santos, T.; González-López, J.; Tsai, C.W.; Aravena, M.; Eisenhardt, P.R.M.; Jones, S.F.; Jun, H.D.; et al. Cold Molecular Gas and Free-Free Emission from Hot, Dust-Obscured Galaxies at z ∼ 3. Mon. Not. R. Astron. Soc. 2020, 496, 1565–1578. [Google Scholar] [CrossRef]
- Capak, P.L.; Riechers, D.; Scoville, N.Z.; Carilli, C.; Cox, P.; Neri, R.; Robertson, B.; Salvato, M.; Schinnerer, E.; Yan, L.; et al. A Massive Proto-Cluster of Galaxies at a Redshift of z ≈ 5.3. Nature 2011, 470, 233–235. [Google Scholar] [CrossRef] [PubMed] [Green Version]
- Marsan, Z.C.; Marchesini, D.; Brammer, G.B.; Stefanon, M.; Muzzin, A.; Fernández-Soto, A.; Geier, S.; Hainline, K.N.; Intema, H.; Karim, A.; et al. Spectroscopic Confirmation of an Ultra Massive and Compact Galaxy at z = 3.35: A Detailed Look at an Early Progenitor of Local Giant Ellipticals. Astrophys. J. 2015, 801, 133. [Google Scholar] [CrossRef]
- Marsan, Z.C.; Marchesini, D.; Brammer, G.B.; Geier, S.; Kado-Fong, E.; Labbé, I.; Muzzin, A.; Stefanon, M. A Spectroscopic Follow-up Program of Very Massive Galaxies at 3 < z < 4: Confirmation of Spectroscopic Redshifts, and a High Fraction of Powerful AGNs. Astrophys. J. 2017, 842, 21. [Google Scholar] [CrossRef] [Green Version]
- Glazebrook, K.; Schreiber, C.; Labbé, I.; Nanayakkara, T.; Kacprzak, G.G.; Oesch, P.A.; Papovich, C.; Spitler, L.R.; Straatman, C.M.S.; Tran, K.V.H.; et al. A Massive, Quiescent Galaxy at a Redshift of 3.717. Nature 2017, 544, 71–74. [Google Scholar] [CrossRef]
- Tanaka, M.; Valentino, F.; Toft, S.; Onodera, M.; Shimakawa, R.; Ceverino, D.; Faisst, A.L.; Gallazzi, A.; Gómez-Guijarro, C.; Kubo, M.; et al. Stellar Velocity Dispersion of a Massive Quenching Galaxy at z = 4.01. Astrophys. J. 2019, 885, L34. [Google Scholar] [CrossRef] [Green Version]
- Valentino, F.; Tanaka, M.; Davidzon, I.; Toft, S.; Gómez-Guijarro, C.; Stockmann, M.; Onodera, M.; Brammer, G.; Ceverino, D.; Faisst, A.L.; et al. Quiescent Galaxies 1.5 Billion Years after the Big Bang and Their Progenitors. Astrophys. J. 2020, 889, 93. [Google Scholar] [CrossRef]
- Saracco, P.; Marchesini, D.; La Barbera, F.; Gargiulo, A.; Annunziatella, M.; Forrest, B.; Lange Vagle, D.J.; Marsan, Z.C.; Muzzin, A.; Stefanon, M.; et al. The Rapid Buildup of Massive Early-type Galaxies: Supersolar Metallicity, High Velocity Dispersion, and Young Age for an Early-type Galaxy at z = 3.35. Astrophys. J. 2020, 905, 40. [Google Scholar] [CrossRef]
- Ando, M.; Shimasaku, K.; Momose, R. A Systematic Search for Galaxy Proto-Cluster Cores at z ∼ 2. Mon. Not. R. Astron. Soc. 2020, 496, 3169–3181. [Google Scholar] [CrossRef]
- McConachie, I.; Wilson, G.; Forrest, B.; Marsan, Z.C.; Muzzin, A.; Cooper, M.C.; Annunziatella, M.; Marchesini, D.; Chan, J.C.C.; Gomez, P.; et al. Spectroscopic Confirmation of a Protocluster at z = 3.37 with a High Fraction of Quiescent Galaxies. Astrophys. J. 2022, 926, 37. [Google Scholar] [CrossRef]
- Forrest, B.; Annunziatella, M.; Wilson, G.; Marchesini, D.; Muzzin, A.; Cooper, M.C.; Marsan, Z.C.; McConachie, I.; Chan, J.C.C.; Gomez, P.; et al. An Extremely Massive Quiescent Galaxy at z = 3.493: Evidence of Insufficiently Rapid Quenching Mechanisms in Theoretical Models. Astrophys. J. 2020, 890, L1. [Google Scholar] [CrossRef] [Green Version]
- Forrest, B.; Marsan, Z.C.; Annunziatella, M.; Wilson, G.; Muzzin, A.; Marchesini, D.; Cooper, M.C.; Chan, J.C.C.; McConachie, I.; Gomez, P.; et al. The Massive Ancient Galaxies at z > 3 NEar-infrared (MAGAZ3NE) Survey: Confirmation of Extremely Rapid Star Formation and Quenching Timescales for Massive Galaxies in the Early Universe. Astrophys. J. 2020, 903, 47. [Google Scholar] [CrossRef]
- Lacaille, K.M.; Chapman, S.C.; Smail, I.; Steidel, C.C.; Blain, A.W.; Geach, J.; Golob, A.; Gurwell, M.; Ivison, R.J.; Reddy, N.; et al. Two Sub-Millimetre Bright Protoclusters Bounding the Epoch of Peak Star-Formation Activity. Mon. Not. R. Astron. Soc. 2019, 488, 1790–1812. [Google Scholar] [CrossRef]
- Wang, T.; Elbaz, D.; Daddi, E.; Finoguenov, A.; Liu, D.; Schreiber, C.; Martín, S.; Strazzullo, V.; Valentino, F.; van der Burg, R.; et al. Discovery of a galaxy cluster with a violently starbursting core at z = 2.506. Astrophys. J. 2016, 828, 56. [Google Scholar] [CrossRef] [Green Version]
- Alexander, D.M.; Simpson, J.M.; Harrison, C.M.; Mullaney, J.R.; Smail, I.; Geach, J.E.; Hickox, R.C.; Hine, N.K.; Karim, A.; Kubo, M.; et al. ALMA Observations of a z ≈ 3.1 Protocluster: Star Formation from Active Galactic Nuclei and Lyman-alpha Blobs in an Overdense Environment. Mon. Not. R. Astron. Soc. 2016, 461, 2944–2952. [Google Scholar] [CrossRef] [Green Version]
- Chiang, Y.K.; Overzier, R.A.; Gebhardt, K.; Finkelstein, S.L.; Chiang, C.T.; Hill, G.J.; Blanc, G.A.; Drory, N.; Chonis, T.S.; Zeimann, G.R.; et al. Surveying Galaxy Proto-clusters in Emission: A Large-scale Structure at z = 2.44 and the Outlook for HETDEX. Astrophys. J. 2015, 808, 37. [Google Scholar] [CrossRef] [Green Version]
- Chapman, S.C.; Bertoldi, F.; Smail, I.; Blain, A.W.; Geach, J.E.; Gurwell, M.; Ivison, R.J.; Petitpas, G.R.; Reddy, N.; Steidel, C.C. A Blind CO Detection of a Distant Red Galaxy in the HS1700+64 Protocluster. Mon. Not. R. Astron. Soc. 2015, 449, L68–L72. [Google Scholar] [CrossRef]
- Emonts, B.H.C.; Lehnert, M.D.; Villar-Martín, M.; Norris, R.P.; Ekers, R.D.; van Moorsel, G.A.; Dannerbauer, H.; Pentericci, L.; Miley, G.K.; Allison, J.R.; et al. Molecular Gas in the Halo Fuels the Growth of a Massive Cluster Galaxy at High Redshift. Science 2016, 354, 1128–1130. [Google Scholar] [CrossRef] [Green Version]
- Emonts, B.H.C.; Lehnert, M.D.; Dannerbauer, H.; De Breuck, C.; Villar-Martín, M.; Miley, G.K.; Allison, J.R.; Gullberg, B.; Hatch, N.A.; Guillard, P.; et al. Giant Galaxy Growing from Recycled Gas: ALMA Maps the Circumgalactic Molecular Medium of the Spiderweb in [C i]. Mon. Not. R. Astron. Soc. 2018, 477, L60–L65. [Google Scholar] [CrossRef]
- Dannerbauer, H.; Kurk, J.D.; De Breuck, C.; Wylezalek, D.; Santos, J.S.; Koyama, Y.; Seymour, N.; Tanaka, M.; Hatch, N.; Altieri, B.; et al. An Excess of Dusty Starbursts Related to the Spiderweb Galaxy. Astron. Astrophys. 2014, 570, A55. [Google Scholar] [CrossRef] [Green Version]
- Diener, C.; Lilly, S.J.; Ledoux, C.; Zamorani, G.; Bolzonella, M.; Murphy, D.N.A.; Capak, P.; Ilbert, O.; McCracken, H. A Protocluster at z = 2.45. Astrophys. J. 2015, 802, 31. [Google Scholar] [CrossRef] [Green Version]
- Gómez-Guijarro, C.; Riechers, D.A.; Pavesi, R.; Magdis, G.E.; Leung, T.K.D.; Valentino, F.; Toft, S.; Aravena, M.; Chapman, S.C.; Clements, D.L.; et al. Confirming Herschel Candidate Protoclusters from ALMA/VLA CO Observations. Astrophys. J. 2019, 872, 117. [Google Scholar] [CrossRef] [Green Version]
- Hayashino, T.; Matsuda, Y.; Tamura, H.; Yamauchi, R.; Yamada, T.; Ajiki, M.; Fujita, S.S.; Murayama, T.; Nagao, T.; Ohta, K.; et al. Large-Scale Structure of Emission-Line Galaxies at Z = 3.1. Astron. J. 2004, 128, 2073–2079. [Google Scholar] [CrossRef]
- Hung, C.L.; Casey, C.M.; Chiang, Y.K.; Capak, P.L.; Cowley, M.J.; Darvish, B.; Kacprzak, G.G.; Kovač, K.; Lilly, S.J.; Nanayakkara, T.; et al. Large-scale structure around a z = 2.1 cluster. Astrophys. J. 2016, 826, 130. [Google Scholar] [CrossRef] [Green Version]
- Harikane, Y.; Ouchi, M.; Ono, Y.; Fujimoto, S.; Donevski, D.; Shibuya, T.; Faisst, A.L.; Goto, T.; Hatsukade, B.; Kashikawa, N.; et al. SILVERRUSH. VIII. Spectroscopic Identifications of Early Large-scale Structures with Protoclusters over 200 Mpc at z ∼ 6–7: Strong Associations of Dusty Star-forming Galaxies. Astrophys. J. 2019, 883, 142. [Google Scholar] [CrossRef] [Green Version]
- Hill, R.; Chapman, S.; Scott, D.; Apostolovski, Y.; Aravena, M.; Béthermin, M.; Bradford, C.M.; Canning, R.E.A.; De Breuck, C.; Dong, C.; et al. Megaparsec-Scale Structure around the Protocluster Core SPT2349–56 at z = 4.3. Mon. Not. R. Astron. Soc. 2020, 495, 3124–3159. [Google Scholar] [CrossRef]
- Kurk, J.D.; Röttgering, H.J.A.; Pentericci, L.; Miley, G.K.; van Breugel, W.; Carilli, C.L.; Ford, H.; Heckman, T.; McCarthy, P.; Moorwood, A. A Search for Clusters at High Redshift. I. Candidate Lyalpha Emitters near 1138-262 at Z = 2.2. Astron. Astrophys. 2000, 358, L1. [Google Scholar]
- Kuiper, E.; Hatch, N.A.; Miley, G.K.; Nesvadba, N.P.H.; Röttgering, H.J.A.; Kurk, J.D.; Lehnert, M.D.; Overzier, R.A.; Pentericci, L.; Schaye, J.; et al. A SINFONI View of Flies in the Spiderweb: A Galaxy Cluster in the Making. Mon. Not. R. Astron. Soc. 2011, 415, 2245–2256. [Google Scholar] [CrossRef] [Green Version]
- Kubo, M.; Uchimoto, Y.K.; Yamada, T.; Kajisawa, M.; Ichikawa, T.; Matsuda, Y.; Akiyama, M.; Hayashino, T.; Konishi, M.; Nishimura, T.; et al. The Formation of the Massive Galaxies in the SSA22 z = 3.1 Protocluster. Astrophys. J. 2013, 778, 170. [Google Scholar] [CrossRef] [Green Version]
- Kubo, M.; Yamada, T.; Ichikawa, T.; Kajisawa, M.; Matsuda, Y.; Tanaka, I. NIR Spectroscopic Observation of Massive Galaxies in the Protocluster at z = 3.09. Astrophys. J. 2015, 799, 38. [Google Scholar] [CrossRef] [Green Version]
- Kato, Y.; Matsuda, Y.; Smail, I.; Swinbank, A.M.; Hatsukade, B.; Umehata, H.; Tanaka, I.; Saito, T.; Iono, D.; Tamura, Y.; et al. Herschel Protocluster Survey: A Search for Dusty Star-Forming Galaxies in Protoclusters at z = 2–3. Mon. Not. R. Astron. Soc. 2016, 460, 3861–3872. [Google Scholar] [CrossRef] [Green Version]
- Koyama, Y.; Polletta, M.d.C.; Tanaka, I.; Kodama, T.; Dole, H.; Soucail, G.; Frye, B.; Lehnert, M.; Scodeggio, M. A Planck -Selected Dusty Proto-Cluster at z = 2.16 Associated with a Strong Overdensity of Massive Hα-emitting Galaxies. Mon. Not. R. Astron. Soc. 2021, 503, L1–L5. [Google Scholar] [CrossRef]
- Kubo, M.; Umehata, H.; Matsuda, Y.; Kajisawa, M.; Steidel, C.C.; Yamada, T.; Tanaka, I.; Hatsukade, B.; Tamura, Y.; Nakanishi, K.; et al. A Massive Quiescent Galaxy Confirmed in a Protocluster at z = 3.09. Astrophys. J. 2021, 919, 6. [Google Scholar] [CrossRef]
- Jiang, L.; Wu, J.; Bian, F.; Chiang, Y.K.; Ho, L.C.; Shen, Y.; Zheng, Z.Y.; Bailey, J.I.; Blanc, G.A.; Crane, J.D.; et al. A Giant Protocluster of Galaxies at Redshift 5.7. Nat. Astron. 2018, 2, 962–966. [Google Scholar] [CrossRef]
- Jin, S.; Dannerbauer, H.; Emonts, B.; Serra, P.; Lagos, C.D.P.; Thomson, A.P.; Bassini, L.; Lehnert, M.; Allison, J.R.; Champagne, J.B.; et al. ATCA CO(1-0) Survey and Luminosity Function in the Spiderweb Protocluster at Z = 2.16. Astron. Astrophys. 2021, 652, A11. [Google Scholar] [CrossRef]
- Lehmer, B.D.; Alexander, D.M.; Chapman, S.C.; Smail, I.; Bauer, F.E.; Brandt, W.N.; Geach, J.E.; Matsuda, Y.; Mullaney, J.R.; Swinbank, A.M. The Chandra Deep Protocluster Survey: Point-Source Catalogues for a 400-Ks Observation of the z = 3.09 Protocluster in SSA22. Mon. Not. R. Astron. Soc. 2009, 400, 299–316. [Google Scholar] [CrossRef] [Green Version]
- Lewis, A.J.R.; Ivison, R.J.; Best, P.N.; Simpson, J.M.; Weiss, A.; Oteo, I.; Zhang, Z.Y.; Arumugam, V.; Bremer, M.N.; Chapman, S.C.; et al. Ultra-Red Galaxies Signpost Candidate Protoclusters at High Redshift. Astrophys. J. 2018, 862, 96. [Google Scholar] [CrossRef]
- Long, A.S.; Cooray, A.; Ma, J.; Casey, C.M.; Wardlow, J.L.; Nayyeri, H.; Ivison, R.J.; Farrah, D.; Dannerbauer, H. Emergence of an Ultrared, Ultramassive Galaxy Cluster Core at z = 4. Astrophys. J. 2020, 898, 133. [Google Scholar] [CrossRef]
- Miller, T.B.; Chapman, S.C.; Aravena, M.; Ashby, M.L.N.; Hayward, C.C.; Vieira, J.D.; Weiß, A.; Babul, A.; Béthermin, M.; Bradford, C.M.; et al. A Massive Core for a Cluster of Galaxies at a Redshift of 4.3. Nature 2018, 556, 469–472. [Google Scholar] [CrossRef]
- Ouchi, M.; Shimasaku, K.; Akiyama, M.; Sekiguchi, K.; Furusawa, H.; Okamura, S.; Kashikawa, N.; Iye, M.; Kodama, T.; Saito, T.; et al. The Discovery of Primeval Large-Scale Structures with Forming Clusters at Redshift 6. Astrophys. J. 2005, 620, L1–L4. [Google Scholar] [CrossRef] [Green Version]
- Oteo, I.; Ivison, R.J.; Dunne, L.; Manilla-Robles, A.; Maddox, S.; Lewis, A.J.R.; de Zotti, G.; Bremer, M.; Clements, D.L.; Cooray, A.; et al. An Extreme Protocluster of Luminous Dusty Starbursts in the Early Universe. Astrophys. J. 2018, 856, 72. [Google Scholar] [CrossRef] [Green Version]
- Pentericci, L.; Kurk, J.D.; Röttgering, H.J.A.; Miley, G.K.; van Breugel, W.; Carilli, C.L.; Ford, H.; Heckman, T.; McCarthy, P.; Moorwood, A. A Search for Clusters at High Redshift. II. A Proto Cluster around a Radio Galaxy at Z = 2.16. Astron. Astrophys. 2000, 361, L25. [Google Scholar]
- Polletta, M.; Soucail, G.; Dole, H.; Lehnert, M.D.; Pointecouteau, E.; Vietri, G.; Scodeggio, M.; Montier, L.; Koyama, Y.; Lagache, G.; et al. Spectroscopic Observations of PHz G237.01+42.50: A Galaxy Protocluster at z = 2.16 in the Cosmos Field. Astron. Astrophys. 2021, 654, A121. [Google Scholar] [CrossRef]
- Rigby, E.E.; Hatch, N.A.; Röttgering, H.J.A.; Sibthorpe, B.; Chiang, Y.K.; Overzier, R.; Herbonnet, R.; Borgani, S.; Clements, D.L.; Dannerbauer, H.; et al. Searching for Large-Scale Structures around High-Redshift Radio Galaxies with Herschel. Mon. Not. R. Astron. Soc. 2014, 437, 1882–1893. [Google Scholar] [CrossRef] [Green Version]
- Rotermund, K.M.; Chapman, S.C.; Phadke, K.A.; Hill, R.; Pass, E.; Aravena, M.; Ashby, M.L.N.; Babul, A.; Béthermin, M.; Canning, R.; et al. Optical and Near-Infrared Observations of the SPT2349-56 Proto-Cluster Core at z = 4.3. Mon. Not. R. Astron. Soc. 2021, 502, 1797–1815. [Google Scholar] [CrossRef]
- Steidel, C.C.; Adelberger, K.L.; Dickinson, M.; Giavalisco, M.; Pettini, M.; Kellogg, M. A Large Structure of Galaxies at Redshift Z Approximately 3 and Its Cosmological Implications. Astrophys. J. 1998, 492, 428–438. [Google Scholar] [CrossRef] [Green Version]
- Steidel, C.C.; Adelberger, K.L.; Shapley, A.E.; Pettini, M.; Dickinson, M.; Giavalisco, M. Lyα Imaging of a Proto-Cluster Region at =3.09. Astrophys. J. 2000, 532, 170–182. [Google Scholar] [CrossRef] [Green Version]
- Spitler, L.R.; Labbé, I.; Glazebrook, K.; Persson, S.E.; Monson, A.; Papovich, C.; Tran, K.V.H.; Poole, G.B.; Quadri, R.; van Dokkum, P.; et al. First Results from Z -FOURGE: Discovery of a Candidate Cluster at z = 2.2 in COSMOS. Astrophys. J. 2012, 748, L21. [Google Scholar] [CrossRef] [Green Version]
- Shimakawa, R.; Kodama, T.; Tadaki, K.I.; Tanaka, I.; Hayashi, M.; Koyama, Y. Identification of the Progenitors of Rich Clusters and Member Galaxies in Rapid Formation at z > 2. Mon. Not. R. Astron. Soc. 2014, 441, L1–L5. [Google Scholar] [CrossRef] [Green Version]
- Tadaki, K.i.; Kodama, T.; Hayashi, M.; Shimakawa, R.; Koyama, Y.; Lee, M.; Tanaka, I.; Hatsukade, B.; Iono, D.; Kohno, K.; et al. Environmental Impacts on Molecular Gas in Protocluster Galaxies at z ∼ 2. Publ. Astron. Soc. Jpn. 2019, 71. [Google Scholar] [CrossRef] [Green Version]
- Uchimoto, Y.K.; Yamada, T.; Kajisawa, M.; Kubo, M.; Ichikawa, T.; Matsuda, Y.; Akiyama, M.; Hayashino, T.; Konishi, M.; Nishimura, T.; et al. Assembly of Massive Galaxies in a High-z Protocluster. Astrophys. J. 2012, 750, 116. [Google Scholar] [CrossRef] [Green Version]
- Umehata, H.; Tamura, Y.; Kohno, K.; Hatsukade, B.; Scott, K.S.; Kubo, M.; Yamada, T.; Ivison, R.J.; Cybulski, R.; Aretxaga, I.; et al. AzTEC/ASTE 1.1-Mm Survey of SSA22: Counterpart Identification and Photometric Redshift Survey of Submillimetre Galaxies. Mon. Not. R. Astron. Soc. 2014, 440, 3462–3478. [Google Scholar] [CrossRef] [Green Version]
- Umehata, H.; Tamura, Y.; Kohno, K.; Ivison, R.J.; Alexander, D.M.; Geach, J.E.; Hatsukade, B.; Hughes, D.H.; Ikarashi, S.; Kato, Y.; et al. Alma deep field in ssa22: A concentration of dusty starbursts in a z = 3.09 protocluster core. Astrophys. J. 2015, 815, L8. [Google Scholar] [CrossRef] [Green Version]
- Umehata, H.; Tamura, Y.; Kohno, K.; Ivison, R.J.; Smail, I.; Hatsukade, B.; Nakanishi, K.; Kato, Y.; Ikarashi, S.; Matsuda, Y.; et al. ALMA Deep Field in SSA22: Source Catalog and Number Counts. Astrophys. J. 2017, 835, 98. [Google Scholar] [CrossRef]
- Valtchanov, I.; Altieri, B.; Berta, S.; Chapin, E.; Coia, D.; Conversi, L.; Dannerbauer, H.; Domínguez-Sánchez, H.; Rawle, T.D.; Sánchez-Portal, M.; et al. Serendipitous Detection of an Overdensity of Herschel-SPIRE 250 Mm Sources South of MRC 1138-26. Mon. Not. R. Astron. Soc. 2013, 436, 2505–2514. [Google Scholar] [CrossRef]
- Wang, G.; Hill, R.; Chapman, S.C.; Weiß, A.; Scott, D.; Aravena, M.; Archipley, M.A.; Béthermin, M.; De Breuck, C.; Canning, R.E.A.; et al. Overdensities of Submillimetre-Bright Sources around Candidate Protocluster Cores Selected from the South Pole Telescope Survey. Mon. Not. R. Astron. Soc. 2021, 508, 3754–3770. [Google Scholar] [CrossRef]
- Yuan, T.; Nanayakkara, T.; Kacprzak, G.G.; Tran, K.V.H.; Glazebrook, K.; Kewley, L.J.; Spitler, L.R.; Poole, G.B.; Labbé, I.; Straatman, C.M.S.; et al. Keck/MOSFIRE Spectroscopic Confirmation of a Virgo-like Cluster Ancestor at z = 2.095. Astrophys. J. 2014, 795, L20. [Google Scholar] [CrossRef] [Green Version]
- Zeballos, M.; Aretxaga, I.; Hughes, D.H.; Humphrey, A.; Wilson, G.W.; Austermann, J.; Dunlop, J.S.; Ezawa, H.; Ferrusca, D.; Hatsukade, B.; et al. AzTEC 1.1 Mm Observations of High-z Protocluster Environments: SMG Overdensities and Misalignment between AGN Jets and SMG Distribution. Mon. Not. R. Astron. Soc. 2018, 479, 4577–4632. [Google Scholar] [CrossRef] [Green Version]
- Zavala, J.A.; Casey, C.M.; Scoville, N.; Champagne, J.B.; Chiang, Y.; Dannerbauer, H.; Drew, P.; Fu, H.; Spilker, J.; Spitler, L.; et al. On the Gas Content, Star Formation Efficiency, and Environmental Quenching of Massive Galaxies in Protoclusters at z ≈ 2.0–2.5. Astrophys. J. 2019, 887, 183. [Google Scholar] [CrossRef] [Green Version]
- Zhang, Y.; Zheng, X.Z.; Shi, D.D.; Gao, Y.; Dannerbauer, H.; An, F.X.; Shu, X.; Gao, Z.K.; Wang, W.H.; Wang, X.; et al. Submillimetre Galaxies in Two Massive Protoclusters at z = 2.24: Witnessing the Enrichment of Extreme Starbursts in the Outskirts of HAE Density Peaks. Mon. Not. R. Astron. Soc. 2022, 512, 4893–4908. [Google Scholar] [CrossRef]
- Negrello, M.; González-Nuevo, J.; Magliocchetti, M.; Moscardini, L.; De Zotti, G.; Toffolatti, L.; Danese, L. Effect of Clustering on Extragalactic Source Counts with Low-Resolution Instruments. Mon. Not. R. Astron. Soc. 2005, 358, 869–874. [Google Scholar] [CrossRef] [Green Version]
- Magnelli, B.; Lutz, D.; Saintonge, A.; Berta, S.; Santini, P.; Symeonidis, M.; Altieri, B.; Andreani, P.; Aussel, H.; Béthermin, M.; et al. The Evolution of the Dust Temperatures of Galaxies in the SFR-M* Plane up to z ∼ 2. Astron. Astrophys. 2014, 561, A86. [Google Scholar] [CrossRef] [Green Version]
- Franceschini, A.; Toffolatti, L.; Mazzei, P.; Danese, L.; de Zotti, G. Galaxy Counts and Contributions to the Background Radiation from 1 Mm to 1000 Mim. Astron. Astrophys. Suppl. Ser. 1991, 89, 285. [Google Scholar]
- Planck Collaboration; Ade, P.A.R.; Aghanim, N.; Arnaud, M.; Ashdown, M.; Aumont, J.; Baccigalupi, C.; Balbi, A.; Banday, A.J.; Barreiro, R.B.; et al. Planck Early Results. VII. The Early Release Compact Source Catalogue. Astron. Astrophys. 2011, 536, A7. [Google Scholar] [CrossRef] [Green Version]
- Planck Collaboration; Ade, P.A.R.; Aghanim, N.; Argüeso, F.; Armitage-Caplan, C.; Arnaud, M.; Ashdown, M.; Atrio-Barandela, F.; Aumont, J.; Baccigalupi, C.; et al. Planck 2013 Results. XXVIII. The Planck Catalogue of Compact Sources. Astron. Astrophys. 2014, 571, A28. [Google Scholar] [CrossRef] [Green Version]
- Herranz, D.; González-Nuevo, J.; Clements, D.L.; Clemens, M.; De Zotti, G.; Lopez-Caniego, M.; Lapi, A.; Rodighiero, G.; Danese, L.; Fu, H.; et al. Herschel -ATLAS: Planck Sources in the Phase 1 Fields. Astron. Astrophys. 2013, 549, A31. [Google Scholar] [CrossRef]
- Baes, M.; Herranz, D.; Bianchi, S.; Ciesla, L.; Clemens, M.; De Zotti, G.; Allaert, F.; Auld, R.; Bendo, G.J.; Boquien, M.; et al. The Herschel Virgo Cluster Survey. XV. Planck Submillimetre Sources in the Virgo Cluster. Astron. Astrophys. 2014, 562, A106. [Google Scholar] [CrossRef] [Green Version]
- Greenslade, J.; Clements, D.L.; Cheng, T.; De Zotti, G.; Scott, D.; Valiante, E.; Eales, S.; Bremer, M.N.; Dannerbauer, H.; Birkinshaw, M.; et al. Candidate High-z Protoclusters among the Planck Compact Sources, as Revealed by Herschel–SPIRE. Mon. Not. R. Astron. Soc. 2018, 476, 3336–3359. [Google Scholar] [CrossRef] [Green Version]
- Miville-Deschênes, M.A.; Lagache, G. IRIS: A New Generation of IRAS Maps. Astrophys. J. Suppl. Ser. 2005, 157, 302–323. [Google Scholar] [CrossRef]
- Martinache, C.; Rettura, A.; Dole, H.; Lehnert, M.; Frye, B.; Altieri, B.; Beelen, A.; Béthermin, M.; Le Floc’h, E.; Giard, M.; et al. SpitzerPlanck Herschel Infrared Cluster (SPHerIC) Survey: Candidate Galaxy Clusters at 1.3 < z < 3 Selected by High Star-Formation Rate. Astron. Astrophys. 2018, 620, A198. [Google Scholar] [CrossRef] [Green Version]
- Egami, E.; Rex, M.; Rawle, T.D.; Pérez-González, P.G.; Richard, J.; Kneib, J.P.; Schaerer, D.; Altieri, B.; Valtchanov, I.; Blain, A.W.; et al. The Herschel Lensing Survey (HLS): Overview. Astron. Astrophys. 2010, 518, L12. [Google Scholar] [CrossRef] [Green Version]
- Oliver, S.J.; Wang, L.; Smith, A.J.; Altieri, B.; Amblard, A.; Arumugam, V.; Auld, R.; Aussel, H.; Babbedge, T.; Blain, A.; et al. HerMES: SPIRE Galaxy Number Counts at 250, 350, and 500 Mm. Astron. Astrophys. 2010, 518, L21. [Google Scholar] [CrossRef] [Green Version]
- Flores-Cacho, I.; Pierini, D.; Soucail, G.; Montier, L.; Dole, H.; Pointecouteau, E.; Pelló, R.; Le Floc’h, E.; Nesvadba, N.; Lagache, G.; et al. Multi-Wavelength Characterisation of z ~ 2 Clustered, Dusty Star-Forming Galaxies Discovered by Planck. Astron. Astrophys. 2016, 585, A54. [Google Scholar] [CrossRef] [Green Version]
- MacKenzie, T.P.; Scott, D.; Bianconi, M.; Clements, D.L.; Dole, H.A.; Flores-Cacho, I.; Guery, D.; Kneissl, R.; Lagache, G.; Marleau, F.R.; et al. SCUBA-2 Follow-up of Herschel-SPIRE Observed Planck Overdensities. Mon. Not. R. Astron. Soc. 2017, 468, 4006–4017. [Google Scholar] [CrossRef] [Green Version]
- Cheng, T.; Clements, D.L.; Greenslade, J.; Cairns, J.; Andreani, P.; Bremer, M.; Conversi, L.; Cooray, A.; Dannerbauer, H.; De Zotti, G.; et al. SCUBA-2 Observations of Candidate Starbursting Protoclusters Selected by Planck and Herschel-SPIRE. Mon. Not. R. Astron. Soc. 2019, 490, 3840–3859. [Google Scholar] [CrossRef] [Green Version]
- Kaasinen, M.; Walter, F.; Novak, M.; Neeleman, M.; Smail, I.; Boogaard, L.; da Cunha, E.; Weiss, A.; Liu, D.; Decarli, R.; et al. A Comparison of the Stellar, CO, and Dust-continuum Emission from Three Star-forming HUDF Galaxies at z ∼ 2. Astrophys. J. 2020, 899, 37. [Google Scholar] [CrossRef]
- Granato, G.L.; Ragone-Figueroa, C.; Domínguez-Tenreiro, R.; Obreja, A.; Borgani, S.; De Lucia, G.; Murante, G. The Early Phases of Galaxy Clusters Formation in IR: Coupling Hydrodynamical Simulations with GRASIL-3D. Mon. Not. R. Astron. Soc. 2015, 450, 1320–1332. [Google Scholar] [CrossRef] [Green Version]
- Negrello, M.; Gonzalez-Nuevo, J.; De Zotti, G.; Bonato, M.; Cai, Z.Y.; Clements, D.; Danese, L.; Dole, H.; Greenslade, J.; Lapi, A.; et al. On the Statistics of Proto-Cluster Candidates Detected in the Planck All-Sky Survey. Mon. Not. R. Astron. Soc. 2017, 470, 2253–2261. [Google Scholar] [CrossRef] [Green Version]
- Kneissl, R.; Polletta, M.d.C.; Martinache, C.; Hill, R.; Clarenc, B.; Dole, H.A.; Nesvadba, N.P.H.; Scott, D.; Béthermin, M.; Frye, B.; et al. Using ALMA to Resolve the Nature of the Early Star-Forming Large-Scale Structure PLCK G073.4-57.5. Astron. Astrophys. 2019, 625, A96. [Google Scholar] [CrossRef] [Green Version]
- Polletta, M.; Dole, H.; Martinache, C.; Lehnert, M.D.; Frye, B.L.; Kneissl, R. Molecular Gas Properties of Planck-selected Protocluster Candidates at Z ~1.3–3. Astron. Astrophys. 2022, 666, 39. [Google Scholar] [CrossRef]
- Lammers, C.; Hill, R.; Lim, S.; Scott, D.; Cañameras, R.; Dole, H. Candidate High-Redshift Protoclusters and Lensed Galaxies in the Planck List of High-z Sources Overlapping with Herschel-SPIRE Imaging. Mon. Not. R. Astron. Soc. 2022, 514, 5004–5023. [Google Scholar] [CrossRef]
- Griffin, M.; Abergel, A.; Ade, P.; André, P.; Baluteau, J.P.; Bock, J.; Franceschini, A.; Gear, W.; Glenn, J.; Griffin, D.; et al. The Herschel-SPIRE Instrument and Its Capabilities for Extragalactic Astronomy. Adv. Space Res. 2007, 40, 612–619. [Google Scholar] [CrossRef]
- Shirley, R.; Duncan, K.; Campos Varillas, M.C.; Hurley, P.D.; Małek, K.; Roehlly, Y.; Smith, M.W.L.; Aussel, H.; Bakx, T.; Buat, V.; et al. HELP: The Herschel Extragalactic Legacy Project. Mon. Not. R. Astron. Soc. 2021, 507, 129–155. [Google Scholar] [CrossRef]
- Gouin, C.; Aghanim, N.; Dole, H.; Polletta, M.; Park, C. Questioning Planck-selected Star-Forming High-Redshift Galaxy Protoclusters and Their Fate. Astron. Astrophys. 2022, 155, 16. [Google Scholar] [CrossRef]
- Pillepich, A.; Springel, V.; Nelson, D.; Genel, S.; Naiman, J.; Pakmor, R.; Hernquist, L.; Torrey, P.; Vogelsberger, M.; Weinberger, R.; et al. Simulating Galaxy Formation with the IllustrisTNG Model. Mon. Not. R. Astron. Soc. 2018, 473, 4077–4106. [Google Scholar] [CrossRef] [Green Version]
- Lim, S.; Scott, D.; Babul, A.; Barnes, D.J.; Kay, S.T.; McCarthy, I.G.; Rennehan, D.; Vogelsberger, M. Is There Enough Star Formation in Simulated Protoclusters? Mon. Not. R. Astron. Soc. 2021, 501, 1803–1822. [Google Scholar] [CrossRef]
- Darvish, B.; Scoville, N.Z.; Martin, C.; Sobral, D.; Mobasher, B.; Rettura, A.; Matthee, J.; Capak, P.; Chartab, N.; Hemmati, S.; et al. Spectroscopic Confirmation of a Coma Cluster Progenitor at z ∼ 2.2. Astrophys. J. 2020, 892, 8. [Google Scholar] [CrossRef] [Green Version]
- Oppenheimer, B.D.; Davé, R.; Kereš, D.; Fardal, M.; Katz, N.; Kollmeier, J.A.; Weinberg, D.H. Feedback and Recycled Wind Accretion: Assembling the z = 0 Galaxy Mass Function. Mon. Not. R. Astron. Soc. 2010, 406, 2325–2338. [Google Scholar] [CrossRef] [Green Version]
- Croton, D.J. Evolution in the Black Hole Mass-Bulge Mass Relation: A Theoretical Perspective. Mon. Not. R. Astron. Soc. 2006, 369, 1808–1812. [Google Scholar] [CrossRef] [Green Version]
- Tremonti, C.A.; Moustakas, J.; Diamond-Stanic, A.M. The Discovery of 1000 Km S-1 Outflows in Massive Poststarburst Galaxies at Z = 0.6. Astrophys. J. 2007, 663, L77–L80. [Google Scholar] [CrossRef] [Green Version]
- Popesso, P.; Rodighiero, G.; Saintonge, A.; Santini, P.; Grazian, A.; Lutz, D.; Brusa, M.; Altieri, B.; Andreani, P.; Aussel, H.; et al. The Effect of Environment on Star Forming Galaxies at Redshift: I. First Insight from PACS. Astron. Astrophys. 2011, 532, A145. [Google Scholar] [CrossRef]
- Sobral, D.; Best, P.N.; Smail, I.; Geach, J.E.; Cirasuolo, M.; Garn, T.; Dalton, G.B. The Dependence of Star Formation Activity on Environment and Stellar Mass at Z∼ 1 from the HiZELS-Hα Survey. Mon. Not. R. Astron. Soc. 2011, 411, 675–692. [Google Scholar] [CrossRef]
- Darvish, B.; Mobasher, B.; Sobral, D.; Rettura, A.; Scoville, N.; Faisst, A.; Capak, P. The Effects of the Local Environment and Stellar Mass on Galaxy Quenching to z ∼ 3. Astrophys. J. 2016, 825, 113. [Google Scholar] [CrossRef] [Green Version]
- Fossati, M.; Wilman, D.J.; Mendel, J.T.; Saglia, R.P.; Galametz, A.; Beifiori, A.; Bender, R.; Chan, J.C.C.; Fabricius, M.; Bandara, K.; et al. Galaxy Environment in the 3D-HST Fields: Witnessing the Onset of Satellite Quenching at z ∼ 1–2. Astrophys. J. 2017, 835, 153. [Google Scholar] [CrossRef] [Green Version]
- Geha, M.; Blanton, M.R.; Yan, R.; Tinker, J.L. A Stellar Mass Threshold for Quenching of Field Galaxies. Astrophys. J. 2012, 757, 85. [Google Scholar] [CrossRef]
- Lidman, C.; Suherli, J.; Muzzin, A.; Wilson, G.; Demarco, R.; Brough, S.; Rettura, A.; Cox, J.; DeGroot, A.; Yee, H.K.C.; et al. Evidence for Significant Growth in the Stellar Mass of Brightest Cluster Galaxies over the Past 10 Billion Years. Mon. Not. R. Astron. Soc. 2012, 427, 550–568. [Google Scholar] [CrossRef]
- Lin, Y.T.; Hsieh, B.C.; Lin, S.C.; Oguri, M.; Chen, K.F.; Tanaka, M.; Chiu, I.N.; Huang, S.; Kodama, T.; Leauthaud, A.; et al. First Results on the Cluster Galaxy Population from the Subaru Hyper Suprime-Cam Survey. III. Brightest Cluster Galaxies, Stellar Mass Distribution, and Active Galaxies. Astrophys. J. 2017, 851, 139. [Google Scholar] [CrossRef]
- Schechter, P. An Analytic Expression for the Luminosity Function for Galaxies. Astrophys. J. 1976, 203, 297–306. [Google Scholar] [CrossRef]
- Pérez-González, P.G.; Rieke, G.H.; Villar, V.; Barro, G.; Blaylock, M.; Egami, E.; Gallego, J.; Gil de Paz, A.; Pascual, S.; Zamorano, J.; et al. The Stellar Mass Assembly of Galaxies from z = 0 to z = 4: Analysis of a Sample Selected in the Rest-Frame Near-Infrared with Spitzer. Astrophys. J. 2008, 675, 234–261. [Google Scholar] [CrossRef] [Green Version]
- Muzzin, A.; Marchesini, D.; Stefanon, M.; Franx, M.; McCracken, H.J.; Milvang-Jensen, B.; Dunlop, J.S.; Fynbo, J.P.U.; Brammer, G.; Labbé, I.; et al. The Evolution of the Stellar Mass Functions of Star-forming and Quiescent Galaxies to z = 4 from the COSMOS/UltraVISTA Survey. Astrophys. J. 2013, 777, 18. [Google Scholar] [CrossRef] [Green Version]
- van der Burg, R.F.J.; Rudnick, G.; Balogh, M.L.; Muzzin, A.; Lidman, C.; Old, L.J.; Shipley, H.; Gilbank, D.; McGee, S.; Biviano, A.; et al. The GOGREEN Survey: A Deep Stellar Mass Function of Cluster Galaxies at 1.0 <z< 1.4 and the Complex Nature of Satellite Quenching. Astron. Astrophys. 2020, 638, A112. [Google Scholar] [CrossRef]
- Vulcani, B.; Poggianti, B.M.; Fasano, G.; Desai, V.; Dressler, A.; Oemler, A.; Calvi, R.; D’Onofrio, M.; Moretti, A. The Importance of the Local Density in Shaping the Galaxy Stellar Mass Functions. Mon. Not. R. Astron. Soc. 2012, 420, 1481–1494. [Google Scholar] [CrossRef] [Green Version]
- Vulcani, B.; Poggianti, B.M.; Oemler, A.; Dressler, A.; Aragón-Salamanca, A.; De Lucia, G.; Moretti, A.; Gladders, M.; Abramson, L.; Halliday, C. The Galaxy Stellar Mass Function and Its Evolution with Time Show No Dependence on Global Environment. Astron. Astrophys. 2013, 550, A58. [Google Scholar] [CrossRef] [Green Version]
- Fasano, G.; Marmo, C.; Varela, J.; D’Onofrio, M.; Poggianti, B.M.; Moles, M.; Pignatelli, E.; Bettoni, D.; Kjærgaard, P.; Rizzi, L.; et al. WINGS: A WIde-field Nearby Galaxy-cluster Survey. I. Optical Imaging. Astron. Astrophys. 2006, 445, 805. [Google Scholar] [CrossRef] [Green Version]
- Oemler, A., Jr.; Dressler, A.; Gladders, M.G.; Rigby, J.R.; Bai, L.; Kelson, D.; Villanueva, E.; Fritz, J.; Rieke, G.; Poggianti, B.M.; et al. The IMACS Cluster Building Survey. I. Description of the Survey and Analysis Methods. Astrophys. J. 2013, 770, 61. [Google Scholar] [CrossRef] [Green Version]
- White, S.D.M.; Clowe, D.I.; Simard, L.; Rudnick, G.; De Lucia, G.; Aragón-Salamanca, A.; Bender, R.; Best, P.; Bremer, M.; Charlot, S.; et al. EDisCS—the ESO Distant Cluster Survey. Sample Definition and Optical Photometry. Astron. Astrophys. 2005, 444, 365. [Google Scholar] [CrossRef]
- Annunziatella, M.; Biviano, A.; Mercurio, A.; Nonino, M.; Rosati, P.; Balestra, I.; Presotto, V.; Girardi, M.; Gobat, R.; Grillo, C.; et al. CLASH-VLT: The Stellar Mass Function and Stellar Mass Density Profile of the z = 0.44 Cluster of Galaxies MACS J1206.2-0847. Astron. Astrophys. 2014, 571, A80. [Google Scholar] [CrossRef] [Green Version]
- Annunziatella, M.; Mercurio, A.; Biviano, A.; Girardi, M.; Nonino, M.; Balestra, I.; Rosati, P.; Bartosch Caminha, G.; Brescia, M.; Gobat, R.; et al. CLASH-VLT: Environment-driven Evolution of Galaxies in the z = 0.209 Cluster Abell 209. Astron. Astrophys. 2016, 585, A160. [Google Scholar] [CrossRef] [Green Version]
- van der Burg, R.F.J.; Muzzin, A.; Hoekstra, H.; Lidman, C.; Rettura, A.; Wilson, G.; Yee, H.K.C.; Hildebrandt, H.; Marchesini, D.; Stefanon, M.; et al. The Environmental Dependence of the Stellar Mass Function at z ~ 1. Comparing Cluster and Field between the GCLASS and UltraVISTA Surveys. Astron. Astrophys. 2013, 557, A15. [Google Scholar] [CrossRef] [Green Version]
- van der Burg, R.F.J.; McGee, S.; Aussel, H.; Dahle, H.; Arnaud, M.; Pratt, G.W.; Muzzin, A. The Stellar Mass Function of Galaxies in Planck-selected Clusters at 0.5 < z < 0.7: New Constraints on the Timescale and Location of Satellite Quenching. Astron. Astrophys. 2018, 618, A140. [Google Scholar] [CrossRef] [Green Version]
- Calvi, R.; Poggianti, B.M.; Vulcani, B.; Fasano, G. The Impact of Global Environment on Galaxy Mass Functions at Low Redshift. Mon. Not. R. Astron. Soc. 2013, 432, 3141–3152. [Google Scholar] [CrossRef]
- Nantais, J.B.; van der Burg, R.F.J.; Lidman, C.; Demarco, R.; Noble, A.; Wilson, G.; Muzzin, A.; Foltz, R.; DeGroot, A.; Cooper, M.C. Stellar Mass Function of Cluster Galaxies at z ~ 1.5: Evidence for Reduced Quenching Efficiency at High Redshift. Astron. Astrophys. 2016, 592, A161. [Google Scholar] [CrossRef] [Green Version]
- Papovich, C.; Kawinwanichakij, L.; Quadri, R.F.; Glazebrook, K.; Labbé, I.; Tran, K.V.H.; Forrest, B.; Kacprzak, G.G.; Spitler, L.R.; Straatman, C.M.S.; et al. The Effects of Environment on the Evolution of the Galaxy Stellar Mass Function. Astrophys. J. 2018, 854, 30. [Google Scholar] [CrossRef]
- Reeves, A.M.M.; Balogh, M.L.; van der Burg, R.F.J.; Finoguenov, A.; Kukstas, E.; McCarthy, I.G.; Webb, K.; Muzzin, A.; McGee, S.; Rudnick, G.; et al. The GOGREEN Survey: Dependence of Galaxy Properties on Halo Mass at z > 1 and Implications for Environmental Quenching. Mon. Not. R. Astron. Soc. 2021, 506, 3364–3384. [Google Scholar] [CrossRef]
- Tomczak, A.R.; Lemaux, B.C.; Lubin, L.M.; Gal, R.R.; Wu, P.F.; Holden, B.; Kocevski, D.D.; Mei, S.; Pelliccia, D.; Rumbaugh, N.; et al. Glimpsing the Imprint of Local Environment on the Galaxy Stellar Mass Function. Mon. Not. R. Astron. Soc. 2017, 472, 3512–3531. [Google Scholar] [CrossRef] [Green Version]
- Lubin, L.M.; Gal, R.R.; Lemaux, B.C.; Kocevski, D.D.; Squires, G.K. The Observations of Redshift Evolution in Large-Scale Environments (ORELSE) Survey. I. The Survey Design and First Results on CL 0023+0423 at z = 0.84 and RX J1821.6+6827 at z = 0.82. Astron. J. 2009, 137, 4867–4883. [Google Scholar] [CrossRef]
- Giodini, S.; Finoguenov, A.; Pierini, D.; Zamorani, G.; Ilbert, O.; Lilly, S.; Peng, Y.; Scoville, N.; Tanaka, M. The Galaxy Stellar Mass Function of X-ray Detected Groups. Environmental Dependence of Galaxy Evolution in the COSMOS Survey. Astron. Astrophys. 2012, 538, A104. [Google Scholar] [CrossRef] [Green Version]
- Mok, A.; Balogh, M.L.; McGee, S.L.; Wilman, D.J.; Finoguenov, A.; Tanaka, M.; Giodini, S.; Bower, R.G.; Connelly, J.L.; Hou, A.; et al. Efficient Satellite Quenching at Z∼1 from the GEEC2 Spectroscopic Survey of Galaxy Groups. Mon. Not. R. Astron. Soc. 2013, 431, 1090–1106. [Google Scholar] [CrossRef] [Green Version]
- Davidzon, I.; Cucciati, O.; Bolzonella, M.; De Lucia, G.; Zamorani, G.; Arnouts, S.; Moutard, T.; Ilbert, O.; Garilli, B.; Scodeggio, M.; et al. The VIMOS Public Extragalactic Redshift Survey (VIPERS). Environmental Effects Shaping the Galaxy Stellar Mass Function. Astron. Astrophys. 2016, 586, A23. [Google Scholar] [CrossRef] [Green Version]
- Pintos-Castro, I.; Yee, H.K.C.; Muzzin, A.; Old, L.; Wilson, G. The Evolution of the Quenching of Star Formation in Cluster Galaxies since z ∼ 1. Astrophys. J. 2019, 876, 40. [Google Scholar] [CrossRef] [Green Version]
- Wetzel, A.R.; Tinker, J.L.; Conroy, C. Galaxy Evolution in Groups and Clusters: Star Formation Rates, Red Sequence Fractions and the Persistent Bimodality. Mon. Not. R. Astron. Soc. 2012, 424, 232–243. [Google Scholar] [CrossRef] [Green Version]
- Bahé, Y.M.; Barnes, D.J.; Dalla Vecchia, C.; Kay, S.T.; White, S.D.M.; McCarthy, I.G.; Schaye, J.; Bower, R.G.; Crain, R.A.; Theuns, T.; et al. The Hydrangea Simulations: Galaxy Formation in and around Massive Clusters. Mon. Not. R. Astron. Soc. 2017, 470, 4186–4208. [Google Scholar] [CrossRef] [Green Version]
- Balogh, M.L.; McGee, S.L.; Mok, A.; Wilman, D.J.; Finoguenov, A.; Bower, R.G.; Mulchaey, J.S.; Parker, L.C.; Tanaka, M. The GEEC2 Spectroscopic Survey of Galaxy Groups at 0.8 < z < 1. Mon. Not. R. Astron. Soc. 2014, 443, 2679–2694. [Google Scholar] [CrossRef] [Green Version]
- Sarron, F.; Conselice, C.J. DETECTIFz Galaxy Groups in the REFINE Survey—I. Group Detection and Quenched Fraction Evolution at z < 2.5. Mon. Not. R. Astron. Soc. 2021, 506, 2136–2155. [Google Scholar] [CrossRef]
- Loh, Y.S.; Ellingson, E.; Yee, H.K.C.; Gilbank, D.G.; Gladders, M.D.; Barrientos, L.F. The Color Bimodality in Galaxy Clusters since z ~ 0.9. Astrophys. J. 2008, 680, 214–223. [Google Scholar] [CrossRef] [Green Version]
- Raichoor, A.; Andreon, S. Galaxy Mass, Cluster-Centric Distance and Secular Evolution: Their Role in the Evolution of Galaxies in Clusters in the Last 10 Gyr. Astron. Astrophys. 2012, 543, A19. [Google Scholar] [CrossRef]
- Kawinwanichakij, L.; Papovich, C.; Quadri, R.F.; Glazebrook, K.; Kacprzak, G.G.; Allen, R.J.; Bell, E.F.; Croton, D.J.; Dekel, A.; Ferguson, H.C.; et al. Effect of Local Environment and Stellar Mass on Galaxy Quenching and Morphology at 0.5 < z < 2.0. Astrophys. J. 2017, 847, 134. [Google Scholar] [CrossRef]
- Lee-Brown, D.B.; Rudnick, G.H.; Momcheva, I.G.; Papovich, C.; Lotz, J.M.; Tran, K.V.H.; Henke, B.; Willmer, C.N.A.; Brammer, G.B.; Brodwin, M.; et al. The Ages of Passive Galaxies in a z = 1.62 Protocluster. Astrophys. J. 2017, 844, 43. [Google Scholar] [CrossRef] [Green Version]
- Nantais, J.B.; Muzzin, A.; van der Burg, R.F.J.; Wilson, G.; Lidman, C.; Foltz, R.; DeGroot, A.; Noble, A.; Cooper, M.C.; Demarco, R. Evidence for Strong Evolution in Galaxy Environmental Quenching Efficiency between z = 1.6 and z = 0.9. Mon. Not. R. Astron. Soc. Lett. 2017, 465, L104–L108. [Google Scholar] [CrossRef] [Green Version]
- Strazzullo, V.; Pannella, M.; Mohr, J.J.; Saro, A.; Ashby, M.L.N.; Bayliss, M.B.; Bocquet, S.; Bulbul, E.; Khullar, G.; Mantz, A.B.; et al. Galaxy Populations in the Most Distant SPT-SZ Clusters: I. Environmental Quenching in Massive Clusters at 1.4 ≲ z ≲ 1.7. Astron. Astrophys. 2019, 622, A117. [Google Scholar] [CrossRef] [Green Version]
- von der Linden, A.; Wild, V.; Kauffmann, G.; White, S.D.M.; Weinmann, S. Star Formation and AGN Activity in SDSS Cluster Galaxies. Mon. Not. R. Astron. Soc. 2010, 404, 1231–1246. [Google Scholar] [CrossRef] [Green Version]
- Chung, S.M.; Eisenhardt, P.R.; Gonzalez, A.H.; Stanford, S.A.; Brodwin, M.; Stern, D.; Jarrett, T. A WISE View of Star Formation in Local Galaxy Clusters. Astrophys. J. 2011, 743, 34. [Google Scholar] [CrossRef] [Green Version]
- Patel, S.G.; Holden, B.P.; Kelson, D.D.; Illingworth, G.D.; Franx, M. The Dependence of Star Formation Rates on Stellar Mass and Environment at z ~ 0.8. Astrophys. J. 2009, 705, L67–L70. [Google Scholar] [CrossRef] [Green Version]
- Haines, C.P.; Pereira, M.J.; Smith, G.P.; Egami, E.; Babul, A.; Finoguenov, A.; Ziparo, F.; McGee, S.L.; Rawle, T.D.; Okabe, N.; et al. LoCuSS: The slow quenching of star formation in cluster galaxies and the need for pre-processing. Astrophys. J. 2015, 806, 101. [Google Scholar] [CrossRef]
- Just, D.W.; Kirby, M.; Zaritsky, D.; Rudnick, G.; Desjardins, T.; Cool, R.; Moustakas, J.; Clowe, D.; De Lucia, G.; Aragón-Salamanca, A.; et al. Preprocessing among the Infalling Galaxy Population of EDisCS Clusters. Astrophys. J. 2019, 885, 6. [Google Scholar] [CrossRef] [Green Version]
- Ayromlou, M.; Kauffmann, G.; Anand, A.; White, S.D.M. The Physical Origin of Galactic Conformity: From Theory to Observation. arXiv 2022, arXiv:220702218A. [Google Scholar]
- Zabludoff, A.I.; Zaritsky, D.; Lin, H.; Tucker, D.; Hashimoto, Y.; Shectman, S.A.; Oemler, A.; Kirshner, R.P. The Environment of “E+A” Galaxies. Astrophys. J. 1996, 466, 104. [Google Scholar] [CrossRef]
- Zabludoff, A.I.; Mulchaey, J.S. Hierarchical Evolution in Poor Groups of Galaxies. Astrophys. J. 1998, 498, L5–L8. [Google Scholar] [CrossRef]
- Kodama, T.; Smail, I.; Nakata, F.; Okamura, S.; Bower, R.G. The Transformation of Galaxies within the Large-Scale Structure around a Z = 0.41 Cluster. Astrophys. J. 2001, 562, L9–L13. [Google Scholar] [CrossRef] [Green Version]
- Fujita, Y. Pre-Processing of Galaxies before Entering a Cluster. Publ. Astron. Soc. Jpn. 2004, 56, 29–43. [Google Scholar] [CrossRef] [Green Version]
- Berrier, J.C.; Stewart, K.R.; Bullock, J.S.; Purcell, C.W.; Barton, E.J.; Wechsler, R.H. The Assembly of Galaxy Clusters. Astrophys. J. 2009, 690, 1292–1302. [Google Scholar] [CrossRef]
- McGee, S.L.; Balogh, M.L.; Bower, R.G.; Font, A.S.; McCarthy, I.G. The Accretion of Galaxies into Groups and Clusters. Mon. Not. R. Astron. Soc. 2009, 400, 937–950. [Google Scholar] [CrossRef] [Green Version]
- Dressler, A.; Oemler, A., Jr.; Poggianti, B.M.; Gladders, M.D.; Abramson, L.; Vulcani, B. The IMACS Cluster Building Survey. II. Spectral Evolution of Galaxies in the Epoch of Cluster Assembly. Astrophys. J. 2013, 770, 62. [Google Scholar] [CrossRef]
- Weinzirl, T.; Aragón-Salamanca, A.; Gray, M.E.; Bamford, S.P.; Rodríguez del Pino, B.; Chies-Santos, A.L.; Böhm, A.; Wolf, C.; Cool, R.J. OMEGA—OSIRIS Mapping of Emission-line Galaxies in A901/2—III. Galaxy Properties across Projected Phase Space in A901/2. Mon. Not. R. Astron. Soc. 2017, 471, 182–200. [Google Scholar] [CrossRef] [Green Version]
- Cooke, E.A.; Hatch, N.A.; Muldrew, S.I.; Rigby, E.E.; Kurk, J.D. A z = 2.5 Protocluster Associated with the Radio Galaxy MRC 2104-242: Star Formation and Differing Mass Functions in Dense Environments. Mon. Not. R. Astron. Soc. 2014, 440, 3262–3274. [Google Scholar] [CrossRef] [Green Version]
- Muldrew, S.I.; Hatch, N.A.; Cooke, E.A. Galaxy Evolution in Protoclusters. Mon. Not. R. Astron. Soc. 2018, 473, 2335–2347. [Google Scholar] [CrossRef]
- Bianconi, M.; Smith, G.P.; Haines, C.P.; McGee, S.L.; Finoguenov, A.; Egami, E. LoCuSS: Pre-Processing in Galaxy Groups Falling into Massive Galaxy Clusters at z = 0.2. Mon. Not. R. Astron. Soc. 2018, 473, L79–L83. [Google Scholar] [CrossRef]
- Diemer, B.; Kravtsov, A.V. Dependence of the Outer Density Profiles of Halos on Their Mass Accretion Rate. Astrophys. J. 2014, 789, 1. [Google Scholar] [CrossRef]
- Haggar, R.; Gray, M.E.; Pearce, F.R.; Knebe, A.; Cui, W.; Mostoghiu, R.; Yepes, G. The Three Hundred Project: Backsplash Galaxies in Simulations of Clusters. Mon. Not. R. Astron. Soc. 2020, 492, 6074–6085. [Google Scholar] [CrossRef] [Green Version]
- Adhikari, S.; Dalal, N.; Chamberlain, R.T. Splashback in Accreting Dark Matter Halos. J. Cosmol. Astropart. Phys. 2014, 2014, 019. [Google Scholar] [CrossRef] [Green Version]
- Mansfield, P.; Kravtsov, A.V.; Diemer, B. Splashback Shells of Cold Dark Matter Halos. Astrophys. J. 2017, 841, 34. [Google Scholar] [CrossRef] [Green Version]
- More, S.; Diemer, B.; Kravtsov, A.V. The Splashback Radius as a Physical Halo Boundary and the Growth of Halo Mass. Astrophys. J. 2015, 810, 36. [Google Scholar] [CrossRef] [Green Version]
- Zinger, E.; Dekel, A.; Kravtsov, A.V.; Nagai, D. Quenching of Satellite Galaxies at the Outskirts of Galaxy Clusters. Mon. Not. R. Astron. Soc. 2018, 475, 3654–3681. [Google Scholar] [CrossRef] [Green Version]
- Mostoghiu, R.; Arthur, J.; Pearce, F.R.; Gray, M.; Knebe, A.; Cui, W.; Welker, C.; Cora, S.A.; Murante, G.; Dolag, K.; et al. The Three Hundred Project: The Gas Disruption of Infalling Objects in Cluster Environments. Mon. Not. R. Astron. Soc. 2021, 501, 5029–5041. [Google Scholar] [CrossRef]
- Ayromlou, M.; Kauffmann, G.; Yates, R.M.; Nelson, D.; White, S.D.M. Galaxy Formation with L-GALAXIES: Modelling the Environmental Dependency of Galaxy Evolution and Comparing with Observations. Mon. Not. R. Astron. Soc. 2021, 505, 492–514. [Google Scholar] [CrossRef]
- Birnboim, Y.; Dekel, A. Virial Shocks in Galactic Haloes? Mon. Not. R. Astron. Soc. 2003, 345, 349–364. [Google Scholar] [CrossRef]
- Dekel, A.; Birnboim, Y. Galaxy Bimodality Due to Cold Flows and Shock Heating. Mon. Not. R. Astron. Soc. 2006, 368, 2–20. [Google Scholar] [CrossRef]
- Grützbauch, R.; Bauer, A.E.; Jørgensen, I.; Varela, J. Suppression of Star Formation in the Central 200 Kpc of a Z= 1.4 Galaxy Cluster. Mon. Not. R. Astron. Soc. 2012, 423, 3652–3662. [Google Scholar] [CrossRef] [Green Version]
- Quadri, R.F.; Williams, R.J.; Franx, M.; Hildebrandt, H. Tracing the star-formation-density relation to z ∼ 2. Astrophys. J. 2012, 744, 88. [Google Scholar] [CrossRef] [Green Version]
- Stalder, B.; Ruel, J.; Šuhada, R.; Brodwin, M.; Aird, K.A.; Andersson, K.; Armstrong, R.; Ashby, M.L.N.; Bautz, M.; Bayliss, M.; et al. SPT-CL J0205-5829: A z = 1.32 Evolved Massive Galaxy Cluster in the South Pole Telescope Sunyaev-Zel’dovich Effect Survey. Astrophys. J. 2013, 763, 93. [Google Scholar] [CrossRef] [Green Version]
- Santos, J.S.; Altieri, B.; Popesso, P.; Strazzullo, V.; Valtchanov, I.; Berta, S.; Böhringer, H.; Conversi, L.; Demarco, R.; Edge, A.C.; et al. Dust-Obscured Star Formation in the Outskirts of XMMU J2235.3-2557, a Massive Galaxy Cluster at z = 1.472. Mon. Not. R. Astron. Soc. 2013, 433, 1287–1299. [Google Scholar] [CrossRef] [Green Version]
- Strazzullo, V.; Gobat, R.; Daddi, E.; Onodera, M.; Carollo, M.; Dickinson, M.; Renzini, A.; Arimoto, N.; Cimatti, A.; Finoguenov, A.; et al. Galaxy Evolution in Overdense Environments at High Redshift: Passive Early-type Galaxies in a Cluster at z ~ 2. Astrophys. J. 2013, 772, 118. [Google Scholar] [CrossRef] [Green Version]
- Newman, A.B.; Ellis, R.S.; Andreon, S.; Treu, T.; Raichoor, A.; Trinchieri, G. Spectroscopic Confirmation of the Rich z = 1.80 Galaxy Cluster JKCS 041 Using the WFC3 Grism: Environmental Trends in the Ages and Structure of Quiescent Galaxies. Astrophys. J. 2014, 788, 51. [Google Scholar] [CrossRef] [Green Version]
- Cooke, E.A.; Hatch, N.A.; Stern, D.; Rettura, A.; Brodwin, M.; Galametz, A.; Wylezalek, D.; Bridge, C.; Conselice, C.J.; De Breuck, C.; et al. A Mature Galaxy Cluster at Z=1.58 around the Radio Galaxy 7C1753+6311. Astrophys. J. 2016, 816, 83. [Google Scholar] [CrossRef] [Green Version]
- Mancone, C.L.; Gonzalez, A.H.; Brodwin, M.; Stanford, S.A.; Eisenhardt, P.R.M.; Stern, D.; Jones, C. The Formation of Massive Cluster Galaxies. Astrophys. J. 2010, 720, 284–298. [Google Scholar] [CrossRef] [Green Version]
- Mancone, C.L.; Baker, T.; Gonzalez, A.H.; Ashby, M.L.N.; Stanford, S.A.; Brodwin, M.; Eisenhardt, P.R.M.; Snyder, G.; Stern, D.; Wright, E.L. The Faint End of the Cluster-galaxy Luminosity Function at High Redshift. Astrophys. J. 2012, 761, 141. [Google Scholar] [CrossRef] [Green Version]
- Muldrew, S.I.; Hatch, N.A.; Cooke, E.A. What Are Protoclusters?—Defining High-Redshift Galaxy Clusters and Protoclusters. Mon. Not. R. Astron. Soc. 2015, 452, 2528–2539. [Google Scholar] [CrossRef]
- Coia, D.; McBreen, B.; Metcalfe, L.; Biviano, A.; Altieri, B.; Ott, S.; Fort, B.; Kneib, J.P.; Mellier, Y.; Miville-Deschênes, M.A.; et al. An ISOCAM Survey through Gravitationally Lensing Galaxy Clusters. IV. Luminous Infrared Galaxies in Cl 0024+1654 and the Dynamical Status of Clusters. Astron. Astrophys. 2005, 431, 433. [Google Scholar] [CrossRef] [Green Version]
- Geach, J.E.; Smail, I.; Ellis, R.S.; Moran, S.M.; Smith, G.P.; Treu, T.; Kneib, J.P.; Edge, A.C.; Kodama, T. A Panoramic Mid-infrared Survey of Two Distant Clusters. Astrophys. J. 2006, 649, 661–672. [Google Scholar] [CrossRef] [Green Version]
- Geach, J.E.; Smail, I.; Moran, S.M.; Treu, T.; Ellis, R.S. The Nature of Dusty Starburst Galaxies in a Rich Cluster at z = 0.4: The Progenitors of Lenticulars? Astrophys. J. 2009, 691, 783–793. [Google Scholar] [CrossRef] [Green Version]
- Marcillac, D.; Rigby, J.R.; Rieke, G.H.; Kelly, D.M. Strong dusty bursts of star formation in galaxies falling into the cluster rx J0152.7–1357. Astrophys. J. 2007, 654, 10. [Google Scholar] [CrossRef] [Green Version]
- Saintonge, A.; Tran, K.V.H.; Holden, B.P. Spitzer/MIPS 24um Observations of Galaxy Clusters: An Increasing Fraction of Obscured Star-forming Members from Z = 0.02 to Z = 0.83. Astrophys. J. 2008, 685, L113–L116. [Google Scholar] [CrossRef] [Green Version]
- Koyama, Y.; Kodama, T.; Shimasaku, K.; Okamura, S.; Tanaka, M.; Lee, H.M.; Im, M.; Matsuhara, H.; Takagi, T.; Wada, T.; et al. Mapping Dusty Star Formation in and around a Cluster at z = 0.81 by Wide-Field Imaging with AKARI. Mon. Not. R. Astron. Soc. 2008, 391, 1758–1770. [Google Scholar] [CrossRef] [Green Version]
- Oemler, A., Jr.; Dressler, A.; Kelson, D.; Rigby, J.; Poggianti, B.M.; Fritz, J.; Morrison, G.; Smail, I. Abell 851 and the Role of Starbursts in Cluster Galaxy Evolution. Astrophys. J. 2009, 693, 152–173. [Google Scholar] [CrossRef] [Green Version]
- Smith, G.P.; Haines, C.P.; Pereira, M.J.; Egami, E.; Moran, S.M.; Hardegree-Ullman, E.; Babul, A.; Rex, M.; Rawle, T.D.; Zhang, Y.Y.; et al. LoCuSS: Probing Galaxy Transformation Physics with Herschel. Astron. Astrophys. 2010, 518, L18. [Google Scholar] [CrossRef] [Green Version]
- Koyama, Y.; Kodama, T.; Shimasaku, K.; Hayashi, M.; Okamura, S.; Tanaka, I.; Tokoku, C. Panoramic Hα and Mid-Infrared Mapping of Star Formation in a z = 0.8 Cluster. Mon. Not. R. Astron. Soc. 2010, 403, 1611–1624. [Google Scholar] [CrossRef] [Green Version]
- Tran, K.V.H.; Papovich, C.; Saintonge, A.; Brodwin, M.; Dunlop, J.S.; Farrah, D.; Finkelstein, K.D.; Finkelstein, S.L.; Lotz, J.; McLure, R.J.; et al. REVERSAL OF FORTUNE: CONFIRMATION OF AN INCREASING STAR FORMATION–DENSITY RELATION IN A CLUSTER AT z = 1.62. Astrophys. J. 2010, 719, L126–L129. [Google Scholar] [CrossRef]
- Haines, C.P.; Smith, G.P.; Egami, E.; Ellis, R.S.; Moran, S.M.; Sanderson, A.J.R.; Merluzzi, P.; Busarello, G.; Smith, R.J. LOCUSS: The mid-infrared butcher-oemler effect. Astrophys. J. 2009, 704, 126–136. [Google Scholar] [CrossRef] [Green Version]
- Haines, C.P.; Pereira, M.J.; Smith, G.P.; Egami, E.; Sanderson, A.J.R.; Babul, A.; Finoguenov, A.; Merluzzi, P.; Busarello, G.; Rawle, T.D.; et al. LoCuSS: The steady decline and slow quenching of star formation in cluster galaxies over the last four billion years. Astrophys. J. 2013, 775, 126. [Google Scholar] [CrossRef] [Green Version]
- Webb, T.M.A.; O’Donnell, D.; Yee, H.K.C.; Gilbank, D.; Coppin, K.; Ellingson, E.; Faloon, A.; Geach, J.E.; Gladders, M.; Noble, A.; et al. The evolution of dusty star formation in galaxy clusters to z = 1: Spitzer infrared observations of the first red-sequence cluster survey. Astron. J. 2013, 146, 84. [Google Scholar] [CrossRef] [Green Version]
- Rieke, G.H.; Young, E.T.; Engelbracht, C.W.; Kelly, D.M.; Low, F.J.; Haller, E.E.; Beeman, J.W.; Gordon, K.D.; Stansberry, J.A.; Misselt, K.A.; et al. The Multiband Imaging Photometer for Spitzer (MIPS). Astrophys. J. Suppl. Ser. 2004, 154, 25–29. [Google Scholar] [CrossRef]
- Le Floc’h, E.; Papovich, C.; Dole, H.; Bell, E.F.; Lagache, G.; Rieke, G.H.; Egami, E.; Pérez-González, P.G.; Alonso-Herrero, A.; Rieke, M.J.; et al. Infrared Luminosity Functions from the Chandra Deep Field-South: The Spitzer View on the History of Dusty Star Formation at 0 < z < 1. Astrophys. J. 2005, 632, 169–190. [Google Scholar] [CrossRef]
- Rujopakarn, W.; Eisenstein, D.J.; Rieke, G.H.; Papovich, C.; Cool, R.J.; Moustakas, J.; Jannuzi, B.T.; Kochanek, C.S.; Rieke, M.J.; Dey, A.; et al. The evolution of the star formation rate of galaxies at 0.0 ⩽z⩽ 1.2. Astrophys. J. 2010, 718, 1171–1185. [Google Scholar] [CrossRef] [Green Version]
- Sargent, M.T.; Béthermin, M.; Daddi, E.; Elbaz, D. The Contribution of Starbursts and Normal Galaxies to Infrared Luminosity Functions at z < 2. Astrophys. J. 2012, 747, L31. [Google Scholar] [CrossRef] [Green Version]
- Ilbert, O.; Arnouts, S.; Le Floc’h, E.; Aussel, H.; Bethermin, M.; Capak, P.; Hsieh, B.C.; Kajisawa, M.; Karim, A.; Le Fèvre, O.; et al. Evolution of the Specific Star Formation Rate Function at Z< 1.4 Dissecting the Mass-SFR Plane in COSMOS and GOODS. Astron. Astrophys. 2015, 579, A2. [Google Scholar] [CrossRef] [Green Version]
- Smith, M.W.L.; Vlahakis, C.; Baes, M.; Bendo, G.J.; Bianchi, S.; Bomans, D.J.; Boselli, A.; Clemens, M.; Corbelli, E.; Cortese, L.; et al. The Herschel Virgo Cluster Survey. IV. Resolved Dust Analysis of Spiral Galaxies. Astron. Astrophys. 2010, 518, L51. [Google Scholar] [CrossRef] [Green Version]
- Popesso, P.; Biviano, A.; Finoguenov, A.; Wilman, D.; Salvato, M.; Magnelli, B.; Gruppioni, C.; Pozzi, F.; Rodighiero, G.; Ziparo, F.; et al. The Role of Massive Halos in the Star Formation History of the Universe. Astron. Astrophys. 2015, 579, A132. [Google Scholar] [CrossRef]
- Popesso, P.; Biviano, A.; Finoguenov, A.; Wilman, D.; Salvato, M.; Magnelli, B.; Gruppioni, C.; Pozzi, F.; Rodighiero, G.; Ziparo, F.; et al. The Evolution of Galaxy Star Formation Activity in Massive Haloes. Astron. Astrophys. 2015, 574, A105. [Google Scholar] [CrossRef] [Green Version]
- Bai, L.; Marcillac, D.; Rieke, G.H.; Rieke, M.J.; Tran, K.V.H.; Hinz, J.L.; Rudnick, G.; Kelly, D.M.; Blaylock, M. IR Observations of MS 1054-03: Star Formation and Its Evolution in Rich Galaxy Clusters. Astrophys. J. 2007, 664, 181–197. [Google Scholar] [CrossRef] [Green Version]
- Haines, C.P.; Smith, G.P.; Pereira, M.J.; Egami, E.; Moran, S.M.; Hardegree-Ullman, E.; Rawle, T.D.; Rex, M. LoCuSS: Shedding New Light on the Massive Lensing Cluster Abell 1689—The View from Herschel. Astron. Astrophys. 2010, 518, L19. [Google Scholar] [CrossRef] [Green Version]
- Kennicutt, R.C. Star Formation in Galaxies Along the Hubble Sequence. Annu. Rev. Astron. Astrophys. 1998, 36, 189. [Google Scholar] [CrossRef] [Green Version]
- Bai, L.; Rieke, G.H.; Rieke, M.J.; Christlein, D.; Zabludoff, A.I. The infrared luminosity functions of rich clusters. Astrophys. J. 2009, 693, 1840–1850. [Google Scholar] [CrossRef] [Green Version]
- Cowie, L.L.; Barger, A.J.; Fomalont, E.B.; Capak, P. The Evolution of the Ultraluminous Infrared Galaxy Population from Redshift 0 to 1.5. Astrophys. J. 2004, 603, L69–L72. [Google Scholar] [CrossRef] [Green Version]
- Biviano, A.; Fadda, D.; Durret, F.; Edwards, L.O.V.; Marleau, F. Spitzer Observations of Abell 1763: III. The Infrared Luminosity Function in Different Supercluster Environments. Astron. Astrophys. 2011, 532, A77. [Google Scholar] [CrossRef] [Green Version]
- Smail, I.; Geach, J.E.; Swinbank, A.M.; Tadaki, K.; Arumugam, V.; Hartley, W.; Almaini, O.; Bremer, M.N.; Chapin, E.; Chapman, S.C.; et al. The scuba-2 cosmology legacy survey: Ultraluminous star-forming galaxies in a z = 1.6 cluster. Astrophys. J. 2014, 782, 19. [Google Scholar] [CrossRef] [Green Version]
- Popesso, P.; Biviano, A.; Rodighiero, G.; Baronchelli, I.; Salvato, M.; Saintonge, A.; Finoguenov, A.; Magnelli, B.; Gruppioni, C.; Pozzi, F.; et al. The Evolution of the Star Formation Activity per Halo Mass up to Redshift ~1.6 as Seen by Herschel. Astron. Astrophys. 2012, 537, A58. [Google Scholar] [CrossRef] [Green Version]
- Noble, A.G.; Webb, T.M.A.; Muzzin, A.; Wilson, G.; Yee, H.K.C.; van der Burg, R.F.J. A kinematic approach to assessing environmental effects: Star-forming galaxies in a z ∼ 0.9 sparcs cluster using spitzer 24 Mm observations. Astrophys. J. 2013, 768, 118. [Google Scholar] [CrossRef]
- Rodríguez-Muñoz, L.; Rodighiero, G.; Mancini, C.; Pérez-González, P.G.; Rawle, T.D.; Egami, E.; Mercurio, A.; Rosati, P.; Puglisi, A.; Franceschini, A.; et al. Quantifying the Suppression of the (Un)-Obscured Star Formation in Galaxy Cluster Cores at 0.2≲z≲0.9. Mon. Not. R. Astron. Soc. 2019, 485, 586–619. [Google Scholar] [CrossRef] [Green Version]
- Mahajan, S.; Mamon, G.A.; Raychaudhury, S. The Velocity Modulation of Galaxy Properties in and near Clusters: Quantifying the Decrease in Star Formation in Backsplash Galaxies. Mon. Not. R. Astron. Soc. 2011, 416, 2882–2902. [Google Scholar] [CrossRef] [Green Version]
- Hernández-Fernández, J.D.; Haines, C.P.; Diaferio, A.; Iglesias-Páramo, J.; Mendes de Oliveira, C.; Vilchez, J.M. Star Formation Activity and Gas Stripping in the Cluster Projected Phase-Space (CPPS). Mon. Not. R. Astron. Soc. 2014, 438, 2186–2200. [Google Scholar] [CrossRef] [Green Version]
- Muzzin, A.; van der Burg, R.F.J.; McGee, S.L.; Balogh, M.; Franx, M.; Hoekstra, H.; Hudson, M.J.; Noble, A.; Taranu, D.S.; Webb, T.; et al. The Phase Space and Stellar Populations of Cluster Galaxies at z ~ 1: Simultaneous Constraints on the Location and Timescale of Satellite Quenching. Astrophys. J. 2014, 796, 65. [Google Scholar] [CrossRef] [Green Version]
- Oman, K.A.; Hudson, M.J.; Behroozi, P.S. Disentangling Satellite Galaxy Populations Using Orbit Tracking in Simulations. Mon. Not. R. Astron. Soc. 2013, 431, 2307–2316. [Google Scholar] [CrossRef] [Green Version]
- Rhee, J.; Smith, R.; Choi, H.; Yi, S.K.; Jaffé, Y.; Candlish, G.; Sánchez-Jánssen, R. Phase-Space Analysis in the Group and Cluster Environment: Time Since Infall and Tidal Mass Loss. Astrophys. J. 2017, 843, 128. [Google Scholar] [CrossRef]
- Bekki, K.; Couch, W.J.; Shioya, Y. Passive Spiral Formation from Halo Gas Starvation: Gradual Transformation into S0s. Astrophys. J. 2002, 577, 651–657. [Google Scholar] [CrossRef] [Green Version]
- Wetzel, A.R.; Tinker, J.L.; Conroy, C.; van den Bosch, F.C. Galaxy Evolution in Groups and Clusters: Satellite Star Formation Histories and Quenching Time-Scales in a Hierarchical Universe. Mon. Not. R. Astron. Soc. 2013, 432, 336–358. [Google Scholar] [CrossRef]
- Tomczak, A.R.; Lemaux, B.C.; Lubin, L.M.; Pelliccia, D.; Shen, L.; Gal, R.R.; Hung, D.; Kocevski, D.D.; Le Fèvre, O.; Mei, S.; et al. Conditional Quenching: A Detailed Look at the SFR-density Relation at z ∼ 0.9 from ORELSE. Mon. Not. R. Astron. Soc. 2019, 484, 4695–4710. [Google Scholar] [CrossRef] [Green Version]
- Tecce, T.E.; Cora, S.A.; Tissera, P.B.; Abadi, M.G.; Lagos, C.D.P. Ram Pressure Stripping in a Galaxy Formation Model—I. A Novel Numerical Approach. Mon. Not. R. Astron. Soc. 2010, 408, 2008–2021. [Google Scholar] [CrossRef]
- Bower, R.G.; Lucey, J.R.; Ellis, R.S. Precision Photometry of Early-Type Galaxies in the Coma and Virgo Clusters: A Test of the Universality of the Colour-Magnitude Relation—II. Analysis. Mon. Not. R. Astron. Soc. 1992, 254, 601. [Google Scholar] [CrossRef] [Green Version]
- Aragon-Salamanca, A.; Ellis, R.S.; Couch, W.J.; Carter, D. Evidence for Systematic Evolution in the Properties of Galaxies in Distant Clusters. Mon. Not. R. Astron. Soc. 1993, 262, 764–794. [Google Scholar] [CrossRef] [Green Version]
- Stanford, S.A.; Eisenhardt, P.R.; Dickinson, M. The Evolution of Early-Type Galaxies in Distant Clusters. Astrophys. J. 1998, 492, 461–479. [Google Scholar] [CrossRef] [Green Version]
- Blakeslee, J.P.; Holden, B.P.; Franx, M.; Rosati, P.; Bouwens, R.J.; Demarco, R.; Ford, H.C.; Homeier, N.L.; Illingworth, G.D.; Jee, M.J.; et al. Clusters at Half Hubble Time: Galaxy Structure and Colors in RX J0152.7-1357 and MS 1054-03. Astrophys. J. 2006, 644, 30–53. [Google Scholar] [CrossRef] [Green Version]
- Mei, S.; Blakeslee, J.P.; Stanford, S.A.; Holden, B.P.; Rosati, P.; Strazzullo, V.; Homeier, N.; Postman, M.; Franx, M.; Rettura, A.; et al. Evolution of the Color-Magnitude Relation in High-Redshift Clusters: Blue Early-Type Galaxies and Red Pairs in RDCS J0910+5422. Astrophys. J. 2006, 639, 81–94. [Google Scholar] [CrossRef] [Green Version]
- Mei, S.; Holden, B.P.; Blakeslee, J.P.; Rosati, P.; Postman, M.; Jee, M.J.; Rettura, A.; Sirianni, M.; Demarco, R.; Ford, H.C.; et al. Evolution of the Color-Magnitude Relation in High-Redshift Clusters: Early-Type Galaxies in the Lynx Supercluster at z ~ 1.26. Astrophys. J. 2006, 644, 759–768. [Google Scholar] [CrossRef] [Green Version]
- Mei, S.; Holden, B.P.; Blakeslee, J.P.; Ford, H.C.; Franx, M.; Homeier, N.L.; Illingworth, G.D.; Jee, M.J.; Overzier, R.; Postman, M.; et al. Evolution of the Color-Magnitude Relation in Galaxy Clusters at z ~ 1 from the ACS Intermediate Redshift Cluster Survey. Astrophys. J. 2009, 690, 42–68. [Google Scholar] [CrossRef] [Green Version]
- Cooper, M.C.; Newman, J.A.; Weiner, B.J.; Yan, R.; Willmer, C.N.A.; Bundy, K.; Coil, A.L.; Conselice, C.J.; Davis, M.; Faber, S.M.; et al. The DEEP2 Galaxy Redshift Survey: The Role of Galaxy Environment in the Cosmic Star Formation History. Mon. Not. R. Astron. Soc. 2008, 383, 1058–1078. [Google Scholar] [CrossRef] [Green Version]
- Hayashi, M.; Kodama, T.; Koyama, Y.; Tanaka, I.; Shimasaku, K.; Okamura, S. High Star Formation Activity in the Central Region of a Distant Cluster at z = 1.46. Mon. Not. R. Astron. Soc. 2010, 402, 1980–1990. [Google Scholar] [CrossRef] [Green Version]
- Hilton, M.; Lloyd-Davies, E.; Stanford, S.A.; Stott, J.P.; Collins, C.A.; Romer, A.K.; Hosmer, M.; Hoyle, B.; Kay, S.T.; Liddle, A.R.; et al. The XMM cluster survey: Active galactic nuclei and starburst galaxies in xmmxcS J2215.9–1738 at z = 1.46. Astrophys. J. 2010, 718, 133–147. [Google Scholar] [CrossRef]
- Lemaux, B.C.; Lubin, L.M.; Shapley, A.; Kocevski, D.; Gal, R.R.; Squires, G.K. The Origin of [O II] in Post-starburst and Red-sequence Galaxies in High-redshift Clusters. Astrophys. J. 2010, 716, 970–992. [Google Scholar] [CrossRef]
- Fassbender, R.; Nastasi, A.; Böhringer, H.; Šuhada, R.; Santos, J.S.; Rosati, P.; Pierini, D.; Mühlegger, M.; Quintana, H.; Schwope, A.D.; et al. The X-ray Luminous Galaxy Cluster XMMU J1007.4+1237 at z = 1.56. The Dawn of Starburst Activity in Cluster Cores. Astron. Astrophys. 2011, 527, L10. [Google Scholar] [CrossRef] [Green Version]
- Hayashi, M.; Kodama, T.; Koyama, Y.; Tadaki, K.I.; Tanaka, I. Properties of Star-Forming Galaxies in a Cluster and Its Surrounding Structure at Z = 1.46. Mon. Not. R. Astron. Soc. 2011, 415, 2670–2687. [Google Scholar] [CrossRef] [Green Version]
- Tadaki, K.i.; Kodama, T.; Ota, K.; Hayashi, M.; Koyama, Y.; Papovich, C.; Brodwin, M.; Tanaka, M.; Iye, M. A Large-Scale Structure Traced by [O II] Emitters Hosting a Distant Cluster at z= 1.62. Mon. Not. R. Astron. Soc. 2012, 423, 2617–2626. [Google Scholar] [CrossRef] [Green Version]
- Bayliss, M.B.; Ashby, M.L.N.; Ruel, J.; Brodwin, M.; Aird, K.A.; Bautz, M.W.; Benson, B.A.; Bleem, L.E.; Bocquet, S.; Carlstrom, J.E.; et al. SPT-CL J2040-4451: An SZ-selected Galaxy Cluster at z = 1.478 with Significant Ongoing Star Formation. Astrophys. J. 2014, 794, 12. [Google Scholar] [CrossRef] [Green Version]
- Fassbender, R.; Nastasi, A.; Santos, J.S.; Lidman, C.; Verdugo, M.; Koyama, Y.; Rosati, P.; Pierini, D.; Padilla, N.; Romeo, A.D.; et al. Galaxy Population Properties of the Massive X-ray Luminous Galaxy Cluster <ASTROBJ>XDCP J0044.0-2033</ASTROBJ> at z = 1.58. Red-sequence Formation, Massive Galaxy Assembly, and Central Star Formation Activity. Astron. Astrophys. 2014, 568, A5. [Google Scholar] [CrossRef] [Green Version]
- Santos, J.S.; Altieri, B.; Valtchanov, I.; Nastasi, A.; Böhringer, H.; Cresci, G.; Elbaz, D.; Fassbender, R.; Rosati, P.; Tozzi, P.; et al. The Reversal of the SF–Density Relation in a Massive, X-ray-selected Galaxy Cluster at z = 1.58: Results from Herschel. Mon. Not. R. Astron. Soc. 2015, 447, L65–L69. [Google Scholar] [CrossRef] [Green Version]
- Stach, S.M.; Swinbank, A.M.; Smail, I.; Hilton, M.; Simpson, J.M.; Cooke, E.A. ALMA Pinpoints a Strong Overdensity of U/LIRGs in the Massive Cluster XCS J2215 at z = 1.46. Astrophys. J. 2017, 849, 154. [Google Scholar] [CrossRef] [Green Version]
- Moster, B.P.; Naab, T.; White, S.D.M. Galactic Star Formation and Accretion Histories from Matching Galaxies to Dark Matter Haloes. Mon. Not. R. Astron. Soc. 2013, 428, 3121–3138. [Google Scholar] [CrossRef]
- Tran, K.V.H.; Nanayakkara, T.; Yuan, T.; Kacprzak, G.G.; Glazebrook, K.; Kewley, L.J.; Momcheva, I.; Papovich, C.J.; Quadri, R.; Rudnick, G.; et al. Zfire: Galaxy cluster kinematics, H α star formation rates, and gas phase metallicities of xmm-lss J02182-05102 at zcl = 1.6233. Astrophys. J. 2015, 811, 28. [Google Scholar] [CrossRef]
- Papovich, C.; Momcheva, I.; Willmer, C.N.A.; Finkelstein, K.D.; Finkelstein, S.L.; Tran, K.V.; Brodwin, M.; Dunlop, J.S.; Farrah, D.; Khan, S.A.; et al. A Spitzer-selected Galaxy Cluster at z = 1.62. Astrophys. J. 2010, 716, 1503–1513. [Google Scholar] [CrossRef] [Green Version]
- Tanaka, M.; Finoguenov, A.; Ueda, Y. A Spectroscopically Confirmed X-ray Cluster at z = 1.62 with a Possible Companion in the Subaru/XMM-Newton Deep Field. Astrophys. J. 2010, 716, L152–L156. [Google Scholar] [CrossRef] [Green Version]
- Smith, C.M.A.; Gear, W.K.; Smith, M.W.L.; Papageorgiou, A.; Eales, S.A. Revealing Dust Obscured Star Formation in CLJ1449+0856, a Cluster at Z = 2. Mon. Not. R. Astron. Soc. 2019, 486, 4304–4319. [Google Scholar] [CrossRef] [Green Version]
- Gobat, R.; Strazzullo, V.; Daddi, E.; Onodera, M.; Carollo, M.; Renzini, A.; Finoguenov, A.; Cimatti, A.; Scarlata, C.; Arimoto, N. WFC3 GRISM Confirmation of the Distant Cluster Cl J1449+0856 at Langzrang = 2.00: Quiescent and Star-forming Galaxy Populations. Astrophys. J. 2013, 776, 9. [Google Scholar] [CrossRef] [Green Version]
- Poglitsch, A.; Waelkens, C.; Geis, N.; Feuchtgruber, H.; Vandenbussche, B.; Rodriguez, L.; Krause, O.; Renotte, E.; van Hoof, C.; Saraceno, P.; et al. The Photodetector Array Camera and Spectrometer (PACS) on the Herschel Space Observatory. Astron. Astrophys. 2010, 518, L2. [Google Scholar] [CrossRef] [Green Version]
- Noble, A.G.; Webb, T.M.A.; Yee, H.K.C.; Muzzin, A.; Wilson, G.; van der Burg, R.F.J.; Balogh, M.L.; Shupe, D.L. The phase space of $z\sim 1.2$ sparcs clusters: Using herschel to probe dust temperature as a function of environment and accretion history. Astrophys. J. 2016, 816, 48. [Google Scholar] [CrossRef] [Green Version]
- Wagner, C.R.; Courteau, S.; Brodwin, M.; Stanford, S.A.; Snyder, G.F.; Stern, D. The evolution of star formation activity in cluster galaxies over 0.15 <z< 1.5. Astrophys. J. 2016, 834, 53. [Google Scholar] [CrossRef] [Green Version]
- Wagner, C.R.; Brodwin, M.; Snyder, G.F.; Gonzalez, A.H.; Stanford, S.A.; Alberts, S.; Pope, A.; Stern, D.; Zeimann, G.R.; Chary, R.R.; et al. Star formation in high-redshift cluster ellipticals. Astrophys. J. 2015, 800, 107. [Google Scholar] [CrossRef] [Green Version]
- Alberts, S.; Pope, A.; Brodwin, M.; Chung, S.M.; Cybulski, R.; Dey, A.; Eisenhardt, P.R.M.; Galametz, A.; Gonzalez, A.H.; Jannuzi, B.T.; et al. Star formation and agn activity in galaxy clusters from z = 1–2: A multi-wavelength analysis featuring herschel/pacs. Astrophys. J. 2016, 825, 72. [Google Scholar] [CrossRef] [Green Version]
- Cooke, E.A.; Smail, I.; Stach, S.M.; Swinbank, A.M.; Bower, R.G.; Chen, C.C.; Koyama, Y.; Thomson, A.P. The Submillimetre View of Massive Clusters at Z ~0.8–1.6. Mon. Not. R. Astron. Soc. 2019, 486, 3047–3058. [Google Scholar] [CrossRef]
- Lemaux, B.C.; Cucciati, O.; Le Fèvre, O.; Zamorani, G.; Lubin, L.M.; Hathi, N.; Ilbert, O.; Pelliccia, D.; Amorín, R.; Bardelli, S.; et al. The VIMOS Ultra Deep Survey: The Reversal of the Star-Formation Rate—Density Relation at 2 < z < 5. Astron. Astrophys. 2022, 662, A33. [Google Scholar] [CrossRef]
- Le Fèvre, O.; Tasca, L.A.M.; Cassata, P.; Garilli, B.; Le Brun, V.; Maccagni, D.; Pentericci, L.; Thomas, R.; Vanzella, E.; Zamorani, G.; et al. The VIMOS Ultra-Deep Survey: ~10 000 Galaxies with Spectroscopic Redshifts to Study Galaxy Assembly at Early Epochs 2 < z ≃ 6. Astron. Astrophys. 2015, 576, A79. [Google Scholar] [CrossRef] [Green Version]
- Cucciati, O.; Lemaux, B.C.; Zamorani, G.; Le Fèvre, O.; Tasca, L.A.M.; Hathi, N.P.; Lee, K.G.; Bardelli, S.; Cassata, P.; Garilli, B.; et al. The Progeny of a Cosmic Titan: A Massive Multi-Component Proto-Supercluster in Formation at z = 2.45 in VUDS. Astron. Astrophys. 2018, 619, A49. [Google Scholar] [CrossRef] [Green Version]
- Chartab, N.; Mobasher, B.; Darvish, B.; Finkelstein, S.; Guo, Y.; Kodra, D.; Lee, K.S.; Newman, J.A.; Pacifici, C.; Papovich, C.; et al. Large-Scale Structures in the CANDELS Fields: The Role of the Environment in Star Formation Activity. Astrophys. J. 2020, 890, 7. [Google Scholar] [CrossRef]
- Hwang, H.S.; Shin, J.; Song, H. Evolution of Star Formation Rate–Density Relation over Cosmic Time in a Simulated Universe: The Observed Reversal Reproduced. Mon. Not. R. Astron. Soc. 2019, 489, 339–348. [Google Scholar] [CrossRef]
- De Lucia, G.; Kauffmann, G.; White, S.D.M. Chemical Enrichment of the Intracluster and Intergalactic Medium in a Hierarchical Galaxy Formation Model. Mon. Not. R. Astron. Soc. 2004, 349, 1101–1116. [Google Scholar] [CrossRef] [Green Version]
- Tonnesen, S.; Cen, R. On the Reversal of Star Formation Rate-Density Relation at z = 1: Insights from Simulations. Astrophys. J. 2014, 788, 133. [Google Scholar] [CrossRef] [Green Version]
- Stevens, J.A.; Ivison, R.J.; Dunlop, J.S.; Smail, I.R.; Percival, W.J.; Hughes, D.H.; Rottgering, H.J.A.; van Breugel, W.J.M.; Reuland, M. The Formation of Cluster Elliptical Galaxies as Revealed by Extensive Star Formation. arXiv 2003, arXiv:0309495. [Google Scholar] [CrossRef] [Green Version]
- Wechsler, R.H.; Tinker, J.L. The Connection Between Galaxies and Their Dark Matter Halos. Annu. Rev. Astron. Astrophys. 2018, 56, 435–487. [Google Scholar] [CrossRef] [Green Version]
- Daddi, E.; Dannerbauer, H.; Krips, M.; Walter, F.; Dickinson, M.; Elbaz, D.; Morrison, G.E. A CO Emission Line from the Optical and Near-IR Undetected Submillimeter Galaxy GN10. Astrophys. J. 2009, 695, L176–L180. [Google Scholar] [CrossRef]
- Walter, F.; Decarli, R.; Carilli, C.; Bertoldi, F.; Cox, P.; da Cunha, E.; Daddi, E.; Dickinson, M.; Downes, D.; Elbaz, D.; et al. The Intense Starburst HDF 850.1 in a Galaxy Overdensity at z ≈ 5.2 in the Hubble Deep Field. Nature 2012, 486, 233–236. [Google Scholar] [CrossRef] [Green Version]
- Pope, A.; Borys, C.; Scott, D.; Conselice, C.; Dickinson, M.; Mobasher, B. The Hubble Deep Field North SCUBA Super-map—III. Optical and near-Infrared Properties of Submillimetre Galaxies. Mon. Not. R. Astron. Soc. 2005, 358, 149–167. [Google Scholar] [CrossRef] [Green Version]
- Hodge, J.A.; Carilli, C.L.; Walter, F.; Daddi, E.; Riechers, D. High-Resolution Spectroscopic Imaging of CO in a z = 4.05 Proto-cluster. Astrophys. J. 2013, 776, 22. [Google Scholar] [CrossRef] [Green Version]
- Riechers, D.A.; Capak, P.L.; Carilli, C.L.; Cox, P.; Neri, R.; Scoville, N.Z.; Schinnerer, E.; Bertoldi, F.; Yan, L. A Massive Molecular Gas Reservoir in the z = 5.3 Submillimeter Galaxy AzTEC-3. Astrophys. J. 2010, 720, L131–L136. [Google Scholar] [CrossRef] [Green Version]
- Pavesi, R.; Riechers, D.A.; Sharon, C.E.; Smolčić, V.; Faisst, A.L.; Schinnerer, E.; Carilli, C.L.; Capak, P.L.; Scoville, N.; Stacey, G.J. Hidden in Plain Sight: A Massive, Dusty Starburst in a Galaxy Protocluster at z = 5.7 in the COSMOS Field. Astrophys. J. 2018, 861, 43. [Google Scholar] [CrossRef] [Green Version]
- Bacon, R.; Accardo, M.; Adjali, L.; Anwand, H.; Bauer, S.; Biswas, I.; Blaizot, J.; Boudon, D.; Brau-Nogue, S.; Brinchmann, J.; et al. The MUSE second-generation VLT instrument. In Proceedings of the Ground-Based and Airborne Instrumentation for Astronomy III, San Diego, CA, USA, 14 July 2010; McLean, I.S., Ramsay, S.K., Takami, H., Eds.; SPIE: Bellingham, WA, USA, 2010; Volume 7735, p. 773508. [Google Scholar] [CrossRef]
- Shimakawa, R.; Kodama, T.; Hayashi, M.; Tanaka, I.; Matsuda, Y.; Kashikawa, N.; Shibuya, T.; Tadaki, K.I.; Koyama, Y.; Suzuki, T.L.; et al. Direct Evidence for Lyboldsymbol{alpha } Depletion in the Protocluster Core. Mon. Not. R. Astron. Soc. 2017, 468, L21–L25. [Google Scholar] [CrossRef] [Green Version]
- Matsuda, Y.; Yamada, T.; Hayashino, T.; Tamura, H.; Yamauchi, R.; Ajiki, M.; Fujita, S.S.; Murayama, T.; Nagao, T.; Ohta, K.; et al. A Subaru Search for Lyα Blobs in and around the Protocluster Region At Redshift z = 3.1. Astron. J. 2004, 128, 569–584. [Google Scholar] [CrossRef] [Green Version]
- Geach, J.E.; Dunlop, J.S.; Halpern, M.; Smail, I.; van der Werf, P.; Alexander, D.M.; Almaini, O.; Aretxaga, I.; Arumugam, V.; Asboth, V.; et al. The SCUBA-2 Cosmology Legacy Survey: 850 Mm Maps, Catalogues and Number Counts. Mon. Not. R. Astron. Soc. 2017, 465, 1789–1806. [Google Scholar] [CrossRef] [Green Version]
- Behroozi, P.S.; Marchesini, D.; Wechsler, R.H.; Muzzin, A.; Papovich, C.; Stefanon, M. Using Cumulative Number Densities to Compare Galaxies across Cosmic Time. Astrophys. J. 2013, 777, L10. [Google Scholar] [CrossRef]
- Lemaux, B.C.; Cucciati, O.; Tasca, L.A.M.; Le Fèvre, O.; Zamorani, G.; Cassata, P.; Garilli, B.; Le Brun, V.; Maccagni, D.; Pentericci, L.; et al. VIMOS Ultra-Deep Survey (VUDS): Witnessing the Assembly of a Massive Cluster at z ~ 3.3. Astron. Astrophys. 2014, 572, A41. [Google Scholar] [CrossRef] [Green Version]
- Mihos, J.C.; Hernquist, L. Gasdynamics and Starbursts in Major Mergers. Astrophys. J. 1996, 464, 641. [Google Scholar] [CrossRef]
- Swinbank, A.M.; Simpson, J.M.; Smail, I.; Harrison, C.M.; Hodge, J.A.; Karim, A.; Walter, F.; Alexander, D.M.; Brandt, W.N.; de Breuck, C.; et al. An ALMA Survey of Sub-Millimetre Galaxies in the Extended Chandra Deep Field South: The Far-Infrared Properties of SMGs. Mon. Not. R. Astron. Soc. 2014, 438, 1267–1287. [Google Scholar] [CrossRef] [Green Version]
- Narayanan, D.; Turk, M.; Feldmann, R.; Robitaille, T.; Hopkins, P.; Thompson, R.; Hayward, C.; Ball, D.; Faucher-Giguère, C.A.; Kereš, D. The Formation of Submillimetre-Bright Galaxies from Gas Infall over a Billion Years. Nature 2015, 525, 496–499. [Google Scholar] [CrossRef]
- Martizzi, D.; Vogelsberger, M.; Artale, M.C.; Haider, M.; Torrey, P.; Marinacci, F.; Nelson, D.; Pillepich, A.; Weinberger, R.; Hernquist, L.; et al. Baryons in the Cosmic Web of IllustrisTNG—I: Gas in Knots, Filaments, Sheets, and Voids. Mon. Not. R. Astron. Soc. 2019, 486, 3766–3787. [Google Scholar] [CrossRef]
- Umehata, H.; Fumagalli, M.; Smail, I.; Matsuda, Y.; Swinbank, A.M.; Cantalupo, S.; Sykes, C.; Ivison, R.J.; Steidel, C.C.; Shapley, A.E.; et al. Gas Filaments of the Cosmic Web Located around Active Galaxies in a Proto-Cluster. Science 2019, 366, 97–100. [Google Scholar] [CrossRef] [Green Version]
- Daddi, E.; Valentino, F.; Rich, R.M.; Neill, J.D.; Gronke, M.; O’Sullivan, D.; Elbaz, D.; Bournaud, F.; Finoguenov, A.; Marchal, A.; et al. Three Lyman-α-emitting Filaments Converging to a Massive Galaxy Group at z = 2.91: Discussing the Case for Cold Gas Infall. Astron. Astrophys. 2021, 649, A78. [Google Scholar] [CrossRef]
- Christensen, C.R.; Davé, R.; Governato, F.; Pontzen, A.; Brooks, A.; Munshi, F.; Quinn, T.; Wadsley, J. In-N-Out: The Gas Cycle from Dwarfs to Spiral Galaxies. Astrophys. J. 2016, 824, 57. [Google Scholar] [CrossRef]
- Walter, F.; Carilli, C.; Neeleman, M.; Decarli, R.; Popping, G.; Somerville, R.S.; Aravena, M.; Bertoldi, F.; Boogaard, L.; Cox, P.; et al. The Evolution of the Baryons Associated with Galaxies Averaged over Cosmic Time and Space. Astrophys. J. 2020, 902, 111. [Google Scholar] [CrossRef]
- Kereš, D.; Katz, N.; Weinberg, D.H.; Davé, R. How Do Galaxies Get Their Gas? Mon. Not. R. Astron. Soc. 2005, 363, 2–28. [Google Scholar] [CrossRef]
- Shi, K.; Toshikawa, J.; Lee, K.S.; Wang, T.; Cai, Z.; Fang, T. Accelerated Galaxy Growth and Environmental Quenching in a Protocluster at z = 3.24. Astrophys. J. 2021, 911, 46. [Google Scholar] [CrossRef]
- Fabian, A.C. Observational Evidence of Active Galactic Nuclei Feedback. Annu. Rev. Astron. Astrophys. 2012, 50, 455. [Google Scholar] [CrossRef] [Green Version]
- Voit, G.M.; Donahue, M. An Observationally Motivated Framework for AGN Heating of Cluster Cores. Astrophys. J. 2005, 634, 955–963. [Google Scholar] [CrossRef]
- Kauffmann, G.; White, S.D.M.; Heckman, T.M.; Ménard, B.; Brinchmann, J.; Charlot, S.; Tremonti, C.; Brinkmann, J. The Environmental Dependence of the Relations between Stellar Mass, Structure, Star Formation and Nuclear Activity in Galaxies. Mon. Not. R. Astron. Soc. 2004, 353, 713–731. [Google Scholar] [CrossRef] [Green Version]
- Popesso, P.; Biviano, A. The AGN Fraction-Velocity Dispersion Relation in Clusters of Galaxies. Astron. Astrophys. 2006, 460, L23. [Google Scholar] [CrossRef] [Green Version]
- Lopes, P.A.A.; Ribeiro, A.L.B.; Rembold, S.B. NoSOCS in SDSS—VI. The Environmental Dependence of AGN in Clusters and Field in the Local Universe. Mon. Not. R. Astron. Soc. 2017, 472, 409–418. [Google Scholar] [CrossRef]
- Galametz, A.; Stern, D.; Eisenhardt, P.R.M.; Brodwin, M.; Brown, M.J.I.; Dey, A.; Gonzalez, A.H.; Jannuzi, B.T.; Moustakas, L.A.; Stanford, S.A. The Cosmic Evolution of Active Galactic Nuclei in Galaxy Clusters. Astrophys. J. 2009, 694, 1309–1316. [Google Scholar] [CrossRef] [Green Version]
- Fassbender, R.; Šuhada, R.; Nastasi, A. AGN Triggering in the Infall Regions of Distant X-ray Luminous Galaxy Clusters at 0.9 < z < 1.6. Adv. Astron. 2012, 2012, 138380. [Google Scholar] [CrossRef] [Green Version]
- Martini, P.; Sivakoff, G.R.; Mulchaey, J.S. The Evolution of Active Galactic Nuclei in Clusters of Galaxies to Redshift 1.3. Astrophys. J. 2009, 701, 66–85. [Google Scholar] [CrossRef] [Green Version]
- Martini, P.; Miller, E.D.; Brodwin, M.; Stanford, S.A.; Gonzalez, A.H.; Bautz, M.; Hickox, R.C.; Stern, D.; Eisenhardt, P.R.; Galametz, A.; et al. The Cluster and Field Galaxy Active Galactic Nucleus Fraction at z = 1–1.5: Evidence for a Reversal of the Local Anticorrelation between Environment and AGN Fraction. Astrophys. J. 2013, 768, 1. [Google Scholar] [CrossRef]
- Bufanda, E.; Hollowood, D.; Jeltema, T.E.; Rykoff, E.S.; Rozo, E.; Martini, P.; Abbott, T.M.C.; Abdalla, F.B.; Allam, S.; Banerji, M.; et al. The Evolution of Active Galactic Nuclei in Clusters of Galaxies from the Dark Energy Survey. Mon. Not. R. Astron. Soc. 2017, 465, 2531–2539. [Google Scholar] [CrossRef] [Green Version]
- Kocevski, D.D.; Lubin, L.M.; Gal, R.; Lemaux, B.C.; Fassnacht, C.D.; Squires, G.K. Chandra Observations of the Cl1604 Supercluster at z = 0.9: Evidence for an Overdensity of Active Galactic Nuclei. Astrophys. J. 2009, 690, 295–318. [Google Scholar] [CrossRef] [Green Version]
- Digby-North, J.A.; Nandra, K.; Laird, E.S.; Steidel, C.C.; Georgakakis, A.; Bogosavljević, M.; Erb, D.K.; Shapley, A.E.; Reddy, N.A.; Aird, J. Excess AGN Activity in the z = 2.30 Protocluster in HS 1700+64. Mon. Not. R. Astron. Soc. 2010, 407, 846–853. [Google Scholar] [CrossRef] [Green Version]
- Kubo, M.; Toshikawa, J.; Kashikawa, N.; Chiang, Y.K.; Overzier, R.; Uchiyama, H.; Clements, D.L.; Alexander, D.M.; Matsuda, Y.; Kodama, T.; et al. Planck Far-infrared Detection of Hyper Suprime-Cam Protoclusters at z ∼ 4: Hidden AGN and Star Formation Activity. Astrophys. J. 2019, 887, 214. [Google Scholar] [CrossRef] [Green Version]
- Macuga, M.; Martini, P.; Miller, E.D.; Brodwin, M.; Hayashi, M.; Kodama, T.; Koyama, Y.; Overzier, R.A.; Shimakawa, R.; Tadaki, K.i.; et al. The Fraction of Active Galactic Nuclei in the USS 1558-003 Protocluster at z = 2.53. Astrophys. J. 2019, 874, 54. [Google Scholar] [CrossRef] [Green Version]
- Alexander, D.M.; Hickox, R.C. What Drives the Growth of Black Holes? New Astron. Rev. 2012, 56, 93–121. [Google Scholar] [CrossRef] [Green Version]
- Brandt, W.N.; Alexander, D.M. Cosmic X-ray Surveys of Distant Active Galaxies. The Demographics, Physics, and Ecology of Growing Supermassive Black Holes. Astron. Astrophys. Rev. 2015, 23, 1. [Google Scholar] [CrossRef]
- Mendez, A.J.; Coil, A.L.; Aird, J.; Diamond-Stanic, A.M.; Moustakas, J.; Blanton, M.R.; Cool, R.J.; Eisenstein, D.J.; Wong, K.C.; Zhu, G. PRIMUS: Infrared and X-Ray AGN Selection Techniques at 0.2 < z < 1.2. Astrophys. J. 2013, 770, 40. [Google Scholar] [CrossRef] [Green Version]
- Azadi, M.; Coil, A.L.; Aird, J.; Reddy, N.; Shapley, A.; Freeman, W.R.; Kriek, M.; Leung, G.C.K.; Mobasher, B.; Price, S.H.; et al. The MOSDEF Survey: AGN Multi-wavelength Identification, Selection Biases, and Host Galaxy Properties. Astrophys. J. 2017, 835, 27. [Google Scholar] [CrossRef] [Green Version]
- Lyu, J.; Alberts, S.; Rieke, G.H.; Rujopakarn, W. AGN Selection and Demographics in GOODS-S/HUDF from X-ray to Radio. arXiv 2022, arXiv:220906219L. [Google Scholar]
- Lacy, M.; Storrie-Lombardi, L.J.; Sajina, A.; Appleton, P.N.; Armus, L.; Chapman, S.C.; Choi, P.I.; Fadda, D.; Fang, F.; Frayer, D.T.; et al. Obscured and Unobscured Active Galactic Nuclei in the Spitzer Space Telescope First Look Survey. Astrophys. J. Suppl. Ser. 2004, 154, 166–169. [Google Scholar] [CrossRef]
- Stern, D.; Eisenhardt, P.; Gorjian, V.; Kochanek, C.S.; Caldwell, N.; Eisenstein, D.; Brodwin, M.; Brown, M.J.I.; Cool, R.; Dey, A.; et al. Mid-Infrared Selection of Active Galaxies. Astrophys. J. 2005, 631, 163–168. [Google Scholar] [CrossRef] [Green Version]
- Stern, D.; Assef, R.J.; Benford, D.J.; Blain, A.; Cutri, R.; Dey, A.; Eisenhardt, P.; Griffith, R.L.; Jarrett, T.H.; Lake, S.; et al. Mid-Infrared Selection of Active Galactic Nuclei with the Wide-Field Infrared Survey Explorer. I. Characterizing WISE-selected Active Galactic Nuclei in COSMOS. Astrophys. J. 2012, 753, 30. [Google Scholar] [CrossRef] [Green Version]
- Assef, R.J.; Kochanek, C.S.; Brodwin, M.; Brown, M.J.I.; Caldwell, N.; Cool, R.J.; Eisenhardt, P.; Eisenstein, D.; Gonzalez, A.H.; Jannuzi, B.T.; et al. Low-Resolution Spectral Templates for Galaxies from 0.2 to 10 Mm. Astrophys. J. 2008, 676, 286–303. [Google Scholar] [CrossRef] [Green Version]
- Assef, R.J.; Kochanek, C.S.; Brodwin, M.; Cool, R.; Forman, W.; Gonzalez, A.H.; Hickox, R.C.; Jones, C.; Le Floc’h, E.; Moustakas, J.; et al. Low-Resolution Spectral Templates for Active Galactic Nuclei and Galaxies from 0.03 to 30 Mm. Astrophys. J. 2010, 713, 970–985. [Google Scholar] [CrossRef] [Green Version]
- Treister, E.; Urry, C.M.; Virani, S. The Space Density of Compton-Thick Active Galactic Nucleus and the X-Ray Background. Astrophys. J. 2009, 696, 110–120. [Google Scholar] [CrossRef]
- Akylas, A.; Georgakakis, A.; Georgantopoulos, I.; Brightman, M.; Nandra, K. Constraining the Fraction of Compton-thick AGN in the Universe by Modelling the Diffuse X-ray Background Spectrum. Astron. Astrophys. 2012, 546, A98. [Google Scholar] [CrossRef] [Green Version]
- Akylas, A.; Georgantopoulos, I.; Ranalli, P.; Gkiokas, E.; Corral, A.; Lanzuisi, G. Compton-Thick AGN in the 70-Month Swift-BAT All-Sky Hard X-ray Survey: A Bayesian Approach. Astron. Astrophys. 2016, 594, A73. [Google Scholar] [CrossRef] [Green Version]
- Georgantopoulos, I.; Akylas, A. NuSTAR Observations of Heavily Obscured Swift/BAT AGNs: Constraints on the Compton-thick AGNs Fraction. Astron. Astrophys. 2019, 621, A28. [Google Scholar] [CrossRef] [Green Version]
- Mishra, H.D.; Dai, X. Lower AGN Abundance in Galaxy Clusters at z < 0.5. Astron. J. 2020, 159, 69. [Google Scholar] [CrossRef] [Green Version]
- Hickox, R.C.; Jones, C.; Forman, W.R.; Murray, S.S.; Kochanek, C.S.; Eisenstein, D.; Jannuzi, B.T.; Dey, A.; Brown, M.J.I.; Stern, D.; et al. Host Galaxies, Clustering, Eddington Ratios, and Evolution of Radio, X-ray, and Infrared-Selected AGNs. Astrophys. J. 2009, 696, 891–919. [Google Scholar] [CrossRef]
- Brodwin, M.; Dey, A.; Brown, M.J.I.; Pope, A.; Armus, L.; Bussmann, S.; Desai, V.; Jannuzi, B.T.; Le Floc’h, E. Clustering of Dust-Obscured Galaxies at z ~ 2. Astrophys. J. 2008, 687, L65. [Google Scholar] [CrossRef] [Green Version]
- Dey, A.; Soifer, B.T.; Desai, V.; Brand, K.; Le Floc’h, E.; Brown, M.J.I.; Jannuzi, B.T.; Armus, L.; Bussmann, S.; Brodwin, M.; et al. A Significant Population of Very Luminous Dust-Obscured Galaxies at Redshift z ~ 2. Astrophys. J. 2008, 677, 943–956. [Google Scholar] [CrossRef] [Green Version]
- Ellison, S.L.; Patton, D.R.; Mendel, J.T.; Scudder, J.M. Galaxy Pairs in the Sloan Digital Sky Survey—IV. Interactions Trigger Active Galactic Nuclei. Mon. Not. R. Astron. Soc. 2011, 418, 2043–2053. [Google Scholar] [CrossRef]
- Ellison, S.L.; Mendel, J.T.; Scudder, J.M.; Patton, D.R.; Palmer, M.J.D. Galaxy Pairs in the Sloan Digital Sky Survey—VII. The Merger-Luminous Infrared Galaxy Connection. Mon. Not. R. Astron. Soc. 2013, 430, 3128–3141. [Google Scholar] [CrossRef] [Green Version]
- Ellison, S.L.; Patton, D.R.; Hickox, R.C. Galaxy Pairs in the Sloan Digital Sky Survey—XII. The Fuelling Mechanism of Low-Excitation Radio-Loud AGN. Mon. Not. R. Astron. Soc. 2015, 451, L35–L39. [Google Scholar] [CrossRef] [Green Version]
- Ellison, S.L.; Viswanathan, A.; Patton, D.R.; Bottrell, C.; McConnachie, A.W.; Gwyn, S.; Cuillandre, J.C. A Definitive Merger-AGN Connection at Z~0 with CFIS: Mergers Have an Excess of AGN and AGN Hosts Are More Frequently Disturbed. Mon. Not. R. Astron. Soc. 2019, 487, 2491–2504. [Google Scholar] [CrossRef]
- Weston, M.E.; McIntosh, D.H.; Brodwin, M.; Mann, J.; Cooper, A.; McConnell, A.; Nielsen, J.L. Incidence of WISE -Selected Obscured AGNs in Major Mergers and Interactions from the SDSS. Mon. Not. R. Astron. Soc. 2017, 464, 3882–3906. [Google Scholar] [CrossRef] [Green Version]
- Urrutia, T.; Lacy, M.; Becker, R.H. Evidence for Quasar Activity Triggered by Galaxy Mergers in HST Observations of Dust-reddened Quasars. Astrophys. J. 2008, 674, 80–96. [Google Scholar] [CrossRef] [Green Version]
- Glikman, E.; Simmons, B.; Mailly, M.; Schawinski, K.; Urry, C.M.; Lacy, M. Major Mergers Host the Most-luminous Red Quasars at z ~ 2: A Hubble Space Telescope WFC3/IR Study. Astrophys. J. 2015, 806, 218. [Google Scholar] [CrossRef] [Green Version]
- Donley, J.L.; Kartaltepe, J.; Kocevski, D.; Salvato, M.; Santini, P.; Suh, H.; Civano, F.; Koekemoer, A.M.; Trump, J.; Brusa, M.; et al. Evidence for Merger-driven Growth in Luminous, High-z, Obscured AGNs in the CANDELS/COSMOS Field. Astrophys. J. 2018, 853, 63. [Google Scholar] [CrossRef]
- Blecha, L.; Snyder, G.F.; Satyapal, S.; Ellison, S.L. The Power of Infrared AGN Selection in Mergers: A Theoretical Study. Mon. Not. R. Astron. Soc. 2018, 478, 3056–3071. [Google Scholar] [CrossRef]
- Decarli, R.; Walter, F.; Gónzalez-López, J.; Aravena, M.; Boogaard, L.; Carilli, C.; Cox, P.; Daddi, E.; Popping, G.; Riechers, D.; et al. The ALMA Spectroscopic Survey in the HUDF: CO Luminosity Functions and the Molecular Gas Content of Galaxies through Cosmic History. Astrophys. J. 2019, 882, 138. [Google Scholar] [CrossRef] [Green Version]
- Decarli, R.; Aravena, M.; Boogaard, L.; Carilli, C.; González-López, J.; Walter, F.; Cortes, P.C.; Cox, P.; da Cunha, E.; Daddi, E.; et al. The ALMA Spectroscopic Survey in the Hubble Ultra Deep Field: Multiband Constraints on Line-luminosity Functions and the Cosmic Density of Molecular Gas. Astrophys. J. 2020, 902, 110. [Google Scholar] [CrossRef]
- Whitaker, K.E.; Franx, M.; Leja, J.; van Dokkum, P.G.; Henry, A.; Skelton, R.E.; Fumagalli, M.; Momcheva, I.G.; Brammer, G.B.; Labbé, I.; et al. Constraining the Low-mass Slope of the Star Formation Sequence at 0.5 < z < 2.5. Astrophys. J. 2014, 795, 104. [Google Scholar] [CrossRef] [Green Version]
- Speagle, J.S.; Steinhardt, C.L.; Capak, P.L.; Silverman, J.D. A Highly Consistent Framework for the Evolution of the Star-Forming “Main Sequence” from z ~ 0–6. Astrophys. J. Suppl. Ser. 2014, 214, 15. [Google Scholar] [CrossRef] [Green Version]
- Geach, J.E.; Smail, I.; Moran, S.M.; MacArthur, L.A.; Lagos, C.d.P.; Edge, A.C. On the Evolution of the Molecular Gas Fraction of Star-Forming Galaxies. Astrophys. J. 2011, 730, L19. [Google Scholar] [CrossRef]
- Genzel, R.; Tacconi, L.J.; Lutz, D.; Saintonge, A.; Berta, S.; Magnelli, B.; Combes, F.; García-Burillo, S.; Neri, R.; Bolatto, A.; et al. Combined CO and Dust Scaling Relations of Depletion Time and Molecular Gas Fractions with Cosmic Time, Specific Star-formation Rate, and Stellar Mass. Astrophys. J. 2015, 800, 20. [Google Scholar] [CrossRef]
- Tacconi, L.J.; Genzel, R.; Saintonge, A.; Combes, F.; García-Burillo, S.; Neri, R.; Bolatto, A.; Contini, T.; Förster Schreiber, N.M.; Lilly, S.; et al. PHIBSS: Unified Scaling Relations of Gas Depletion Time and Molecular Gas Fractions. Astrophys. J. 2018, 853, 179. [Google Scholar] [CrossRef]
- Davé, R.; Finlator, K.; Oppenheimer, B.D. An Analytic Model for the Evolution of the Stellar, Gas and Metal Content of Galaxies. Mon. Not. R. Astron. Soc. 2012, 421, 98–107. [Google Scholar] [CrossRef] [Green Version]
- Saintonge, A.; Catinella, B.; Cortese, L.; Genzel, R.; Giovanelli, R.; Haynes, M.P.; Janowiecki, S.; Kramer, C.; Lutz, K.A.; Schiminovich, D.; et al. Molecular and Atomic Gas along and across the Main Sequence of Star-Forming Galaxies. Mon. Not. R. Astron. Soc. 2016, 462, 1749–1756. [Google Scholar] [CrossRef]
- Saintonge, A.; Catinella, B.; Tacconi, L.J.; Kauffmann, G.; Genzel, R.; Cortese, L.; Davé, R.; Fletcher, T.J.; Graciá-Carpio, J.; Kramer, C.; et al. xCOLD GASS: The Complete IRAM 30 m Legacy Survey of Molecular Gas for Galaxy Evolution Studies. Astrophys. J. Suppl. Ser. 2017, 233, 22. [Google Scholar] [CrossRef] [Green Version]
- Bolatto, A.D.; Wong, T.; Utomo, D.; Blitz, L.; Vogel, S.N.; Sánchez, S.F.; Barrera-Ballesteros, J.; Cao, Y.; Colombo, D.; Dannerbauer, H.; et al. The EDGE-CALIFA Survey: Interferometric Observations of 126 Galaxies with CARMA. Astrophys. J. 2017, 846, 159. [Google Scholar] [CrossRef]
- Lin, L.; Pan, H.A.; Ellison, S.L.; Belfiore, F.; Shi, Y.; Sánchez, S.F.; Hsieh, B.C.; Rowlands, K.; Ramya, S.; Thorp, M.D.; et al. The ALMaQUEST Survey: The Molecular Gas Main Sequence and the Origin of the Star-forming Main Sequence. Astrophys. J. 2019, 884, L33. [Google Scholar] [CrossRef]
- Ellison, S.L.; Thorp, M.D.; Lin, L.; Pan, H.A.; Bluck, A.F.L.; Scudder, J.M.; Teimoorinia, H.; Sánchez, S.F.; Sargent, M. The ALMaQUEST Survey—III. Scatter in the Resolved Star-Forming Main Sequence Is Primarily Due to Variations in Star Formation Efficiency. Mon. Not. R. Astron. Soc. 2020, 493, L39–L43. [Google Scholar] [CrossRef]
- Baars, J.W.M.; Hooghoudt, B.G.; Mezger, P.G.; de Jonge, M.J. The IRAM 30-m Millimeter Radio Telescope on Pico Veleta, Spain. Astron. Astrophys. 1987, 175, 319. [Google Scholar]
- Saintonge, A.; Kauffmann, G.; Kramer, C.; Tacconi, L.J.; Buchbender, C.; Catinella, B.; Fabello, S.; Graciá-Carpio, J.; Wang, J.; Cortese, L.; et al. COLD GASS, an IRAM Legacy Survey of Molecular Gas in Massive Galaxies—I. Relations between H2, H I, Stellar Content and Structural Properties. Mon. Not. R. Astron. Soc. 2011, 415, 32–60. [Google Scholar] [CrossRef] [Green Version]
- Tacconi, L.J.; Neri, R.; Genzel, R.; Combes, F.; Bolatto, A.; Cooper, M.C.; Wuyts, S.; Bournaud, F.; Burkert, A.; Comerford, J.; et al. Phibss: Molecular Gas Content and Scaling Relations in z ~ 1-3 Massive, Main-sequence Star-forming Galaxies. Astrophys. J. 2013, 768, 74. [Google Scholar] [CrossRef] [Green Version]
- Freundlich, J.; Combes, F.; Tacconi, L.J.; Genzel, R.; Garcia-Burillo, S.; Neri, R.; Contini, T.; Bolatto, A.; Lilly, S.; Salomé, P.; et al. PHIBSS2: Survey Design and z = 0.5–0.8 Results. Molecular Gas Reservoirs during the Winding-down of Star Formation. Astron. Astrophys. 2019, 622, A105. [Google Scholar] [CrossRef] [Green Version]
- Koyama, S.; Koyama, Y.; Yamashita, T.; Morokuma-Matsui, K.; Matsuhara, H.; Nakagawa, T.; Hayashi, M.; Kodama, T.; Shimakawa, R.; Suzuki, T.L.; et al. A Universal Correlation between Star Formation Activity and Molecular Gas Properties Across Environments. Astrophys. J. 2017, 847, 137. [Google Scholar] [CrossRef] [Green Version]
- Bolatto, A.D.; Wolfire, M.; Leroy, A.K. The CO-to-H2 Conversion Factor. Annu. Rev. Astron. Astrophys. 2013, 51, 207. [Google Scholar] [CrossRef] [Green Version]
- Narayanan, D.; Krumholz, M.R. A Theory for the Excitation of CO in Star-Forming Galaxies. Mon. Not. R. Astron. Soc. 2014, 442, 1411–1428. [Google Scholar] [CrossRef]
- Papadopoulos, P.P.; van der Werf, P.P.; Xilouris, E.M.; Isaak, K.G.; Gao, Y.; Mühle, S. The Molecular Gas in Luminous Infrared Galaxies—I. CO Lines, Extreme Physical Conditions and Their Drivers. Mon. Not. R. Astron. Soc. 2012, 426, 2601–2629. [Google Scholar] [CrossRef] [Green Version]
- Narayanan, D.; Krumholz, M.R.; Ostriker, E.C.; Hernquist, L. A General Model for the CO-H2 Conversion Factor in Galaxies with Applications to the Star Formation Law: The Effect of Galactic Environment on XCO. Mon. Not. R. Astron. Soc. 2012, 421, 3127–3146. [Google Scholar] [CrossRef] [Green Version]
- Genzel, R.; Tacconi, L.J.; Combes, F.; Bolatto, A.; Neri, R.; Sternberg, A.; Cooper, M.C.; Bouché, N.; Bournaud, F.; Burkert, A.; et al. The metallicity dependence of the co → H 2 conversion factor in z ⩾ 1 star-forming galaxies. Astrophys. J. 2012, 746, 69. [Google Scholar] [CrossRef] [Green Version]
- Janowiecki, S.; Cortese, L.; Catinella, B.; Goodwin, A.J. Lurking Systematics in Predicting Galaxy Cold Gas Masses Using Dust Luminosities and Star Formation Rates. Mon. Not. R. Astron. Soc. 2018, 476, 1390–1404. [Google Scholar] [CrossRef] [Green Version]
- Draine, B.T.; Li, A. Infrared Emission from Interstellar Dust. IV. The Silicate-Graphite-PAH Model in the Post-Spitzer Era. Astrophys. J. 2007, 657, 810–837. [Google Scholar] [CrossRef] [Green Version]
- Dunne, L.; Maddox, S.J.; Papadopoulos, P.P.; Ivison, R.J.; Gomez, H.L. Dust, CO and [CI]: Cross-calibration of Molecular Gas Mass Tracers in Metal-Rich Galaxies across Cosmic Time. Mon. Not. R. Astron. Soc. 2022, 517, 962–999. [Google Scholar] [CrossRef]
- Leroy, A.K.; Bolatto, A.; Gordon, K.; Sandstrom, K.; Gratier, P.; Rosolowsky, E.; Engelbracht, C.W.; Mizuno, N.; Corbelli, E.; Fukui, Y.; et al. The CO-to-H2 Conversion Factor from Infrared Dust Emission across the Local Group. Astrophys. J. 2011, 737, 12. [Google Scholar] [CrossRef] [Green Version]
- Sandstrom, K.M.; Leroy, A.K.; Walter, F.; Bolatto, A.D.; Croxall, K.V.; Draine, B.T.; Wilson, C.D.; Wolfire, M.; Calzetti, D.; Kennicutt, R.C.; et al. The CO-to-H2 Conversion Factor and Dust-to-gas Ratio on Kiloparsec Scales in Nearby Galaxies. Astrophys. J. 2013, 777, 5. [Google Scholar] [CrossRef] [Green Version]
- Eales, S.; Smith, M.W.L.; Auld, R.; Baes, M.; Bendo, G.J.; Bianchi, S.; Boselli, A.; Ciesla, L.; Clements, D.; Cooray, A.; et al. Can Dust Emission Be Used to Estimate the Mass of the Interstellar Medium in Galaxies—A Pilot Project with the Herschel Reference Survey. Astrophys. J. 2012, 761, 168. [Google Scholar] [CrossRef] [Green Version]
- Kaasinen, M.; Scoville, N.; Walter, F.; Da Cunha, E.; Popping, G.; Pavesi, R.; Darvish, B.; Casey, C.M.; Riechers, D.A.; Glover, S. The Molecular Gas Reservoirs of z ∼ 2 Galaxies: A Comparison of CO(1-0) and Dust-based Molecular Gas Masses. Astrophys. J. 2019, 880, 15. [Google Scholar] [CrossRef]
- Groves, B.A.; Schinnerer, E.; Leroy, A.; Galametz, M.; Walter, F.; Bolatto, A.; Hunt, L.; Dale, D.; Calzetti, D.; Croxall, K.; et al. Dust Continuum Emission as a Tracer of Gas Mass in Galaxies. Astrophys. J. 2015, 799, 96. [Google Scholar] [CrossRef] [Green Version]
- Roman-Duval, J.; Bot, C.; Chastenet, J.; Gordon, K. Dust Abundance Variations in the Magellanic Clouds: Probing the Life-cycle of Metals with All-sky Surveys. Astrophys. J. 2017, 841, 72. [Google Scholar] [CrossRef] [Green Version]
- Gould, R.J.; Salpeter, E.E. The Interstellar Abundance of the Hydrogen Molecule. I. Basic Processes. Astrophys. J. 1963, 138, 393. [Google Scholar] [CrossRef]
- Le Bourlot, J.; Le Petit, F.; Pinto, C.; Roueff, E.; Roy, F. Surface Chemistry in the Interstellar Medium. I. H2 Formation by Langmuir-Hinshelwood and Eley-Rideal Mechanisms. Astron. Astrophys. 2012, 541, A76. [Google Scholar] [CrossRef] [Green Version]
- Cortese, L.; Bekki, K.; Boselli, A.; Catinella, B.; Ciesla, L.; Hughes, T.M.; Baes, M.; Bendo, G.J.; Boquien, M.; de Looze, I.; et al. The Selective Effect of Environment on the Atomic and Molecular Gas-to-Dust Ratio of Nearby Galaxies in the Herschel Reference Survey. Mon. Not. R. Astron. Soc. 2016, 459, 3574–3584. [Google Scholar] [CrossRef] [Green Version]
- Nakanishi, H.; Kuno, N.; Sofue, Y.; Sato, N.; Nakai, N.; Shioya, Y.; Tosaki, T.; Onodera, S.; Sorai, K.; Egusa, F.; et al. Environmental Effects on Gaseous Disks of the Virgo Spiral Galaxies. Astrophys. J. 2006, 651, 804–810. [Google Scholar] [CrossRef]
- Henderson, B.; Bekki, K. Significant Enhancement of H2 Formation in Disk Galaxies under Strong Ram Pressure. Astrophys. J. 2016, 822, L33. [Google Scholar] [CrossRef] [Green Version]
- Haynes, M.P.; Giovanelli, R.; Chincarini, G.L. The Influence of Envirionment on the H I Content of Galaxies. Annu. Rev. Astron. Astrophys. 1984, 22, 445–470. [Google Scholar] [CrossRef]
- Davies, R.D.; Lewis, B.M. Neutral Hydrogen in Virgo Cluster Galaxies. Mon. Not. R. Astron. Soc. 1973, 165, 231–244. [Google Scholar] [CrossRef] [Green Version]
- Haynes, M.P.; Giovanelli, R. Neutral Hydrogen in Isolated Galaxies. IV. Results for the Arecibo Sample. Astron. J. 1984, 89, 758–800. [Google Scholar] [CrossRef]
- Giovanelli, R.; Haynes, M.P. Gas Deficiency in Cluster Galaxies: A Comparison of Nine Clusters. Astrophys. J. 1985, 292, 404–425. [Google Scholar] [CrossRef]
- Wong, T.; Blitz, L. The Relationship between Gas Content and Star Formation in Molecule-rich Spiral Galaxies. Astrophys. J. 2002, 569, 157–183. [Google Scholar] [CrossRef] [Green Version]
- Kenney, J.D.P.; Young, J.S. The Effects of Environment on the Molecular and Atomic Gas Properties of Large Virgo Cluster Spirals. Astrophys. J. 1989, 344, 171. [Google Scholar] [CrossRef]
- Stark, A.A.; Knapp, G.R.; Bally, J.; Wilson, R.W.; Penzias, A.A.; Rowe, H.E. Molecules in Galaxies. III. The Virgo Cluster. Astrophys. J. 1986, 310, 660. [Google Scholar] [CrossRef]
- Boselli, A. Multifrequency Windows on Spiral Galaxies. IV. Gas Content and Star Formation in the Virgo Cluster. Astron. Astrophys. 1994, 292, 1–12. [Google Scholar]
- Boselli, A.; Lequeux, J.; Gavazzi, G. Molecular Gas in Normal Late-Type Galaxies. Astron. Astrophys. 2002, 384, 33–47. [Google Scholar] [CrossRef] [Green Version]
- Casoli, F.; Dickey, J.; Kazes, I.; Boselli, A.; Gavazzi, P.; Baumgardt, K. H I, H_2_ and Star Formation in Spiral Galaxies in the Region of the Coma Supercluster. Astron. Astrophys. 1996, 309, 43–58. [Google Scholar]
- Casoli, F.; Boisse, P.; Combes, F.; Dupraz, C. Are HI-deficient Galaxies of the Coma Supercluster Deficient in Moleculargas? Astron. Astrophys. 1991, 249, 359. [Google Scholar]
- Boselli, A.; Gavazzi, G.; Lequeux, J.; Buat, V.; Casoli, F.; Dickey, J.; Donas, J. The Molecular Gas Content of Spiral Galaxies in the Coma/A1367 Supercluster. Astron. Astrophys. 1997, 327, 522–538. [Google Scholar]
- Horellou, C.; Casoli, F.; Dupraz, C. The CO and HI Emission of Spiral and Lenticular Galaxies in the Fornax Cluster. Astron. Astrophys. 1995, 303, 361. [Google Scholar]
- Young, J.S.; Xie, S.; Kenney, J.D.P.; Rice, W.L. Global Properties of Infrared Bright Galaxies. Astrophys. J. Suppl. Ser. 1989, 70, 699. [Google Scholar] [CrossRef]
- Rengarajan, T.N.; Iyengar, K.V.K. Are Virgo Cluster Spirals Deficient in Molecular Gas ? Mon. Not. R. Astron. Soc. 1992, 259, 559–562. [Google Scholar] [CrossRef] [Green Version]
- Young, J.S.; Xie, S.; Tacconi, L.; Knezek, P.; Viscuso, P.; Tacconi-Garman, L.; Scoville, N.; Schneider, S.; Schloerb, F.P.; Lord, S.; et al. The FCRAO Extragalactic CO Survey. I. The Data. Astrophys. J. Suppl. Ser. 1995, 98, 219. [Google Scholar] [CrossRef]
- Young, J.S.; Scoville, N.Z. Molecular Gas in Galaxies. Annu. Rev. Astron. Astrophys. 1991, 29, 581. [Google Scholar] [CrossRef]
- Casoli, F.; Sauty, S.; Gerin, M.; Boselli, A.; Fouque, P.; Braine, J.; Gavazzi, G.; Lequeux, J.; Dickey, J. Molecular Gas in Spiral Galaxies. Astron. Astrophys. 1998, 331, 451–462. [Google Scholar]
- Sage, L.J. Molecular Gas in Nearby Galaxies. I. CO Observations of a Distance-Limited Sample. Astron. Astrophys. 1993, 272, 123–136. [Google Scholar]
- Vollmer, B.; Balkowski, C.; Cayatte, V.; van Driel, W.; Huchtmeier, W. NGC 4569: Recent Evidence for a Past Ram Pressure Stripping Event. Astron. Astrophys. 2004, 419, 35–46. [Google Scholar] [CrossRef]
- Crowl, H.H.; Kenney, J.D.P. The Stellar Populations of Stripped Spiral Galaxies in the Virgo Cluster. Astron. J. 2008, 136, 1623–1644. [Google Scholar] [CrossRef] [Green Version]
- Leroy, A.K.; Walter, F.; Brinks, E.; Bigiel, F.; de Blok, W.J.G.; Madore, B.; Thornley, M.D. The Star Formation Efficiency in Nearby Galaxies: Measuring Where Gas Forms Stars Effectively. Astron. J. 2008, 136, 2782–2845. [Google Scholar] [CrossRef] [Green Version]
- Fumagalli, M.; Gavazzi, G. The Relationship between Gas Content and Star Formation Rate in Spiral Galaxies. Comparing the Local Field with the Virgo Cluster. Astron. Astrophys. 2008, 490, 571–581. [Google Scholar] [CrossRef] [Green Version]
- Helfer, T.T.; Thornley, M.D.; Regan, M.W.; Wong, T.; Sheth, K.; Vogel, S.N.; Blitz, L.; Bock, D.C.J. The BIMA Survey of Nearby Galaxies (BIMA SONG). II. The CO Data. Astrophys. J. Suppl. Ser. 2003, 145, 259–327. [Google Scholar] [CrossRef] [Green Version]
- Kuno, N.; Sato, N.; Nakanishi, H.; Hirota, A.; Tosaki, T.; Shioya, Y.; Sorai, K.; Nakai, N.; Nishiyama, K.; Vila-Vilaró, B. Nobeyama CO Atlas of Nearby Spiral Galaxies: Distribution of Molecular Gas in Barred and Nonbarred Spiral Galaxies. Publ. Astron. Soc. Jpn. 2007, 59, 117–166. [Google Scholar] [CrossRef] [Green Version]
- Scott, T.C.; Usero, A.; Brinks, E.; Boselli, A.; Cortese, L.; Bravo-Alfaro, H. CO in Late-Type Galaxies within the Central Region of Abell 1367. Mon. Not. R. Astron. Soc. 2013, 429, 221–241. [Google Scholar] [CrossRef] [Green Version]
- Scott, T.C.; Bravo-Alfaro, H.; Brinks, E.; Caretta, C.A.; Cortese, L.; Boselli, A.; Hardcastle, M.J.; Croston, J.H.; Plauchu, I. Probing Evolutionary Mechanisms in Galaxy Clusters: Neutral Atomic Hydrogen in Abell1367. Mon. Not. R. Astron. Soc. 2010, 403, 1175–1192. [Google Scholar] [CrossRef] [Green Version]
- Boselli, A.; Eales, S.; Cortese, L.; Bendo, G.; Chanial, P.; Buat, V.; Davies, J.; Auld, R.; Rigby, E.; Baes, M.; et al. The Herschel Reference Survey. Publ. Astron. Soc. Pac. 2010, 122, 261. [Google Scholar] [CrossRef]
- Corbelli, E.; Bianchi, S.; Cortese, L.; Giovanardi, C.; Magrini, L.; Pappalardo, C.; Boselli, A.; Bendo, G.J.; Davies, J.; Grossi, M.; et al. The Herschel Virgo Cluster Survey. X. The Relationship between Cold Dust and Molecular Gas Content in Virgo Spirals. Astron. Astrophys. 2012, 542, A32. [Google Scholar] [CrossRef] [Green Version]
- Boselli, A.; Cortese, L.; Boquien, M.; Boissier, S.; Catinella, B.; Gavazzi, G.; Lagos, C.; Saintonge, A. Cold Gas Properties of the Herschel Reference Survey. III. Molecular Gas Stripping in Cluster Galaxies. Astron. Astrophys. 2014, 564, A67. [Google Scholar] [CrossRef]
- Zabel, N.; Davis, T.A.; Smith, M.W.L.; Sarzi, M.; Loni, A.; Serra, P.; Lara-López, M.A.; Cigan, P.; Baes, M.; Bendo, G.J.; et al. AlFoCS + F3D—II. Unexpectedly Low Gas-to-Dust Ratios in the Fornax Galaxy Cluster. Mon. Not. R. Astron. Soc. 2021, 502, 4723–4742. [Google Scholar] [CrossRef]
- Morokuma-Matsui, K.; Kodama, T.; Morokuma, T.; Nakanishi, K.; Koyama, Y.; Yamashita, T.; Koyama, S.; Okamoto, T. A Phase-space View of Cold-gas Properties of Virgo Cluster Galaxies: Multiple Quenching Processes at Work? Astrophys. J. 2021, 914, 145. [Google Scholar] [CrossRef]
- Castignani, G.; Combes, F.; Jablonka, P.; Finn, R.A.; Rudnick, G.; Vulcani, B.; Desai, V.; Zaritsky, D.; Salomé, P. Virgo Filaments. I. Processing of Gas in Cosmological Filaments around the Virgo Cluster. Astron. Astrophys. 2022, 657, A9. [Google Scholar] [CrossRef]
- Wilson, C.D.; Warren, B.E.; Israel, F.P.; Serjeant, S.; Attewell, D.; Bendo, G.J.; Butner, H.M.; Chanial, P.; Clements, D.L.; Golding, J.; et al. The JCMT Nearby Galaxies Legacy Survey—VIII. CO Data and the LCO(3-2)-LFIR Correlation in the SINGS Sample. Mon. Not. R. Astron. Soc. 2012, 424, 3050–3080. [Google Scholar] [CrossRef] [Green Version]
- Mok, A.; Wilson, C.D.; Golding, J.; Warren, B.E.; Israel, F.P.; Serjeant, S.; Knapen, J.H.; Sánchez-Gallego, J.R.; Barmby, P.; Bendo, G.J.; et al. The JCMT Nearby Galaxies Legacy Survey—X. Environmental Effects on the Molecular Gas and Star Formation Properties of Spiral Galaxies. Mon. Not. R. Astron. Soc. 2016, 456, 4384–4406. [Google Scholar] [CrossRef] [Green Version]
- Cairns, J.; Stroe, A.; De Breuck, C.; Mroczkowski, T.; Clements, D. Large Molecular Gas Reservoirs in Star-forming Cluster Galaxies. Astrophys. J. 2019, 882, 132. [Google Scholar] [CrossRef]
- Cybulski, R.; Yun, M.S.; Erickson, N.; De la Luz, V.; Narayanan, G.; Montaña, A.; Sánchez, D.; Zavala, J.A.; Zeballos, M.; Chung, A.; et al. Early Science with the Large Millimeter Telescope: COOL BUDHIES I—A Pilot Study of Molecular and Atomic Gas at z ≃ 0.2. Mon. Not. R. Astron. Soc. 2016, 459, 3287–3306. [Google Scholar] [CrossRef] [Green Version]
- Jablonka, P.; Combes, F.; Rines, K.; Finn, R.; Welch, T. Cold Gas in the Inner Regions of Intermediate Redshift Clusters. Astron. Astrophys. 2013, 557, A103. [Google Scholar] [CrossRef] [Green Version]
- Castignani, G.; Jablonka, P.; Combes, F.; Haines, C.P.; Rawle, T.; Jauzac, M.; Egami, E.; Krips, M.; Spérone-Longin, D.; Arnaud, M.; et al. Molecular Gas and Star Formation Activity in Luminous Infrared Galaxies in Clusters at Intermediate Redshifts. Astron. Astrophys. 2020, 640, A64. [Google Scholar] [CrossRef]
- Betti, S.K.; Pope, A.; Scoville, N.; Yun, M.S.; Aussel, H.; Kartaltepe, J.; Sheth, K. Environmental Effect on the Interstellar Medium in Galaxies across the Cosmic Web at z = 0.73. Astrophys. J. 2019, 874, 53. [Google Scholar] [CrossRef]
- Spérone-Longin, D.; Jablonka, P.; Combes, F.; Castignani, G.; Krips, M.; Rudnick, G.; Zaritsky, D.; Finn, R.A.; De Lucia, G.; Desai, V. SEEDisCS. I. Molecular Gas in Galaxy Clusters and Their Large-Scale Structure: The Case of CL1411.1-1148 at z ∼ 0.5. Astron. Astrophys. 2021, 647, A156. [Google Scholar] [CrossRef]
- Spérone-Longin, D.; Jablonka, P.; Combes, F.; Castignani, G.; Krips, M.; Rudnick, G.; Desjardins, T.; Zaritsky, D.; Finn, R.A.; De Lucia, G.; et al. SEEDisCS. II. Molecular Gas in Galaxy Clusters and Their Large-Scale Structure: Low Gas Fraction Galaxies, the Case of CL1301.7-1139. Astron. Astrophys. 2021, 654, A69. [Google Scholar] [CrossRef]
- Noble, A.G.; McDonald, M.; Muzzin, A.; Nantais, J.; Rudnick, G.; van Kampen, E.; Webb, T.M.A.; Wilson, G.; Yee, H.K.C.; Boone, K.; et al. ALMA Observations of Gas-rich Galaxies in z ∼ 1.6 Galaxy Clusters: Evidence for Higher Gas Fractions in High-density Environments. Astrophys. J. 2017, 842, L21. [Google Scholar] [CrossRef] [Green Version]
- Noble, A.G.; Muzzin, A.; McDonald, M.; Rudnick, G.; Matharu, J.; Cooper, M.C.; Demarco, R.; Lidman, C.; Nantais, J.; van Kampen, E.; et al. Resolving CO (2-1) in z ∼ 1.6 Gas-rich Cluster Galaxies with ALMA: Rotating Molecular Gas Disks with Possible Signatures of Gas Stripping. Astrophys. J. 2019, 870, 56. [Google Scholar] [CrossRef] [Green Version]
- Rudnick, G.; Hodge, J.; Walter, F.; Momcheva, I.; Tran, K.V.; Papovich, C.; da Cunha, E.; Decarli, R.; Saintonge, A.; Willmer, C.; et al. Deep CO(1-0) Observations of z = 1.62 Cluster Galaxies with Substantial Molecular Gas Reservoirs and Normal Star Formation Efficiencies. Astrophys. J. 2017, 849, 27. [Google Scholar] [CrossRef] [Green Version]
- Hayashi, M.; Tadaki, K.I.; Kodama, T.; Kohno, K.; Yamaguchi, Y.; Hatsukade, B.; Koyama, Y.; Shimakawa, R.; Tamura, Y.; Suzuki, T.L. Molecular Gas Reservoirs in Cluster Galaxies at z = 1.46. Astrophys. J. 2018, 856, 118. [Google Scholar] [CrossRef] [Green Version]
- Alberts, S.; Adams, J.; Gregg, B.; Pope, A.; Williams, C.C.; Eisenhardt, P.R.M. Significant Molecular Gas Deficiencies in Star-forming Cluster Galaxies at z 1.4. Astrophys. J. 2022, 927, 235. [Google Scholar] [CrossRef]
- Williams, C.C.; Alberts, S.; Spilker, J.S.; Noble, A.G.; Stefanon, M.; Willmer, C.N.A.; Bezanson, R.; Narayanan, D.; Whitaker, K.E. ALMA Measures Molecular Gas Reservoirs Comparable to Field Galaxies in a Low-mass Galaxy Cluster at z = 1.3. Astrophys. J. 2022, 929, 35. [Google Scholar] [CrossRef]
- Coogan, R.T.; Daddi, E.; Sargent, M.T.; Strazzullo, V.; Valentino, F.; Gobat, R.; Magdis, G.; Bethermin, M.; Pannella, M.; Onodera, M.; et al. Merger Driven Star-Formation Activity in Cl J1449+0856 at Z = 1.99 as Seen by ALMA and JVLA. Mon. Not. R. Astron. Soc. 2018. [Google Scholar] [CrossRef]
- Wagg, J.; Pope, A.; Alberts, S.; Armus, L.; Brodwin, M.; Bussmann, R.S.; Desai, V.; Dey, A.; Jannuzi, B.; Le Floc’h, E.; et al. CO J = 2-1 Line Emission in Cluster Galaxies at z ~ 1: Fueling Star Formation in Dense Environments. Astrophys. J. 2012, 752, 91. [Google Scholar] [CrossRef]
- Aravena, M.; Carilli, C.L.; Salvato, M.; Tanaka, M.; Lentati, L.; Schinnerer, E.; Walter, F.; Riechers, D.; Smolcić, V.; Capak, P.; et al. Deep Observations of CO Line Emission from Star-Forming Galaxies in a Cluster Candidate at Z = 1.5. Mon. Not. R. Astron. Soc. 2012, 426, 258–275. [Google Scholar] [CrossRef] [Green Version]
- Casasola, V.; Magrini, L.; Combes, F.; Mignano, A.; Sani, E.; Paladino, R.; Fontani, F. A Gas-Rich AGN near the Centre of a Galaxy Cluster at z ~ 1.4. Astron. Astrophys. 2013, 558, A60. [Google Scholar] [CrossRef] [Green Version]
- Castignani, G.; Combes, F.; Salomé, P.; Andreon, S.; Pannella, M.; Heywood, I.; Trinchieri, G.; Cicone, C.; Davies, L.J.M.; Owen, F.N.; et al. Molecular Gas in Two Companion Cluster Galaxies at z = 1.2. Astron. Astrophys. 2018, 617, A103. [Google Scholar] [CrossRef] [Green Version]
- Hayashi, M.; Kodama, T.; Kohno, K.; Yamaguchi, Y.; Tadaki, K.i.; Hatsukade, B.; Koyama, Y.; Shimakawa, R.; Tamura, Y.; Suzuki, T.L. Evolutionary Phases of Gas-rich Galaxies in a Galaxy Cluster at z = 1.46. Astrophys. J. 2017, 841, L21. [Google Scholar] [CrossRef] [Green Version]
- D’Amato, Q.; Gilli, R.; Prandoni, I.; Vignali, C.; Massardi, M.; Mignoli, M.; Cucciati, O.; Morishita, T.; Decarli, R.; Brusa, M.; et al. Discovery of Molecular Gas Fueling Galaxy Growth in a Protocluster at z = 1.7. Astron. Astrophys. 2020, 641, L6. [Google Scholar] [CrossRef]
- Bahé, Y.M.; McCarthy, I.G.; Crain, R.A.; Theuns, T. The Competition between Confinement and Ram Pressure and Its Implications for Galaxies in Groups and Clusters. Mon. Not. R. Astron. Soc. 2012, 424, 1179–1186. [Google Scholar] [CrossRef] [Green Version]
- Zinger, E.; Dekel, A.; Birnboim, Y.; Kravtsov, A.; Nagai, D. The Role of Penetrating Gas Streams in Setting the Dynamical State of Galaxy Clusters. Mon. Not. R. Astron. Soc. 2016, 461, 412–432. [Google Scholar] [CrossRef] [Green Version]
- Zinger, E.; Dekel, A.; Birnboim, Y.; Nagai, D.; Lau, E.; Kravtsov, A.V. Cold Fronts and Shocks Formed by Gas Streams in Galaxy Clusters. Mon. Not. R. Astron. Soc. 2018, 476, 56–70. [Google Scholar] [CrossRef] [Green Version]
- Strazzullo, V.; Coogan, R.T.; Daddi, E.; Sargent, M.T.; Gobat, R.; Valentino, F.; Bethermin, M.; Pannella, M.; Dickinson, M.; Renzini, A.; et al. Deciphering the Activity and Quiescence of High-redshift Cluster Environments: ALMA Observations of Cl J1449+0856 at z = 2. Astrophys. J. 2018, 862, 64. [Google Scholar] [CrossRef] [Green Version]
- Daddi, E.; Dannerbauer, H.; Liu, D.; Aravena, M.; Bournaud, F.; Walter, F.; Riechers, D.; Magdis, G.; Sargent, M.; Béthermin, M.; et al. CO Excitation of Normal Star-Forming Galaxies out to z = 1.5 as Regulated by the Properties of Their Interstellar Medium. Astron. Astrophys. 2015, 577, A46. [Google Scholar] [CrossRef]
- Huang, Y.D.T.; Morata, O.; Koch, P.M.; Kemper, C.; Hwang, Y.J.; Chiong, C.C.; Ho, P.; Chu, Y.H.; Huang, C.D.; Liu, C.T.; et al. The Atacama Large Millimeter/sub-millimeter Array band-1 receiver. In Proceedings of the Modeling, Systems Engineering, and Project Management for Astronomy VI, Edinburgh, UK, 10 August 2016; Angeli, G.Z., Dierickx, P., Eds.; SPIE: Bellingham, WA, USA, 2016; Volume 9911, p. 99111V. [Google Scholar] [CrossRef] [Green Version]
- Dannerbauer, H.; Lehnert, M.D.; Emonts, B.; Ziegler, B.; Altieri, B.; De Breuck, C.; Hatch, N.; Kodama, T.; Koyama, Y.; Kurk, J.D.; et al. The Implications of the Surprising Existence of a Large, Massive CO Disk in a Distant Protocluster. Astron. Astrophys. 2017, 608, A48. [Google Scholar] [CrossRef] [Green Version]
- Aoyama, K.; Kodama, T.; Suzuki, T.L.; Tadaki, K.i.; Shimakawa, R.; Hayashi, M.; Koyama, Y.; Pérez-Martínez, J.M. The Environmental Dependence of Gas Properties in Dense Cores of a Protocluster at z 2.5 Revealed with ALMA. Astrophys. J. 2022, 924, 74. [Google Scholar] [CrossRef]
- Lee, M.M.; Tanaka, I.; Iono, D.; Kawabe, R.; Kodama, T.; Kohno, K.; Saito, T.; Tamura, Y. Revisited Cold Gas Content with Atomic Carbon [C i] in z = 2.5 Protocluster Galaxies. Astrophys. J. 2021, 909, 181. [Google Scholar] [CrossRef]
- Tanaka, I.; De Breuck, C.; Kurk, J.D.; Taniguchi, Y.; Kodama, T.; Matsuda, Y.; Packham, C.; Zirm, A.; Kajisawa, M.; Ichikawa, T.; et al. Discovery of an Excess of Hα Emitters around 4C 23.56 at z = 2.48. Publ. Astron. Soc. Jpn. 2011, 63, 415. [Google Scholar] [CrossRef] [Green Version]
- Lee, M.M.; Tanaka, I.; Kawabe, R.; Kohno, K.; Kodama, T.; Kajisawa, M.; Yun, M.S.; Nakanishi, K.; Iono, D.; Tamura, Y.; et al. A Radio-to-mm Census of Star-forming Galaxies in Protocluster 4C23.56 at Z = 2.5: Gas Mass and Its Fraction Revealed with ALMA. Astrophys. J. 2017, 842, 55. [Google Scholar] [CrossRef] [Green Version]
- Decarli, R.; Walter, F.; Aravena, M.; Carilli, C.; Bouwens, R.; da Cunha, E.; Daddi, E.; Ivison, R.J.; Popping, G.; Riechers, D.; et al. ALMA Spectroscopic Survey in the Hubble Ultra Deep Field: CO Luminosity Functions and the Evolution of the Cosmic Density of Molecular Gas. Astrophys. J. 2016, 833, 69. [Google Scholar] [CrossRef] [Green Version]
- Pappalardo, C.; Bianchi, S.; Corbelli, E.; Giovanardi, C.; Hunt, L.; Bendo, G.J.; Boselli, A.; Cortese, L.; Magrini, L.; Zibetti, S.; et al. The Herschel Virgo Cluster Survey. XI. Environmental Effects on Molecular Gas and Dust in Spiral Disks. Astron. Astrophys. 2012, 545, A75. [Google Scholar] [CrossRef] [Green Version]
- Davis, T.A.; Alatalo, K.; Bureau, M.; Cappellari, M.; Scott, N.; Young, L.M.; Blitz, L.; Crocker, A.; Bayet, E.; Bois, M.; et al. The ATLAS3D Project—XIV. The Extent and Kinematics of the Molecular Gas in Early-Type Galaxies. Mon. Not. R. Astron. Soc. 2013, 429, 534–555. [Google Scholar] [CrossRef]
- Cortese, L.; Davies, J.I.; Pohlen, M.; Baes, M.; Bendo, G.J.; Bianchi, S.; Boselli, A.; De Looze, I.; Fritz, J.; Verstappen, J.; et al. The Herschel Virgo Cluster Survey. II. Truncated Dust Disks in H I-deficient Spirals. Astron. Astrophys. 2010, 518, L49. [Google Scholar] [CrossRef]
- Chung, E.J.; Yun, M.S.; Verheijen, M.A.W.; Chung, A. 12 CO(J = 1 $\to $ 0) On-the-fly Mapping Survey of the Virgo Cluster Spirals. II. Molecular Gas Properties in Different Density Environments. Astrophys. J. 2017, 843, 50. [Google Scholar] [CrossRef] [Green Version]
- Mok, A.; Wilson, C.D.; Knapen, J.H.; Sánchez-Gallego, J.R.; Brinks, E.; Rosolowsky, E. The JCMT Nearby Galaxies Legacy Survey—XI. Environmental Variations in the Atomic and Molecular Gas Radial Profiles of Nearby Spiral Galaxies. Mon. Not. R. Astron. Soc. 2017, 467, 4282–4292. [Google Scholar] [CrossRef] [Green Version]
- Tonnesen, S.; Bryan, G.L. Gas Stripping in Simulated Galaxies with a Multiphase Interstellar Medium. Astrophys. J. 2009, 694, 789–804. [Google Scholar] [CrossRef] [Green Version]
- Combes, F.; Dupraz, C.; Casoli, F.; Pagani, L. CO Emission in NGC 4438: A Case for Tidal Stripping? Astron. Astrophys. 1988, 203, L9–L12. [Google Scholar]
- Vollmer, B.; Braine, J.; Balkowski, C.; Cayatte, V.; Duschl, W.J. 12CO(1-0) Observations of NGC 4848: A Coma Galaxy after Stripping. Astron. Astrophys. 2001, 374, 824–838. [Google Scholar] [CrossRef]
- Scott, T.C.; Usero, A.; Brinks, E.; Bravo-Alfaro, H.; Cortese, L.; Boselli, A.; Argudo-Fernández, M. Highly Perturbed Molecular Gas in Infalling Cluster Galaxies: The Case of CGCG97-079. Mon. Not. R. Astron. Soc. 2015, 453, 328–337. [Google Scholar] [CrossRef] [Green Version]
- Lee, B.; Wang, J.; Chung, A.; Ho, L.C.; Wang, R.; Michiyama, T.; Molina, J.; Kim, Y.; Shao, L.; Kilborn, V.; et al. ALMA/ACA CO Survey of the IC 1459 and NGC 4636 Groups: Environmental Effects on the Molecular Gas of Group Galaxies. Astrophys. J. Suppl. Ser. 2022, 262, 31. [Google Scholar] [CrossRef]
- Chung, A.; van Gorkom, J.H.; Kenney, J.D.P.; Crowl, H.; Vollmer, B. VLA Imaging of Virgo Spirals in Atomic Gas (VIVA). I. The Atlas and the H I Properties. Astron. J. 2009, 138, 1741–1816. [Google Scholar] [CrossRef] [Green Version]
- Leroy, A.K.; Walter, F.; Bigiel, F.; Usero, A.; Weiss, A.; Brinks, E.; de Blok, W.J.G.; Kennicutt, R.C.; Schuster, K.F.; Kramer, C.; et al. Heracles: The HERA CO Line Extragalactic Survey. Astron. J. 2009, 137, 4670–4696. [Google Scholar] [CrossRef]
- Lee, B.; Chung, A. The ALMA Detection of Extraplanar 13CO in a Ram-pressure-stripped Galaxy and Its Implication. Astrophys. J. 2018, 866, L10. [Google Scholar] [CrossRef] [Green Version]
- Vollmer, B.; Braine, J.; Pappalardo, C.; Hily-Blant, P. Ram-Pressure Stripped Molecular Gas in the Virgo Spiral Galaxy NGC 4522. Astron. Astrophys. 2008, 491, 455–464. [Google Scholar] [CrossRef]
- Verdugo, C.; Combes, F.; Dasyra, K.; Salomé, P.; Braine, J. Ram Pressure Stripping in the Virgo Cluster. Astron. Astrophys. 2015, 582, A6. [Google Scholar] [CrossRef] [Green Version]
- Moretti, A.; Paladino, R.; Poggianti, B.M.; D’Onofrio, M.; Bettoni, D.; Gullieuszik, M.; Jaffé, Y.L.; Vulcani, B.; Fasano, G.; Fritz, J.; et al. GASP—X. APEX Observations of Molecular Gas in the Discs and in the Tails of Ram-Pressure Stripped Galaxies. Mon. Not. R. Astron. Soc. 2018, 480, 2508–2520. [Google Scholar] [CrossRef] [Green Version]
- Jáchym, P.; Combes, F.; Cortese, L.; Sun, M.; Kenney, J.D.P. Abundant Molecular Gas and Inefficient Star Formation in Intracluster Regions: Ram Pressure Stripped Tail of the Norma Galaxy ESO137-001. Astrophys. J. 2014, 792, 11. [Google Scholar] [CrossRef]
- Jáchym, P.; Sun, M.; Kenney, J.D.P.; Cortese, L.; Combes, F.; Yagi, M.; Yoshida, M.; Palouš, J.; Roediger, E. Molecular Gas Dominated 50 Kpc Ram Pressure Stripped Tail of the Coma Galaxy D100. Astrophys. J. 2017, 839, 114. [Google Scholar] [CrossRef] [Green Version]
- Cramer, W.J.; Kenney, J.D.P.; Cortes, J.R.; Cortes P., C.; Vlahakis, C.; Jáchym, P.; Pompei, E.; Rubio, M. ALMA Evidence for Ram Pressure Compression and Stripping of Molecular Gas in the Virgo Cluster Galaxy NGC 4402. Astrophys. J. 2020, 901, 95. [Google Scholar] [CrossRef]
- Cramer, W.J.; Kenney, J.D.P.; Tonnesen, S.; Smith, R.; Wong, T.; Jáchym, P.; Cortés, J.R.; Cortés, P.C.; Wu, Y.T. Molecular Gas Filaments and Fallback in the Ram Pressure Stripped Coma Spiral NGC 4921. Astrophys. J. 2021, 921, 22. [Google Scholar] [CrossRef]
- Owers, M.S.; Couch, W.J.; Nulsen, P.E.J.; Randall, S.W. Shocking Tails in the Major Merger Abell 2744. Astrophys. J. 2012, 750, L23. [Google Scholar] [CrossRef]
- Poggianti, B.M.; Fasano, G.; Omizzolo, A.; Gullieuszik, M.; Bettoni, D.; Moretti, A.; Paccagnella, A.; Jaffé, Y.L.; Vulcani, B.; Fritz, J.; et al. Jellyfish Galaxy Candidates at Low Redshift. Astron. J. 2016, 151, 78. [Google Scholar] [CrossRef] [Green Version]
- Ebeling, H.; Stephenson, L.N.; Edge, A.C. Jellyfish: Evidence of extreme ram-pressure stripping in massive galaxy clusters. Astrophys. J. 2014, 781, L40. [Google Scholar] [CrossRef] [Green Version]
- Fumagalli, M.; Fossati, M.; Hau, G.K.T.; Gavazzi, G.; Bower, R.; Sun, M.; Boselli, A. MUSE Sneaks a Peek at Extreme Ram-Pressure Stripping Events—I. A Kinematic Study of the Archetypal Galaxy ESO137-001. Mon. Not. R. Astron. Soc. 2014, 445, 4335–4344. [Google Scholar] [CrossRef]
- Rawle, T.D.; Altieri, B.; Egami, E.; Pérez-González, P.G.; Richard, J.; Santos, J.S.; Valtchanov, I.; Walth, G.; Bouy, H.; Haines, C.P.; et al. Star Formation in the Massive Cluster Merger Abell 2744. Mon. Not. R. Astron. Soc. 2014, 442, 196–206. [Google Scholar] [CrossRef] [Green Version]
- Houck, J.R.; Roellig, T.L.; Van Cleve, J.; Forrest, W.J.; Herter, T.L.; Lawrence, C.R.; Matthews, K.; Reitsema, H.J.; Soifer, B.T.; Watson, D.M.; et al. The infrared spectrograph on the Spitzer Space Telescope. In Proceedings of the Optical, Infrared, and Millimeter Space Telescopes, Glasgow, UK, 12 October 2004; Mather, J.C., Ed.; SPIE: Bellingham, WA, USA, 2004; Volume 5487, pp. 62–76. [Google Scholar] [CrossRef] [Green Version]
- Sivanandam, S.; Rieke, M.J.; Rieke, G.H. A Warm Molecular Hydrogen Tail Due to Ram-pressure Stripping of a Cluster Galaxy. Astrophys. J. 2010, 717, 147–162. [Google Scholar] [CrossRef] [Green Version]
- Sivanandam, S.; Rieke, M.J.; Rieke, G.H. Tracing Ram-pressure Stripping with Warm Molecular Hydrogen Emission. Astrophys. J. 2014, 796, 89. [Google Scholar] [CrossRef] [Green Version]
- Sun, M.; Jones, C.; Forman, W.; Nulsen, P.E.J.; Donahue, M.; Voit, G.M. A 70 Kiloparsec X-ray Tail in the Cluster A3627. Astrophys. J. 2006, 637, L81–L84. [Google Scholar] [CrossRef] [Green Version]
- Sun, M.; Donahue, M.; Voit, G.M. Hα Tail, Intracluster H II Regions, and Star Formation: ESO 137-001 in Abell 3627. Astrophys. J. 2007, 671, 190–202. [Google Scholar] [CrossRef] [Green Version]
- Jáchym, P.; Kenney, J.D.P.; Sun, M.; Combes, F.; Cortese, L.; Scott, T.C.; Sivanandam, S.; Brinks, E.; Roediger, E.; Palouš, J.; et al. ALMA Unveils Widespread Molecular Gas Clumps in the Ram Pressure Stripped Tail of the Norma Jellyfish Galaxy. Astrophys. J. 2019, 883, 145. [Google Scholar] [CrossRef] [Green Version]
- Kenney, J.D.P.; Geha, M.; Jáchym, P.; Crowl, H.H.; Dague, W.; Chung, A.; van Gorkom, J.; Vollmer, B. Transformation of a Virgo Cluster Dwarf Irregular Galaxy by Ram Pressure Stripping: IC3418 and Its Fireballs. Astrophys. J. 2014, 780, 119. [Google Scholar] [CrossRef] [Green Version]
- Lee, B.; Chung, A.; Tonnesen, S.; Kenney, J.D.P.; Wong, O.I.; Vollmer, B.; Petitpas, G.R.; Crowl, H.H.; van Gorkom, J. The Effect of Ram Pressure on the Molecular Gas of Galaxies: Three Case Studies in the Virgo Cluster. Mon. Not. R. Astron. Soc. 2017, 466, 1382–1398. [Google Scholar] [CrossRef] [Green Version]
- Young, L.M.; Meier, D.S.; Crocker, A.; Davis, T.A.; Topal, S. Down but Not Out: Properties of the Molecular Gas in the Stripped Virgo Cluster Early-type Galaxy NGC 4526. Astrophys. J. 2022, 933, 90. [Google Scholar] [CrossRef]
- Lizée, T.; Vollmer, B.; Braine, J.; Nehlig, F. Gas Compression and Stellar Feedback in the Tidally Interacting and Ram-Pressure Stripped Virgo Spiral Galaxy NGC 4654. Astron. Astrophys. 2021, 645, A111. [Google Scholar] [CrossRef]
- Nehlig, F.; Vollmer, B.; Braine, J. Effects of Environmental Gas Compression on the Multiphase ISM and Star Formation. The Virgo Spiral Galaxies NGC 4501 and NGC 4567/68. Astron. Astrophys. 2016, 587, A108. [Google Scholar] [CrossRef] [Green Version]
- Moretti, A.; Paladino, R.; Poggianti, B.M.; Serra, P.; Ramatsoku, M.; Franchetto, A.; Deb, T.; Gullieuszik, M.; Tomičić, N.; Mingozzi, M.; et al. The High Molecular Gas Content, and the Efficient Conversion of Neutral into Molecular Gas, in Jellyfish Galaxies. Astrophys. J. 2020, 897, L30. [Google Scholar] [CrossRef]
- Roberts, I.D.; Parker, L.C. Ram Pressure Stripping Candidates in the Coma Cluster: Evidence for Enhanced Star Formation. Mon. Not. R. Astron. Soc. 2020, 495, 554–569. [Google Scholar] [CrossRef]
- Riechers, D.A.; Walter, F.; Brewer, B.J.; Carilli, C.L.; Lewis, G.F.; Bertoldi, F.; Cox, P. A Molecular Einstein Ring at z = 4.12: Imaging the Dynamics of a Quasar Host Galaxy Through a Cosmic Lens. Astrophys. J. 2008, 686, 851–858. [Google Scholar] [CrossRef] [Green Version]
- Tacconi, L.J.; Genzel, R.; Neri, R.; Cox, P.; Cooper, M.C.; Shapiro, K.; Bolatto, A.; Bouché, N.; Bournaud, F.; Burkert, A.; et al. High Molecular Gas Fractions in Normal Massive Star-Forming Galaxies in the Young Universe. Nature 2010, 463, 781–784. [Google Scholar] [CrossRef] [Green Version]
- Bothwell, M.S.; Chapman, S.C.; Tacconi, L.; Smail, I.; Ivison, R.J.; Casey, C.M.; Bertoldi, F.; Beswick, R.; Biggs, A.; Blain, A.W.; et al. High-Resolution CO and Radio Imaging of ULIRGs: Extended CO Structures and Implications for the Universal Star Formation Law. Mon. Not. R. Astron. Soc. 2010, 405, 219–233. [Google Scholar] [CrossRef] [Green Version]
- Hodge, J.A.; Carilli, C.L.; Walter, F.; de Blok, W.J.G.; Riechers, D.; Daddi, E.; Lentati, L. Evidence for a Clumpy, Rotating Gas Disk in a Submillimeter Galaxy at z = 4. Astrophys. J. 2012, 760, 11. [Google Scholar] [CrossRef] [Green Version]
- Cibinel, A.; Daddi, E.; Bournaud, F.; Sargent, M.T.; le Floc’h, E.; Magdis, G.E.; Pannella, M.; Rujopakarn, W.; Juneau, S.; Zanella, A.; et al. ALMA Constraints on Star-Forming Gas in a Prototypical z = 1.5 Clumpy Galaxy: The Dearth of CO(5-4) Emission from UV-bright Clumps. Mon. Not. R. Astron. Soc. 2017, 469, 4683–4704. [Google Scholar] [CrossRef] [Green Version]
- Molina, J.; Ibar, E.; Smail, I.; Swinbank, A.M.; Villard, E.; Escala, A.; Sobral, D.; Hughes, T.M. The Kiloparsec-Scale Gas Kinematics in Two Star-Forming Galaxies at z ∼ 1.47 Seen with ALMA and VLT-SINFONI. Mon. Not. R. Astron. Soc. 2019, 487, 4856–4869. [Google Scholar] [CrossRef]
- Genzel, R.; Price, S.H.; Übler, H.; Förster Schreiber, N.M.; Shimizu, T.T.; Tacconi, L.J.; Bender, R.; Burkert, A.; Contursi, A.; Coogan, R.; et al. Rotation Curves in z ∼ 1-2 Star-forming Disks: Evidence for Cored Dark Matter Distributions. Astrophys. J. 2020, 902, 98. [Google Scholar] [CrossRef]
- Lee, M.M.; Tanaka, I.; Kawabe, R.; Aretxaga, I.; Hatsukade, B.; Izumi, T.; Kajisawa, M.; Kodama, T.; Kohno, K.; Nakanishi, K.; et al. A Radio-to-millimeter Census of Star-forming Galaxies in Protocluster 4C 23.56 at z = 2.5: Global and Local Gas Kinematics. Astrophys. J. 2019, 883, 92. [Google Scholar] [CrossRef] [Green Version]
- Cramer, W.J.; Noble, A.G.; Massingill, K.; Cairns, J.; Clements, D.L.; Cooper, M.C.; Demarco, R.; Matharu, J.; McDonald, M.; Muzzin, A.; et al. A large-scale kinematic study of molecular gas in high-z cluster galaxies: Evidence for high levels of kinematic asymmetry. arXiv 2022, arXiv:2209.06929. [Google Scholar]
- Dole, H.; Lagache, G.; Puget, J.L.; Caputi, K.I.; Fernández-Conde, N.; Le Floc’h, E.; Papovich, C.; Pérez-González, P.G.; Rieke, G.H.; Blaylock, M. The Cosmic Infrared Background Resolved by Spitzer. Contributions of Mid-Infrared Galaxies to the Far-Infrared Background. Astron. Astrophys. 2006, 451, 417. [Google Scholar] [CrossRef] [Green Version]
- Kelly, D.M.; Rieke, G.H. 60 Micron Luminosity Evolution of Rich Clusters of Galaxies. Astrophys. J. 1990, 361, 354. [Google Scholar] [CrossRef]
- Shchekinov, Y.A.; Nath, B.B.; Vasiliev, E.O. Dust in Clusters of Galaxies. Universe 2022, 8, 212. [Google Scholar] [CrossRef]
- Sarazin, C.L.; White, R.E., III. The X-Ray Emission of Normal Elliptical Galaxies: Steady State Cooling Flow Models. Astrophys. J. 1988, 331, 102. [Google Scholar] [CrossRef]
- Dwek, E.; Rephaeli, Y.; Mather, J.C. Infrared Emission from Dust in the Coma Cluster of Galaxies. Astrophys. J. 1990, 350, 104. [Google Scholar] [CrossRef]
- Draine, B.T.; Salpeter, E.E. On the Physics of Dust Grains in Hot Gas. Astrophys. J. 1979, 231, 77–94. [Google Scholar] [CrossRef]
- Dwek, E.; Arendt, R.G. Dust-Gas Interactions and the Infrared Emission from Hot Astrophysical Plasmas. Annu. Rev. Astron. Astrophys. 1992, 30, 11. [Google Scholar] [CrossRef]
- Popescu, C.C.; Tuffs, R.J.; Fischera, J.; Völk, H. On the FIR Emission from Intracluster Dust. Astron. Astrophys. 2000, 354, 480. [Google Scholar]
- Montier, L.A.; Giard, M. The Importance of Dust in Cooling and Heating the InterGalactic Medium. Astron. Astrophys. 2004, 417, 401. [Google Scholar] [CrossRef]
- Weingartner, J.C.; Draine, B.T.; Barr, D.K. Photoelectric Emission from Dust Grains Exposed to Extreme Ultraviolet and X-Ray Radiation. Astrophys. J. 2006, 645, 1188–1197. [Google Scholar] [CrossRef]
- Vogelsberger, M.; McKinnon, R.; O’Neil, S.; Marinacci, F.; Torrey, P.; Kannan, R. Dust in and around Galaxies: Dust in Cluster Environments and Its Impact on Gas Cooling. Mon. Not. R. Astron. Soc. 2019, 487, 4870–4883. [Google Scholar] [CrossRef] [Green Version]
- da Silva, A.C.; Catalano, A.; Montier, L.; Pointecouteau, E.; Lanoux, J.; Giard, M. The Impact of Dust on the Scaling Properties of Galaxy Clusters. Mon. Not. R. Astron. Soc. 2009, 396, 849–859. [Google Scholar] [CrossRef] [Green Version]
- Nollenberg, J.G.; Williams, L.L.R.; Maddox, S.J. Determination of Reddening and Extinction Due to Dust in APM Galaxy Clusters. Astron. J. 2003, 125, 2927–2935. [Google Scholar] [CrossRef] [Green Version]
- Chelouche, D.; Koester, B.P.; Bowen, D.V. The Dust Content of Galaxy Clusters. Astrophys. J. 2007, 671, L97–L100. [Google Scholar] [CrossRef] [Green Version]
- Bovy, J.; Hogg, D.W.; Moustakas, J. The Transparency of Galaxy Clusters. Astrophys. J. 2008, 688, 198–207. [Google Scholar] [CrossRef]
- Gutiérrez, C.M.; López-Corredoira, M. On the Dust Content of Galaxy Clusters. Astron. Astrophys. 2014, 571, A66. [Google Scholar] [CrossRef] [Green Version]
- Longobardi, A.; Boselli, A.; Boissier, S.; Bianchi, S.; Andreani, P.; Sarpa, E.; Nanni, A.; Miville-Deschênes, M. The GALEX Ultraviolet Virgo Cluster Survey (GUViCS): VIII. Diffuse Dust in the Virgo Intra-Cluster Space. Astron. Astrophys. 2020, 633, L7. [Google Scholar] [CrossRef] [Green Version]
- Stickel, M.; Klaas, U.; Lemke, D.; Mattila, K. Far-Infrared Emission from Intracluster Dust in Abell Clusters. Astron. Astrophys. 2002, 383, 367. [Google Scholar] [CrossRef]
- Bai, L.; Rieke, G.H.; Rieke, M.J. A Search for Infrared Emission from Intracluster Dust in Abell 2029. Astrophys. J. 2007, 668, L5–L8. [Google Scholar] [CrossRef]
- Kitayama, T.; Ito, Y.; Okada, Y.; Kaneda, H.; Takahashi, H.; Ota, N.; Onaka, T.; Tajiri, Y.Y.; Nagata, H.; Yamada, K. Constraints on the Intracluster Dust Emission in the Coma Cluster of Galaxies. Astrophys. J. 2009, 695, 1191–1198. [Google Scholar] [CrossRef] [Green Version]
- Bianchi, S.; Giovanardi, C.; Smith, M.W.L.; Fritz, J.; Davies, J.I.; Haynes, M.P.; Giovanelli, R.; Baes, M.; Bocchio, M.; Boissier, S.; et al. The Herschel Virgo Cluster Survey: XX. Dust and Gas in the Foreground Galactic Cirrus★★★. Astron. Astrophys. 2017, 597, A130. [Google Scholar] [CrossRef] [Green Version]
- Montier, L.A.; Giard, M. Dust Emission from Clusters of Galaxies: Statistical Detection. Astron. Astrophys. 2005, 439, 35–44. [Google Scholar] [CrossRef] [Green Version]
- Giard, M.; Montier, L.; Pointecouteau, E.; Simmat, E. The Infrared Luminosity of Galaxy Clusters. Astron. Astrophys. 2008, 490, 547–554. [Google Scholar] [CrossRef] [Green Version]
- Roncarelli, M.; Pointecouteau, E.; Giard, M.; Montier, L.; Pello, R. Infrared Properties of the SDSS-maxBCG Galaxy Clusters. Astron. Astrophys. 2010, 512, A20. [Google Scholar] [CrossRef] [Green Version]
- Planck Collaboration; Adam, R.; Ade, P.A.R.; Aghanim, N.; Ashdown, M.; Aumont, J.; Baccigalupi, C.; Banday, A.J.; Barreiro, R.B.; Bartolo, N.; et al. Planck Intermediate Results: XLIII. Spectral Energy Distribution of Dust in Clusters of Galaxies. Astron. Astrophys. 2016, 596, A104. [Google Scholar] [CrossRef] [Green Version]
- Kirkpatrick, A.; Pope, A.; Alexander, D.M.; Charmandaris, V.; Daddi, E.; Dickinson, M.; Elbaz, D.; Gabor, J.; Hwang, H.S.; Ivison, R.; et al. GOODS-Herschel: Impact of Active Galactic Nuclei and Star Formation Activity on Infrared Spectral Energy Distributions at High Redshift. Astrophys. J. 2012, 759, 139. [Google Scholar] [CrossRef] [Green Version]
- Casey, C.M. Far-Infrared Spectral Energy Distribution Fitting for Galaxies near and Far. Mon. Not. R. Astron. Soc. 2012, 425, 3094–3103. [Google Scholar] [CrossRef] [Green Version]
- Clemens, M.S.; Negrello, M.; De Zotti, G.; Gonzalez-Nuevo, J.; Bonavera, L.; Cosco, G.; Guarese, G.; Boaretto, L.; Salucci, P.; Baccigalupi, C.; et al. Dust and Star Formation Properties of a Complete Sample of Local Galaxies Drawn from the Planck Early Release Compact Source Catalogue. Mon. Not. R. Astron. Soc. 2013, 433, 695–711. [Google Scholar] [CrossRef] [Green Version]
- Dunne, L.; Gomez, H.L.; da Cunha, E.; Charlot, S.; Dye, S.; Eales, S.; Maddox, S.J.; Rowlands, K.; Smith, D.J.B.; Auld, R.; et al. Herschel-ATLAS: Rapid Evolution of Dust in Galaxies over the Last 5 Billion Years. Mon. Not. R. Astron. Soc. 2011, 417, 1510–1533. [Google Scholar] [CrossRef]
- Symeonidis, M.; Vaccari, M.; Berta, S.; Page, M.J.; Lutz, D.; Arumugam, V.; Aussel, H.; Bock, J.; Boselli, A.; Buat, V.; et al. The Herschel Census of Infrared SEDs through Cosmic Time. Mon. Not. R. Astron. Soc. 2013, 431, 2317–2340. [Google Scholar] [CrossRef]
- Gutiérrez, C.M.; López-Corredoira, M. Dust in clusters: Separating the contribution of galaxies and intracluster media. Astrophys. J. 2017, 835, 111. [Google Scholar] [CrossRef] [Green Version]
- Alberts, S.; Lee, K.S.; Pope, A.; Brodwin, M.; Chiang, Y.K.; McKinney, J.; Xue, R.; Huang, Y.; Brown, M.; Dey, A.; et al. Measuring the Total Infrared Light from Galaxy Clusters at z = 0.5–1.6: Connecting Stellar Populations to Dusty Star Formation. Mon. Not. R. Astron. Soc. 2021, 501, 1970–1998. [Google Scholar] [CrossRef]
- McKinney, J.; Ramakrishnan, V.; Lee, K.S.; Pope, A.; Alberts, S.; Chiang, Y.K.; Popescu, R. Measuring the Total Ultraviolet Light from Galaxy Clusters at z = 0.5-1.6: The Balance of Obscured and Unobscured Star Formation. Astrophys. J. 2022, 928, 88. [Google Scholar] [CrossRef]
- Kirkpatrick, A.; Pope, A.; Sajina, A.; Roebuck, E.; Yan, L.; Armus, L.; Díaz-Santos, T.; Stierwalt, S. The Role of Star Formation and an AGN in Dust Heating of z = 0.3-2.8 Galaxies. I. Evolution with Redshift and Luminosity. Astrophys. J. 2015, 814, 9. [Google Scholar] [CrossRef] [Green Version]
- Drew, P.M.; Casey, C.M. No Redshift Evolution of Galaxies’ Dust Temperatures Seen from 0 < z < 2. Astrophys. J. 2022, 930, 142. [Google Scholar] [CrossRef]
- Pereira, M.J.; Haines, C.P.; Smith, G.P.; Egami, E.; Moran, S.M.; Finoguenov, A.; Hardegree-Ullman, E.; Okabe, N.; Rawle, T.; Rex, M. LoCuSS: A Herschel View of Obscured Star Formation in Abell 1835. Astron. Astrophys. 2010, 518, L40. [Google Scholar] [CrossRef] [Green Version]
- Rawle, T.D.; Rex, M.; Egami, E.; Chung, S.M.; Pérez-González, P.G.; Smail, I.; Walth, G.; Altieri, B.; Appleton, P.; Alba, A.B.; et al. Discovery of “warm dust” galaxies in clusters at z ∼ 0.3: Evidence for stripping of cool dust in the dense environment? Astrophys. J. 2012, 756, 106. [Google Scholar] [CrossRef] [Green Version]
- Viero, M.P.; Moncelsi, L.; Quadri, R.F.; Arumugam, V.; Assef, R.J.; Béthermin, M.; Bock, J.; Bridge, C.; Casey, C.M.; Conley, A.; et al. HerMES: The Contribution to the Cosmic Infrared Background from Galaxies Selected by Mass and Redshift. Astrophys. J. 2013, 779, 32. [Google Scholar] [CrossRef] [Green Version]
- Béthermin, M.; Wu, H.Y.; Lagache, G.; Davidzon, I.; Ponthieu, N.; Cousin, M.; Wang, L.; Doré, O.; Daddi, E.; Lapi, A. The Impact of Clustering and Angular Resolution on Far-Infrared and Millimeter Continuum Observations. Astron. Astrophys. 2017, 607, A89. [Google Scholar] [CrossRef]
- Old, L.J.; Balogh, M.L.; van der Burg, R.F.J.; Biviano, A.; Yee, H.K.C.; Pintos-Castro, I.; Webb, K.; Muzzin, A.; Rudnick, G.; Vulcani, B.; et al. The GOGREEN Survey: The Environmental Dependence of the Star-Forming Galaxy Main Sequence at 1.0 < z < 1.5. Mon. Not. R. Astron. Soc. 2020, 493, 5987–6000. [Google Scholar] [CrossRef] [Green Version]
- Koyama, Y.; Kodama, T.; Nakata, F.; Shimasaku, K.; Okamura, S. Red Star-forming Galaxies and Their Environment at z = 0.4 Revealed by Panoramic Hα Imaging. Astrophys. J. 2011, 734, 66. [Google Scholar] [CrossRef] [Green Version]
- Hatch, N.A.; Muldrew, S.I.; Cooke, E.A.; Hartley, W.G.; Almaini, O.; Simpson, C.J.; Conselice, C.J. The Structure and Evolution of a Forming Galaxy Cluster at z = 1.62. Mon. Not. R. Astron. Soc. 2016, 459, 387–401. [Google Scholar] [CrossRef] [Green Version]
- Sobral, D.; Stroe, A.; Koyama, Y.; Darvish, B.; Calhau, J.; Afonso, A.; Kodama, T.; Nakata, F. The Nature of Hα Star-Forming Galaxies at z ∼ 0.4 in and around Cl 0939+4713: The Environment Matters. Mon. Not. R. Astron. Soc. 2016, 458, 3443–3454. [Google Scholar] [CrossRef] [Green Version]
- Frenk, C.S.; White, S.D.M.; Bode, P.; Bond, J.R.; Bryan, G.L.; Cen, R.; Couchman, H.M.P.; Evrard, A.E.; Gnedin, N.; Jenkins, A.; et al. The Santa Barbara Cluster Comparison Project: A Comparison of Cosmological Hydrodynamics Solutions. Astrophys. J. 1999, 525, 554–582. [Google Scholar] [CrossRef] [Green Version]
- Gao, L.; Navarro, J.F.; Frenk, C.S.; Jenkins, A.; Springel, V.; White, S.D.M. The Phoenix Project: The Dark Side of Rich Galaxy Clusters. Mon. Not. R. Astron. Soc. 2012, 425, 2169–2186. [Google Scholar] [CrossRef] [Green Version]
- Navarro, J.F.; Frenk, C.S.; White, S.D.M. The Structure of Cold Dark Matter Halos. Astrophys. J. 1996, 462, 563. [Google Scholar] [CrossRef] [Green Version]
- Navarro, J.F.; Frenk, C.S.; White, S.D.M. A Universal Density Profile from Hierarchical Clustering. Astrophys. J. 1997, 490, 493–508. [Google Scholar] [CrossRef]
- Dutton, A.A.; Macciò, A.V. Cold Dark Matter Haloes in the Planck Era: Evolution of Structural Parameters for Einasto and NFW Profiles. Mon. Not. R. Astron. Soc. 2014, 441, 3359–3374. [Google Scholar] [CrossRef] [Green Version]
- Klypin, A.; Yepes, G.; Gottlöber, S.; Prada, F.; Heß, S. MultiDark Simulations: The Story of Dark Matter Halo Concentrations and Density Profiles. Mon. Not. R. Astron. Soc. 2016, 457, 4340–4359. [Google Scholar] [CrossRef] [Green Version]
- Diemer, B.; Kravtsov, A.V. A Universal Model for Halo Concentrations. Astrophys. J. 2015, 799, 108. [Google Scholar] [CrossRef]
- Ludlow, A.D.; Navarro, J.F.; Li, M.; Angulo, R.E.; Boylan-Kolchin, M.; Bett, P.E. The Dynamical State and Mass-Concentration Relation of Galaxy Clusters. Mon. Not. R. Astron. Soc. 2012, 427, 1322–1328. [Google Scholar] [CrossRef] [Green Version]
- Correa, C.A.; Wyithe, J.S.B.; Schaye, J.; Duffy, A.R. The Accretion History of Dark Matter Haloes—III. A Physical Model for the Concentration-Mass Relation. Mon. Not. R. Astron. Soc. 2015, 452, 1217–1232. [Google Scholar] [CrossRef] [Green Version]
- Biviano, A.; Moretti, A.; Paccagnella, A.; Poggianti, B.M.; Bettoni, D.; Gullieuszik, M.; Vulcani, B.; Fasano, G.; D’Onofrio, M.; Fritz, J.; et al. The Concentration–Mass Relation of Clusters of Galaxies from the OmegaWINGS Survey. Astron. Astrophys. 2017, 607, A81. [Google Scholar] [CrossRef] [Green Version]
- Gnedin, O.Y.; Kravtsov, A.V.; Klypin, A.A.; Nagai, D. Response of Dark Matter Halos to Condensation of Baryons: Cosmological Simulations and Improved Adiabatic Contraction Model. Astrophys. J. 2004, 616, 16–26. [Google Scholar] [CrossRef]
- Rozo, E.; Nagai, D.; Keeton, C.; Kravtsov, A. The Impact of Baryonic Cooling on Giant Arc Abundances. Astrophys. J. 2008, 687, 22–38. [Google Scholar] [CrossRef] [Green Version]
- De Boni, C.; Ettori, S.; Dolag, K.; Moscardini, L. Hydrodynamical Simulations of Galaxy Clusters in Dark Energy Cosmologies—II. c-M Relation. Mon. Not. R. Astron. Soc. 2013, 428, 2921–2938. [Google Scholar] [CrossRef] [Green Version]
- Gao, L.; Navarro, J.F.; Cole, S.; Frenk, C.S.; White, S.D.M.; Springel, V.; Jenkins, A.; Neto, A.F. The Redshift Dependence of the Structure of Massive Λ Cold Dark Matter Haloes. Mon. Not. R. Astron. Soc. 2008, 387, 536–544. [Google Scholar] [CrossRef] [Green Version]
- Muzzin, A.; Yee, H.K.C.; Hall, P.B.; Ellingson, E.; Lin, H. Near-Infrared Properties of Moderate-Redshift Galaxy Clusters: Luminosity Functions and Density Profiles. Astrophys. J. 2007, 659, 1106–1124. [Google Scholar] [CrossRef] [Green Version]
- Capozzi, D.; Collins, C.A.; Stott, J.P.; Hilton, M. The Evolution of K* and the Halo Occupation Distribution since z= 1.5: Observations versus Simulations. Mon. Not. R. Astron. Soc. 2012, 419, 2821–2835. [Google Scholar] [CrossRef]
- Budzynski, J.M.; Koposov, S.E.; McCarthy, I.G.; McGee, S.L.; Belokurov, V. The Radial Distribution of Galaxies in Groups and Clusters: Satellite Profiles in Groups and Clusters. Mon. Not. R. Astron. Soc. 2012, 423, 104–121. [Google Scholar] [CrossRef] [Green Version]
- van der Burg, R.F.J.; Muzzin, A.; Hoekstra, H.; Wilson, G.; Lidman, C.; Yee, H.K.C. A Census of Stellar Mass in Ten Massive Haloes at z ~ 1 from the GCLASS Survey. Astron. Astrophys. 2014, 561, A79. [Google Scholar] [CrossRef] [Green Version]
- van der Burg, R.F.J.; Hoekstra, H.; Muzzin, A.; Sifón, C.; Balogh, M.L.; McGee, S.L. Evidence for the Inside-out Growth of the Stellar Mass Distribution in Galaxy Clusters since Z~1. Astron. Astrophys. 2015, 577, A19. [Google Scholar] [CrossRef] [Green Version]
- Zenteno, A.; Mohr, J.J.; Desai, S.; Stalder, B.; Saro, A.; Dietrich, J.P.; Bayliss, M.; Bocquet, S.; Chiu, I.; Gonzalez, A.H.; et al. Galaxy Populations in the 26 Most Massive Galaxy Clusters in the South Pole Telescope SPT-SZ Survey. Mon. Not. R. Astron. Soc. 2016, 462, 830–843. [Google Scholar] [CrossRef] [Green Version]
- Hennig, C.; Mohr, J.J.; Zenteno, A.; Desai, S.; Dietrich, J.P.; Bocquet, S.; Strazzullo, V.; Saro, A.; Abbott, T.M.C.; Abdalla, F.B.; et al. Galaxy Populations in Massive Galaxy Clusters to z = 1.1: Colour Distribution, Concentration, Halo Occupation Number and Red Sequence Fraction. Mon. Not. R. Astron. Soc. 2017, 467, 4015–4035. [Google Scholar] [CrossRef]
- Diemer, B.; Joyce, M. An Accurate Physical Model for Halo Concentrations. Astrophys. J. 2019, 871, 168. [Google Scholar] [CrossRef] [Green Version]
- Diemer, B. COLOSSUS: A Python Toolkit for Cosmology, Large-scale Structure, and Dark Matter Halos. Astrophys. J. Suppl. Ser. 2018, 239, 35. [Google Scholar] [CrossRef] [Green Version]
- Planck Collaboration; Ade, P.A.R.; Aghanim, N.; Arnaud, M.; Ashdown, M.; Aumont, J.; Baccigalupi, C.; Banday, A.J.; Barreiro, R.B.; Bartlett, J.G.; et al. Planck 2015 Results. XIII. Cosmological Parameters. Astron. Astrophys. 2016, 594, A13. [Google Scholar] [CrossRef] [Green Version]
- Kawata, D.; Mulchaey, J.S. Strangulation in Galaxy Groups. Astrophys. J. 2008, 672, L103. [Google Scholar] [CrossRef] [Green Version]
- McCarthy, I.G.; Frenk, C.S.; Font, A.S.; Lacey, C.G.; Bower, R.G.; Mitchell, N.L.; Balogh, M.L.; Theuns, T. Ram Pressure Stripping the Hot Gaseous Haloes of Galaxies in Groups and Clusters. Mon. Not. R. Astron. Soc. 2008, 383, 593–605. [Google Scholar] [CrossRef]
- Vijayaraghavan, R.; Ricker, P.M. Ram Pressure Stripping of Hot Coronal Gas from Group and Cluster Galaxies and the Detectability of Surviving X-ray Coronae. Mon. Not. R. Astron. Soc. 2015, 449, 2312–2335. [Google Scholar] [CrossRef] [Green Version]
- Gabor, J.M.; Davé, R. Hot Gas in Massive Haloes Drives Both Mass Quenching and Environment Quenching. Mon. Not. R. Astron. Soc. 2015, 447, 374–391. [Google Scholar] [CrossRef] [Green Version]
- Sun, M.; Jones, C.; Forman, W.; Vikhlinin, A.; Donahue, M.; Voit, M. X-ray Thermal Coronae of galaxies in Hot Clusters: Ubiquity of Embedded Mini-Cooling Cores. Astrophys. J. 2007, 657, 197–231. [Google Scholar] [CrossRef] [Green Version]
- Goulding, A.D.; Greene, J.E.; Ma, C.P.; Veale, M.; Bogdan, A.; Nyland, K.; Blakeslee, J.P.; McConnell, N.J.; Thomas, J. The MASSIVE Survey. IV. The X-ray Halos of the Most Massive Early-type Galaxies in the Nearby Universe. Astrophys. J. 2016, 826, 167. [Google Scholar] [CrossRef] [Green Version]
- Wagner, C.R.; McDonald, M.; Courteau, S. Stripping of the Hot Gas Halos in Member Galaxies of Abell 1795. Astrophys. J. 2018, 867, 14. [Google Scholar] [CrossRef]
- Quilis, V.; Planelles, S.; Ricciardelli, E. Is Ram-Pressure Stripping an Efficient Mechanism to Remove Gas in Galaxies? Mon. Not. R. Astron. Soc. 2017, 469, 80–94. [Google Scholar] [CrossRef] [Green Version]
- Bekki, K. Galactic Star Formation Enhanced and Quenched by Ram Pressure in Groups and Clusters. Mon. Not. R. Astron. Soc. 2014, 438, 444–462. [Google Scholar] [CrossRef] [Green Version]
- Merluzzi, P.; Busarello, G.; Dopita, M.A.; Haines, C.P.; Steinhauser, D.; Mercurio, A.; Rifatto, A.; Smith, R.J.; Schindler, S. ACCESS—V. Dissecting Ram-Pressure Stripping through Integral-Field Spectroscopy and Multiband Imaging. Mon. Not. R. Astron. Soc. 2013, 429, 1747–1773. [Google Scholar] [CrossRef] [Green Version]
- Merluzzi, P.; Busarello, G.; Dopita, M.A.; Haines, C.P.; Steinhauser, D.; Bourdin, H.; Mazzotta, P. Shapley Supercluster Survey: Ram-Pressure Stripping versus Tidal Interactions in the Shapley Supercluster. Mon. Not. R. Astron. Soc. 2016, 460, 3345–3369. [Google Scholar] [CrossRef] [Green Version]
- Tonnesen, S. The Journey Counts: The Importance of Including Orbits When Simulating Ram Pressure Stripping. Astrophys. J. 2019, 874, 161. [Google Scholar] [CrossRef]
- Yagi, M.; Yoshida, M.; Komiyama, Y.; Kashikawa, N.; Furusawa, H.; Okamura, S.; Graham, A.W.; Miller, N.A.; Carter, D.; Mobasher, B.; et al. A Dozen New Galaxies Caught in the Act: Gas Stripping and Extended Emission Line Regions in the Coma Cluster. Astron. J. 2010, 140, 1814–1829. [Google Scholar] [CrossRef]
- Gavazzi, G.; Consolandi, G.; Gutierrez, M.L.; Boselli, A.; Yoshida, M. Ubiquitous Ram Pressure Stripping in the Coma Cluster of Galaxies. Astron. Astrophys. 2018, 618, A130. [Google Scholar] [CrossRef] [Green Version]
- Liu, Q.; Yee, H.K.C.; Drissen, L.; Sivanandam, S.; Pintos-Castro, I.; Alcorn, L.Y.; Hsieh, B.C.; Lin, L.; Lin, Y.T.; Muzzin, A.; et al. SITELLE Hα Imaging Spectroscopy of z ∼ 0.25 Clusters: Emission-line Galaxy Detection and Ionized Gas Offset in Abell 2390 and Abell 2465. Astrophys. J. 2021, 908, 228. [Google Scholar] [CrossRef]
- Roberts, I.D.; Parker, L.C.; Brown, T.; Joshi, G.D.; Hlavacek-Larrondo, J.; Wadsley, J. Quenching Low-mass Satellite Galaxies: Evidence for a Threshold ICM Density. Astrophys. J. 2019, 873, 42. [Google Scholar] [CrossRef] [Green Version]
- Ryu, D.; Kang, H. Shock Waves in the Large-Scale Structure of the Universe. Astrophys. Space Sci. 2009, 322, 65. [Google Scholar] [CrossRef]
- Schmidt, W.; Engels, J.F.; Niemeyer, J.C.; Almgren, A.S. Hot and Turbulent Gas in Clusters. Mon. Not. R. Astron. Soc. 2016, 459, 701–719. [Google Scholar] [CrossRef] [Green Version]
- Vulcani, B.; Treu, T.; Schmidt, K.B.; Morishita, T.; Dressler, A.; Poggianti, B.M.; Abramson, L.; Bradač, M.; Brammer, G.B.; Hoag, A.; et al. The Grism Lens-Amplified Survey from Space (GLASS). VII. The Diversity of the Distribution of Star Formation in Cluster and Field Galaxies at 0.3 Less than or Equal to z Less than or Equal to 0.7. Astrophys. J. 2016, 833, 178. [Google Scholar] [CrossRef] [Green Version]
- Boselli, A.; Epinat, B.; Contini, T.; Abril-Melgarejo, V.; Boogaard, L.A.; Pointecouteau, E.; Ventou, E.; Brinchmann, J.; Carton, D.; Finley, H.; et al. Evidence for Ram-Pressure Stripping in a Cluster of Galaxies at z = 0.7. Astron. Astrophys. 2019, 631, A114. [Google Scholar] [CrossRef] [Green Version]
- Finn, R.A.; Desai, V.; Rudnick, G.; Balogh, M.; Haynes, M.P.; Jablonka, P.; Koopmann, R.A.; Moustakas, J.; Peng, C.Y.; Poggianti, B.; et al. The Local Cluster Survey. I. Evidence of Outside-in Quenching in Dense Environments. Astrophys. J. 2018, 862, 149. [Google Scholar] [CrossRef] [Green Version]
- Ikeda, R.; Tadaki, K.I.; Iono, D.; Kodama, T.; Chan, J.C.C.; Hatsukade, B.; Hayashi, M.; Izumi, T.; Kohno, K.; Koyama, Y.; et al. High-Resolution ALMA Study of CO (2-1) Line and Dust Continuum Emissions in Cluster Galaxies at z = 1.46. Astrophys. J. 2022, 933, 18. [Google Scholar] [CrossRef]
- Ramos-Martínez, M.; Gómez, G.C.; Pérez-Villegas, Á. MHD Simulations of Ram Pressure Stripping of a Disc Galaxy. Mon. Not. R. Astron. Soc. 2018, 476, 3781–3792. [Google Scholar] [CrossRef] [Green Version]
- Vulcani, B.; Poggianti, B.M.; Jaffé, Y.L.; Moretti, A.; Fritz, J.; Gullieuszik, M.; Bettoni, D.; Fasano, G.; Tonnesen, S.; McGee, S. GASP—XII. The Variety of Physical Processes Occurring in a Single Galaxy Group in Formation. Mon. Not. R. Astron. Soc. 2018, 480, 3152–3169. [Google Scholar] [CrossRef] [Green Version]
- Durret, F.; Chiche, S.; Lobo, C.; Jauzac, M. Jellyfish Galaxy Candidates in MACS J0717.5+3745 and 39 Other Clusters of the DAFT/FADA and CLASH Surveys. Astron. Astrophys. 2021, 648, A63. [Google Scholar] [CrossRef]
- Troncoso-Iribarren, P.; Padilla, N.; Santander, C.; Lagos, C.D.P.; García-Lambas, D.; Rodríguez, S.; Contreras, S. The Better Half—Asymmetric Star Formation Due to Ram Pressure in the EAGLE Simulations. Mon. Not. R. Astron. Soc. 2020, 497, 4145–4161. [Google Scholar] [CrossRef] [Green Version]
- Singh, A.; Gulati, M.; Bagla, J.S. Ram Pressure Stripping: An Analytical Approach. Mon. Not. R. Astron. Soc. 2019, 489, 5582–5593. [Google Scholar] [CrossRef] [Green Version]
- van der Wel, A.; Franx, M.; van Dokkum, P.G.; Skelton, R.E.; Momcheva, I.G.; Whitaker, K.E.; Brammer, G.B.; Bell, E.F.; Rix, H.W.; Wuyts, S.; et al. 3D-HST+CANDELS: The Evolution of the Galaxy Size-Mass Distribution since z = 3. Astrophys. J. 2014, 788, 28. [Google Scholar] [CrossRef] [Green Version]
- Decarli, R.; Walter, F.; Aravena, M.; Carilli, C.; Bouwens, R.; da Cunha, E.; Daddi, E.; Elbaz, D.; Riechers, D.; Smail, I.; et al. The ALMA Spectroscopic Survey in the Hubble Ultra Deep Field: Molecular Gas Reservoirs in High-redshift Galaxies. Astrophys. J. 2016, 833, 70. [Google Scholar] [CrossRef] [Green Version]
- Lagos, C.D.P.; Baugh, C.M.; Lacey, C.G.; Benson, A.J.; Kim, H.S.; Power, C. Cosmic Evolution of the Atomic and Molecular Gas Contents of Galaxies. Mon. Not. R. Astron. Soc. 2011, 418, 1649–1667. [Google Scholar] [CrossRef] [Green Version]
- Rasmussen, J.; Ponman, T.J.; Mulchaey, J.S. Gas Stripping in Galaxy Groups—The Case of the Starburst Spiral NGC 2276. Mon. Not. R. Astron. Soc. 2006, 370, 453–467. [Google Scholar] [CrossRef]
- George, K.; Poggianti, B.M.; Bellhouse, C.; Radovich, M.; Fritz, J.; Paladino, R.; Bettoni, D.; Jaffé, Y.; Moretti, A.; Gullieuszik, M.; et al. GASP XVIII: Star Formation Quenching Due to AGN Feedback in the Central Region of a Jellyfish Galaxy. Mon. Not. R. Astron. Soc. 2019, 487, 3102–3111. [Google Scholar] [CrossRef]
- Radovich, M.; Poggianti, B.; Jaffé, Y.L.; Moretti, A.; Bettoni, D.; Gullieuszik, M.; Vulcani, B.; Fritz, J. GASP—XIX. AGN and Their Outflows at the Centre of Jellyfish Galaxies. Mon. Not. R. Astron. Soc. 2019, 486, 486–503. [Google Scholar] [CrossRef] [Green Version]
- Hopkins, P.F.; Hernquist, L.; Cox, T.J.; Di Matteo, T.; Martini, P.; Robertson, B.; Springel, V. Black Holes in Galaxy Mergers: Evolution of Quasars. Astrophys. J. 2005, 630, 705–715. [Google Scholar] [CrossRef]
- Silk, J. Unleashing Positive Feedback: Linking the Rates of Star Formation, Supermassive Black Hole Accretion, and Outflows in Distant Galaxies. Astrophys. J. 2013, 772, 112. [Google Scholar] [CrossRef]
- Somerville, R.S.; Popping, G.; Trager, S.C. Star Formation in Semi-Analytic Galaxy Formation Models with Multiphase Gas. Mon. Not. R. Astron. Soc. 2015, 453, 4337–4367. [Google Scholar] [CrossRef] [Green Version]
- Beckmann, R.S.; Devriendt, J.; Slyz, A.; Peirani, S.; Richardson, M.L.A.; Dubois, Y.; Pichon, C.; Chisari, N.E.; Kaviraj, S.; Laigle, C.; et al. Cosmic Evolution of Stellar Quenching by AGN Feedback: Clues from the Horizon-AGN Simulation. Mon. Not. R. Astron. Soc. 2017, 472, 949–965. [Google Scholar] [CrossRef] [Green Version]
- Donnari, M.; Pillepich, A.; Joshi, G.D.; Nelson, D.; Genel, S.; Marinacci, F.; Rodriguez-Gomez, V.; Pakmor, R.; Torrey, P.; Vogelsberger, M.; et al. Quenched Fractions in the IllustrisTNG Simulations: The Roles of AGN Feedback, Environment, and Pre-Processing. Mon. Not. R. Astron. Soc. 2021, 500, 4004–4024. [Google Scholar] [CrossRef]
- Harshan, A.; Gupta, A.; Tran, K.V.; Rodriguez-Gomez, V.; Pillepich, A.; Alcorn, L.Y.; Nanayakkara, T.; Kacprzak, G.G.; Glazebrook, K. ZFIRE: The Beginning of the End for Massive Galaxies at z 2 and Why Environment Matters. Astrophys. J. 2021, 919, 57. [Google Scholar] [CrossRef]
- Haines, C.P.; Gargiulo, A.; La Barbera, F.; Mercurio, A.; Merluzzi, P.; Busarello, G. The Different Physical Mechanisms That Drive the Star Formation Histories of Giant and Dwarf Galaxies. Mon. Not. R. Astron. Soc. 2007, 381, 7–32. [Google Scholar] [CrossRef] [Green Version]
- Boselli, A.; Boissier, S.; Cortese, L.; Gavazzi, G. The Origin of Dwarf Ellipticals in the Virgo Cluster. Astrophys. J. 2008, 674, 742–767. [Google Scholar] [CrossRef] [Green Version]
- Benítez-Llambay, A.; Navarro, J.F.; Abadi, M.G.; Gottlöber, S.; Yepes, G.; Hoffman, Y.; Steinmetz, M. Dwarf Galaxies and the Cosmic Web. Astrophys. J. 2013, 763, L41. [Google Scholar] [CrossRef]
- Fillingham, S.P.; Cooper, M.C.; Wheeler, C.; Garrison-Kimmel, S.; Boylan-Kolchin, M.; Bullock, J.S. Taking Care of Business in a Flash: Constraining the Time-Scale for Low-Mass Satellite Quenching with ELVIS. Mon. Not. R. Astron. Soc. 2015, 454, 2039–2049. [Google Scholar] [CrossRef]
- Wetzel, A.R.; Tollerud, E.J.; Weisz, D.R. Rapid Environmental Quenching of Satellite Dwarf Galaxies in the Local Group. Astrophys. J. 2015, 808, L27. [Google Scholar] [CrossRef] [Green Version]
- Steinhauser, D.; Schindler, S.; Springel, V. Simulations of Ram-Pressure Stripping in Galaxy-Cluster Interactions. Astron. Astrophys. 2016, 591, A51. [Google Scholar] [CrossRef] [Green Version]
- Bullock, J.S.; Boylan-Kolchin, M. Small-Scale Challenges to the ΛCDM Paradigm. Annu. Rev. Astron. Astrophys. 2017, 55, 343. [Google Scholar] [CrossRef] [Green Version]
- McQuinn, K.B.W.; van Zee, L.; Skillman, E.D. Galactic Winds in Low-mass Galaxies. Astrophys. J. 2019, 886, 74. [Google Scholar] [CrossRef] [Green Version]
- Trussler, J.; Maiolino, R.; Maraston, C.; Peng, Y.; Thomas, D.; Goddard, D.; Lian, J. Both Starvation and Outflows Drive Galaxy Quenching. Mon. Not. R. Astron. Soc. 2020, 491, 5406–5434. [Google Scholar] [CrossRef] [Green Version]
- Roberts, I.D.; Parker, L.C.; Gwyn, S.; Hudson, M.J.; Carlberg, R.; McConnachie, A.; Cuillandre, J.C.; Chambers, K.C.; Duc, P.A.; Furusawa, H.; et al. Ram Pressure Candidates in UNIONS. Mon. Not. R. Astron. Soc. 2022, 509, 1342–1357. [Google Scholar] [CrossRef]
- Yoon, I.; Rosenberg, J.L. The Effect of Halo Mass on the H I Content of Galaxies in Groups and Clusters. Astrophys. J. 2015, 812, 4. [Google Scholar] [CrossRef] [Green Version]
- Odekon, M.C.; Koopmann, R.A.; Haynes, M.P.; Finn, R.A.; McGowan, C.; Micula, A.; Reed, L.; Giovanelli, R.; Hallenbeck, G. The HI Content of Galaxies in Groups and Clusters as Measured by ALFALFA. Astrophys. J. 2016, 824, 110. [Google Scholar] [CrossRef]
- De Lucia, G.; Weinmann, S.; Poggianti, B.M.; Aragón-Salamanca, A.; Zaritsky, D. The Environmental History of Group and Cluster Galaxies in a Λ Cold Dark Matter Universe. Mon. Not. R. Astron. Soc. 2012, 423, 1277–1292. [Google Scholar] [CrossRef]
- Oman, K.A.; Bahé, Y.M.; Healy, J.; Hess, K.M.; Hudson, M.J.; Verheijen, M.A.W. A Homogeneous Measurement of the Delay between the Onsets of Gas Stripping and Star Formation Quenching in Satellite Galaxies of Groups and Clusters. Mon. Not. R. Astron. Soc. 2021, 501, 5073–5095. [Google Scholar] [CrossRef]
- Diemer, B.; Mansfield, P.; Kravtsov, A.V.; More, S. The Splashback Radius of Halos from Particle Dynamics. II. Dependence on Mass, Accretion Rate, Redshift, and Cosmology. Astrophys. J. 2017, 843, 140. [Google Scholar] [CrossRef] [Green Version]
- Shin, T.; Jain, B.; Adhikari, S.; Baxter, E.J.; Chang, C.; Pandey, S.; Salcedo, A.; Weinberg, D.H.; Amsellem, A.; Battaglia, N.; et al. The Mass and Galaxy Distribution around SZ-selected Clusters. Mon. Not. R. Astron. Soc. 2021, 507, 5758–5779. [Google Scholar] [CrossRef]
- Keshet, U.; Kushnir, D.; Loeb, A.; Waxman, E. Preliminary Evidence for a Virial Shock around the Coma Galaxy Cluster. Astrophys. J. 2017, 845, 24. [Google Scholar] [CrossRef] [Green Version]
- Keshet, U.; Reiss, I. Evidence for an X-Ray to Gamma-Ray Virial Shock Signal from the Coma Cluster. Astrophys. J. 2018, 869, 53. [Google Scholar] [CrossRef] [Green Version]
- Keshet, U.; Reiss, I.; Hurier, G. Coincident Sunyaev-Zel’dovich and Gamma-Ray Signals from Cluster Virial Shocks. Astrophys. J. 2020, 895, 72. [Google Scholar] [CrossRef]
- Voit, G.M.; Balogh, M.L.; Bower, R.G.; Lacey, C.G.; Bryan, G.L. On the Origin of Intracluster Entropy. Astrophys. J. 2003, 593, 272–290. [Google Scholar] [CrossRef] [Green Version]
- Molnar, S.M.; Hearn, N.; Haiman, Z.; Bryan, G.; Evrard, A.E.; Lake, G. Accretion Shocks in Clusters of Galaxies and Their SZ Signature from Cosmological Simulations. Astrophys. J. 2009, 696, 1640–1656. [Google Scholar] [CrossRef] [Green Version]
- Book, L.G.; Benson, A.J. The Role of Ram Pressure Stripping in the Quenching of Cluster Star Formation. Astrophys. J. 2010, 716, 810–818. [Google Scholar] [CrossRef] [Green Version]
- Lau, E.T.; Nagai, D.; Avestruz, C.; Nelson, K.; Vikhlinin, A. Mass Accretion and Its Effects on the Self-similarity of Gas Profiles in the Outskirts of Galaxy Clusters. Astrophys. J. 2015, 806, 68. [Google Scholar] [CrossRef]
- Hurier, G.; Adam, R.; Keshet, U. First Detection of a Virial Shock with SZ Data: Implication for the Mass Accretion Rate of Abell 2319. Astron. Astrophys. 2019, 622, A136. [Google Scholar] [CrossRef] [Green Version]
- Anderson, C.S.; Heald, G.H.; Eilek, J.A.; Lenc, E.; Gaensler, B.M.; Rudnick, L.; Van Eck, C.L.; O’Sullivan, S.P.; Stil, J.M.; Chippendale, A.; et al. Early Science from POSSUM: Shocks, Turbulence, and a Massive New Reservoir of Ionised Gas in the Fornax Cluster. Publ. Astron. Soc. Aust. 2021, 38, e020. [Google Scholar] [CrossRef]
- Baxter, E.J.; Adhikari, S.; Vega-Ferrero, J.; Cui, W.; Chang, C.; Jain, B.; Knebe, A. Shocks in the Stacked Sunyaev-Zel’dovich Profiles of Clusters—I. Analysis with the Three Hundred Simulations. Mon. Not. R. Astron. Soc. 2021, 508, 1777–1787. [Google Scholar] [CrossRef]
- Tonnesen, S. Environmentally-Driven Evolution of Simulated Cluster Galaxies. New Astron. Rev. 2007, 51, 80–83. [Google Scholar] [CrossRef] [Green Version]
- Lotz, M.; Remus, R.S.; Dolag, K.; Biviano, A.; Burkert, A. Gone after One Orbit: How Cluster Environments Quench Galaxies. Mon. Not. R. Astron. Soc. 2019, 488, 5370–5389. [Google Scholar] [CrossRef] [Green Version]
- Cen, R.; Roxana Pop, A.; Bahcall, N.A. Gas Loss in Simulated Galaxies as They Fall into Clusters. Proc. Natl. Acad. Sci. USA 2014, 111, 7914–7919. [Google Scholar] [CrossRef] [Green Version]
- Jaffé, Y.L.; Smith, R.; Candlish, G.N.; Poggianti, B.M.; Sheen, Y.K.; Verheijen, M.A.W. BUDHIES II: A Phase-Space View of H I Gas Stripping and Star Formation Quenching in Cluster Galaxies. Mon. Not. R. Astron. Soc. 2015, 448, 1715–1728. [Google Scholar] [CrossRef] [Green Version]
- Zhang, C.; Churazov, E.; Dolag, K.; Forman, W.R.; Zhuravleva, I. Encounters of Merger and Accretion Shocks in Galaxy Clusters and Their Effects on Intracluster Medium. Mon. Not. R. Astron. Soc. 2020, 494, 4539–4547. [Google Scholar] [CrossRef]
- Lotz, J.M.; Papovich, C.; Faber, S.M.; Ferguson, H.C.; Grogin, N.; Guo, Y.; Kocevski, D.; Koekemoer, A.M.; Lee, K.S.; McIntosh, D.; et al. Caught in the Act: The Assembly of Massive Cluster Galaxies at z = 1.62. Astrophys. J. 2013, 773, 154. [Google Scholar] [CrossRef] [Green Version]
- Hine, N.K.; Geach, J.E.; Alexander, D.M.; Lehmer, B.D.; Chapman, S.C.; Matsuda, Y. An Enhanced Merger Fraction within the Galaxy Population of the SSA22 Protocluster at z = 3.1. Mon. Not. R. Astron. Soc. 2016, 455, 2363–2370. [Google Scholar] [CrossRef]
- Deger, S.; Rudnick, G.; Kelkar, K.; Aragón-Salamanca, A.; Desai, V.; Lotz, J.M.; Jablonka, P.; Moustakas, J.; Zaritsky, D. Tidal Interactions and Mergers in Intermediate-redshift EDisCS Clusters. Astrophys. J. 2018, 869, 6. [Google Scholar] [CrossRef] [Green Version]
- Watson, C.; Tran, K.V.; Tomczak, A.; Alcorn, L.; Salazar, I.V.; Gupta, A.; Momcheva, I.; Papovich, C.; van Dokkum, P.; Brammer, G.; et al. Galaxy Merger Fractions in Two Clusters at Z ∼ 2 Using the Hubble Space Telescope. Astrophys. J. 2019, 874, 63. [Google Scholar] [CrossRef] [Green Version]
- Sazonova, E.; Alatalo, K.; Lotz, J.; Rowlands, K.; Snyder, G.F.; Boone, K.; Brodwin, M.; Hayden, B.; Lanz, L.; Perlmutter, S.; et al. The Morphology–Density Relationship in 1 < z < 2 Clusters. Astrophys. J. 2020, 899, 85. [Google Scholar] [CrossRef]
- Delahaye, A.G.; Webb, T.M.A.; Nantais, J.; DeGroot, A.; Wilson, G.; Muzzin, A.; Yee, H.K.C.; Foltz, R.; Noble, A.G.; Demarco, R.; et al. Galaxy Merger Candidates in High-redshift Cluster Environments. Astrophys. J. 2017, 843, 126. [Google Scholar] [CrossRef] [Green Version]
- Alonso-Herrero, A.; Rieke, G.H.; Rieke, M.J.; Scoville, N.Z. Extreme Star Formation in the Interacting Galaxy Arp 299 (IC 694+NGC 3690). Astrophys. J. 2000, 532, 845–866. [Google Scholar] [CrossRef] [Green Version]
- Barnes, J.E. Shock-Induced Star Formation in a Model of the Mice. Mon. Not. R. Astron. Soc. 2004, 350, 798–808. [Google Scholar] [CrossRef] [Green Version]
- Evans, A.S.; Vavilkin, T.; Pizagno, J.; Modica, F.; Mazzarella, J.M.; Iwasawa, K.; Howell, J.H.; Surace, J.A.; Armus, L.; Petric, A.O.; et al. Off-Nuclear Star Formation and Obscured Activity in the Luminous Infrared Galaxy NGC 2623. Astrophys. J. 2008, 675, L69. [Google Scholar] [CrossRef] [Green Version]
- Blumenthal, K.A.; Barnes, J.E. Go with the Flow: Understanding Inflow Mechanisms in Galaxy Collisions. Mon. Not. R. Astron. Soc. 2018, 479, 3952–3965. [Google Scholar] [CrossRef]
- Scudder, J.M.; Ellison, S.L.; Momjian, E.; Rosenberg, J.L.; Torrey, P.; Patton, D.R.; Fertig, D.; Mendel, J.T. Galaxy Pairs in the Sloan Digital Sky Survey—X. Does Gas Content Alter Star Formation Rate Enhancement in Galaxy Interactions? Mon. Not. R. Astron. Soc. 2015, 449, 3719–3740. [Google Scholar] [CrossRef] [Green Version]
- Fensch, J.; Renaud, F.; Bournaud, F.; Duc, P.A.; Agertz, O.; Amram, P.; Combes, F.; Di Matteo, P.; Elmegreen, B.; Emsellem, E.; et al. High-Redshift Major Mergers Weakly Enhance Star Formation. Mon. Not. R. Astron. Soc. 2017, 465, 1934–1949. [Google Scholar] [CrossRef]
- Abruzzo, M.W.; Narayanan, D.; Davé, R.; Thompson, R. Identifying Mergers Using Quantitative Morphologies in Zoom Simulations of High-Redshift Galaxies. arXiv 2018, arXiv:1803.02374. [Google Scholar]
- Capelo, P.R.; Volonteri, M.; Dotti, M.; Bellovary, J.M.; Mayer, L.; Governato, F. Growth and Activity of Black Holes in Galaxy Mergers with Varying Mass Ratios. Mon. Not. R. Astron. Soc. 2015, 447, 2123–2143. [Google Scholar] [CrossRef] [Green Version]
- Koss, M.J.; Glidden, A.; Baloković, M.; Stern, D.; Lamperti, I.; Assef, R.; Bauer, F.; Ballantyne, D.; Boggs, S.E.; Craig, W.W.; et al. NuSTAR Resolves the First Dual AGN above 10 keV in SWIFT J2028.5+2543. Astrophys. J. 2016, 824, L4. [Google Scholar] [CrossRef]
- Koss, M.J.; Blecha, L.; Bernhard, P.; Hung, C.L.; Lu, J.R.; Trakhtenbrot, B.; Treister, E.; Weigel, A.; Sartori, L.F.; Mushotzky, R.; et al. A Population of Luminous Accreting Black Holes with Hidden Mergers. Nature 2018, 563, 214–216. [Google Scholar] [CrossRef] [Green Version]
- Kocevski, D.D.; Brightman, M.; Nandra, K.; Koekemoer, A.M.; Salvato, M.; Aird, J.; Bell, E.F.; Hsu, L.T.; Kartaltepe, J.S.; Koo, D.C.; et al. Are Compton-thick AGNs the Missing Link between Mergers and Black Hole Growth? Astrophys. J. 2015, 814, 104. [Google Scholar] [CrossRef] [Green Version]
- Ricci, C.; Bauer, F.E.; Treister, E.; Schawinski, K.; Privon, G.C.; Blecha, L.; Arevalo, P.; Armus, L.; Harrison, F.; Ho, L.C.; et al. Growing Supermassive Black Holes in the Late Stages of Galaxy Mergers Are Heavily Obscured. Mon. Not. R. Astron. Soc. 2017, 468, 1273–1299. [Google Scholar] [CrossRef] [Green Version]
- Knebe, A.; Power, C.; Gill, S.P.D.; Gibson, B.K. The Importance of Interactions for Mass Loss from Satellite Galaxies in Cold Dark Matter Haloes. Mon. Not. R. Astron. Soc. 2006, 368, 741–750. [Google Scholar] [CrossRef]
- Vijayaraghavan, R.; Ricker, P.M. Pre-Processing and Post-Processing in Group-Cluster Mergers. Mon. Not. R. Astron. Soc. 2013, 435, 2713–2735. [Google Scholar] [CrossRef] [Green Version]
- Bahé, Y.M.; Schaye, J.; Barnes, D.J.; Dalla Vecchia, C.; Kay, S.T.; Bower, R.G.; Hoekstra, H.; McGee, S.L.; Theuns, T. Disruption of Satellite Galaxies in Simulated Groups and Clusters: The Roles of Accretion Time, Baryons, and Pre-Processing. Mon. Not. R. Astron. Soc. 2019, 485, 2287–2311. [Google Scholar] [CrossRef]
- Benavides, J.A.; Sales, L.V.; Abadi, M.G. Accretion of Galaxy Groups into Galaxy Clusters. Mon. Not. R. Astron. Soc. 2020, 498, 3852–3862. [Google Scholar] [CrossRef]
- Doré, O.; Werner, M.W.; Ashby, M.; Banerjee, P.; Battaglia, N.; Bauer, J.; Benjamin, R.A.; Bleem, L.E.; Bock, J.; Boogert, A.; et al. Science Impacts of the SPHEREx All-Sky Optical to Near-Infrared Spectral Survey: Report of a Community Workshop Examining Extragalactic, Galactic, Stellar and Planetary Science. arXiv 2016, arXiv:1606.07039. [Google Scholar]
- Wang, Y.; Armus, L.; Benson, A.; Daddi, E.; Faisst, A.; Gonzalez, A.; Papovich, C.; Ninkov, Z.; Robberto, M.; Rose, R.J.; et al. Illuminating Galaxy Evolution at Cosmic Noon with ISCEA: The Infrared Satellite for Cosmic Evolution Astrophysics. arXiv 2021, arXiv:2112.02387. [Google Scholar]
- Dannerbauer, H.; van Kampen, E.; Afonso, J.; Andreani, P.; Battaia, F.A.; Bertoldi, F.; Casey, C.; Chen, C.C.; Clements, D.L.; De Breuck, C.; et al. Mapping Galaxy Clusters in the Distant Universe. Bull. Am. Astron. Soc. 2019, 51, 293. [Google Scholar]
- Adam, R.; Adane, A.; Ade, P.A.R.; André, P.; Andrianasolo, A.; Aussel, H.; Beelen, A.; Benoît, A.; Bideaud, A.; Billot, N.; et al. The NIKA2 Large-Field-of-View Millimetre Continuum Camera for the 30 m IRAM Telescope. Astron. Astrophys. 2018, 609, A115. [Google Scholar] [CrossRef]
- Dicker, S.R.; Ade, P.A.R.; Aguirre, J.; Brevik, J.A.; Cho, H.M.; Datta, R.; Devlin, M.J.; Dober, B.; Egan, D.; Ford, J.; et al. MUSTANG2: A large focal plan array for the 100 meter Green Bank Telescope. In Proceedings of the Millimeter, Submillimeter, and Far-Infrared Detectors and Instrumentation for Astronomy VII, Montréal, QC, Canada, 23 July 2014; Holland, W.S., Zmuidzinas, J., Eds.; SPIE: Bellingham, WA, USA, 2014; Volume 9153, p. 91530J. Available online: https://spie.org/Publications/Proceedings/Volume/9153?SSO=1 (accessed on 2 September 2022). [CrossRef]
- Klaassen, P.D.; Mroczkowski, T.K.; Cicone, C.; Hatziminaoglou, E.; Sartori, S.; De Breuck, C.; Bryan, S.; Dicker, S.R.; Duran, C.; Groppi, C.; et al. The Atacama Large Aperture Submillimeter Telescope (AtLAST). In Proceedings of the SPIE Conference Series, Online, 13 December 2020; Volume 11445, p. 114452F. [Google Scholar] [CrossRef]
- Harris, C.R.; Millman, K.J.; van der Walt, S.J.; Gommers, R.; Virtanen, P.; Cournapeau, D.; Wieser, E.; Taylor, J.; Berg, S.; Smith, N.J.; et al. Array Programming with NumPy. Nature 2020, 585, 357–362. [Google Scholar] [CrossRef] [PubMed]
- Hunter, J.D. Matplotlib: A 2D Graphics Environment. Comput. Sci. Eng. 2007, 9, 90–95. [Google Scholar] [CrossRef]
- Astropy Collaboration; Price-Whelan, A.M.; Sipocz, B.M.; Günther, H.M.; Lim, P.L.; Crawford, S.M.; Conseil, S.; Shupe, D.L.; Craig, M.W.; Dencheva, N.; et al. The Astropy Project: Building an Open-science Project and Status of the v2.0 Core Package. Astron. J. 2018, 156, 123. [Google Scholar] [CrossRef]
- Reback, J.; Jbrockmendel; McKinney, W.; Van den Bossche, J.; Augspurger, T.; Cloud, P.; Hawkins, S.; Gfyoung; Roeschke, M.; Sinhrks; et al. Pandas-Dev/Pandas: Pandas 1.3.4. Zenodo 2021. [Google Scholar] [CrossRef]
- Waskom, M. Seaborn: Statistical Data Visualization. Zenodo 2021. [Google Scholar] [CrossRef]
- van der Velden, E. CMasher: Scientific Colormaps for Making Accessible, Informative and ’cmashing’ Plots. J. Open Source Softw. 2020, 5, 2004. [Google Scholar] [CrossRef]
- Liu, D.; Schinnerer, E.; Groves, B.; Magnelli, B.; Lang, P.; Leslie, S.; Jiménez-Andrade, E.; Riechers, D.A.; Popping, G.; Magdis, G.E.; et al. Automated Mining of the ALMA Archive in the COSMOS Field (A3COSMOS). II. Cold Molecular Gas Evolution out to Redshift 6. Astrophys. J. 2019, 887, 235. [Google Scholar] [CrossRef]
Figure 1.
The star-forming fraction across four environments (voids, filaments, groups, and the cluster) in the Coma Supercluster region. Two stellar mass bins are shown: log (blue) and log (red). At all masses, the star-forming fraction progressively decreases with increasing local galaxy density. Note that the star-forming fraction for low-mass galaxies in underdense void regions is nearly one. Horizontal error bars indicate the standard deviation of each local density bin (omitted from the lower mass bin for clarity). Figure adapted from Figure 9 in Cybulski et al. [14].

Figure 2.
Halo mass and redshift distribution of cluster candidates identified in large (>100 deg) NIR-based (Table 1) and SZ surveys (Table 2). For the NIR, halo masses are largely derived from mass-richness scaling relations. Redshifts are largely photo-z based. Infrared-based cluster surveys have grown by orders of magnitude in the last several years and now span and log –15. Future surveys are projected to increase this by orders of magnitude.

Figure 3.
(a) Herschel SPIRE 350 m stacking of 228 Planck PHz cold sources [229]. Extended emission is seen over the 8.7 × 8.7 cutout, consistent with these sources being proto-cluster candidates. For comparison, panel (b) shows the stacking of 278 Herschel Lensing Survey clusters [358], (c) single 500 m sources from HerMES16, and (d) shows 500 random positions in the HerMES Lockman field. Figure reproduced from Figure 12 in Planck Collaboration et al. [280], with permission from ©ESO.

Figure 4.
The SMFs of QGs (left), SFGs (middle), and the total population (right) in 11 GOGREEN clusters at (circles; [388]). Renormalized field SMFs (crosses) drawn from the COSMOS/UltraVISTA survey [387] are shown in comparison. For QGs and SFGs separately, the shapes of the SMFs are independent of environment. For the total population, there is an excess of high-mass and a dearth of low-mass galaxies in the clusters. Figure reproduced from Figure 6 in van der Burg et al. [388], with permission from ©ESO.

Figure 5.
A toy model showing that combining the observed QG SMF in the lowest density quartile (D1, panel a) with the steep low-mass end of the SFG SMF (panel b) observed in both the highest (D4) and lowest (D1) density quartiles requires a mass-dependent environmental quenching model (panel c, bottom) to avoid a strong excess in the low-mass quenched galaxies in overdense environments (panel d). Both quenching models are able to reproduce the high-mass end. Figure reproduced by permission of the ©AAS from Figure 5 in Papovich et al. [400].

Figure 6.
(left) The quiescent fraction versus stellar mass of GCLASS clusters and GEEC2 low-mass clusters/groups at (yellow circles and red pentagons; Balogh et al. [35]) compared to three clusters at (green shaded region; Lee-Brown et al. [415]). Comparisons are made to coeval field samples from UltraVISTA (dash dot line at and blue shaded region for ). Local SDSS clusters are also shown, demonstrating that the SFR-density relation is in place at for log cluster galaxies. The comparison between GCLASS clusters and GEEC2 low-mass clusters/groups reveals a halo mass dependence, while the comparison of clusters at and shows a redshift and stellar mass dependence. (right) The environmental quenching efficiency in massive (proto-)clusters as a function of redshift. The stellar mass limit of each sample is denoted by the color scale. Closed symbols and regions contain multiple clusters, while open symbols are single clusters. Gray hatches and circles mark measured within ; all others are within . Strong stellar mass [388,407] and redshift [407,416] dependencies are observed in cluster surveys. A halo mass dependency is also suggested by the comparison of Planck clusters (log ; [397]) to the SpARCS and GOGREEN surveys (log ; [388,407]). Quenched high-mass populations can be found in clusters out to [417] and in proto-clusters at 2–2.5 [346]. Figures adapted from Figure 3 in Balogh et al. [35], Figure 7 in Lee-Brown et al. [415], and Figure 12 in Pintos-Castro et al. [407], reproduced by permission from the ©AAS.

Figure 7.
The halo mass-normalized total SFR from infrared observations of (proto-)clusters in the literature as a function of redshift. Colors indicate the reported limit in for each study (white indicates that the limit was not available). Studies that use background subtraction rather than spec-z or photo-z cluster membership are indicated in the legend. Catalog or imaged stacked samples are shown as squares. All SFRs were converted to a Kroupa [153] IMF and the Kennicutt [478] conversion from to SFR. The lines show different redshift evolution relations for : (black dashed line; [378]); (dark teal dash-dot line; [197,467,479]); (black dotted line; [456,480,481]), normalized at . The general evolution for field galaxies [469,470,471,472] is shown in the gray region. The light teal dash-dot line shows the relation scaled from log following [467], see text for details.

Figure 8.
(left) Phase space (caustic) diagram of SFGs in the LoCuSS sample split into four bins of SSFR. X’s indicate the mean radii and line-of-sight velocity dispersions in each bin, with the ellipses showing the uncertainties. Gray points are QGs. SFGs with suppressed SSFRs are kinematically separated from those without. (right) The star-forming fraction from obscured (red) and unobscured (pink) SF tracers. A sharp decrease is seen into the cluster cores. Delayed then rapid models of quenching are shown in the solid lines; a delay time of ∼1 Gyr best models the IR . A ∼20% suppression below the field to large radii requires pre-processing to reproduce. The dot dash line indicates the model where all star formation is instantaneously quenched when galaxies reach pericenter. Figures adapted from Figure 8 and Figure 16 in Haines et al. [421], reproduced by permission of the ©AAS.

Figure 9.
Star formation properties of ISCS/IDCS cluster galaxies at as a function of projected, cluster-centric radius. (a) The star-forming fraction for MIPS- [175] and PACS-detected [523] populations. By , is flat or even rising into the cluster cores. (b) The field-normalized SSFRs, where the field is taken from the largest radial bin. Light and dark gray hexagons show the PACS-detected sample divided into log = 10.1–10.8 and log bins, respectively, instead of redshift. The lower mass bin shows evidence of a rise in SSFR into the cores. (c) The average SFR of the PACS-detected sample, which show no radial trends. (d) Mass-limited cluster members stacked on PACS 100 m imaging. No radial trend is evident at , while a strong radial trend appears by .

Figure 10.
The Distant Red Core, a proto-cluster at . (left) The 870 m LABOCA map (smoothed to a resolution of 27) reveals 8 sources, an overdensity relative to field submm number counts (e.g., [543]). (middle) ALMA 2 mm continuum map of LABOCA sources A and B, which resolves into 11 discrete sources, 10 of which are in the proto-cluster. Orange and green contours show radio continuum from ATCA and JVLA, respectively. (right) A high-resolution (0.12) ALMA 870 m map of source DRC-1, which resolves further into three star-forming clumps. Figure adapted from Figure 1 in Oteo et al. [328], reproduced by permission of the ©AAS.

Figure 11.
The SFRD of proto-clusters and proto-cluster cores with DSFG overdensities at 2–7 (Table 3) in comparison with the field [142]. Most of these proto-clusters will have a halo mass comparable to the Coma Supercluster (log ). Caution: the volumes assumed are highly uncertain and inhomogeneously derived; a robust analysis requires more uniform volume definitions be adopted in the literature. The total SFRs are also often underestimated due to membership/spectroscopic incompleteness. For comparison, we show the projected SFRD for proto-clusters with a halo mass of log from [21] (red dotted line). Coma progenitors sit above the field but as lower limits, a comparison to theory is limited. Proto-cluster cores, however, are up to a few orders of magnitude in excess of the field when considering the central DSFG overdensity. See Table 3 for the relevant references.

Figure 12.
(A) Velocity map of Ly emission from MUSE. Contours show Ly surface brightness greater than erg s cm. Circles (squares) indicate the positions of SMGs (X-ray AGN). (B) The Ly filaments in three-dimensions. Blue and magenta denote and >5 voxels. The locations of SMGs, AGN-host SMGs, and X-ray AGN are shown in orange circles, red diamonds, and brown hexagons. The DSFGs and AGN are cospatial with the Ly filaments on megaparsec scales. Figure reproduced from Figure 3 in Umehata et al. [550] and reprinted with permission from ©AAAS.

Figure 13.
The radial trends of the molecular gas-to-stellar mass ratio () for Virgo cluster galaxies, where Mstar-dependencies of field galaxies have been subtracted to expose field offset quantities. The median values are plotted as large black circles, with individual points shown as gray circles. The dashed line at zero represents the field value with 1 uncertainties indicated by the shaded gray region. The Spearman’s rank order correlation coefficient and corresponding p-value are displayed in black text at the top of each panel. There is a trend toward larger offsets of molecular gas-to-stellar mass ratio with decreasing clustercentric radius (left panel), as well as with other environmental tracers, such as increasing projected local galaxy density (middle panel), and earlier accretion epoch (right panel). Figures adapted from Figures 6–8 in Morokuma-Matsui et al. [665], reproduced by permission of the ©AAS.

Figure 14.
(left) Molecular gas mass as a function of redshift for Virgo galaxies and other various cluster samples. The lines represent the field-scaling relations at three different stellar masses, using the formulations in Tacconi et al. [603]. There is a clear increase in gas mass with increasing redshift, stellar mass, and offset from the star-forming Main Sequence, for both field and cluster galaxies. (right) The molecular gas fraction offset of cluster galaxies from the field-scaling relations at a given stellar mass, star formation rate, and redshift, for the same cluster galaxies in the left panel, while low-redshift clusters display a mix of depleted and elevated gas fractions, cluster galaxies are preferentially elevated compared to the field with the exception of 2 galaxies at and stacked averages at using dust continuum as a proxy for molecular gas (stars). The gray shaded region represents the Tacconi et al. [603] field-scaling relations with an associated dex uncertainty. Virgo sources compiled from Morokuma-Matsui et al. [665] and references therein. Other surveys compiled from data in Chapman et al. [304], Gómez-Guijarro et al. [309], Tadaki et al. [337], Geach et al. [457], Geach et al. [601], Cybulski et al. [670], Castignani et al. [672], Betti et al. [673], Spérone-Longin et al. [674,675], Noble et al. [676,677], Rudnick et al. [678], Hayashi et al. [679], Alberts et al. [680], Williams et al. [681], Coogan et al. [682], Wagg et al. [683], Aravena et al. [684].

Figure 15.
The jellyfish galaxy, ESO 137-001, with ALMA CO () (red), H from MUSE (green), and Chandra X-ray emission (contours), overlaid on a 3-color image from HST. At 350 kpc resolution, the CO is distributed along filaments and clumps, potentially representing different phases of gas stripping. Figure adapted from Figure 3 in Jáchym et al. [731], reproduced by permission of the ©AAS.

Figure 16.
(left) Adapted from Lee et al. [733] and Cramer et al. [719] in top and bottom panels, respectively. The locations of UV peaks (gray-scale, top) correlate with sites of molecular gas compression (CO, bottom) in a ram-pressure stripped galaxy in Virgo. (right) Adapted from Noble et al. [677]. ALMA CO observations of a cluster galaxy display similar indications of ram-pressure stripped molecular gas tails ( red contours on grayscale HST F160W in upper right panel), including a strong kinematic signature—accelerated gas toward the tip of the tail (color image in bottom right panel). Figures reproduced by permission of the ©AAS.

Figure 17.
Halo concentrations () derived from galaxy density profiles [805,806,807,808,809,810,811], stellar mass density profiles [384], and total light stacking [779] as a function of redshift (left) and (right). Solid and dashed lines show the DM halo concentrations from [799,812], respectively. DM concentrations are relatively flat with redshift and halo mass, with the exception of an upturn at high-mass predicted for unrelaxed clusters. The stellar component is often observed to be less concentrated than the DM, but with exceptions at high redshift and low-mass, which may reflect complex baryonic physics in unrelaxed or merging systems.

Figure 18.
A depiction of potential quenching pathways for galaxies falling into a massive (log ) galaxy cluster (red dotted line denotes the virial radius). An infalling massive group (log ) is depicted in light teal. Galaxies (blue spirals) are roughly sized according to stellar mass, with solid (dashed) lines tracing their radial (eccentric) orbit around the cluster potential. Note: morphological transformations are not shown in this cartoon for simplicity. Yellow and orange denote hot halo and cold molecular disk gas, respectively. Red denotes quenched regions with little to no gas. A star marks AGN activity. Scenarios A and B, along with their variations, are discussed in Section 8.

Figure 19.
A tabulated list of the primary quenching mechanisms that fall within the scenarios outlined in Section 8, along with their respective signatures, some of the more robust lines of supporting evidence from infrared studies, and open questions.
Figure 19.
A tabulated list of the primary quenching mechanisms that fall within the scenarios outlined in Section 8, along with their respective signatures, some of the more robust lines of supporting evidence from infrared studies, and open questions.

Publisher’s Note: MDPI stays neutral with regard to jurisdictional claims in published maps and institutional affiliations. |
© 2022 by the authors. Licensee MDPI, Basel, Switzerland. This article is an open access article distributed under the terms and conditions of the Creative Commons Attribution (CC BY) license (https://creativecommons.org/licenses/by/4.0/).
Share and Cite
MDPI and ACS Style
Alberts, S.; Noble, A. From Clusters to Proto-Clusters: The Infrared Perspective on Environmental Galaxy Evolution. Universe 2022, 8, 554. https://doi.org/10.3390/universe8110554
AMA Style
Alberts S, Noble A. From Clusters to Proto-Clusters: The Infrared Perspective on Environmental Galaxy Evolution. Universe. 2022; 8(11):554. https://doi.org/10.3390/universe8110554
Chicago/Turabian StyleAlberts, Stacey, and Allison Noble. 2022. "From Clusters to Proto-Clusters: The Infrared Perspective on Environmental Galaxy Evolution" Universe 8, no. 11: 554. https://doi.org/10.3390/universe8110554
Note that from the first issue of 2016, this journal uses article numbers instead of page numbers. See further details here.