
Outliers in Spectral Time Lag-Selected Gamma Ray Bursts


1
School of Mathematics and Physics, Qingdao University of Science and Technology, Qingdao 266061, China
2
School of Physics, Huazhong University of Science and Technology, Wuhan 430074, China
*
Author to whom correspondence should be addressed.
Universe 2022, 8(10), 521; https://doi.org/10.3390/universe8100521
Submission received: 21 August 2022
/
Revised: 2 October 2022
/
Accepted: 4 October 2022
/
Published: 8 October 2022
(This article belongs to the Special Issue Advances in Astrophysics and Cosmology – in Memory of Prof. Tan Lu)
Abstract
:It is possible that astrophysical samples are polluted by some outliers, which might belong to a different sub-class. By removing the outliers, the underlying statistical features may be revealed. A more reliable correlation can be used as a standard candle relationship for cosmological study. We present outlier searching for gamma ray bursts with the Partitioning Around Medoids (PAM) method. In this work, we choose three parameters from the sample, with all of them having rest-frame spectral time lag (). In most cases, the outliers are GRBs 980425B and 030528A. Linear regression is carried out for the sample without the outliers. Some of them have passed hypothesis testing, while others have not. However, even for the passed sample, the correlation is not very significant. More parameter combinations should be considered in future work.
1. Introduction
Gamma ray bursts (GRBs) are astronomical phenomena detected at high energies. Classification and correlation seeking may reveal the underlying physics. GRBs can be classified as long GRBs (LGRBs) and short GRBs (SGRBs). SGRBs are likely associated with compact binary coalescence events involving at least one neutron star [1,2]. Massive stellar collapse is believed to generate the LGRBs [3,4,5]. However, there is no clear criterion for this classification. Some GRBs could not be decisively classified in either class. On the other hand, it is still possible that GRBs can be classified into more groups, such as intermediate class giant flares from soft gamma ray repeaters. Outlier detection belongs to classification analysis. The outliers may belong to an individual group.
There are various cluster analysis techniques, such as k-means, K-medoids, hierarchical clustering, neural network clustering, and kernel principal component analysis [6,7,8]. Modak [9] conducted fuzzy clustering on GRBs from the final Burst and Transient Source Experiment (BATSE) catalog and confirmed three groups. Partitioning Around Medoids (PAM) is the most prominent method of K-medoids. We use the Euclidean distance as the similarity measurement. The outliers are far away from the other data. We analyze the outliers and seek the underlying linear correlation between different properties.
The data are based on the collection of Wang et al. [10]. We collect a full sample including prompt emission, afterglow and host galaxy properties. We choose arbitrary three parameters based on the rest-frame spectral time lag to find the outliers, i.e., each combination of the physical parameters containing , trying to find any possible clues for the classification.
Spectral time lag is the time arrival difference between different energy bands for the prompt emission light curves of GRBs. Spectral lag was first introduced by Norris et al. [11]. A cross-correlation function (CCF) can be used to quantify such an effect since the pulse peaks at different energy bands are delayed. The method is widely used to calculate spectral lag [12]. A positive spectral lag is when the high-energy photons arrive before the low-energy photons, while a negative spectral lag is the opposite. Prompt intrinsic spectral evolution or the curvature effect of relativistically moving shocked shells is used to explain the observed spectral lag [13,14].
Spectral time lag has been found to be correlated to several other quantities. The bolometric peak luminosity and spectral lag have an anti-correlation found by Norris et al. [15], later confirmed by Ukwatta et al. [12], Norris [16], Gehrels et al. [17]. Therefore, the lag is an indicator of both GRB peak luminosity and time history morphology, with short-lag and variable bursts having greater luminosities than long-lag and smooth bursts [16,18,19]. The peak luminosity and spectral lag relation can be viewed as being closely related to the peak luminosity and the variability relationship. Variability should be inversely proportional to spectral lag, i.e., larger variability jets exhibit shorter spectral lags [20]. Using the internal shock model, the peak luminosity–spectral lag relation and the peak luminosity–variability relation can be caused by changes in observer’s viewing angle with respect to the jet axis [21]. Bright GRBs are expected to have a larger Lorentz factor and smaller viewing angles, meaning that the observer is viewing the GRB jet on the axis. The spectral lag should be small due to the smaller emitting region [21]. Chen et al. [22] showed the distribution of spectral time lags in GRBs. The distribution of spectral time lags in LGRBs is apparently different from SGRBs, which implies different physical mechanisms. Yi et al. [23] confirmed this result. Zhang et al. [24] also studied the spectral time lag of SGRBs and found that the lags of the majority of SGRBs are so small that they are negligible or not measurable. Shao et al. [19] carried out a systematic study of the spectral time lag properties of 50 single-pulsed GRBs detected by Fermi. Shao et al. [19] provided a new measurement, which is independent of energy channel selections, and the new results favored the relativistic geometric effects for the origin of spectral time lag. Lu et al. [25] found the spectral time lags are closely related to spectral evolution within the pulse. However, all of the statistics related to the lags do not have very high significance. In this work, we try to find if there are outliers and to see whether the statistics become more significant without the outliers. We want to find more reliable correlations than the previous works. We hope to use the reliable correlations as a standard candle and to constrain the cosmological parameters.
2. Statistical Methods
The parameters and samples are from our previous work [10]. We collected all the possible data for 6289 GRBs in a big catalog [10], of which 165 GRBs were selected, as they contained the required parameters. The parameters we used in this work include (rest-frame spectral time lag, in units of ), (duration of 25% to 75% -ray fluence in rest-frame), (duration of 5% to 95% -ray fluence in rest-frame), (defined in [26]), (light curve variability from the definition of Reichart et al. [26]), (peak luminosity of 1 time bin in rest-frame 1– energy band, in units of ), (isotropic ray energy in rest-frame 1– energy band, in units of ), (low-energy spectral index of the Band model), (high-energy spectral index of the Band model), (rest-frame spectral peak energy of the Band model, ), (rest-frame spectral peak energy of the Band model and cutoff power law model, ), (low-energy spectral index of cutoff power law model), (rest-frame central engine active duration in logarithm, in units of ) (defined in [27]), (rest-frame peak time in radio band, in units of ), (index in X-ray band at 11 h related to the trigger time), age (in units of ), (dust extinction), host galaxy offset (the distance from GRB location to the centre of its host galaxy, in units of ), Mag (absolute magnitude in AB system at rest 3.6 m wavelength), (specific star formation rate in logarithm, in units of ), and (column density of hydrogen, in units of ). We used the label “i” to mark the parameters in the rest-frame. We chose three parameters, including , for PAM analysis. For the spectral time lag, because the energy band is different for different instruments, we divided the spectral time lag by the difference of two energy band central values to get a unified quantity, which can be seen in Table 1 of Wang et al. [10]. For example, the spectral time lag for GRB 980425B is 1.46 ± 0.18 between 50–100 and 25–50 [20], and the redshift is 0.0085. The central value of is . The error of is . Similar to the suggestion in Foley et al. [28], we removed the for GRB 060218 because GRB 060218 has extremely large lag, and it is an X-ray flash rather than a typical GRB.
For the spectral parameters, the spectra are mainly fitted by three models: the Band model, the cutoff power law (CPL) model and the simple power law (SPL) model [29]. The Band model is a smoothly joint broken power law with the definition [30]:
where is the low-energy photon index, is the high-energy photon index, A is the coefficient for normalization, E is the energy of the photons, and is the break energy. Mostly, we used instead of . is the peak energy in the spectrum of , and .
In the previous work [10], we used , and as Band function spectral parameters. and were used to mark CPL model spectrum parameters. The formula of SPL model is . In this paper, we used , and to stand for the opposite of spectral indices, as they become mostly positive numbers by adding the `−’ sign.
Cluster analysis divides data into clusters that are meaningful, useful, or both. Cluster analysis is the study of techniques for finding the most representative cluster prototypes. A cluster is a set of objects in which each object is more similar to the prototype that defines the cluster than to the prototype of any other clusters. There are a number of such techniques, but two of the most prominent are K-means and K-medoids. The K-medoids method is more robust than others in terms of outliers. The outliers are the smallest groups with a few points in this paper. Partitioning Around Medoids (PAM) is the most prominent method of K-medoids. In this paper, we use the PAM method of K-medoids for outlier detection [31]. In order to avoid the influence of different units, we apply data standardization to all the parameters. We use the R language function Nbclust to calculate the best cluster number. The detailed processes are the following:
- We calculate the best cluster number K and choose K initial centroids, where K is a user-specified parameter, namely, the number of clusters desired. In this paper, the K is 2 or 3;
- We use the Euclidean distance as a similarity measurement. We calculate the Euclidean distance to the initial centroids of each point;
- Each point is then assigned to the closest centroid, and each collection of points assigned to a centroid is a cluster;
- For every cluster, we calculate the Euclidean distance sum to the centroid of each point, which are assigned to this centroid. Then, we obtain the sum of each cluster;
- For every cluster, we choose one point to update the centroid;
- Points are assigned to the updated centroids;
- For every cluster, we calculate the Euclidean distance sum to the updated centroid of each point, which are assigned to this updated centroid. Then, we get the sum of all the clusters;
- If the sum of all the clusters in the seventh step is smaller than the fourth step, we update the centroids;
- We repeat the assignments and update steps until no point changes clusters, or equivalently, until the centroids remain the same.
We tried all three parameter combinations including . For every combination, we used PAM method for outlier detection firstly. If we found outliers, we conducted linear regression among the three parameters including without outliers. Some combinations have obvious outliers and significant correlations, as shown in Section 3.1. Some combinations only have obvious outliers, but no significant correlations can be found, as shown in Section 3.2. Some combinations have no obvious outliers and no significant correlations, and we do not show these results. We also consider all the error bars using the MC method [32]. The results are shown in the next section.
3. PAM Results
We tried all the three combinations including with the PAM method. The data selection criterion was that the sample should have at least 10 GRBs. We used the R language Nbclust package to calculate the best cluster number. The Nbclust package provides 30 indices for determining the number of clusters, such as the Krzanowski–Lai (KL) index [33], the Davies–Bouldin (DB) index [34], and so on. Charrad et al. [35] showed more details regarding the Nbclust package. As shown in the upper panel of Figure 1, number 2 has the maximum criteria. Therefore, the cluster number should be 2. However, the cluster number of Figures 9 and 10 is 3, as shown in Figure 9. Except for Figures 9 and 10, the cluster number of other figures is 2 with the Nbclust package. We did not show the others in this paper. We found 191 combinations with obvious outliers. Though the PAM method can find the outliers, the rest of the sample in the PAM plot does not show any meaningful message on the correlation or the clustering. Therefore, some independent statistics should be applied to check the statistical property for the rest of the sample. Linear regression is carried out with outliers removed. Only 8 combinations have passed the hypothesis testing, which are displayed in Figure 1, Figure 2, Figure 3, Figure 4, Figure 5, Figure 6, Figure 7 and Figure 8. However, for the passed combinations, the correlation is not very significant. We use the adjusted to measure the goodness of the regression model. It indicates the percentage of variance explained considering the parameter freedom. We also showed a small part of cluster plots with obvious outliers but not passing the hypothesis testing in Figure 9, Figure 10, Figure 11, Figure 12, Figure 13 and Figure 14. These figures include all the outliers. In other words, the cluster plots with repeated outliers are not displayed in this paper.
3.1. Remarkable Linear Regression Results without Outliers
The outlier analysis can be apparently shown in the figures. We list the results with remarkable linear regression results in Figure 1, Figure 2, Figure 3, Figure 4, Figure 5, Figure 6, Figure 7 and Figure 8.
Figure 1 and Figure 2 show the outliers in the diagram of , (and ) and , respectively. Both and indicate the duration of the GRBs. Therefore, these two analyses have similar behavior. GRBs 980425B and 030528A are the two outliers, which can be clearly seen from these two figures. The spectral time lag for GRB 030528A is 12.5 ± 0.5 between 100–300 and 25–50 [36]. The spectral time lag for GRB 980425B is 1.46 ± 0.18 between 50–100 and 25–50 [20]. Because the energy band is different, we divide the spectral time lag by the difference of two energy band central values. for these two GRBs are 43,215 ± 1729 and 38,605 ± 4760 , respectively, which are much larger than other GRBs. The detailed data for all the samples can be seen in [10]. Notice GRB 980425B is the familiar burst, which is generally called GRB 980425 (see [10] for the explanation). From the right panels of these two figures, one can see the two outliers have extraordinarily large lags, which should be the reason why they are classified as outliers. From the linear regression results, one can see the spectral time lag is proportional to duration of GRBs and anti-correlated to the spectral index .
Without the two outliers, one finds . Considering , this relationship is actually showing that the lag is anti-correlated to the total energy, i.e., with higher total energy, the lag is shorter.
The indication from Figure 3 is identified in Figure 4. It directly shows the proportional correlation to and the anti-correlation to .
Figure 5 introduces a new parameter, the spectral index . The lag is positively correlated to , i.e., with bigger , the lag is larger. Remember the anti-correlation to as shown in Figure 1 and Figure 2, i.e., with smaller , the lag is larger. Notice that in general, , and , which means the sharper the slope of the spectrum, the larger the lag. This is confirmed in Figure 6, where again is anti-correlated to .
Figure 7 shows a positive correlation between the lag and the peak energy of GRBs. Another new correlation is shown in Figure 8, which is the anti-correlation between the lag and the variability. Because GRB 030528A does not have the value of , we just have one outlier as shown in Figure 8. Both of them have larger adjusted , indicating that the correlation is more reliable.
3.2. Remarkable Outliers without Significant Linear Regression
Figure 9, Figure 10, Figure 11, Figure 12, Figure 13 and Figure 14 show the remarkable outliers without significant linear regression (with p-value greater than 0.05), which are clearly obvious. In some of these figures (e.g., right panel of Figure 10 and Figure 11), one can see that the sample without outliers shows apparent linear correlations. However, one cannot deduce an intrinsic correlation of the physical parameters, as the PAM method only identifies the outliers into apparent large distances.
From these figures, we found more outliers for different combinations of three parameters. The outliers are GRBs 980425B, 010921A, 030528A, 031203A, 050416A, 060502A, 060604A, 060605A, 060607A, 080319B, 080721A, 081221A, 090926A, 091127A, 100621A, and 130408A in different cases.
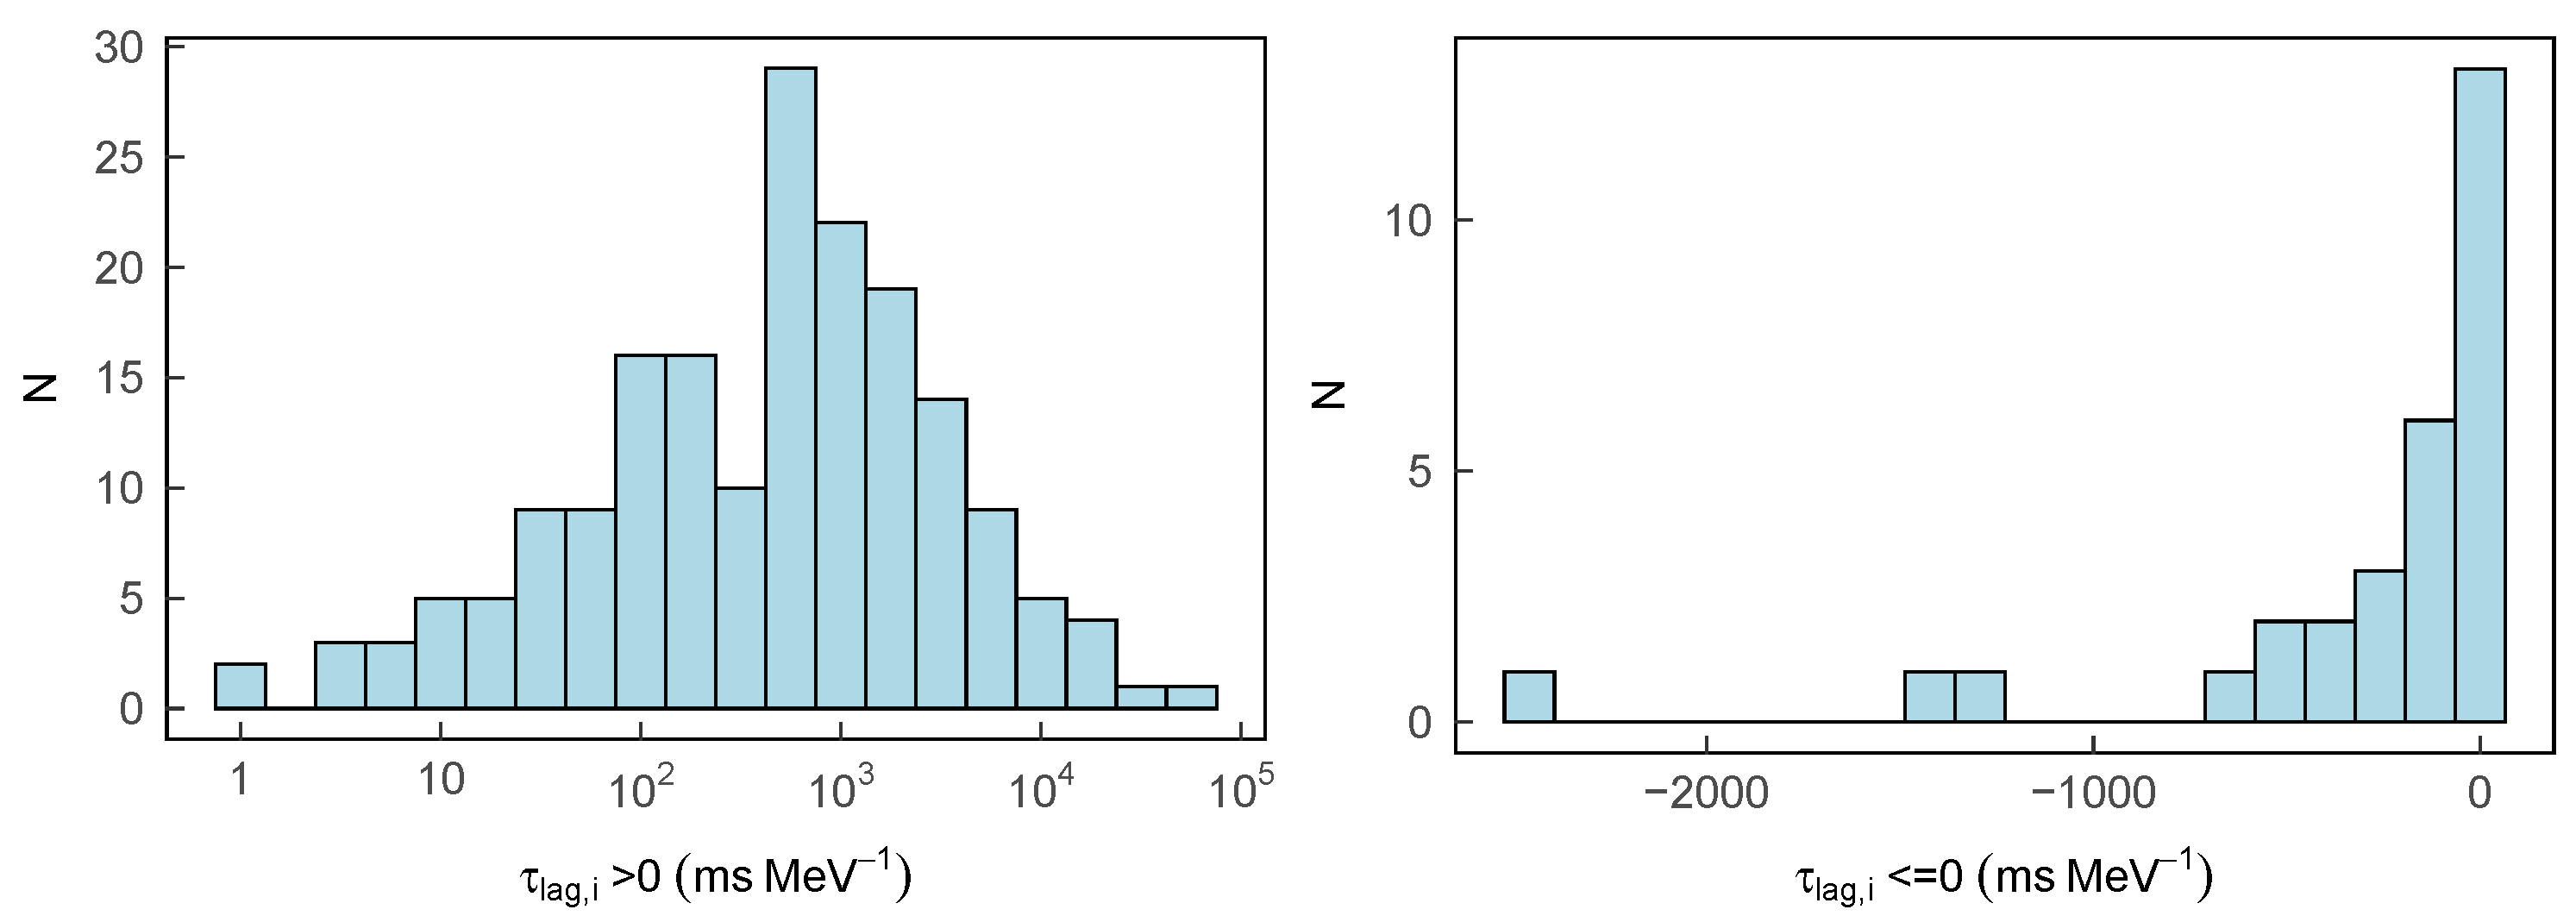
We also show the distribution of in Figure 15; the outliers are not obvious. Though the quantities are clearly larger for these GRBs, from the distribution itself, they could be inside a single distribution function. Only when they are combined with other parameters do the outliers become obvious. To show the distribution more obviously, we choose the logarithmic scale. However, to avoid the negative numbers, we put them in an independent panel, as shown in Figure 15. We also did not consider the error bars in the distribution, as that may arise the positive-negative value problem.
4. Discussion and Conclusions
By performing the PAM method on the GRB data, we expect to find some outliers. By removing the outliers, we then expect to find inner correlations with the remaining sample. In this work, we chose the spectral time lag selected sample together with other parameters, and we found that, in most cases, the outliers are GRBs 980425B and 030528A. This is mainly because they are the two GRBs with the largest spectral lags. However, there are also other outliers in other combinations. That means the value of the lag is not the only criterion. In some combinations of other two parameters, there are weak correlations obtained by removing the outliers, while there are also others having no correlations. As there are no strong correlations, we can not get very conclusive results from those correlations yet. We expect more combinations can reveal some underline correlations. Once we find tighter correlations, some of those correlations could be used as standard candle relations and could be used for more reliable cosmological studies.
It is interesting that the outliers are always GRBs 980425B and 030528A for those combinations having correlations (see Figure 1, Figure 2, Figure 3, Figure 4, Figure 5, Figure 6, Figure 7 and Figure 8), while the others have more outliers. The reason for this is not clear yet. GRBs 980425B and 030528A both have very large . In Figure 9, Figure 10, Figure 11, Figure 12, Figure 13 and Figure 14, most outliers are not GRBs 980425B and 030528A. This is because not all the combinations include GRBs 980425B and 030528A. On the other hand, GRB 980425B is a low-luminosity burst [37], and GRB 030528A is an X-ray-rich burst [38]. They are both special GRBs.
With the accumulated data, one can perform both classification and correlation analysis on the data. One can also first classify the GRBs into several subgroups and look for the correlation for each subgroup. These processes may reveal the underlying nature. Outlier analysis is similar to the classification, while to find the outliers, which is the minority in the whole sample. Those outliers may indicate some special feature of the selected GRBs, which may reveal an independent origin (but much smaller samples), or a very different radiation mechanism. More outlier criteria (more parameter combinations) may reveal that in different aspects. For example, the soft ray repeaters may lie in the sample of conventional GRBs from compact binary mergers or the collapse of massive stars and may be classified as outliers with a certain set of correctly selected parameters. If the outliers are real strangers, one may want to remove them from the whole sample. By omitting the outliers, the remaining sample may obey some laws, which can also be used to study the physics of GRBs. With the remaining sample, one may want to do a similar classification and correlation analysis. In the future, more comprehensive study, new patterns might be revealed.
Author Contributions
Data curation, F.-F.W.; formal analysis, F.-F.W.; investigation, Y.-C.Z.; supervision, Y.-C.Z.; writing—original draft, F.-F.W.; writing—review and editing, Y.-C.Z. All authors have read and agreed to the published version of the manuscript.
Funding
This work is in part supported by the National Natural Science Foundation of China (Grant Nos. U1931203 and 12041306) and by the National Key R&D Program of China (2021YFC2203100). We also acknowledge the science research grants from the China Manned Space Project with No. CMS-CSST-2021-B11.
Data Availability Statement
The data used in this work are publicly available in the machine readable table in [10].
Conflicts of Interest
The authors declare no conflict of interest.
References
- Abbott, B.P.; Abbott, R.; Abbott, T.D.; Acernese, F.; Ackley, K.; Adams, C.; Adams, T.; Addesso, P.; Adhikari, R.X.; Adya, V.B.; et al. GW170817: Observation of Gravitational Waves from a Binary Neutron Star Inspiral. Phys. Rev. Lett. 2017, 119, 161101. [Google Scholar] [CrossRef] [PubMed] [Green Version]
- Goldstein, A.; Veres, P.; Burns, E.; Briggs, M.S.; Hamburg, R.; Kocevski, D.; Wilson-Hodge, C.A.; Preece, R.D.; Poolakkil, S.; Roberts, O.J.; et al. An Ordinary Short Gamma-Ray Burst with Extraordinary Implications: Fermi-GBM Detection of GRB 170817A. Astrophys. J. Lett. 2017, 848, L14. [Google Scholar] [CrossRef] [Green Version]
- Woosley, S.E. Gamma-ray bursts from stellar mass accretion disks around black holes. Astrophys. J. 1993, 405, 273–277. [Google Scholar] [CrossRef]
- Woosley, S.E.; Bloom, J.S. The Supernova–Gamma-Ray Burst Connection. Ann. Rev. Astron. Astrophys. 2006, 44, 507–556. [Google Scholar] [CrossRef] [Green Version]
- Blanchard, P.K.; Berger, E.; Fong, W.-F. The Offset and Host Light Distributions of Long Gamma-Ray Bursts: A New View from HST Observations of Swift Bursts. Astrophys. J. 2016, 817, 144. [Google Scholar] [CrossRef] [Green Version]
- Balastegui, A.; Ruiz-Lapuente, P.; Canal, R. Reclassification of gamma-ray bursts. Mon. Not. R. Astron. Soc. 2001, 328, 283–290. [Google Scholar] [CrossRef] [Green Version]
- Chattopadhyay, S.; Maitra, R. Gaussian-mixture-model-based cluster analysis finds five kinds of gamma-ray bursts in the BATSE catalogue. Mon. Not. R. Astron. Soc. 2017, 469, 3374–3389. [Google Scholar] [CrossRef] [Green Version]
- Modak, S.; Chattopadhyay, A.K.; Chattopadhyay, T. Clustering of gamma-ray bursts through kernel principal component analysis. Commun. Stat. Simul. Comput. 2017, 47, 1088–1102. [Google Scholar] [CrossRef] [Green Version]
- Modak, S. Distinction of groups of gamma-ray bursts in the BATSE catalog through fuzzy clustering. Astron. Comput. 2021, 34, 100441. [Google Scholar] [CrossRef]
- Wang, F.; Zou, Y.C.; Liu, F.; Liao, B.; Liu, Y.; Chai, Y.; Xia, L. A Comprehensive Statistical Study of Gamma-Ray Bursts. Astrophys. J. 2020, 893, 77. [Google Scholar] [CrossRef]
- Norris, J.P.; Nemiroff, R.J.; Bonnell, J.T.; Scargle, J.D.; Kouveliotou, C.; Paciesas, W.S.; Meegan, C.A.; Fishman, G.J. Attributes of Pulses in Long Bright Gamma-Ray Bursts. Astrophys. J. 1996, 459, 393. [Google Scholar] [CrossRef]
- Ukwatta, T.N.; Stamatikos, M.; Dhuga, K.S.; Sakamoto, T.; Barthelmy, S.D.; Eskandarian, A.; Gehrels, N.; Maximon, L.C.; Norris, J.P.; Parke, W.C. Spectral Lags and the Lag-Luminosity Relation: An Investigation with Swift BAT Gamma-Ray Bursts. Astrophys. J. 2010, 711, 1073–1086. [Google Scholar] [CrossRef] [Green Version]
- Dermer, C.D. Curvature Effects in Gamma-Ray Burst Colliding Shells. Astrophys. J. 2004, 614, 284–292. [Google Scholar] [CrossRef] [Green Version]
- Uhm, Z.L.; Zhang, B. Toward an Understanding of GRB Prompt Emission Mechanism. I. the Origin of Spectral Lags. Astrophys. J. 2016, 825, 97. [Google Scholar] [CrossRef] [Green Version]
- Norris, J.P.; Marani, G.F.; Bonnell, J.T. Connection between Energy-Dependent Lags and Peak Luminosity in Gamma-Ray Bursts. Astrophys. J. 2000, 534, 248–257. [Google Scholar] [CrossRef]
- Norris, J.P. Implications of the Lag-Luminosity Relationship for Unified Gamma-Ray Burst Paradigms. Astrophys. J. 2002, 579, 386–403. [Google Scholar] [CrossRef]
- Gehrels, N.; Norris, J.P.; Barthelmy, S.D.; Granot, J.; Kaneko, Y.; Kouveliotou, C.; Markwardt, C.B.; Mészáros, P.; Nakar, E.; Nousek, J.A.; et al. A new γ-ray burst classification scheme from GRB060614. Nature 2006, 444, 1044–1046. [Google Scholar] [CrossRef] [Green Version]
- Ukwatta, T.N.; Dhuga, K.S.; Stamatikos, M.; Dermer, C.D.; Sakamoto, T.; Sonbas, E.; Parke, W.C.; Maximon, L.C.; Linnemann, J.T.; Bhat, P.N.; et al. The lag-luminosity relation in the GRB source frame: An investigation with Swift BAT bursts. Mon. Not. R. Astron. Soc. 2012, 419, 614–623. [Google Scholar] [CrossRef] [Green Version]
- Shao, L.; Zhang, B.B.; Wang, F.R.; Wu, X.F.; Cheng, Y.H.; Zhang, X.; Yu, B.Y.; Xi, B.J.; Wang, X.; Feng, H.X.; et al. A New Measurement of the Spectral Lag of Gamma-Ray Bursts and its Implications for Spectral Evolution Behaviors. Astrophys. J. 2017, 844, 126. [Google Scholar] [CrossRef] [Green Version]
- Zhang, B.; Zhang, B.B.; Virgili, F.J.; Liang, E.W.; Kann, D.A.; Wu, X.F.; Proga, D.; Lv, H.J.; Toma, K.; Mészáros, P.; et al. Discerning the Physical Origins of Cosmological Gamma-ray Bursts Based on Multiple Observational Criteria: The Cases of z = 6.7 GRB 080913, z = 8.2 GRB 090423, and Some Short/Hard GRBs. Astrophys. J. 2009, 703, 1696–1724. [Google Scholar] [CrossRef]
- Ioka, K.; Nakamura, T. Peak Luminosity–Spectral Lag Relation Caused by the Viewing Angle of the Collimated Gamma-Ray Bursts. Astrophys. J. 2001, 554, L163–L167. [Google Scholar] [CrossRef]
- Chen, L.; Lou, Y.Q.; Wu, M.; Qu, J.L.; Jia, S.M.; Yang, X.J. Distribution of Spectral Lags in Gamma-Ray Bursts. Astrophys. J. 2005, 619, 983–993. [Google Scholar] [CrossRef] [Green Version]
- Yi, T.; Liang, E.; Qin, Y.; Lu, R. On the spectral lags of the short gamma-ray bursts. Mon. Not. R. Astron. Soc. 2006, 367, 1751–1756. [Google Scholar] [CrossRef] [Green Version]
- Zhang, Z.; Xie, G.Z.; Deng, J.G.; Jin, W. Revisiting the characteristics of the spectral lags in short gamma-ray bursts. Mon. Not. R. Astron. Soc. 2006, 373, 729–732. [Google Scholar] [CrossRef]
- Lu, R.J.; Liang, Y.F.; Lin, D.B.; Lü, J.; Wang, X.G.; Lü, H.J.; Liu, H.B.; Liang, E.W.; Zhang, B. A Comprehensive Analysis of Fermi Gamma-Ray Burst Data. IV. Spectral Lag and its Relation to Ep Evolution. Astrophys. J. 2018, 865, 153. [Google Scholar] [CrossRef] [Green Version]
- Reichart, D.E.; Lamb, D.Q.; Fenimore, E.E.; Ramirez-Ruiz, E.; Cline, T.L.; Hurley, K. A Possible Cepheid-like Luminosity Estimator for the Long Gamma-Ray Bursts. Astrophys. J. 2001, 552, 57–71. [Google Scholar] [CrossRef] [Green Version]
- Zhang, B.B.; Zhang, B.; Murase, K.; Connaughton, V.; Briggs, M.S. How Long does a Burst Burst? Astrophys. J. 2014, 787, 66. [Google Scholar] [CrossRef] [Green Version]
- Foley, S.; McGlynn, S.; Hanlon, L.; McBreen, S.; McBreen, B. Global characteristics of GRBs observed with INTEGRAL and the inferred large population of low-luminosity GRBs. Astron. Astrophys. 2008, 484, 143–157. [Google Scholar] [CrossRef] [Green Version]
- Li, Y.; Zhang, B.; Lü, H.J. A Comparative Study of Long and Short GRBs. I. Overlapping Properties. Astrophys. J. 2016, 227, 7. [Google Scholar] [CrossRef] [Green Version]
- Band, D.; Matteson, J.; Ford, L.; Schaefer, B.; Palmer, D.; Teegarden, B.; Cline, T.; Briggs, M.; Paciesas, W.; Pendleton, G.; et al. BATSE observations of gamma-ray burst spectra. I. Spectral diversity. Astrophys. J. 1993, 413, 281–292. [Google Scholar] [CrossRef]
- Tan, P.; Steinbach, M.; Kumar, V. Introduction to Data Mining; Pearson: New York, NY, USA, 2005; Chapter 8; pp. 487–568. ISBN 978-0321321367. [Google Scholar]
- Zou, Y.C.; Wang, F.F.; Moharana, R.; Liao, B.; Chen, W.; Wu, Q.; Lei, W.H.; Wang, F.Y. Determining the Lorentz Factor and Viewing Angle of GRB 170817A. Astrophys. J. 2017, 852, L1. [Google Scholar] [CrossRef] [Green Version]
- Dudoit, S.; Fridlyand, J. A prediction-based resampling method for estimating the number of clusters in a dataset. Genome Biol. 2002, 3, 1–12. [Google Scholar] [CrossRef]
- Davies, D.L.; Bouldin, D.W. A Cluster Separation Measure. IEEE Trans. Pattern Anal. Mach. Intell. 1979, 1, 224–227. [Google Scholar] [CrossRef]
- Charrad, M.; Ghazzali, N.; Boiteau, V.; Niknafs, A. NbClust: An R Package for Determining the Relevant Number of Clusters in a Data Set. J. Stat. Softw. 2014, 61, 1–36. [Google Scholar] [CrossRef] [Green Version]
- Schaefer, B.E. The Hubble Diagram to Redshift >6 from 69 Gamma-Ray Bursts. Astrophys. J. 2007, 660, 16–46. [Google Scholar] [CrossRef] [Green Version]
- Rudolph, A.; Bošnjak, Ž.; Palladino, A.; Sadeh, I.; Winter, W. Multiwavelength radiation models for low-luminosity GRBs and the implications for UHECRs. Mon. Not. R. Astron. Soc. 2022, 511, 5823–5842. [Google Scholar] [CrossRef]
- Rau, A.; Salvato, M.; Greiner, J. The host of GRB/XRF 030528—An actively star forming galaxy at z = 0.782. Astron. Astrophys. 2005, 444, 425–430. [Google Scholar] [CrossRef]
Figure 1.
The outlier plot for the three parameters, , and . The histogram is the result of function NbClust, indicating the best cluster number is 2. The left panel shows the PAM result for the clustering analysis. Notice the x and y axes (compnent 1 and 2) are the two principal components in the PAM method and do not represent any combination of the three parameters. The right plot shows the regression result of the physical parameters without outliers. The outliers are GRBs 980425B and 030528A. The linear regression result is . The adjusted is 0.07. The red line is the best fit result, i.e., .
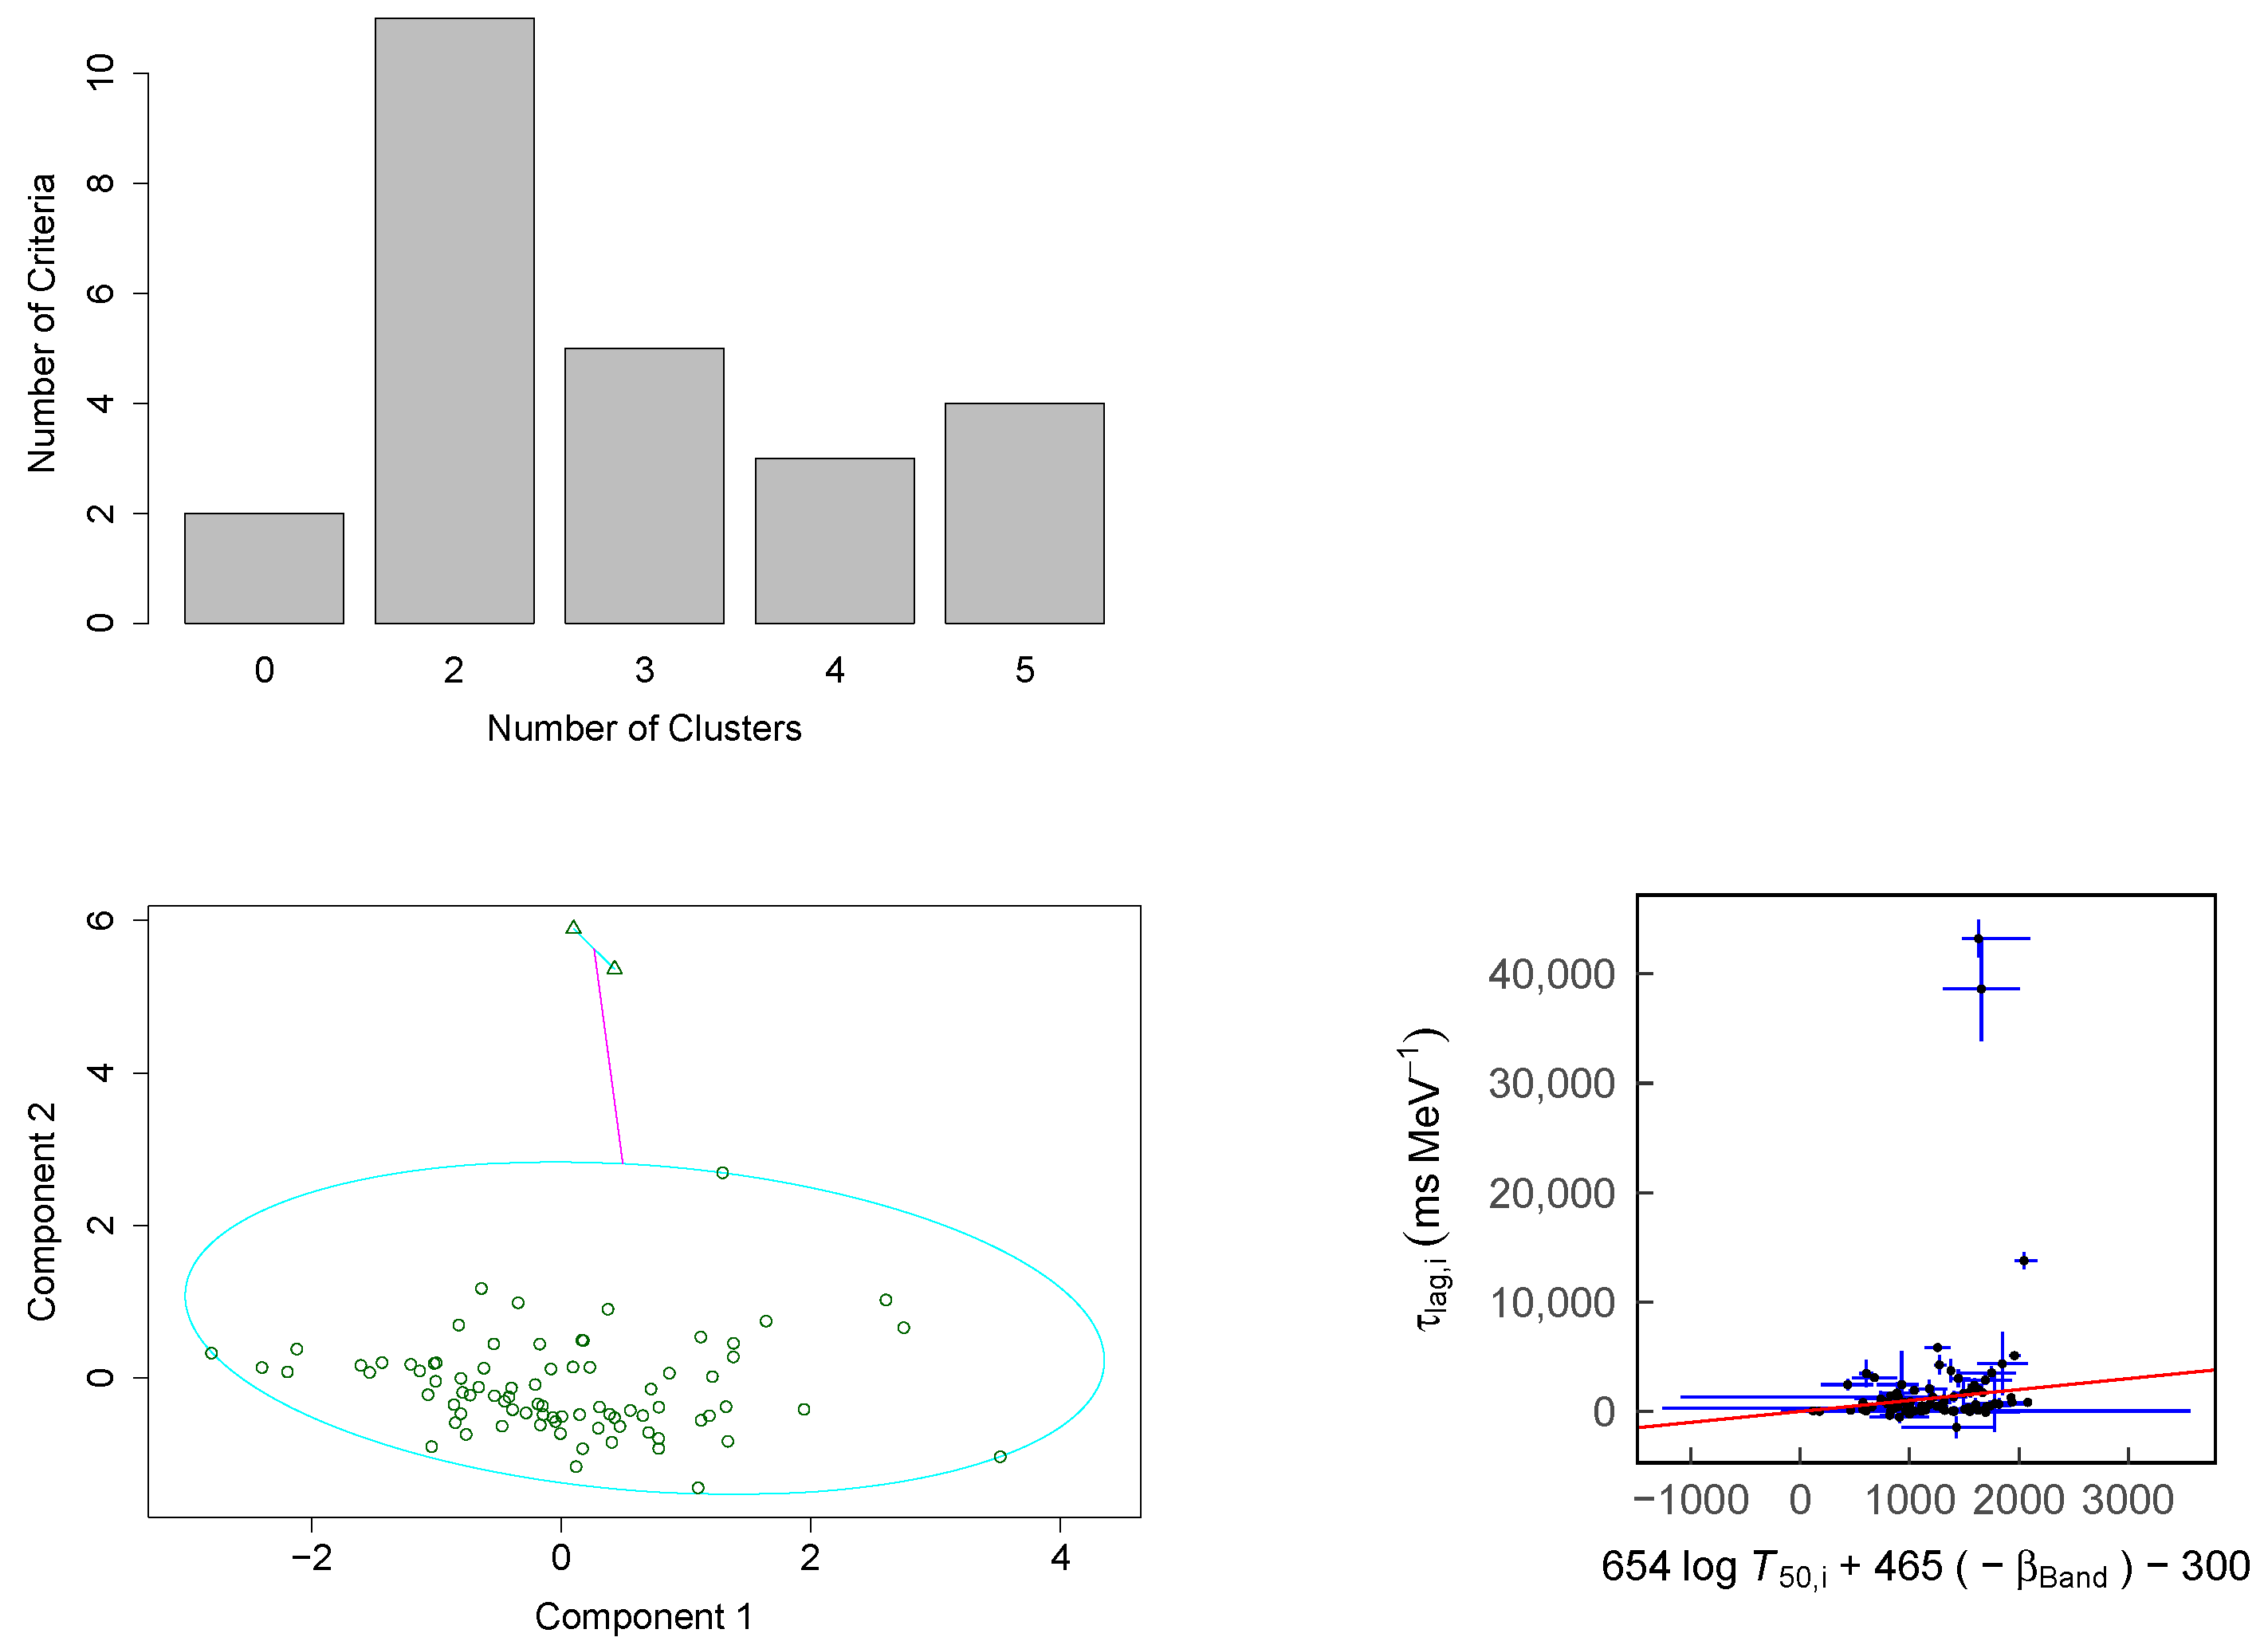
Figure 2.
Similar to Figure 1, with the three parameters being , and . The outliers are GRBs 980425B and 030528A. The linear regression result is . The adjusted is 0.05.
Figure 2.
Similar to Figure 1, with the three parameters being , and . The outliers are GRBs 980425B and 030528A. The linear regression result is . The adjusted is 0.05.
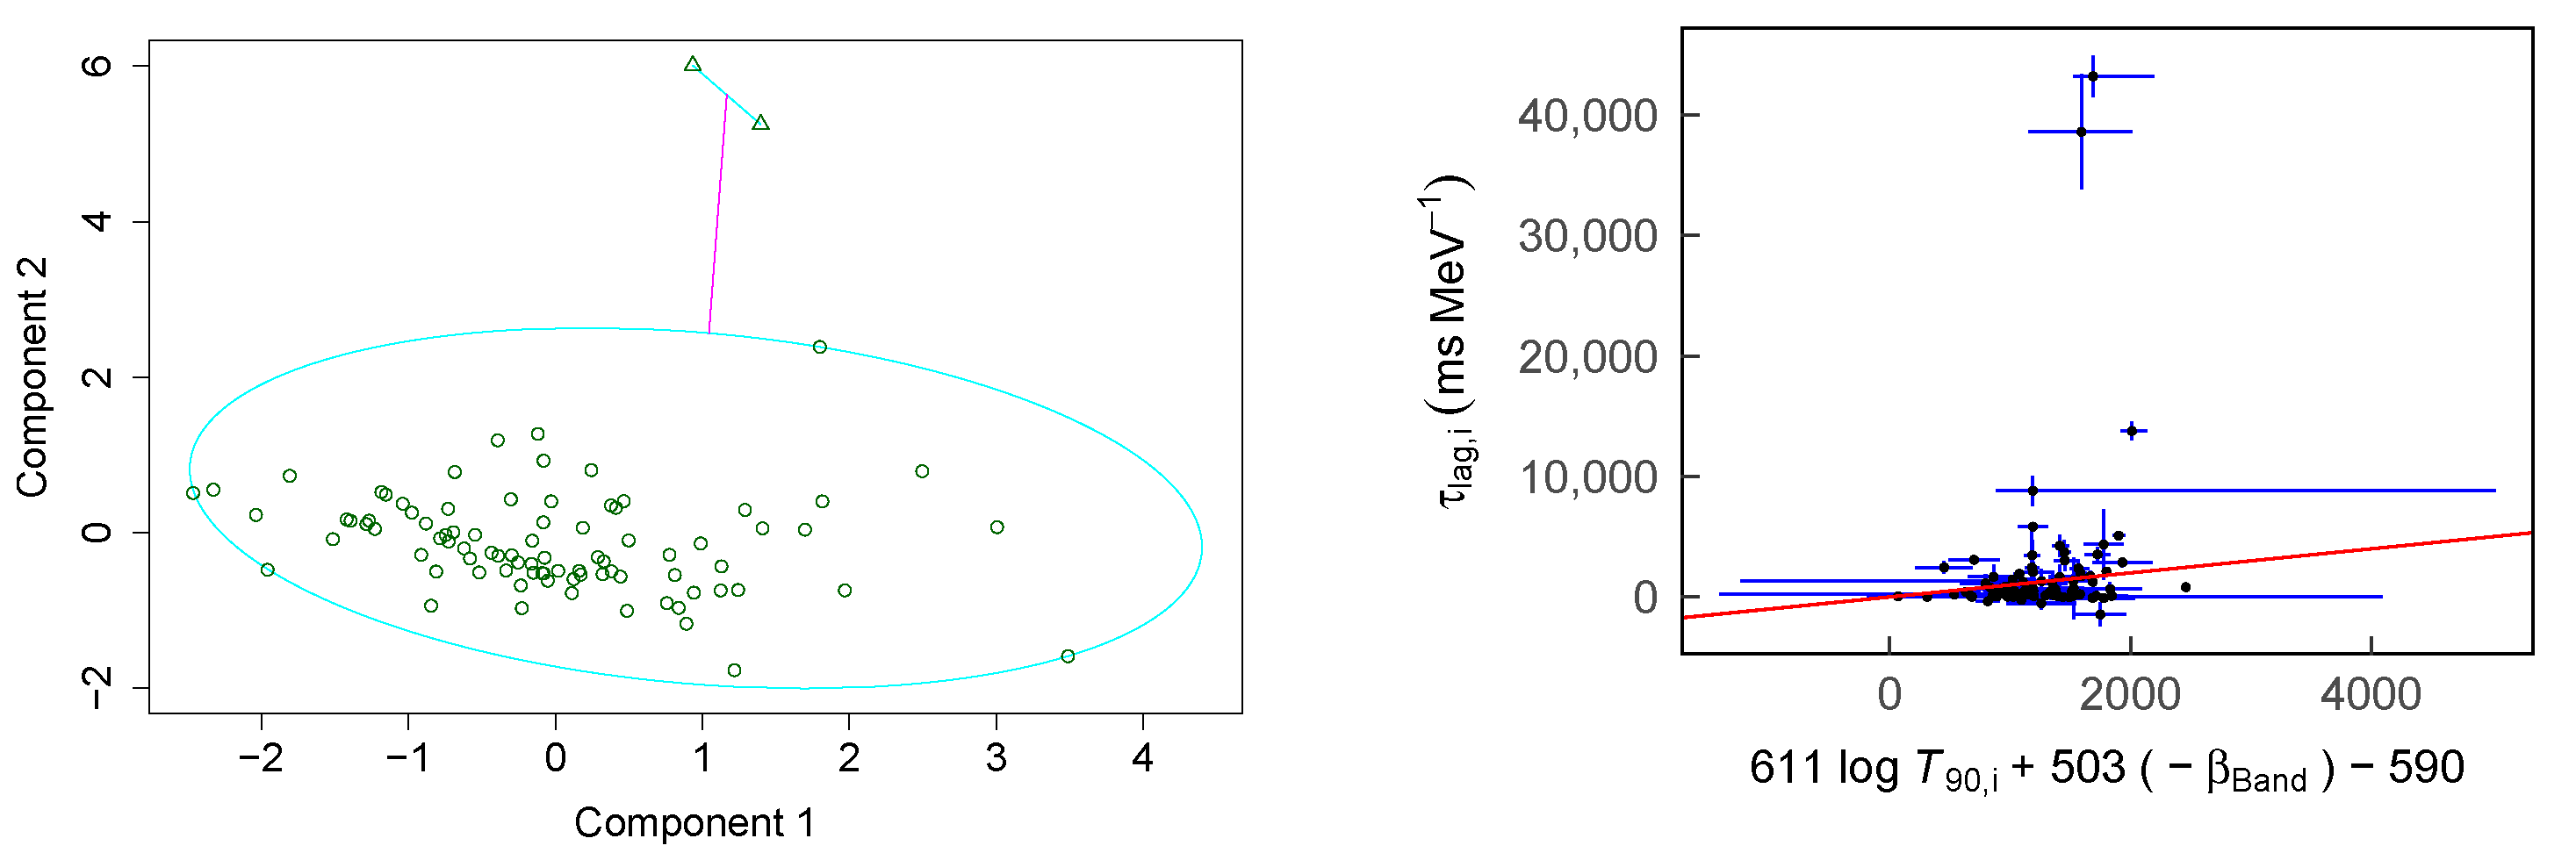
Figure 3.
Similar to Figure 1, with the three parameters being , and . The outliers are GRBs 980425B and 030528A. The linear regression result is . The adjusted is 0.08.
Figure 3.
Similar to Figure 1, with the three parameters being , and . The outliers are GRBs 980425B and 030528A. The linear regression result is . The adjusted is 0.08.
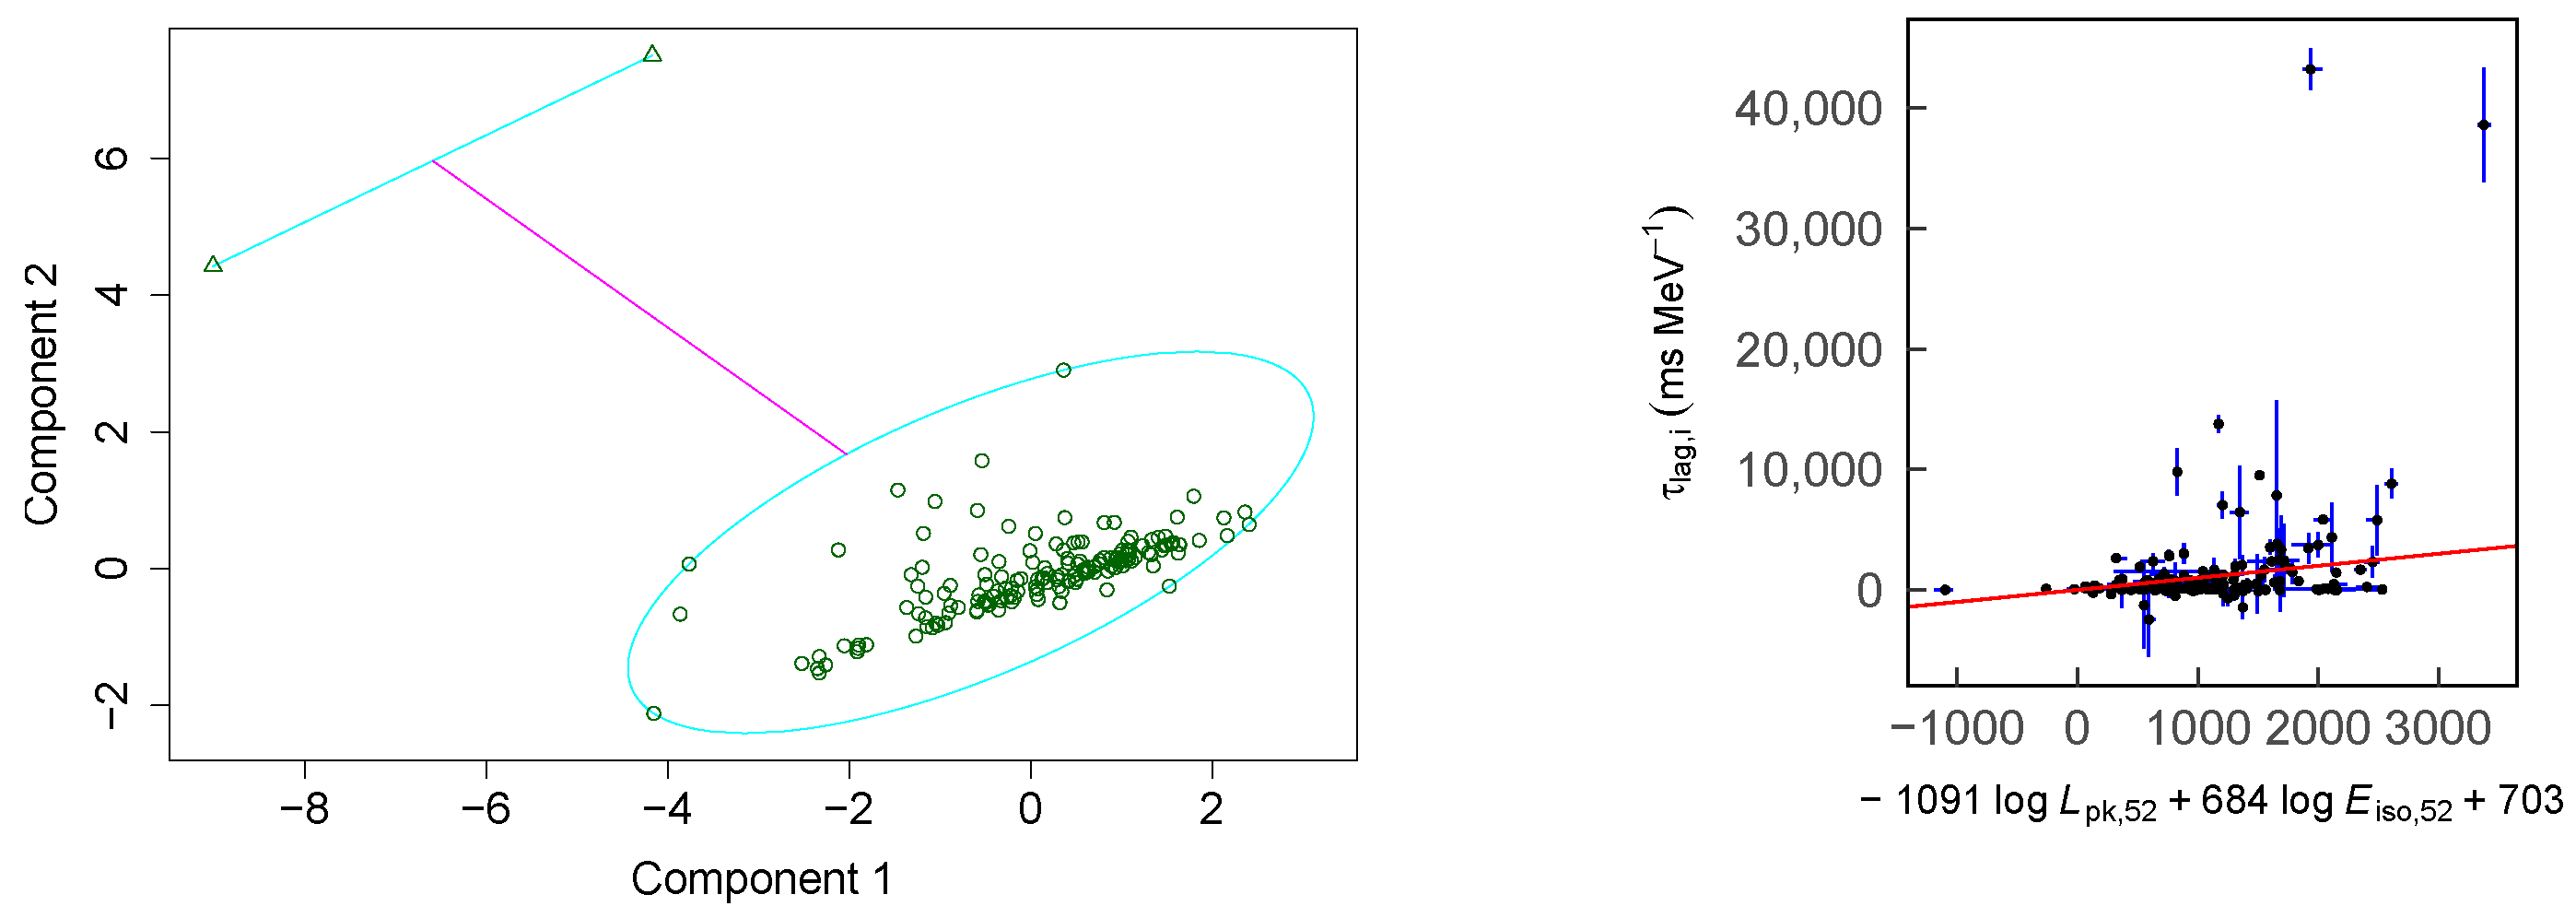
Figure 4.
Similar to Figure 1, with the three parameters being , and . The outliers are GRB 980425B and 030528A. The linear regression result is . The adjusted is 0.07.
Figure 4.
Similar to Figure 1, with the three parameters being , and . The outliers are GRB 980425B and 030528A. The linear regression result is . The adjusted is 0.07.
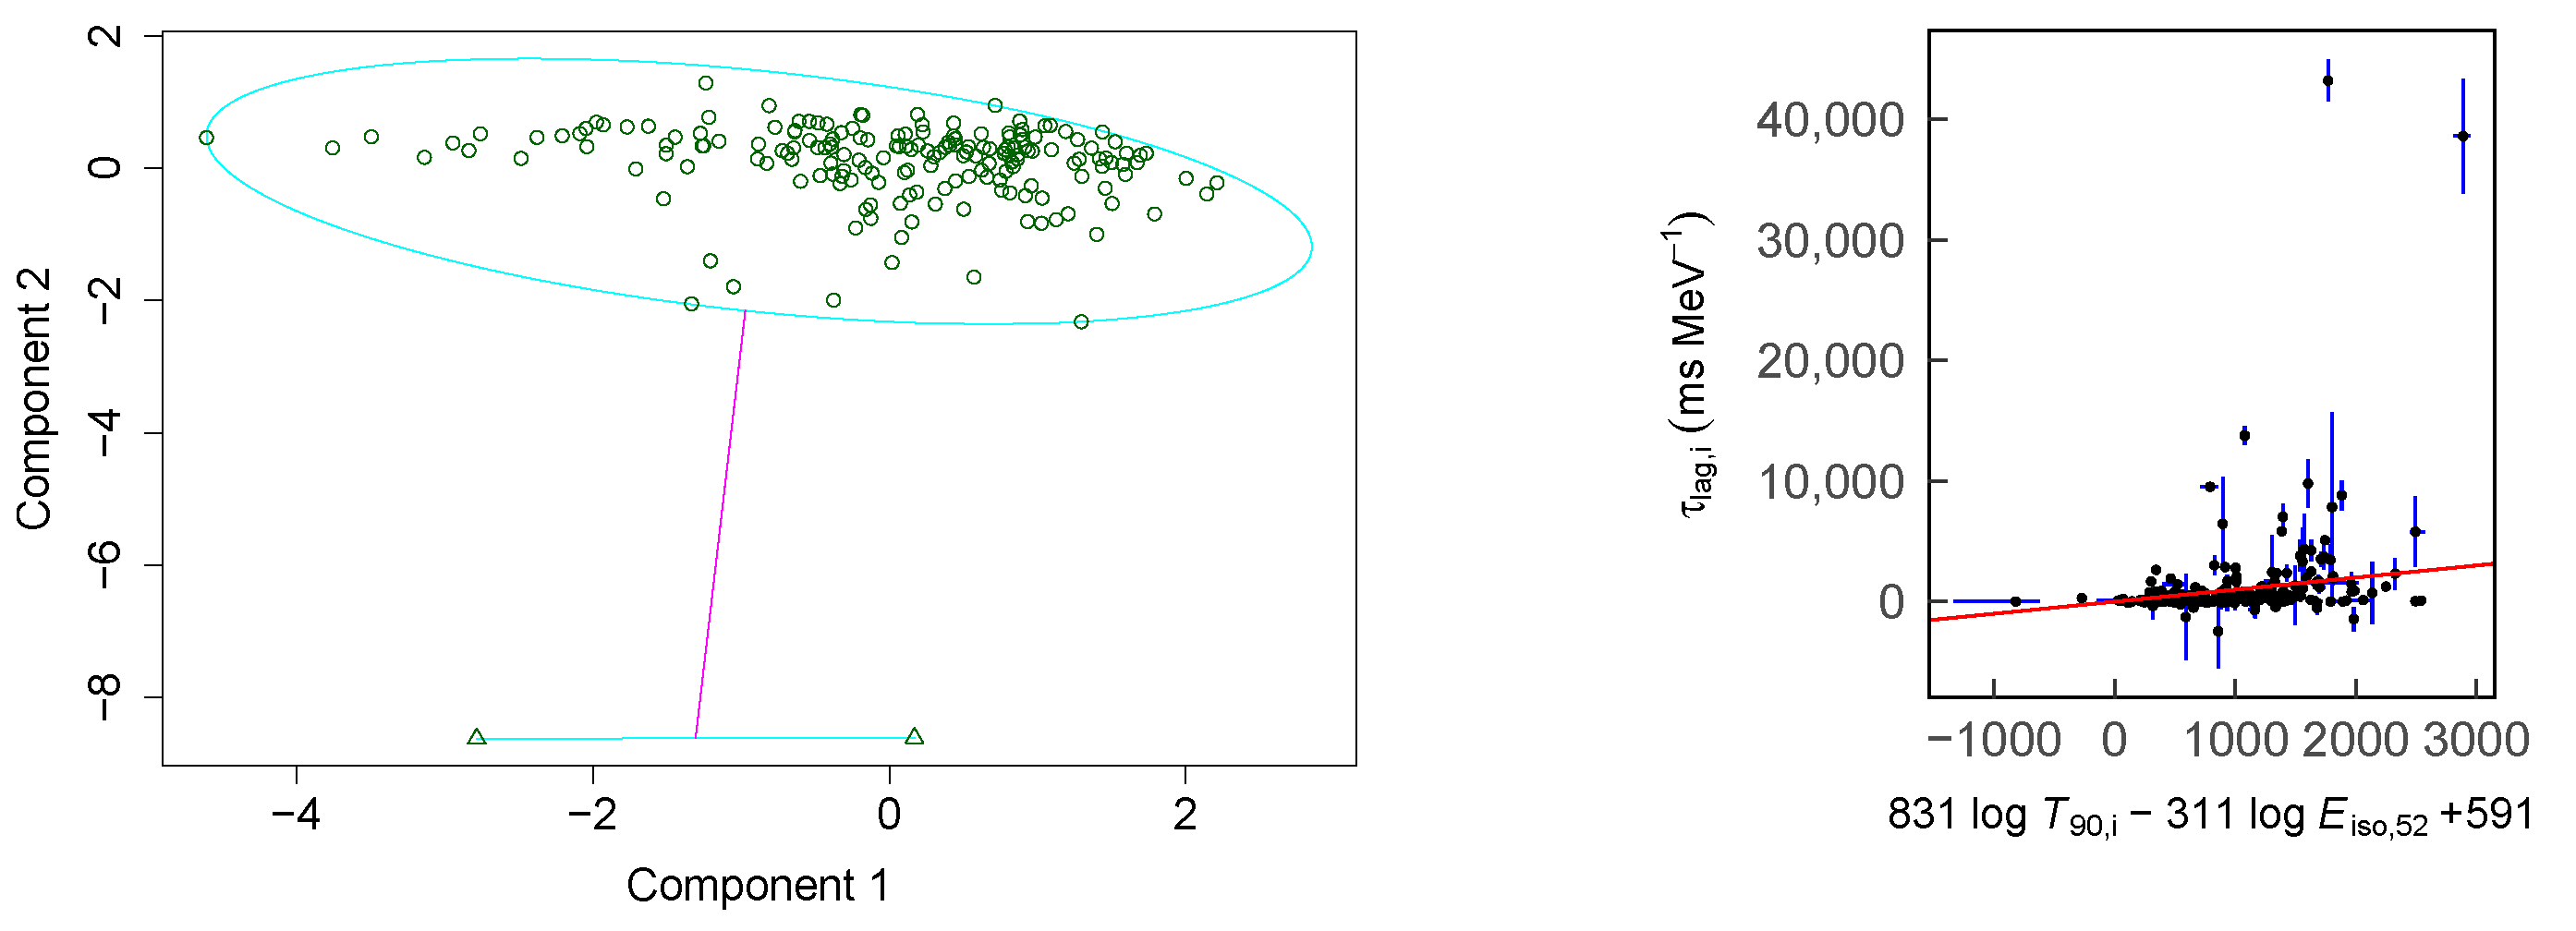
Figure 5.
Similar to Figure 1, with the three parameters being , and . The outliers are GRB 980425B and 030528A. The linear regression result is . The adjusted is 0.14.
Figure 5.
Similar to Figure 1, with the three parameters being , and . The outliers are GRB 980425B and 030528A. The linear regression result is . The adjusted is 0.14.
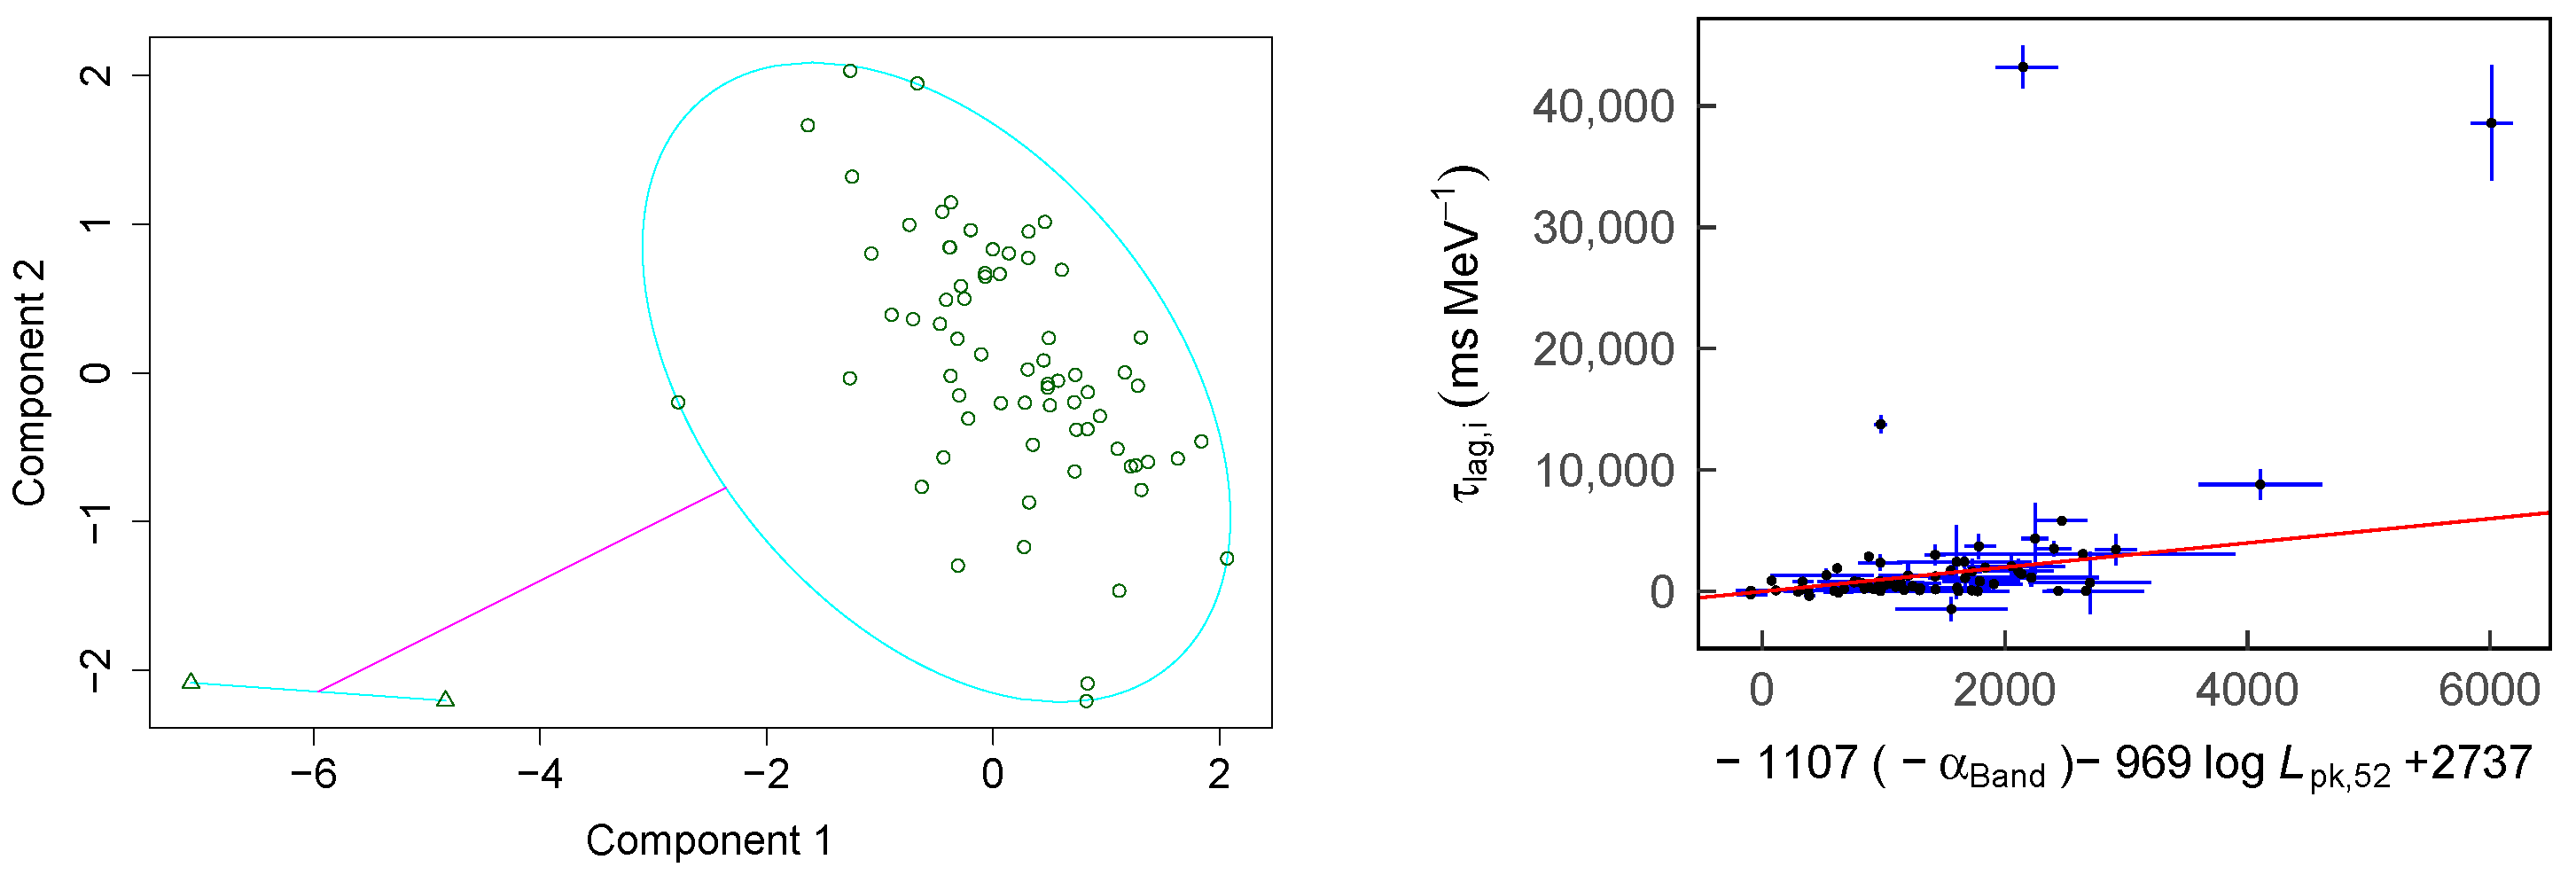
Figure 6.
Similar to Figure 1, with the three parameters being , and . The outliers are GRB 980425B and 030528A. The linear regression result is . The adjusted is 0.21.
Figure 6.
Similar to Figure 1, with the three parameters being , and . The outliers are GRB 980425B and 030528A. The linear regression result is . The adjusted is 0.21.

Figure 7.
Similar to Figure 1, with the three parameters being , and . The outliers are GRB 980425B and 030528A. The linear regression result is . The adjusted is 0.22.
Figure 7.
Similar to Figure 1, with the three parameters being , and . The outliers are GRB 980425B and 030528A. The linear regression result is . The adjusted is 0.22.
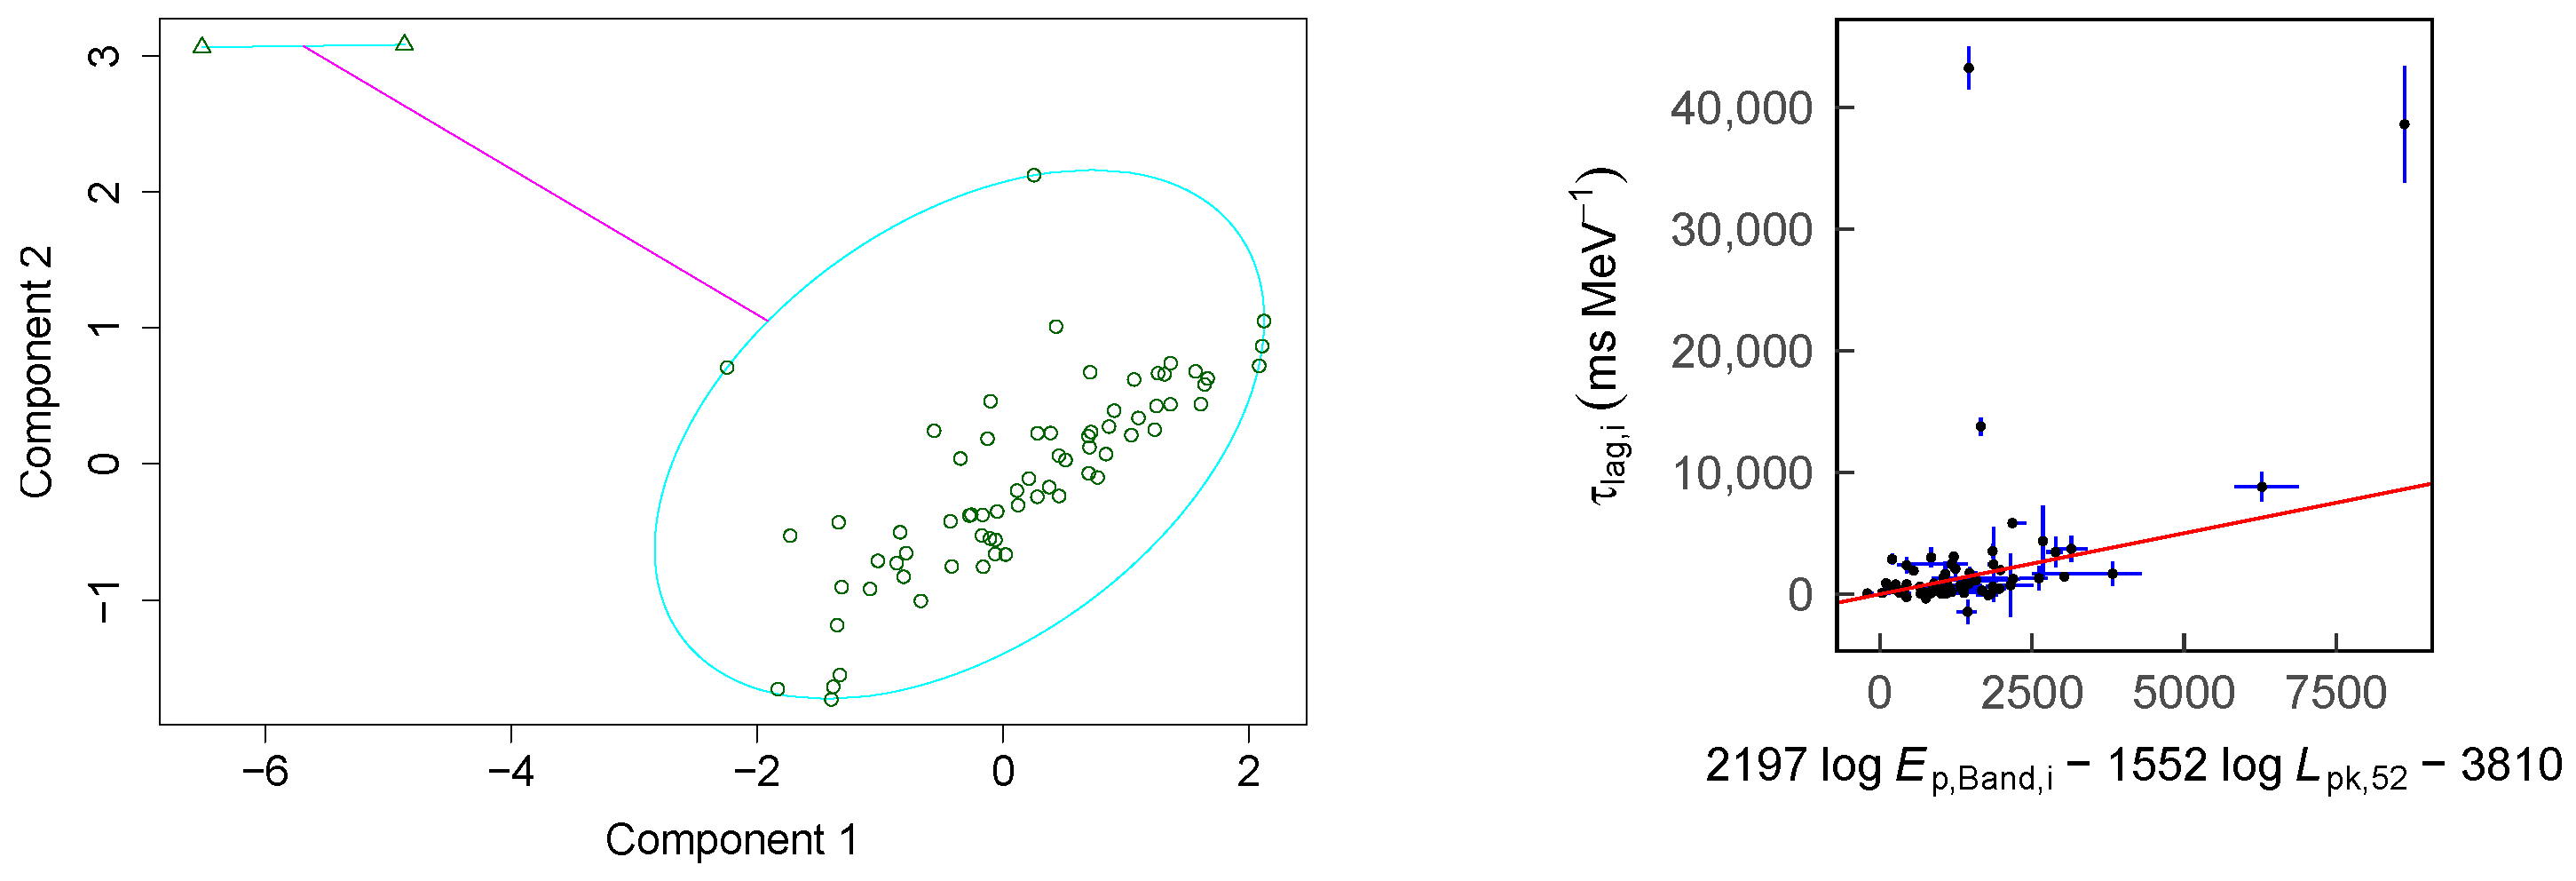
Figure 8.
Similar to Figure 1, with the three parameters being , and . The outlier is GRB 980425B. The linear regression result is . The adjusted is 0.16.
Figure 8.
Similar to Figure 1, with the three parameters being , and . The outlier is GRB 980425B. The linear regression result is . The adjusted is 0.16.
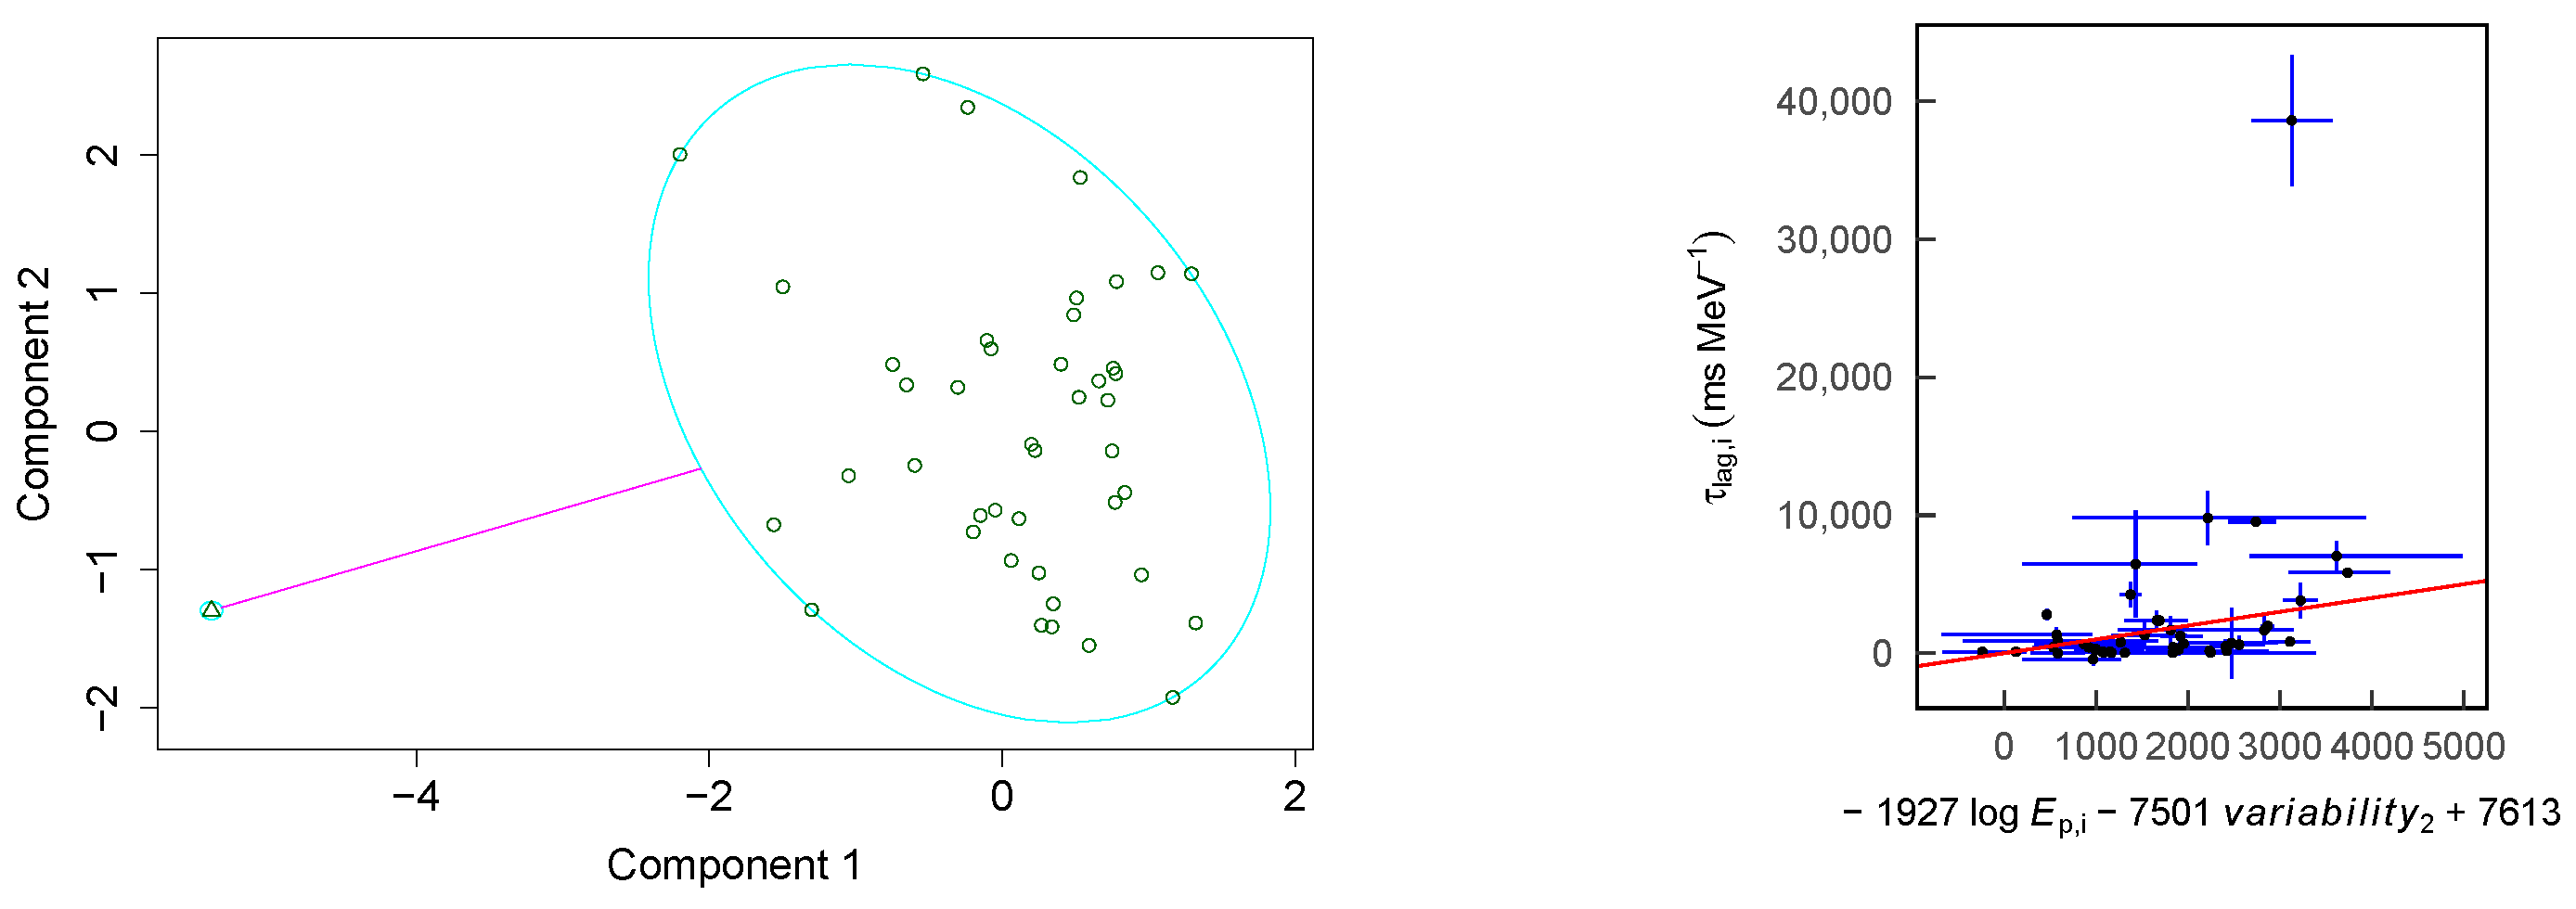
Figure 9.
PAM result for the clustering analysis for the three parameters being , , and . The histogram is the result of function NbClust, indicating the best cluster number is 3. The right panel shows the PAM result for the clustering analysis. The introduction of every parameter is in Section 2. The one outlier is 080319B. The four outliers are GRBs 080721A, 090926A, 091127A and 130408A.

Figure 10.
Similar to the right panel of Figure 9. The left panel shows PAM clustering with the three parameters being , Mag, and , while the outliers are GRBs 080319B and 081221A. The right panel shows PAM clustering with the three parameters being , Age, and , while the outliers are GRB 980425B and 030528A.
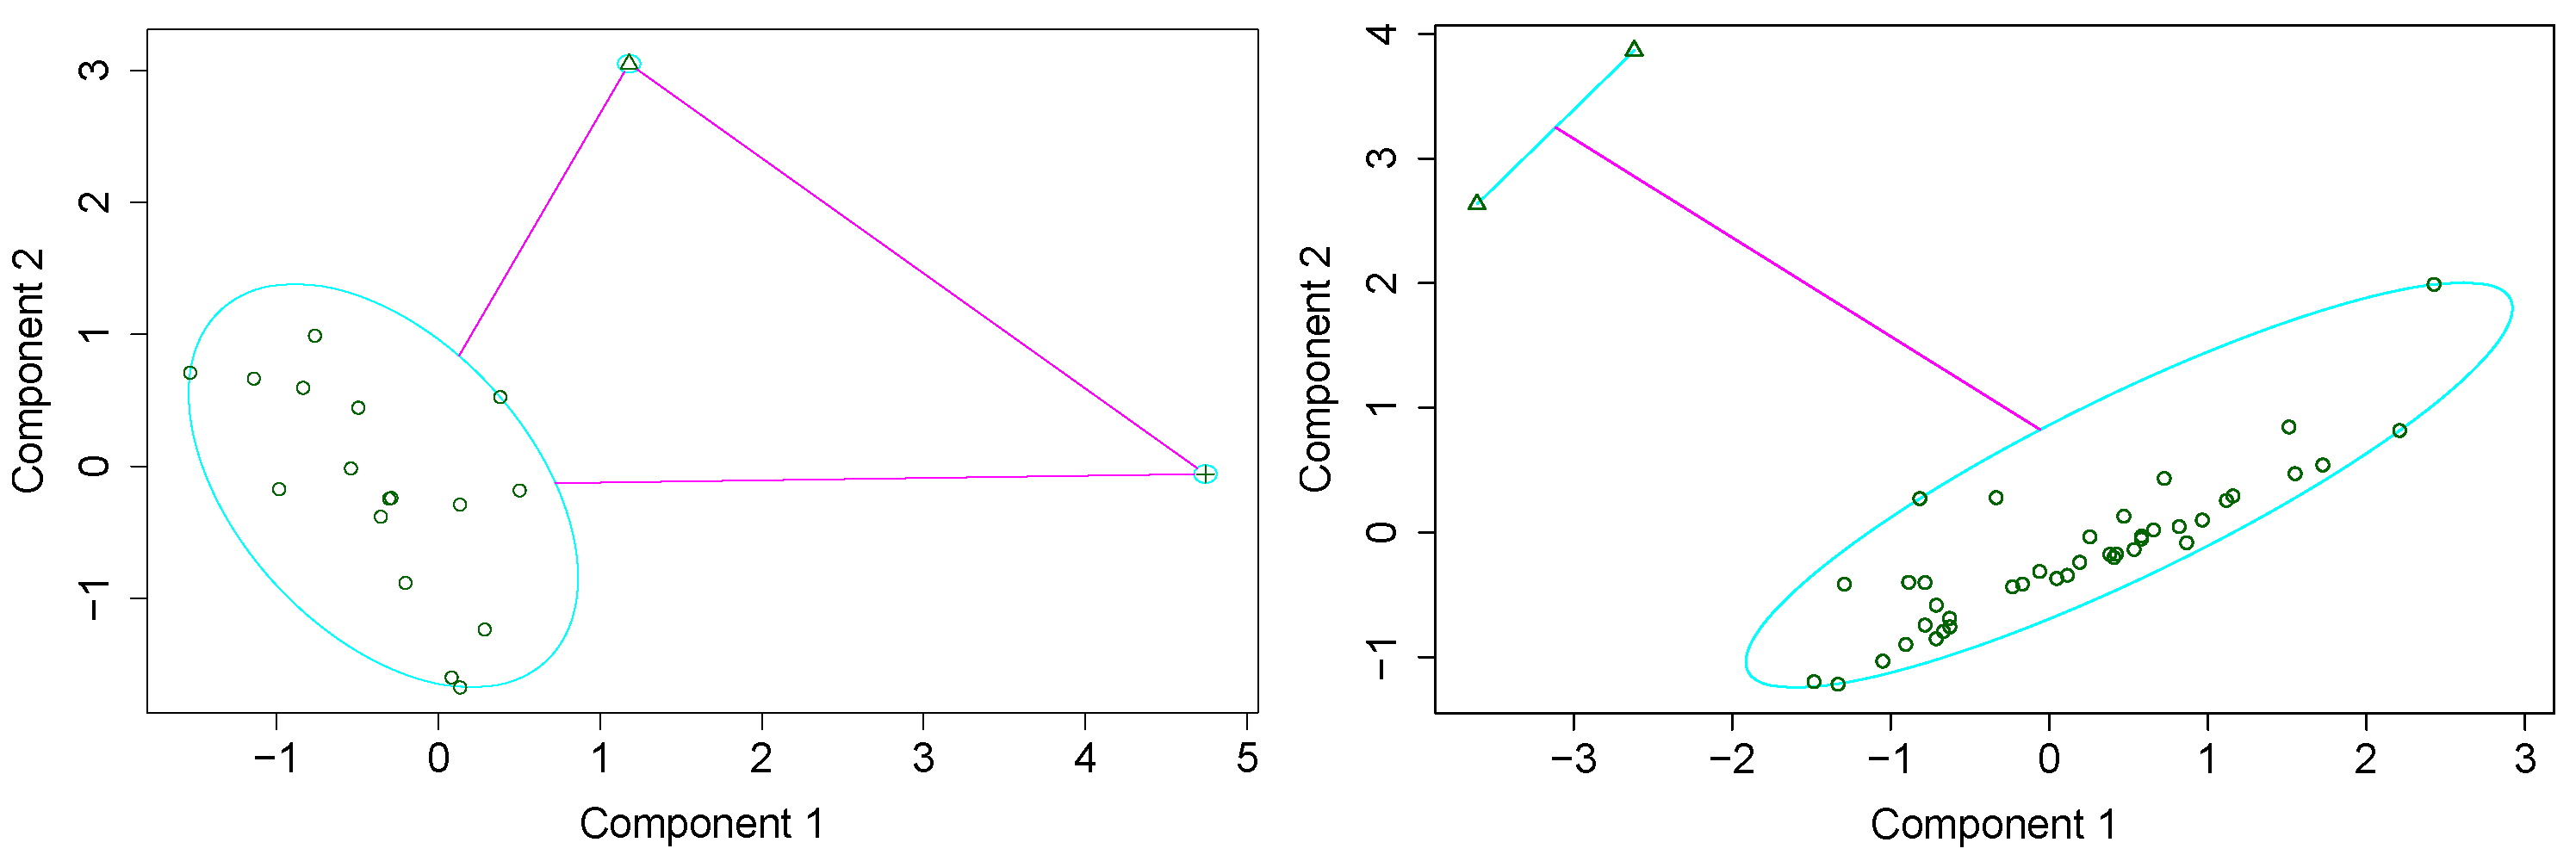
Figure 11.
Same as Figure 10. The left panel shows PAM clustering with the three parameters being , , and , while the outliers are GRB 980425B and 030528A. The right panel shows PAM clustering with the three parameters being , , and Age, while the outlier is GRB 100621A.
Figure 11.
Same as Figure 10. The left panel shows PAM clustering with the three parameters being , , and , while the outliers are GRB 980425B and 030528A. The right panel shows PAM clustering with the three parameters being , , and Age, while the outlier is GRB 100621A.
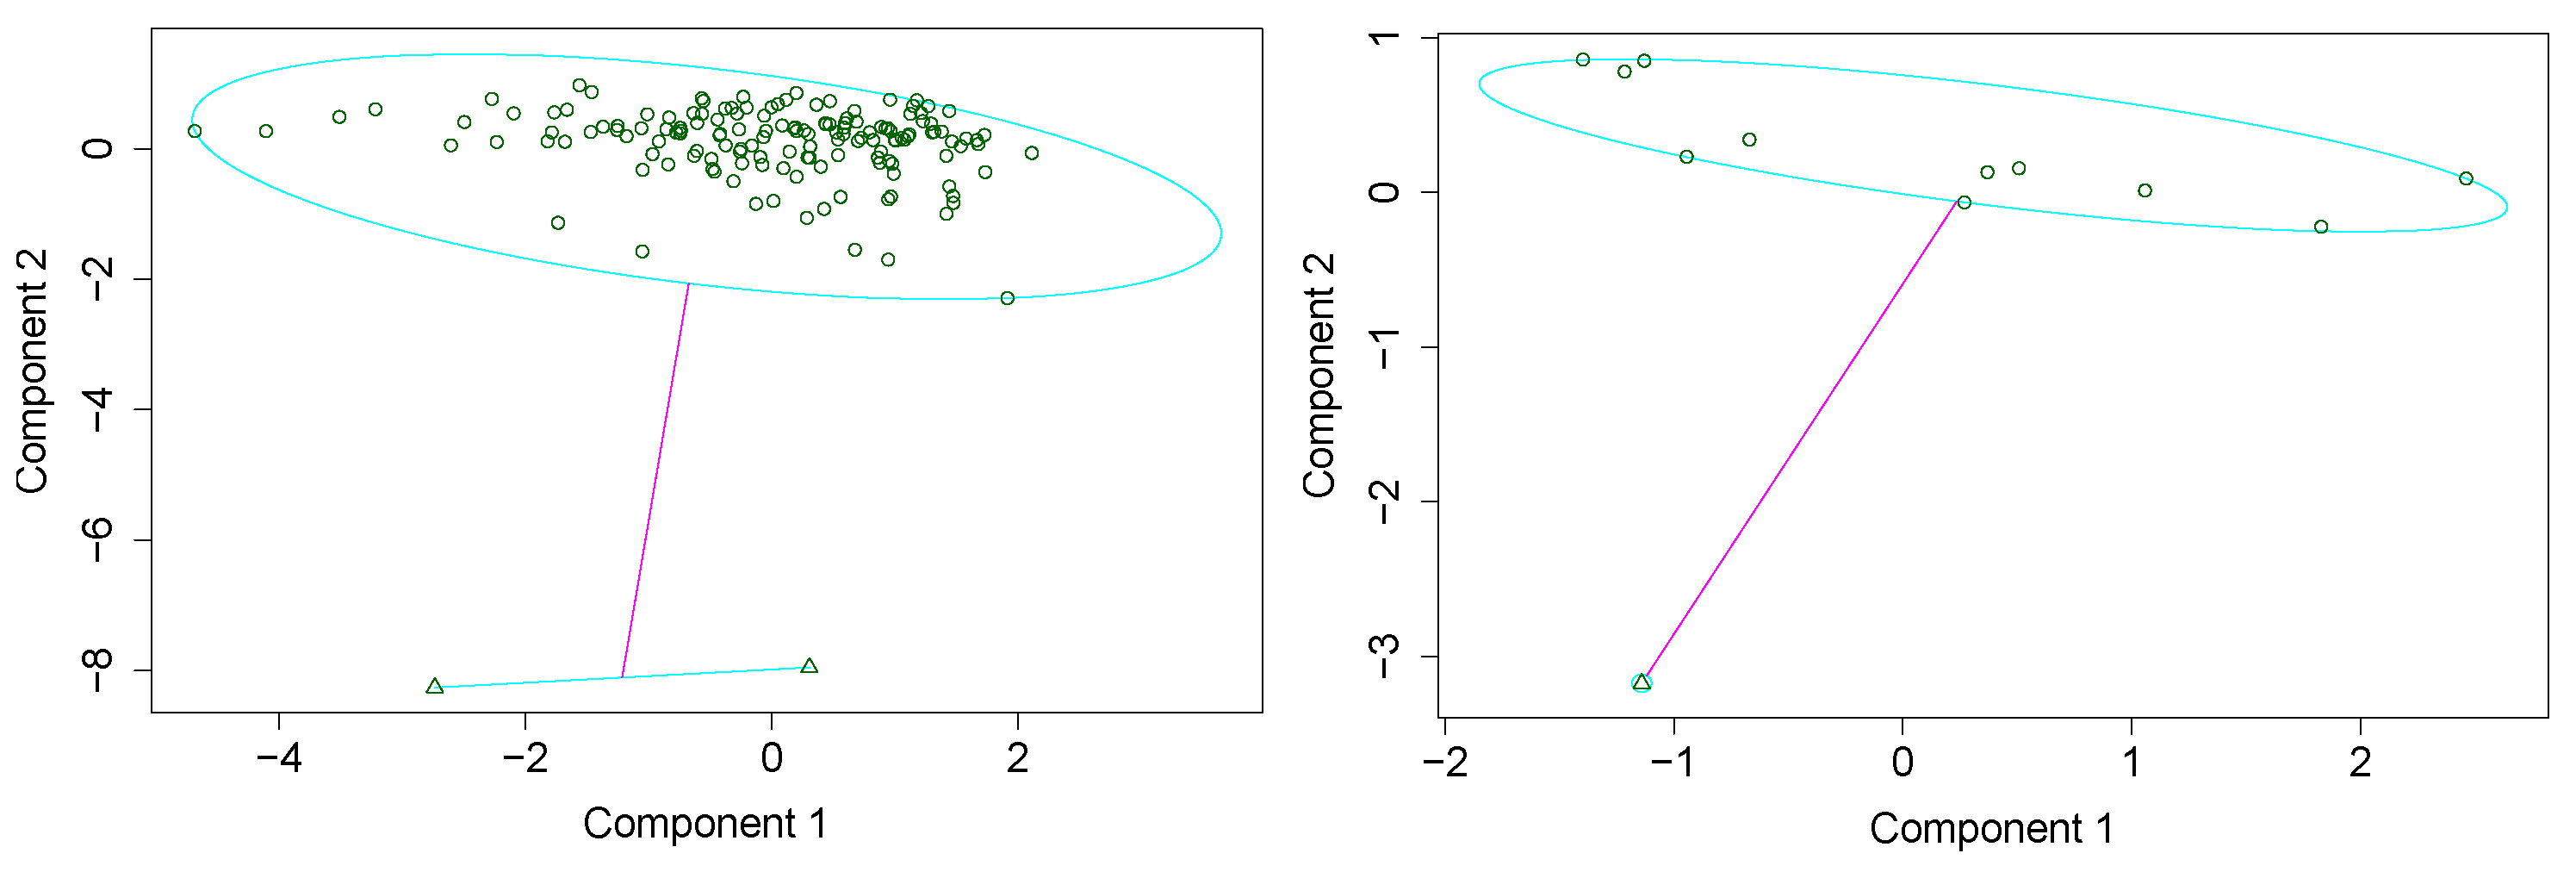
Figure 12.
Same as Figure 10. The left panel shows PAM clustering with the three parameters being , , and Age, while the outliers are GRBs 010921A, 031203A, and 050416A. The right panel shows PAM clustering with the three parameters being , , and , while the outlier is GRB 080319B.
Figure 12.
Same as Figure 10. The left panel shows PAM clustering with the three parameters being , , and Age, while the outliers are GRBs 010921A, 031203A, and 050416A. The right panel shows PAM clustering with the three parameters being , , and , while the outlier is GRB 080319B.

Figure 13.
Same as Figure 10. The left panel shows PAM clustering with the three parameters being , host galaxy offset, and , while the outliers are GRBs 031203A and 060502A. The right panel shows PAM clustering with the three parameters being , , and , while the outliers are GRBs 050416A, 060604A, 060605A, 080319B, and 100621A.
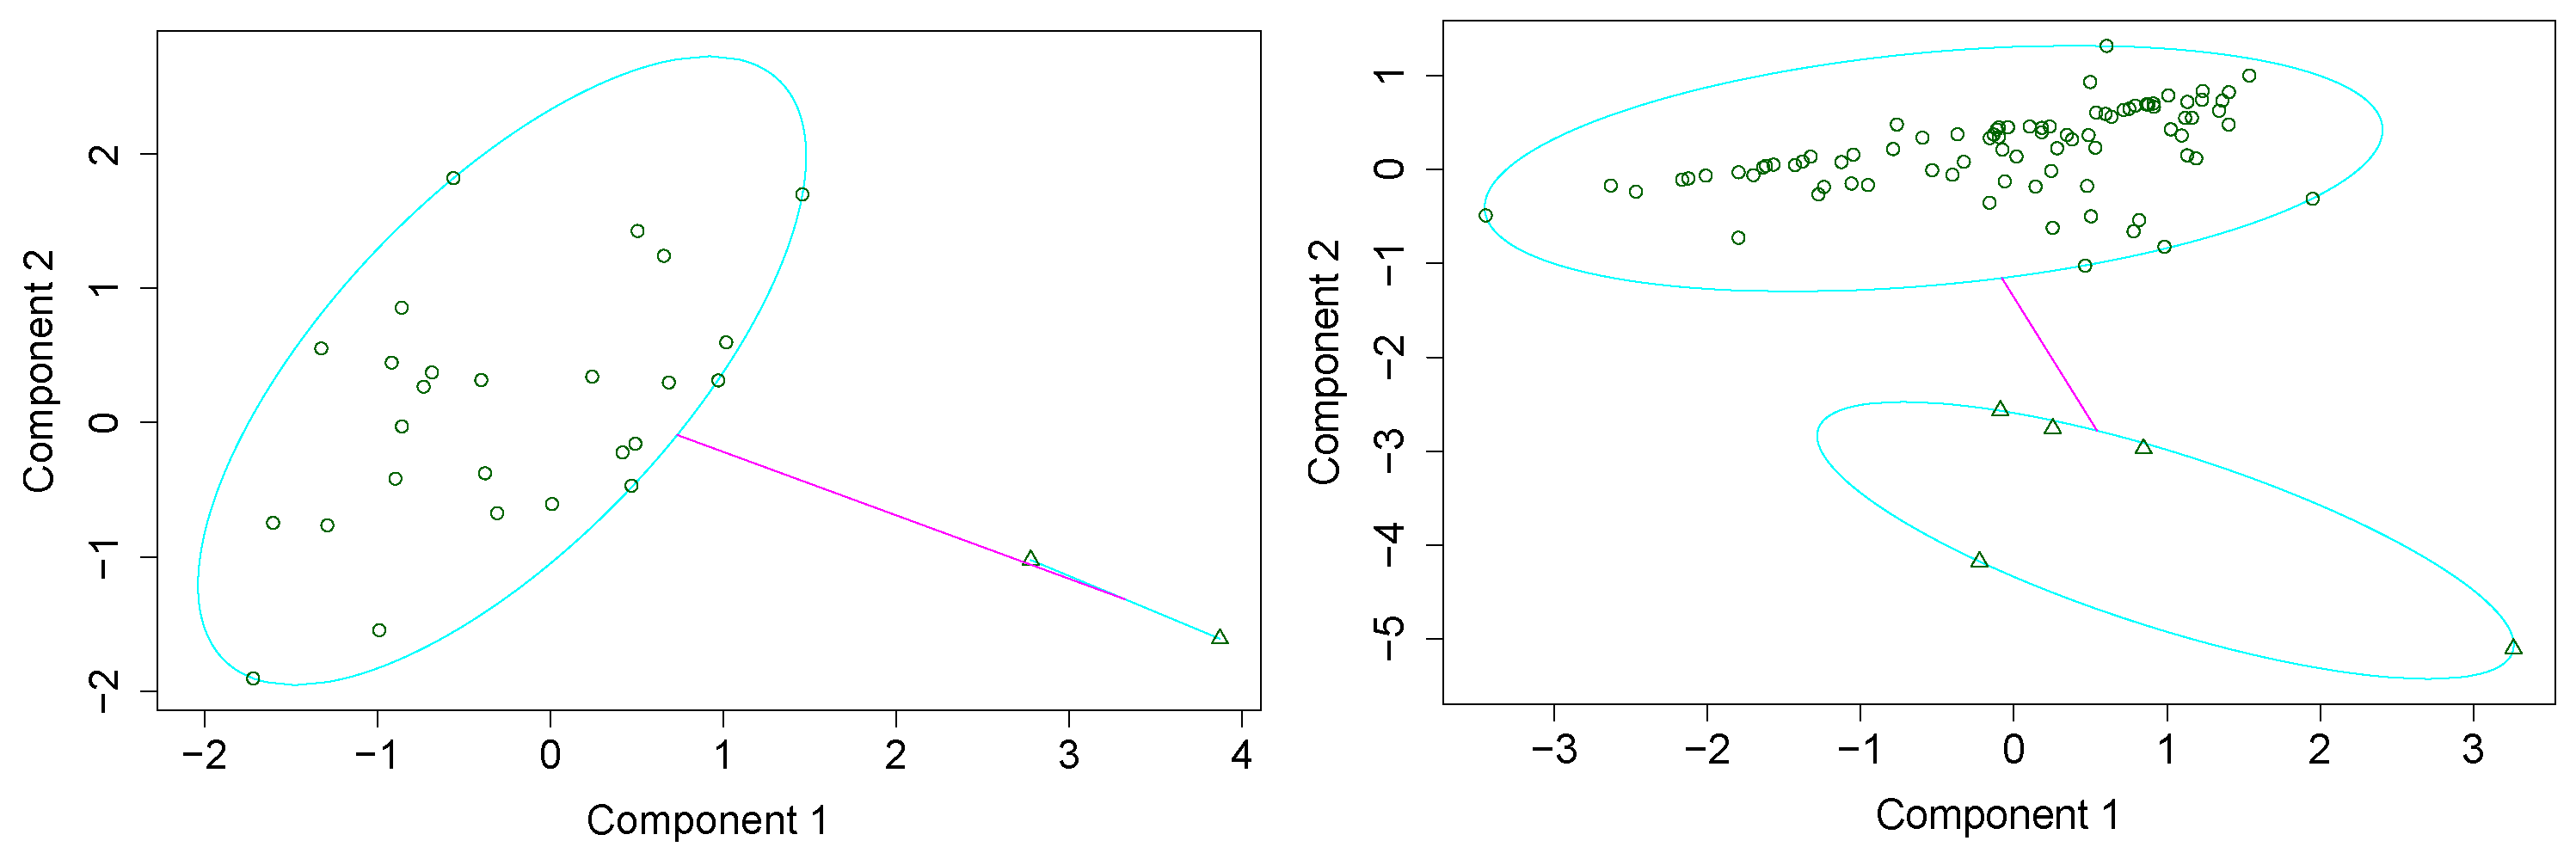
Figure 14.
Same as Figure 10. The left panel shows PAM clustering with the three parameters being , , and host galaxy offset. The outliers are GRBs 031203A and 060505A. The right panel shows PAM clustering with the three parameters being , , and . The outliers are GRBs 060607A, 080721A, 090926A, 091127A, and 130408A.

Figure 15.
The distribution of rest frame spectral time lag . The left panel shows the GRBs with positive values in logarithmic scale. The right panel shows the ones with negative values in normal scale.
Figure 15.
The distribution of rest frame spectral time lag . The left panel shows the GRBs with positive values in logarithmic scale. The right panel shows the ones with negative values in normal scale.
Publisher’s Note: MDPI stays neutral with regard to jurisdictional claims in published maps and institutional affiliations. |
© 2022 by the authors. Licensee MDPI, Basel, Switzerland. This article is an open access article distributed under the terms and conditions of the Creative Commons Attribution (CC BY) license (https://creativecommons.org/licenses/by/4.0/).
Share and Cite
MDPI and ACS Style
Wang, F.-F.; Zou, Y.-C. Outliers in Spectral Time Lag-Selected Gamma Ray Bursts. Universe 2022, 8, 521. https://doi.org/10.3390/universe8100521
AMA Style
Wang F-F, Zou Y-C. Outliers in Spectral Time Lag-Selected Gamma Ray Bursts. Universe. 2022; 8(10):521. https://doi.org/10.3390/universe8100521
Chicago/Turabian StyleWang, Fei-Fei, and Yuan-Chuan Zou. 2022. "Outliers in Spectral Time Lag-Selected Gamma Ray Bursts" Universe 8, no. 10: 521. https://doi.org/10.3390/universe8100521
Note that from the first issue of 2016, this journal uses article numbers instead of page numbers. See further details here.