Article

Untargeted Urinary 1H NMR-Based Metabolomic Pattern as a Potential Platform in Breast Cancer Detection

1
CQM—Centro de Química da Madeira, Universidade da Madeira, Campus Universitário da Penteada, 9020-105 Funchal, Portugal
2
Faculdade de Ciências Exactas e Engenharia da Universidade da Madeira, Universidade da Madeira, Campus Universitário da Penteada, 9020-105 Funchal, Portugal
*
Author to whom correspondence should be addressed.
Metabolites 2019, 9(11), 269; https://doi.org/10.3390/metabo9110269
Submission received: 12 October 2019 / Revised: 25 October 2019 / Accepted: 6 November 2019 / Published: 7 November 2019
(This article belongs to the Special Issue Cancer Metabolomics 2019)

Abstract

:
Breast cancer (BC) remains the second leading cause of death among women worldwide. An emerging approach based on the identification of endogenous metabolites (EMs) and the establishment of the metabolomic fingerprint of biological fluids constitutes a new frontier in medical diagnostics and a promising strategy to differentiate cancer patients from healthy individuals. In this work we aimed to establish the urinary metabolomic patterns from 40 BC patients and 38 healthy controls (CTL) using proton nuclear magnetic resonance spectroscopy (1H-NMR) as a powerful approach to identify a set of BC-specific metabolites which might be employed in the diagnosis of BC. Orthogonal partial least squares-discriminant analysis (OPLS-DA) was applied to a 1H-NMR processed data matrix. Metabolomic patterns distinguished BC from CTL urine samples, suggesting a unique metabolite profile for each investigated group. A total of 10 metabolites exhibited the highest contribution towards discriminating BC patients from healthy controls (variable importance in projection (VIP) >1, p < 0.05). The discrimination efficiency and accuracy of the urinary EMs were ascertained by receiver operating characteristic curve (ROC) analysis that allowed the identification of some metabolites with the highest sensitivities and specificities to discriminate BC patients from healthy controls (e.g. creatine, glycine, trimethylamine N-oxide, and serine). The metabolomic pathway analysis indicated several metabolism pathway disruptions, including amino acid and carbohydrate metabolisms, in BC patients, namely, glycine and butanoate metabolisms. The obtained results support the high throughput potential of NMR-based urinary metabolomics patterns in discriminating BC patients from CTL. Further investigations could unravel novel mechanistic insights into disease pathophysiology, monitor disease recurrence, and predict patient response towards therapy.

Graphical Abstract

1. Introduction

The global cancer burden is estimated to have risen to 18.1 million new cases and 9.6 million deaths in 2018 (WHO) [1], being the second leading cause of death worldwide. Several genetic and epigenetic factors including ageing, unhealthy life styles (poor diet, tobacco and alcohol consumption), population growth, as well as the changing prevalence of certain causes of cancer linked to social and economic development, contribute for this sobering fact. Lung and female breast cancers are at the top of the leading cancer types in terms of the number of new cases, with approximately 2.1 million diagnoses in 2018, contributing about 11.6% of the total cancer incidence [1]. Furthermore, breast cancer is also the leading cause of cancer death in women (15.0%), followed by lung cancer (13.8%) and colorectal cancer (9.5%), which are also the second and third most common types of cancer, respectively [1]. Improving BC detection methods could reduce patient mortality and improve therapeutic responses and prognosis rates [2,3]. Common methods of routine surveillance for BC include periodic mammography, self- or physician performed examination, and blood tests of tumor markers, including cancer antigens (CA 15-3, CA 27.29), carcinoembryonic antigen (CEA), tissue polypeptide specific-antigen, and human epidermal growth factor receptor 2 (the shed form). CA 15-3 and CEA represent the most widely used tumor markers [4]. An additional factor that contributes to the poor prognosis of patients diagnosed with BC is the fact that the diagnosis is often delayed due to limitations in screening tests [5]. A recent approach is metabolomics that study a subset of small molecules derived from the global or targeted analysis of metabolic profiles from biological samples such as blood [6], urine [7,8,9,10], cells, or tissue [11,12,13,14,15], representing a valuable tool in the detection of several diseases including cancer. Several reports have already demonstrated the importance of studying the metabolome as means to discover a set of metabolites to be used as cancer biomarkers [16,17,18]. The study of specific metabolites to identify cancer fingerprints or signatures can aid in cancer detection and prognosis as well as the assessment of the pharmacodynamic effects of therapy [11]. The most common approaches in metabolomics involve gas chromatography-mass spectrometry (GC-MS) [8], liquid chromatography-mass spectrometry (LC-MS) [19] or nuclear magnetic resonance spectroscopy (NMR) [3,16,18,20].
Mass spectrometry (MS) includes a separation stage using liquid chromatography (LC) or gas chromatography (GC) and can discriminate between compounds based on a mass-to-charge (m/z) ratio in charged particles. Although compared with NMR, MS exhibits a greater sensitivity, sample preparation is laborious and dependent on metabolite chemical properties [21]. In addition, MS lacks accuracy and precision, producing an enhanced resolution profile with numerous peaks. However, only approximately 5% of these peaks are associated with known components [22]. Recently, non-invasive sampling strategies, including exhaled breath, urine and saliva, have emerged as attractive and useful approaches when coupled to high-throughput techniques such as NMR (1H NMR) [12,23,24]. NMR spectroscopy is a particularly appealing platform based on the energy absorption and re-emission of the nuclei due to the magnetic field, where the selected isotopes, having momentum in an external magnetic field, will give a signal. This technique presents several advantages such as being rapid, robust, cost-effective, highly reproducible, non-destructive, and fully quantitative. In addition, it requires no prior compound separation or derivatization generating spectra from a biological sample within few minutes, being useful for conducting metabolomic studies on biofluids [25,26,27]. Zhang et al. [28] reviewed the most common methods for NMR spectroscopy-based metabolite profiling, data processing and analysis. Bingol et al. [29] recently overview some advances in the metabolomics field and contribution to targeted and untargeted approaches. A variety of studies have been conducted by NMR in disease research using urine [3,12], saliva [24,30], serum [31], plasma [32,33], tissue [34,35,36,37], and in cell culture [38,39,40].
The aim of this study was to evaluate the ability of 1H NMR spectroscopy combined with multivariate statistical tools to differentiate and discriminate the urinary metabolomic patterns from BC patients and healthy volunteers (CTL) as a powerful approach to identify a set of BC-specific metabolites which might be employed in the diagnosis of BC.

2. Materials and Methods

2.1. Reagents

3-(Trimethylsilyl)propionic-2,2,3,3-d4 acid sodium salt (TSP) and deuterium oxide (D2O) were supplied by Acros Organics (Geel, Belgium). Potassium dihydrogen phosphate (KH2PO4), sodium azide and potassium deuteroxide solution (KOD) were purchased from Panreac (Barcelona, Spain) and Sigma Aldrich (St. Louis, MO, USA).

2.2. Urine Collection

To investigate the urinary NMR profile, 40 urine samples from female patients with BC (n = 40, age range 40–74 years, average 59 ± 10 years) and 38 urine samples from healthy female volunteers without any known pathology (n = 38, age range 40–72 years, average 53 ± 8 years; control group—CTL) were obtained from the Haemato-Oncology Unit of Hospital Dr. Nélio Mendonça (Funchal, Portugal) and Blood Donors Bank of the same Hospital, respectively (Table 1), and were randomly selected among the volunteers. Patients did not receive any neoadjuvant chemotherapy or radiation therapy prior to sample collection. Healthy controls were age- and gender-matched patients and had no declared history of cancer or gastrointestinal symptoms. Exclusion criteria included pregnancy, inflammatory conditions, mental disorders, gastrointestinal tract disorders, hypertension, uncontrolled bacterial, viral, or fungal infection and diabetes mellitus.
The study was approved by the Ethic Committee of Hospital Dr. Nélio Mendonça (Approval no. S.1708625/2017). Written informed consent for the study was obtained from all participants. Each individual (either as a patient or healthy volunteer) provided a sample of morning urine (after overnight fasting) in a 20 mL sterile container. The samples were aliquoted into 4 mL glass vials and frozen at –80 °C until the experiments.
Urine samples were thawed and centrifuged (8000 rpm for 5 min) to remove any suspended cells and other precipitated material [12]. Then, 540 µL of urine was mixed with 60 µL of a buffer solution (KH2PO4, 1.5 M in D2O) containing 0.1% of TSP-d4 (used as chemical shift reference) and sodium azide (NaN3, 2 mM). The pH was adjusted to 7.00 ± 0.02 by adding small amounts of KOD.

2.3. NMR Measurements

NMR spectral acquisition was performed using a Bruker Advance II Plus NMR spectrometer equipped with a 400 MHz magnet UltraShield™ 400 Plus at 300K. All NMR spectra acquisition and pre-processing were performed under the control of a workstation with TopSpin 3.1 (Bruker BioSpin). Two different 1H-NMR spectra were collected: a 1D 1H spectrum providing quantitative metabolite data for statistical analysis while 2D HSQC and 2D-Jres experiments assisted in peak assignment and metabolite identification using standard Bruker pulse programs. For each sample, a 1D nuclear overhauser enhancement spectroscopy (NOESY) pulse sequence (noesypr1d) was used in all cases and solvent signal suppression was achieved by presaturation during relaxation and mixing time (SW 4807.692 Hz, TD 64 K data points, relaxation delay 5 s, 128 scans). The shimming was calibrated automatically. Also, all spectra were processed using a line broadening (1.0 Hz) and baseline automatically corrected. The NMR spectrum of each sample was aligned with reference to the TSP signal at δ 0.00 ppm. Spectral regions within the range of 0.94 to 10 ppm were analyzed after excluding the sub-region δ 4.55–6.05 ppm to remove variability arising from water suppression and possible cross-relaxation effect on the urea signal via solvent exchanging protons. As already known, the TSP signal may be affected by proteins or other macromolecules present in samples [41] and for that reason in the preparation of urine samples before NMR analysis, the step of centrifugation was taken into account and the rotations per minute (rpm) was used in order to remove any proteins present in samples
The identification of metabolites was accomplished using the Chenomx NMR Suite 8.2 (Chenomx Inc., Alberta, Canada) and relative concentrations (in mM) of metabolites were determined using the 400MHz library from Chenomx NMR Suite 8.2, which compares the integral of a known reference signal (TSP) with signals derived from a library of compounds containing chemical shifts and peak multiplicities. In addition, the identification of selected metabolites was also cross checked from the Human Metabolome Database (HMDB) [42] and literature [43]. Regarding the metabolites that were not available in the library, identification was accomplished by running a standard solution and the relative concentration was calculated manually. This software not only allows the identification of compounds but also access their quantification based on advanced algorithms turning into a very straightforward tool to analyze NMR spectra.

2.4. Statistical Analysis

Statistical analyses were performed using the web server Metaboanalyst 3.0 [44] where sample specific normalization allowed the manual adjustment of relative concentrations based on biological inputs (i.e., volume, mass) and row-wise normalization allowed the general-purpose adjustment for differences among samples. Regarding data transformation and scaling were accomplished using two different approaches to make features more comparable, raw data were scaled using mean-centering and cubic root transformation. Intensities in each spectrum were normalized by the sum to avoid the contribution of urine dilution. Then, multivariate statistical analyses, namely, PCA, PLS-DA, and OPLS-DA were applied to the urinary metabolomic profile dataset to provide insights into the separations between the groups. Furthermore, hierarchical cluster analysis by k-means of the 2 groups in the study was performed and Pearson’s correlation was used to generate the heat map using the metabolites to identify clustering patterns. Moreover, the ROC curves were attained to verify which metabolites had the highest sensitivity/specificity for a BC diagnosis. Finally, the metabolites were used for the metabolic pathway analysis to identify the most relevant metabolic pathways involved in the BC and CTL groups.

3. Results and Discussion

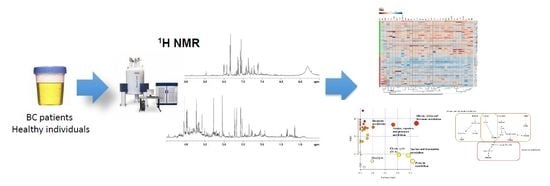
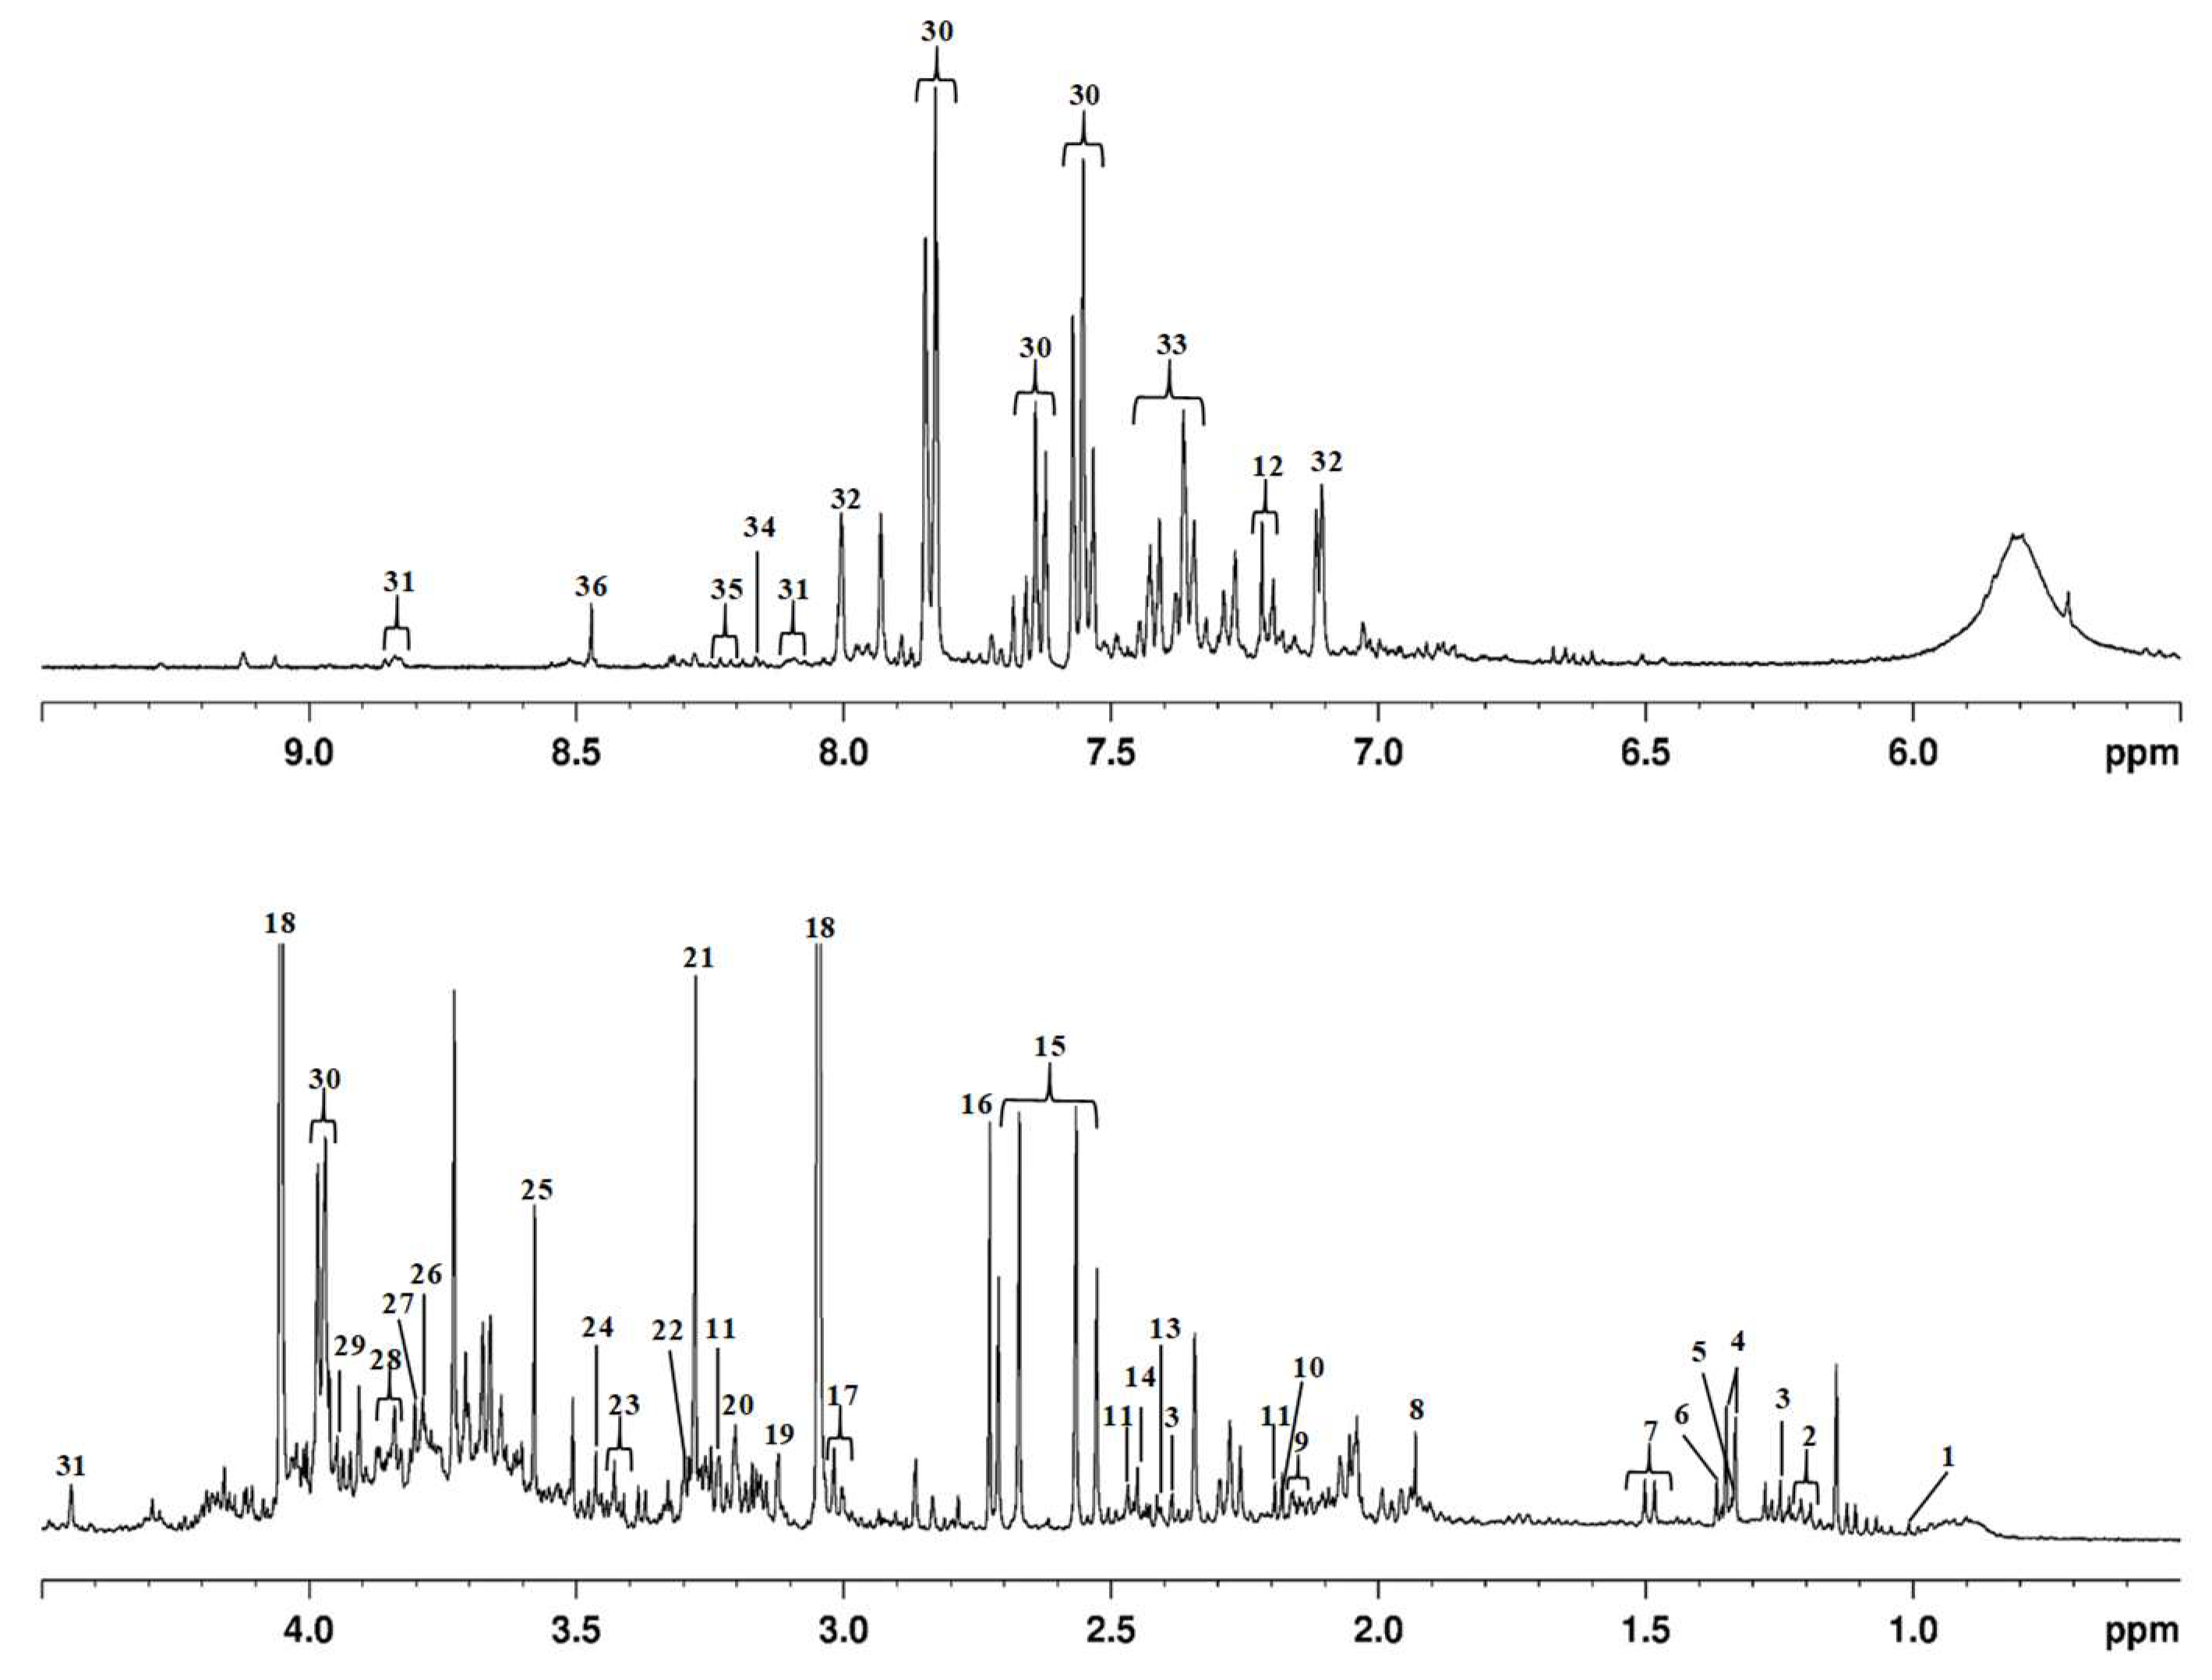
3.1. Urinary Metabolomic Pattern Based on 1H NMR

1H NMR analysis was performed according to the procedure described in the Methods section. A representative first dimension urine 1H NMR spectrum, referenced to TSP (δ 0. 0 ppm), from a BC patient is shown in Figure 1, and metabolites were indicated based on their chemical shifts.
Table 2 represents the identification of metabolites as well as their minimum and maximum relative concentrations (mM) for each group and the respective percentage of occurrence (FO). Each sample analysis was performed in triplicate and the relative standard deviation (RSD) was lower than 2%.
For most metabolites, the FO was higher than 90% with the following exceptions: valine, glutamine, carnitine, trigonelline, 4-cresol sulphate, and hypoxanthine for the BC group; α-hydroxyisobutyrate, trimethylamine N-oxide, hypoxanthine, and glycine for the CTL group. Regarding relative concentrations (in mM), the highest level was obtained for creatinine followed by hippurate in the BC group and citrate in the CTL group. In addition, taurine and mannitol presented superior levels in BC group, respectively. It can also be highlighted that the majority of metabolites were down-regulated relatively to the BC group, except formate, α-hydroxybutyrate hippurate, and phenylalanine, that were up-regulated, being also identified in a study developed by Carrola et al. [12] with lung cancer patients
Thirty-six metabolites were identified and quantified relative to TSP (Figure 1). The main metabolites identified in urine resulted mainly from tricarboxylate (e.g., citrate, cis-aconitate), methane (e.g., dimethylamine, trimethylamine N-oxide) and amino acid metabolisms (e.g., hippurate, glycine). The most intense signals were obtained from creatinine, creatine, hippurate, citrate, and trimethylamine N-oxide (Figure 1). These metabolites were already identified in several studies that use urine from cancer individuals [12,37,45]. Trimethylamine N-oxide is produced in the liver by intestinal bacteria from dietary quaternary amines, such as choline and carnitine trough trimethylamine (TMA) via flavin-containing monooxygenase (FMO3), and the levels in urine or plasma are used to determine FMO3 deficiency [46,47,48,49,50]. Creatinine is subsequently produced via a biological system involving creatine, phosphocreatine, and adenosine triphosphate (ATP), whereas hippurate and citrate are derived from phenylalanine metabolism and the citrate cycle [51]. The concentration of creatinine is age- and sex dependent, decreasing with age and varying throughout the day. Normally, the concentration of creatinine is increased in males when compared with females, given the increased body mass index [52]. Creatinine production from the muscles is proportional to the total muscle mass and muscle catabolism. In individuals with a relatively low muscle mass, including children, women, and cancer patients, serum creatinine levels are reduced for a given glomerular filtration rate (GFR), which is the flow rate of filtered fluid through the kidney, thus providing information on kidney function [53].

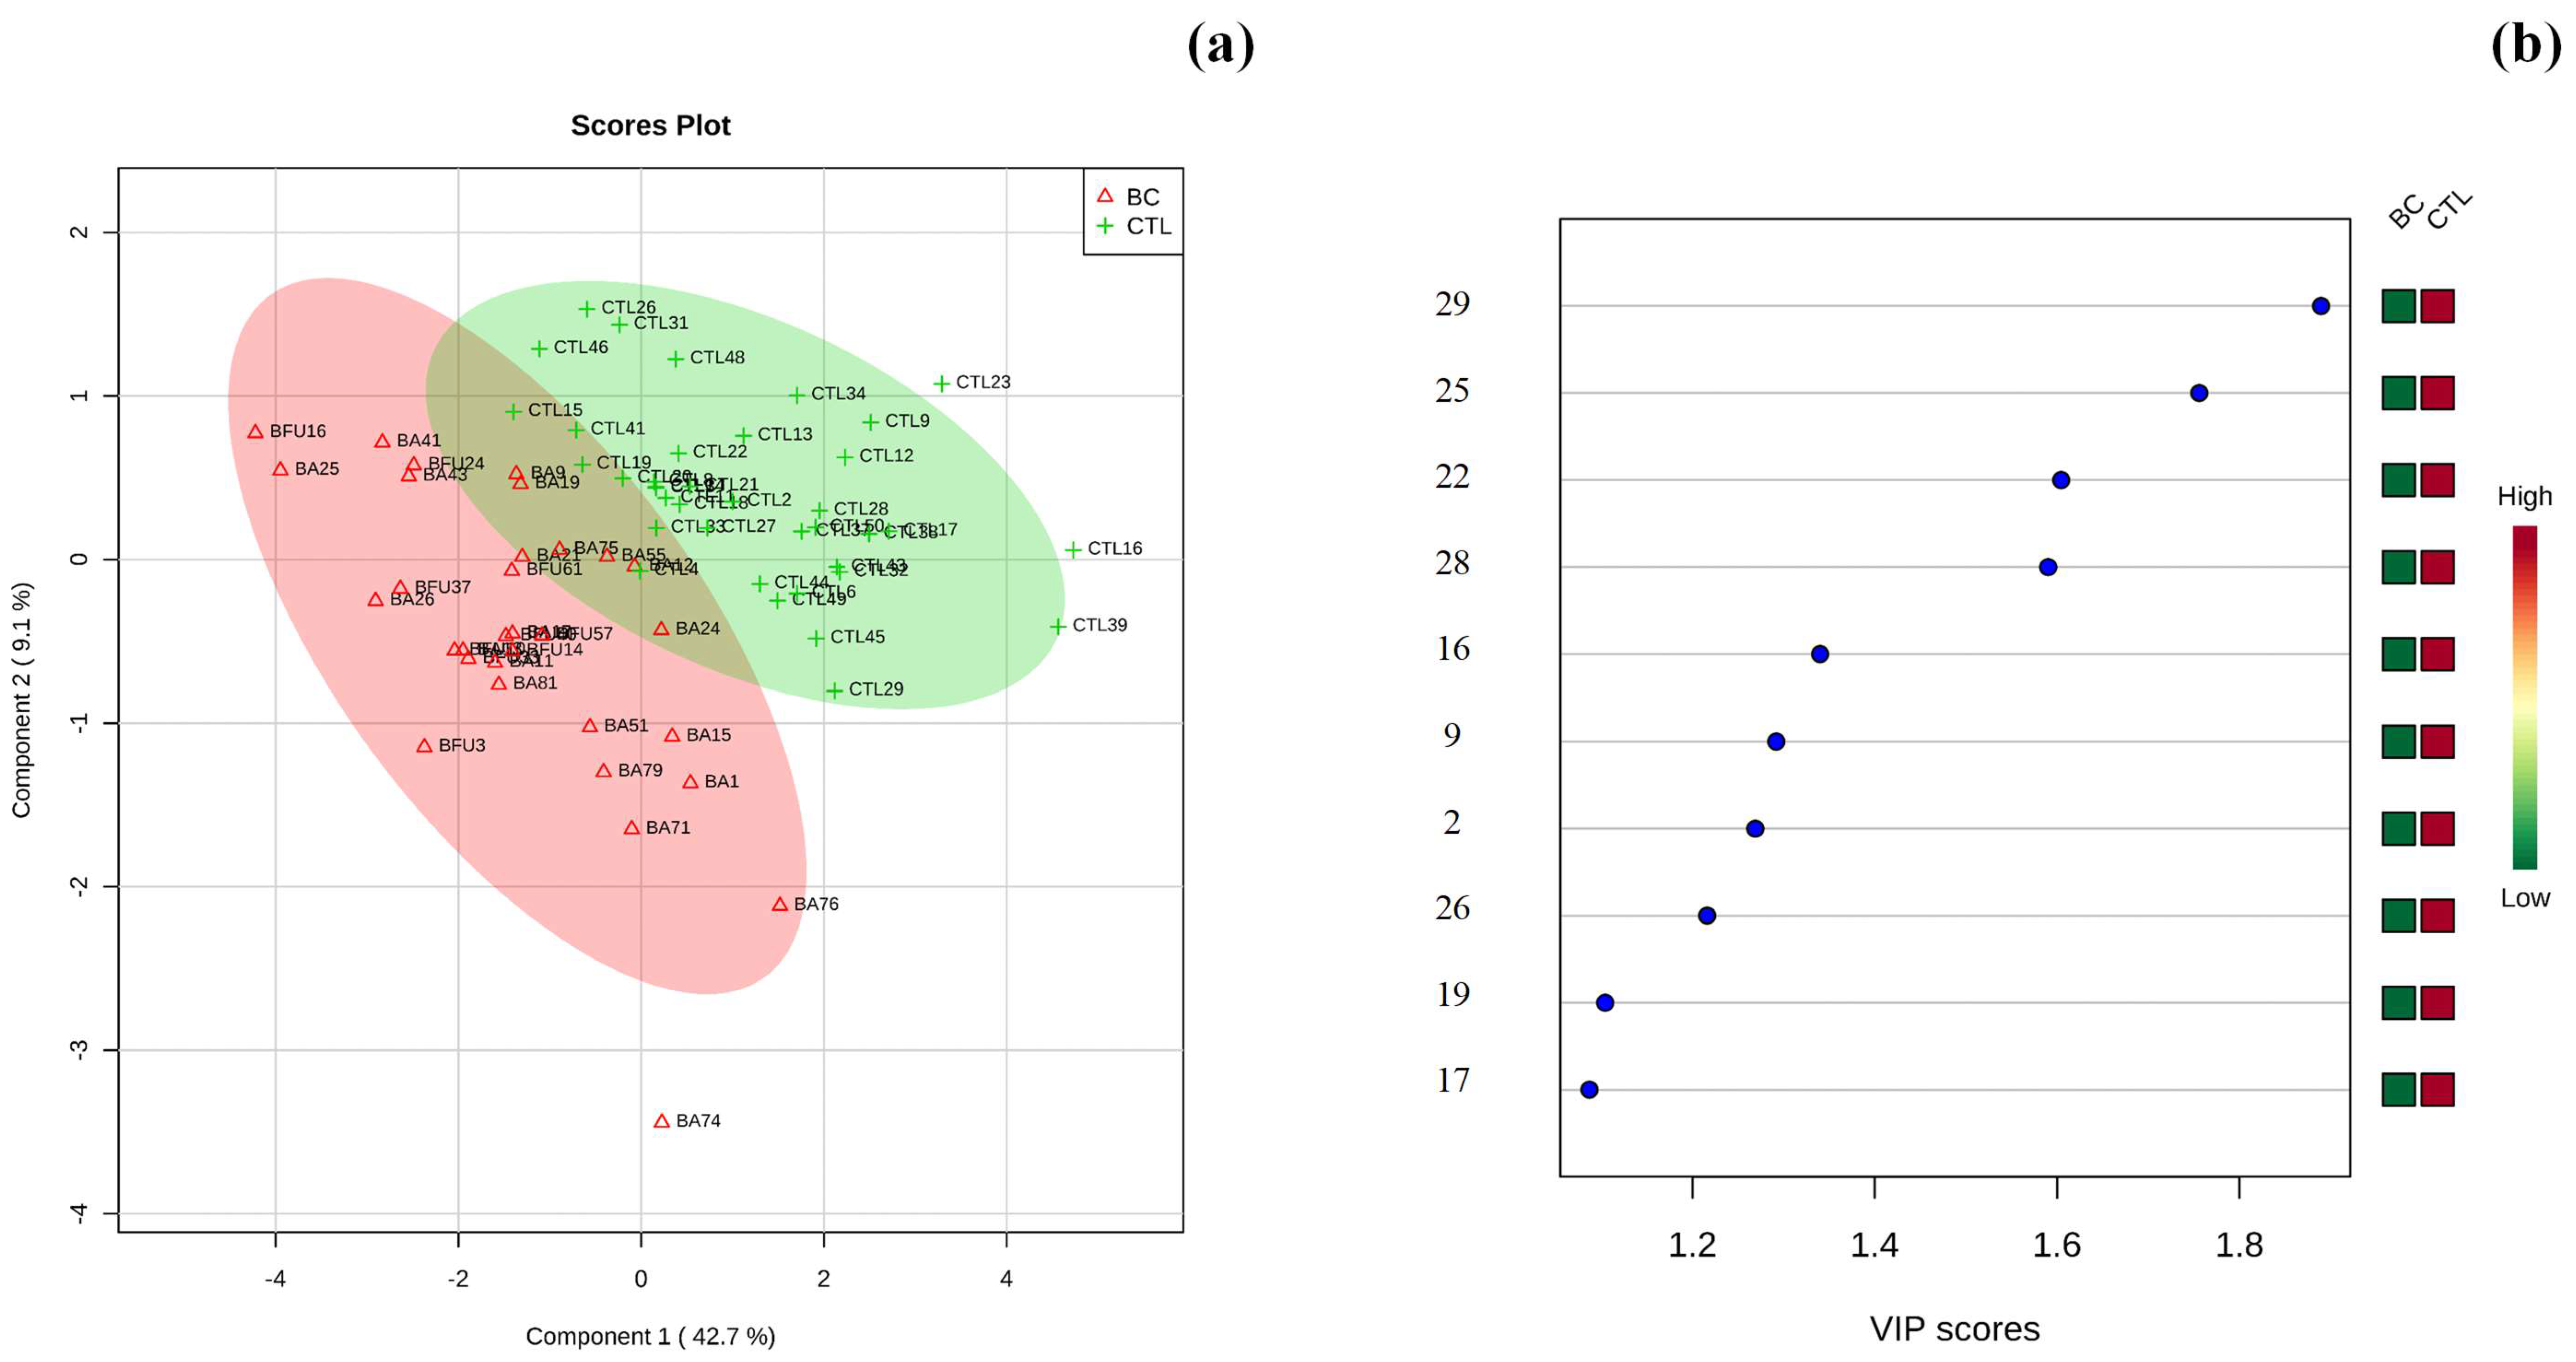
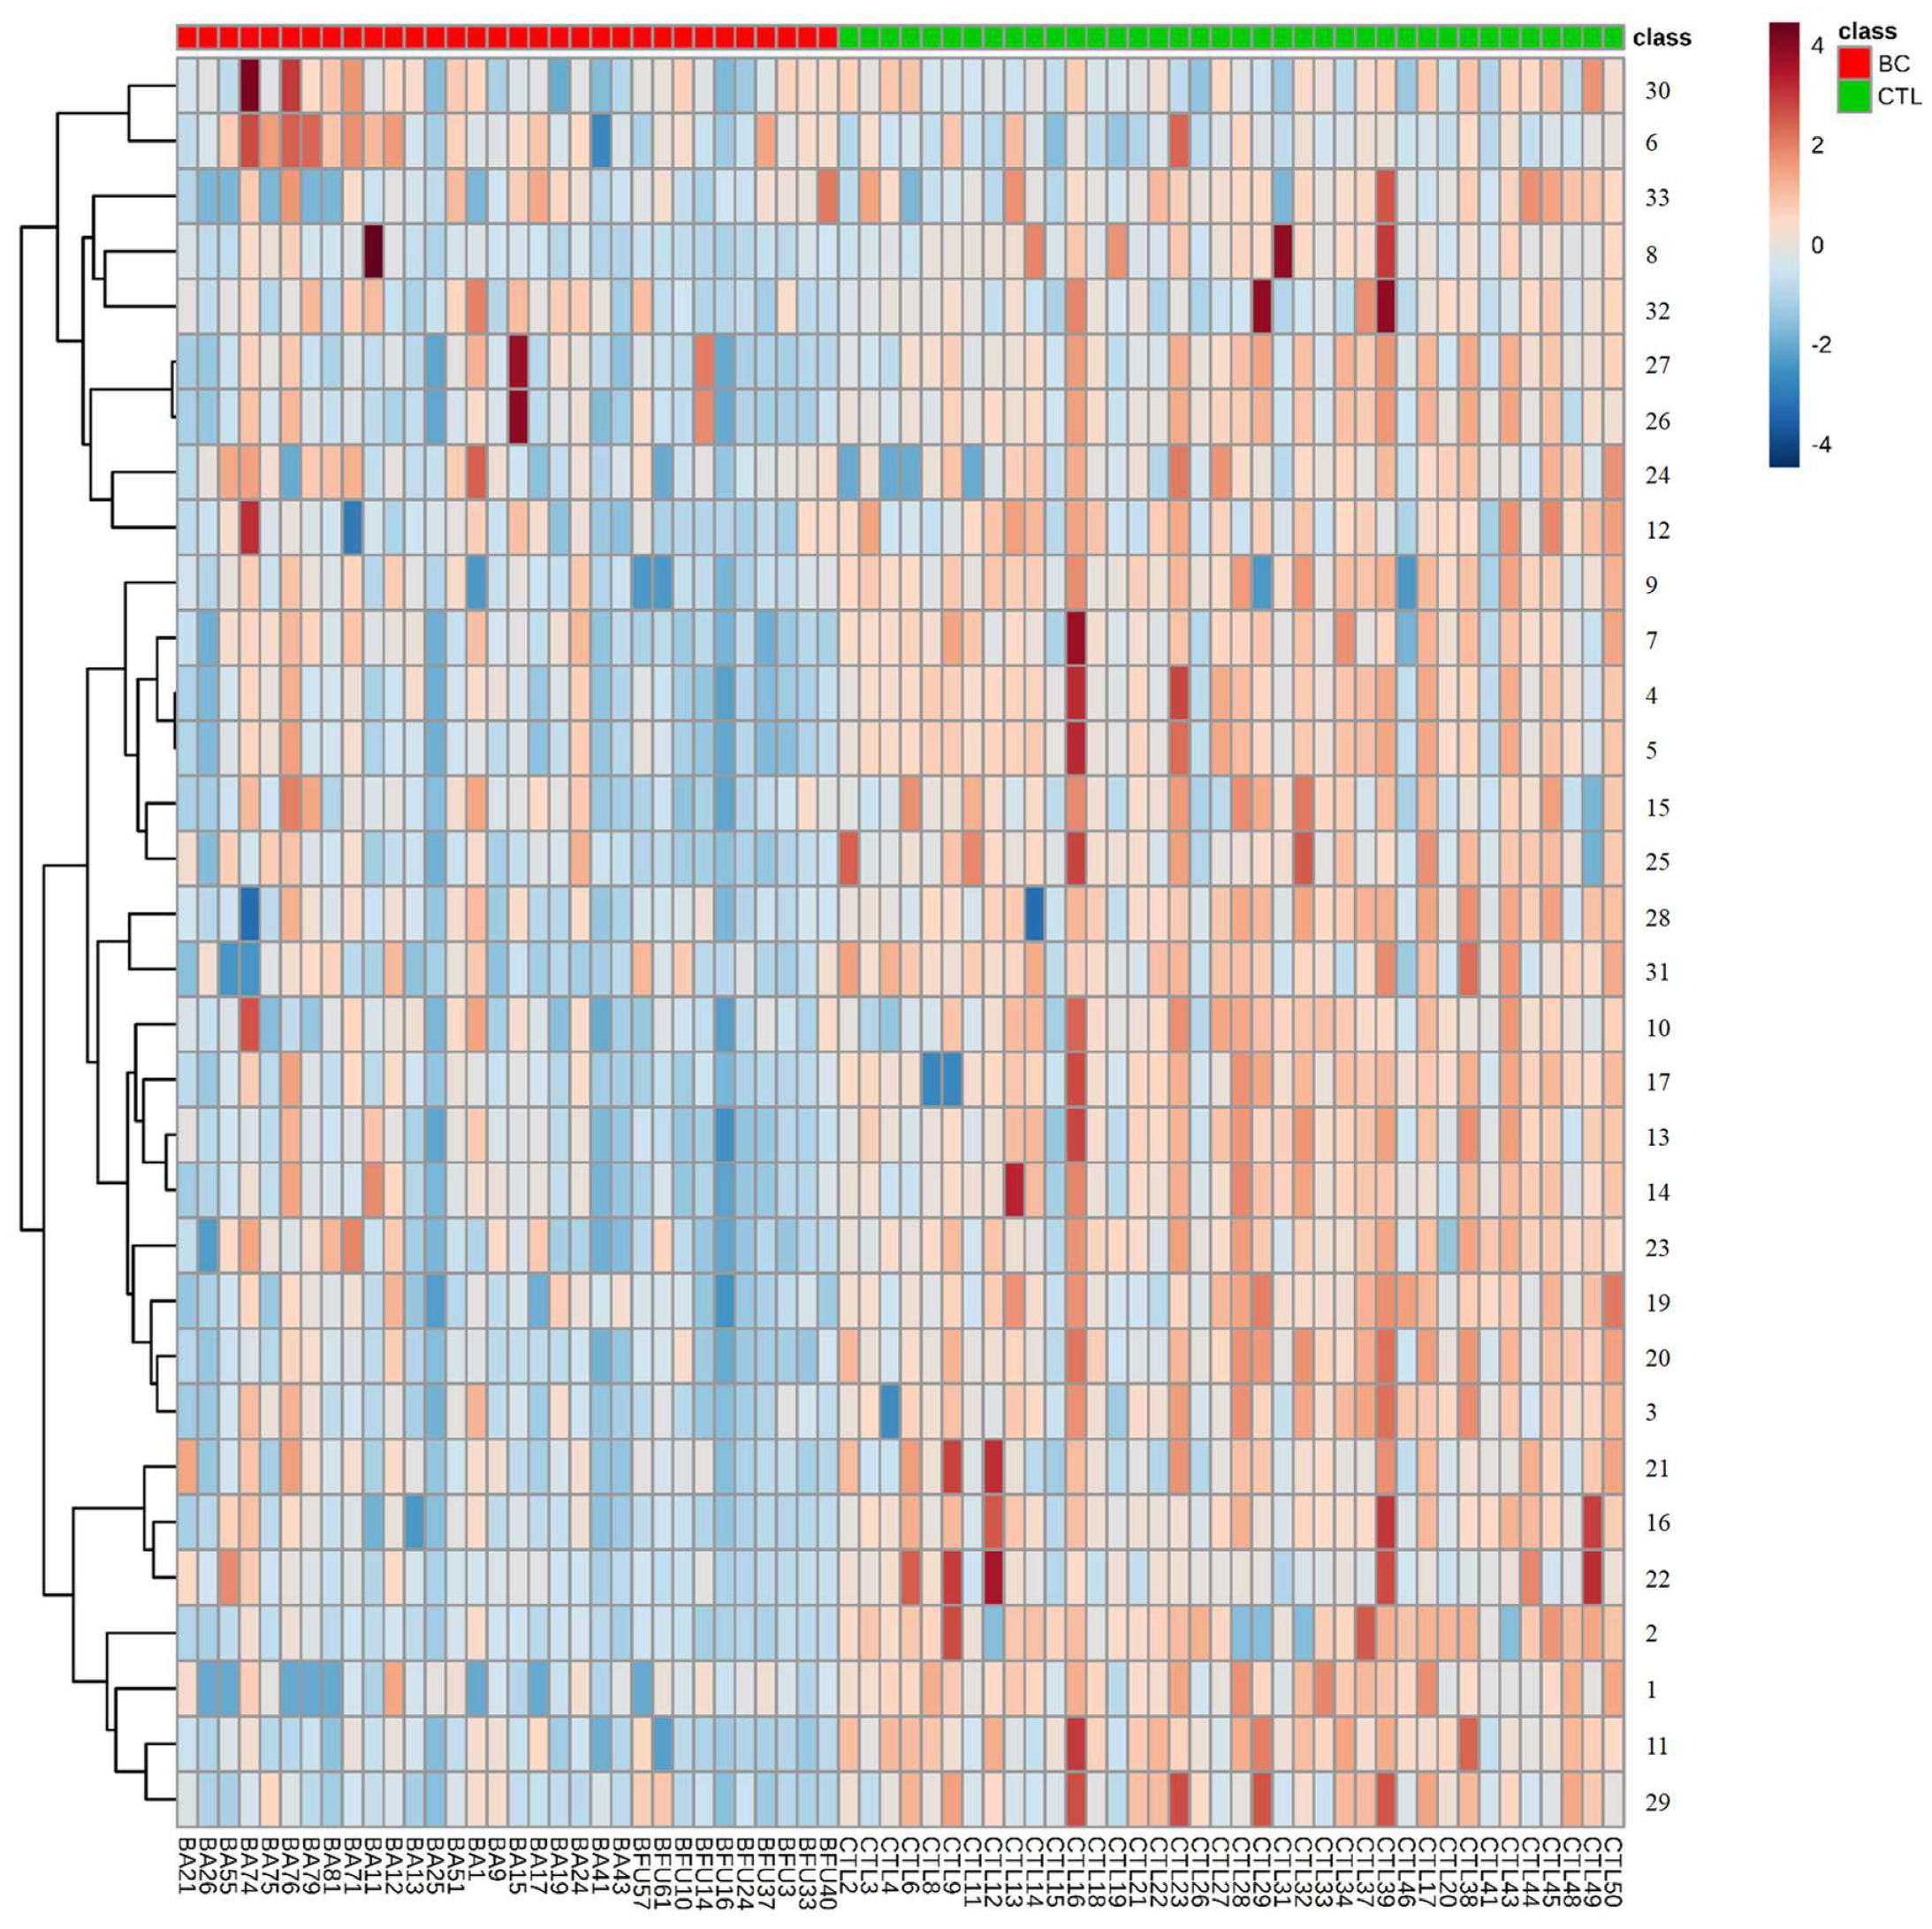
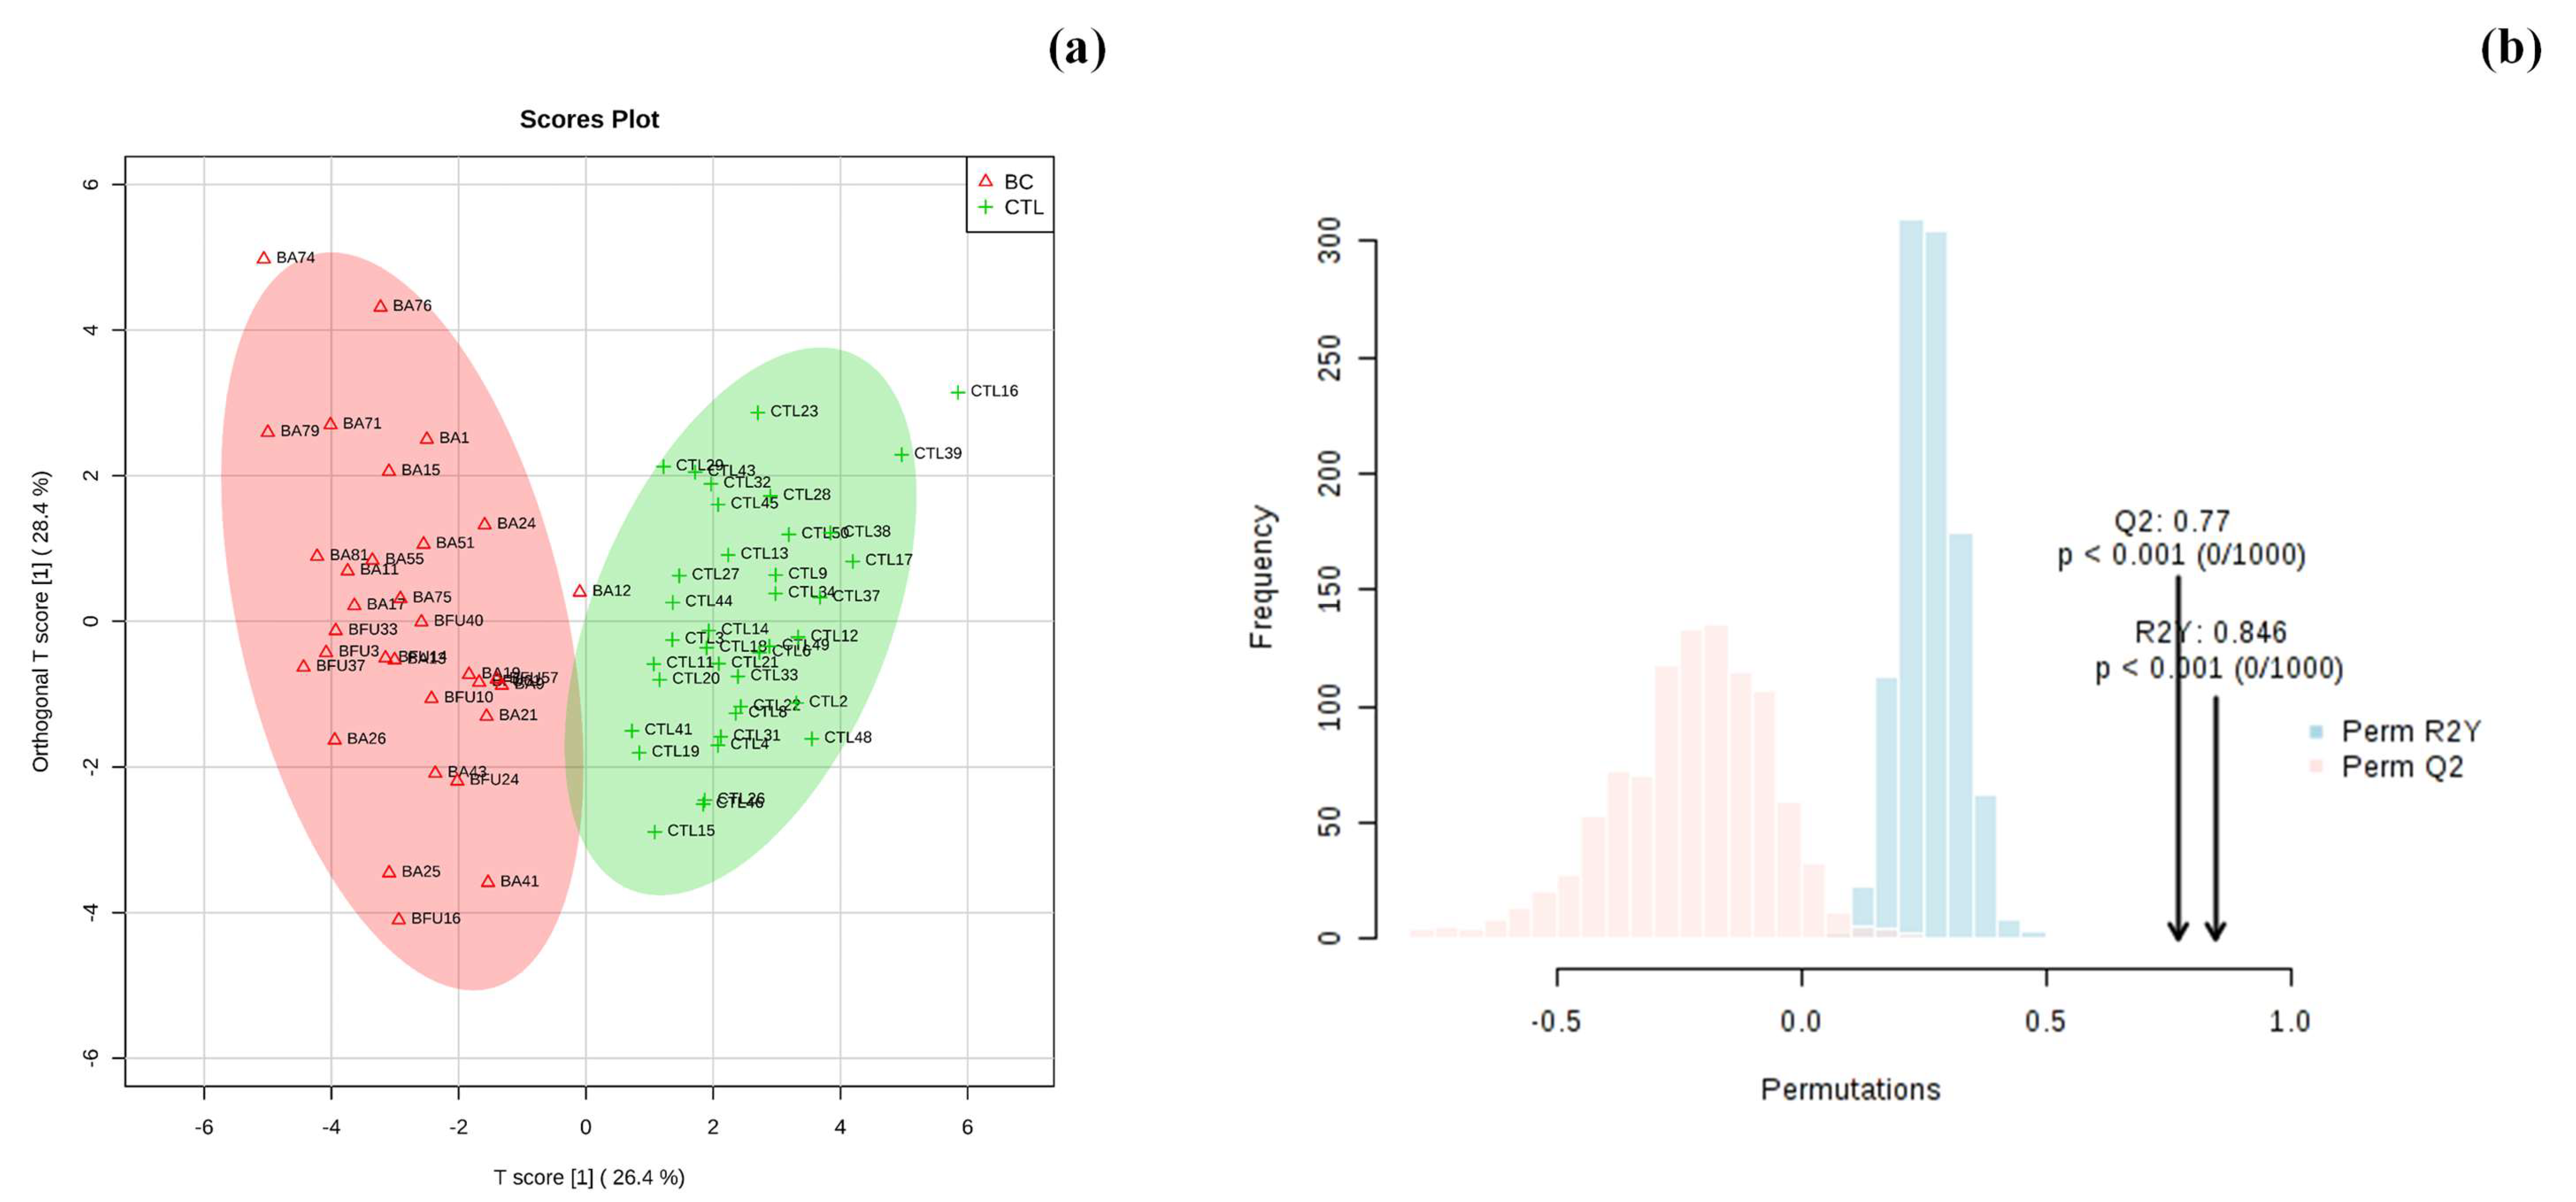
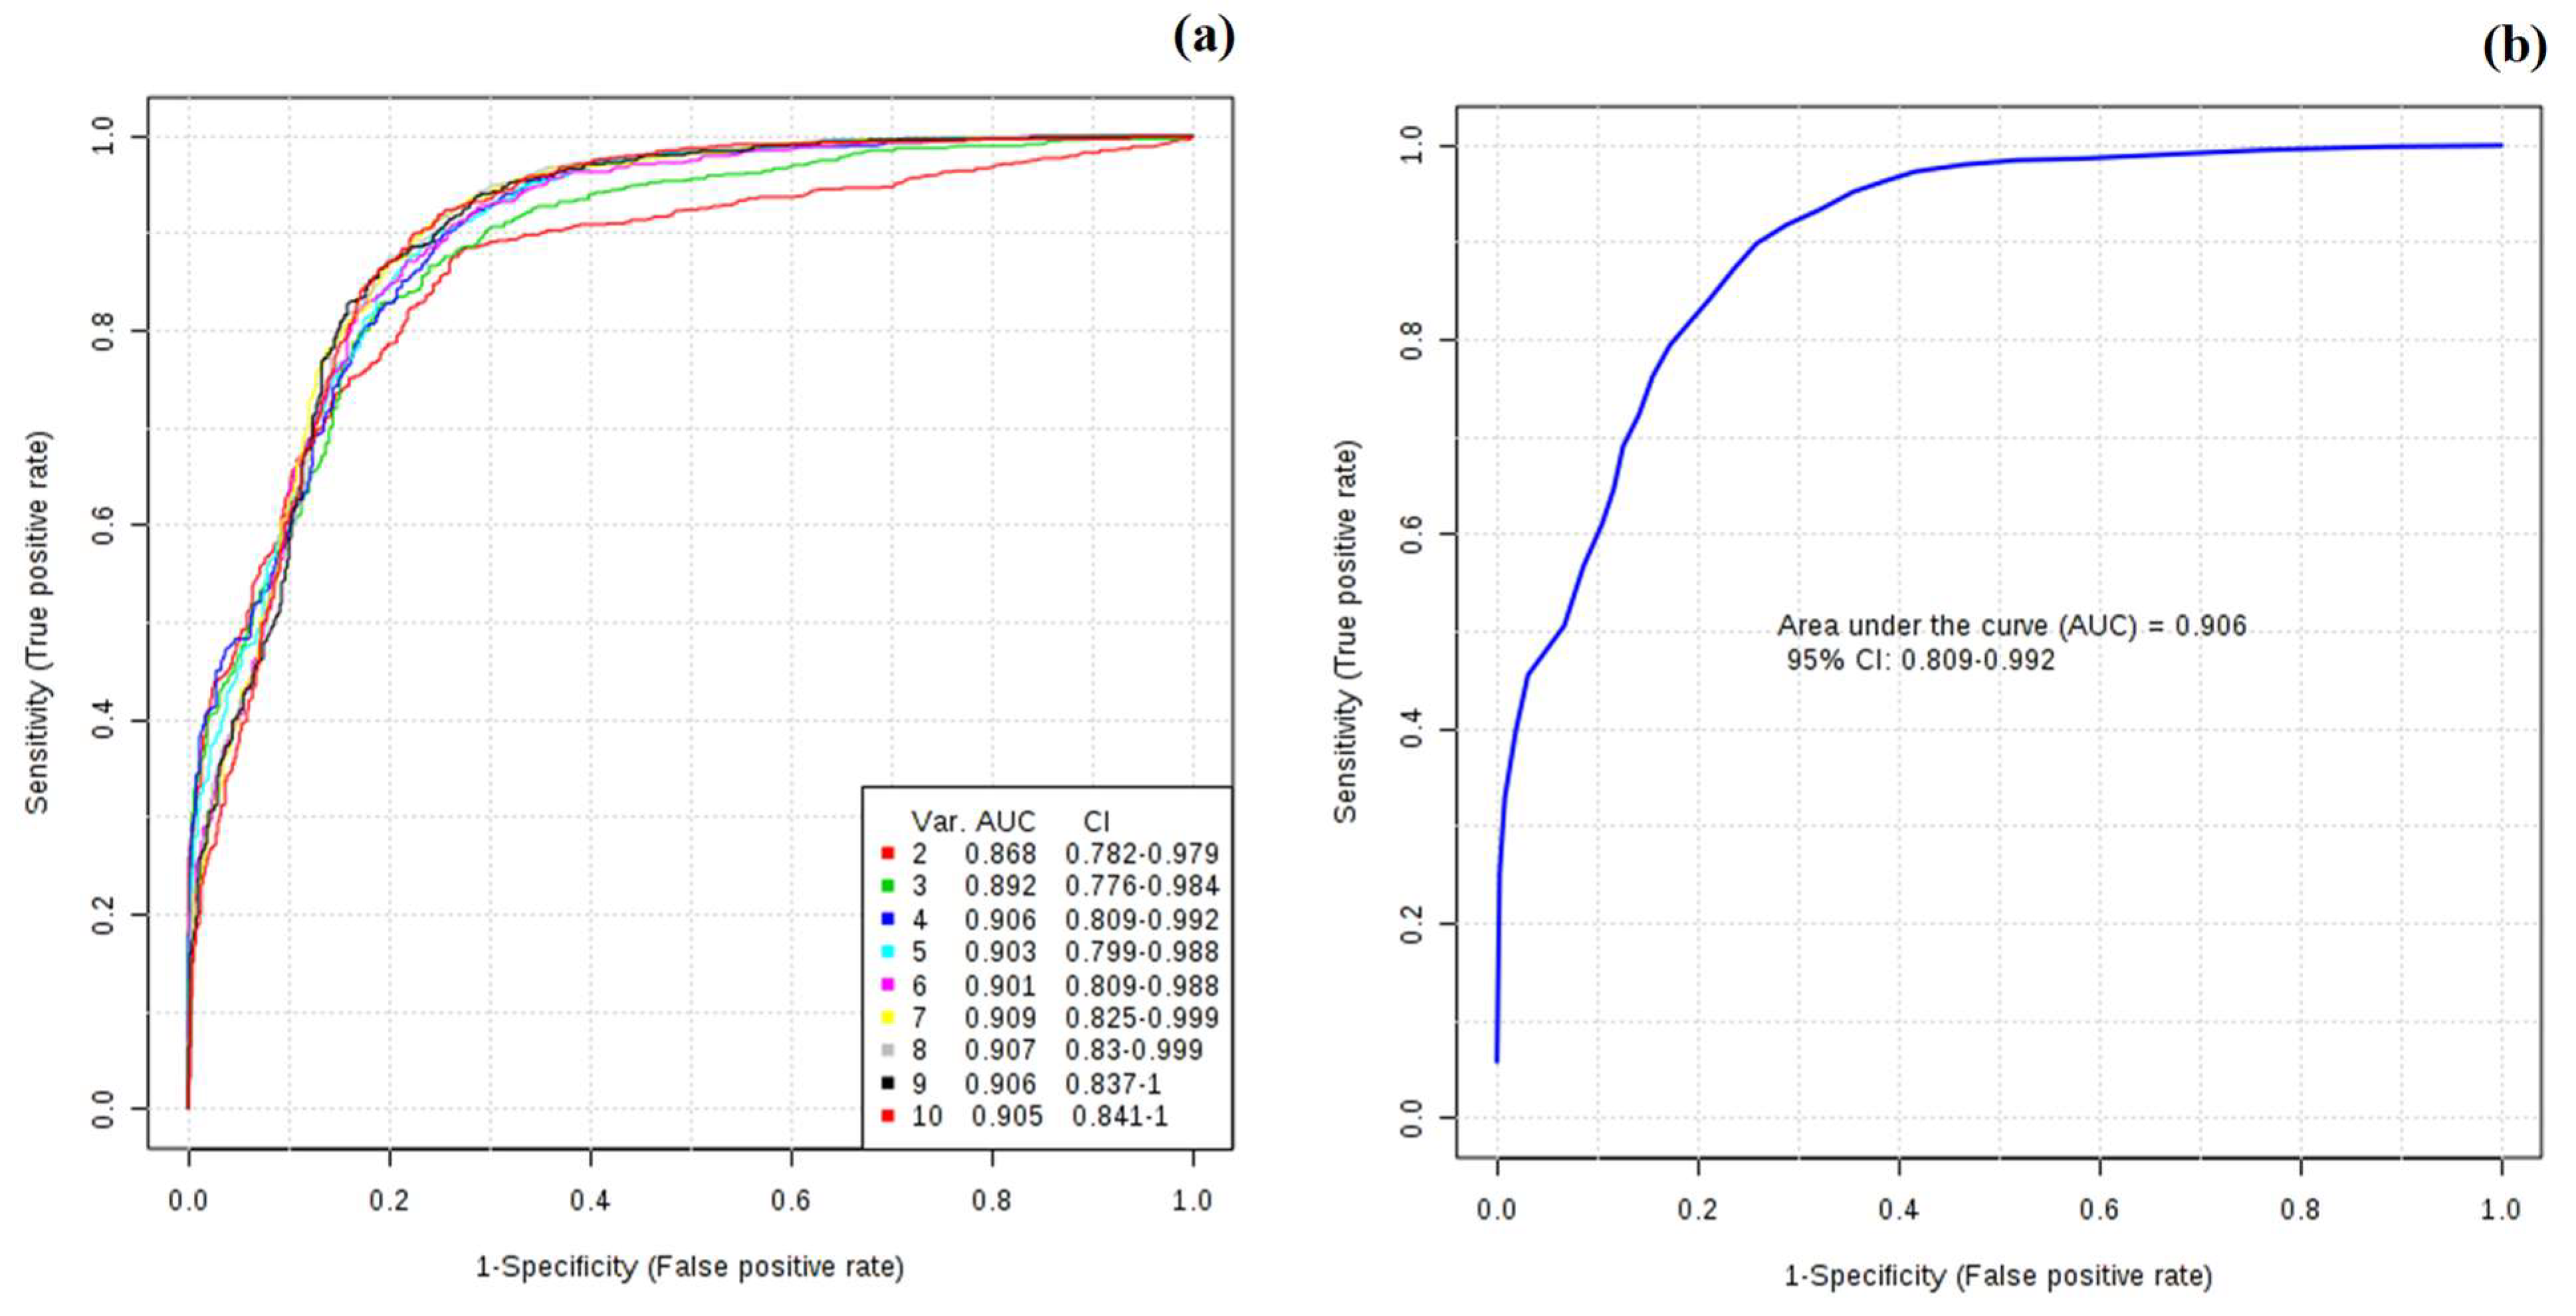
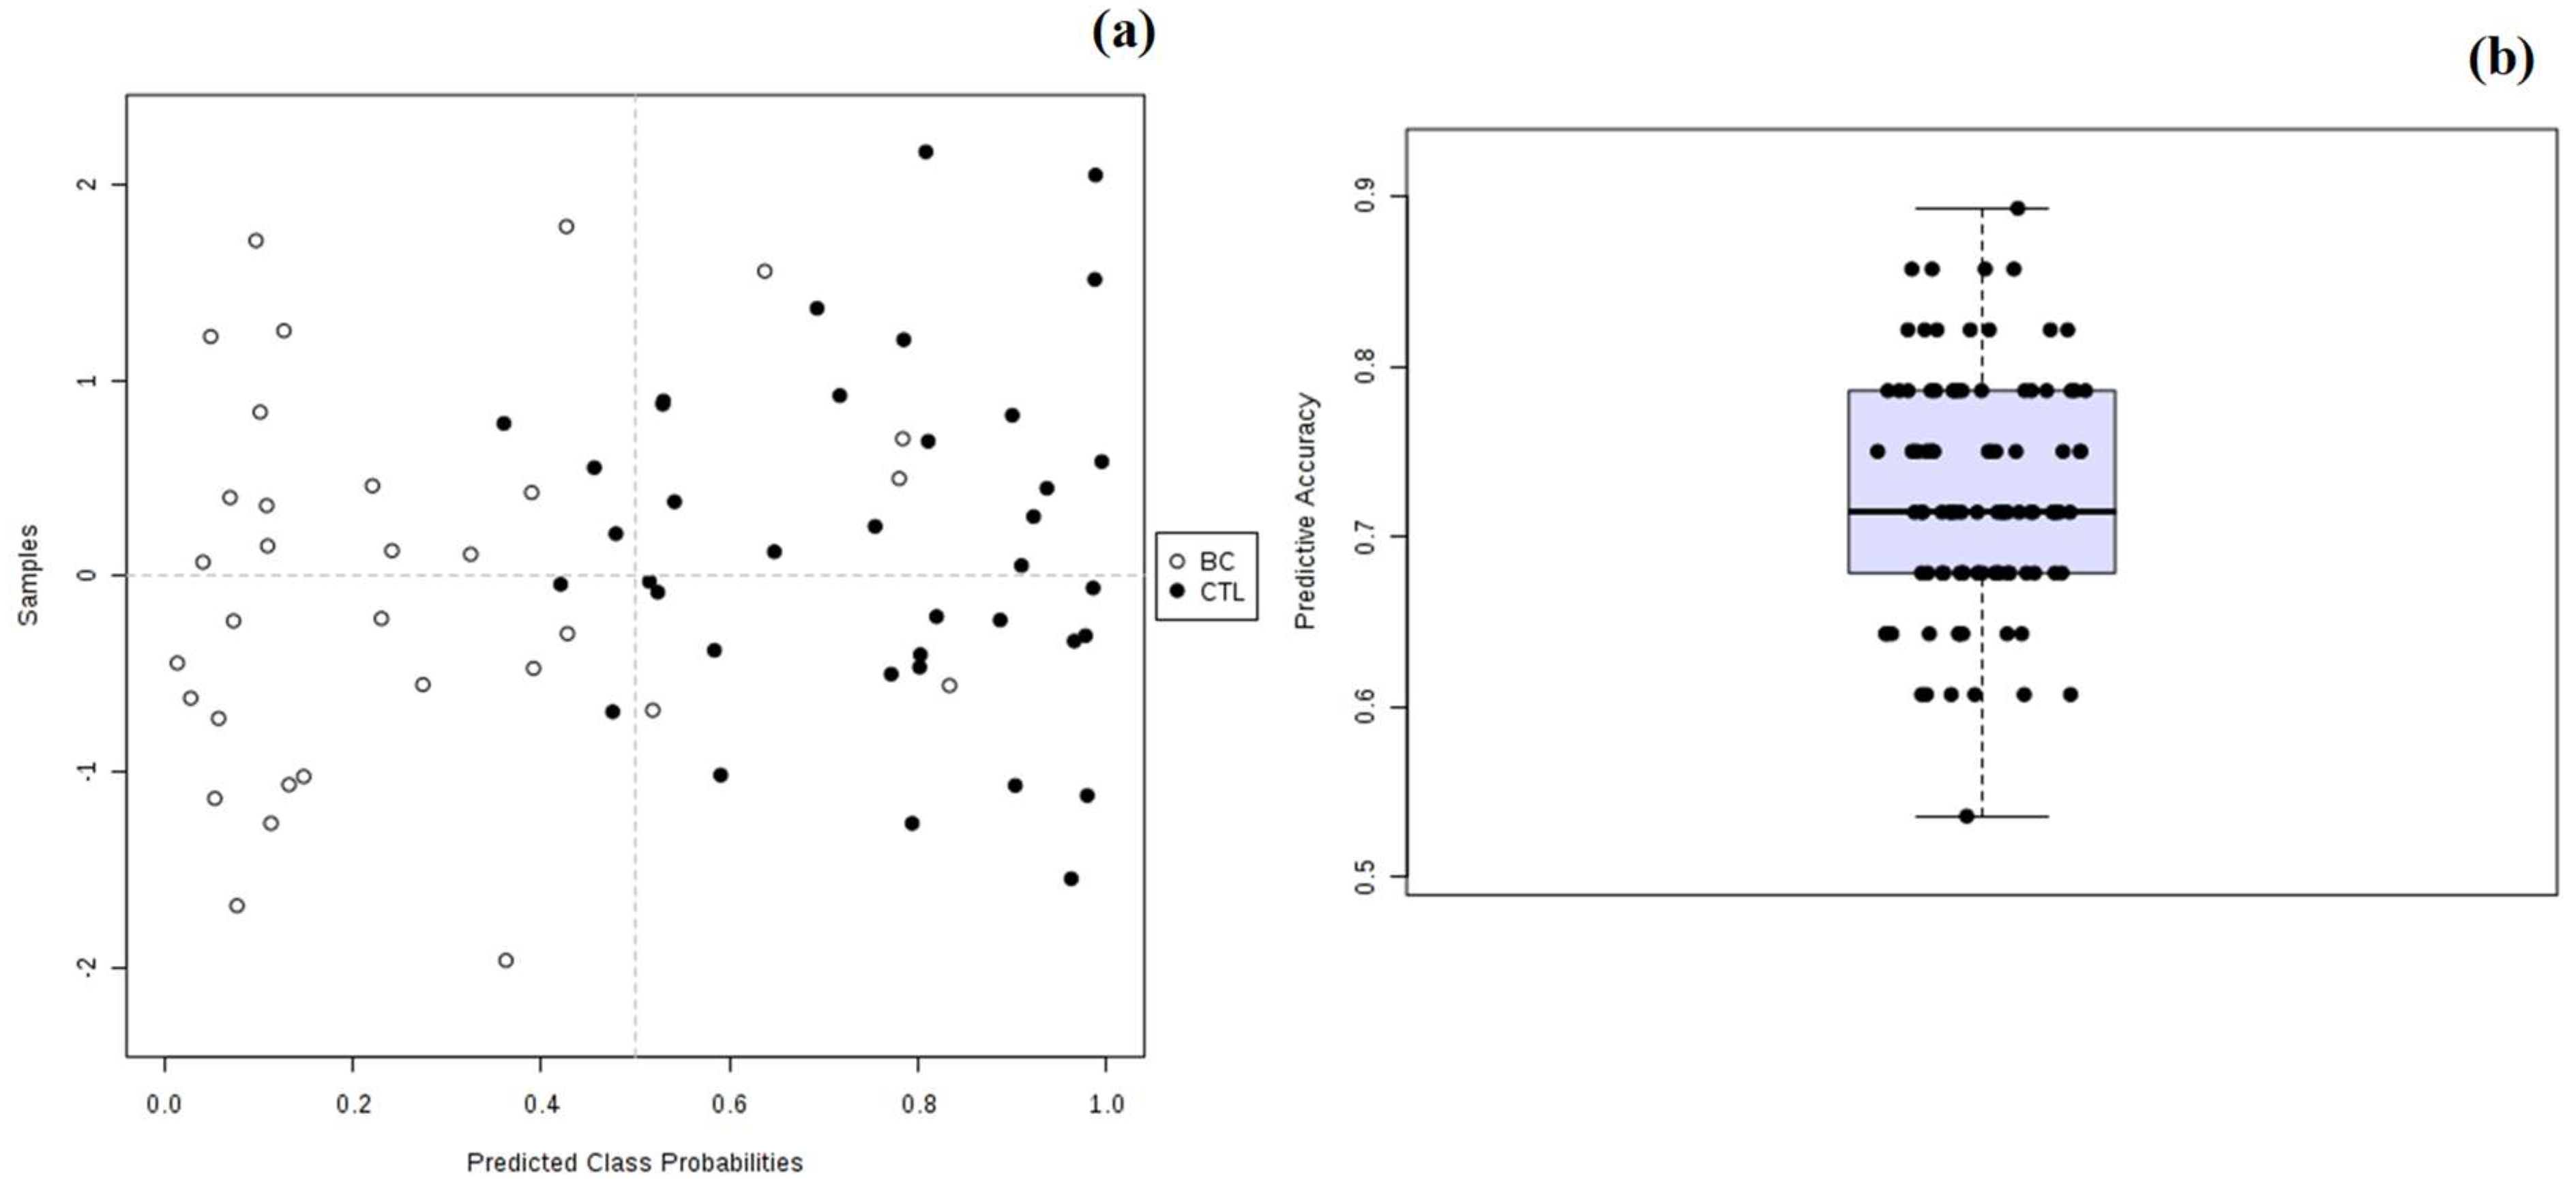
3.2. Multivariate Statistical Analysis of Urinary Metabolomic Profile

The first step before performing multivariate statistical analysis was to verify the normal distribution of the urinary metabolomic profile dataset using the Kolmogorov–Smirnov test (Table 2). All samples under analysis exhibited a normal distribution within each assigned group (p > 0.05). The samples under analysis that exhibited a normal distribution within each assigned group (those with p-values > 0.05 in the K–S column) were tested using the t-test to compare the means of the two groups (BC and CTL). For the samples that rejected the normality assumption (p-values < 0.05), the Mann–Whitney–Wilcoxon test was applied. The corresponding p-values associated with these tests are presented in a mean comparison column in Table 2. Furthermore, to obtain a reliable dataset to apply multivariate analysis, the dataset was evaluated to exclude the metabolites that had an FO < 90%. The dataset used to perform the statistical analysis also excluded creatinine, as mentioned above, as its concentration is dependent on age, gender, and disease status, decreasing with age and varying throughout the day. Regarding creatinine, relative concentrations obtained, and their respective differences between groups under study, this metabolite might be considered a potential artefact given that creatinine values may be altered, as the generation of creatinine may not be simply a product of muscle mass but influenced by muscle function, muscle composition, activity, diet, and health status [54]. Based on this, the dataset composed of 33 metabolites and 70 samples (32 BC and 38 CTL) that fulfilled this condition was subjected to principal component analysis (PCA). PCA as an unsupervised method was performed to visualize the similarities/differences between urine sample profiles of groups in this study. In this step, the samples were analyzed individually, e.g. without classification, according to the groups. A PCA score plot and loading plot from urine samples are presented in Supplementary Figure S1a,b. Although the projection of the variance between samples was performed without classification, it is possible to observe that the PCA of urine samples from BC patients and those from CTL presented a tendency for the formation of two clusters across the first principal component (PC1) that explains 54.6 % of the total variance. Most of the metabolites exhibited enormous importance in the variance projection of samples. Then, the partial least square-discriminant analysis (PLS-DA) was used as a supervised clustering method to maximize the separation between the groups and demonstrated that the samples tended to be grouped according with health condition of subject (BC and CTL) through its variance/covariance along the first component. Ten differently expressed metabolites that exhibited a variable importance in a projection (VIP) score greater than 1 were identified: creatine, glycine, serine, dimethylamine, trimethylamine N-oxide, α-hydroxyisobutyrate, mannitol, glutamine, cis-aconitate, and trigonelline (Figure 2a–d).
Many of these metabolites were already identified in various cancer types, including lung [12,55], breast, ovarian [3,5], bladder [56], and gastric cancers [57], in previous reports. Additionally, Zhou et al. [58] performed a metabonomics study using serum and urine from BC patients based on NMR, where citrate, phenylacetylglycine, and guanidoacetate exhibited significance in the discrimination of BC patients from healthy volunteers. In addition, Slupsky et al. [3] accomplished a study using urine from breast and ovarian cancer patients to discover metabolites for an early diagnosis. The authors found that certain intermediates of the tricarboxylic acid cycle and metabolites relating to energy metabolism, amino acids, and gut microbial metabolism, were perturbed. With regard to amino acids as raw materials of protein synthesis and catabolism products in vivo, their changes, whether in composition and concentration, can reflect the metabolic status of patients [58]. In addition, Cala et al. [59] established that the urinary and lipid profiles of Hispanic women also identified some of the same metabolites of this study, namely amino acids (valine, alanine, glycine, threonine), their levels being decreased in BC patients when compared to controls. This might be related to the requirement of amino acids in cancer metabolism in order to facilitate proliferation and cancer progression [60].
Moreover, a heat map was constructed using Pearson’s correlation, providing intuitive visualization of the data set. The heat map contained the metabolites and was used to identify samples or features that are unusually high or low (Figure 3). As noted in Figure 3, the higher relative concentrations for most metabolites were found in the CTL group whereas the lowest relative concentrations were noted in the BC group.
Also, a heat map was generated for the dataset using Pearson’s correlation, providing an immediate visualization of data and possible correlations between samples (Figure 3).
Additionally, orthogonal partial least square-discriminant (OPLS-DA) analysis was applied to the urinary metabolomic profile dataset to maximize the separation between the CTL and BC groups. Figure 4a,b presents the scores and the loading plots for the OPLS-DA analysis, where it can be observed that a good separation was achieved with 54.8 % of total variance.
The OPLS-DA tool provides insights into the separation between the groups, demonstrating which variables are responsible for class discrimination. The robustness of the model was tested using a random permutation test with 1000 permutations (Figure 4b). This test yielded an R2 (that represents the goodness of fit) of 0.846 and a Q2 (that represents the predictive ability) of 0.770, indicating that the model is not over fitted and has a good predictive ability to distinguish between the groups under study.
Moreover, receiver operating characteristic curves (ROCs) were generated for the two groups (CTL-BC) using the 10 identified metabolites with VIP values higher than 1 and are presented in Figure 5a,b.
As noted in the figure, as the number of metabolites increases, the area under the curve (AUC) also increases. Thus, using only 4 metabolites, the AUC value obtained was 0.91 for the CTL–BC, demonstrating the higher sensitivity/specificity to distinguish the groups. The metabolites with significance were creatine, glycine, serine, and trimethylamine N-oxide. These results are in accordance with the literature, where Xia et al. [61] report that an AUC value between 0.9 and 1.0 is excellent, and a value between 0.8 and 0.9 is good. By comparing the results, the values obtained were very good. A greater AUC value indicates a greater ability to distinguish the CTL from the BC group. The AUC can be interpreted as the probability that a randomly selected diseased subject is classified as diseased than a casually selected healthy subject [61].
Moreover, a 10-fold cross validation was used to generate a logistic regression model and the performance was calculated according to the equation below.
logit(P) = log(P/(1 − P)) = 0.471 + 1.434 creatine + 1.327 glycine + 0.25 serine + 0.285 trimethylamine N-oxide
where P is Pr(y = 1|x). The best threshold (or cutoff) for the predicted P was 0.39 (Tables S1 and S2).
Figure 6a,b show the results obtained for the predicted probabilities using the OPLS-DA model and the average of the predictive accuracy for the same model, where it can be observed that the model allowed good classification of samples (>90%). Moreover, 14 samples without known labels were processed together with the ones with known labels in order to obtain the probability of class labels, as presented in Table S3.
Most of the cases were classified in their respective group except for CTL49, BA71 and BA1, with a probability score ranging from 0.729 to 0.829 (Table S3).
Finally, the metabolic pathway analysis was performed to determine which pathways were altered in the groups under study.
Figure 7a,b presents the impacted pathways in the CTL-BC groups, respectively. The most impacted metabolic pathways were the glycine metabolism, the glutamate metabolism, the butanoate metabolism, glycolysis, the citrate cycle (TCA cycle), the taurine metabolism and the pyruvate metabolism, indicated by the red and yellow colors. It can be also highlighted that the pathway with the highest impact was the glycine metabolism (Figure 6b). The alterations are related to the down-regulation of the tricarboxylic acid (TCA) cycle (e.g., the Warburg effect) and the increased energy request in tumors [62]. It is well known that cancer cells convert more glucose into lactic acid than normal cells even in aerobic conditions, leading to a disturbance of the TCA cycle and their intermediates.
Based on these results, a successful differentiation and discrimination of samples was achieved between the CTL and BC groups. The results indicate that the 1H NMR urinary profile represents a useful approach to identifying potential BC biomarkers.

4. Conclusions

This study assessed the metabolomic urinary profile of BC patients in active and follow-up stages compared with that in healthy volunteers, using 1H NMR combined with multivariate statistical tools (PCA, PLS-DA, and OPLS-DA) that were applied to two groups (BC and CTL). Thirty-three metabolites were identified and quantified using Chenomx software. Multivariate statistical analysis revealed some metabolites were significantly altered in BC patients. Of the metabolites detected, creatine, glycine, serine, dimethylamine, trimethylamine N-oxide, α-hydroxyisobutyrate, mannitol, glutamine, cis-aconitate, and trigonelline exhibited the highest sensitivities and specificities to discriminate BC patients from healthy controls. A plot analysis revealed a metabolomic biosignature comprising an array of several biochemical pathways altered in BC patients. A metabolic pathway analysis indicated that the discriminatory metabolites potentially originated from several dysregulated pathways in BC: the glycine metabolism, the glutamate metabolism, the butanoate metabolism, glycolysis, the citrate cycle (TCA cycle), the taurine metabolism and the pyruvate metabolism. Moreover, although this was a small sample cohort without discrimination against BC subtypes, the results obtained were promising, indicating the usefulness of endogenous metabolites for biomarker discovery metabolites and the need to investigate the related metabolomic pathways in order to improve the diagnostic tools of BC.

Supplementary Materials

The following are available online at https://www.mdpi.com/2218-1989/9/11/269/s1, Figure S1: Scores plot (a) and loading plots (b) of PCA from urine samples based on 33 metabolites. For numbers identification see Table 2.

Author Contributions

C.L.S.: performed the design of experiments, urine assays, data analysis and manuscript preparation. A.O.: optimization of NMR experimental parameters. P.S.: performed the statistical analysis and interpretation. R.P.: performed the design of experiments and data analysis. H.T.: co-supervisor of the work, conception of studies, experimental design, and manuscript preparation. J.S.C.: main supervisor of the work, conception of studies, experimental design, and manuscript preparation.

Acknowledgments

This work was supported by FCT-Fundação para a Ciência e a Tecnologia (project PEstOE/QUI/UI0674/2019, CQM, Portuguese Government funds, and INNOINDIGO/0001/2015), Madeira 14-20 Program (project PROEQUIPRAM - Reforço do Investimento em Equipamentos e Infraestruturas Científicas na RAM-M1420-01-0145-FEDER-000008) and by ARDITI-Agência Regional para o Desenvolvimento da Investigação Tecnologia e Inovação through the project M1420-01-0145-FEDER-000005-Centro de Química da Madeira-CQM + (Madeira 14-20). The authors also acknowledge the FCT for the Ph.D grant SFRH/BD/97039/2013 and PostDoctoral fellowship SFRH/BPD/97387/2013 given to Catarina L. Silva and Rosa Perestrelo. Pedro Silva acknowledges ARDITI through the Ph.D grant under the M1420 Project-09-5369-FSE-000001.

Conflicts of Interest

The authors declare no conflict of interest.

References

  1. Bray, F.; Ferlay, J.; Soerjomataram, I.; Siegel, R.L.; Torre, L.A.; Jemal, A. Global cancer statistics 2018: GLOBOCAN estimates of incidence and mortality worldwide for 36 cancers in 185 countries. CA Cancer J. Clin. 2018, 68, 394–424. [Google Scholar] [CrossRef] [PubMed] [Green Version]
  2. Kretschmer, C.; Sterner-Kock, A.; Siedentopf, F.; Schoenegg, W.; Schlag, P.M.; Kemmner, W. Identification of early molecular markers for breast cancer. Mol. Cancer 2011, 10, 15. [Google Scholar] [CrossRef] [PubMed]
  3. Slupsky, C.M.; Steed, H.; Wells, T.H.; Dabbs, K.; Schepansky, A.; Capstick, V.; Faught, W.; Sawyer, M.B. Urine metabolite analysis offers potential early diagnosis of ovarian and breast cancers. Clin. Cancer Res. 2010, 16, 5835–5841. [Google Scholar] [CrossRef] [PubMed]
  4. Duffy, M.J. Serum Tumor Markers in Breast Cancer: Are They of Clinical Value? Clin. Chem. 2006, 52, 345–351. [Google Scholar] [CrossRef] [Green Version]
  5. Asiago, V.M.; Alvarado, L.Z.; Shanaiah, N.; Gowda, G.A.N.; Owusu-Sarfo, K.; Ballas, R.A.; Raftery, D. Early Detection of Recurrent Breast Cancer Using Metabolite Profiling. Cancer Res. 2010, 70, 8309–8318. [Google Scholar] [CrossRef] [Green Version]
  6. Brase, J.C.; Wuttig, D.; Kuner, R.; Sültmann, H. Serum microRNAs as non-invasive biomarkers for cancer. Mol. Cancer 2010, 9, 306. [Google Scholar] [CrossRef]
  7. Kim, Y.; Koo, I.; Jung, B.H.; Chung, B.C.; Lee, D. Multivariate classification of urine metabolome profiles for breast cancer diagnosis. BMC Bioinform. 2010, 11, S4. [Google Scholar] [CrossRef]
  8. Woo, H.M.; Kim, K.M.; Choi, M.H.; Jung, B.H.; Lee, J.; Kong, G.; Nam, S.J.; Kim, S.; Bai, S.W.; Chung, B.C. Mass spectrometry based metabolomic approaches in urinary biomarker study of women’s cancers. Clin. Chim. Acta 2009, 400, 63–69. [Google Scholar] [CrossRef]
  9. Nam, H.; Chung, B.C.; Kim, Y.; Lee, K.; Lee, D. Combining tissue transcriptomics and urine metabolomics for breast cancer biomarker identification. Bioinformatics 2009, 25, 3151–3157. [Google Scholar] [CrossRef] [Green Version]
  10. Henneges, C.; Bullinger, D.; Fux, R.; Friese, N.; Seeger, H.; Neubauer, H.; Laufer, S.; Gleiter, C.H.; Schwab, M.; Zell, A.; et al. Prediction of breast cancer by profiling of urinary RNA metabolites using Support Vector Machine-based feature selection. BMC Cancer 2009, 9, 104. [Google Scholar] [CrossRef]
  11. Abaffy, T.; Möller, M.; Riemer, D.D.; Milikowski, C. A Case Report-Volatile Metabolomic Signature of Malignant Melanoma using Matching Skin as a Control. J. Cancer Sci. Ther. 2011, 03, 140–144. [Google Scholar] [CrossRef] [PubMed]
  12. Carrola, J.; Rocha, C.M.; Barros, A.S.; Gil, A.M.; Goodfellow, B.J.; Carreira, I.M.; Bernardo, J.; Gomes, A.; Sousa, V.; Carvalho, L.; et al. Metabolic signatures of lung cancer in biofluids: NMR-based metabonomics of urine. J. Proteome Res. 2011, 10, 221–230. [Google Scholar] [CrossRef]
  13. Abaffy, T.; Möller, M.G.; Riemer, D.D.; Milikowski, C.; DeFazio, R.A. Comparative analysis of volatile metabolomics signals from melanoma and benign skin: A pilot study. Metabolomics 2013, 9, 998–1008. [Google Scholar] [CrossRef]
  14. Filipiak, W.; Filipiak, A.; Sponring, A.; Schmid, T.; Zelger, B.; Ager, C.; Klodzinska, E.; Denz, H.; Pizzini, A.; Lucciarini, P.; et al. Comparative analyses of volatile organic compounds (VOCs) from patients, tumors and transformed cell lines for the validation of lung cancer-derived breath markers. J. Breath Res. 2014, 8, 027111. [Google Scholar] [CrossRef] [PubMed]
  15. Filipiak, W.; Sponring, A.; Filipiak, A.; Ager, C.; Schubert, J.; Miekisch, W.; Amann, A.; Troppmair, J. TD-GC-MS analysis of volatile metabolites of human lung cancer and normal cells in vitro. Cancer Epidemiol. Biomark. Prev. 2010, 19, 182–195. [Google Scholar] [CrossRef]
  16. Silva, C.L.; Passos, M.; Câmara, J.S. Solid phase microextraction, mass spectrometry and metabolomic approaches for detection of potential urinary cancer biomarkers—A powerful strategy for breast cancer diagnosis. Talanta 2012, 89, 360–368. [Google Scholar] [CrossRef] [PubMed]
  17. Matsumura, K.; Opiekun, M.; Oka, H.; Vachani, A.; Albelda, S.M.; Yamazaki, K.; Beauchamp, G.K. Urinary Volatile Compounds as Biomarkers for Lung Cancer: A Proof of Principle Study Using Odor Signatures in Mouse Models of Lung Cancer. PLoS ONE 2010, 5, e8819. [Google Scholar] [CrossRef] [PubMed]
  18. Silva, C.L.; Passos, M.; Câmara, J.S. Investigation of urinary volatile organic metabolites as potential cancer biomarkers by solid-phase microextraction in combination with gas chromatography-mass spectrometry. Br. J. Cancer 2011, 105, 1894–1904. [Google Scholar] [CrossRef] [Green Version]
  19. Chen, Y.; Zhang, R.; Song, Y.; He, J.; Sun, J.; Bai, J.; An, Z.; Dong, L.; Zhan, Q.; Abliz, Z. RRLC-MS/MS-based metabonomics combined with in-depth analysis of metabolic correlation network: Finding potential biomarkers for breast cancer. Analyst 2009, 134, 2003. [Google Scholar] [CrossRef]
  20. Gu, H.; Pan, Z.; Xi, B.; Asiago, V.; Musselman, B.; Raftery, D. Principal component directed partial least squares analysis for combining nuclear magnetic resonance and mass spectrometry data in metabolomics: Application to the detection of breast cancer. Anal. Chim. Acta 2011, 686, 57–63. [Google Scholar] [CrossRef] [Green Version]
  21. Oakman, C.; Tenori, L.; Biganzoli, L.; Santarpia, L.; Cappadona, S.; Luchinat, C.; Di Leo, A. Uncovering the metabolomic fingerprint of breast cancer. Int. J. Biochem. Cell Biol. 2011, 43, 1010–1020. [Google Scholar] [CrossRef] [PubMed]
  22. Bu, Q.; Huang, Y.; Yan, G.; Cen, X.; Zhao, Y.L. Metabolomics: A revolution for novel cancer marker identification. Comb. Chem. High Throughput Screen. 2012, 15, 266–275. [Google Scholar] [CrossRef] [PubMed]
  23. Santini, G.; Mores, N.; Penas, A.; Capuano, R.; Mondino, C.; Trové, A.; Macagno, F.; Zini, G.; Cattani, P.; Martinelli, E.; et al. Electronic Nose and Exhaled Breath NMR-based Metabolomics Applications in Airways Disease. Curr. Top. Med. Chem. 2016, 16, 1610–1630. [Google Scholar] [CrossRef] [PubMed]
  24. Figueira, J.; Jonsson, P.; Nordin Adolfsson, A.; Adolfsson, R.; Nyberg, L.; Öhman, A. NMR analysis of the human saliva metabolome distinguishes dementia patients from matched controls. Mol. Biosyst. 2016, 12, 2562–2571. [Google Scholar] [CrossRef] [PubMed] [Green Version]
  25. Frank, A.; Möller, H.M.; Exner, T.E. Toward the Quantum Chemical Calculation of NMR Chemical Shifts of Proteins. 2. Level of Theory, Basis Set, and Solvents Model Dependence. J. Chem. Theory Comput. 2012, 8, 1480–1492. [Google Scholar] [CrossRef] [PubMed]
  26. Zhang, A.; Sun, H.; Qiu, S.; Wang, X. NMR-based metabolomics coupled with pattern recognition methods in biomarker discovery and disease diagnosis. Magn. Reson. Chem. 2013, 51, 549–556. [Google Scholar] [CrossRef] [PubMed]
  27. Alonso, A.; Marsal, S.; Julià, A. Analytical methods in untargeted metabolomics: State of the art in 2015. Front. Bioeng. Biotechnol. 2015, 3, 23. [Google Scholar] [CrossRef]
  28. Zhang, A.; Sun, H.; Wang, P.; Han, Y.; Wang, X. Recent and potential developments of biofluid analyses in metabolomics. J. Proteom. 2012, 75, 1079–1088. [Google Scholar] [CrossRef]
  29. Bingol, K. Recent Advances in Targeted and Untargeted Metabolomics by NMR and MS/NMR Methods. High-Throughput 2018, 7, 9. [Google Scholar] [CrossRef] [PubMed]
  30. Bertram, H.C.; Eggers, N.; Eller, N. Potential of Human Saliva for Nuclear Magnetic Resonance-Based Metabolomics and for Health-Related Biomarker Identification. Anal. Chem. 2009, 81, 9188–9193. [Google Scholar] [CrossRef]
  31. Tiziani, S.; Lopes, V.; Günther, U.L. Early stage diagnosis of oral cancer using 1H NMR-based metabolomics. Neoplasia 2009, 11, 269–276. [Google Scholar] [CrossRef]
  32. Louis, E.; Bervoets, L.; Reekmans, G.; De Jonge, E.; Mesotten, L.; Thomeer, M.; Adriaensens, P. Phenotyping human blood plasma by 1H-NMR: A robust protocol based on metabolite spiking and its evaluation in breast cancer. Metabolomics 2015, 11, 225–236. [Google Scholar] [CrossRef]
  33. Louis, E.; Adriaensens, P.; Guedens, W.; Bigirumurame, T.; Baeten, K.; Vanhove, K.; Vandeurzen, K.; Darquennes, K.; Vansteenkiste, J.; Dooms, C.; et al. Detection of Lung Cancer through Metabolic Changes Measured in Blood Plasma. J. Thorac. Oncol. 2016, 11, 516–523. [Google Scholar] [CrossRef] [Green Version]
  34. Wang, H.; Wang, L.; Zhang, H.; Deng, P.; Chen, J.; Zhou, B.; Hu, J.; Zou, J.; Lu, W.; Xiang, P.; et al. 1H NMR-based metabolic profiling of human rectal cancer tissue. Mol. Cancer 2013, 12, 121. [Google Scholar] [CrossRef]
  35. Lindon, J.C.; Holmes, E.; Lindon, J.C.; Holmes, E. NMR Spectroscopy of Biofluids, Tissues, and Tissue Extracts. In eMagRes; John Wiley & Sons, Ltd.: Chichester, UK, 2008. [Google Scholar]
  36. Beckonert, O.; Monnerjahn, J.; Bonk, U.; Leibfritz, D. Visualizing metabolic changes in breast-cancer tissue using1H-NMR spectroscopy and self-organizing maps. NMR Biomed. 2003, 16, 1–11. [Google Scholar] [CrossRef] [PubMed]
  37. Sitter, B.; Bathen, T.F.; Singstad, T.E.; Fjøsne, H.E.; Lundgren, S.; Halgunset, J.; Gribbestad, I.S. Quantification of metabolites in breast cancer patients with different clinical prognosis using HR MAS MR spectroscopy. NMR Biomed. 2010, 23, 424–431. [Google Scholar] [CrossRef] [PubMed]
  38. Madhu, B.; Dadulescu, M.; Griffiths, J. Artefacts in 1H NMR-based metabolomic studies on cell cultures. Magn. Reson. Mater. Phys. Biol. Med. 2015, 28, 161–171. [Google Scholar] [CrossRef] [PubMed]
  39. Aranibar, N.; Borys, M.; Mackin, N.A.; Ly, V.; Abu-Absi, N.; Abu-Absi, S.; Niemitz, M.; Schilling, B.; Li, Z.J.; Brock, B.; et al. NMR-based metabolomics of mammalian cell and tissue cultures. J. Biomol. NMR 2011, 49, 195–206. [Google Scholar] [CrossRef] [PubMed]
  40. Bradley, S.A.; Ouyang, A.; Purdie, J.; Smitka, T.A.; Wang, T.; Kaerner, A. Fermentanomics: Monitoring Mammalian Cell Cultures with NMR Spectroscopy. J. Am. Chem. Soc. 2010, 132, 9531–9533. [Google Scholar] [CrossRef] [PubMed]
  41. Kostidis, S.; Addie, R.D.; Morreau, H.; Mayboroda, O.A.; Giera, M. Quantitative NMR analysis of intra- and extracellular metabolism of mammalian cells: A tutorial. Anal. Chim. Acta 2017, 980, 1–24. [Google Scholar] [CrossRef] [PubMed]
  42. Wishart, D.S.; Jewison, T.; Guo, A.C.; Wilson, M.; Knox, C.; Liu, Y.; Djoumbou, Y.; Mandal, R.; Aziat, F.; Dong, E.; et al. HMDB 3.0—The Human Metabolome Database in 2013. Nucleic Acids Res. 2012, 41, D801–D807. [Google Scholar] [CrossRef]
  43. Bouatra, S.; Aziat, F.; Mandal, R.; Guo, A.C.; Wilson, M.R.; Knox, C.; Bjorndahl, T.C.; Krishnamurthy, R.; Saleem, F.; Liu, P.; et al. The Human Urine Metabolome. PLoS ONE 2013, 8, e73076. [Google Scholar]
  44. Xia, J.; Wishart, D.S.; Xia, J.; Wishart, D.S. Using MetaboAnalyst 3.0 for Comprehensive Metabolomics Data Analysis. In Current Protocols in Bioinformatics; John Wiley & Sons, Inc.: Hoboken, NJ, USA, 2016; pp. 14.10.1–14.10.91. ISBN 9780471250951. [Google Scholar]
  45. Monteiro, M.S.; Barros, A.S.; Pinto, J.; Carvalho, M.; Pires-Luís, A.S.; Henrique, R.; Jerónimo, C.; Bastos, M.; de Lourdes Bastos, M.; Gil, A.M.; et al. Nuclear Magnetic Resonance metabolomics reveals an excretory metabolic signature of renal cell carcinoma. Sci. Rep. 2016, 6, 37275. [Google Scholar] [CrossRef]
  46. Cross, A.J.; Pollock, J.R.A.; Bingham, S.A. Haem, not protein or inorganic iron, is responsible for endogenous intestinal N-nitrosation arising from red meat. Cancer Res. 2003, 63, 2358–2360. [Google Scholar]
  47. Ohshima, H.; Kawabata, T. Mechanism of N-nitrosodimethylamine formation from trimethylamine and trimethylaminoxide. IARC Sci. Publ. 1978, 19, 143–153. [Google Scholar] [CrossRef]
  48. Awwad, H.M.; Geisel, J.; Obeid, R. Determination of trimethylamine, trimethylamine N-oxide, and taurine in human plasma and urine by UHPLC–MS/MS technique. J. Chromatogr. B 2016, 1038, 12–18. [Google Scholar] [CrossRef]
  49. Chalmers, R.A.; Bain, M.D.; Michelakakis, H.; Zschocke, J.; Iles, R.A. Diagnosis and management of trimethylaminuria (FMO3 deficiency) in children. J. Inherit. Metab. Dis. 2006, 29, 162–172. [Google Scholar] [CrossRef]
  50. Mackay, R.J.; McEntyre, C.J.; Henderson, C.; Lever, M.; George, P.M. Trimethylaminuria: Causes and diagnosis of a socially distressing condition. Clin. Biochem. Rev. 2011, 32, 33–43. [Google Scholar] [PubMed]
  51. Zhao, L.; Dong, M.; Liao, S.; Du, Y.; Zhou, Q.; Zheng, H.; Chen, M.; Ji, J.; Gao, H. Identification of key metabolic changes in renal interstitial fibrosis rats using metabonomics and pharmacology. Sci. Rep. 2016, 6, 27194. [Google Scholar] [CrossRef] [PubMed] [Green Version]
  52. Barr, D.B.; Wilder, L.C.; Caudill, S.P.; Gonzalez, A.J.; Needham, L.L.; Pirkle, J.L. Urinary Creatinine Concentrations in the U.S. Population: Implications for Urinary Biologic Monitoring Measurements. Environ. Health Perspect. 2004, 113, 192–200. [Google Scholar] [CrossRef] [PubMed]
  53. Nankivell, B.J. Abnormal Laboratory Results: Creatinine clearance and the assessment of renal function. Aust. Prescr. 2001, 24, 15–17. [Google Scholar] [CrossRef] [Green Version]
  54. Gowda, S.; Desai, P.B.; Kulkarni, S.S.; Hull, V.V.; Math, A.A.K.; Vernekar, S.N. Markers of renal function tests. N. Am. J. Med. Sci. 2010, 2, 170–173. [Google Scholar]
  55. Wang, L.; Tang, Y.; Liu, S.; Mao, S.; Ling, Y.; Liu, D.; He, X.; Wang, X. Metabonomic profiling of serum and urine by (1)H NMR-based spectroscopy discriminates patients with chronic obstructive pulmonary disease and healthy individuals. PLoS ONE 2013, 8, e65675. [Google Scholar] [CrossRef] [PubMed]
  56. Srivastava, S.; Roy, R.; Singh, S.; Kumar, P.; Dalela, D.; Sankhwar, S.N.; Goel, A.; Sonkar, A.A. Taurine–A possible fingerprint biomarker in non-muscle invasive bladder cancer: A pilot study by 1H NMR spectroscopy. Cancer Biomark. 2010, 6, 11–20. [Google Scholar] [CrossRef] [PubMed]
  57. Jung, J.; Jung, Y.; Bang, E.J.; Cho, S.; Jang, Y.J.; Kwak, J.M.; Ryu, D.H.; Park, S.; Hwang, G.S. Noninvasive Diagnosis and Evaluation of Curative Surgery for Gastric Cancer by Using NMR-based Metabolomic Profiling. Ann. Surg. Oncol. 2014, 21, 736–742. [Google Scholar] [CrossRef] [PubMed]
  58. Zhou, J.; Wang, Y.; Zhang, X.; Zhou, J.; Wang, Y.; Zhang, X.; Zhou, J.; Wang, Y.; Zhang, X. Metabonomics studies on serum and urine of patients with breast cancer using 1H-NMR spectroscopy. Oncotarget 2017, 5–14. [Google Scholar]
  59. Cala, M.; Aldana, J.; Sánchez, J.; Guio, J.; Meesters, R.J.W. Urinary metabolite and lipid alterations in Colombian Hispanic women with breast cancer: A pilot study. J. Pharm. Biomed. Anal. 2018, 152, 234–241. [Google Scholar] [CrossRef] [PubMed]
  60. Cha, Y.J.; Kim, E.S.; Koo, J.S. Amino acid transporters and glutamine metabolism in breast cancer. Int. J. Mol. Sci. 2018, 19, 907. [Google Scholar] [CrossRef]
  61. Xia, J.; Broadhurst, D.I.; Wilson, M.; Wishart, D.S. Translational biomarker discovery in clinical metabolomics: An introductory tutorial. Metabolomics 2013, 9, 280–299. [Google Scholar] [CrossRef] [PubMed]
  62. Mishra, P.; Ambs, S. Metabolic signatures of human breast cancer. Mol. Cell. Oncol. 2015, 2, e992217. [Google Scholar] [CrossRef] [PubMed] [Green Version]
Figure 1. Typical 400 MHz representative urine 1H NMR spectrum from a BC patient, referenced to TSP (δ 0.00 ppm). For peak identification please see Table 2.
Metabolites 09 00269 g001
Figure 2. (a) Loading score plots of partial least square discriminant analysis (PLS-DA), and (b) VIP values of metabolites obtained by 1H NMR analysis of urine samples from the two groups in study. For number identification, see Table 2.
Metabolites 09 00269 g002
Figure 3. Heat map visualization and hierarchical clustering analysis by Pearson’s distance analysis.
Metabolites 09 00269 g003
Figure 4. (a) Loading score plots of orthogonal projection to latent structure discriminant analysis (OPLS-DA), and (b) model validation by the permutation test based on 1000 permutations of metabolites obtained by 1H NMR analysis of urine samples from the two groups under study. The p-value based on permutation was p < 0.001 (0/1000).
Metabolites 09 00269 g004
Figure 5. Receiver operating characteristic (ROC) curves for the predictive model. (a) A combination model calculated from the logistic regression analysis using the 10 metabolites selected by the VIP (>1.0) values, (b) ROC curves for the top 4 metabolites (creatine, glycine, trimethylamine N-oxide, and serine) with the highest ability to discriminate BC patients against CTL.
Metabolites 09 00269 g005
Figure 6. (a) Plot of the predicted class probabilities for all samples using the OPLS-DA biomarker model based on AUC and (b) box plot of the predictive accuracy (with an average of 0.910) of the biomarker model based on 100 cross validations.
Metabolites 09 00269 g006
Figure 7. (a) The metabolome view map of significant altered metabolic pathways observed in urine from BC and CTL groups, and (b) metabolic pathways (x-axis) with highest impact that include the most promising potential BC biomarkers identified in this study.
Metabolites 09 00269 g007
Table 1. List of collected urine samples from breast cancer patients and healthy individuals (controls).
Sample GroupN° Urine SamplesAge Range/YearsMean Age ± SD 1
Breast Cancer (BC)n = 4040–7459 ± 10
Control (CTL)n = 3840–7253 ± 8
1 SD: standard deviation.
Table 2. Metabolites found in urine samples from breast cancer (BC) patients and healthy controls (CTL) (n = 3, % RSD <2).
Peak n°Metaboliteδ (ppm)Relative Concentrations (mM) Variation K-S 3 (Normality) FO (%) 6
CTLBCCTLBCMean Comparison 5CTLBC
MultiplicityMin 1Max 2AverageMinMaxAverageStatistic 4p-ValueStatisticp-Value
6α-hydroxyisobutyrate1.35 (s) 71.216.643.940.150.890.550.1180.2000.1380.2001.10 × 10−1278100
18creatinine3.03 (s), 4.05 (s)116.84381.60200.5610.49216.3683.870.2310.2000.2650.1039.23 × 10−11100100
13pyruvate2.36 (s)1.904.353.340.473.711.860.3170.0320.1140.2003.86 × 10−10100100
5threonine1.32 (d) 8, 3.58 (d), 4.25 (m) 92.156.814.330.744.092.360.2030.2000.1970.2005.12 × 10−109893
17α-oxoglutarate2.43 (t) 10, 2.99 (t)3.0010.546.330.826.133.070.2450.2000.2070.2008.78 × 10−109592
3β-hydroxyisovalerate1.26 (s), 2.35 (s)0.711.641.190.151.160.570.1660.2000.2980.0357.15 × 10−998100
16dimethylamine2.72 (s)3.439.717.000.318.073.610.2320.2000.2670.0971.00 × 10−895100
8acetate1.91 (s)1.303.302.030.562.441.360.2020.2000.2060.2001.00 × 10−79596
4lactate1.32 (d), 4.11 (m)2.146.413.990.754.712.880.1740.2000.1530.2001.10 × 10-798100
20choline3.19 (s), 3.51 (m), 4.06 (m)0.932.451.610.252.071.080.2210.2000.2230.2001.20 × 10−710096
28serine3.84 (q) 11, 3.94 (q), 3.98 (q)15.0060.9229.595.0330.1215.320.2310.2000.2200.2003.59 × 10−79592
11carnitine2.40 (s), 2.45 (s), 3.21 (s)0.652.951.700.151.970.860.2180.2000.2000.2001.46 × 10−610080
14succinate2.39 (s)0.701.611.040.181.250.680.1920.2000.1460.2001.88 × 10−610096
9glutamine2.10 (t), 2.42 (m), 3.77 (t)1.4711.197.131.6510.814.780.2190.2000.2420.1862.87 × 10−69367
124-cresol sulphate2.24 (s), 6.82 (m), 7.23 (m)1.2211.915.510.794.922.090.2160.2000.1910.2001.38 × 10−510084
36formate8.44 (s)0.181.580.701.446.663.750.2560.1840.3490.0051.54 × 10−57779
29creatine3.03 (s), 3.92 (s)6.1940.7420.771.5017.007.460.1940.2000.2250.2003.29 × 10−59892
27guanidoacetate3.79 (s)7.9821.0412.411.7114.898.720.2060.2000.1710.2005.38 × 10−510092
19cis-aconitate3.11 (d), 5.72 (m)4.0812.317.510.5912.205.140.1670.2000.2070.2008.28 × 10−595100
7alanine1.47 (d), 3.78 (m)1.594.482.900.573.512.290.2020.2000.2550.1368.42 × 10−5100100
1valine1.03 (d), 2.26 (m), 3.60 (d)40.321.140.600.271.240.500.2700.1310.3100.0231.35 × 10−49568
10acetone2.22 (s)0.782.691.600.332.311.280.1670.2000.1710.2001.64 × 10−410092
22trimethylamine N-oxide3.25 (s)3.3715.658.961.3118.045.630.1730.2000.3000.0332.82 × 10−48592
26mannitol3.67 (m), 3.75 (m), 3.79 (d)14.2449.0428.853.6724.0416.100.2300.2000.1670.2006.31 × 10−410092
25glycine3.55 (s)1.9343.5218.571.8822.1310.200.1660.2000.1660.2009.26 × 10−488100
31trigonelline4.43 (s), 8.07 (t), 8.83 (m), 8.78 (m)1.364.212.790.396.132.680.1680.2000.2640.1061.35 × 10−310088
15citrate2.53 (d), 2.69 (d)9.1485.1033.0410.5855.4729.530.3270.0230.2310.2002.10 × 10−3100100
23taurine3.25 (t), 3.42 (t)6.6612.9510.181.9314.466.800.1640.2000.3070.0262.58 × 10−39892
2α-hydroxybutyrate1.19 (d), 2.27 (m), 2.39 (m)0.471.300.770.393.381.470.2080.2000.3180.0172.71 × 10−310095
21betaine3.25 (s), 3.89 (s)0.522.621.370.221.961.050.2610.1630.1440.2001.71 × 10−293100
35hypoxanthine8.18 (s), 8.20 (s)0.452.771.570.312.140.780.2140.2000.3160.0183.42 × 10−28064
343-methylhistidine3.22 (m), 3.31 (m), 3.73 (s), 3.96 (q), 8.08 (s)0.5611.634.330.5410.872.440.2240.2000.4190.0001.74 × 10−193100
244-hydroxyphenylacetate3.44 (s), 6.85 (d), 7.15 (d)0.904.141.890.595.021.570.2870.0840.2820.0613.65 × 10−19088
32histidine7.08 (m), 7.87 (d)0.124.060.950.331.090.570.4060.0010.2060.2003.88 × 10−18889
33phenylalanine7.31 (m), 7.37 (m), 7.43 (m)0.974.841.980.915.992.660.2520.2000.1820.2006.93 × 10−17688
30hippurate3.96 (d), 7.54 (t), 7.63 (t), 7.82 (d)5.5670.0124.732.2758.3033.760.2580.1740.3130.0217.48 × 10−19396
Legend:1 Min—minimum relative concentration; 2 Max—maximum relative concentration; 3 K–S—Kolmogorov–Smirnov (normality test); 4 observed value related to K–S test regarding normality; 5 Mean comparison using t-test or Mann–Whitney–Wilcoxon test; 6 frequency of occurrence; 7 (s) singlet; 8 (t) triplet; 9 (m) multiplet; 10 (d) duplet; 11 (q) quartet.

