Article

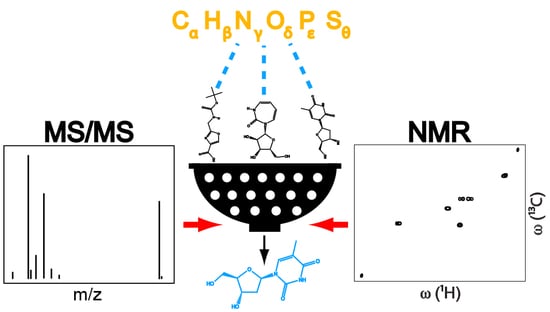
Structure Elucidation of Unknown Metabolites in Metabolomics by Combined NMR and MS/MS Prediction

1
Environmental Molecular Sciences Laboratory, Pacific Northwest National Laboratory, Richland, WA 99354, USA
2
Department of Ecology and Evolutionary Biology, University of Kansas, Lawrence, KS 66045, USA
*
Author to whom correspondence should be addressed.
Metabolites 2018, 8(1), 8; https://doi.org/10.3390/metabo8010008
Submission received: 28 December 2017 / Revised: 13 January 2018 / Accepted: 13 January 2018 / Published: 17 January 2018

Abstract

:
We introduce a cheminformatics approach that combines highly selective and orthogonal structure elucidation parameters; accurate mass, MS/MS (MS2), and NMR into a single analysis platform to accurately identify unknown metabolites in untargeted studies. The approach starts with an unknown LC-MS feature, and then combines the experimental MS/MS and NMR information of the unknown to effectively filter out the false positive candidate structures based on their predicted MS/MS and NMR spectra. We demonstrate the approach on a model mixture, and then we identify an uncatalogued secondary metabolite in Arabidopsis thaliana. The NMR/MS2 approach is well suited to the discovery of new metabolites in plant extracts, microbes, soils, dissolved organic matter, food extracts, biofuels, and biomedical samples, facilitating the identification of metabolites that are not present in experimental NMR and MS metabolomics databases.

Graphical Abstract

1. Introduction

Metabolomics has become a key discipline in small molecule research. It has been widely applied to generate new hypotheses for unresolved scientific questions, such as in metabolism-related disorders, environmental carbon cycling studies, complex biofuel analysis, nutritional and food sciences, and synthetic biology optimization [1,2,3,4,5]. Nuclear magnetic resonance (NMR) spectroscopy and mass spectrometry (MS) are the two most powerful experimental methods for metabolomics [6,7]. This is primarily because of their high-resolution powers providing detection of individual molecular species in a short acquisition time with minimal sample preparation. Connecting the detected signals to scientific interpretation requires assignment of individual signals to their corresponding metabolite identities. This is often performed by querying detected signals against one or several experimental databases such as BMRB [8], HMDB [9], METLIN [10] and COLMAR [11]. The success of this approach for positive metabolite identification requires the presence of the spectra of a metabolite within the database. Although excellent progress has been made in growing the number of metabolites in databases, many of the signals detected in metabolomics experiments cannot be identified through this database approach because of the absence of their spectra in metabolomics databases.
Identification of these unknowns is a major bottleneck. Traditionally, identification of unknowns requires extensive isolation of the molecule from complex mixture in sufficient amount for detailed analysis by NMR and other spectroscopic techniques [12]. While this approach has been proven useful, complete fractionation is time-consuming. Moreover, low yield of purification may not allow downstream structure elucidation processes for low-abundance metabolites. Alternatively, structure elucidation can be performed in the mixture environment, such as in crude extract or partially fractionated sample. This strategy is highly attractive for high-throughput metabolomics. There are three main approaches proposed for this purpose. The first approach excludes spectroscopic analysis; rather, it aims to identify metabolites by LC-MS and LC-MS/MS techniques. This approach compares experimental MS/MS (MS2) spectra of an unknown metabolite with the predicted MS/MS fragmentation of possible candidate structures to find the best match. This approach has received significant attention in recent years. There are multiple publicly available software and web servers allowing the query of experimental LC-MS and LC-MS/MS data for identification of unknowns, including MetFrag and CSI:FingerID [13,14,15].
The second strategy, on the other hand, relies on the NMR technique, in which the experimental chemical shifts of unknown metabolites are sequentially assigned and deconvoluted by multidimensional NMR [16,17]. These assignments are further verified through comparison with their quantum NMR chemical shift predictions [18]. While these MS- and NMR-based approaches greatly facilitate the structural characterization, they have limited power, since they rely only on a single technique. Recently, a hybrid MS/NMR metabolite identification strategy, SUMMIT MS/NMR has been proposed. SUMMIT first acquires experimental high-resolution MS1 and NMR spectra of a metabolomics sample. Then, it compares experimental NMR chemical shifts of the unknowns in the sample with the predicted NMR chemical shifts of all feasible structures consistent with the derived chemical formulas from high resolution MS1 [19]. Recently, this approach was extended to 3D NMR and FT-ICR mass spectrometry to increase resolution and accuracy of metabolite identification [20].
Here, we will further explore improving the accuracy of NMR/MS-based approaches for structure elucidation by combining NMR predictions with MS/MS predictions from a public in silico MS/MS library. This is the first cheminformatics approach that compares and combines MS/MS and NMR predictions for unknown/uncatalogued metabolite identification. We demonstrate the approach on a model mixture and then we identify an uncatalogued secondary metabolite in Arabidopsis thaliana.

2. Results

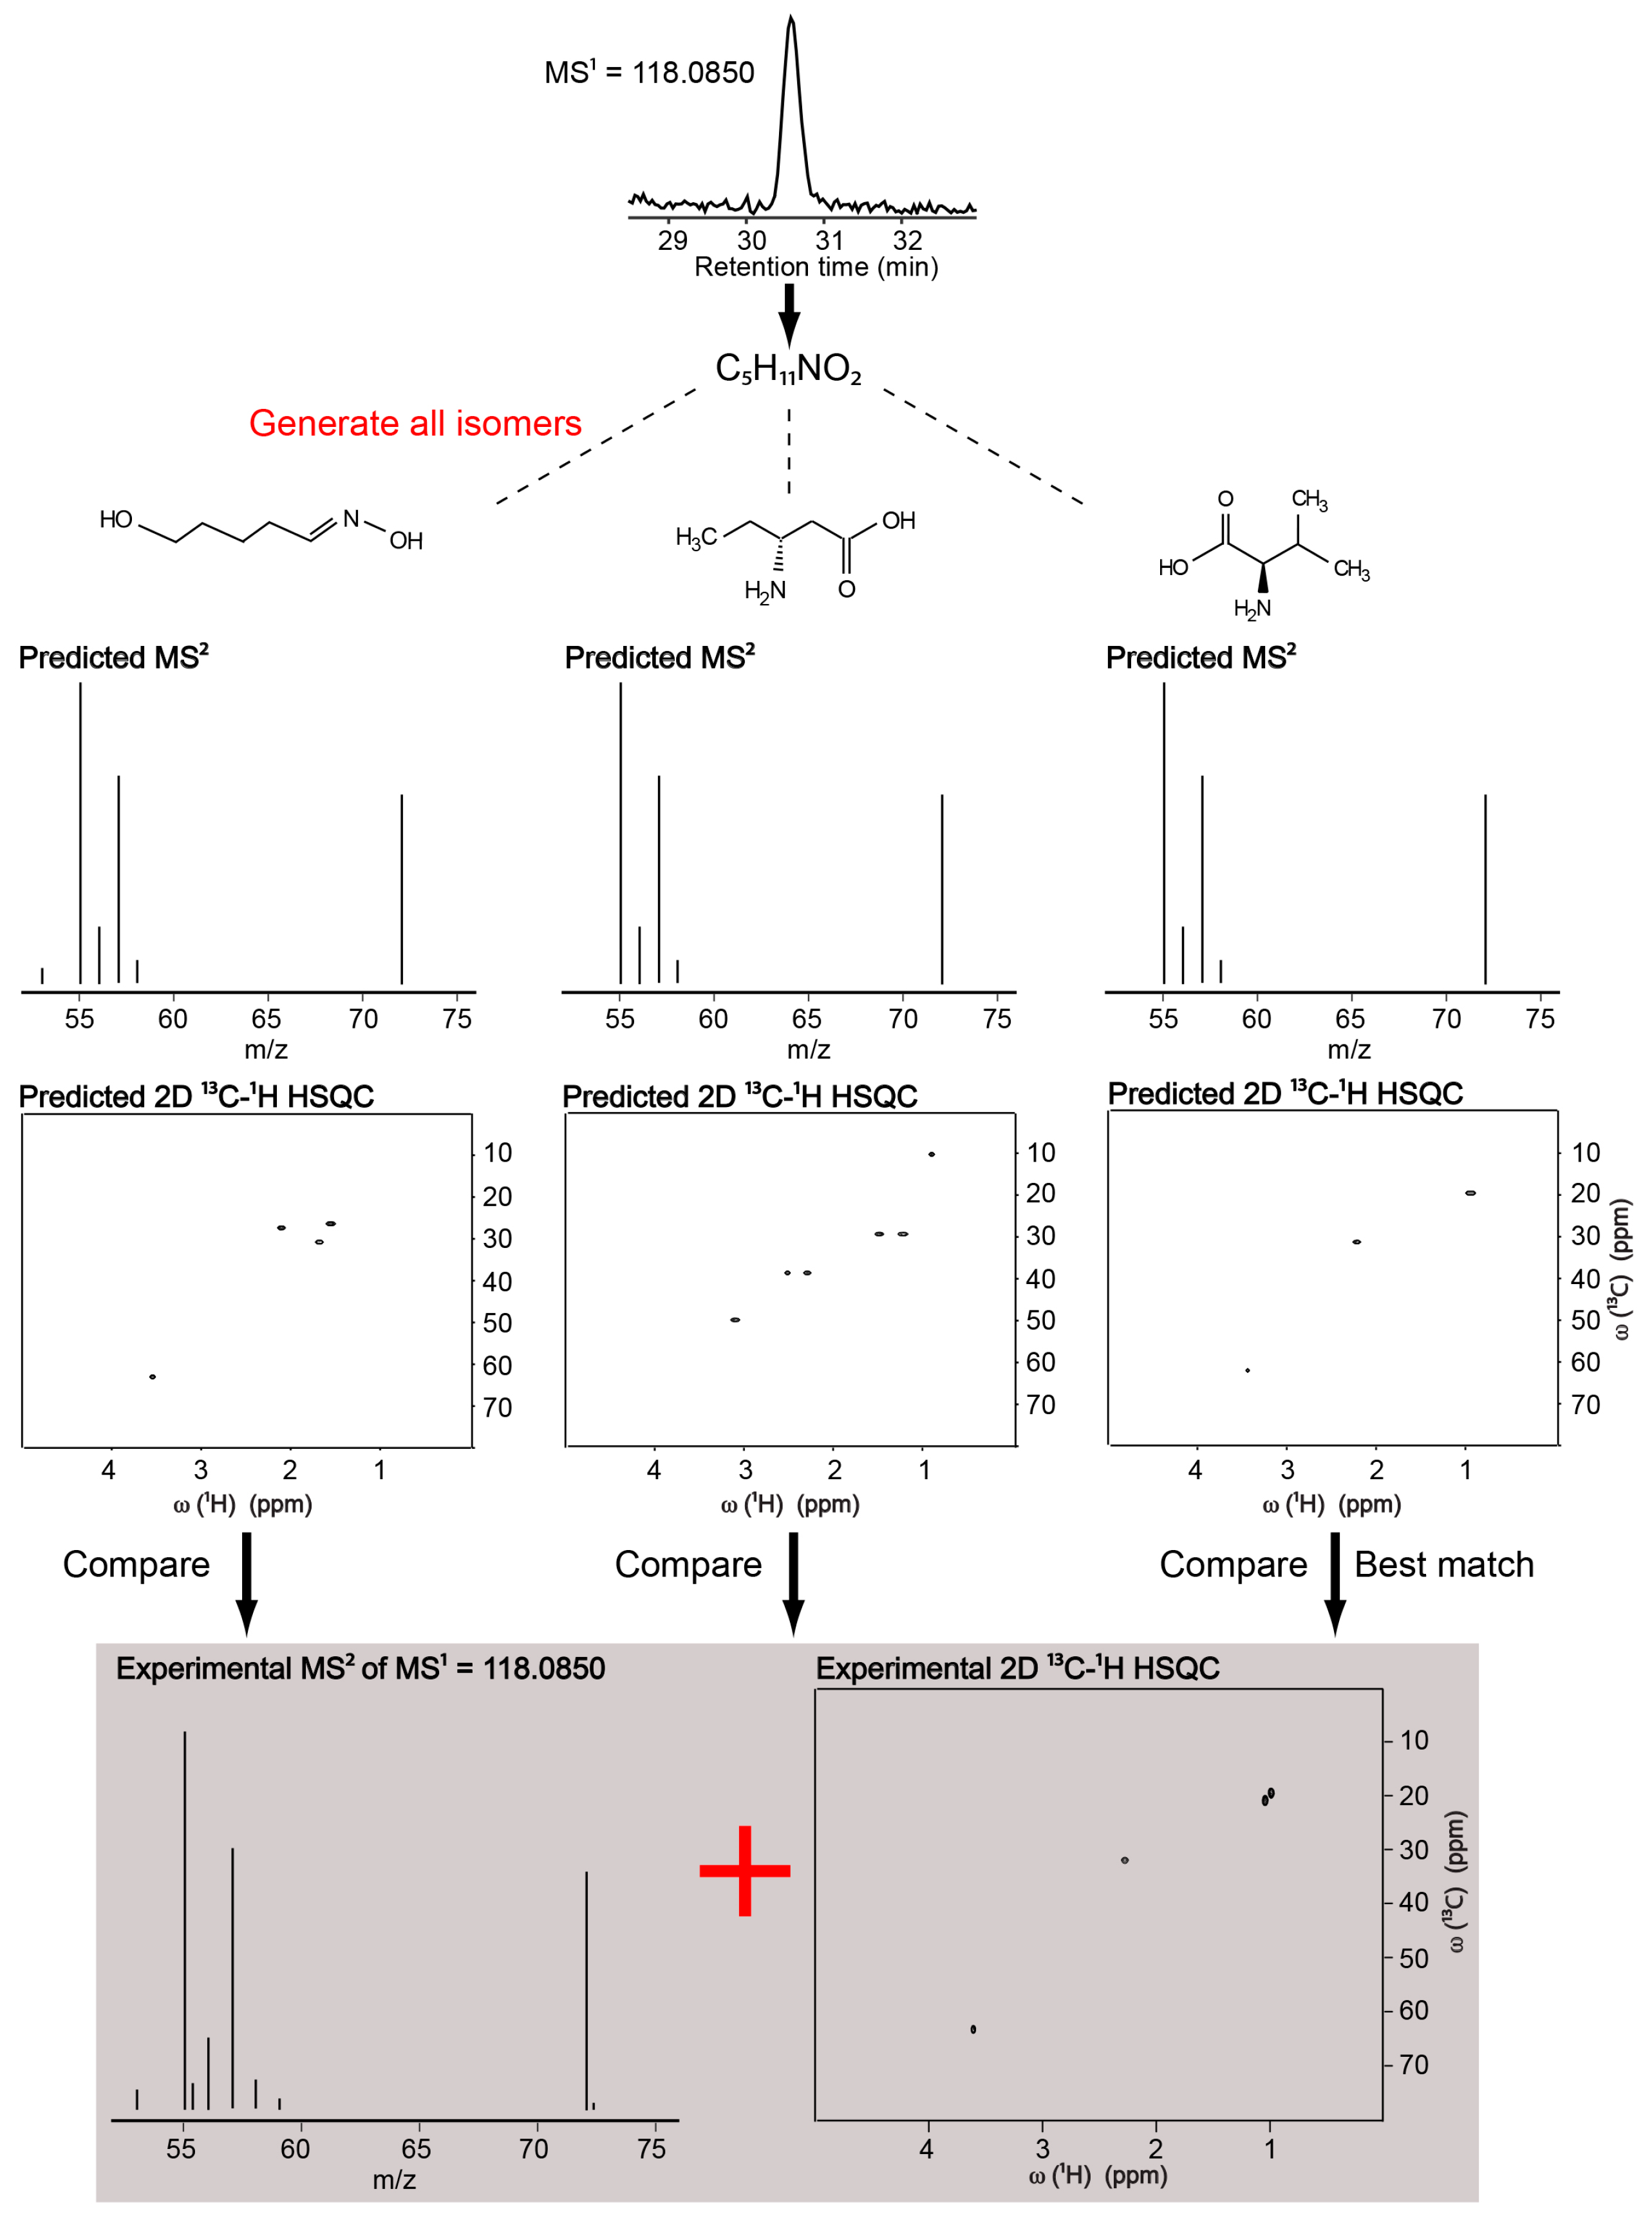
2.1. Identification of a Known Metabolite without the Use of a Database for Matching

Our NMR/MS-based approach works as follows: we first determine the chemical formula of an unknown LC-MS feature by analyzing its accurate mass and isotopic distributions. Next, we generate all possible candidate structures consisted with the chemical formula. We predict the MS/MS and NMR spectra of each candidate structure. Meanwhile, we collect the experimental NMR spectrum of the same sample. We compare the predicted MS/MS and NMR data against the experimental MS/MS and NMR, and rank them according to the level of agreement to determine the best matching candidate. Figure 1 shows the approach on a simplest case, where there is only one metabolite in the NMR spectrum; therefore, NMR spectrum was paired with the LC-MS spectrum. We used the MS2 and NMR spectra of valine. The high-resolution LC-MS spectrum of valine allowed the determination of its molecular formula, C5H11NO2. All possible structures consistent with C5H11NO2 were determined using the ChemSpider database [21]. There were 453 possible structures. We queried all the 453 MS2 predictions against the experimental MS2 of valine by using the MetFrag web server [15]. This gave a scoring for each predicted MS2 match. Valine MS2 prediction was the 6th-best match to the experimental MS2 of valine among 453 predictions. We predicted the 2D 13C-1H HSQC NMR spectra [22] of all the 453 structures by using MestReNova software, and queried them against the experimental 2D 13C-1H HSQC of valine. Valine NMR prediction was the best match to the experimental NMR spectrum of valine.
By using the same strategy, we analyzed nine other common metabolites. Table 1 (column 7) and Table 2 (column 5) show the performance of MS2 and NMR predictions for these metabolites, respectively. With one exception, the NMR predictions were always either the best or second-best match to their experimental signals; the NMR prediction of panthothenate was the fourth-best match. On the MS2 side, the predictions matched less successfully to their corresponding experimental MS2 (Table S1). For instance, nicotinate and glutamine predictions were the 7th- and 10th-best matches, respectively. Phenylalanine was an exception, with the MS2 prediction being the best match to its experimental data.
Overall, NMR predictions turned out to be a more effective filter than MS2 predictions. Thus, the structural assignments obtained with NMR prediction tend to provide the most accurate structural information, with MS2-based predictions providing an orthogonal method that can distinguish between molecules that yield similar NMR chemical shifts. For instance, proline NMR prediction was the second best to its experimental NMR spectrum with a chemical shift difference of 0.3077 and 1.0908 ppm along 1H and 13C dimension. The best match was 5-hydroxy-2-piperidinone with a chemical shift difference of 0.1072 and 2.1928 ppm along 1H and 13C dimension. Whereas MS2 ranks of proline and 5-hydroxy-2-piperidinone were 26 (score: 0.8515) and 167 (score: 0.5964), respectively (Figure S1). Therefore, the false positive candidate (5-hydroxy-2-piperidinone) based on NMR prediction can be eliminated by MS2 prediction, showing the advantage of combining these two orthogonal parameters for metabolite identification.

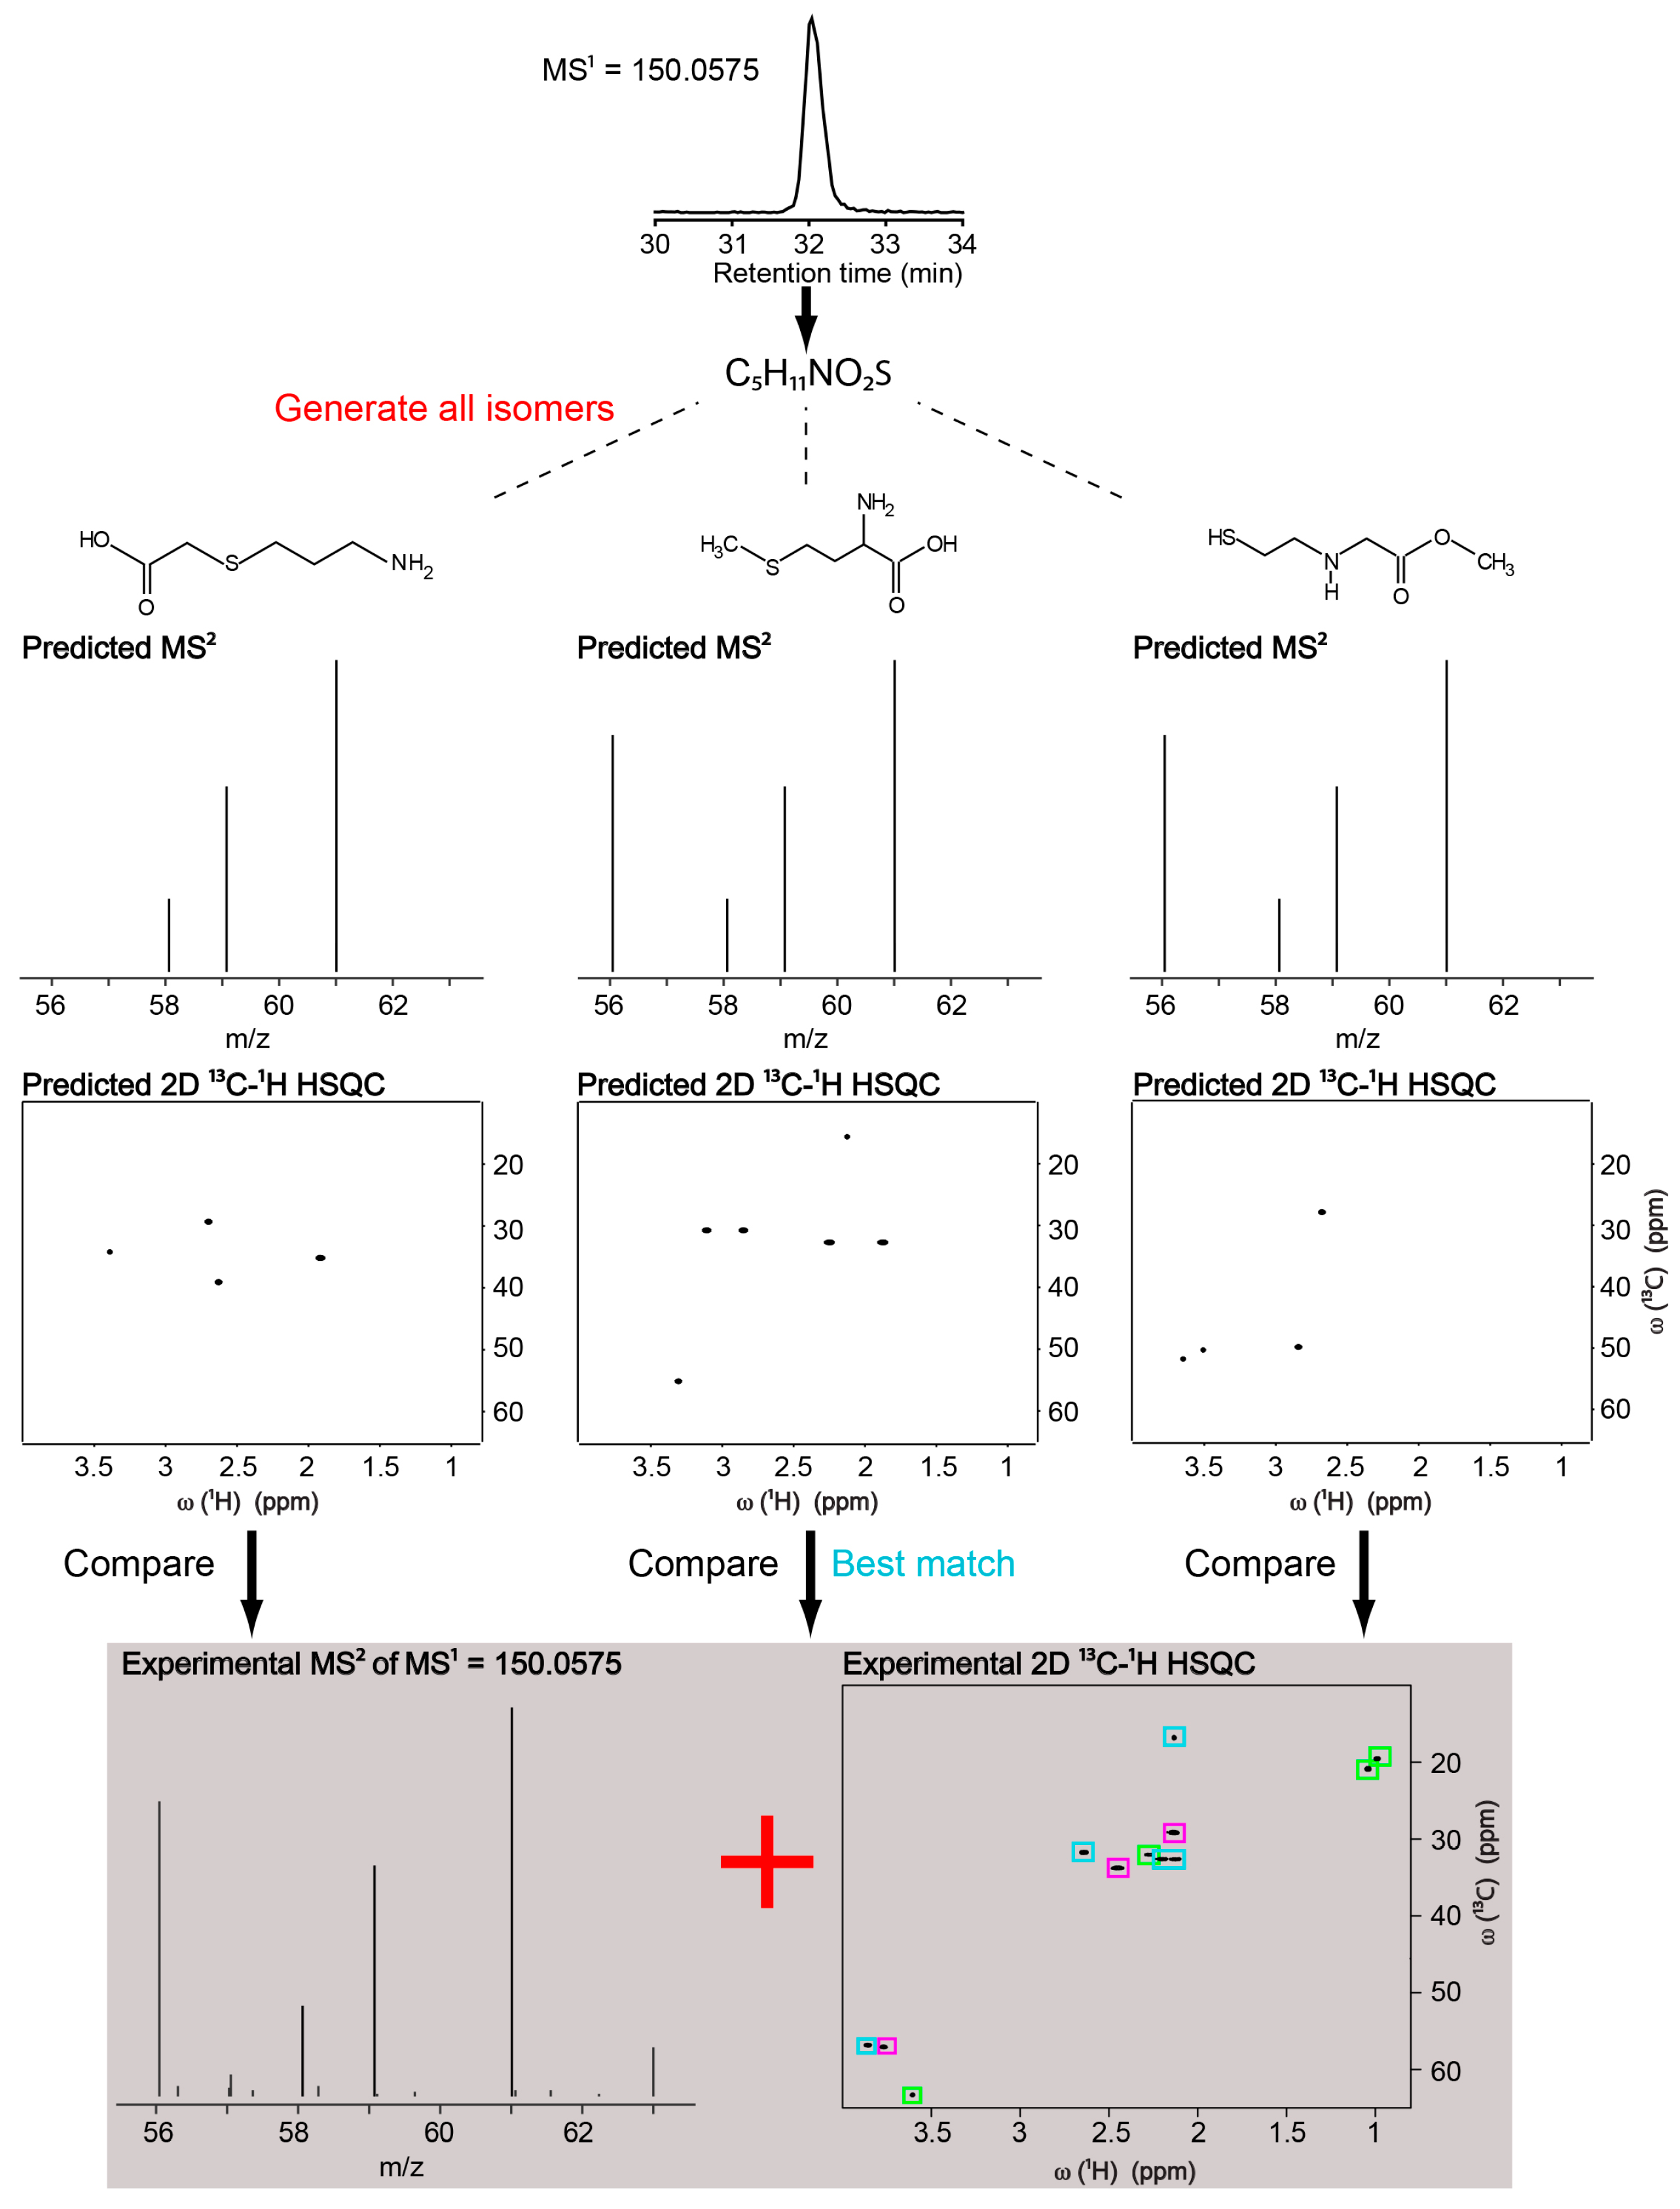
2.2. Identification of Known Metabolites in a Test Mixture without the Use of a Database for Matching

In the example above, which considered one unknown metabolite at a time, each NMR spectrum was paired with a single LC-MS feature. However, it is common in metabolomics to analyze complex mixtures consisting of multiple metabolites within unfractionated samples. In these cases, multiple LC-MS features and multiple deconvoluted NMR spectra are generated, without knowing which pairs correspond to the same metabolite. This increases the challenge of metabolite identification. The NMR/MS2 approach can also be applied to mixtures containing multiple metabolites. When multiple metabolites are present, the workflow is modified to consider all pairwise combinations; NMR predictions are generated for all structural isomers of each LC-MS feature, and they are all compared to every deconvoluted experimental NMR spectra.
Figure 2 shows the approach on a sample consisting of three metabolites; valine, methionine and glutamine. Deconvolution of the HSQC spectrum by connectivity information from TOCSY [23] and HMBC [24] resulted in 3 HSQC-peak lists, colored magenta, light-blue and green (Figure 2). The LC-MS feature of methionine was first converted to the chemical formula C5H11NO2S. There were 212 possible isomers. We queried HSQC predictions of the 212 structures against the HSQC peak lists of the magenta, light-blue and green individually. Among them, the best match was the one between the predicted HSQC of methionine and the light-blue peaks, corresponding to the experimental HSQC of methionine (Figure 2). The predicted HSQC of methionine provided a better match to the light-blue peaks than all the other 211 methionine isomers compared to all three deconvoluted peak lists.
To demonstrate how the approach would work in a more complex mixture, we expanded the list of metabolites from three to ten; thymidine, proline, phenylalanine, pantothenate, nicotinate, methionine, isoleucine, glutamine, leucine and valine. Table 2, column 6 shows the performance of NMR prediction in the ten-metabolite mixture. The ranks of thymidine, proline, phenylalanine, nicotinate, methionine, isoleucine, glutamine and valine did not differ from being the only metabolite in the NMR spectrum (column 5) to being one of the ten metabolites in the mixture (column 6). On the other hand, the rank of panthothenate and leucine increased from 4 to 16 and from 1 to 3, respectively. This is because in the single-metabolite case, NMR predictions of panthothenate and leucine isomers were limited to matching only to the experimental NMR spectra of panthothenate and leucine. Whereas in the mixture, they can also match to experimental NMR signals of the other mixture metabolites. Figure S2 shows this in detail for leucine. When NMR predictions of 962 C6H13NO2 isomers (including leucine and isoleucine) were queried against the experimental HSQC peak-lists of the ten metabolites, the best-matching NMR prediction belonged to isoleucine, which found the experimental NMR of isoleucine as the best match (true positive). The second-best match was 3-methylaminopropyl acetate, which found experimental NMR of proline as a match (false positive). Finally, the third-best match was between the predicted NMR of leucine and the experimental NMR of leucine (true positive).
3-methylaminopropyl acetate can be eliminated by MS2 prediction, since MS2 prediction of 3-methylaminopropyl acetate was ranked 92nd (score: 0.6665), whereas MS2 prediction of isoleucine was ranked 22nd (score: 0.8723) when they were compared to experimentally detected MS2 of isoleucine. MS2 prediction of 3-methylaminopropyl acetate was ranked 585th (score: 0.2079), whereas MS2 prediction of leucine was ranked 148th (score: 0.7002) when they were compared to experimentally detected MS2 of leucine. Therefore, this shows, again, the advantage of combining NMR and MS2 predictions for metabolite identification.

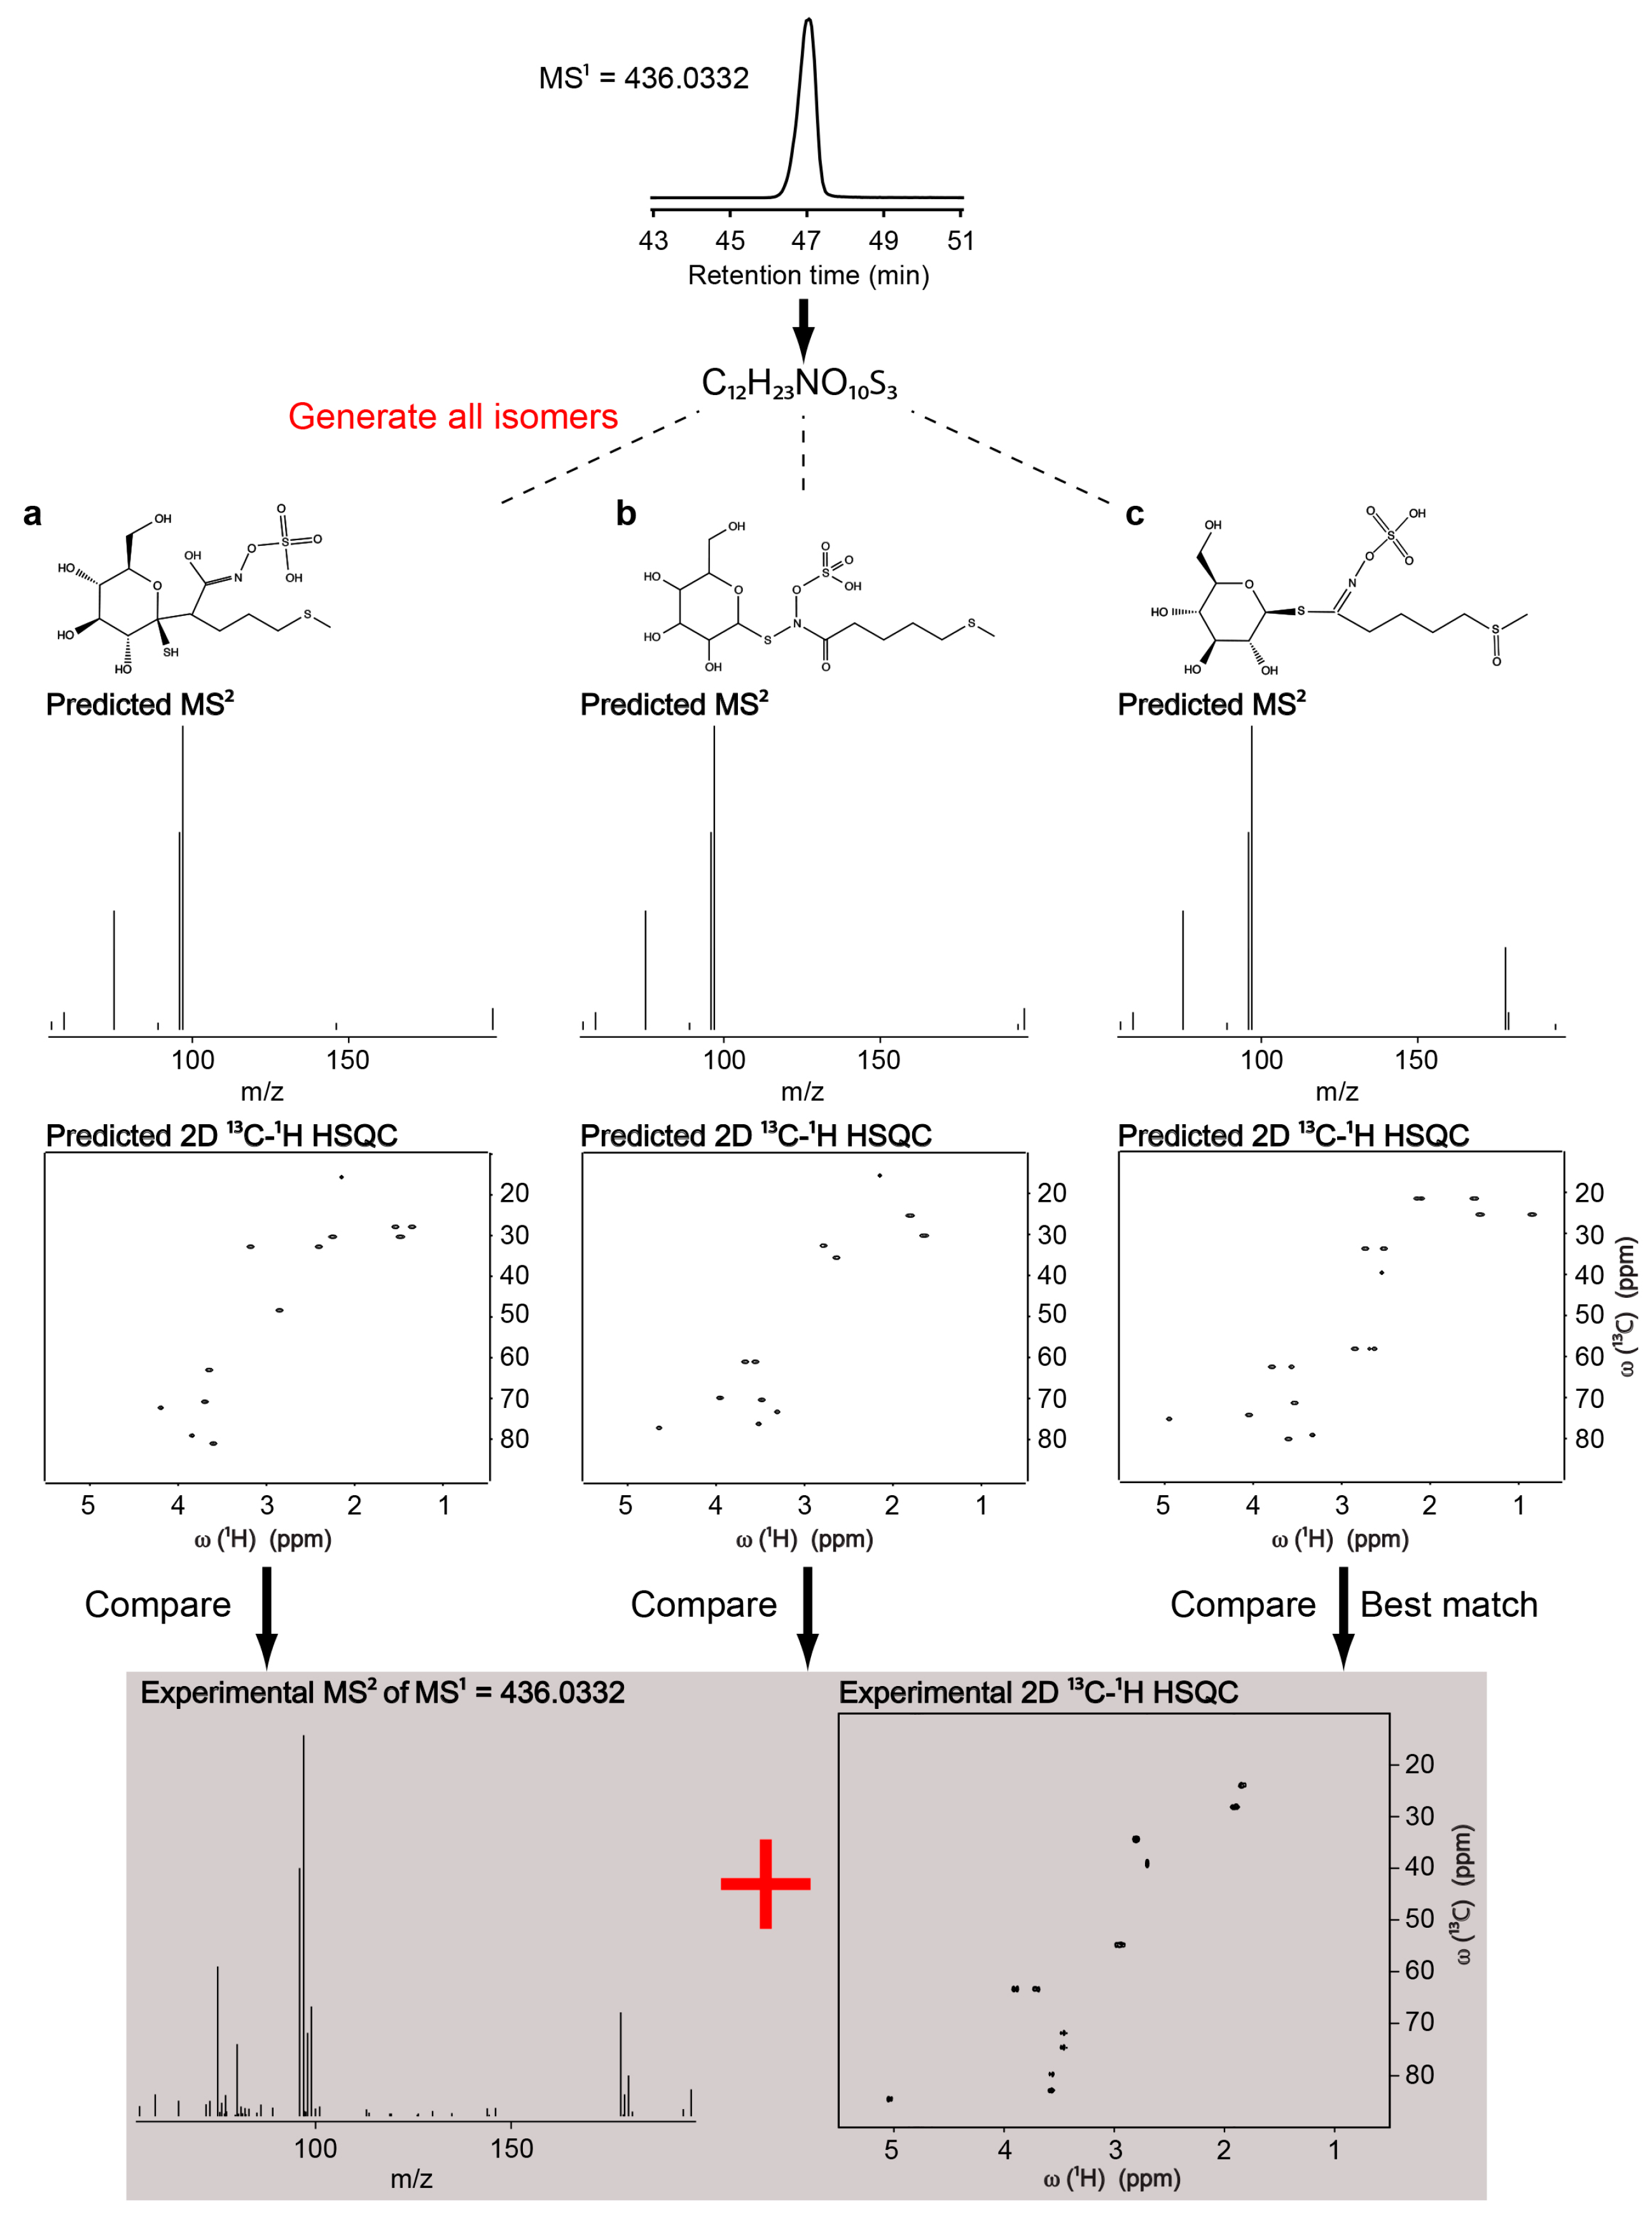
2.3. Identification of Uncatalogued Metabolite in Arabidopsis thaliana

Many of the metabolites in plants are unknown or uncatalogued; therefore, plants are excellent samples to demonstrate the power of the NMR/MS2 approach. We recorded the LC-MS and LC-MS/MS spectra of Arabidopsis extract and queried this data against the METLIN database [10], but could not identify many of the high-abundance peaks. Similarly, we recorded the 2D 13C-1H HSQC spectrum of the sample, and queried this against COLMAR HSQC database [25]. Again, many of the high-abundance peaks could not be identified, as these metabolites were not in either database. One of the highly abundant metabolites had an m/z 436.0332 in negative mode at the retention time ~47 min (Figure S3). The challenge of identifying unknown metabolites starts at the chemical formula determination step. Previous studies have shown that even 1 ppm mass accuracy is often insufficient to unambiguously determine the chemical formula without additional constraints from isotopic patterns [26]. For the accurate mass 436.0332, there are 4291 possible structures in ChemSpider within 30 ppm mass error, 3194 possible structures within 20 ppm mass error, 1909 structures within 10 ppm mass error, 907 structures within 5 ppm mass error, 528 structures within 3 ppm mass error and 379 structures within 1 ppm mass error. By including the isotopic distribution, we narrowed down the possible chemical formula to C12H23NO10S3. The next challenge was to determine which of the many isomers of that formula match the structure of the unknown molecule. We queried all MS2 predictions of all possible isomers of C12H23NO10S3 against the experimental MS2 by using the MetFrag web server. MetFrag hits with their matching scores are shown in Figure 3. The structure c was the best match with a matching score of 1.00, structure b was the second-best match (score of 0.87), and structure a was the third-best match (score of 0.79). The main MS/MS peak differentiating c from a and b was at m/z 178.0166 (Figure 3), which corresponds to the theoretical mass of the fragment formula of [C5H9NO4S]-H, that includes the SO4 group and part of the aliphatic chain (Figure S4).
For NMR, we simplified the plant extract into sub-mixtures by performing LC-fractionation at 1 min intervals. At the retention time ~47 min, we obtained the 2D 13C-1H HSQC spectrum in Figure S5. Querying the HSQC predictions of all possible isomers against the experimental HSQC (Figure 3) also returned the structure c as the best match with average chemical shift ppm error of 0.2081 ppm in 1H and 1.4187 ppm in 13C dimension. The key contributor for the differentiation of molecule c from a and b was the methyl group at the end of the aliphatic chain. In molecule c, the methyl was attached to a sulfoxide group, while in molecule a and b it was attached to a thioether. The prediction values of the methyl group in structure c was 2.55 ppm in 1H and 39.57 ppm in 13C dimension, whereas the prediction values of the methyl group in structure a and b were both 2.15 ppm in 1H and 15.64 ppm in 13C dimension. It was experimentally detected in 2.70 ppm in 1H and 39.06 ppm in 13C dimension (Figure 3). For final validation, we purchased metabolite c (glucoraphanin) and recorded the HSQC spectrum. Close agreement between the uncatalogued molecule from Arabidopsis and the purchased standard confirmed the identity (Figure S6). The NMR/MS2 approach successfully identified glucoraphanin in Arabidopsis.

3. Discussion

The introduced NMR/MS2 approach is highly compelling for identification of unknown and uncatalogued metabolites for multiple reasons. First, it combines highly selective, universal and orthogonal structure elucidation parameters—accurate mass, MS2 and NMR—in a single analysis platform to accurately identify metabolites. Secondly, the approach does not require any experimental NMR or MS metabolomics database for identification. Instead, it generates in silico NMR and MS2 spectra for all possible isomers of a chemical formula and queries them directly against experimental NMR and MS2 spectra of the unknown of interest. As a proof-of-principle, we used the ChemSpider database [21] as a structure generator, assuming it to contain a sizeable portion of the possible isomers of a chemical formula. To expand the structural space, one could replace ChemSpider with a structure generator such as MOLGEN [27], or one could use a more biological structure resource such as KEGG [28] to focus on biological compounds. Third, the introduced approach has a robust workflow. It not only works in single metabolite samples but also in mixtures.
This cheminformatics approach provided a unique platform to compare performances of NMR and MS/MS predictions for structure elucidation. NMR predictions turned out to be a more effective filter than MS/MS predictions in the model mixture study. Overall, the complementarity of NMR and MS/MS predictions increased the accuracy of metabolite identification as compared to using individual techniques alone. We only used a single collision energy (30 V) for fragmentation, perhaps using multiple collision energies or optimizing collision energies for each metabolite and comparing them with other in silico MS/MS tools such as combined energy competitive fragmentation modeling (CFM) [29] and CSI:FingerID [14] may provide better results, this needs to be further tested. To improve the selectivity on the MS-side, one could include additional parameters such as collusion cross-sections from ion mobility mass spectrometry [30] and LC-retention time, although the latter one is highly dependent on experimental conditions. Determination of the correct molecular formula or at least a small set of possible formulas including the correct formula is crucial for downstream analysis. Accurate mass significantly lowers the number of possible structures that are consistent with the detected mass. For cases where accurate mass is still not enough to narrow down to a single formula, the NMR/MS2 approach still works, as the combined MS2 and NMR predictions are strong enough to filter majority of false positive structures coming from false chemical formulas. Higher resolution MS systems than TOF, such as Orbitrap and FTICR, would provide better performance, especially for larger metabolites.
With NMR, we used 2D 13C-1H HSQC [22] predictions as an effective filter, predictions were performed by empirical calculations. The advantage of empirical calculations is the speed. Each prediction takes about 10 s on a desktop computer. To get more accurate chemical shift values, one could use quantum chemical calculations at the expense of calculation time [31,32]. To make NMR parameters even more selective, one could include additional NMR parameters, in particularly the connectivity information retrieved from 2D 1H-1H TOCSY [23], 2D 13C-1H HSQC-TOCSY [33] or 2D 13C-1H HMBC [24]. Metabolites with high quaternary carbon content may require direct carbon detection experiments such as 1D 13C NMR and their comparison with 1D 13C NMR predictions. Successful implementation of the workflow requires detection of a metabolite of interest by both MS and NMR. Therefore, a metabolite should have at least low micromolar concentration to be detected in NMR experiments. Moreover, it should be ionized in a mass spectrometer. Signal overlaps are another challenge for the success of the approach, here we showed that the most straightforward way to resolve this challenge in real mixtures is to perform partial or complete LC-fractionation before NMR analysis. As we have shown with examples, our NMR/MS2 approach is designed to be able to work in all three conditions, switching from unfractionated to partially fractionated to completely fractionated sample depending on the experimental conditions does not significantly affect the protocol. To the best of our knowledge, this is the first study developed to facilitate the identification of unknown metabolites by combining NMR and MS/MS predictions, which supports previous findings that in addition to HRMS, NMR is required for de-novo identification of plant metabolites [34]. We used this approach to identify a type of glucosinolate, glucoraphanin in A. thaliana. Glucosinolates are biologically active secondary metabolites that occur in Brassicaceae species [35] such as food crops, broccoli and cauliflower. These metabolites influence plant-insect interactions, and glucoraphanin has been shown to be an important chemical for the insect pest resistance in Arabidopsis [36]. Glucoraphanin in vegetables within Brassicaceae is associated with a lower risk of lung and colorectal cancer [37]. Continued application of the NMR/MS2 approach is ongoing on plant derived metabolites. The unknown/uncatalogued metabolites identified will be added to metabolomics databases for database expansion and dereplication [38]. The NMR/MS2 approach is applicable to a wide range of samples from plant extracts, to, microbes, soils, dissolved organic matter, food extracts, biofuels and biomedical samples.

4. Materials and Methods

The model mixture was prepared by dissolving thymidine, proline, phenylalanine, pantothenate, nicotinate, methionine, isoleucine, glutamine, leucine and valine in 5 µL D2O, 45 µL H2O and 950 µL acetonitrile. The final concentration of each metabolite was 100 µM. 100 µL of this material was injected to LC-MS. NMR sample of the three-compound mixture was prepared by dissolving glutamine, valine and methionine in 180 µL D2O, the final concentration of each metabolite was 1 mM. A. thaliana metabolite extract was prepared as described previously [39]. The plant extract was dissolved in 200 µL D2O with 0.5 mM DSS, 180 µL of this sample was used for NMR. 5 µL of this sample was diluted with 45 µL H2O and 950 µL acetonitrile, 100 µL of this was injected to LC-MS.
2D 13C-1H HSQC spectra [22] were collected using a Varian (VNMRS) 600 MHz solution state NMR spectrometer equipped with a Varian z-gradient triple resonance HCN cold probe. The number of scans per t1 increment were 16 for the three-compound mixture, 64 for unfractionated Arabidopsis extract, 256 for fractionated Arabidopsis extract, and 128 for glucoraphanin standard (Cayman Chemicals, Ann Arbor, MI, USA). 2D 1H-1H TOCSY spectra for the unfractionated Arabidopsis extract and fractionated Arabidopsis extract were collected by 32 and 256 scans per t1 increment. TOCSY mixing time was 90 ms. The 2D 13C-1H HSQC, 2D 1H-1H TOCSY [23] and 2D 13C-1H HMBC [24] spectra of the ten metabolites were downloaded from BMRB database [8]. All data were zero-filled, Fourier transformed, phase and baseline corrected using NMRPipe [40].
Mass spectrometry studies were conducted using an HPLC system (1200 series, Agilent Technologies, Santa Clara, CA, USA) coupled to an Agilent 6538 UHD ESI Q-TOF instrument with a mass resolution of 40K. The instrument was externally calibrated with Agilent low-concentration tuning mix (part no. G1969-85000) before sample analysis, achieving a mass accuracy of ±5 ppm. LC-MS and collision induced dissociation LC-MS/MS data collection was performed together in auto MS/MS mode with a fixed collision energy of 30 V in both positive and negative ionization modes. Samples were separated using a normal-phase approach with a Phenomenex Luna NH2 column (150 mm × 2 mm i.d., 3 µm particle size). A gradient method was used for separation. The composition of the solvents was A = 10 mM NH4Ac plus 10 mM NH4OH in 95% water and 5% acetonitrile (mobile phase A) and solvent B = 95% acetonitrile and 5% water (mobile phase B). A 0.1 mL/min flow rate was used for the mobile phase flow, starting with 100%B to 0% B over 60 min, holding at 0% B for 5 min., increasing the flow rate to 0.2 mL/min and re-equilibration with 100% B for 54 min., then returning the flow to 0.1 mL/min for an additional 10 min. The settings for the mass spectrometer were as follows: capillary voltage, 4000 V (positive ion mode) and −4000 V (negative ion mode); drying gas flow (N2), 5 L/min; drying gas temperature, 330 °C; and nebulizer gas (N2), 30 psig. The raw LC-MS data was converted to mzdata.xml format by using MassHunter Qualitative Analysis (Agilent Technologies) and analyzed by mzMine 2 [41]. LC-fractionation of the plant extract was performed by an Agilent HPLC system (1200 series) coupled to an Agilent fraction collector (1100 series). The LC column, elution gradient, flow rates, solvents and injection volume were the same as the LC-MS experiments above. The fractions were collected in a 96-well deep plate (96DeepNunc31mm) with 1-min retention time intervals.
Candidate structures for the chemical formulas were extracted from ChemSpider database [21] by using ‘advanced’ and ‘intrinsic properties’ search option. 2D 13C-1H HSQC spectra for the candidate structures were predicted using MestReNova software (Santiago de Compostela, Spain). HSQC spectra of the predicted structures were compared with experimental HSQC spectrum and ranked by using a custom developed MATLAB algorithm. The ranking took into account chemical shift differences between experimental and predicted chemical shifts, and the matching ratio. The chemical shift differences were calculated by using a distance matrix as previously described [19,20]. The weights assigned for 1H and 13C chemical shifts were 10 and 1, respectively. The matching ratio is defined as the ratio of the matched peaks to the total number of peaks. For example, if a certain metabolite has 6 cross-peaks based on HSQC prediction, and 5 of them have corresponding matched peaks in the experimental HSQC spectrum, the matching ratio for this metabolite is 0.83. Sorting the metabolite candidates by minimum chemical shift difference and maximum matching ratio provided the quantitative ranking. Running the algorithm takes less than one second on a desktop computer. Generation of the MS/MS predictions for ChemSpider candidates and their comparisons with the experimental MS/MS spectrum was performed on MetFrag web server [15] using 30 ppm MS2 mass accuracy.

Supplementary Materials

The following are available online at www.mdpi.com/2218-1989/8/1/8/s1, Figures S1 and S2: chemical structures of the molecules, whose NMR predictions matched best to the experimental NMR spectra, Figure S3: total ion chromatogram of Arabidopsis metabolite extract, Figure S4: the MS/MS peak differentiating MS/MS prediction of glucoraphanin from the other isomers, Figures S5 and S6: overlay of the experimental 2D 13C-1H HSQC spectra of glucoraphanin, unfractionated and fractionated Arabidopsis extracts, Table S1: the list of precursor ions that were selected for fragmentation.

Acknowledgments

We thank the authors of the MetFrag for publicly sharing their web server. This work was performed under Proposal ID: 49679 (KB) with Early Career Laboratory Directed Research Development (LDRD) Program funding, Science Theme Proposal ID: 48397 (JKW), the Linus Pauling Postdoctoral Fellowship LDRD 69488 (RMB) using Environmental Molecular Sciences Laboratory, a national scientific user facility sponsored by DOE’s Office of Biological and Environmental Research and located at PNNL. PNNL is operated by Battelle for the DOE under Contract DE-AC05-76RL01830.

Author Contributions

K.B. designed the study; R.M.B., D.W.H., C.D.N. and H.A.K.-S. performed the experiments; K.B. and R.M.B. analyzed the data; all the authors contributed to prepare the manuscript and approved the submission.

Conflicts of Interest

The authors declare no conflict of interest.

References

  1. Nicholson, J.K.; Holmes, E.; Kinross, J.M.; Darzi, A.W.; Takats, Z.; Lindon, J.C. Metabolic phenotyping in clinical and surgical environments. Nature 2012, 491, 384–392. [Google Scholar] [CrossRef] [PubMed]
  2. Bundy, J.G.; Davey, M.P.; Viant, M.R. Environmental metabolomics: A critical review and future perspectives. Metabolomics 2009, 5, 3–21. [Google Scholar] [CrossRef]
  3. Martien, J.I.; Amador-Noguez, D. Recent applications of metabolomics to advance microbial biofuel production. Curr. Opin. Biotechnol. 2017, 43, 118–126. [Google Scholar] [CrossRef] [PubMed]
  4. Scalbert, A.; Brennan, L.; Manach, C.; Andres-Lacueva, C.; Dragsted, L.O.; Draper, J.; Rappaport, S.M.; van der Hooft, J.J.; Wishart, D.S. The food metabolome: A window over dietary exposure. Am. J. Clin. Nutr. 2014, 99, 1286–1308. [Google Scholar] [CrossRef] [PubMed]
  5. Ellis, D.I.; Goodacre, R. Metabolomics-assisted synthetic biology. Curr. Opin. Biotechnol. 2012, 23, 22–28. [Google Scholar] [CrossRef] [PubMed]
  6. Markley, J.L.; Brüschweiler, R.; Edison, A.S.; Eghbalnia, H.R.; Powers, R.; Raftery, D.; Wishart, D.S. The future of NMR-based metabolomics. Curr. Opin. Biotechnol. 2017, 43, 34–40. [Google Scholar] [CrossRef] [PubMed]
  7. Lu, W.; Su, X.; Klein, M.S.; Lewis, I.A.; Fiehn, O.; Rabinowitz, J.D. Metabolite measurement: Pitfalls to avoid and practices to follow. Annu. Rev. Biochem. 2017, 86, 277–304. [Google Scholar] [CrossRef] [PubMed]
  8. Ulrich, E.L.; Akutsu, H.; Doreleijers, J.F.; Harano, Y.; Ioannidis, Y.E.; Lin, J.; Livny, M.; Mading, S.; Maziuk, D.; Miller, Z.; et al. BioMagResBank. Nucleic Acids Res. 2008, 36, D402–D408. [Google Scholar] [CrossRef] [PubMed]
  9. Wishart, D.S.; Jewison, T.; Guo, A.C.; Wilson, M.; Knox, C.; Liu, Y.; Djoumbou, Y.; Mandal, R.; Aziat, F.; Dong, E.; et al. HMDB 3.0—The human metabolome database in 2013. Nucleic Acids Res. 2013, 41, D801–D807. [Google Scholar] [CrossRef] [PubMed]
  10. Zhu, Z.J.; Schultz, A.W.; Wang, J.; Johnson, C.H.; Yannone, S.M.; Patti, G.J.; Siuzdak, G. Liquid chromatography quadrupole time-of-flight mass spectrometry characterization of metabolites guided by the METLIN database. Nat. Protocols 2013, 8, 451–460. [Google Scholar] [CrossRef] [PubMed]
  11. Bingol, K.; Li, D.W.; Zhang, B.; Brüschweiler, R. Comprehensive metabolite identification strategy using multiple two-dimensional nmr spectra of a complex mixture implemented in the COLMARm web server. Anal. Chem. 2016, 88, 12411–12418. [Google Scholar] [CrossRef] [PubMed]
  12. Koehn, F.E.; Carter, G.T. The evolving role of natural products in drug discovery. Nat. Rev. Drug Discov. 2005, 4, 206–220. [Google Scholar] [CrossRef] [PubMed]
  13. Wang, Y.; Kora, G.; Bowen, B.P.; Pan, C. MIDAS: A database-searching algorithm for metabolite identification in metabolomics. Anal. Chem. 2014, 86, 9496–9503. [Google Scholar] [CrossRef] [PubMed]
  14. Duhrkop, K.; Shen, H.; Meusel, M.; Rousu, J.; Bocker, S. Searching molecular structure databases with tandem mass spectra using CSI:FingerID. Proc. Natl. Acad. Sci. USA 2015, 112, 12580–12585. [Google Scholar] [CrossRef] [PubMed]
  15. Ruttkies, C.; Schymanski, E.L.; Wolf, S.; Hollender, J.; Neumann, S. Metfrag relaunched: Incorporating strategies beyond in silico fragmentation. J. Cheminform. 2016, 8, 3. [Google Scholar] [CrossRef] [PubMed]
  16. Bingol, K.; Zhang, F.; Bruschweiler-Li, L.; Brüschweiler, R. Carbon backbone topology of the metabolome of a cell. J. Am. Chem. Soc. 2012, 134, 9006–9011. [Google Scholar] [CrossRef] [PubMed]
  17. Clendinen, C.S.; Pasquel, C.; Ajredini, R.; Edison, A.S. 13C NMR metabolomics: Inadequate network analysis. Anal. Chem. 2015, 87, 5698–5706. [Google Scholar] [CrossRef] [PubMed]
  18. Komatsu, T.; Ohishi, R.; Shino, A.; Kikuchi, J. Structure and metabolic-flow analysis of molecular complexity in a 13C-labeled tree by 2D and 3D NMR. Angew. Chem. 2016, 128, 6104–6107. [Google Scholar] [CrossRef]
  19. Bingol, K.; Bruschweiler-Li, L.; Yu, C.; Somogyi, A.; Zhang, F.; Brüschweiler, R. Metabolomics beyond spectroscopic databases: A combined MS/NMR strategy for the rapid identification of new metabolites in complex mixtures. Anal. Chem. 2015, 87, 3864–3870. [Google Scholar] [CrossRef] [PubMed]
  20. Wang, C.; He, L.; Li, D.W.; Bruschweiler-Li, L.; Marshall, A.G.; Brüschweiler, R. Accurate identification of unknown and known metabolic mixture components by combining 3D NMR with fourier transform ion cyclotron resonance tandem mass spectrometry. J. Proteome Res. 2017, 16, 3774–3786. [Google Scholar] [CrossRef] [PubMed]
  21. Pence, H.E.; Williams, A. ChemSpider: An online chemical information resource. J. Chem. Educ. 2010, 87, 1123–1124. [Google Scholar] [CrossRef]
  22. Bodenhausen, G.; Ruben, D.J. Natural abundance N15 nmr by enhanced heteronuclear spectroscopy. Chem. Phys. Lett. 1980, 69, 185–189. [Google Scholar] [CrossRef] [Green Version]
  23. Braunschweiler, L.; Ernst, R.R. Coherence transfer by isotropic mixing—Application to proton correlation spectroscopy. J. Magn. Reson. 1983, 53, 521–528. [Google Scholar] [CrossRef]
  24. Bax, A.; Summers, M.F. H-1 and C-13 assignments from sensitivity-enhanced detection of heteronuclear multiple-bond connectivity by 2D multiple quantum NMR. J. Am. Chem. Soc. 1986, 108, 2093–2094. [Google Scholar] [CrossRef]
  25. Bingol, K.; Li, D.W.; Bruschweiler-Li, L.; Cabrera, O.A.; Megraw, T.; Zhang, F.; Brüschweiler, R. Unified and isomer-specific NMR metabolomics database for the accurate analysis of 13C-1H HSQC spectra. ACS Chem. Biol. 2015, 10, 452–459. [Google Scholar] [CrossRef] [PubMed]
  26. Kind, T.; Fiehn, O. Metabolomic database annotations via query of elemental compositions: Mass accuracy is insufficient even at less than 1 ppm. BMC Bioinform. 2006, 7, 234. [Google Scholar] [CrossRef] [PubMed]
  27. Benecke, C.; Grund, R.; Hohberger, R.; Kerber, A.; Laue, R.; Wieland, T. Molgen+, a generator of connectivity isomers and stereoisomers for molecular-structure elucidation. Anal. Chim. Acta 1995, 314, 141–147. [Google Scholar] [CrossRef]
  28. Kanehisa, M.; Goto, S. KEGG: Kyoto encyclopedia of genes and genomes. Nucleic Acids Res. 2000, 28, 27–30. [Google Scholar] [CrossRef] [PubMed]
  29. Allen, F.; Greiner, R.; Wishart, D. Competitive fragmentation modeling of esi-ms/ms spectra for putative metabolite identification. Metabolomics 2015, 11, 98–110. [Google Scholar] [CrossRef]
  30. Metz, T.O.; Baker, E.S.; Schymanski, E.L.; Renslow, R.S.; Thomas, D.G.; Causon, T.J.; Webb, I.K.; Hann, S.; Smith, R.D.; Teeguarden, J.G. Integrating ion mobility spectrometry into mass spectrometry-based exposome measurements: What can it add and how far can it go? Bioanalysis 2017, 9, 81–98. [Google Scholar] [CrossRef] [PubMed]
  31. Chikayama, E.; Shimbo, Y.; Komatsu, K.; Kikuchi, J. The effect of molecular conformation on the accuracy of theoretical 1H and 13C chemical shifts calculated by ab initio methods for metabolic mixture analysis. J. Phys. Chem. B 2016, 120, 3479–3487. [Google Scholar] [CrossRef] [PubMed]
  32. Hoffmann, F.; Li, D.W.; Sebastiani, D.; Brüschweiler, R. Improved quantum chemical nmr chemical shift prediction of metabolites in aqueous solution toward the validation of unknowns. J. Phys. Chem. A 2017, 121, 3071–3078. [Google Scholar] [CrossRef] [PubMed]
  33. Lerner, L.; Bax, A. Sensitivity-enhanced two-dimensional heteronuclear relayed coherence transfer nmr-spectroscopy. J. Magn. Reson. 1986, 69, 375–380. [Google Scholar] [CrossRef]
  34. Tolstikov, V.; Costisella, B.; Weckwerth, W.; Zhang, B.; Fiehn, O. Accurate mass QTOF and MSn Ion trap measurements require additional NMR data for plant metabolites de-novo identification. In Proceedings of the 50th ASMS Conference on Mass Spectrometry and Allied Topics, Orlando, FL, USA, 2–6 June 2002; pp. 417–418. [Google Scholar]
  35. Kliebenstein, D.J.; Kroymann, J.; Brown, P.; Figuth, A.; Pedersen, D.; Gershenzon, J.; Mitchell-Olds, T. Genetic control of natural variation in arabidopsis glucosinolate accumulation. Plant Physiol. 2001, 126, 811–825. [Google Scholar] [CrossRef] [PubMed]
  36. Beekwilder, J.; van Leeuwen, W.; van Dam, N.M.; Bertossi, M.; Grandi, V.; Mizzi, L.; Soloviev, M.; Szabados, L.; Molthoff, J.W.; Schipper, B.; et al. The impact of the absence of aliphatic glucosinolates on insect herbivory in arabidopsis. PLoS ONE 2008, 3, e2068. [Google Scholar] [CrossRef] [PubMed]
  37. Higdon, J.V.; Delage, B.; Williams, D.E.; Dashwood, R.H. Cruciferous vegetables and human cancer risk: Epidemiologic evidence and mechanistic basis. Pharmacol. Res. 2007, 55, 224–236. [Google Scholar] [CrossRef] [PubMed]
  38. Bingol, K.; Brüschweiler, R. Knowns and unknowns in metabolomics identified by multidimensional nmr and hybrid ms/nmr methods. Curr. Opin. Biotechnol. 2017, 43, 17–24. [Google Scholar] [CrossRef] [PubMed]
  39. Walker, L.R.; Hoyt, D.W.; Walker, S.M., II; Ward, J.K.; Nicora, C.D.; Bingol, K. Unambiguous metabolite identification in high-throughput metabolomics by hybrid 1D 1H NMR/ESI MS1 approach. Magn. Reson. Chem. 2016, 54, 998–1003. [Google Scholar] [CrossRef] [PubMed]
  40. Delaglio, F.; Grzesiek, S.; Vuister, G.W.; Zhu, G.; Pfeifer, J.; Bax, A. Nmrpipe: A multidimensional spectral processing system based on unix pipes. J. Biomol. NMR 1995, 6, 277–293. [Google Scholar] [CrossRef] [PubMed]
  41. Pluskal, T.; Castillo, S.; Villar-Briones, A.; Oresic, M. Mzmine 2: Modular framework for processing, visualizing, and analyzing mass spectrometry-based molecular profile data. BMC Bioinform. 2010, 11, 395. [Google Scholar] [CrossRef] [PubMed]
Figure 1. Workflow of the NMR/MS2 approach on a single metabolite (valine) in the NMR spectrum.
Metabolites 08 00008 g001
Figure 2. Identification of methionine by the NMR/MS2 approach in a three-metabolite mixture. Magenta, light-blue and green boxes indicate HSQC peaks of glutamine, methionine and valine, respectively.
Metabolites 08 00008 g002
Figure 3. Identification of glucoraphanin in Arabidopsis extract by using the NMR/MS2 approach.
Metabolites 08 00008 g003
Table 1. MS2 results for ten commonly known metabolites.
Metabolitem/z appm bFormulaSize cScore dRank e
Phenylalanine166.08592C9H11NO218811.00001
Valine118.085010C5H11NO24530.92406
Nicotinate124.03920C6H5NO21000.89007
Pantothenate220.11742C9H17NO55630.89638
Glutamine147.074612C5H10N2O32830.840410
Methionine150.05755C5H11NO2S2120.895213
Isoleucine132.10162C6H13NO29620.872322
Proline116.07032C5H9NO25280.851526
Thymidine243.09711C10H14N2O59480.911040
Leucine132.10180C6H13NO29620.7002148
a Experimentally detected m/z ratio of [M + H]+; b m/z ratio difference (in units of ppm) between experimentally detected and theoretical m/z ratio of a given ion; c Number of structures for a given molecular formula (obtained with ChemSpider); d Matching score between experimental and predicted MS2 of a given metabolite (obtained with MetFrag), where 1.0 represents the best score. The score goes toward 0 as the agreement between experimental and predicted MS2 decreases; e Rank-ordered agreement between experimental and predicted MS2 of a given metabolite (obtained with MetFrag).
Table 2. NMR results for ten commonly known metabolites.
MetaboliteSize a1H b13C cRank dRank e
Phenylalanine18810.12242.850522
Valine4530.07730.665311
Nicotinate1000.11873.131711
Pantothenate5630.13200.8340416
Glutamine2830.08521.447311
Methionine2120.20940.967011
Isoleucine9620.09232.282711
Proline5280.30771.090822
Thymidine9480.19592.089922
Leucine9620.12201.572013
a Number of structures for a given molecular formula (obtained with ChemSpider); b Average 1H chemical shift difference (in units of ppm) between predicted and experimental chemical shifts for a given metabolite; c Average 13C chemical shift difference (in units of ppm) between predicted and experimental chemical shifts for a given metabolite; d Rank-ordered agreement between predicted and experimental chemical shifts of a given metabolite when the metabolite is the only unknown in the NMR spectrum; e Rank-ordered agreement between predicted and experimental chemical shifts of a given metabolite when the metabolite is one of the ten unknowns in the NMR spectrum.

