
Non-Targeted Metabolomics Analysis of the Effects of Tyrosine Kinase Inhibitors Sunitinib and Erlotinib on Heart, Muscle, Liver and Serum Metabolism In Vivo

 , ,
, ,
Abstract
:1. Introduction
2. Results
3. Discussion
4. Materials and Methods
4.1. Animals, Experimental Design, Drug Delivery, and Harvest
4.2 Non-Targeted Metabolomics Determination by GC–MS Instrumentation
4.3 Metabolomic Statistical Analyses
4.4 Other Statistical Analyses.
Supplementary Materials
Acknowledgments
Author Contributions
Conflicts of Interest
Abbreviations
| DHA | docosahexaenoic acid |
| EPA | eicosapentaenoic acid |
| EGFR | epidermal growth factor receptor |
| IHD | ischemic heart disease |
| TKI | tyrosine kinase inhibitor |
| VEGFR | vascular endothelial growth factor receptor |
References
- Krause, D.S.; Van Etten, R.A. Tyrosine kinases as targets for cancer therapy. N. Engl. J. Med. 2005, 353, 172–187. [Google Scholar] [CrossRef] [PubMed]
- Manning, G.; Whyte, D.B.; Martinez, R.; Hunter, T.; Sudarsanam, S. The protein kinase complement of the human genome. Science 2002, 298, 1912–1934. [Google Scholar] [CrossRef] [PubMed]
- Steeghs, N.; Nortier, J.W.; Gelderblom, H. Small molecule tyrosine kinase inhibitors in the treatment of solid tumors: An update of recent developments. Ann. Surg. Oncol. 2007, 14, 942–953. [Google Scholar] [CrossRef] [PubMed]
- Dy, G.K.; Adjei, A.A. Understanding, recognizing, and managing toxicities of targeted anticancer therapies. CA Cancer J. Clin. 2013, 63, 249–279. [Google Scholar] [CrossRef] [PubMed]
- Srikanthan, A.; Ethier, J.L.; Ocana, A.; Seruga, B.; Krzyzanowska, M.K.; Amir, E. Cardiovascular toxicity of multi-tyrosine kinase inhibitors in advanced solid tumors: A population-based observational study. PLoS ONE 2015, 10, e0122735. [Google Scholar] [CrossRef] [PubMed]
- Patras de Campaigno, E.; Bondon-Guitton, E.; Laurent, G.; Montastruc, F.; Montastruc, J.L.; Lapeyre-Mestre, M.; Despas, F. Identification of cellular targets involved in cardiac failure caused by pki in oncology: An approach combining pharmacovigilance and pharmacodynamics. Br. J. Clin. Pharmacol. 2017, 83, 1544–1555. [Google Scholar] [CrossRef] [PubMed]
- Jacob, F.; Yonis, A.Y.; Cuello, F.; Luther, P.; Schulze, T.; Eder, A.; Streichert, T.; Mannhardt, I.; Hirt, M.N.; Schaaf, S.; et al. Analysis of tyrosine kinase inhibitor-mediated decline in contractile force in rat engineered heart tissue. PLoS ONE 2016, 11, e0145937. [Google Scholar] [CrossRef] [PubMed]
- Henderson, K.A.; Borders, R.B.; Ross, J.B.; Huwar, T.B.; Travis, C.O.; Wood, B.J.; Ma, Z.J.; Hong, S.P.; Vinci, T.M.; Roche, B.M. Effects of tyrosine kinase inhibitors on rat isolated heart function and protein biomarkers indicative of toxicity. J. Pharmacol. Toxicol. Methods 2013, 68, 150–159. [Google Scholar] [CrossRef] [PubMed]
- Will, Y.; Dykens, J.A.; Nadanaciva, S.; Hirakawa, B.; Jamieson, J.; Marroquin, L.D.; Hynes, J.; Patyna, S.; Jessen, B.A. Effect of the multitargeted tyrosine kinase inhibitors imatinib, dasatinib, sunitinib, and sorafenib on mitochondrial function in isolated rat heart mitochondria and h9c2 cells. Toxicol. Sci. 2008, 106, 153–161. [Google Scholar] [CrossRef] [PubMed]
- Escalante, C.P.; Chang, Y.C.; Liao, K.; Rouleau, T.; Halm, J.; Bossi, P.; Bhadriraju, S.; Brito-Dellan, N.; Sahai, S.; Yusuf, S.W.; et al. Meta-analysis of cardiovascular toxicity risks in cancer patients on selected targeted agents. Support. Care Cancer 2016, 24, 4057–4074. [Google Scholar] [CrossRef] [PubMed]
- Doherty, K.R.; Wappel, R.L.; Talbert, D.R.; Trusk, P.B.; Moran, D.M.; Kramer, J.W.; Brown, A.M.; Shell, S.A.; Bacus, S. Multi-parameter in vitro toxicity testing of crizotinib, sunitinib, erlotinib, and nilotinib in human cardiomyocytes. Toxicol. Appl. Pharmacol. 2013, 272, 245–255. [Google Scholar] [CrossRef] [PubMed]
- Blanca, A.J.; Ruiz-Armenta, M.V.; Zambrano, S.; Miguel-Carrasco, J.L.; Arias, J.L.; Arevalo, M.; Mate, A.; Aramburu, O.; Vazquez, C.M. Inflammatory and fibrotic processes are involved in the cardiotoxic effect of sunitinib: Protective role of l-carnitine. Toxicol. Lett. 2016, 241, 9–18. [Google Scholar] [CrossRef] [PubMed]
- Hashita, T.; Katsuyama, Y.; Nakamura, K.; Momose, Y.; Komatsu, D.; Koide, N.; Miyagawa, S.; Nakamura, T.; Yamamoto, K.; Ohmori, S. Treatment of a gist patient with modified dose of sunitinib by measurement of plasma drug concentrations. Oncol. Lett. 2012, 4, 501–504. [Google Scholar] [PubMed]
- Mendel, D.B.; Laird, A.D.; Xin, X.; Louie, S.G.; Christensen, J.G.; Li, G.; Schreck, R.E.; Abrams, T.J.; Ngai, T.J.; Lee, L.B.; et al. In vivo antitumor activity of su11248, a novel tyrosine kinase inhibitor targeting vascular endothelial growth factor and platelet-derived growth factor receptors: Determination of a pharmacokinetic/pharmacodynamic relationship. Clin. Cancer Res. 2003, 9, 327–337. [Google Scholar] [PubMed]
- Schem, C.; Bauerschlag, D.; Bender, S.; Lorenzen, A.C.; Loermann, D.; Hamann, S.; Rosel, F.; Kalthoff, H.; Gluer, C.C.; Jonat, W.; et al. Preclinical evaluation of sunitinib as a single agent in the prophylactic setting in a mouse model of bone metastases. BMC Cancer 2013, 13, 32. [Google Scholar] [CrossRef] [PubMed]
- Frohna, P.; Lu, J.; Eppler, S.; Hamilton, M.; Wolf, J.; Rakhit, A.; Ling, J.; Kenkare-Mitra, S.R.; Lum, B.L. Evaluation of the absolute oral bioavailability and bioequivalence of erlotinib, an inhibitor of the epidermal growth factor receptor tyrosine kinase, in a randomized, crossover study in healthy subjects. J. Clin. Pharmacol. 2006, 46, 282–290. [Google Scholar] [CrossRef] [PubMed]
- Deeken, J.F.; Beumer, J.H.; Anders, N.M.; Wanjiku, T.; Rusnak, M.; Rudek, M.A. Preclinical assessment of the interactions between the antiretroviral drugs, ritonavir and efavirenz, and the tyrosine kinase inhibitor erlotinib. Cancer Chemother. Pharmacol. 2015, 76, 813–819. [Google Scholar] [CrossRef] [PubMed]
- Mueller, E.W.; Rockey, M.L.; Rashkin, M.C. Sunitinib-related fulminant hepatic failure: Case report and review of the literature. Pharmacotherapy 2008, 28, 1066–1070. [Google Scholar] [CrossRef] [PubMed]
- Arora, A.K. Erlotinib-induced hepatotoxicity-clinical presentation and successful management: A case report. J. Clin. Exp. Hepatol. 2011, 1, 38–40. [Google Scholar] [CrossRef]
- Shepherd, F.A.; Rodrigues Pereira, J.; Ciuleanu, T.; Tan, E.H.; Hirsh, V.; Thongprasert, S.; Campos, D.; Maoleekoonpiroj, S.; Smylie, M.; Martins, R.; et al. Erlotinib in previously treated non-small-cell lung cancer. N. Engl. J. Med. 2005, 353, 123–132. [Google Scholar] [CrossRef] [PubMed]
- Yang, Z.H.; Emma-Okon, B.; Remaley, A.T. Dietary marine-derived long-chain monounsaturated fatty acids and cardiovascular disease risk: A mini review. Lipids Health Dis. 2016, 15, 201. [Google Scholar] [CrossRef] [PubMed]
- Jiang, J.; Li, K.; Wang, F.; Yang, B.; Fu, Y.; Zheng, J.; Li, D. Effect of marine-derived n-3 polyunsaturated fatty acids on major eicosanoids: A systematic review and meta-analysis from 18 randomized controlled trials. PLoS ONE 2016, 11, e0147351. [Google Scholar] [CrossRef] [PubMed]
- Quehenberger, O.; Armando, A.M.; Brown, A.H.; Milne, S.B.; Myers, D.S.; Merrill, A.H.; Bandyopadhyay, S.; Jones, K.N.; Kelly, S.; Shaner, R.L.; et al. Lipidomics reveals a remarkable diversity of lipids in human plasma. J. Lipid Res. 2010, 51, 3299–3305. [Google Scholar] [CrossRef] [PubMed]
- Raphael, W.; Sordillo, L.M. Dietary polyunsaturated fatty acids and inflammation: The role of phospholipid biosynthesis. Int. J. Mol. Sci. 2013, 14, 21167–21188. [Google Scholar] [CrossRef] [PubMed]
- Doublet, A.; Robert, V.; Vedie, B.; Rousseau-Ralliard, D.; Reboulleau, A.; Grynberg, A.; Paul, J.L.; Fournier, N. Contrasting effects of arachidonic acid and docosahexaenoic acid membrane incorporation into cardiomyocytes on free cholesterol turnover. Biochim. Biophys. Acta 2014, 1842, 1413–1421. [Google Scholar] [CrossRef] [PubMed]
- Nair, S.S.; Leitch, J.W.; Falconer, J.; Garg, M.L. Prevention of cardiac arrhythmia by dietary (n-3) polyunsaturated fatty acids and their mechanism of action. J. Nutr. 1997, 127, 383–393. [Google Scholar] [PubMed]
- Xiao, Y.F.; Sigg, D.C.; Leaf, A. The antiarrhythmic effect of n-3 polyunsaturated fatty acids: Modulation of cardiac ion channels as a potential mechanism. J. Membr. Biol. 2005, 206, 141–154. [Google Scholar] [CrossRef] [PubMed]
- Endo, J.; Arita, M. Cardioprotective mechanism of omega-3 polyunsaturated fatty acids. J. Cardiol. 2016, 67, 22–27. [Google Scholar] [CrossRef] [PubMed]
- Bennett, M.; Gilroy, D.W. Lipid mediators in inflammation. Microbiol. Spectr. 2016, 4. [Google Scholar] [CrossRef]
- Souza, P.R.; Norling, L.V. Implications for eicosapentaenoic acid- and docosahexaenoic acid-derived resolvins as therapeutics for arthritis. Eur. J. Pharmacol. 2016, 785, 165–173. [Google Scholar] [CrossRef] [PubMed]
- Maskrey, B.H.; Megson, I.L.; Rossi, A.G.; Whitfield, P.D. Emerging importance of omega-3 fatty acids in the innate immune response: Molecular mechanisms and lipidomic strategies for their analysis. Mol. Nutr. Food Res. 2013, 57, 1390–1400. [Google Scholar] [CrossRef] [PubMed]
- Tassi, R.; Baldazzi, V.; Lapini, A.; Carini, M.; Mazzanti, R. Hyperlipidemia and hypothyroidism among metastatic renal cell carcinoma patients taking sunitinib malate. Related or unrelated adverse events? Clin. Genitourin. Cancer 2015, 13, 101–105. [Google Scholar] [CrossRef] [PubMed]
- Ferreira, A.K.; Freitas, V.M.; Levy, D.; Ruiz, J.L.; Bydlowski, S.P.; Rici, R.E.; Filho, O.M.; Chierice, G.O.; Maria, D.A. Anti-angiogenic and anti-metastatic activity of synthetic phosphoethanolamine. PLoS ONE 2013, 8, e57937. [Google Scholar] [CrossRef] [PubMed]
- Quintana, M.T.; Parry, T.L.; He, J.; Yates, C.C.; Sidorova, T.N.; Murray, K.T.; Bain, J.R.; Newgard, C.B.; Muehlbauer, M.J.; Eaton, S.C.; et al. Cardiomyocyte-specific human Bcl2-associated anthanogene 3 P209L expression induces mitochondrial fragmentation, Bcl2-associated anthanogene 3 haploinsufficiency, and activates p38 signaling. Am. J. Pathol. 2016, 186, 1989–2007. [Google Scholar] [CrossRef] [PubMed]
- Wadosky, K.M.; Berthiaume, J.M.; Tang, W.; Zungu, M.; Portman, M.A.; Gerdes, A.M.; Willis, M.S. Murf1 mono-ubiquitinates tralpha to inhibit t3-induced cardiac hypertrophy in vivo. J. Mol. Endocrinol. 2016, 56, 273–290. [Google Scholar] [CrossRef] [PubMed]
- Banerjee, R.; Bultman, S.J.; Holley, D.; Hillhouse, C.; Bain, J.R.; Newgard, C.B.; Muehlbauer, M.J.; Willis, M.S. Non-targeted metabolomics of brg1/brm double-mutant cardiomyocytes reveals a novel role for swi/snf complexes in metabolic homeostasis. Metabolomics 2015, 11, 1287–1301. [Google Scholar] [CrossRef] [PubMed]
- Xia, J.; Psychogios, N.; Young, N.; Wishart, D.S. Metaboanalyst: A web server for metabolomic data analysis and interpretation. Nucleic Acids Res. 2009, 37, 652–660. [Google Scholar] [CrossRef] [PubMed]
- Xia, J.; Sinelnikov, I.V.; Han, B.; Wishart, D.S. Metaboanalyst 3.0-making metabolomics more meaningful. Nucleic Acids Res. 2015, 43, 251–257. [Google Scholar] [CrossRef] [PubMed]
- Zheng, J.F.; Lu, J.; Wang, X.Z.; Guo, W.H.; Zhang, J.X. Comparative metabolomic profiling of hepatocellular carcinoma cells treated with sorafenib monotherapy vs. Sorafenib-everolimus combination therapy. Med. Sci. Monit. 2015, 21, 1781–1791. [Google Scholar] [CrossRef] [PubMed]


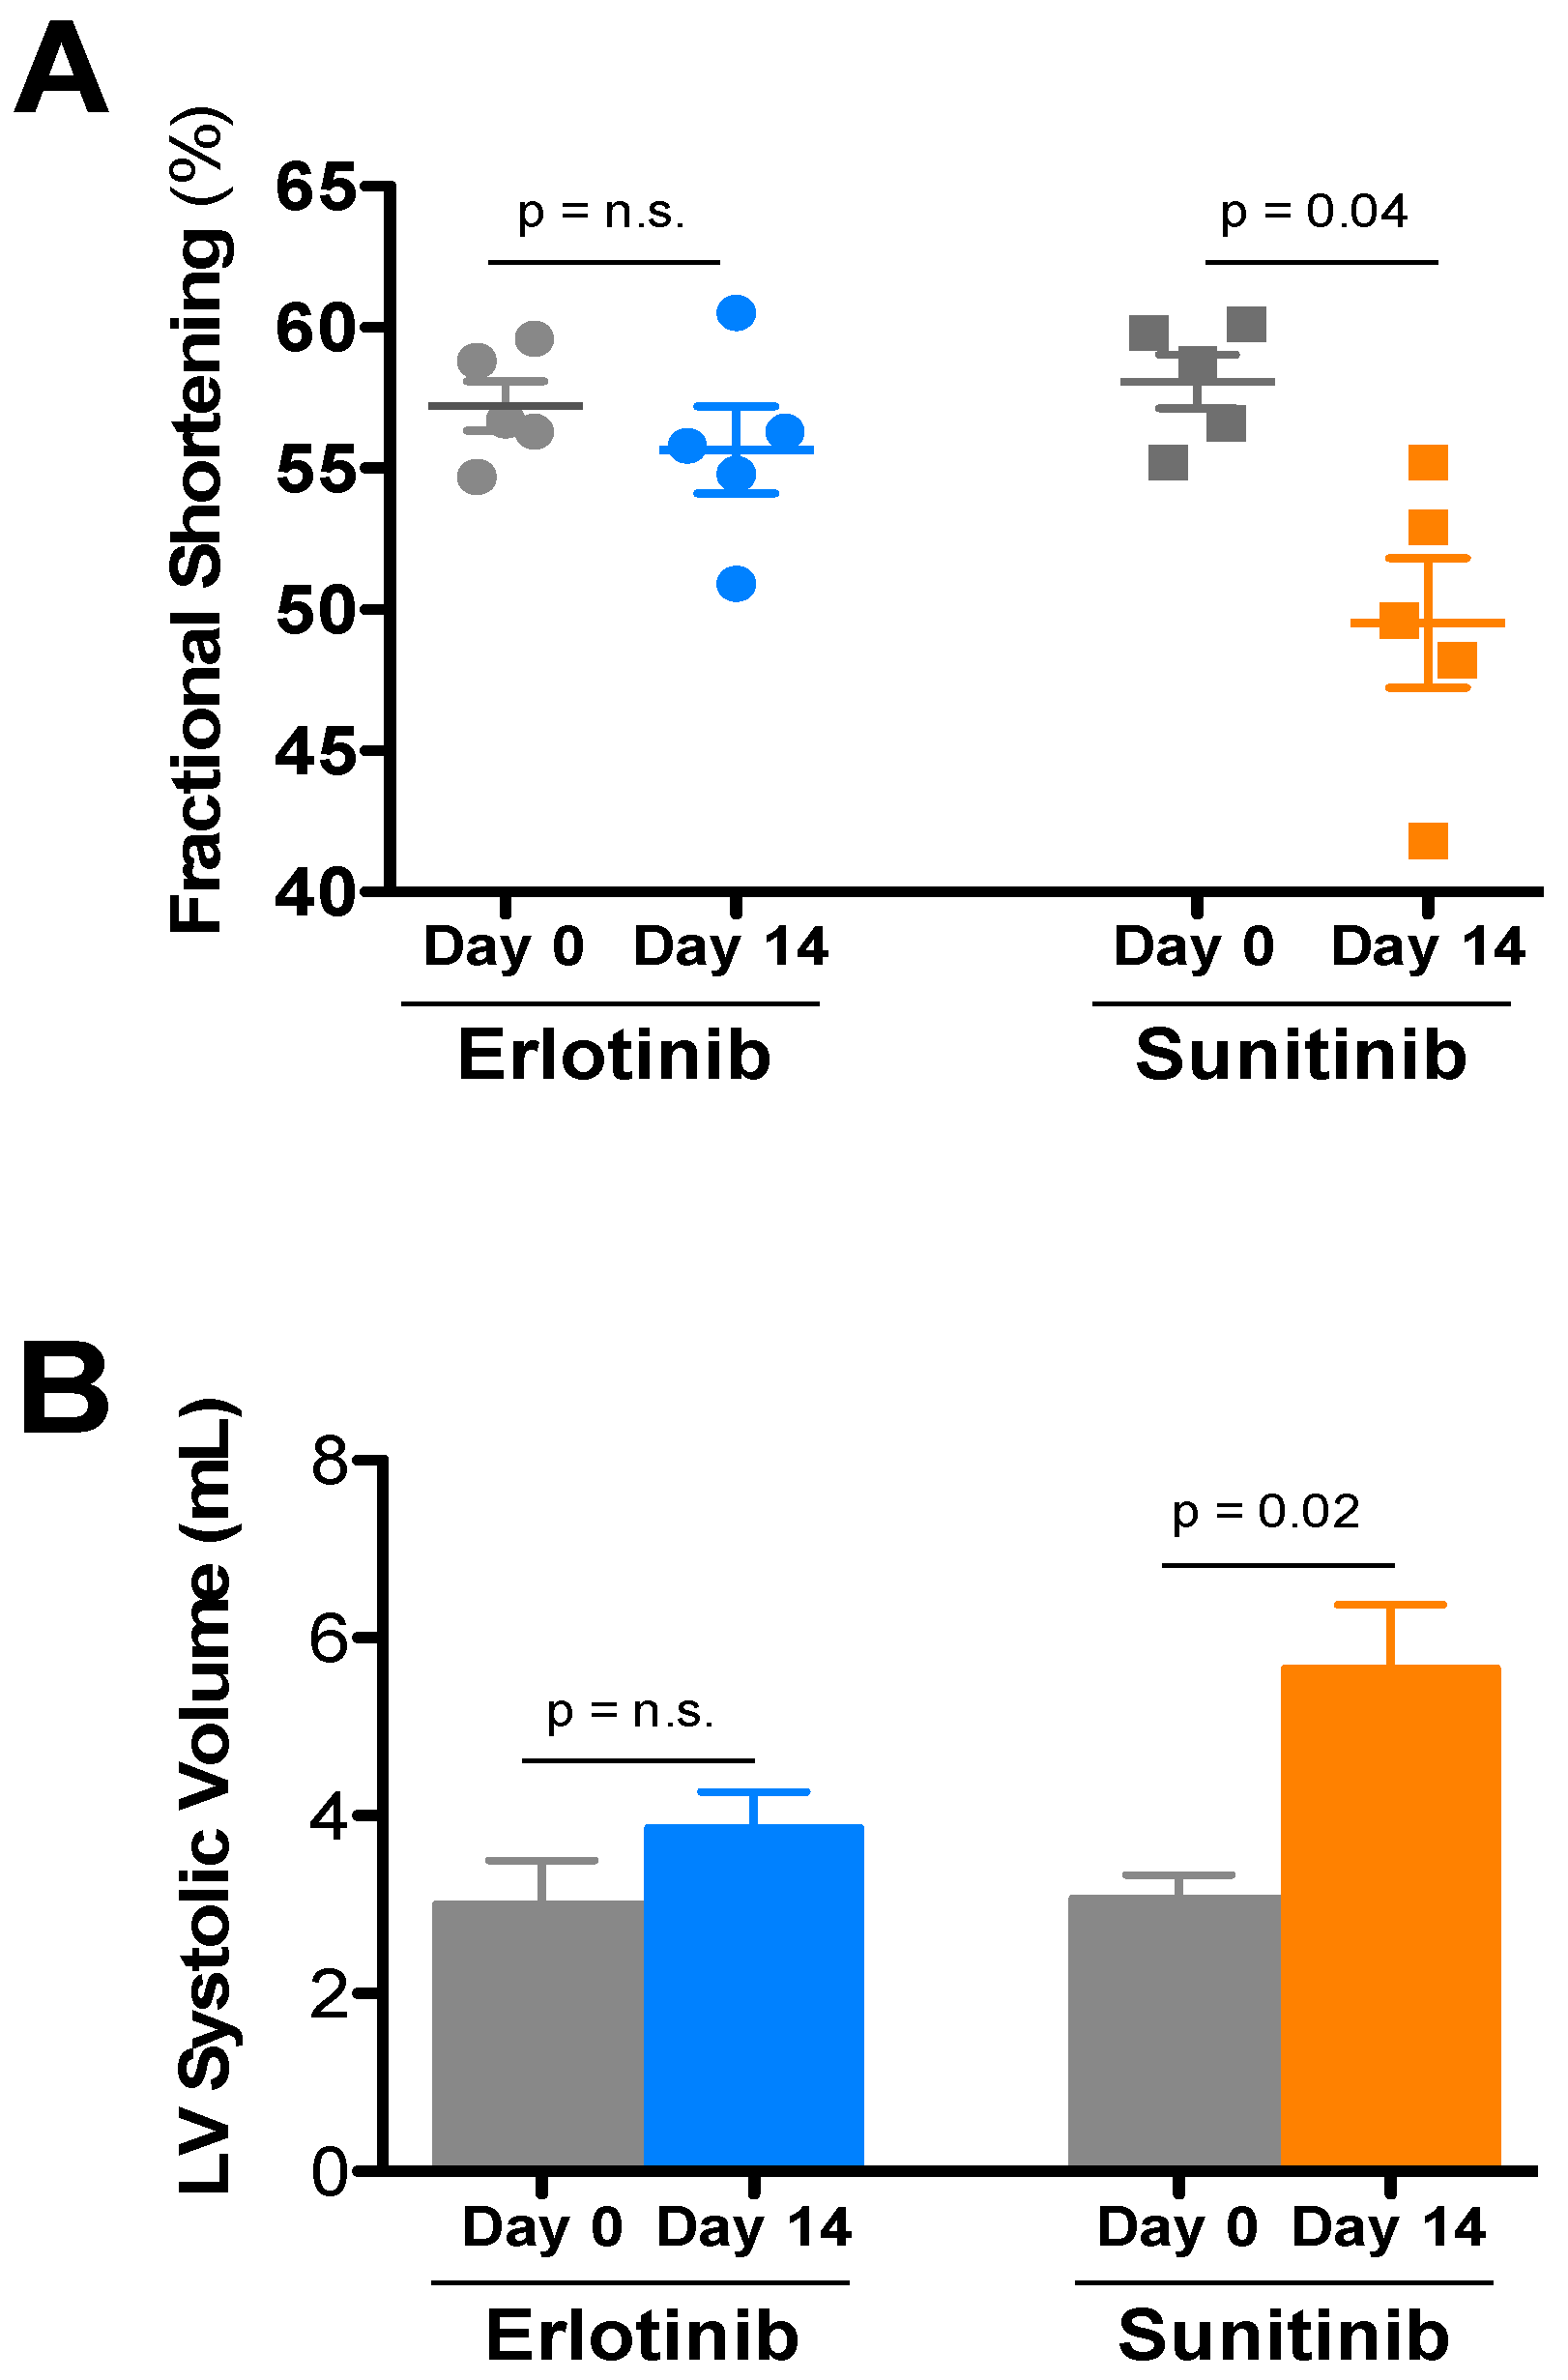
| Treatment | Day | HR | LVIDd | LVIDs | FS | LVd vol | LVs vol | IVSd | PWd |
|---|---|---|---|---|---|---|---|---|---|
| Sunitinib (5) | Day 0 | 684 ± 14 | 2.76 ± 0.06 | 1.16 ± 0.04 | 58.1 ± 0.9 | 28.6 ± 1.5 | 3.08 ± 0.26 | 0.93 ± 0.01 | 0.95 ± 0.04 |
| Day 14 | 683 ± 13 | 2.88 ± 0.08 | 1.45 ± 0.07 * | 49.5 ± 2.3 | 31.7 ± 2.1 | 5.66 ± 0.71 * | 0.87 ± 0.02 | 0.95 ± 0.06 | |
| Erlotinib (5) | Day 0 | 672 ± 23 | 2.66 ± 0.11 | 1.14 ± 0.06 | 57.2 ± 0.9 | 26.3 ± 2.7 | 3.00 ± 0.49 | 0.85 ± 0.05 | 0.96 ± 0.01 |
| Day 14 | 668 ± 12 | 2.84 ± 0.08 | 1.26 ± 0.05 | 55.7 ± 1.5 | 30.7 ± 2.1 | 3.86 ± 0.40 | 0.95 ± 0.03 | 1.00 ± 0.07 |
| Sunitinib Treatment | |||
|---|---|---|---|
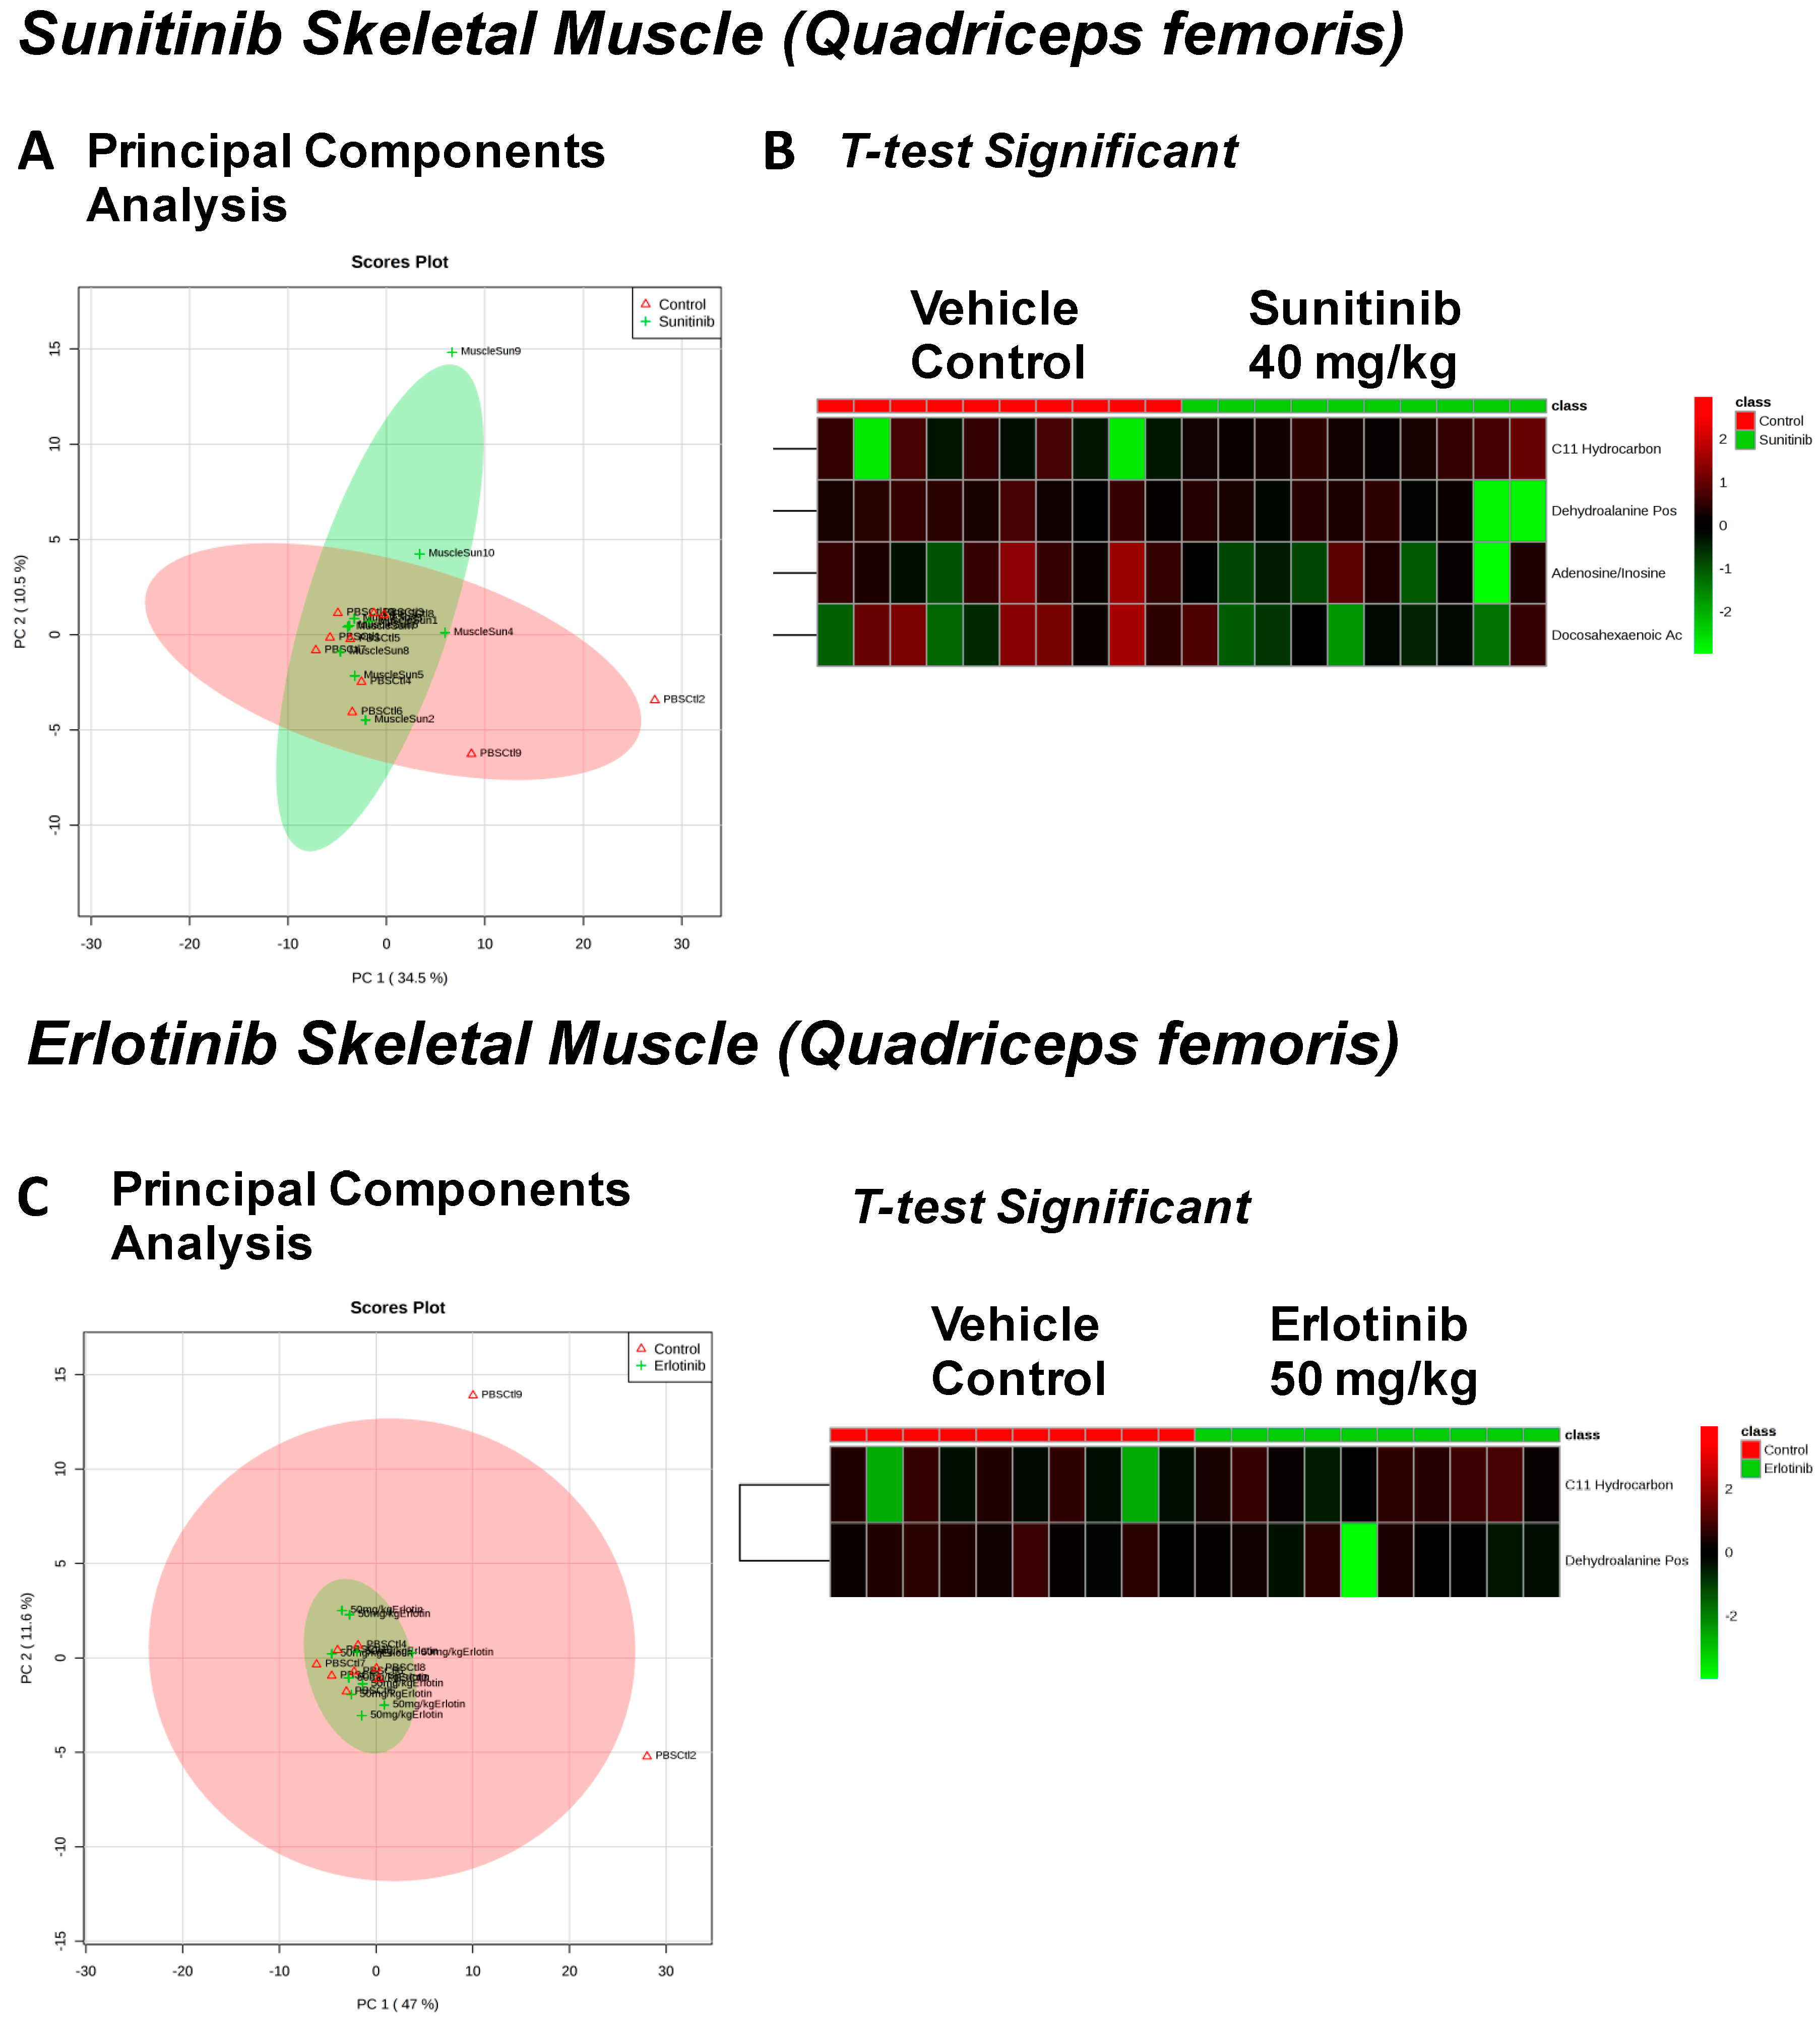
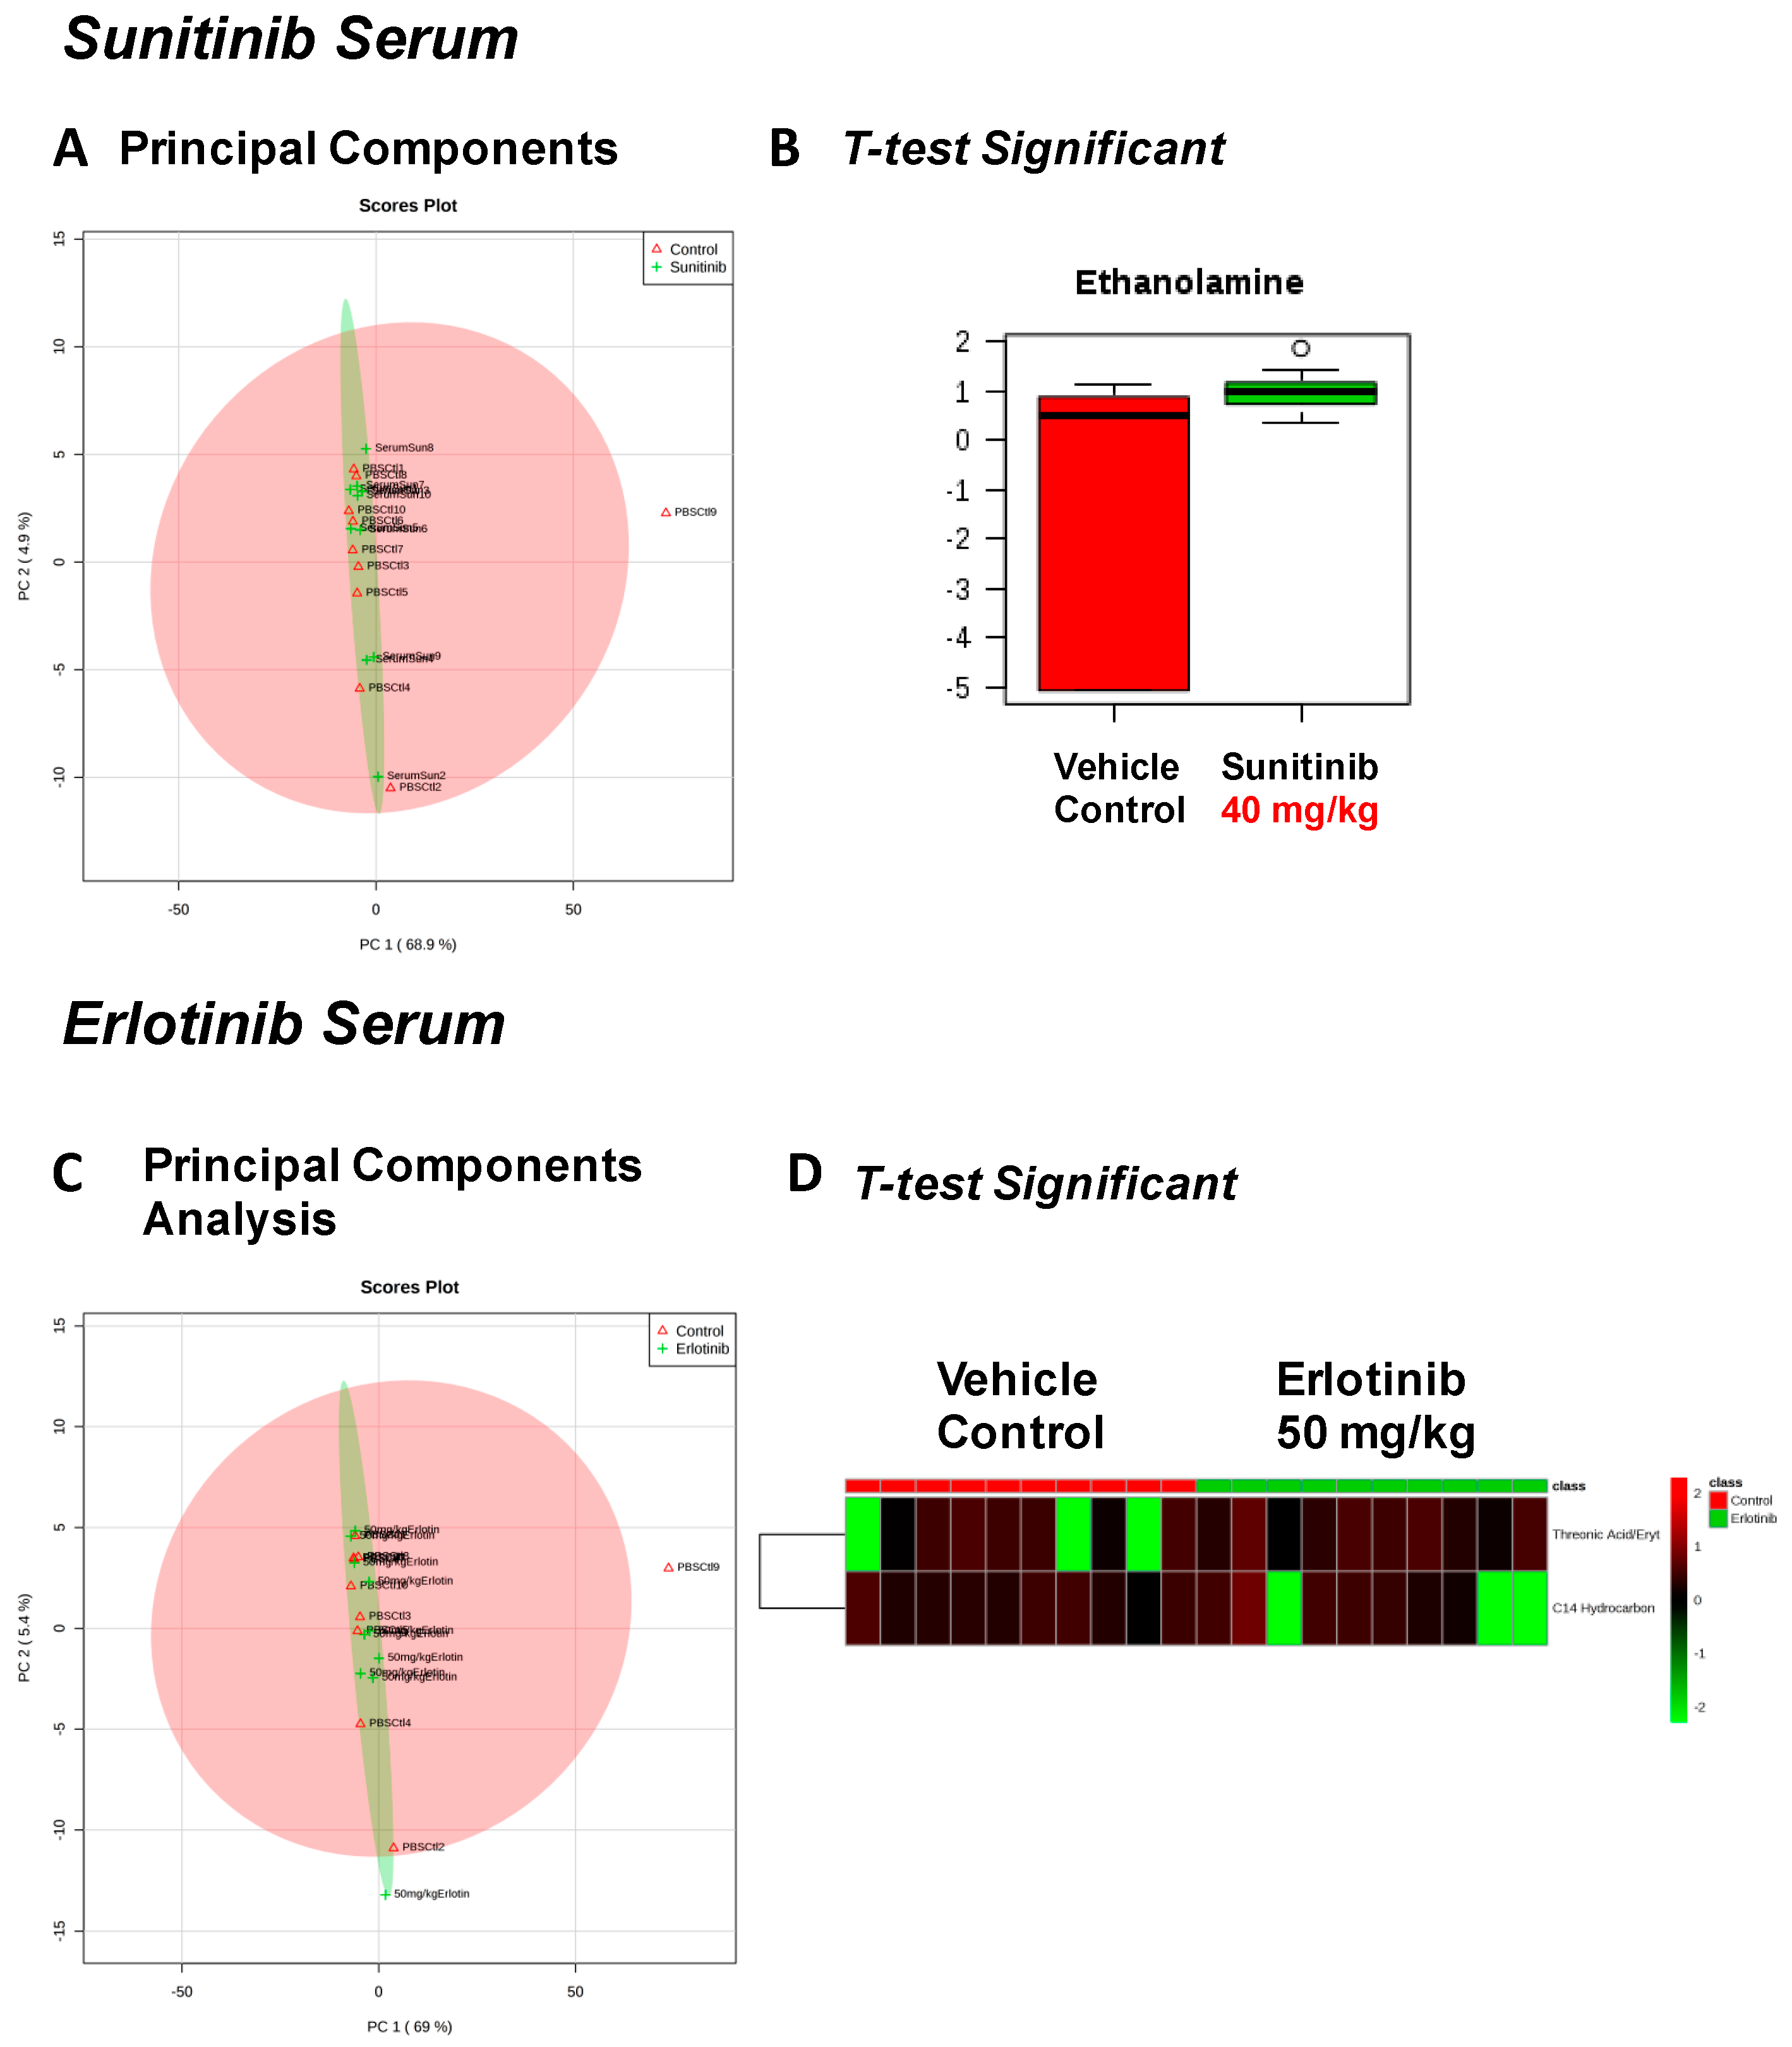
| Heart | Liver | Skeletal Muscle | Serum |
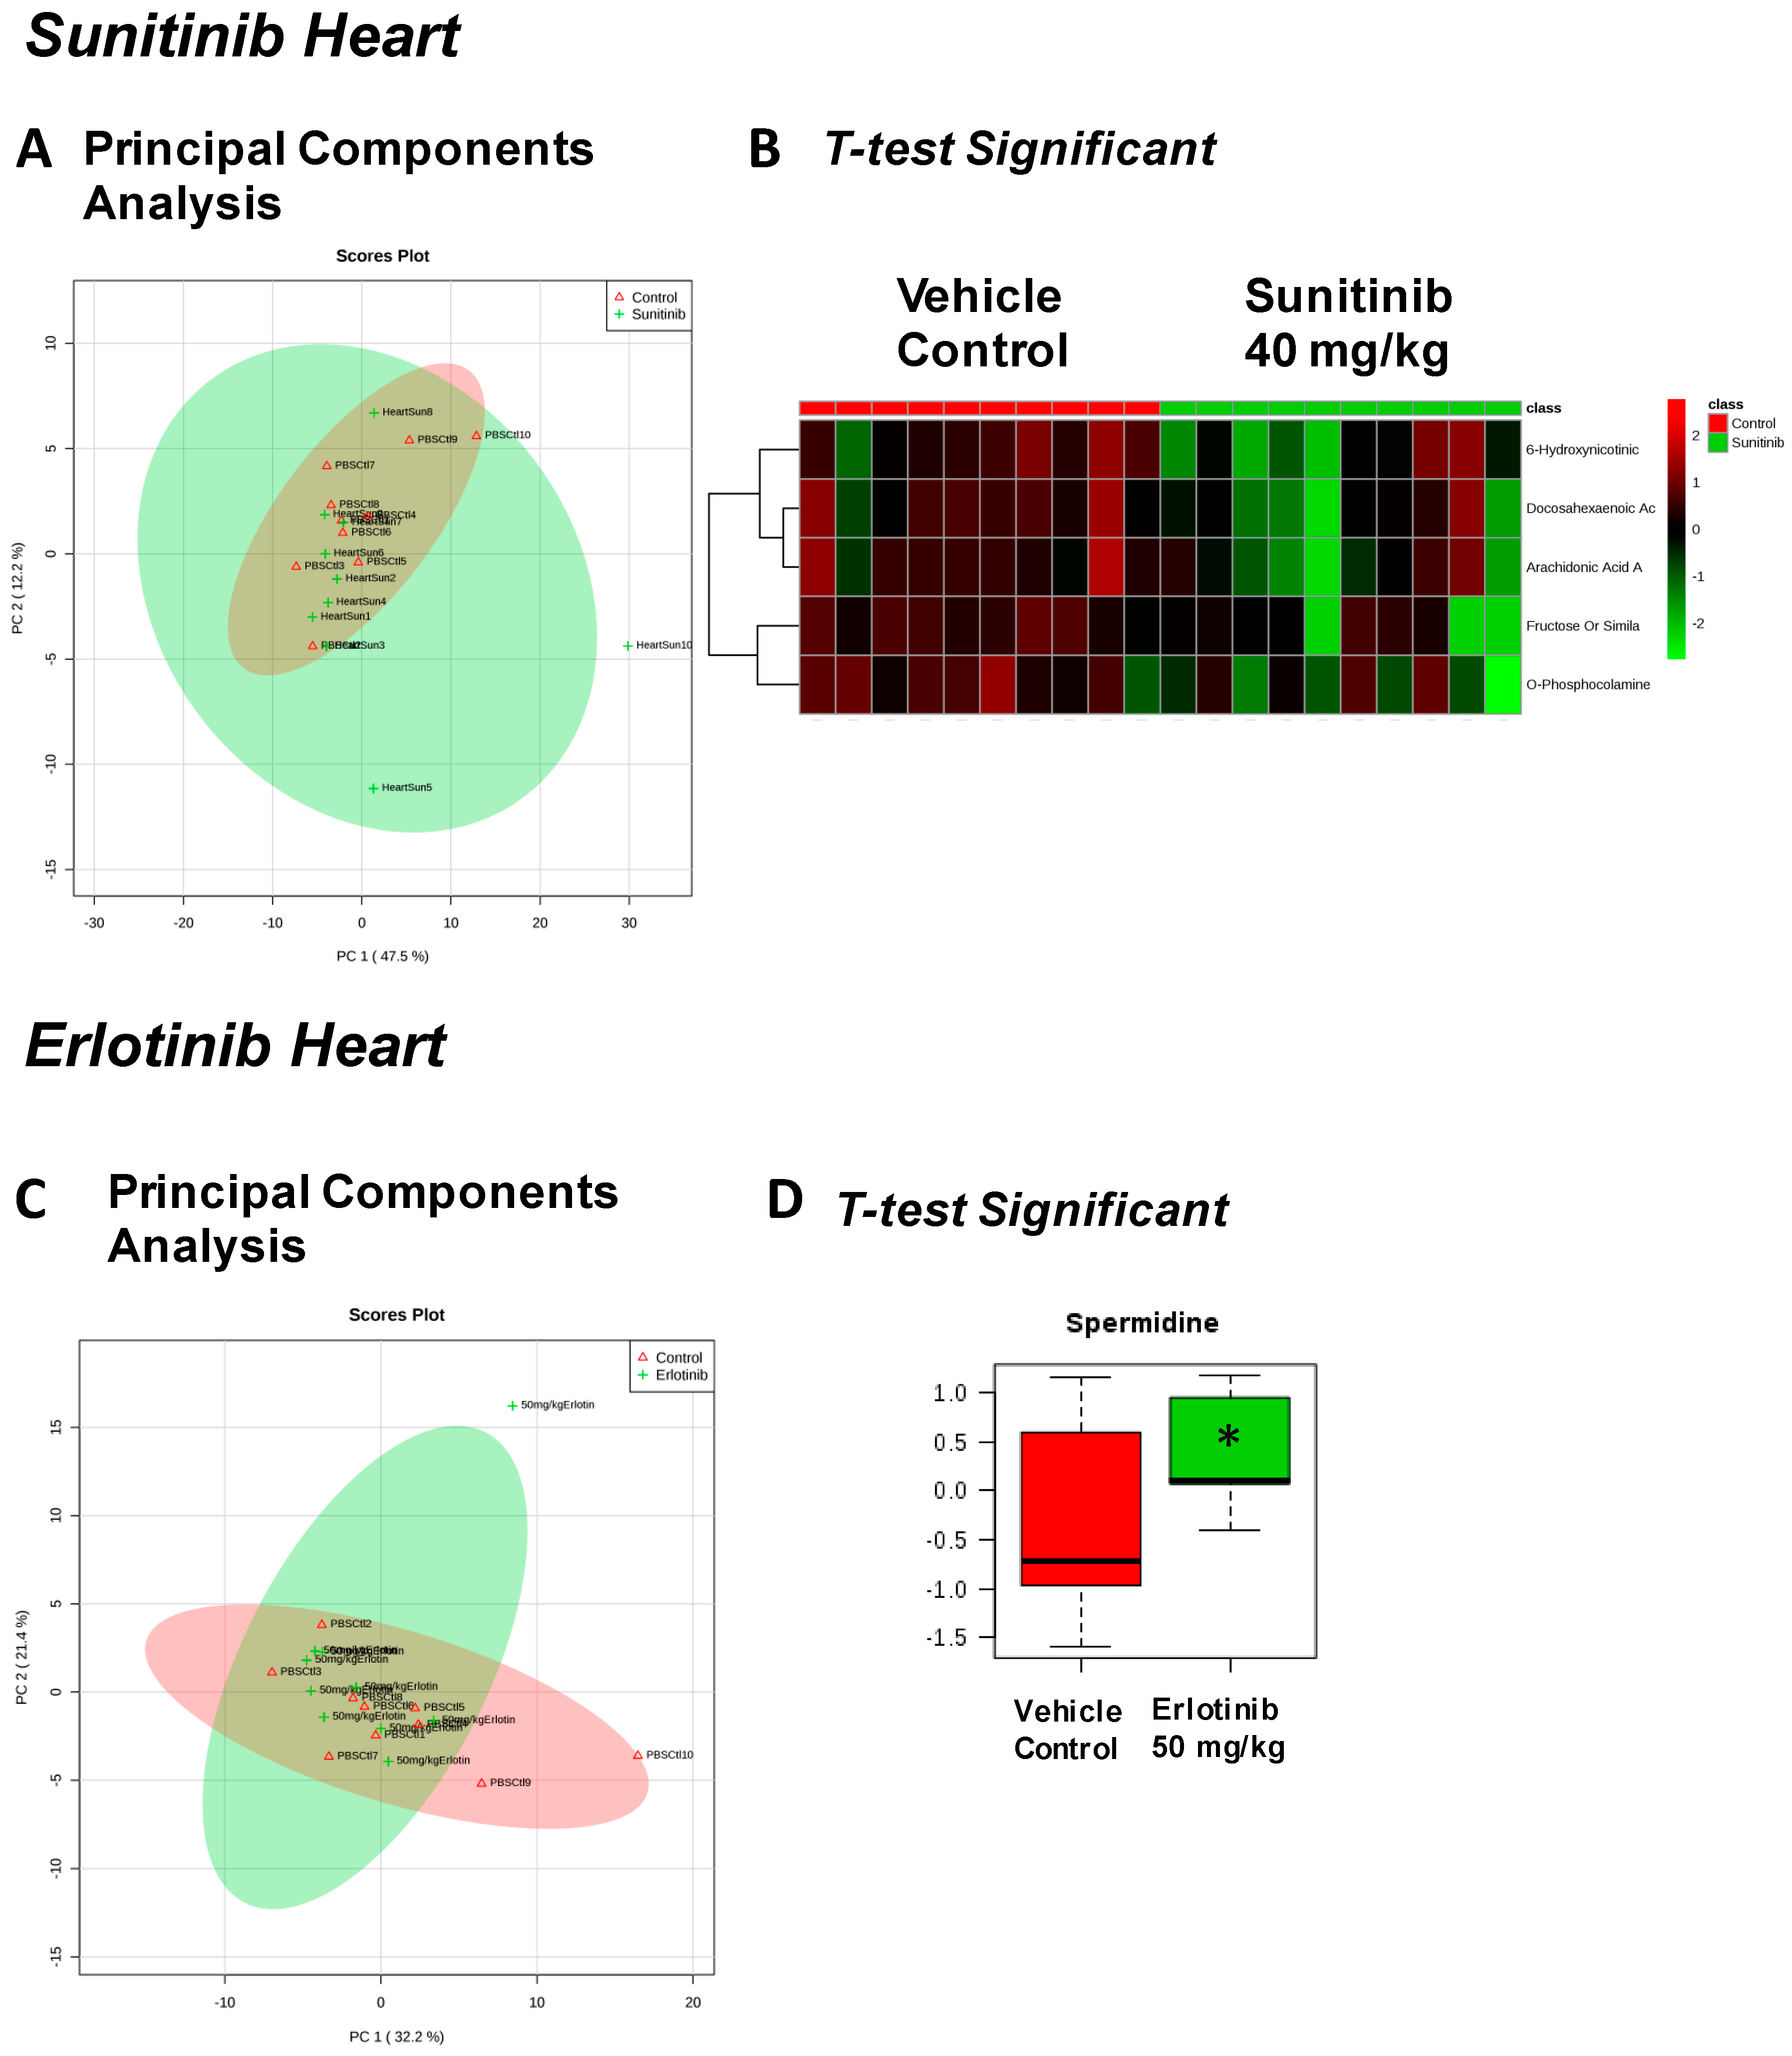
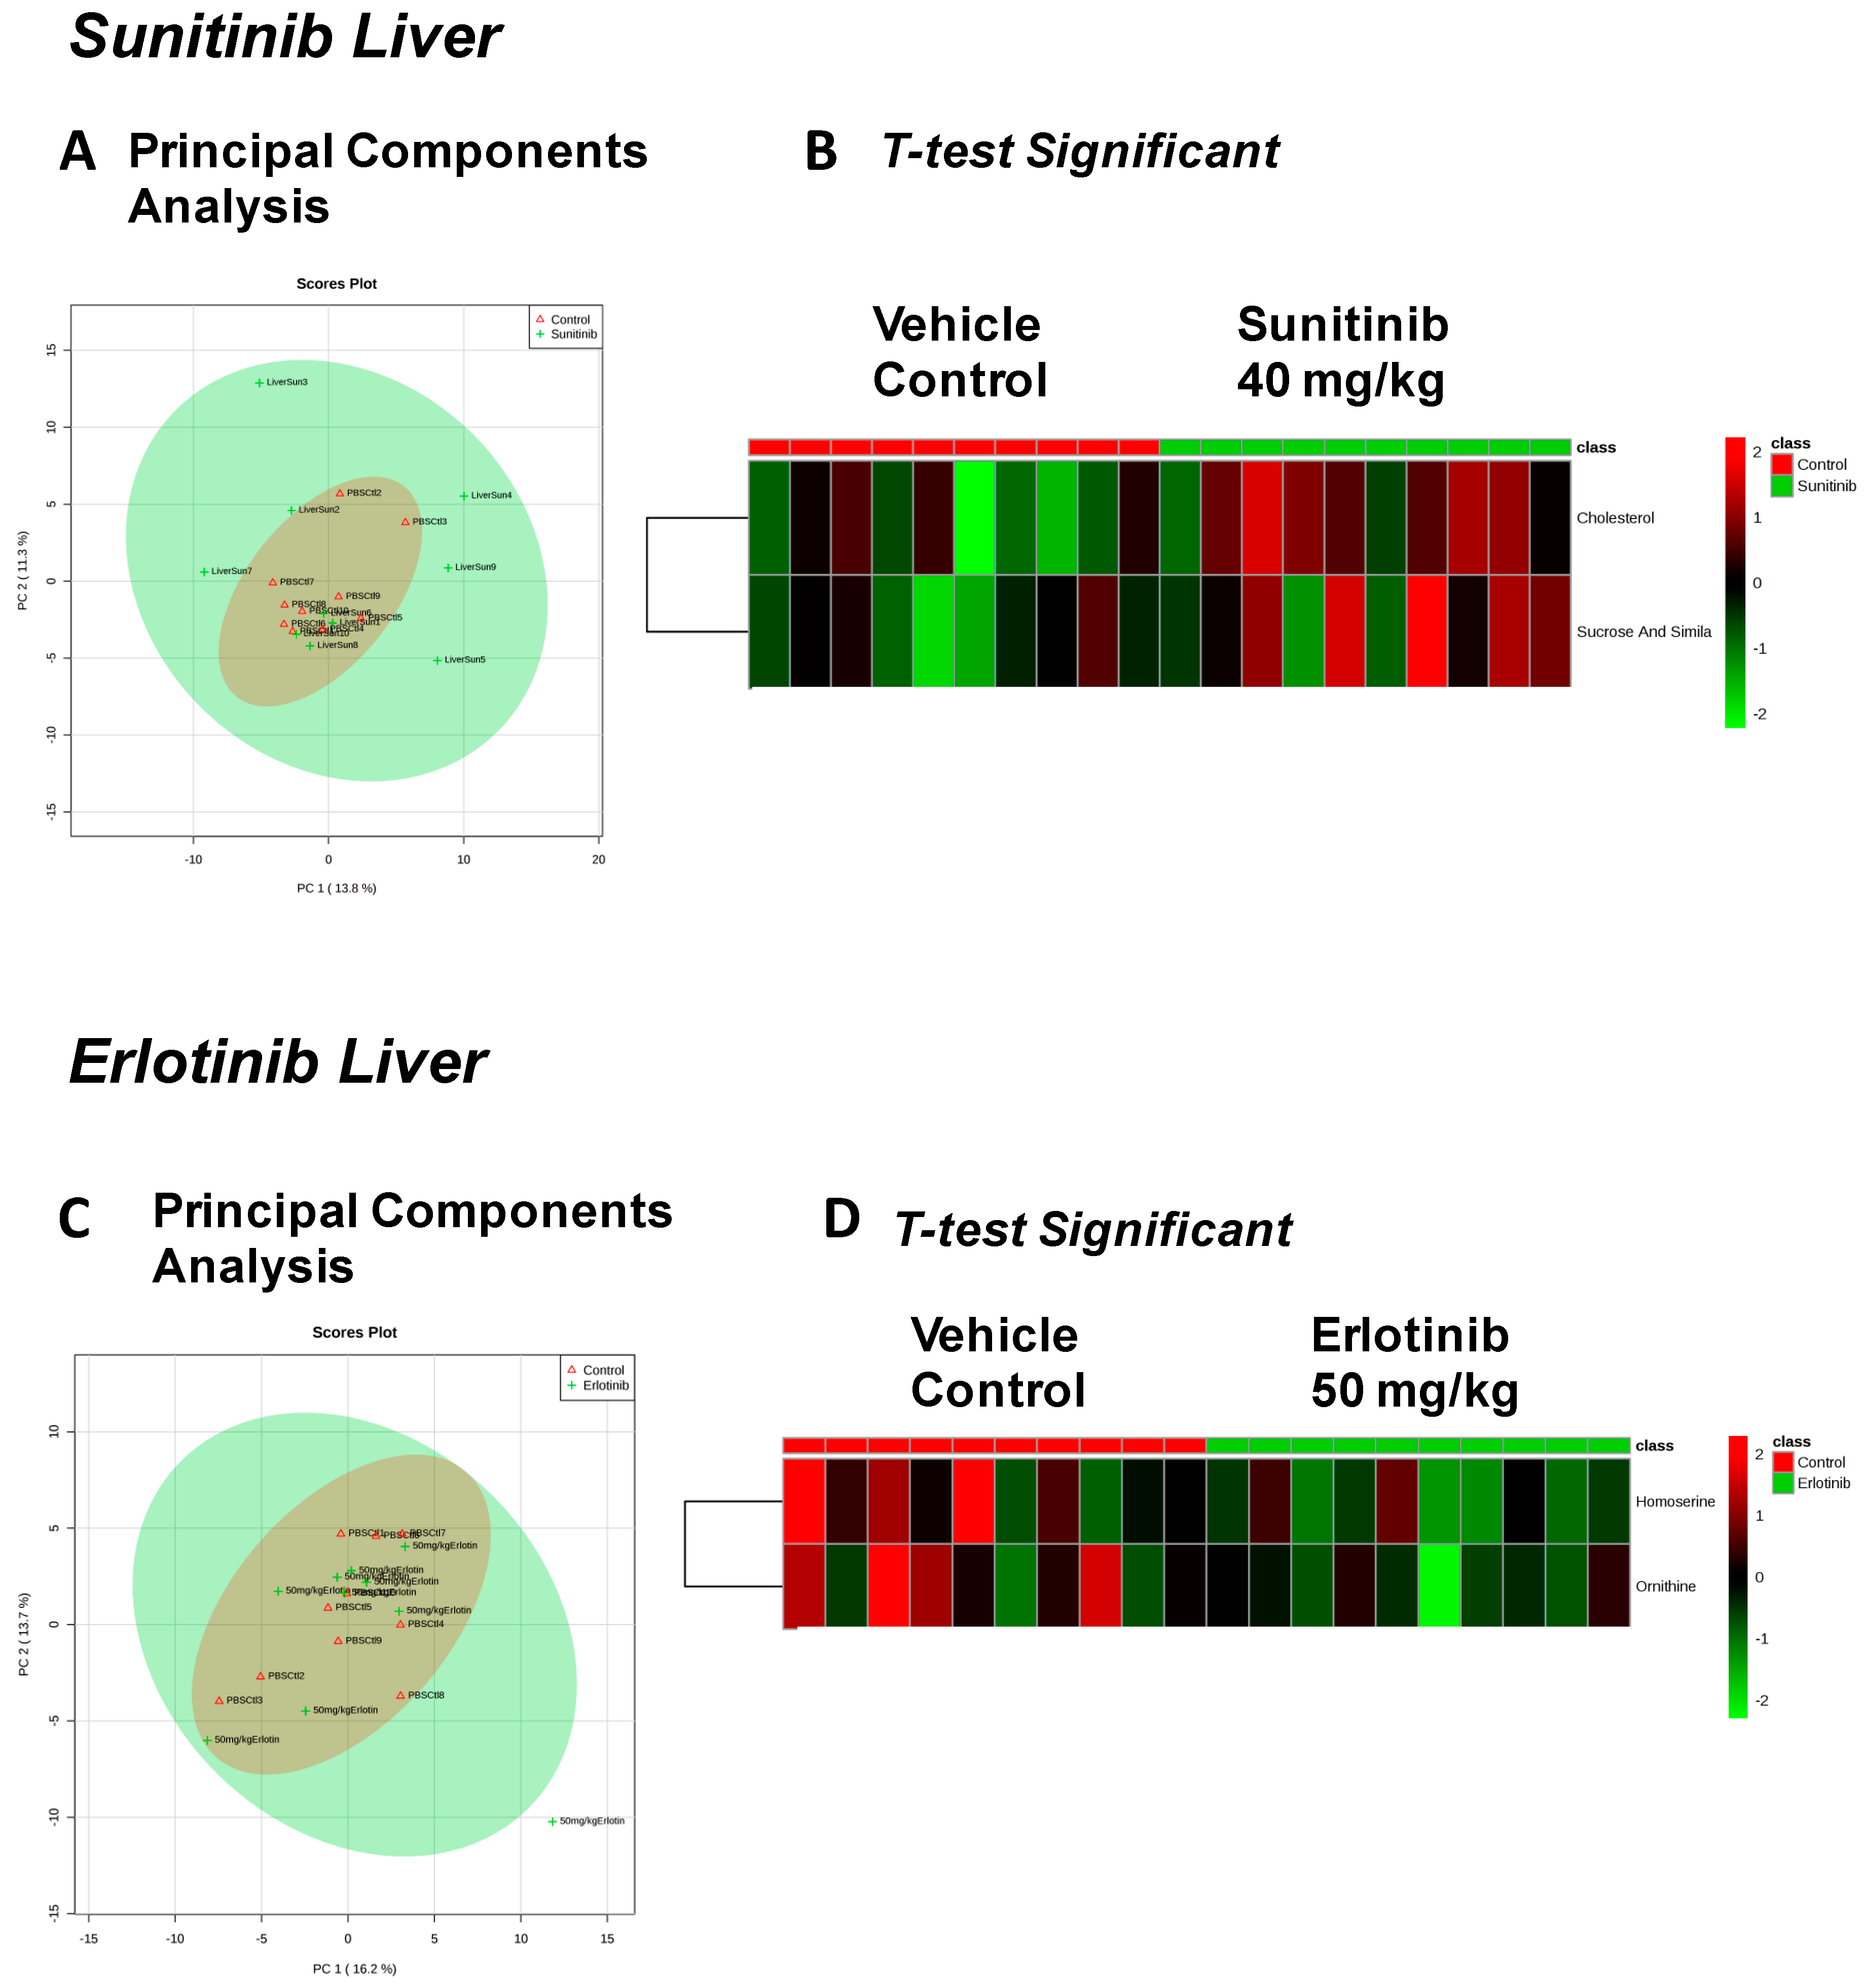
| Fructose Or Similar Ketohexose (↓) | Cholesterol (↑) | Adenosine/Inosine (↓) | Ethanolamine (↑) |
| Docosahexaenoic Acid (DHA) (↓) | Sucrose and Similar Disaccharides (↑) | Docosahexaenoic Acid (DHA) (↓) | |
| Arachidonic Acid Also Eicosapentaenoic Acid (EPA) (↓) | C11 Hydrocarbon (↓) | ||
| O-Phosphocolamine (↓) | Dehydroalanine Possibly From Cysteine (↓) | ||
| 6-Hydroxynicotinic Acid (↓) | |||
| Erlotinib Treatment | |||
|---|---|---|---|
| Heart | Liver | Skeletal Muscle | Serum |
| Spermidine (↑) | Homoserine (↓) | C11 Hydrocarbon (↓) | Threonic Acid/Erythronic Acid (↑) |
| Ornithine (↓) | Dehydroalanine Possibly From Cysteine (↓) | ||
© 2017 by the authors. Licensee MDPI, Basel, Switzerland. This article is an open access article distributed under the terms and conditions of the Creative Commons Attribution (CC BY) license (http://creativecommons.org/licenses/by/4.0/).
Share and Cite
Jensen, B.C.; Parry, T.L.; Huang, W.; Ilaiwy, A.; Bain, J.R.; Muehlbauer, M.J.; O’Neal, S.K.; Patterson, C.; Johnson, G.L.; Willis, M.S. Non-Targeted Metabolomics Analysis of the Effects of Tyrosine Kinase Inhibitors Sunitinib and Erlotinib on Heart, Muscle, Liver and Serum Metabolism In Vivo. Metabolites 2017, 7, 31. https://doi.org/10.3390/metabo7030031
Jensen BC, Parry TL, Huang W, Ilaiwy A, Bain JR, Muehlbauer MJ, O’Neal SK, Patterson C, Johnson GL, Willis MS. Non-Targeted Metabolomics Analysis of the Effects of Tyrosine Kinase Inhibitors Sunitinib and Erlotinib on Heart, Muscle, Liver and Serum Metabolism In Vivo. Metabolites. 2017; 7(3):31. https://doi.org/10.3390/metabo7030031
Chicago/Turabian StyleJensen, Brian C., Traci L. Parry, Wei Huang, Amro Ilaiwy, James R. Bain, Michael J. Muehlbauer, Sara K. O’Neal, Cam Patterson, Gary L. Johnson, and Monte S. Willis. 2017. "Non-Targeted Metabolomics Analysis of the Effects of Tyrosine Kinase Inhibitors Sunitinib and Erlotinib on Heart, Muscle, Liver and Serum Metabolism In Vivo" Metabolites 7, no. 3: 31. https://doi.org/10.3390/metabo7030031
APA StyleJensen, B. C., Parry, T. L., Huang, W., Ilaiwy, A., Bain, J. R., Muehlbauer, M. J., O’Neal, S. K., Patterson, C., Johnson, G. L., & Willis, M. S. (2017). Non-Targeted Metabolomics Analysis of the Effects of Tyrosine Kinase Inhibitors Sunitinib and Erlotinib on Heart, Muscle, Liver and Serum Metabolism In Vivo. Metabolites, 7(3), 31. https://doi.org/10.3390/metabo7030031