
A Study of the Effects of Exercise on the Urinary Metabolome Using Normalisation to Individual Metabolic Output


Abstract
:
1. Introduction
2. Materials and Methods
2.1. Ethics Statement (UEC 14/28, Watson/Daskalaki: Pilot Exercise Trial)
2.2. Subjects and Experimental Design
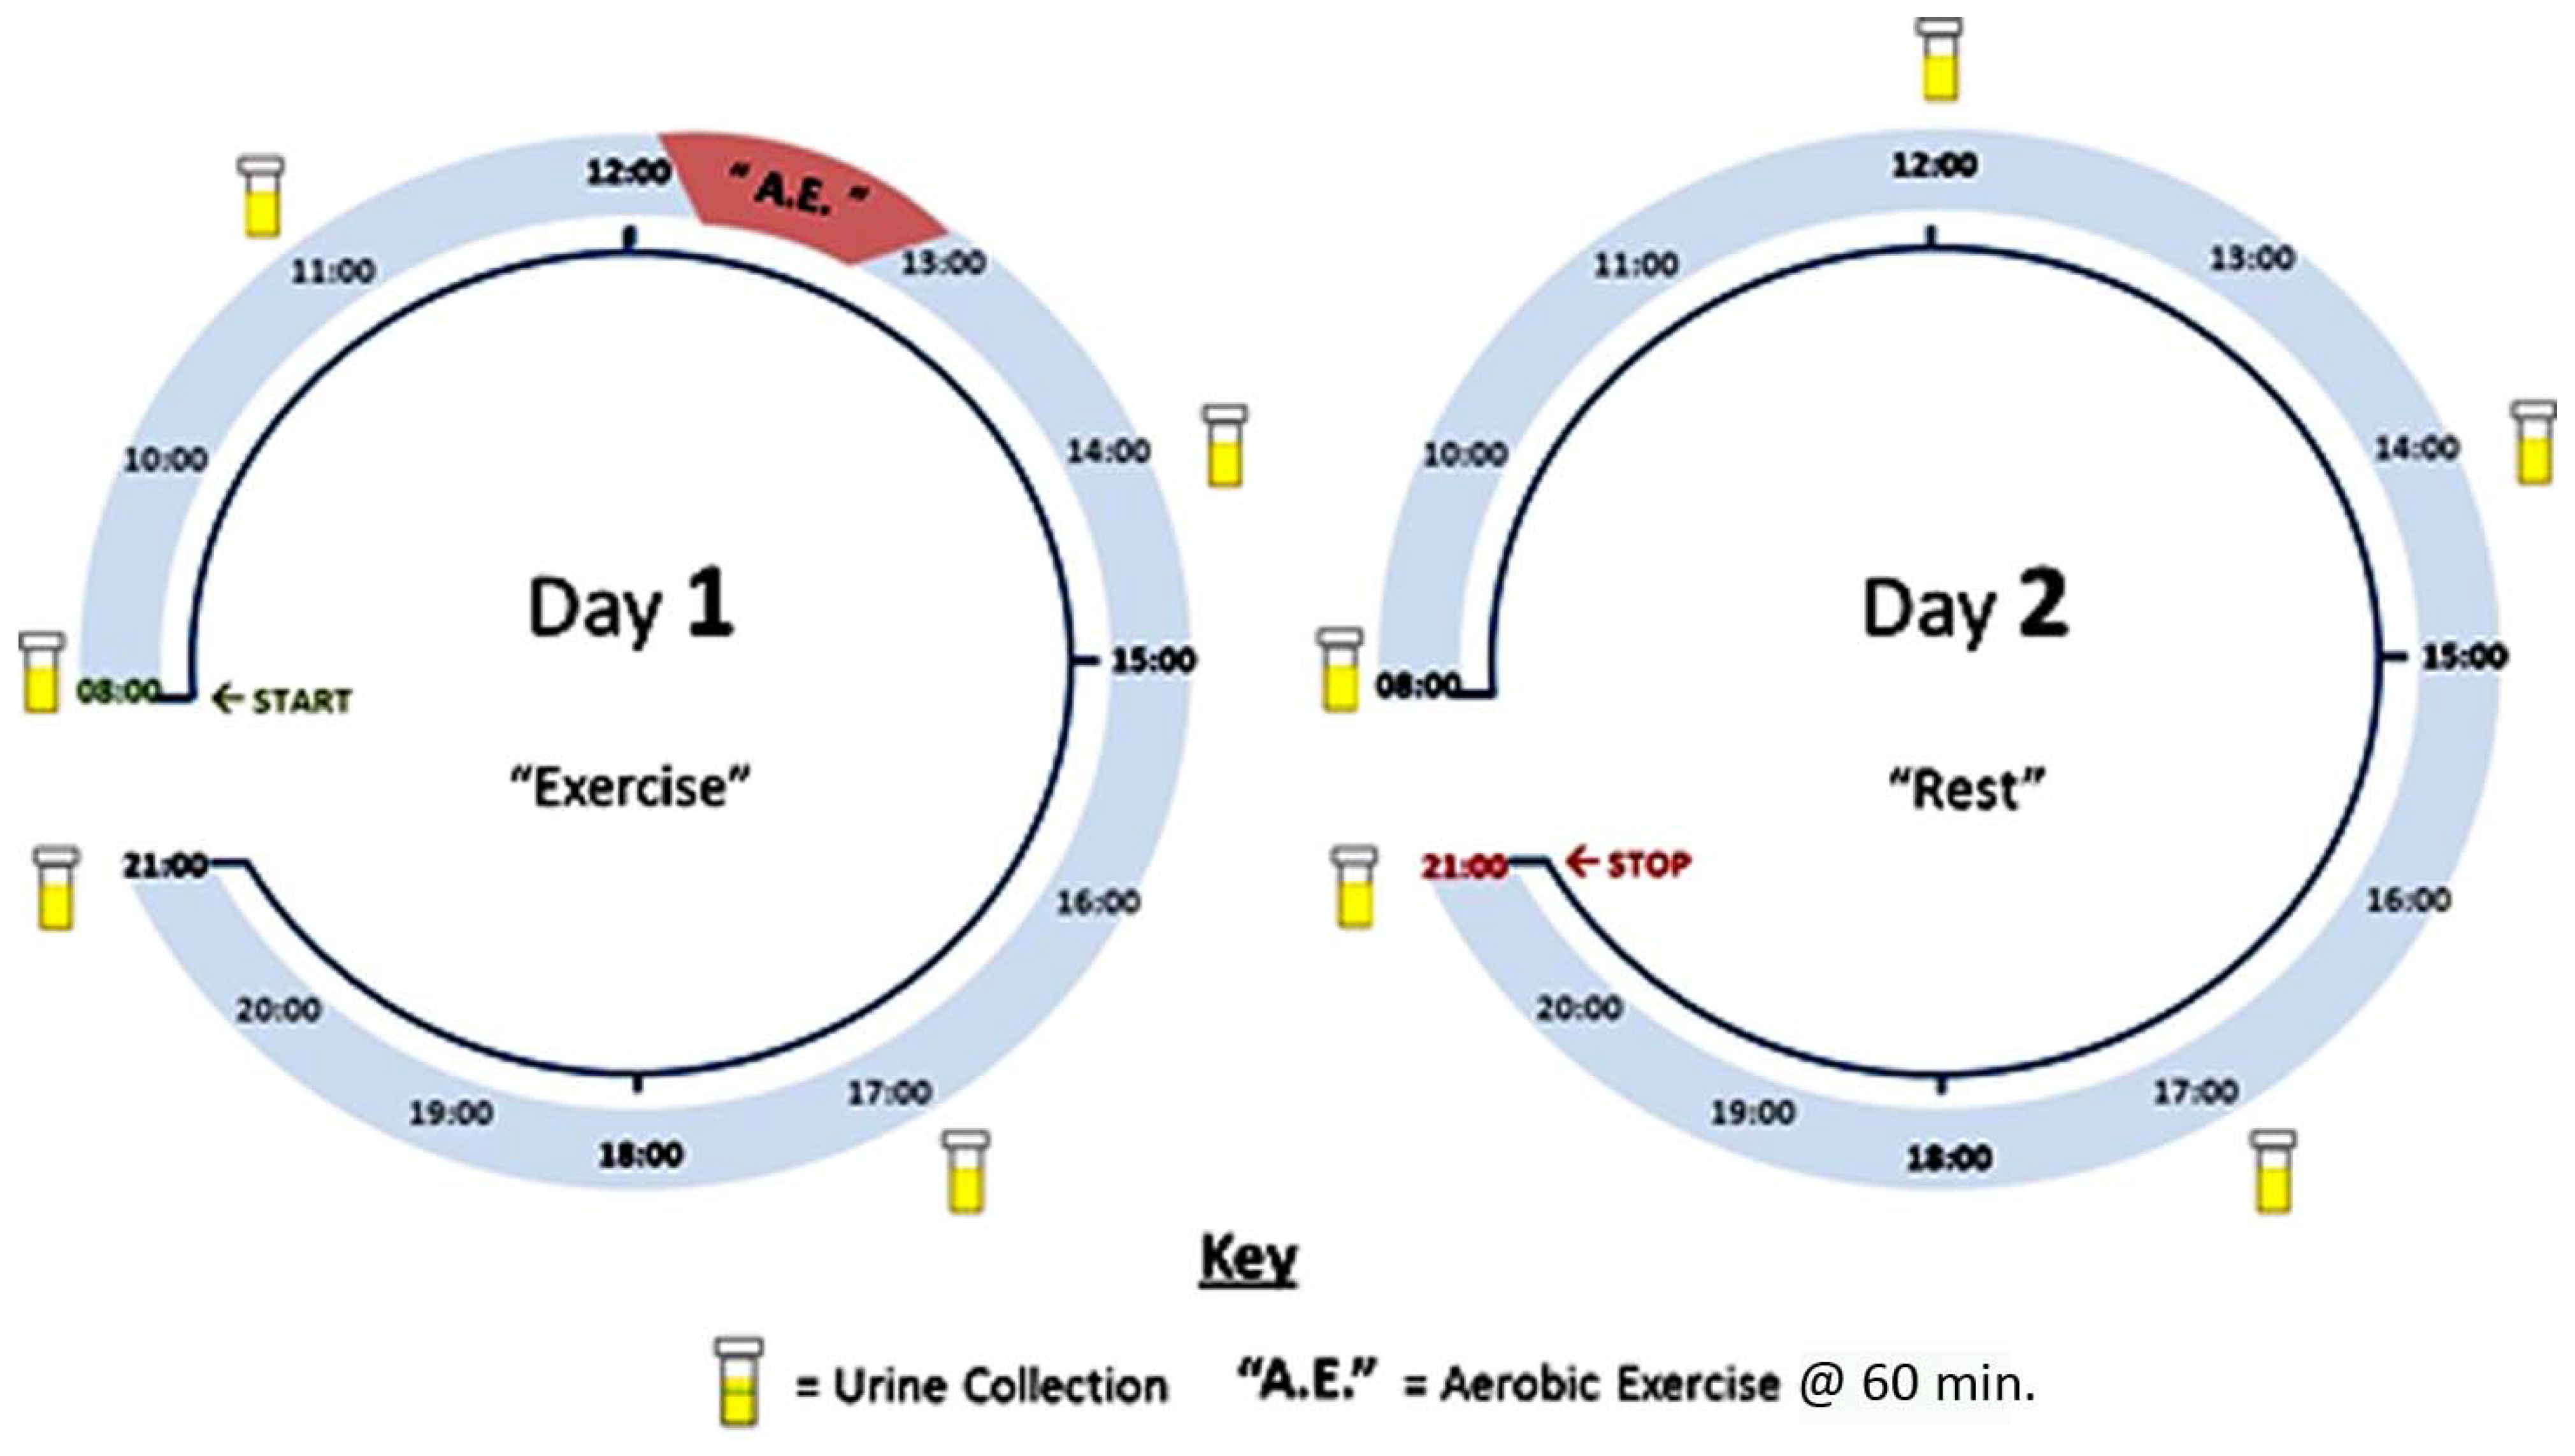
2.3. Sample Collection and Preparation
2.4. Measurement of Creatinine
2.5. Chemicals and Solvents
2.6. LC-MS Method
2.7. LC-MS Data Processing with MzMatch and Ideom (Version 19)
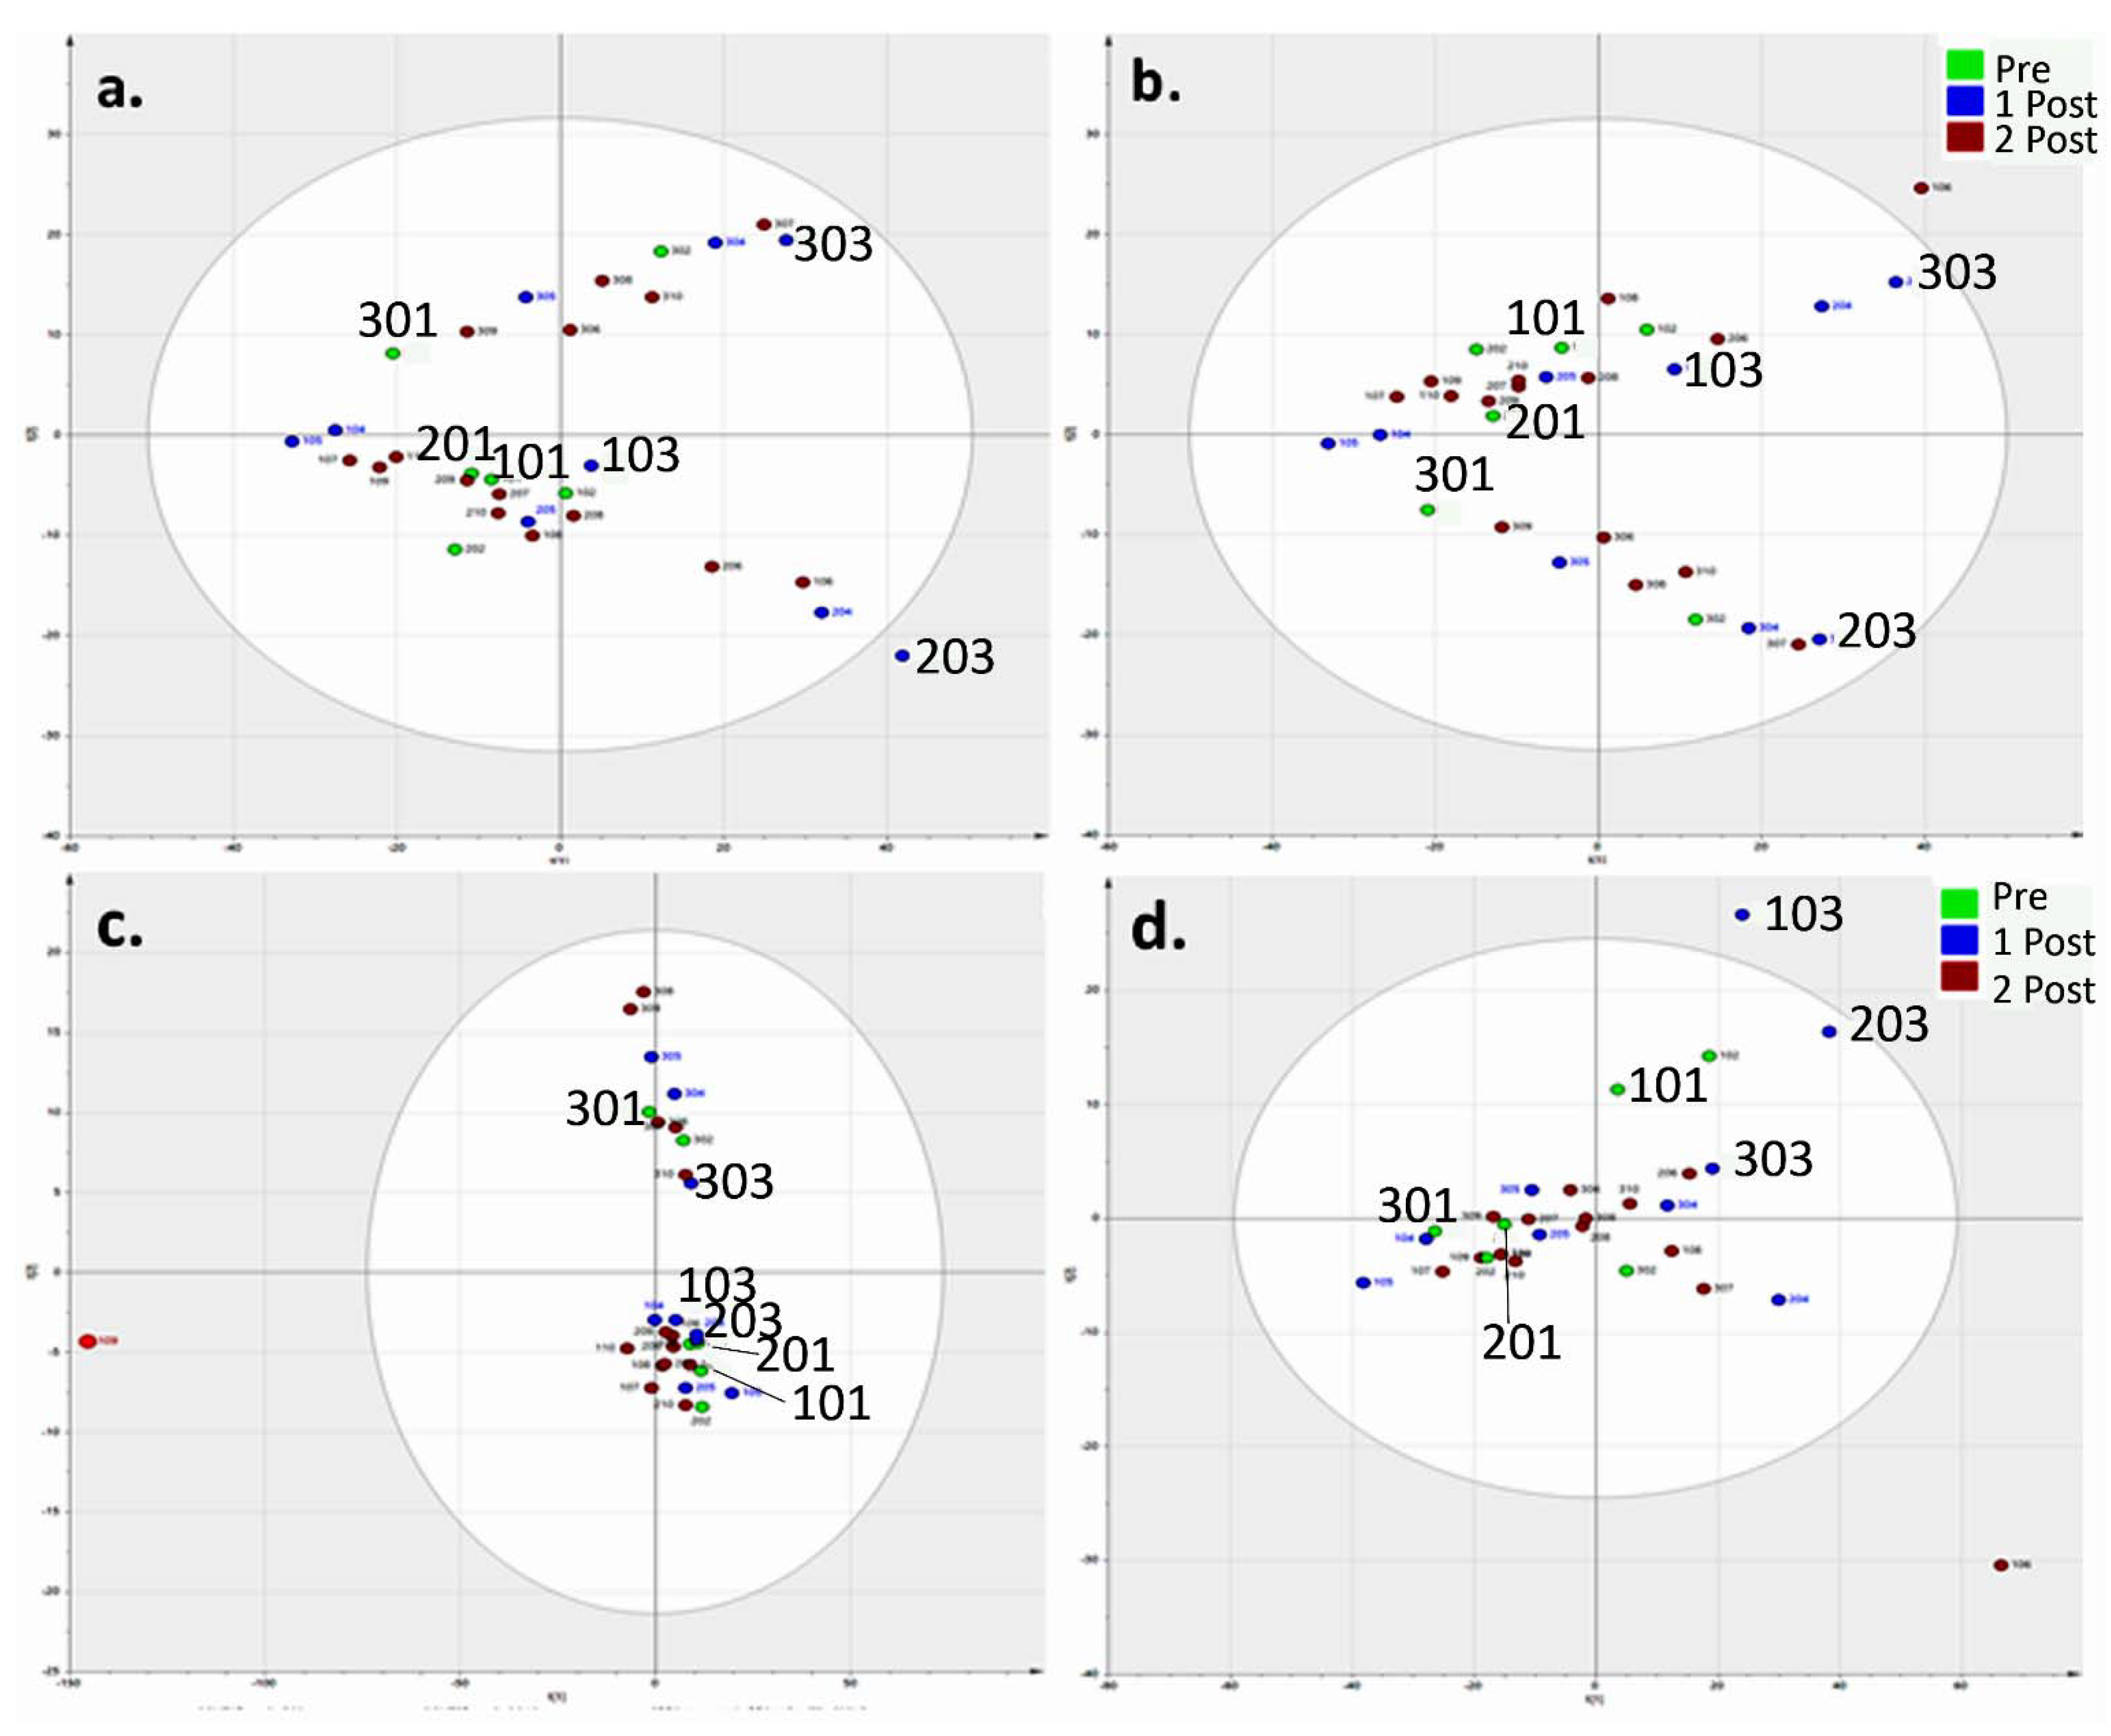
2.8. Statistical Analysis
3. Results
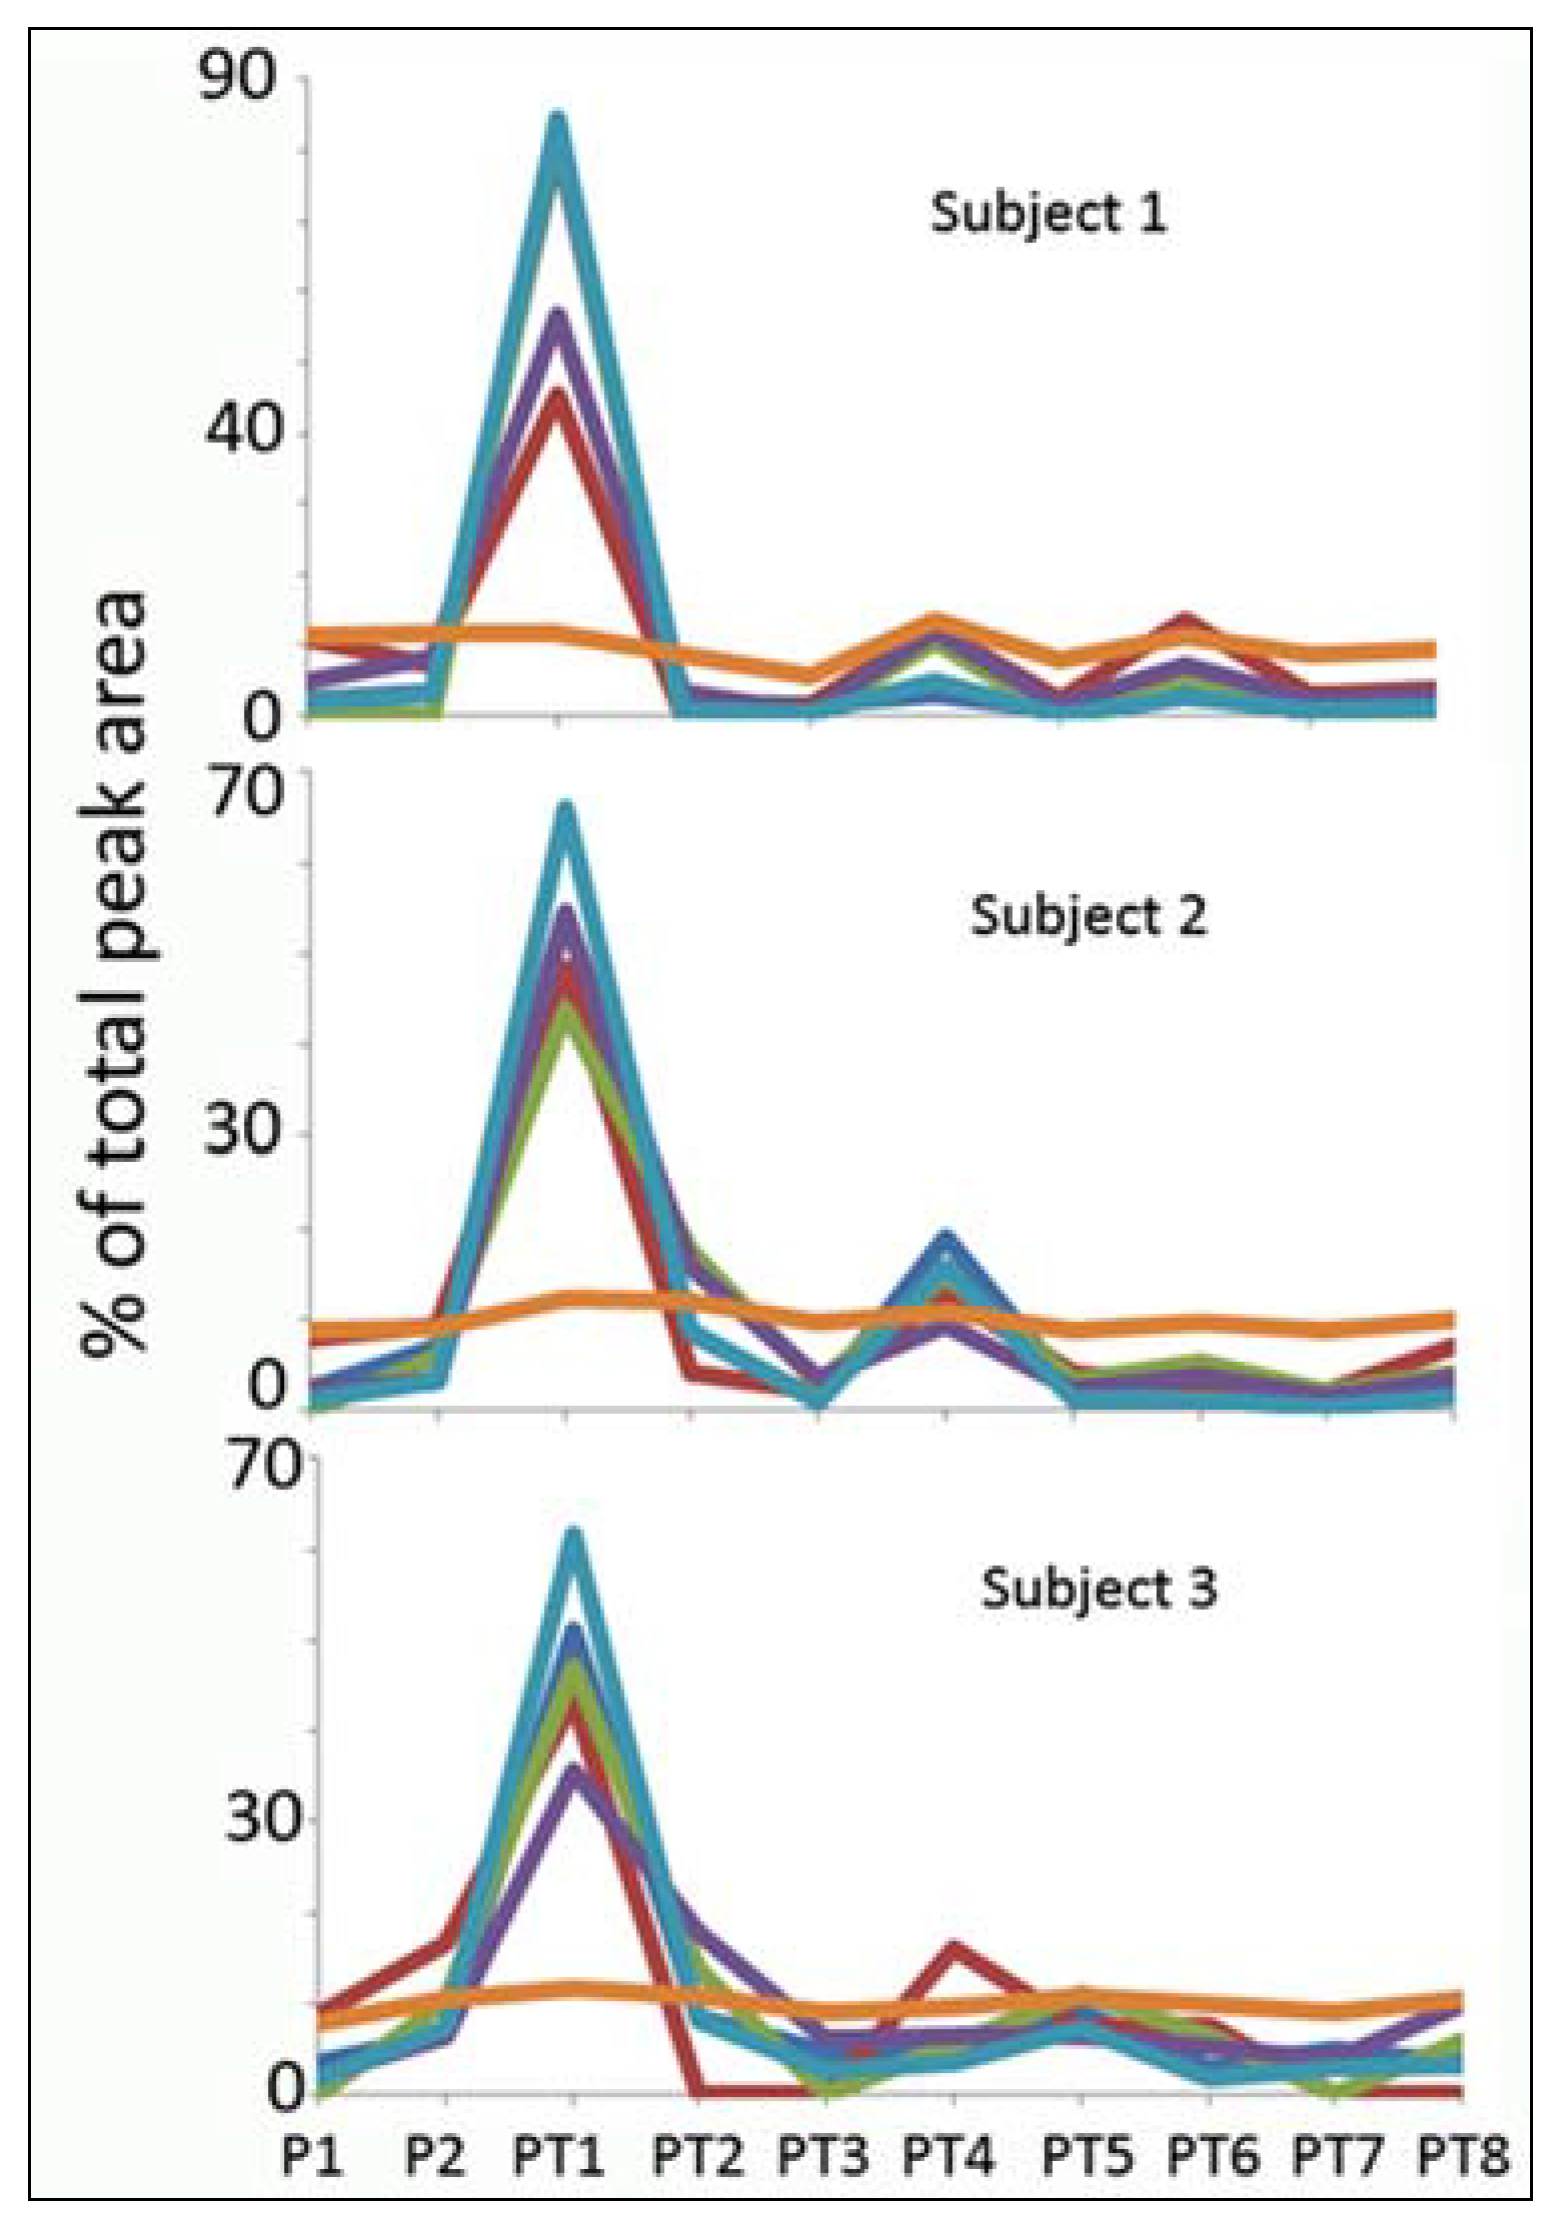
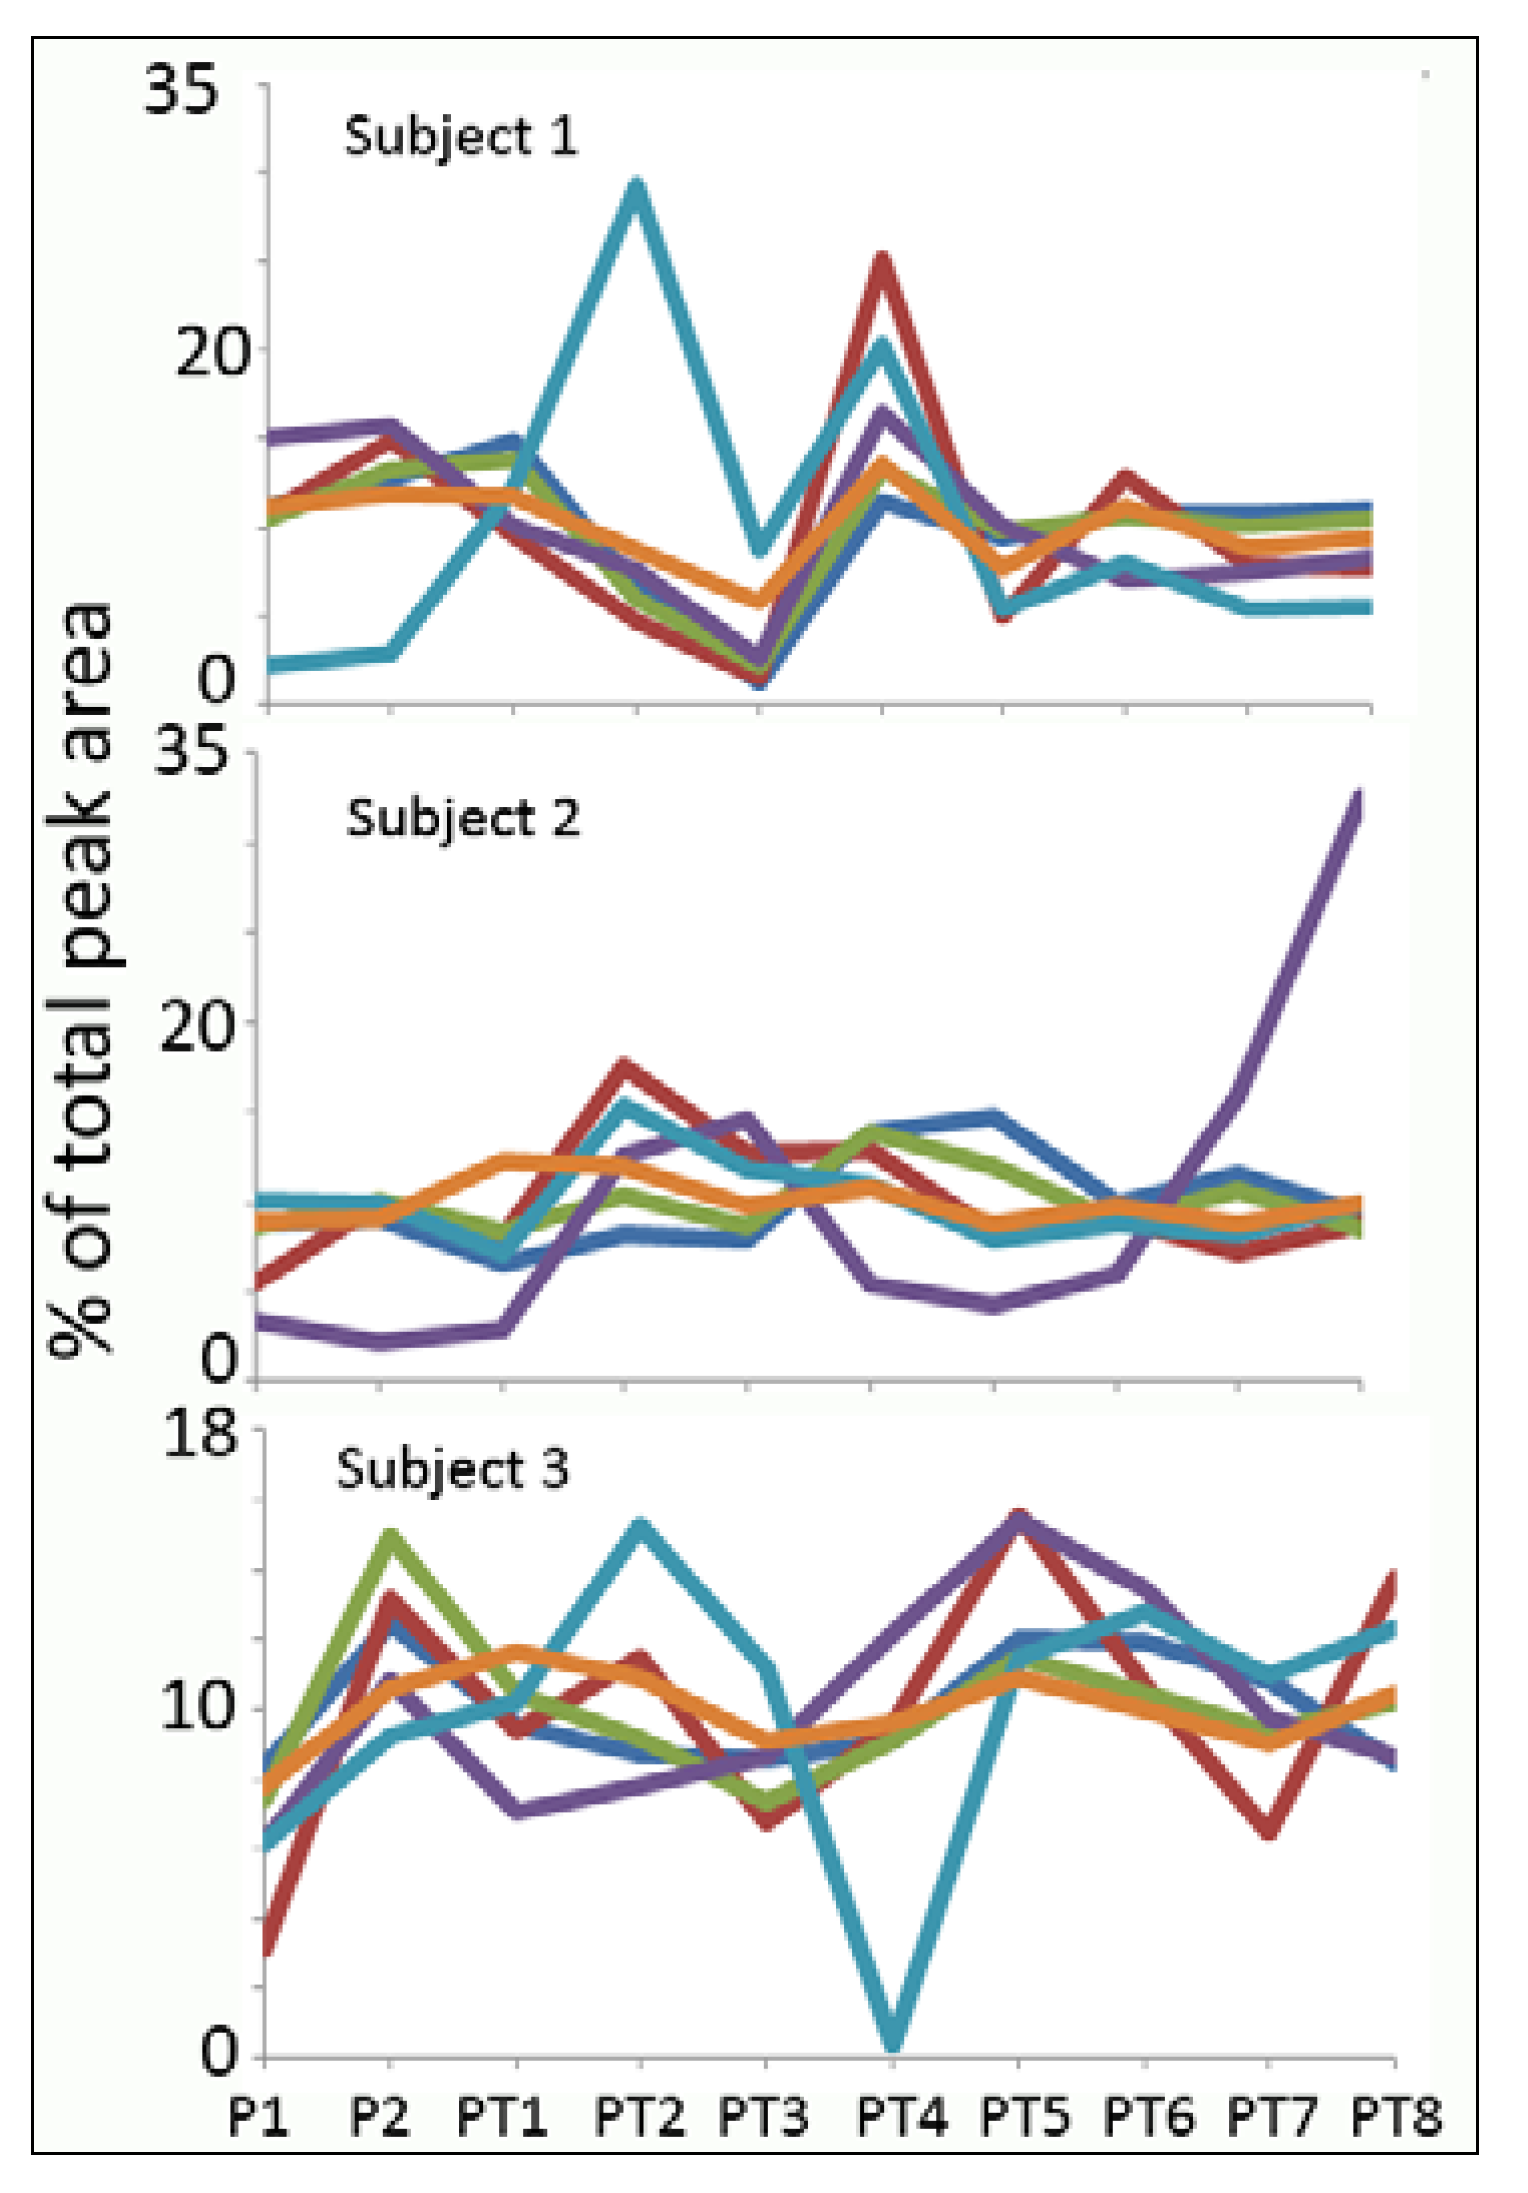
Normalisation

| Compound | Mass | Retention Time (RT) (min) | RSD (%) |
|---|---|---|---|
| * Creatinine | 113.050 | 10.1 | 16.3 |
| * Threonine | 119.058 | 14.9 | 25.4 |
| Imidazolone propanoate | 156.053 | 11.5 | 25.5 |
| * Glutamine | 146.069 | 15.5 | 27.2 |
| * Serine | 105.043 | 16.1 | 27.7 |
| Dihydrothymine | 128.058 | 15.2 | 31.2 |
| N-acetylhistidine | 197.080 | 10.6 | 31.5 |
| Dimethylarginine | 202.143 | 22.0 | 31.9 |
| Dihydrouridine | 246.085 | 10.8 | 32.0 |
| * Betaine | 117.079 | 11.7 | 32.3 |
| * N-acetylglucosamine | 221.090 | 12.2 | 33.2 |
| N-acetylarginine | 216.122 | 15.3 | 34.9 |
| * N6-acetyllysine | 188.116 | 15.5 | 35.6 |
| * Adenine | 135.055 | 9.5 | 37.9 |
| * Methylthioadenosine | 297.089 | 7.0 | 38.1 |
| * Citrulline | 175.096 | 15.9 | 39.0 |
| * Proline | 115.063 | 13.2 | 40.0 |
| Methylimidazole acetic acid | 140.058 | 9.7 | 41.0 |
| * Alanine | 89.048 | 15.2 | 41.3 |
| * Methylhistidine | 169.085 | 13.3 | 41.9 |
| Thymine | 126.043 | 12.0 | 42.3 |
| * Isoleucine | 131.095 | 11.6 | 42.5 |
| Butenyl carnitine | 229.131 | 9.8 | 42.8 |
| Methylcytosine | 125.059 | 11.0 | 43.2 |
| * N-acetylglutamine | 188.080 | 11.0 | 44.2 |
| * Adenosine | 267.097 | 9.3 | 44.9 |
| * Phenylalanine | 165.079 | 10.5 | 46.8 |
| * Histidine | 155.069 | 15.0 | 47.9 |
| * Kynurenine | 208.085 | 11.2 | 51.2 |
| * Cytosine | 111.043 | 11.6 | 51.1 |
| * Ornithine | 132.090 | 22.3 | 56.6 |
| * Tryptophan | 204.090 | 12.0 | 55.6 |
| Carnitine | 161.105 | 13.8 | 60.4 |
| * Arginine | 174.112 | 26.4 | 62.6 |
| Creatinine (assay kit) | - | - | 73.0 |
| * Pantothenate | 219.111 | 8.9 | 82.4 |
| Tetrahydro aldosterone glucuronide | 542.273 | 7.4 | 84.8 |
| * Lysine | 146.105 | 25.0 | 100.6 |
| * Pyruvate | 88.016 | 8.3 | 106.3 |
| Cresol glucuronide | 284.090 | 7.8 | 113.1 |
| * Urate | 168.028 | 13.0 | 121.6 |
| * Xanthosine | 284.075 | 12.7 | 141.3 |
| * Tyrosine | 181.074 | 13.3 | 133.7 |
| * Inosine | 268.081 | 11.2 | 180.3 |
| * Hypoxanthine | 136.038 | 10.5 | 186.1 |
| Deoxyinosine | 252.086 | 9.0 | 210.6 |

| Mass | RT (min) | PT1/P1 | PT1/P2 | PT1/PT2 | PT1/PT4 | PT1/PT5 | PT1/PT7 | |||||||
|---|---|---|---|---|---|---|---|---|---|---|---|---|---|---|
| Ratio | p-Value | Ratio | p-Value | Ratio | p-Value | Ratio | p-Value | Ratio | p-Value | Ratio | p-Value | |||
| Purine metabolism | ||||||||||||||
| N2-N2-Dimethylguanosine | 311.123 | 9.0 | 2.59 | 0.0200 | 1.57 | 0.11 | 1.97 | 0.12 | 1.18 | 0.61 | 2.68 | 0.070 | 4.75 | 0.0043 |
| Xanthosine * | 284.075 | 12.7 | 16.18 | 0.0191 | 8.24 | 0.019 | 3.98 | 0.014 | 5.25 | 0.022 | 13.7 | 0.017 | 18.6 | 0.019 |
| Inosine * | 268.081 | 11.2 | 581 | 0.045 | 10.8 | 0.048 | 5.55 | 0.049 | 5.64 | 0.0591 | 12.14 | 0.045 | 88.8 | 0.046 |
| Deoxyinosine | 252.086 | 9.0 | 43.3 | 0.010 | 15.6 | 0.0091 | 11.9 | 0.0060 | 8.87 | 0.0037 | 25.13 | 0.0062 | 53.4 | 0.0093 |
| Guanine * | 151.049 | 12.7 | 5.01 | <0.001 | 4.17 | 0.0017 | 33.7 | <0.001 | 3.30 | <0.001 | 10.17 | <0.001 | 27.7 | <0.001 |
| Hypoxanthine * | 136.038 | 10.5 | 22.8 | 0.025 | 11.0 | 0.026 | 9.86 | 0.023 | 6.96 | 0.016 | 15.5 | 0.020 | 27.3 | 0.023 |
| Kynurenine pathway | ||||||||||||||
| ** 3-Hydroxytryptophan | 220.085 | 10.3 | 2.69 | 0.012 | 1.45 | 0.12 | 1.52 | 0.27 | 0.93 | 0.83 | 2.14 | 0.095 | 3.66 | 0.0095 |
| † Xanthurenic acid isomer | 205.037 | 11.3 | 4.55 | 0.0023 | 1.93 | 0.0072 | 1.95 | 0.085 | 1.76 | 0.15 | 2.14 | 0.044 | 3.91 | 0.0001 |
| Kynurenate | 189.043 | 6.6 | 3.36 | 0.085 | 2.71 | 0.13 | 1.57 | 0.42 | 1.59 | 0.31 | 2.55 | 0.13 | 3.87 | 0.092 |
| Hydroxytryptophol | 177.079 | 7.5 | 3.74 | 0.0048 | 0.98 | 0.97 | 1.86 | 0.14 | 2.22 | 0.016 | 2.43 | 0.026 | 4.01 | 0.0040 |
| N1-Methyl-2-pyridone-5-carboxamide | 152.059 | 7.8 | 2.27 | 0.042 | 1.56 | 0.40 | 1.28 | 0.58 | 0.86 | 0.68 | 1.44 | 0.44 | 3.12 | 0.0012 |
| Glycolysis | ||||||||||||||
| Pyruvate * | 88.016 | 8.3 | 6.79 | 0.026 | 5.93 | 0.02 | 2.11 | 0.12 | 2.81 | 0.041 | 9.08 | 0.024 | 6.50 | 0.031 |
| Methyl oxalate | 118.027 | 8.5 | 3.09 | 0.011 | 1.68 | 0.31 | 0.95 | 0.92 | 1.14 | 0.82 | 1.96 | 0.13 | 3.12 | 0.0026 |
| Vitamins | ||||||||||||||
| Riboflavin * | 376.138 | 8.9 | 3.01 | 0.047 | 1.19 | 0.59 | 2.63 | 0.055 | 0.75 | 0.50 | 2.92 | 0.043 | 8.94 | <0.001 |
| Pantothenate * | 219.111 | 8.9 | 5.09 | 0.031 | 3.18 | 0.048 | 1.96 | 0.13 | 2.19 | 0.071 | 3.44 | 0.034 | 4.37 | 0.042 |
| Neurotransmitter metabolism | ||||||||||||||
| L-Metanephrine * | 197.105 | 18.6 | 4.56 | 0.013 | 2.00 | 0.050 | 1.88 | 0.13 | 1.45 | 0.42 | 2.90 | 0.035 | 5.21 | 0.026 |
| Microbial metabolism | ||||||||||||||
| Indole-3-acetyl-glutamine | 303.122 | 8.2 | 4.86 | 0.010 | 1.61 | 0.26 | 3.36 | 0.024 | 1.38 | 0.28 | 3.64 | 0.021 | 8.02 | 0.011 |
| 5-Hydroxyindolepyruvate | 219.053 | 5.3 | 3.99 | 0.0045 | 1.90 | 0.036 | 1.92 | 0.13 | 1.30 | 0.46 | 2.54 | 0.082 | 3.35 | 0.0067 |
| Indoxyl sulphate | 213.010 | 7.4 | 3.07 | 0.050 | 2.05 | 0.19 | 2.23 | 0.1155 | 1.48 | 0.4326 | 3.62 | 0.044 | 11.57 | 0.040 |
| Hydroxyferulate | 210.053 | 6.8 | 3.81 | 0.042 | 2.83 | 0.084 | 1.36 | 0.5378 | 1.55 | 0.27 | 6.27 | 0.040 | 5.87 | 0.044 |
| Cresol sulphate | 187.008 | 4.5 | 2.97 | 0.037 | 1.37 | 0.34 | 2.14 | 0.13 | 0.96 | 0.91 | 3.48 | 0.029 | 4.05 | 0.026 |
| Phenol sulphate | 173.999 | 5.0 | 3.32 | 0.0042 | 2.02 | 0.17 | 1.84 | 0.15 | 1.01 | 0.99 | 2.13 | 0.075 | 3.83 | 0.0034 |
| Urocanate | 138.043 | 7.5 | 2.81 | 0.054 | 2.03 | 0.036 | 1.73 | 0.16 | 2.02 | 0.049 | 2.97 | 0.027 | 5.50 | 0.014 |
| Amino acids | ||||||||||||||
| Tryptophan * | 204.090 | 12.0 | 2.02 | 0.044 | 0.90 | 0.62 | 1.24 | 0.58 | 0.77 | 0.60 | 1.49 | 0.32 | 2.36 | <0.001 |
| O-Acetyl-L-homoserine | 161.069 | 8.6 | 3.76 | 0.019 | 2.91 | 0.047 | 1.54 | 0.42 | 1.75 | 0.1177 | 3.06 | 0.023 | 4.23 | 0.019 |
| Histidine * | 155.069 | 15.0 | 0.41 | 0.047 | 0.39 | 0.073 | 0.67 | 0.44 | 0.62 | 0.30 | 0.29 | <0.001 | 0.34 | 0.019 |
| D-Methionine * | 149.051 | 7.6 | 2.40 | 0.017 | 1.32 | 0.16 | 1.51 | 0.27 | 1.11 | 0.70 | 1.78 | 0.21 | 1.98 | 0.015 |
| L-Proline * | 115.063 | 13.2 | 3.88 | 0.018 | 1.85 | 0.091 | 2.18 | 0.058 | 1.74 | 0.12 | 2.38 | 0.047 | 3.53 | 0.035 |
| Amino acid metabolism | ||||||||||||||
| N-Acetylvanilalanine | 253.095 | 8.0 | 7.48 | 0.0020 | 3.19 | 0.035 | 2.28 | 0.15 | 2.52 | 0.085 | 4.18 | 0.018 | 7.21 | < 0.001 |
| N-(Carboxyethyl) arginine | 246.133 | 14.6 | 5.16 | 0.027 | 3.43 | 0.039 | 2.98 | 0.031 | 3.10 | 0.027 | 4.27 | 0.026 | 4.13 | 0.032 |
| N-Acetyl-D-tryptophan | 246.101 | 6.6 | 3.60 | 0.051 | 3.28 | 0.047 | 1.29 | 0.68 | 1.45 | 0.25 | 2.47 | 0.087 | 5.42 | 0.055 |
| N-acetylmethionine | 191.062 | 6.1 | 4.85 | 0.039 | 3.26 | 0.052 | 1.85 | 0.22 | 1.68 | 0.19 | 2.9 | 0.070 | 6.07 | 0.046 |
| Amino acid oxidation | ||||||||||||||
| Indole pyruvate | 203.059 | 6.9 | 2.36 | 0.030 | 1.59 | 0.40 | 1.14 | 0.81 | 1.44 | 0.46 | 3.07 | 0.025 | 3.39 | 0.014 |
| Acetamido-oxohexanoate | 187.084 | 8.4 | 2.71 | 0.029 | 1.84 | 0.24 | 1.37 | 0.38 | 1.44 | 0.31 | 2.28 | 0.031 | 4.42 | 0.0075 |
| Hydroxyphenylpyruvate | 180.042 | 7.9 | 4.43 | 0.0030 | 2.63 | 0.077 | 1.54 | 0.41 | 1.80 | 0.12 | 4.66 | 0.0032 | 4.94 | 0.0051 |
| Oxoarginine | 173.080 | 14.7 | 1.99 | 0.04 | 1.78 | 0.089 | 1.96 | 0.052 | 1.63 | 0.078 | 2.88 | 0.018 | 2.18 | 0.045 |
| Guanidovaleramide | 158.117 | 24.7 | 6.74 | 0.0015 | 2.33 | 0.032 | 1.61 | 0.37 | 1.33 | 0.65 | 3.42 | 0.080 | 9.27 | 0.0049 |
| Acetohydroxybutanoate | 146.058 | 7.0 | 5.67 | 0.0016 | 3.51 | 0.0310 | 1.99 | 0.14 | 1.49 | 0.31 | 3.01 | 0.012 | 6.47 | <0.001 |
| Acetamidobutanoate | 145.074 | 7.1 | 3.17 | 0.0095 | 2.24 | 0.14 | 1.69 | 0.28 | 1.80 | 0.13 | 2.82 | 0.029 | 6.39 | 0.0069 |
| Amino acid oxidation | ||||||||||||||
| Dihydroxymethylbutanoate | 134.058 | 9.2 | 8.00 | 0.030 | 3.23 | 0.053 | 1.74 | 0.32 | 0.79 | 0.74 | 1.31 | 0.58 | 2.54 | 0.10 |
| Methyl-oxopentanoic acid | 130.063 | 5.2 | 4.21 | 0.026 | 2.65 | 0.068 | 1.51 | 0.45 | 1.18 | 0.66 | 2.32 | 0.084 | 3.68 | 0.030 |
| Dioxopentanoate | 130.027 | 8.8 | 2.31 | 0.046 | 1.56 | 0.39 | 1.10 | 0.85 | 0.94 | 0.84 | 1.47 | 0.31 | 2.18 | 0.035 |
| Hydroxypentanoate | 118.063 | 7.1 | 2.72 | 0.018 | 1.72 | 0.28 | 0.94 | 0.92 | 0.71 | 0.58 | 1.42 | 0.48 | 2.99 | 0.0035 |
| Methyloxobutanoic acid | 116.047 | 6.9 | 3.12 | 0.013 | 1.95 | 0.19 | 1.25 | 0.70 | 0.85 | 0.78 | 1.46 | 0.48 | 3.60 | 0.0020 |
| Hydroxybutanoic acid | 104.047 | 8.2 | 3.24 | 0.010 | 2.09 | 0.15 | 1.31 | 0.60 | 0.86 | 0.75 | 1.51 | 0.40 | 2.96 | 0.011 |
| Carnitine metabolism | ||||||||||||||
| Dodecenoylcarnitine | 341.256 | 5.5 | 4.59 | 0.0025 | 3.00 | 0.030 | 2.67 | 0.045 | 1.52 | 0.13 | 3.55 | 0.051 | 5.19 | < 0.001 |
| Undecanoylcarnitine | 329.256 | 5.5 | 3.08 | 0.026 | 1.57 | 0.20 | 1.48 | 0.35 | 1.32 | 0.40 | 2.07 | 0.17 | 3.83 | 0.028 |
| Decanoylcarnitine | 315.241 | 5.8 | 3.07 | 0.045 | 2.00 | 0.065 | 1.71 | 0.24 | 1.18 | 0.66 | 2.40 | 0.1425 | 5.05 | <0.001 |
| L-Octanoylcarnitine | 287.209 | 6.4 | 2.15 | 0.016 | 1.41 | 0.19 | 1.52 | 0.31 | 0.71 | 0.51 | 1.46 | 0.47 | 3.18 | 0.004 |
| Methylglutarylcarnitine | 261.121 | 5.6 | 1.92 | 0.078 | 2.08 | 0.18 | 1.24 | 0.58 | 0.60 | 0.23 | 2.10 | 0.023 | 2.06 | 0.013 |
| Hexanoylcarnitine | 259.178 | 7.7 | 2.26 | 0.041 | 1.17 | 0.55 | 1.15 | 0.77 | 0.85 | 0.71 | 1.55 | 0.39 | 3.37 | 0.027 |
| Valerylcarnitine | 245.162 | 10.7 | 2.33 | 0.0186 | 1.74 | 0.065 | 1.36 | 0.42 | 0.98 | 0.96 | 2.52 | 0.0082 | 2.91 | 0.0075 |
| Dehydroxycarnitine | 145.110 | 15.8 | 2.76 | 0.0095 | 1.89 | 0.023 | 1.65 | 0.20 | 1.52 | 0.15 | 2.69 | 0.012 | 3.00 | 0.0082 |
| Steroid metabolism | ||||||||||||||
| Urocortisol glucuronide | 542.273 | 7.4 | 6.48 | 0.0036 | 2.68 | 0.062 | 1.84 | 0.16 | 2.16 | 0.063 | 2.60 | 0.045 | 5.84 | 0.011 |
| Dihydrocortisone glucuronide | 540.257 | 5.5 | 5.47 | 0.029 | 2.59 | 0.082 | 3.70 | 0.028 | 2.04 | 0.075 | 3.65 | 0.032 | 8.43 | 0.033 |
| Hydrocortisone sulphate | 442.166 | 4.3 | 8.83 | 0.060 | 3.13 | 0.084 | 5.16 | 0.060 | 2.74 | 0.092 | 5.40 | 0.051 | 25.26 | 0.055 |
| Hydroxyandrosterone glucuronide | 482.252 | 5.5 | 4.27 | 0.0064 | 2.21 | 0.14 | 2.24 | 0.068 | 1.79 | 0.091 | 2.90 | 0.018 | 5.08 | 0.017 |
| Androstane diol glucuronide | 468.272 | 5.6 | 2.77 | 0.0082 | 2.11 | 0.17 | 1.71 | 0.21 | 1.24 | 0.51 | 2.38 | 0.065 | 4.45 | 0.0029 |
| Androsterone glucuronide | 466.257 | 4.8 | 3.59 | 0.0039 | 1.99 | 0.19 | 1.84 | 0.19 | 1.40 | 0.32 | 2.43 | 0.076 | 5.00 | 0.0069 |
| Oxoandrostane glucuronide | 480.236 | 5.3 | 4.13 | 0.046 | 2.17 | 0.15 | 2.03 | 0.13 | 1.47 | 0.32 | 2.83 | 0.061 | 9.22 | 0.051 |
4. Discussion
4.1. Tryptophan Metabolism
4.2. Glycolysis
4.3. Microbiome Metabolites
4.4. Amino Acid Oxidation
4.5. Carnitines
4.6. Steroid Metabolism
5. Conclusions
Acknowledgments
Author Contributions
Supplementary Materials
Conflicts of Interest
References
- Bouatra, S.; Aziat, F.; Mandal, R.; Guo, A.C.; Wilson, M.R.; Knox, C.; Bjorndahl, T.C.; Krishnamurthy, R.; Saleem, F.; Liu, P.; et al. The human urine metabolome. PLoS One 2013, 8, e73076. [Google Scholar] [CrossRef] [PubMed]
- Goodyear, L.J. The exercise pill–Too good to be true? N. Engl. J. Med. 2008, 359, 1842–1844. [Google Scholar] [CrossRef] [PubMed]
- Woldt, E.; Sebti, Y.; Solt, L.A.; Duhem, C.; Lancel, S.; Eeckhoute, J.; Hesselink, M.K.C.; Paquet, C.; Delhaye, S.; Shin, Y.; et al. Rev-erb-α modulates skeletal muscle oxidative capacity by regulating mitochondrial biogenesis and autophagy. Nat. Med. 2013, 19, 1039–1046. [Google Scholar] [CrossRef] [PubMed]
- Kujala, U.M.; Mäkinen, V.-P.; Heinonen, I.; Soininen, P.; Kangas, A.J.; Leskinen, T.H.; Rahkila, P.; Würtz, P.; Kovanen, V.; Cheng, S.; et al. Long-term leisure-time physical activity and serum metabolome. Circulation 2013, 127, 340–348. [Google Scholar] [CrossRef] [PubMed]
- Lewis, G.D.; Farrell, L.; Wood, M.J.; Martinovic, M.; Arany, Z.; Rowe, G.C.; Souza, A.; Cheng, S.; McCabe, E.L.; Yang, E.; et al. Metabolic signatures of exercise in human plasma. Sci. Transl. Med. 2010, 2, 33ra37. [Google Scholar] [CrossRef] [PubMed]
- Clouse, A.; Deo, S.; Rampersaud, E.; Farmer, J.; Goldschmidt-Clermont, P.J.; Daunert, S. Defining a molecular portrait of physical fitness. Anal. Bioanal. Chem. 2013, 405, 21–26. [Google Scholar] [CrossRef] [PubMed]
- Lehmann, R.; Zhao, X.; Weigert, C.; Simon, P.; Fehrenbach, E.; Fritsche, J.; Machann, J.; Schick, F.; Wang, J.; Hoene, M.; et al. Medium chain acylcarnitines dominate the metabolite pattern in humans under moderate intensity exercise and support lipid oxidation. PLoS One 2010, 5, e11519. [Google Scholar] [CrossRef] [PubMed]
- Krug, S.; Kastenmüller, G.; Stückler, F.; Rist, M.J.; Skurk, T.; Sailer, M.; Raffler, J.; Römisch-Margl, W.; Adamski, J.; Prehn, C.; et al. The dynamic range of the human metabolome revealed by challenges. FASEB J. 2012, 26, 2607–2619. [Google Scholar] [CrossRef] [PubMed]
- Dumas, M.-E.; Kinross, J.; Nicholson, J.K. Metabolic phenotyping and systems biology approaches to understanding metabolic syndrome and fatty liver disease. Gastroenterology 2014, 146, 46–62. [Google Scholar] [CrossRef] [PubMed]
- Sweedler, J.; James, R. Tech News Metabolomics: Where seeing is believing. Biotechniques 2011, 50, 285–289. [Google Scholar] [PubMed]
- Nicholson, J.K.; Holmes, E.; Elliott, P. The metabolome-wide association study: A new look at human disease risk factors. J. Proteome Res. 2008, 7, 3637–3638. [Google Scholar] [CrossRef] [PubMed]
- Ellis, D.I.; Dunn, W.B.; Griffin, J.L.; Allwood, J.W.; Goodacre, R. Metabolic fingerprinting as a diagnostic tool. Pharmacogenomics 2007, 8, 1243–1266. [Google Scholar] [CrossRef] [PubMed]
- Nieman, D.C.; Shanely, R.A.; Gillitt, N.D.; Pappan, K.L.; Lila, M.A. Serum metabolic signatures induced by a three-day intensified exercise period persist after 14 h of recovery in runners. J. Proteome Res. 2013, 12, 4577–4584. [Google Scholar] [CrossRef] [PubMed]
- Yan, B.; Jiye, A.; Wang, G.; Lu, H.; Huang, X.; Liu, Y.; Zha, W.; Hao, H.; Zhang, Y.; Liu, L.; et al. Metabolomic investigation into variation of endogenous metabolites in professional athletes subject to strength-endurance training. J. Appl. Physiol. 2009, 106, 531–538. [Google Scholar] [CrossRef] [PubMed]
- Mukherjee, K.; Edgett, B.A.; Burrows, H.W.; Castro, C.; Griffin, J.L.; Schwertani, A.G.; Gurd, B.J.; Funk, C.D. Whole blood transcriptomics and urinary metabolomics to define adaptive biochemical pathways of high-intensity exercise in 50–60 year old masters athletes. PLoS One 2014, 9, e92031. [Google Scholar] [CrossRef] [PubMed]
- Pechlivanis, A.; Kostidis, S.; Saraslanidis, P.; Petridou, A.; Tsalis, G.; Veselkov, K.; Mikros, E.; Mougios, V.; Theodoridis, G.A. 1H NMR study on the short- and long-term impact of two training programs of sprint running on the metabolic fingerprint of human serum. J. Proteome Res. 2013, 12, 470–480. [Google Scholar] [CrossRef] [PubMed]
- Pechlivanis, A.; Kostidis, S.; Saraslanidis, P.; Petridou, A.; Tsalis, G.; Mougios, V.; Gika, H.G.; Mikros, E.; Theodoridis, G.A. (1)H NMR-based metabonomic investigation of the effect of two different exercise sessions on the metabolic fingerprint of human urine. J. Proteome Res. 2010, 9, 6405–6416. [Google Scholar] [CrossRef] [PubMed]
- Sheedy, D.J.R.; Gooley, P.R.; Nahid, A.; Tull, D.L.; McConville, M.J.; Kukuljan, S.; Nowson, C.A.; Daly, R.M.; Ebeling, P.R. 1H-NMR analysis of the human urinary metabolome in response to an 18-month multi-component exercise program and calcium-vitamin-D3 supplementation in older men. App. Physiol., Nut. Met. 2014, 39, 1294–1304. [Google Scholar] [CrossRef]
- Neal, C.M.; Hunter, A.M.; Brennan, L.; O’Sullivan, A.; Hamilton, D.L.; de Vito, G.; Galloway, S.D.R. Six weeks of a polarized training-intensity distribution leads to greater physiological and performance adaptations than a threshold model in trained cyclists. J. Appl. Physiol. 2013, 114, 461–471. [Google Scholar] [CrossRef] [PubMed]
- Zieliński, J.; Krasińska, B.; Kusy, K. Hypoxanthine as a predictor of performance in highly trained athletes. Int. J. Sports Med. 2013, 34, 1079–1086. [Google Scholar] [CrossRef] [PubMed]
- Zieliński, J.; Rychlewski, T.; Kusy, K.; Domaszewska, K.; Laurentowska, M. The effect of endurance training on changes in purine metabolism: A longitudinal study of competitive long-distance runners. Eur. J. Appl. Physiol. 2009, 106, 867–876. [Google Scholar] [CrossRef] [PubMed]
- Stathis, C.G.; Carey, M.F.; Hayes, A.; Garnham, A.P.; Snow, R.J. Sprint training reduces urinary purine loss following intense exercise in humans. Appl. Physiol. Nutr. Metable 2006, 31, 702–708. [Google Scholar] [CrossRef]
- Zielinski, J.; Kusy, K. Training-induced adaptation in purine metabolism in high-level sprinters vs. triathletes. J. Appl. Physiol. 2012, 112, 542–551. [Google Scholar] [CrossRef] [PubMed]
- Sahlin, K.; Tonkonogi, M.; Söderlund, K. Plasma hypoxanthine and ammonia in humans during prolonged exercise. Eur. J. Appl. Physiol. Occup. Physiol. 1999, 80, 417–422. [Google Scholar] [CrossRef] [PubMed]
- Dudzinska, W.; Lubkowska, A.; Dolegowska, B.; Safranow, K.; Jakubowska, K. Adenine, guanine and pyridine nucleotides in blood during physical exercise and restitution in healthy subjects. Eur. J. Appl. Physiol. 2010, 110, 1155–1162. [Google Scholar] [CrossRef] [PubMed]
- Zieliński, J.; Kusy, K.; Rychlewski, T. Effect of training load structure on purine metabolism in middle-distance runners. Med. Sci. Sports Exerc. 2011, 43, 1798–1807. [Google Scholar] [CrossRef] [PubMed]
- Bianchi, G.P.; Grossi, G.; Bargossi, A.M.; Fiorella, P.L.; Marchesini, G. Can oxypurines plasma levels classify the type of physical exercise? J. Sports Med. Phys. Fitness 1999, 39, 123–127. [Google Scholar] [PubMed]
- Hellsten, Y.; Svensson, M.; Sjödin, B.; Smith, S.; Christensen, A.; Richter, E.; Bangsbo, J. Allantoin formation and urate and glutathione exchange in human muscle during submaximal exercise. Free Radic. Biol. Med. 2001, 31, 1313–1322. [Google Scholar] [CrossRef] [PubMed]
- Lustgarten, M.S.; Price, L.L.; Logvinenko, T.; Hatzis, C.; Padukone, N.; Reo, N.V.; Phillips, E.M.; Kirn, D.; Mills, J.; Fielding, R.A. Identification of serum analytes and metabolites associated with aerobic capacity. Eur. J. Appl. Physiol. 2013, 113, 1311–1320. [Google Scholar] [CrossRef] [PubMed]
- Creek, D.J.; Jankevics, A.; Breitling, R.; Watson, D.G.; Barrett, M.P.; Burgess, K.E.V. Toward global metabolomics analysis with hydrophilic interaction liquid chromatography-mass spectrometry: Improved metabolite identification by retention time prediction. Anal. Chem. 2011, 83, 8703–8710. [Google Scholar] [CrossRef] [PubMed]
- Zhang, T.; Watson, D.G.; Wang, L.; Abbas, M.; Murdoch, L.; Bashford, L.; Ahmad, I.; Lam, N.Y.; Ng, A.C.F.; Leung, H.Y. Application of Holistic Liquid Chromatography-High Resolution Mass Spectrometry Based Urinary Metabolomics for Prostate Cancer Detection and Biomarker Discovery. PLoS One 2013, 8, e65880. [Google Scholar] [CrossRef] [PubMed]
- Zhang, R.; Watson, D.G.; Wang, L.; Westrop, G.D.; Coombs, G.H.; Zhang, T. Evaluation of mobile phase characteristics on three zwitterionic columns in hydrophilic interaction liquid chromatography mode for liquid chromatography-high resolution mass spectrometry based untargeted metabolite profiling of Leishmania parasites. J. Chromatogr. A 2014, 1362, 168–179. [Google Scholar] [CrossRef] [PubMed]
- Creek, D.J.; Jankevics, A.; Burgess, K.E.V.; Breitling, R.; Barrett, M.P. IDEOM: An Excel interface for analysis of LC-MS-based metabolomics data. Bioinformatics 2012, 28, 1048–1049. [Google Scholar] [CrossRef] [PubMed]
- Ryan, D.; Robards, K.; Prenzler, P.D.; Kendall, M. Recent and potential developments in the analysis of urine: A review. Anal. Chim. Acta 2011, 684, 8–20. [Google Scholar] [CrossRef] [PubMed]
- Takahashi, H. Non-enzymatic hydroxylation of kynurenic acid to 6-hydroxykynurenic acid. J. Biochem. 1968, 63, 789–791. [Google Scholar] [PubMed]
- Al Bratty, M.; Chintapalli, V.R.; Dow, J.A.T.; Zhang, T.; Watson, D.G. Metabolomic profiling reveals that Drosophila melanogaster larvae with the y mutation have altered lysine metabolism. FEBS Open Bio 2012, 2, 217–221. [Google Scholar] [CrossRef] [PubMed]
- Romijn, J.A.; Coyle, E.F.; Sidossis, L.S.; Gastaldelli, A.; Horowitz, J.F.; Endert, E.; Wolfe, R.R. Regulation of endogenous fat and carbohydrate metabolism in relation to exercise intensity and duration. Am. J. Physiol. 1993, 265, E380–E391. [Google Scholar] [PubMed]
- Wu, I.-W.; Hsu, K.-H.; Lee, C.-C.; Sun, C.-Y.; Hsu, H.-J.; Tsai, C.-J.; Tzen, C.-Y.; Wang, Y.-C.; Lin, C.-Y.; Wu, M.-S. p-Cresyl sulphate and indoxyl sulphate predict progression of chronic kidney disease. Nephrol. Dial. Transplant 2011, 26, 938–947. [Google Scholar] [CrossRef] [PubMed]
- Nicholson, J.K.; Holmes, E.; Kinross, J.; Burcelin, R.; Gibson, G.; Jia, W.; Pettersson, S. Host-gut microbiota metabolic interactions. Science 2012, 336, 1262–1267. [Google Scholar] [CrossRef] [PubMed]
- Davila, A.-M.; Blachier, F.; Gotteland, M.; Andriamihaja, M.; Benetti, P.-H.; Sanz, Y.; Tomé, D. Intestinal luminal nitrogen metabolism: role of the gut microbiota and consequences for the host. Pharmacol. Res. 2013, 68, 95–107. [Google Scholar] [CrossRef] [PubMed]
- Lustgarten, M.S.; Price, L.L.; Chalé, A.; Fielding, R.A. Metabolites related to gut bacterial metabolism, peroxisome proliferator-activated receptor-alpha activation, and insulin sensitivity are associated with physical function in functionally-limited older adults. Aging Cell 2014, 13, 918–925. [Google Scholar] [CrossRef] [PubMed]
- Lehmann, R.; Zhao, X.; Weigert, C.; Simon, P.; Fehrenbach, E.; Fritsche, J.; Machann, J.; Schick, F.; Wang, J.; Hoene, M.; et al. Medium chain acylcarnitines dominate the metabolite pattern in humans under moderate intensity exercise and support lipid oxidation. PLoS One 2010, 5, e11519. [Google Scholar] [CrossRef] [PubMed]
- Romijn, J.A.; Coyle, E.F.; Sidossis, L.S.; Rosenblatt, J.; Wolfe, R.R. Substrate metabolism during different exercise intensities in endurance-trained women. J. Appl. Physiol. 2000, 88, 1707–1714. [Google Scholar] [PubMed]
- Zammit, V.A.; Ramsay, R.R.; Bonomini, M.; Arduini, A. Carnitine, mitochondrial function and therapy. Adv. Drug Deliv. Rev. 2009, 61, 1353–1362. [Google Scholar] [CrossRef] [PubMed]
- Kasukawa, T.; Sugimoto, M.; Hida, A.; Minami, Y.; Mori, M.; Honma, S.; Honma, K.; Mishima, K.; Soga, T.; Ueda, H.R. Human blood metabolite timetable indicates internal body time. Proc. Natl. Acad. Sci. USA 2012, 109, 15036–15041. [Google Scholar] [CrossRef] [PubMed]
- Hafezi-Moghadam, A.; Simoncini, T.; Yang, Z.; Limbourg, F.P.; Plumier, J.-C.; Rebsamen, M.C.; Hsieh, C.-M.; Chui, D.-S.; Thomas, K.L.; Prorock, A.J.; et al. Acute cardiovascular protective effects of corticosteroids are mediated by non-transcriptional activation of endothelial nitric oxide synthase. Nat. Med. 2002, 8, 473–479. [Google Scholar] [CrossRef] [PubMed]
- Tremblay, M.S.; Copeland, J.L.; Van Helder, W. Effect of training status and exercise mode on endogenous steroid hormones in men. J. Appl. Physiol. 2004, 96, 531–539. [Google Scholar] [CrossRef] [PubMed]
- Gatti, R.; Cappellin, E.; Zecchin, B.; Antonelli, G.; Spinella, P.; Mantero, F.; de Palo, E.F. Urinary high performance reverse phase chromatography cortisol and cortisone analyses before and at the end of a race in elite cyclists. J. Chromatogr. B. Analyt. Technol. Biomed. Life Sci. 2005, 824, 51–56. [Google Scholar] [CrossRef] [PubMed]
- Dovio, A.; Roveda, E.; Sciolla, C.; Montaruli, A.; Raffaelli, A.; Saba, A.; Calogiuri, G.; de Francia, S.; Borrione, P.; Salvadori, P.; et al. Intense physical exercise increases systemic 11beta-hydroxysteroid dehydrogenase type 1 activity in healthy adult subjects. Eur. J. Appl. Physiol. 2010, 108, 681–687. [Google Scholar] [CrossRef] [PubMed]
- Pechlivanis, A.; Kostidis, S.; Saraslanidis, P.; Petridou, A.; Tsalis, G.; Mougios, V.; Gika, H.G.; Mikros, E.; Theodoridis, G.A. 1H NMR-Based Metabonomic Investigation of the Effect of Two Different Exercise Sessions on the Metabolic Fingerprint of Human Urine. J. Proteome Res. 2010, 9, 6405–6416. [Google Scholar] [CrossRef] [PubMed]
- Zieliński, J.; Kusy, K.; Słomińska, E. Alterations in purine metabolism in middle-aged elite, amateur, and recreational runners across a 1-year training cycle. Eur. J. Appl. Physiol. 2013, 113, 763–773. [Google Scholar] [CrossRef] [PubMed]
- Ganti, S.; Taylor, S.L.; Kim, K.; Hoppel, C.L.; Guo, L.; Yang, J.; Evans, C.; Weiss, R.H. Urinary acylcarnitines are altered in human kidney cancer. Int. J. Cancer 2012, 130, 2791–2800. [Google Scholar] [CrossRef] [PubMed]
- Jin, X.; Yun, S.J.; Jeong, P.; Kim, I.Y.; Kim, W.-J.; Park, S. Diagnosis of bladder cancer and prediction of survival by urinary metabolomics. Oncotarget 2014, 5, 1635–1645. [Google Scholar] [PubMed]
- Struck, W.; Siluk, D.; Yumba-Mpanga, A.; Markuszewski, M.; Kaliszan, R.; Markuszewski, M.J. Liquid chromatography tandem mass spectrometry study of urinary nucleosides as potential cancer markers. J. Chromatogr. A 2013, 1283, 122–131. [Google Scholar] [CrossRef] [PubMed]
- Pitsiladis, Y.P.; Durussel, J.; Rabin, O. An integrative “omics” solution to the detection of recombinant human erythropoietin and blood doping. Br. J. Sports Med. 2014, 48, 856–861. [Google Scholar] [CrossRef] [PubMed]
- Daskalaki, E.; Easton, C.; Watson, D.G. The application of metabolomic profiling to the effects of physical activity. Curr. Metabolomics 2015, 4. in press. [Google Scholar]
© 2015 by the authors; licensee MDPI, Basel, Switzerland. This article is an open access article distributed under the terms and conditions of the Creative Commons Attribution license (http://creativecommons.org/licenses/by/4.0/).
Share and Cite
Daskalaki, E.; Blackburn, G.; Kalna, G.; Zhang, T.; Anthony, N.; Watson, D.G. A Study of the Effects of Exercise on the Urinary Metabolome Using Normalisation to Individual Metabolic Output. Metabolites 2015, 5, 119-139. https://doi.org/10.3390/metabo5010119
Daskalaki E, Blackburn G, Kalna G, Zhang T, Anthony N, Watson DG. A Study of the Effects of Exercise on the Urinary Metabolome Using Normalisation to Individual Metabolic Output. Metabolites. 2015; 5(1):119-139. https://doi.org/10.3390/metabo5010119
Chicago/Turabian StyleDaskalaki, Evangelia, Gavin Blackburn, Gabriela Kalna, Tong Zhang, Nahoum Anthony, and David G. Watson. 2015. "A Study of the Effects of Exercise on the Urinary Metabolome Using Normalisation to Individual Metabolic Output" Metabolites 5, no. 1: 119-139. https://doi.org/10.3390/metabo5010119
APA StyleDaskalaki, E., Blackburn, G., Kalna, G., Zhang, T., Anthony, N., & Watson, D. G. (2015). A Study of the Effects of Exercise on the Urinary Metabolome Using Normalisation to Individual Metabolic Output. Metabolites, 5(1), 119-139. https://doi.org/10.3390/metabo5010119