Identification of Genetic Markers Linked to The Activity of Indoleamine 2,3-Dioxygenase and Kidney Function


1
Department of Medical Sciences, Graduate School, Soonchunhyang University, Asan 31538, Chungnam, Republic of Korea
2
Department of Biomedical Laboratory Science, College of Life and Health Sciences, Hoseo University, Asan 31499, Chungnam, Republic of Korea
3
Department of Biomedical Laboratory Science, College of Medical Sciences, Soonchunhyang University, Asan 31538, Chungnam, Republic of Korea
*
Author to whom correspondence should be addressed.
†
These authors contributed equally to this work.
Metabolites 2023, 13(4), 541; https://doi.org/10.3390/metabo13040541
Submission received: 12 March 2023
/
Revised: 4 April 2023
/
Accepted: 7 April 2023
/
Published: 10 April 2023
(This article belongs to the Section Endocrinology and Clinical Metabolic Research)
Abstract
:Indoleamine 2,3-dioxygenase (IDO) is a tryptophan-degrading enzyme belonging to the kynurenine pathway. IDO activity has been suggested as a potential biomarker for early diagnosis of chronic kidney disease (CKD). The aim of this study was to perform coincident association analysis to gain genetic insights into the correlation between IDO activity and CKD. This study evaluated the association between IDO activity and CKD using the Korea Association REsource (KARE) cohort. Logistic and linear regression were used to analyze CKD and quantitative phenotypes such as IDO and estimated glomerular filtration rate (eGFR). Our results identified 10 single nucleotide polymorphisms (SNPs) that were coincidently associated with both IDO and CKD (p < 0.001). Among them, rs6550842, rs77624055, and rs35651150 were selected as potential candidates after excluding SNPs with insufficient evidence for having an association with IDO or CKD. Further expression quantitative trait loci (eQTL) analysis for variants at selected loci showed that rs6550842 and rs35651150 significantly affected the expression of NKIRAS1 and SH2D4A genes in human tissues, respectively. Additionally, we highlighted that the NKIRAS1 and BMP6 genes were correlated with IDO activity and CKD through signaling pathways associated with inflammation. Our data suggest that NKIRAS1, SH2D4A, and BMP6 were potential causative genes affecting IDO activity and CKD through integrated analysis. Identifying these genes could aid in early detection and treatment by predicting the risk of CKD associated with IDO activity.
1. Introduction
Chronic kidney disease (CKD) is a worldwide public health problem, which can lead to a gradual decline in kidney function [1]. Diabetes and high blood pressure are among the primary factors responsible for its roughly [2]. According to a recent Center for Disease Control and Prevention (CDC) report, about 15% of American adults suffer from CKD, with many of them being oblivious to their condition [3]. The Korea Disease Control and Prevention Agency (KDCA) also reported that the prevalence of CKD among Korean adults in 2019 was 9.3% (https://health.kdca.go.kr/ (accessed on 10 March 2023)). Continued kidney damage can lead to end-stage renal disease (ESRD) requiring dialysis or kidney transplantation or increase the risk of cardiovascular complications [2]. Therefore, early identification and effective control of CKD are important to prevent these diseases [2,4]. Creatinine and estimated glomerular filtration rate (eGFR) are mainly used as indicators of kidney damage [5]. However, they are insufficiently sensitive to predict CKD at an early stage [6]. Thus, further studies are needed to identify novel biomarkers.
Indoleamine 2,3-dioxygenase (IDO) is a rate-limiting enzyme of tryptophan metabolism that catalyzes the degradation of tryptophan to kynurenine [7]. Its activity is induced by pro-inflammatory cytokines such as interferon-γ (IFN-γ) and tumor necrosis factor-α (TNF-α) [8]. Previously published reports have demonstrated a correlation between some types of renal disease and IDO activity [9,10,11,12]. In detail, IDO expression was found in the glomerular and tubular cells of the nephrotoxic serum nephritis model [9] and increased apoptosis in tubular cells of the renal ischemia-reperfusion injury model [10], respectively. IDO was also associated with diabetic nephropathy [12] and renal fibrosis [11]. Furthermore, several studies have demonstrated the association between CKD and IDO activity [7,13,14,15].
Renal inflammation is an initial response to kidney damage, but if inflammation persists, it promotes the fibrotic process, leading to CKD [16]. Interestingly, Matheus et al. showed that IDO accompanies renal fibrosis, and its expression is induced by transforming growth factor-β (TGF-β) 1, a potent fibrotic molecule [11]. Another study demonstrated that IDO activity is associated with CKD and key inflammatory markers (hs-CRP, high-sensitivity C-reactive protein, and sTNFR-I, soluble TNF-receptor-1) [13]. The precise mechanism of IDO in CKD remains uncertain. Nevertheless, the above findings suggest that the correlation between CKD and IDO may be mainly induced by inflammatory mechanisms.
To better understand these complex diseases, recent studies have used an integrated analysis of omics, including genomics, transcriptomics, proteomics, metabolomics, and epigenomics [17,18]. CKD has been proven to be a complex disease with high heritability [2,19]. Hence, we hypothesized that genetic factors might play a role in altering IDO activity and through a combining genomics and metabolomics data analysis of a Korean cohort, we have recently identified multiple loci linked to IDO activity associated with CKD [15]. However, since our previous study had a narrow focus on IDO activity, the statistical significance of CKD and eGFR was paid less attention. To compensate for this and to find genes coincidentally associated with CKD and IDO activity, we broadened the statistical significance to 0.01. Additionally, loci affecting mRNA expression were then identified through expression quantitative trait loci (eQTL) analysis among variants related to CKD and IDO activity.
2. Materials and Methods
2.1. Study Population
The Korea Association REsource (KARE) cohort used in this study has been described in detail elsewhere [20]. Briefly, the KARE cohort as part of the Korean Genome and Epidemiology Study (KoGES) was initiated in 2001. It included a total of 10,038 participants aged 40–69 years. The cohort consisted of baseline data from 2001 to 2002 and follow-up data from 2003–2014 (every two years). Among them, secondary follow-up data between 2005 and 2006 that included metabolite information were selected for this study. A total of 2579 participants with both metabolomic and genomic data were available. Basic characteristics of the participants are provided in Table 1.
All participants underwent anthropometric and biochemical measurements. Information about these measurements is included in the KARE dataset. Height and weight values were obtained through an automated measuring instrument (Dong Sahn Jenix Co., Seoul, Republic of Korea). Blood pressure measurements were performed three times at intervals of more than five minutes in a sitting position, using a mercury sphygmomanometer (Baumanometer; W.A. Baum, Copiague, NY, USA). Their average values were used in this study. Blood sampling was performed to analyze biochemical traits such as serum creatinine and blood urea nitrogen (BUN) in individuals who fasted for more than 8 h. Serum creatinine was determined via the Jaffe method using an automatic analyzer (Hitachi, Tokyo, Japan) [21]. The CKD-Epidemiology Collaboration (CKD-EPI) equation was used to calculate the eGFR. The eGFR equations used in this study according to gender are described below:
eGFR in Men = 141 × min (creatinine/0.9, 1)−0.411 × max (creatinine/0.9, 1)−1.209 × 0.993age
eGFR in Women = 143.54 × min (creatinine/0.7, 1)−0.329 × max (creatinine/0.7, 1)−1.209 × 0.993age
For case-control analysis, participants were divided into two groups (CKD and non-CKD) based on the criteria of the Kidney Disease Improving Global Outcome (KDIGO) [22]. The CKD group (n = 264) consisted of people with eGFR < 60 mL/min/1.72 m2 and a history of CKD. The non-CKD group (n = 1550) was defined as an eGFR ≥ 60 mL/min/1.72 m2. Patients (n = 765) with a diagnosis or drug history of diabetes and/or hypertension were excluded from the non-CKD group.
2.2. Metabolite Measurements
Serum metabolite quantification for 2579 participants was carried out using an AbsoluteIDQ p180 kit (BIOCRATES Life Science, Innsbruck, Austria) following the manufacturer’s instructions. An API 4000 QTRAP system (Applied Biosystems, Foster City, CA, USA) equipped with an Agilent 1200 HPLC system (Agilent Technologies, Santa Clara, CA, USA) was used to perform liquid chromatography and flow injection analysis-mass spectrometry. Concentrations of kynurenine and tryptophan used in this study were measured in μM units with a MetVal software package (BIOCRATES Life Sciences). Serum metabolites that passed the following quality control (QC) criteria were included in this study: (i) the coefficient of variance for each metabolite in the reference standards < 25%, (ii) half of the analyzed metabolite concentrations in the reference standards > limit of detection (LOD), and (iii) half of the analyzed metabolite concentrations in the experimental samples > LOD. Detailed information for the QC procedure has been described in a previous study [23]. The ratio of kynurenine to tryptophan (K/T) was calculated to estimate the IDO activity.
2.3. Genotyping and Imputation
Genomic DNA samples were extracted from peripheral blood samples and genotyped using an Affymetrix Genome-Wide Human SNP array 5.0 (Affymetrix, Santa Clara, CA, USA). Detailed QC procedures for samples and single nucleotide polymorphisms (SNPs) have been previously reported [24]. Briefly, samples were excluded if they had high missing call rates, ≥ 4%, DNA contamination, sex inconsistencies, or cryptic relatedness. Genotyping data were cleaned according to QC criteria [excluding SNPs with missing call rates > 0.05, Hardy-Weinberg equilibrium (HWE) p-value < 1 × 10⁻⁶, or minor allele frequency (MAF) < 0.01]. The imputation of SNPs was performed using the 1000 Genomes Phase I data (reference panel) and the IMPUTE2 software [25]. Finally, 6,461,358 SNPs were included in the current analysis. Locations of SNPs were based on the National Center for Biotechnology Information (NCBI) Human Genome Build 37 (hg19).
2.4. Statistical Analysis
Regression analyses based on the additive model were conducted using PLINK version 1.90 beta (https://www.cog-genomics.org/plink2 (accessed on 10 March 2023)) [26]. A student’s t-test was used to compare the mean values of several characteristics between cases and controls. Quantitative phenotypes such as IDO and eGFR were analyzed via linear regression. Logistic regression was used to test the association between SNPs and CKD. p-values were adjusted for covariates such as age, sex, geographic area, body mass index (BMI), hemoglobin A1C (HbA1c), alcohol intake, smoking, systolic blood pressure (SBP), and high-sensitivity C-reactive protein (hs-CRP). We selected SNPs that showed p < 0.001 for both IDO activity and CKD. To avoid enrichment testing for multiple SNPs showing the same genetic linkage signal, SNPs were clumped for linkage disequilibrium (LD) with an r2 threshold 0.5 within a distance of 1000 kb. Regional plots were generated with the LocusZoom browser (http://locuszoom.org/ (accessed on 10 March 2023)). In silico analysis was performed using genotype tissue expression (GTEx) (https://gtexportal.org/ (accessed on 10 March 2023)) and HaploReg v4.1 (https://pubs.broadinstitute.org/ (accessed on 10 March 2023)) databases. The transforming growth factor-β (TGF-β) signaling pathway was downloaded from the Kyoto Encyclopedia of Genes and Genomes (KEGG) pathway website (https://www.genome.jp/kegg/ (accessed on 2 February 2023)).
2.5. Genotype-Tissue Expression (GTEx)
The GTEx portal is a data resource and tissue bank established by the National Institutes of Health Common Fund to investigate the correlation between genetic variation and gene expression in multiple tissues [27]. The donors comprise nearly 1000 individuals who have consented to donate their organs and/or tissues after death, including various ethnicities such as European American, African American, Asian American, Hispanic, or Latino. The samples were collected from 54 non-diseased tissue sites (such as brain, thyroid, pancreas, skin, etc.) and 2 cell lines. Detailed information about tissue sampling sites can be found on the GTEx portal (https://gtexportal.org/ (accessed on 10 March 2023)).
2.6. Ethics Statement
This study was approved by the Institutional Review Board (IRB) of the Korea Disease Control and Prevention Agency (KDCA) (approval number: KBN-2021-003; date: 26 January 2021) and Soonchunhyang University (approval number: 202012-BR-086-01; date: 15 December 2020). All participants provided written informed consent.
3. Results
3.1. Characteristics of Study Participants
The clinical profiles of the study population are summarized in Table 1. The average age of 2579 participants was 57.10 ± 9.05 years. There were 1218 (47.23%) males. Compared with healthy controls (n = 1550), CKD patients (n = 264) were older with higher BMI, creatinine, and BUN levels. In contrast, height, weight, and eGFR were lower in the case group than in the control group. All characteristics were significantly (p < 0.05) different between the case group and the control group.
3.2. Variants Associated with Both IDO Activity and CKD
Using regression analysis, this study performed genome-wide analysis to investigate associations of SNPs with IDO activity and CKD. As a result, we identified 10 tag SNPs that were significantly associated with both IDO activity and CKD (p < 0.001) (Table 2). Of these, rs189138212 located near the ITPKB (Inositol-Trisphosphate 3-Kinase B) gene showed the highest association (p = 7.19 × 10⁻⁵) with IDO activity. However, its frequency was too low (MAF = 0.017). In addition, no strong LD was observed in the vicinity (Figure S2). Therefore, we first excluded genes irrelevant to IDO activity and CKD as well as variants showing weak LD values with surrounding SNPs to select candidate genes/loci. Eventually, we focused on rs6550842, rs77624055, and rs35651150 located at 3p24.2, 6p24.3, and 8p21.3, respectively.
The recombination rates (cM/Mb) and LD values of three candidate variants are shown in regional plots (Figure 1). Locus 3p24.2 reached high significance levels with p = 1.07 × 10⁻⁴ and p = 2.52 × 10⁻⁴ for rs6550842 in IDO activity and CKD, respectively. The LD block of this variant was surrounded by several genes (UBE2E1, Ubiquitin Conjugating Enzyme E2 E1; NKIRAS1, NFKB Inhibitor Interacting Ras Like 1; RPL15, Ribosomal Protein L15; NR1D2, Nuclear Receptor Subfamily 1 Group D Member 2; LINC00691, Long Intergenic Non-Protein Coding RNA 691; THRB, Thyroid Hormone Receptor Beta) on chromosome 3. The second associated region at 6p24.3 also showed significant associations with IDO activity and CKD (p = 9.70 × 10⁻⁴ and p = 5.89 × 10⁻⁴ for rs77624055, respectively) rs77624055 is a variant located in the intronic of the BMP6 (Bone Morphogenetic Protein 6) gene. The rs35651150 of the third locus at 8p21.3 is an intergenic SNP located 26 kb upstream of LOC100128993 and 42 kb upstream of SH2D4A (SH2 Domain Containing 4A). Its minor allele carriers significantly reduced both IDO level (β = −0.11, p = 8.30 × 10⁻⁴) and CKD risk (OR = 0.58, 95% CI: 0.44–0.77, p = 1.37 × 10⁻⁴). All these tag SNPs (rs6550842, rs77624055, and rs35651150) also showed significant associations with eGFR (all p < 0.05).
Since rs6550842 and rs35651150 are located between several genes rather than belonging to one specific gene, we further analyzed rs77624055 located in the intron of the BMP6 gene. SNPs within the same region (7.68–7.74 kb at 6p24.3) as rs77624055, based on recombination rates, were included in the analysis. Five out of 16 tag SNPs, including rs77624055, reached a statistical significance of p < 0.05 for associations with IDO activity (Table 3). These variants had signals independent of each other. Among them, rs7753111 showed statistically significant associations with IDO activity (β = 0.085, p = 5.56 × 10⁻³), CKD (OR = 1.31, 95% CI 1.04–1.66, p = 0.024), and eGFR (β = −0.74, p = 0.019). Additionally, rs111588693 in the BMP6 gene was associated with IDO activity (β = −0.085, p = 0.023) as a non-synonymous variant.
3.3. In Silico Analysis
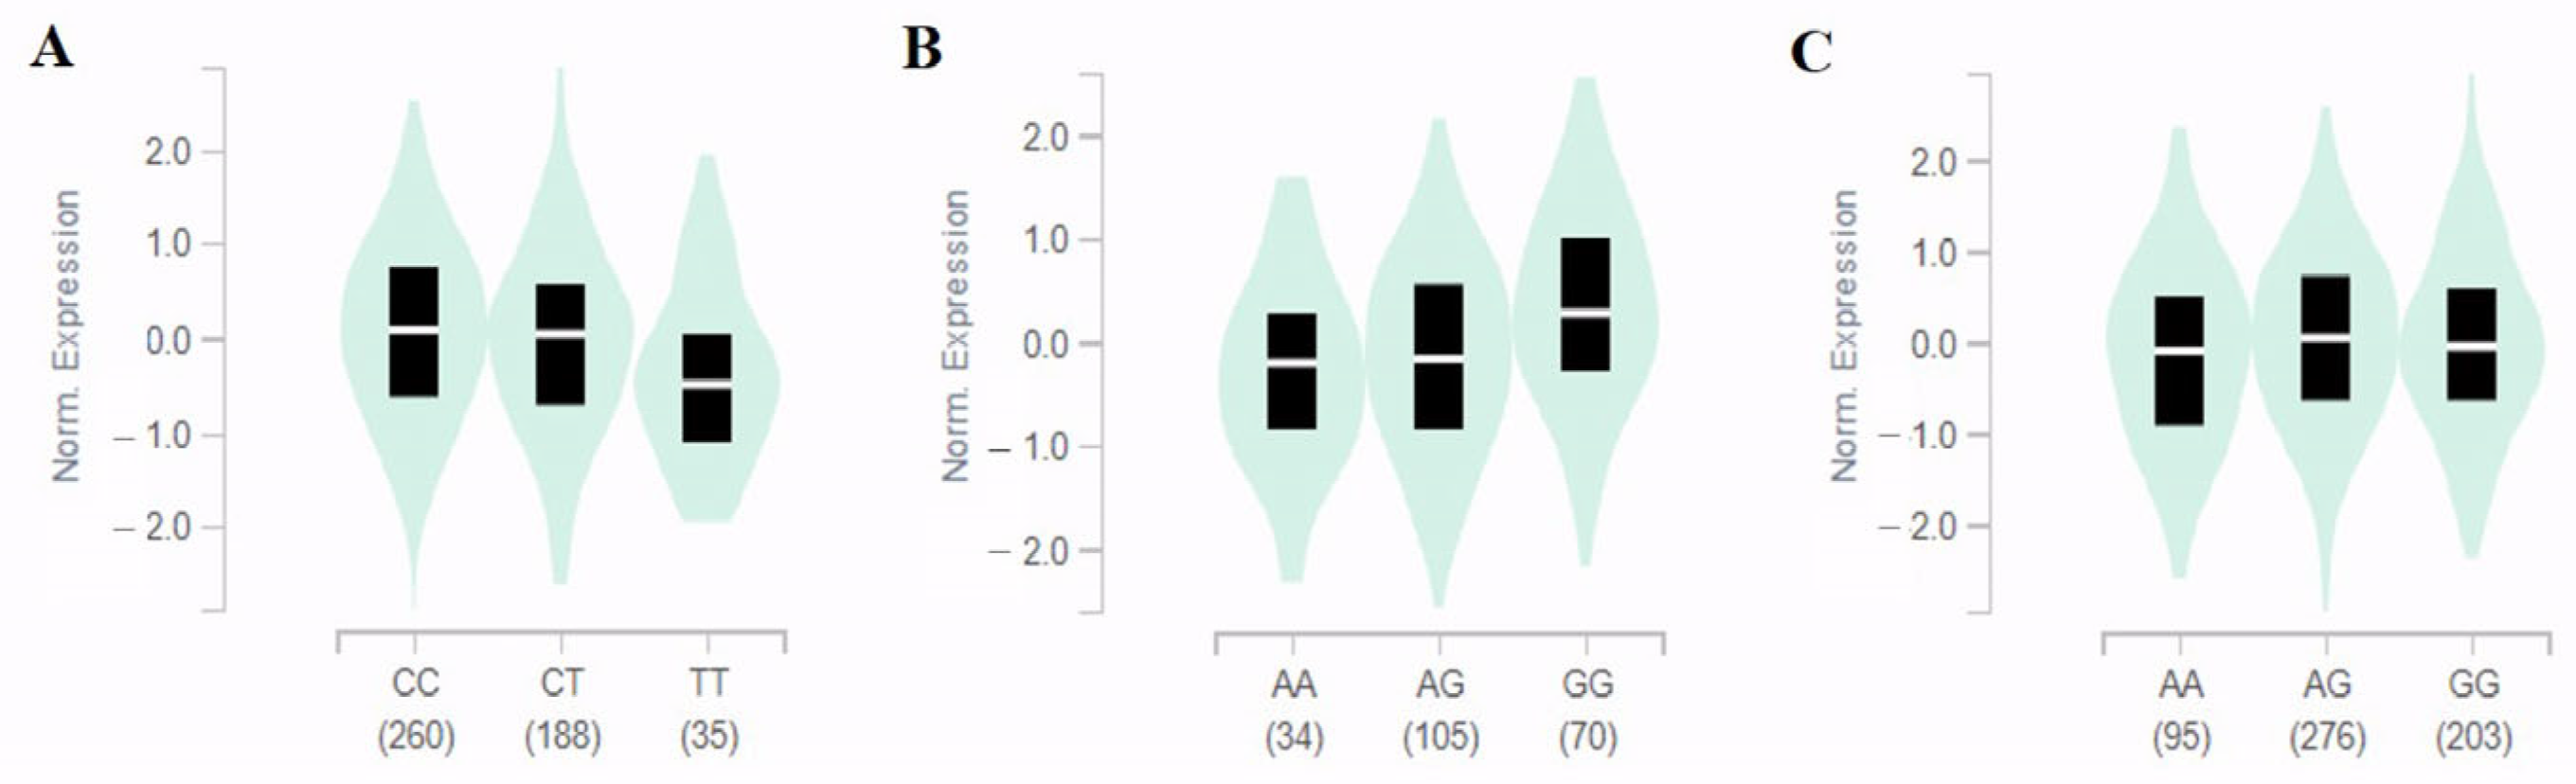
This study performed eQTL analysis based on the GTEx database to determine gene expression levels according to SNP genotypes. eQTL was found for two SNPs except for rs77624055 in human tissues (Figure 2). As a result, the minor allele (A) of rs35651150 located between LOC100128993 and SH2D4A contributed to lower expression levels of the SH2D4A gene in the cerebellum (effect size = 0.37, p = 1.3 × 10⁻⁵) and thyroid (effect size = 0.19, p = 7.7 × 10⁻⁹) (Figure 2B,C) respectively. In particular, rs6550842 only affected the expression of the NKRAS1 gene, although it was located between several genes (NKIRAS1-NR1D2-THRB).
In cultured fibroblasts, the expression level of the NKIRAS1 gene was significantly reduced in minor allele (T) carriers of rs6550842 (effect size = −0.12, p = 7.3 × 10⁻⁵) (Figure 2A). Thus, its true functional association was believed to be with SH2D4A for rs35651150 and NKIRAS1 for rs6550842, respectively. For the BMP6 gene without eQTL data, potential functional effects of five SNPs related to IDO activity were examined using the HaploReg database (Table S1). Motif changes were predicted for the four SNPs that showed significant associations with IDO activity. The TGF-β signaling pathway involved in many cellular processes is also shown through KEGG pathway analysis of the BMP6 gene (Figure S1).
4. Discussion
Various populations, including Koreans [28], have provided evidence to support the connection between IDO activity and CKD [7,13,14]. We have recently conducted an integrated metabolome and genome association analysis to identify genetic markers for detecting CKD in its early stages [15]. However, the previous study that focused on IDO activity had a limitation, as the correlation with CKD was moderately low. To overcome this issue, we conducted the present study to identify the causative gene without any bias towards a specific phenotype. As a result, we identified 10 SNPs showing significant associations with both IDO activity and CKD (Table 2). Among them, four SNPs (rs189138212, rs145478425, rs149583220, and rs145951089) showed low LD values with surrounding SNPs in their respective genetic regions, suggesting that their genetic signals were weak (Figures S2 and S3). Also, rs7679032, rs9533960, and rs72898186 were considered signals unrelated to IDO activity or CKD. Eventually, we selected three candidate genes/loci (NKIRAS1/3p24.2, BMP6/6p24.3, and SH2D4A/8p21.3), excluding unrelated and weak signals.
Among these three selected variants, rs6550842 is an intergenic tag SNP located between several genes (UBE2E1, NKIRAS1, RPL15, NR1D2, LINC00691, and THRB), and rs35651150 is located between the LOC100128993 and SH2D4A genes. Previous studies have reported that eQTL analysis can be used to identify novel trait-related loci and determine the most functionally related genes at loci [18,29]. Therefore, we performed eQTL analysis to identify target genes. eQTL analysis shows that rs6550842 affected the expression of the NKIRAS1 gene in cultured fibroblasts (Figure 2A). Additionally, although rs35651150 was closer to the LOC100128993 gene, it significantly altered the SH2D4A gene expression levels in the cerebellum and thyroid (Figure 2B,C). Based on some evidence indicating their connections with IDO activity and CKD, we further investigated the NKIRAS1 and SH2D4A genes, as described below.
The first candidate gene, NKIRAS1, encodes a Ras-like protein that has a close association with the NF-kappa-B (NF-κB) pathway [30]. Activation of NF-κB, which controls many genes involved in inflammation, has been reported to play an important role in the inflammatory response of kidney injury [31,32]. In light of these studies, NKIRAS1, which negatively regulates NF-κB activity [30], can improve renal impairment. Indeed, Gerashchenko et al. have reported that the expression of NKIRAS1 is downregulated in renal cell carcinoma [33]. Consistent with previous findings, our results showed that being a minor carrier of rs6550842 decreased the expression of NKIRAS1 but increased both CKD risk and IDO activity (Table 2 and Figure 2).
As a second candidate, the BMP6 gene encodes a protein which is a member of the TGF-β superfamily [34]. The TGF-β is a potent fibrotic cytokine involved in many cellular processes including cell growth, differentiation, and migration [35]. Many studies have found increased expression and activation of TGF-β1 in progressive kidney disease [35,36,37]. In addition, TGF-β1, a potent fibrogenic cytokine, has been reported to regulate IDO in some cell types [38]. Remarkably, in vivo studies have confirmed that deficiency of the BMP6 gene can increase renal fibrosis and upregulate TGF-β1 after renal injury [39,40,41]. TGF-β is known to activate the Smad2/3 and c-Jun NH2-terminal kinase (JNK) signaling pathways [42]. Further to this discovery, Yan et al. have conducted cell experiments and suggested that inhibition of JNK and Smad2/3 signaling activated by TGF-β1 is a major mechanism for the antifibrotic effect of the BMP6 gene [43].
In this study, the minor allele of rs77624055 in the BMP6 gene showed the same tendency to increase both IDO activity and CKD risk (Table 2). In combination with several previous studies, our results suggest that the BMP6 gene might ultimately be involved in CKD by regulating renal fibrosis as well as IDO activity via the TGF-β signaling pathway (Figure S1). On the other hand, since the currently available eQTL database does not provide evidence for rs77624055, further functional studies are needed to elucidate whether this variant affects the expression of the BMP6 gene associated with IDO and CKD.
The estrogen receptor α (ERα) is a nuclear transcription factor involved in physiological development and function in humans [44]. Regulating its activity might be useful for preventing and treating various diseases. Previous studies have reported that estrogen and the ERα are involved in kidney repair and regeneration [45,46]. As a final candidate gene, the SH2D4A gene encodes a protein that belongs to the SH2 signaling protein family, which has been reported to bind directly to the ERα in kidney cells [47]. Accordingly, we hypothesize that SH2D4A, which inhibits the ER signaling pathway, could potentially have adverse effects on the kidneys. Consistent with our hypothesis, minor allele carriers of rs35651150 had decreased IDO activity and CKD risk, as well as downregulated expression levels of the SH2D4A gene in human tissues (Table 2 and Figure 2). These observations provide evidence that the SH2D4A gene, associated with the ERα, affects IDO activity and CKD.
The limitation of this study is that the sample size was insufficient to perform separate analyses for males and females. Additionally, the absence of parental information in the KARE cohort posed a challenge in establishing a cause-and-effect relationship between family history of kidney disease and IDO activity. Therefore, further replication studies in other cohorts are necessary to validate our findings and investigate the impact of gender.
In a previous study, we demonstrated that the regulation of IDO activity by four genes (RSU1, PDGFD, SNX25 and TNFRSF19) is linked to CKD. These findings could aid in the early diagnosis of CKD by utilizing SNPs of these genes to predict IDO activity. In contrast to the previous study, the present research conducted an analysis to find genes that are commonly associated with both CKD and IDO activity. Of the 10 identified SNPs, we focused on rs6550842 (NKIRAS1), rs77624055 (BMP6), and rs35651150 (SH2D4A). Moreover, we confirmed whether identified variants could affect gene expression. As a result, rs6550842 and rs35651150 of NKIRAS1 and SH2D4A genes, respectively, showed important signals in human tissues. In particular, the NKIRAS1 and BMP6 genes are implicated in the NF-κB and TGF-β pathways, respectively. This suggests that IDO activity might act on CKD through the NF-κB and TGF-β pathways, which are closely related to inflammation.
5. Conclusions
The study suggests that NKIRAS1, BMP6, and SH2D4A could be promising new genetic markers for early improvement in renal health. Additionally, in vivo experiments should be performed to extend the genetic markers identified in this study to the mechanisms of disease physiology.
Supplementary Materials
The following supporting information can be downloaded at: https://www.mdpi.com/article/10.3390/metabo13040541/s1, Figure S1: The KEGG pathway for TGF-β signaling pathway; Figure S2: Regional plots for association of SNPs near ITPKB (A), LOC101927318 (B), and LINC00330 (C) genes; Figure S3: Regional plots for association of SNPs near ADAM7 (A), FHIT (B), and LINC00616 (C), MIR924HG (D) genes; Table S1: HaploReg results of four SNPs in the BMP gene.
Author Contributions
Conceptualization, H.-R.K. and H.-S.J.; methodology, H.-S.J.; software, H.-R.K.; validation, H.-R.K., H.-S.J. and Y.-B.E.; investigation, H.-R.K.; resources, Y.-B.E.; data curation, H.-R.K. and H.-S.J.; writing—original draft preparation, H.-R.K. and H.-S.J.; writing—review and editing, H.-S.J. and Y.-B.E.; supervision, Y.-B.E.; project administration, Y.-B.E.; funding acquisition, Y.-B.E. All authors have read and agreed to the published version of the manuscript.
Funding
This study was supported by Soonchunhyang University research fund [SCH-20230312] and a National Research Foundation of Korea (NRF) grant funded by the Korean government (MSIT) [NRF-2023R1A2C1003486].
Institutional Review Board Statement
This study was approved by the Institutional Review Board (IRB) of Korea Disease Control and Prevention Agency (KDCA, KBN-2021-003, 26 January 2021) and Soonchunhyang University (202012-BR-086-01, 15 December 2020).
Informed Consent Statement
Informed consent was obtained from all subjects involved in the study.
Data Availability Statement
The data presented in this study are available on request from the corresponding author. The data are not publicly available due to ethnical concerns.
Conflicts of Interest
The authors declare no conflict of interests.
References
- Levey, A.; Atkins, R.; Coresh, J.; Cohen, E.; Collins, A.; Eckardt, K.-U.; Nahas, M.; Jaber, B.; Jadoul, M.; Levin, A. Chronic kidney disease as a global public health problem: Approaches and initiatives—A position statement from Kidney Disease Improving Global Outcomes. Kidney Int. 2007, 72, 247–259. [Google Scholar] [CrossRef] [PubMed] [Green Version]
- Parmar, M.S. Chronic renal disease. BMJ 2002, 325, 85–90. [Google Scholar] [CrossRef] [PubMed]
- Center for Disease Control and Prevention (CDC). Chronic Kidney Disease in the United States. 2021. Available online: https://www.cdc.gov/kidneydisease/publications-resources/CKD-national-facts.html (accessed on 23 July 2022).
- Zoccali, C.; Kramer, A.; Jager, K.J. Chronic kidney disease and end-stage renal disease—A review produced to contribute to the report ‘the status of health in the European union: Towards a healthier Europe’. NDT Plus 2010, 3, 213–224. [Google Scholar] [CrossRef] [PubMed] [Green Version]
- Levey, A.S.; Stevens, L.A.; Schmid, C.H.; Zhang, Y.; Castro, A.F., III; Feldman, H.I.; Kusek, J.W.; Eggers, P.; Van Lente, F.; Greene, T. A new equation to estimate glomerular filtration rate. Ann. Intern. Med. 2009, 150, 604–612. [Google Scholar] [CrossRef] [PubMed]
- Perrone, R.D.; Madias, N.E.; Levey, A.S. Serum creatinine as an index of renal function: New insights into old concepts. Clin. Chem. 1992, 38, 1933–1953. [Google Scholar] [CrossRef]
- Mor, A.; Kalaska, B.; Pawlak, D. Kynurenine pathway in chronic kidney disease: What’s old, what’s new, and what’s next? Int. J. Tryptophan. Res. 2020, 13, 1178646920954882. [Google Scholar] [CrossRef]
- Robinson, C.M.; Hale, P.T.; Carlin, J.M. The role of IFN-γ and TNF-α-responsive regulatory elements in the synergistic induction of indoleamine dioxygenase. J. Interferon. Cytokine Res. 2005, 25, 20–30. [Google Scholar] [CrossRef] [Green Version]
- Hou, W.; Li, S.; Wu, Y.; Du, X.; Yuan, F. Inhibition of indoleamine 2,3-dioxygenase-mediated tryptophan catabolism accelerates crescentic glomerulonephritis. Clin. Exp. Immunol. 2009, 156, 363–372. [Google Scholar] [CrossRef]
- Mohib, K.; Wang, S.; Guan, Q.; Mellor, A.L.; Sun, H.; Du, C.; Jevnikar, A.M. Indoleamine 2,3-dioxygenase expression promotes renal ischemia-reperfusion injury. Am. J. Physiol. Renal. Physiol. 2008, 295, F226–F234. [Google Scholar] [CrossRef] [Green Version]
- Matheus, L.H.G.; Simão, G.M.; Amaral, T.A.; Brito, R.B.O.; Malta, C.S.; Matos, Y.S.T.; Santana, A.C.; Rodrigues, G.G.C.; Albejante, M.C.; Bach, E.E. Indoleamine 2,3-dioxygenase (IDO) increases during renal fibrogenesis and its inhibition potentiates TGF-β 1-induced epithelial to mesenchymal transition. BMC Nephrol. 2017, 18, 287. [Google Scholar] [CrossRef]
- Baban, B.; Liu, J.Y.; Mozaffari, M.S. Endoplasmic reticulum stress response and inflammatory cytokines in type 2 diabetic nephropathy: Role of indoleamine 2,3-dioxygenase and programmed death-1. Exp. Mol. Pathol. 2013, 94, 343–351. [Google Scholar] [CrossRef]
- Schefold, J.C.; Zeden, J.-P.; Fotopoulou, C.; von Haehling, S.; Pschowski, R.; Hasper, D.; Volk, H.-D.; Schuett, C.; Reinke, P. Increased indoleamine 2,3-dioxygenase (IDO) activity and elevated serum levels of tryptophan catabolites in patients with chronic kidney disease: A possible link between chronic inflammation and uraemic symptoms. Nephrol. Dial. Transplant. 2009, 24, 1901–1908. [Google Scholar] [CrossRef] [Green Version]
- Bao, Y.-S.; Ji, Y.; Zhao, S.-L.; Ma, L.-L.; Xie, R.-J.; Na, S.-P. Serum levels and activity of indoleamine2,3-dioxygenase and tryptophanyl-tRNA synthetase and their association with disease severity in patients with chronic kidney disease. Biomarkers 2013, 18, 379–385. [Google Scholar] [CrossRef]
- Kim, H.R.; Jin, H.S.; Eom, Y.B. Metabolite Genome-Wide Association Study for Indoleamine 2,3-Dioxygenase Activity Associated with Chronic Kidney Disease. Genes 2021, 12, 1905. [Google Scholar] [CrossRef]
- Meng, X.M. Inflammatory Mediators and Renal Fibrosis. Adv. Exp. Med. Biol. 2019, 1165, 381–406. [Google Scholar]
- Akiyama, M. Multi-omics study for interpretation of genome-wide association study. J. Hum. Genet. 2021, 66, 3–10. [Google Scholar] [CrossRef]
- Zhu, Z.; Zhang, F.; Hu, H.; Bakshi, A.; Robinson, M.R.; Powell, J.E.; Montgomery, G.W.; Goddard, M.E.; Wray, N.R.; Visscher, P.M. Integration of summary data from GWAS and eQTL studies predicts complex trait gene targets. Nat. Genet. 2016, 48, 481–487. [Google Scholar] [CrossRef]
- Cañadas-Garre, M.; Anderson, K.; Cappa, R.; Skelly, R.; Smyth, L.J.; McKnight, A.J.; Maxwell, A.P. Genetic susceptibility to chronic kidney disease–some more pieces for the heritability puzzle. Front. Genet. 2019, 10, 453. [Google Scholar] [CrossRef]
- Kim, Y.; Han, B.G.; KoGES Group. Cohort Profile: The Korean Genome and Epidemiology Study (KoGES) Consortium. Int. J. Epidemiol. 2017, 46, 1350. [Google Scholar] [CrossRef]
- Levey, A.S.; Coresh, J.; Greene, T.; Marsh, J.; Stevens, L.A.; Kusek, J.W.; Van Lente, F.; Collaboration, C.K.D.E. Expressing the Modification of Diet in Renal Disease Study equation for estimating glomerular filtration rate with standardized serum creatinine values. Clin. Chem. 2007, 53, 766–772. [Google Scholar] [CrossRef] [Green Version]
- Levey, A.S.; Eckardt, K.-U.; Tsukamoto, Y.; Levin, A.; Coresh, J.; Rossert, J.; Zeeuw, D.D.; Hostetter, T.H.; Lameire, N.; Eknoyan, G. Definition and classification of chronic kidney disease: A position statement from Kidney Disease: Improving Global Outcomes (KDIGO). Kidney Int. 2005, 67, 2089–2100. [Google Scholar] [CrossRef] [Green Version]
- Lee, H.-S.; Xu, T.; Lee, Y.; Kim, N.-H.; Kim, Y.-J.; Kim, J.-M.; Cho, S.Y.; Kim, K.-Y.; Nam, M.; Adamski, J. Identification of putative biomarkers for type 2 diabetes using metabolomics in the Korea Association REsource (KARE) cohort. Metabolomics 2016, 12, 178. [Google Scholar] [CrossRef]
- Cho, Y.S.; Go, M.J.; Kim, Y.J.; Heo, J.Y.; Oh, J.H.; Ban, H.-J.; Yoon, D.; Lee, M.H.; Kim, D.-J.; Park, M. A large-scale genome-wide association study of Asian populations uncovers genetic factors influencing eight quantitative traits. Nat. Genet. 2009, 41, 527–534. [Google Scholar] [CrossRef] [PubMed]
- Howie, B.N.; Donnelly, P.; Marchini, J. A flexible and accurate genotype imputation method for the next generation of genome-wide association studies. PLoS Genet. 2009, 5, e1000529. [Google Scholar] [CrossRef] [PubMed] [Green Version]
- Purcell, S.; Neale, B.; Todd-Brown, K.; Thomas, L.; Ferreira, M.A.; Bender, D.; Maller, J.; Sklar, P.; de Bakker, P.I.; Daly, M.J.; et al. PLINK: A tool set for whole-genome association and population-based linkage analyses. Am. J. Hum. Genet. 2007, 81, 559–575. [Google Scholar] [CrossRef] [Green Version]
- Lonsdale, J.; Thomas, J.; Salvatore, M.; Phillips, R.; Lo, E.; Shad, S.; Hasz, R.; Walters, G.; Garcia, F.; Young, N.; et al. The Genotype-Tissue Expression (GTEx) project. Nat. Genet. 2013, 45, 580–585. [Google Scholar] [CrossRef]
- Lee, H.; Jang, H.B.; Yoo, M.-G.; Park, S.I.; Lee, H.-J. Amino acid metabolites associated with chronic kidney disease: An eight-year follow-up Korean epidemiology study. Biomedicines 2020, 8, 222. [Google Scholar] [CrossRef]
- Gusev, A.; Ko, A.; Shi, H.; Bhatia, G.; Chung, W.; Penninx, B.W.; Jansen, R.; De Geus, E.J.; Boomsma, D.I.; Wright, F.A. Integrative approaches for large-scale transcriptome-wide association studies. Nat. Genet. 2016, 48, 245–252. [Google Scholar] [CrossRef] [Green Version]
- Oeckinghaus, A.; Postler, T.S.; Rao, P.; Schmitt, H.; Schmitt, V.; Grinberg-Bleyer, Y.; Kühn, L.I.; Gruber, C.W.; Lienhard, G.E.; Ghosh, S. κB-Ras proteins regulate both NF-κB-dependent inflammation and Ral-dependent proliferation. Cell Rep. 2014, 8, 1793–1807. [Google Scholar] [CrossRef] [Green Version]
- Esteban, V.; Lorenzo, O.; Rupérez, M.; Suzuki, Y.; Mezzano, S.; Blanco, J.; Kretzler, M.; Sugaya, T.; Egido, J.; Ruiz-Ortega, M. Angiotensin II, via AT1 and AT2 receptors and NF-κB pathway, regulates the inflammatory response in unilateral ureteral obstruction. J. Am. Soc. Nephrol. 2004, 15, 1514–1529. [Google Scholar] [CrossRef] [Green Version]
- Zhang, H.; Sun, S.-C. NF-κB in inflammation and renal diseases. Cell Biosci. 2015, 5, 63. [Google Scholar] [CrossRef] [Green Version]
- Gerashchenko, G.; Bogatyrova, O.; Rudenko, E.; Kondratov, A.; Gordiyuk, V.; Zgonnyk, Y.; Vozianov, O.; Pavlova, T.; Zabarovsky, E.; Rynditch, A. Genetic and epigenetic changes of NKIRAS1 gene in human renal cell carcinomas. Exp. Oncol. 2010, 32, 71–75. [Google Scholar]
- Wang, R.N.; Green, J.; Wang, Z.; Deng, Y.; Qiao, M.; Peabody, M.; Zhang, Q.; Ye, J.; Yan, Z.; Denduluri, S. Bone Morphogenetic Protein (BMP) signaling in development and human diseases. Genes Dis. 2014, 1, 87–105. [Google Scholar] [CrossRef] [Green Version]
- Meng, X.M.; Nikolic-Paterson, D.J.; Lan, H.Y. TGF-beta: The master regulator of fibrosis. Nat. Rev. Nephrol. 2016, 12, 325–338. [Google Scholar] [CrossRef]
- Yoshioka, K.; Takemura, T.; Murakami, K.; Okada, M.; Hino, S.; Miyamoto, H.; Maki, S. Transforming growth factor-beta protein and mRNA in glomeruli in normal and diseased human kidneys. Lab. Investig. 1993, 68, 154–163. [Google Scholar]
- Yamamoto, T.; Nakamura, T.; Noble, N.A.; Ruoslahti, E.; Border, W.A. Expression of transforming growth factor beta is elevated in human and experimental diabetic nephropathy. Proc. Natl. Acad. Sci. USA 1993, 90, 1814–1818. [Google Scholar] [CrossRef] [Green Version]
- Chen, W. IDO: More than an enzyme. Nat. Immunol. 2011, 12, 809–811. [Google Scholar] [CrossRef]
- Dendooven, A.; van Oostrom, O.; van der Giezen, D.M.; Leeuwis, J.W.; Snijckers, C.; Joles, J.A.; Robertson, E.J.; Verhaar, M.C.; Nguyen, T.Q.; Goldschmeding, R. Loss of endogenous bone morphogenetic protein-6 aggravates renal fibrosis. Am. J. Pathol. 2011, 178, 1069–1079. [Google Scholar] [CrossRef]
- Jenkins, R.H.; Fraser, D.J. BMP-6 emerges as a potential major regulator of fibrosis in the kidney. Am. J. Pathol. 2011, 178, 964–965. [Google Scholar] [CrossRef]
- Long, J.; Badal, S.S.; Wang, Y.; Chang, B.H.; Rodriguez, A.; Danesh, F.R. MicroRNA-22 is a master regulator of bone morphogenetic protein-7/6 homeostasis in the kidney. J. Biol. Chem. 2013, 288, 36202–36214. [Google Scholar] [CrossRef] [Green Version]
- Derynck, R.; Zhang, Y.E. Smad-dependent and Smad-independent pathways in TGF-β family signalling. Nature 2003, 425, 577–584. [Google Scholar] [CrossRef] [PubMed]
- Yan, J.-D.; Yang, S.; Zhang, J.; Zhu, T.-H. BMP6 reverses TGF-β1-induced changes in HK-2 cells: Implications for the treatment of renal fibrosis. Acta Pharmacol. Sin. 2009, 30, 994–1000. [Google Scholar] [CrossRef] [PubMed] [Green Version]
- Paterni, I.; Granchi, C.; Katzenellenbogen, J.A.; Minutolo, F. Estrogen receptors alpha (ERα) and beta (ERβ): Subtype-selective ligands and clinical potential. Steroids 2014, 90, 13–29. [Google Scholar] [CrossRef] [PubMed] [Green Version]
- Ma, H.-Y.; Chen, S.; Du, Y. Estrogen and estrogen receptors in kidney diseases. Ren. Fail. 2021, 43, 619–642. [Google Scholar] [CrossRef]
- Carrero, J.J.; Hecking, M.; Chesnaye, N.C.; Jager, K.J. Sex and gender disparities in the epidemiology and outcomes of chronic kidney disease. Nat. Rev. Nephrol. 2018, 14, 151–164. [Google Scholar] [CrossRef]
- Li, T.; Li, W.; Lu, J.; Liu, H.; Li, Y.; Zhao, Y. SH2D4A regulates cell proliferation via the ERα/PLC-γ/PKC pathway. BMB Rep. 2009, 42, 516–522. [Google Scholar] [CrossRef]
Figure 1.
Regional association plots of IDO activity and CKD at 3p24.2 (A), 6p24.3 (B) and 8p21.3 (C) loci. Statistical significances of SNPs near NKIRAS1, BMP6, and SH2D4A for IDO activity and CKD are plotted as −log10 p-values. The purple diamond (◆) represents the SNP strongly involved in both CKD and IDO activity. Levels of linkage disequilibrium (r2) of top SNPs and surrounding SNPs are shown in different colors. These regional plots for SNPs were generated via LocusZoom(http://locuszoom.org/ (accessed on 10 March 2023)). IDO, indoleamine 2,3-dioxygenase; CKD, chronic kidney disease.
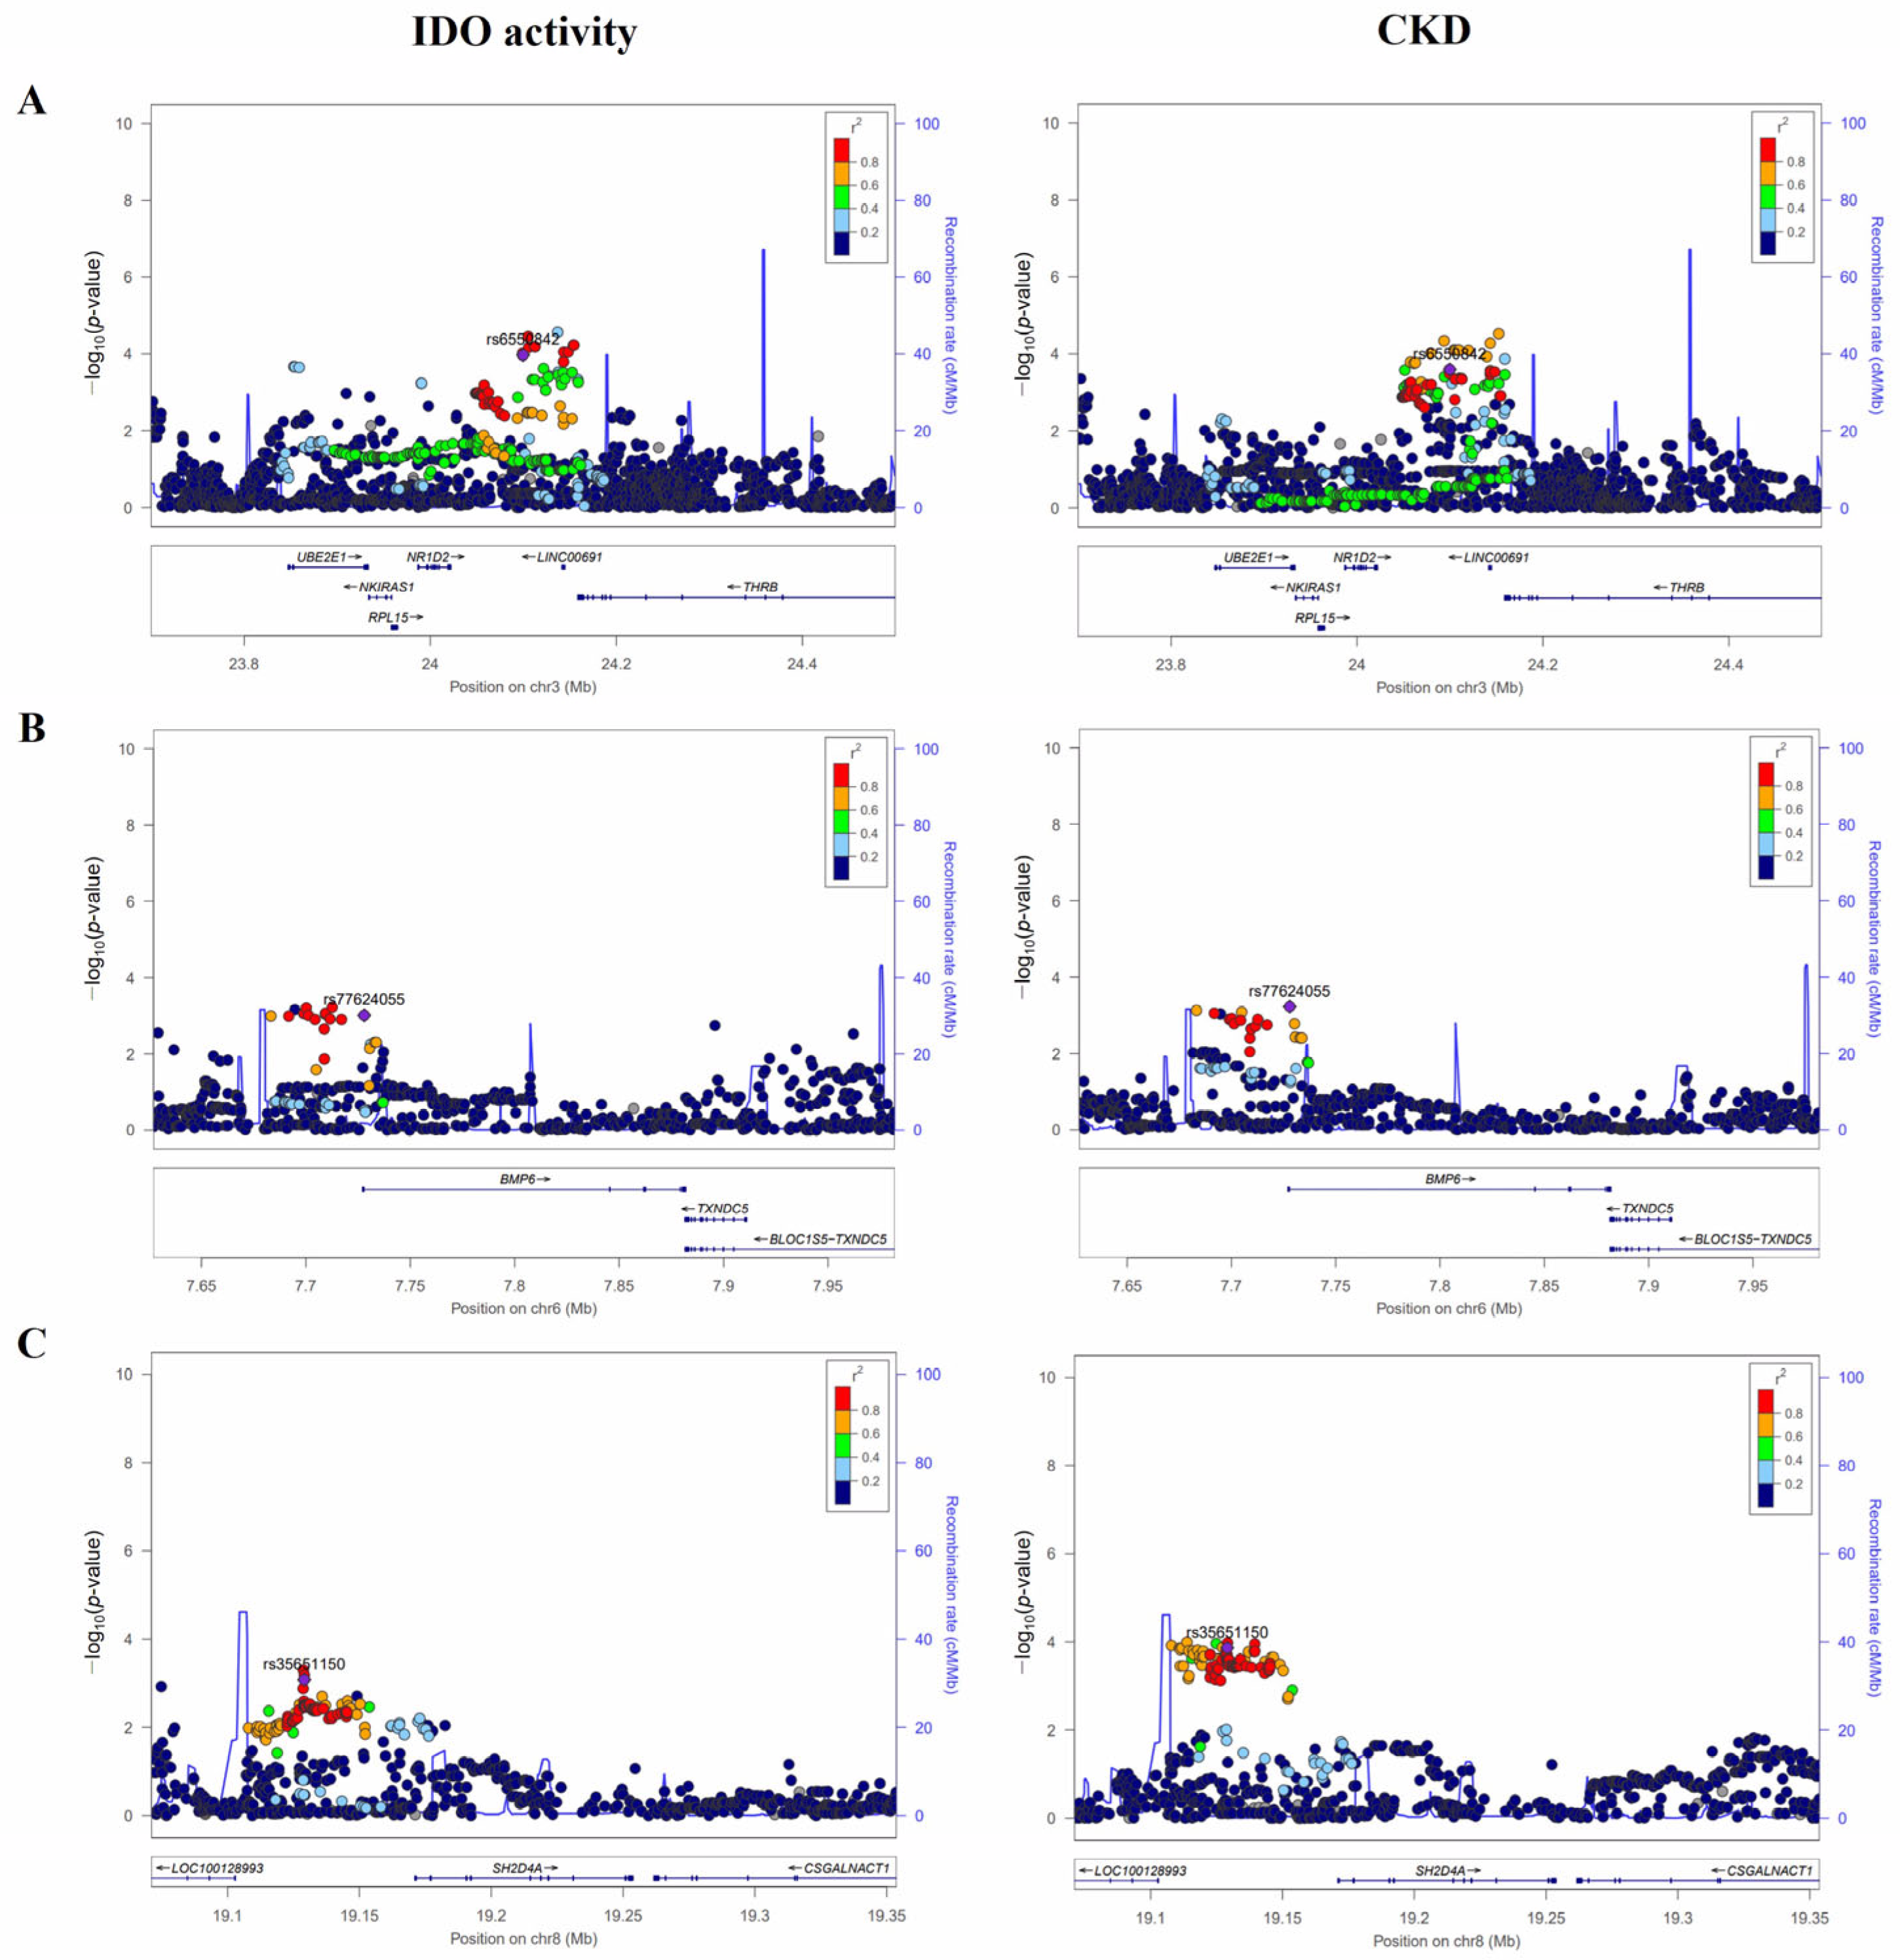
Figure 2.
Identification of NKIRAS1 and SH2D4A expression and rs6550842 (A) and rs35651150 (B,C) in eQTL, respectively. Violin plots show NKIRAS1 expression in cultured fibroblasts for the rs6550842 genotype ((A), effect size = −0.12, p = 7.3 × 10⁻⁵). The SH2D4A expression for the rs35651150 genotype in the cerebellum ((B), effect size = 0.37, p = 1.3 × 10⁻⁵) and thyroid ((C), effect size = 0.19, p = 7.7 × 10⁻⁹) was confirmed and statistically significant. Mean expression levels are indicated by the white line and 25% and 75% quantiles are shown by the black box. Data were obtained via GTEx browser (https://gtexportal.org/ (accessed on 10 March 2023)).

Table 1.
Characteristics of participants in this study.
| Characteristics | Quantitative Trait Analysis | Case-Control Analysis for CKD | ||
|---|---|---|---|---|
| Controls | Cases | p-Value 1 | ||
| Number of participants | 2579 | 1550 | 264 | |
| Gender [men/women] | 1218/1361 | 789/761 | 81/183 | <0.001 |
| Age (M years ± SD) | 57.10 ± 9.05 | 54.98 ± 8.64 | 65.72 ± 6.53 | <0.001 |
| Height (M cm ± SD) | 159.55 ± 9.16 | 160.55 ± 8.98 | 155.42 ± 8.28 | <0.001 |
| Weight (M kg ± SD) | 62.63 ± 10.36 | 62.30 ± 10.41 | 60.88 ± 9.53 | 0.042 |
| BMI (M kg/m2 ± SD) | 24.56 ± 3.23 | 24.11 ± 3.09 | 25.20 ± 3.47 | <0.001 |
| eGFR (mL/min/1.73 m2) | 75.58 ± 11.92 | 78.68 ± 9.69 | 55.24 ± 9.21 | <0.001 |
| Creatinine (mg/dL) | 0.98 ± 0.20 | 0.96 ± 0.14 | 1.18 ± 0.42 | <0.001 |
| BUN (mg/dL) | 15.69 ± 4.26 | 15.33 ± 3.92 | 17.91 ± 5.45 | <0.001 |
1 Significant differences in characteristics between cases and controls were determined with Student’s t-test. BMI, body mass index; eGFR, estimated glomerular filtration rate; BUN, blood urea nitrogen; CKD, chronic kidney disease; M, mean value; SD, standard deviation.
Table 2.
Loci associated with both indoleamine 2,3-dioxygenase activity and chronic kidney disease in Koreans.
Table 2.
Loci associated with both indoleamine 2,3-dioxygenase activity and chronic kidney disease in Koreans.
| SNP | Nearest Gene | Chromosome Position | Minor Allele | MAF | Function | IDO Activity | CKD | eGFR | |||
|---|---|---|---|---|---|---|---|---|---|---|---|
| β ± S.E | p-Value | OR (95% CI) | p-Value | β ± S.E | p-Value | ||||||
| rs189138212 | ITPKB | 1:226951229 | C | 0.017 | - | 0.44 ± 0.11 | 7.19 × 10⁻⁵ | 3.55 (1.71–7.37) | 6.78 × 10⁻⁴ | −3.34 ± 1.13 | 3.28 × 10⁻³ |
| rs6550842 | NKIRAS1-NR1D2-THRB | 3:24099794 | T | 0.107 | - | 0.18 ± 0.05 | 1.07 × 10⁻⁴ | 1.89 (1.34–2.65) | 2.52 × 10⁻⁴ | −1.77 ± 0.47 | 1.76 × 10⁻⁴ |
| rs145478425 | FHIT | 3:59803424 | T | 0.015 | Intron | 0.41 ± 0.12 | 4.04 × 10⁻⁴ | 3.63 (1.78–7.40) | 3.95 × 10⁻⁴ | −1.26 ± 1.20 | 0.293 |
| rs7679032 | LINC00616 | 4:138949061 | T | 0.031 | Intron | 0.32 ± 0.08 | 1.26 × 10⁻⁴ | 2.65 (1.53–4.60) | 5.24 × 10⁻⁴ | −1.32 ± 0.85 | 0.120 |
| rs77624055 | BMP6 | 6:7727931 | A | 0.167 | Intron | 0.13 ± 0.04 | 9.70 × 10⁻⁴ | 1.67 (1.25–2.23) | 5.89 × 10⁻⁴ | −0.93 ± 0.39 | 0.017 |
| rs35651150 | SH2D4A | 8:19129080 | A | 0.256 | - | −0.11 ± 0.03 | 8.30 × 10⁻⁴ | 0.58 (0.44–0.77) | 1.37 × 10⁻⁴ | 1.16 ± 0.33 | 4.48 × 10⁻⁴ |
| rs149583220 | ADAM7 | 8:24307595 | C | 0.011 | Intron | 0.48 ± 0.13 | 2.99 × 10⁻⁴ | 4.64 (2.06–10.44) | 2.16 × 10⁻⁴ | −4.26 ± 1.36 | 1.75 × 10⁻³ |
| rs145951089 | LOC101927318 | 12:50355316 | T | 0.026 | Intron | 0.34 ± 0.09 | 1.40 × 10⁻⁴ | 3.13 (1.71–5.73) | 2.15 × 10⁻⁴ | −2.43 ± 0.91 | 7.80 × 10⁻³ |
| rs9533960 | LINC00330 | 13:45333274 | C | 0.320 | - | 0.11 ± 0.03 | 5.04 × 10⁻⁴ | 1.51 (1.19–1.92) | 7.31 × 10⁻⁴ | −0.63 ± 0.31 | 0.041 |
| rs72898186 | MIR924HG | 18:37071519 | C | 0.163 | Intron | 0.13 ± 0.04 | 9.80 × 10⁻⁴ | 1.72 (1.29–2.29) | 2.49 × 10⁻⁴ | −0.75 ± 0.39 | 0.056 |
SNP, single nucleotide polymorphism; MAF, minor allele frequency; IDO, indoleamine 2,3-dioxygenase; CKD, chronic kidney disease; eGFR, estimated glomerular filtration rate; β, regression coefficient; S.E, standard error; OR, odds ratio; CI, confidence interval. All analyses were adjusted for age, sex, area, BMI, alcohol intake, smoking, SBP, hs-CRP and HbA1c. SNPs that achieved p < 0.001 in both IDO activity and CKD were selected. Locations of SNPs were based on the National Center for Biotechnology Information (NCBI) Human Genome Build 37 (hg19). Genes stated in the manuscript are indicated in bold.
Table 3.
Association results of SNPs near BMP6 gene with IDO activity, CKD, and eGFR.
| SNP | Chromosome Position | Minor Allele | MAF | Function | IDO Activity | CKD | eGFR | |||
|---|---|---|---|---|---|---|---|---|---|---|
| β ± S.E | p-Value | OR (95% CI) | p-Value | β ± S.E | p-Value | |||||
| rs77624055 | 7727931 | A | 0.167 | Intron | 0.125 ± 0.038 | 9.70 × 10⁻⁴ | 1.67 (1.25–2.23) | 5.89 × 10⁻⁴ | −0.93 ± 0.39 | 0.017 |
| rs7753111 | 7730944 | G | 0.299 | Intron | 0.085 ± 0.031 | 5.56 × 10⁻³ | 1.31 (1.04–1.66) | 0.024 | −0.74 ± 0.31 | 0.019 |
| rs2224564 | 7737187 | C | 0.297 | Intron | 0.082 ± 0.031 | 8.99 × 10⁻³ | 0.93 (0.73–1.19) | 0.564 | −0.57 ± 0.32 | 0.079 |
| rs111588693 | 7727271 | A | 0.179 | Non-synonymous (R28Q) | −0.085 ± 0.038 | 0.023 | 0.89 (0.65–1.23) | 0.484 | 0.06 ± 0.38 | 0.875 |
| rs76295967 | 7733744 | A | 0.009 | Intron | −0.305 ± 0.151 | 0.043 | 0.71 (0.14–3.52) | 0.676 | 0.34 ± 1.54 | 0.826 |
| rs7766858 | 7694908 | G | 0.478 | - | 0.043 ± 0.029 | 0.132 | 1.32 (1.05–1.65) | 0.015 | −0.60 ± 0.29 | 0.041 |
| rs270407 | 7738392 | C | 0.478 | Intron | −0.043 ± 0.028 | 0.132 | 1.21 (0.97–1.52) | 0.090 | 0.13 ± 0.29 | 0.657 |
| rs962279 | 7708132 | G | 0.324 | - | −0.043 ± 0.030 | 0.150 | 0.95 (0.74–1.22) | 0.690 | −0.05 ± 0.31 | 0.859 |
| rs1923409 | 7728212 | A | 0.370 | Intron | 0.031 ± 0.029 | 0.297 | 1.25 (0.99–1.58) | 0.057 | −0.59 ± 0.30 | 0.048 |
| rs270417 | 7729614 | C | 0.025 | Intron | −0.095 ± 0.091 | 0.297 | 1.68 (0.84–3.36) | 0.145 | −0.63 ± 0.93 | 0.498 |
| rs9505263 | 7698011 | T | 0.017 | - | −0.106 ± 0.109 | 0.329 | 0.65 (0.26–1.65) | 0.364 | 0.64 ± 1.11 | 0.565 |
| rs79982308 | 7691593 | A | 0.016 | - | 0.068 ± 0.110 | 0.535 | 1.29 (0.60–2.75) | 0.513 | −0.16 ± 1.12 | 0.886 |
| rs75686372 | 7737224 | T | 0.016 | Intron | 0.060 ± 0.115 | 0.603 | 1.84 (0.88–3.85) | 0.105 | −1.05 ± 1.18 | 0.371 |
| rs118168182 | 7735363 | T | 0.028 | Intron | 0.027 ± 0.088 | 0.759 | 0.95 (0.49–1.86) | 0.888 | 1.52 ± 0.89 | 0.090 |
| rs79560447 | 7690928 | T | 0.142 | - | −0.005 ± 0.042 | 0.902 | 0.77 (0.56–1.07) | 0.115 | 0.27 ± 0.42 | 0.526 |
| rs2876117 | 7738931 | T | 0.138 | Intron | 0.000 ± 0.040 | 0.994 | 0.91 (0.67–1.25) | 0.573 | 0.27 ± 0.41 | 0.507 |
SNP, single nucleotide polymorphism; MAF, minor allele frequency; IDO, indoleamine 2,3-dioxygenase; CKD, chronic kidney disease; eGFR, estimated glomerular filtration rate; β, regression coefficient; S.E, standard error; OR, odds ratio; CI, confidence interval. All analyses were adjusted for age, sex, geographic area, BMI, alcohol intake, smoking, SBP, hs-CRP, and HbA1c. The locations of SNPs were based on the National Center for Biotechnology Information (NCBI) Human Genome Build 37 (hg19). Genes stated in the manuscript are indicated in bold.
Disclaimer/Publisher’s Note: The statements, opinions and data contained in all publications are solely those of the individual author(s) and contributor(s) and not of MDPI and/or the editor(s). MDPI and/or the editor(s) disclaim responsibility for any injury to people or property resulting from any ideas, methods, instructions or products referred to in the content. |
© 2023 by the authors. Licensee MDPI, Basel, Switzerland. This article is an open access article distributed under the terms and conditions of the Creative Commons Attribution (CC BY) license (https://creativecommons.org/licenses/by/4.0/).
Share and Cite
MDPI and ACS Style
Kim, H.-R.; Jin, H.-S.; Eom, Y.-B. Identification of Genetic Markers Linked to The Activity of Indoleamine 2,3-Dioxygenase and Kidney Function. Metabolites 2023, 13, 541. https://doi.org/10.3390/metabo13040541
AMA Style
Kim H-R, Jin H-S, Eom Y-B. Identification of Genetic Markers Linked to The Activity of Indoleamine 2,3-Dioxygenase and Kidney Function. Metabolites. 2023; 13(4):541. https://doi.org/10.3390/metabo13040541
Chicago/Turabian StyleKim, Hye-Rim, Hyun-Seok Jin, and Yong-Bin Eom. 2023. "Identification of Genetic Markers Linked to The Activity of Indoleamine 2,3-Dioxygenase and Kidney Function" Metabolites 13, no. 4: 541. https://doi.org/10.3390/metabo13040541
Note that from the first issue of 2016, this journal uses article numbers instead of page numbers. See further details here.