Mechanism of Chronic Kidney Disease Progression and Novel Biomarkers: A Metabolomic Analysis of Experimental Glomerulonephritis

 , , , and
Abstract
:1. Introduction
2. Material and Methods
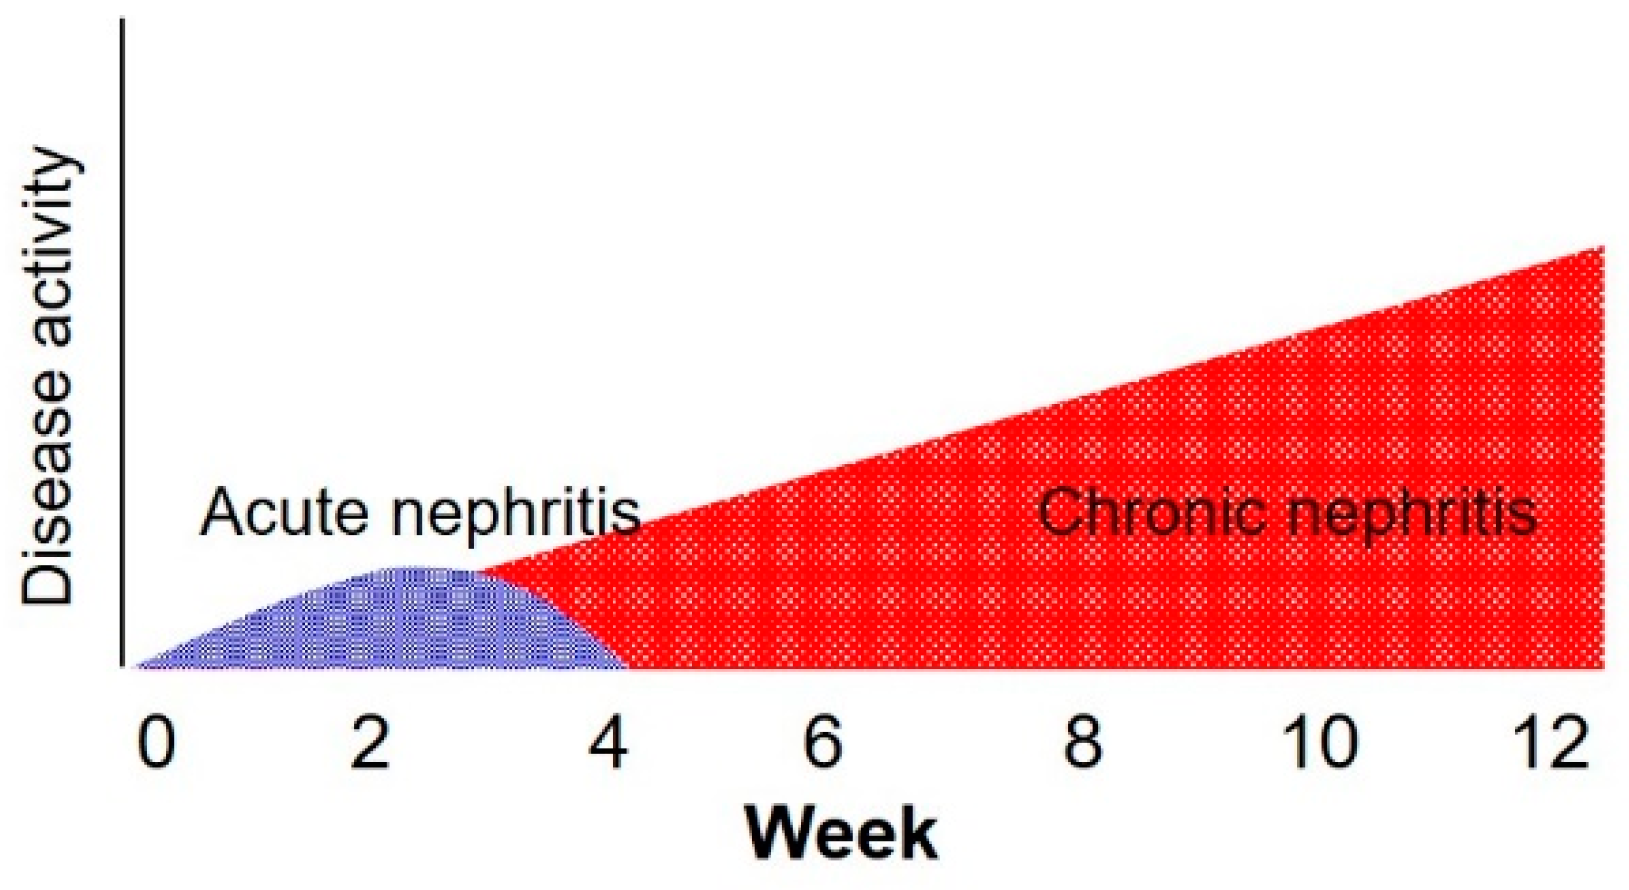
2.1. Definition
2.2. Animals
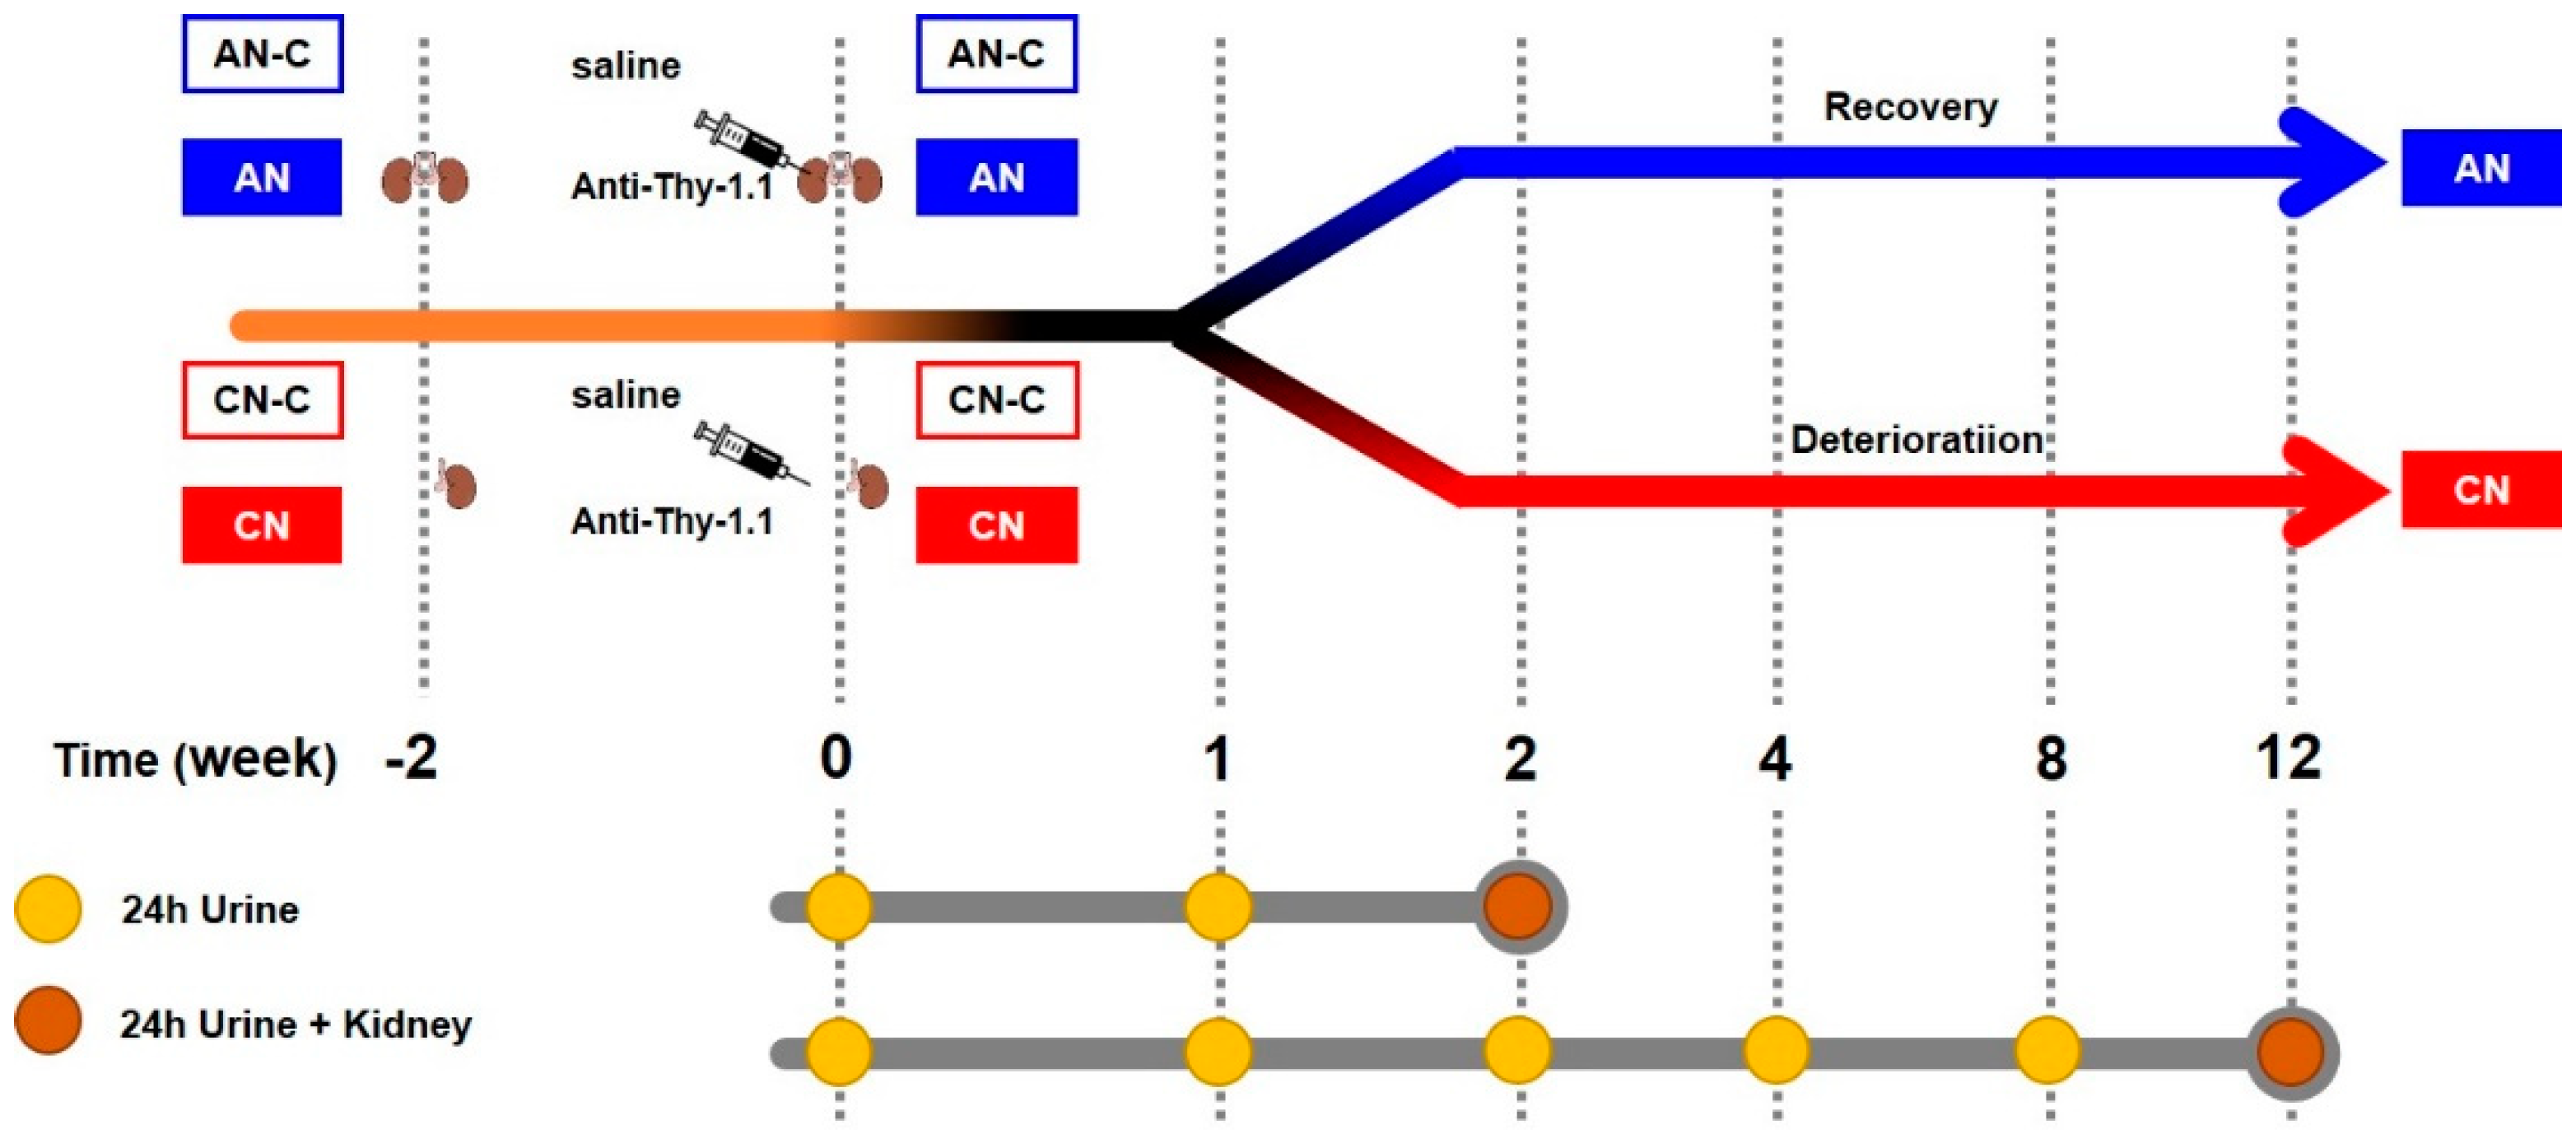
2.3. Experimental Design
2.4. Measurement of Proteinuria
2.5. Evaluation of Renal Histology
2.6. Metabolomic Analysis
2.7. mRNA Analysis
2.8. Statistical Analysis
3. Results
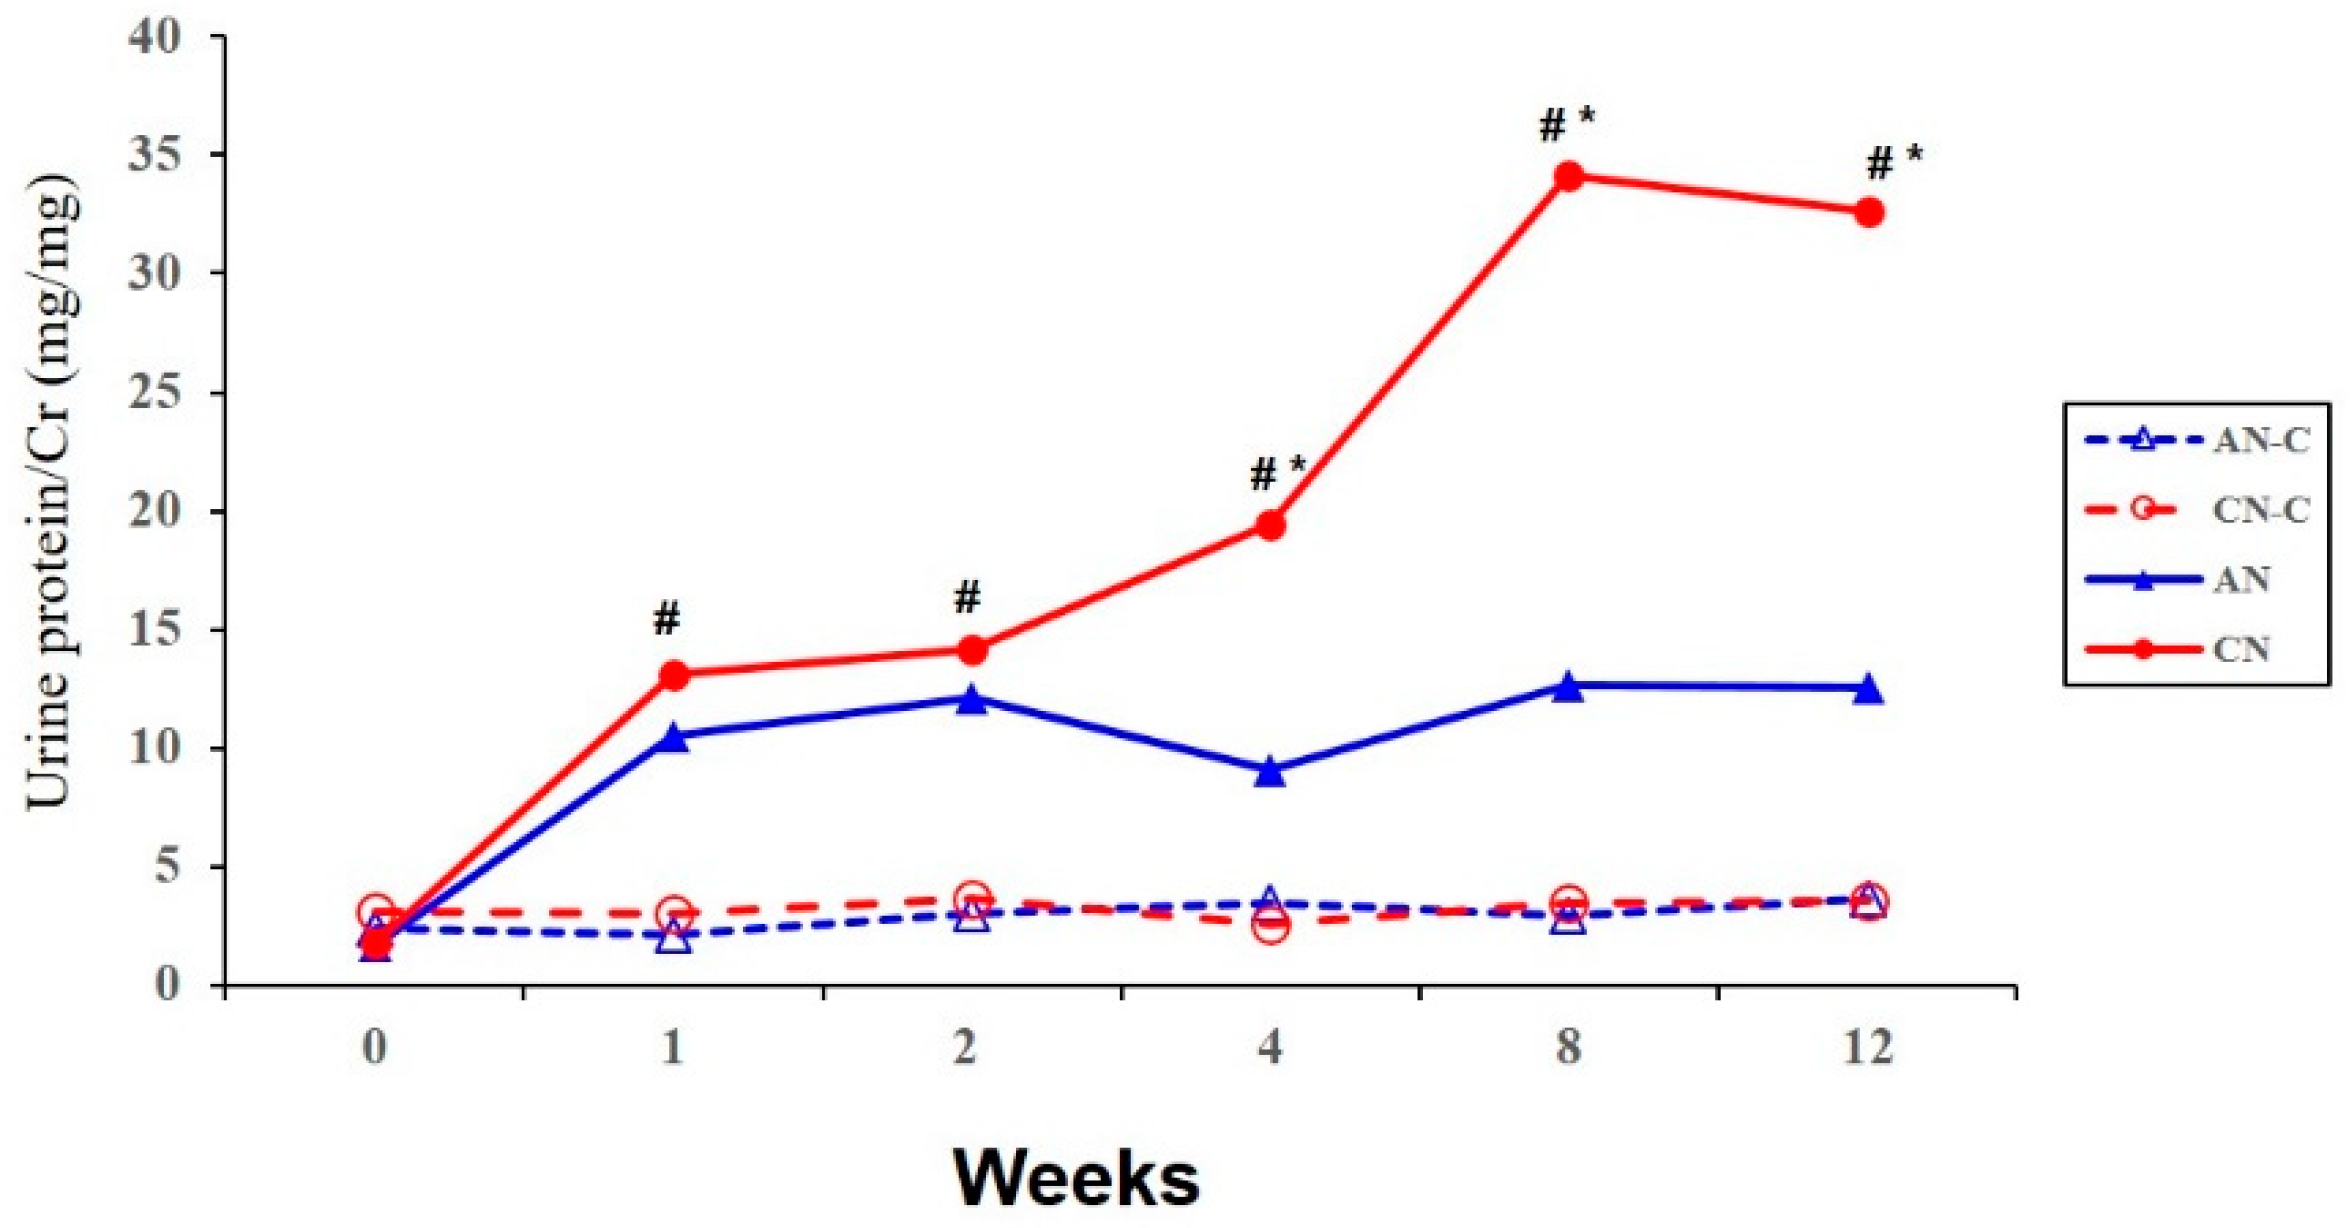
3.1. Proteinuria
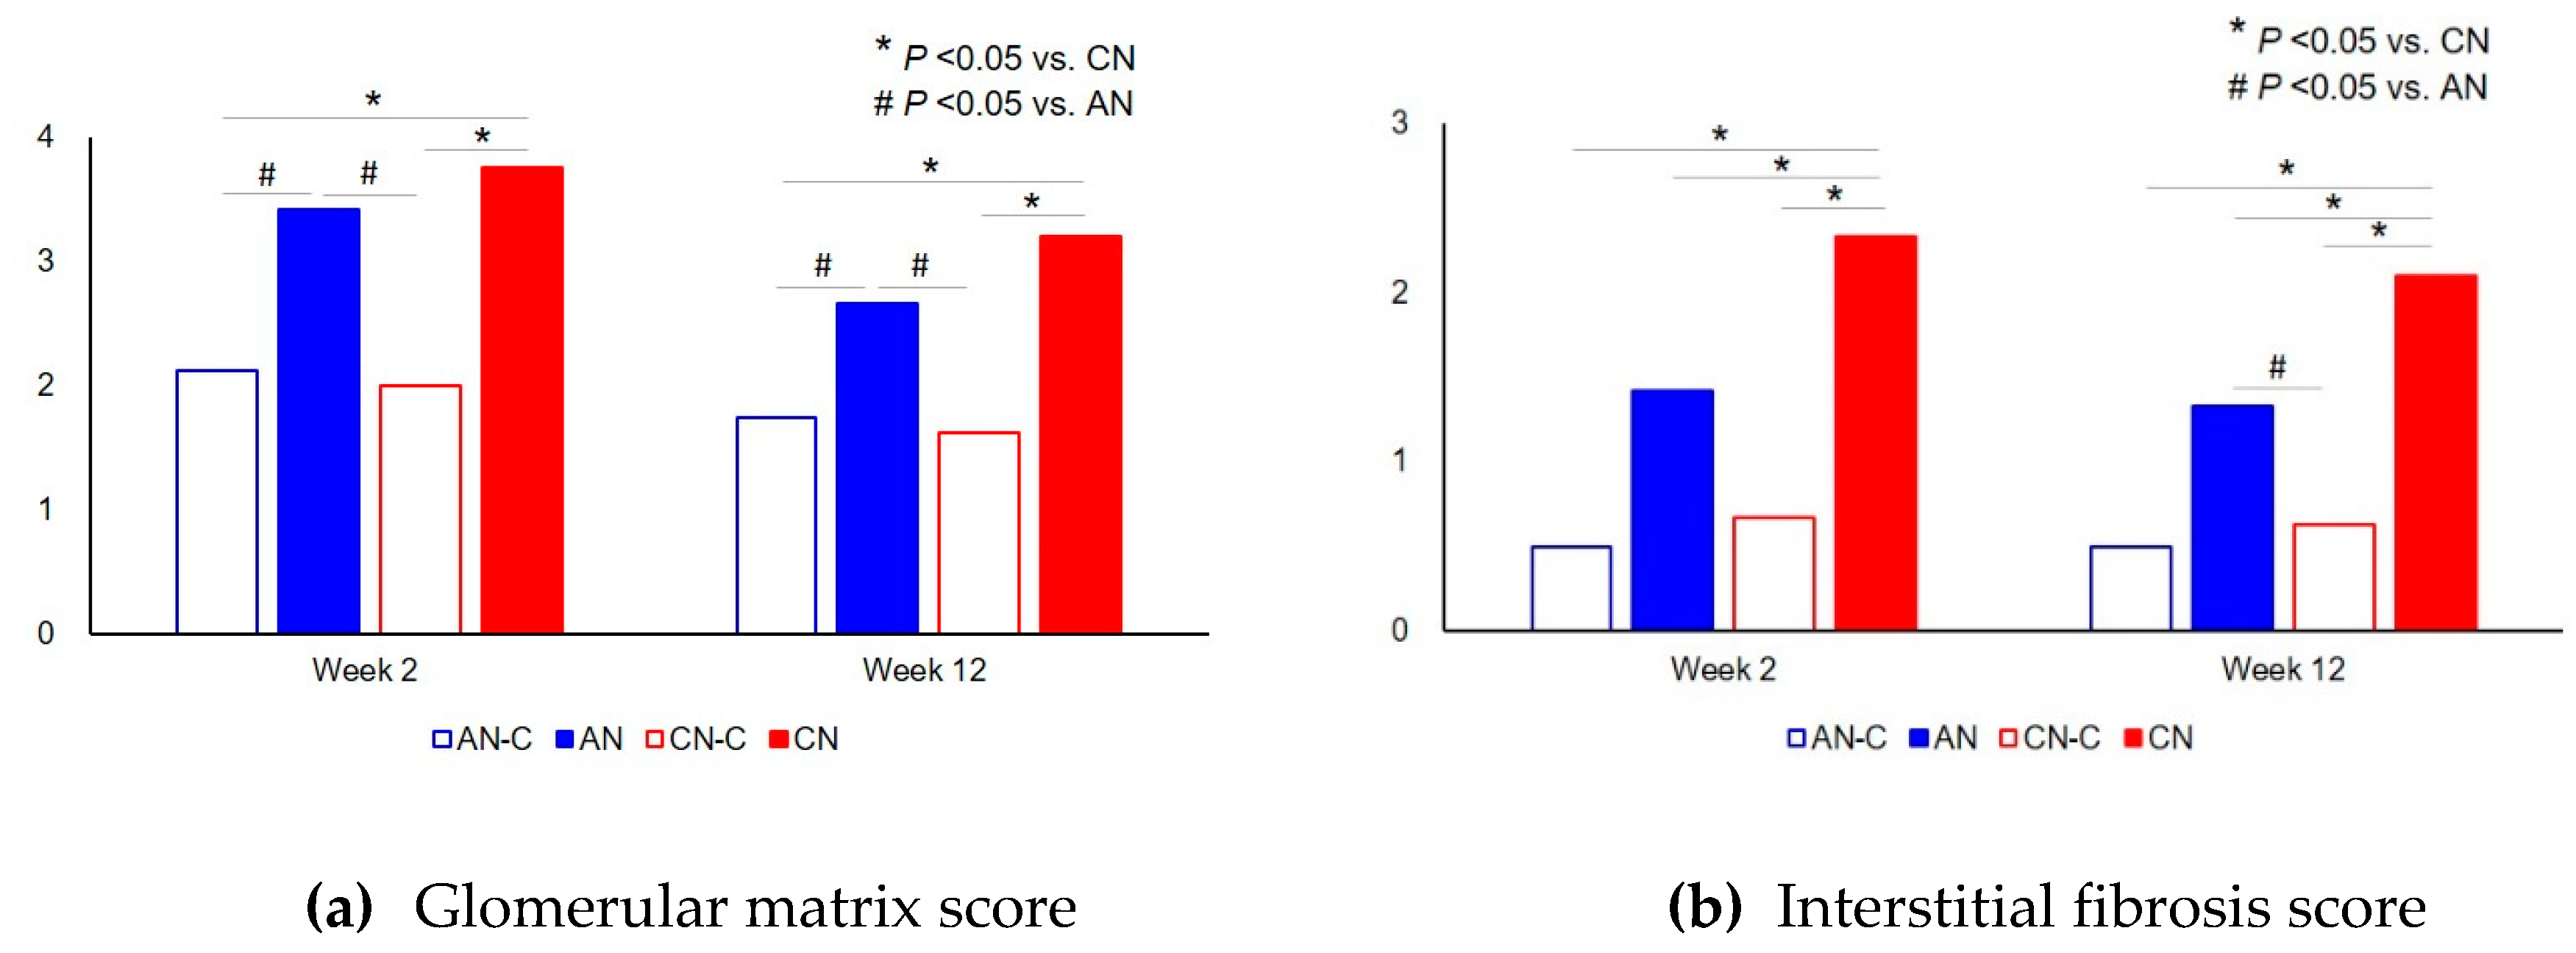
3.2. Renal Histology
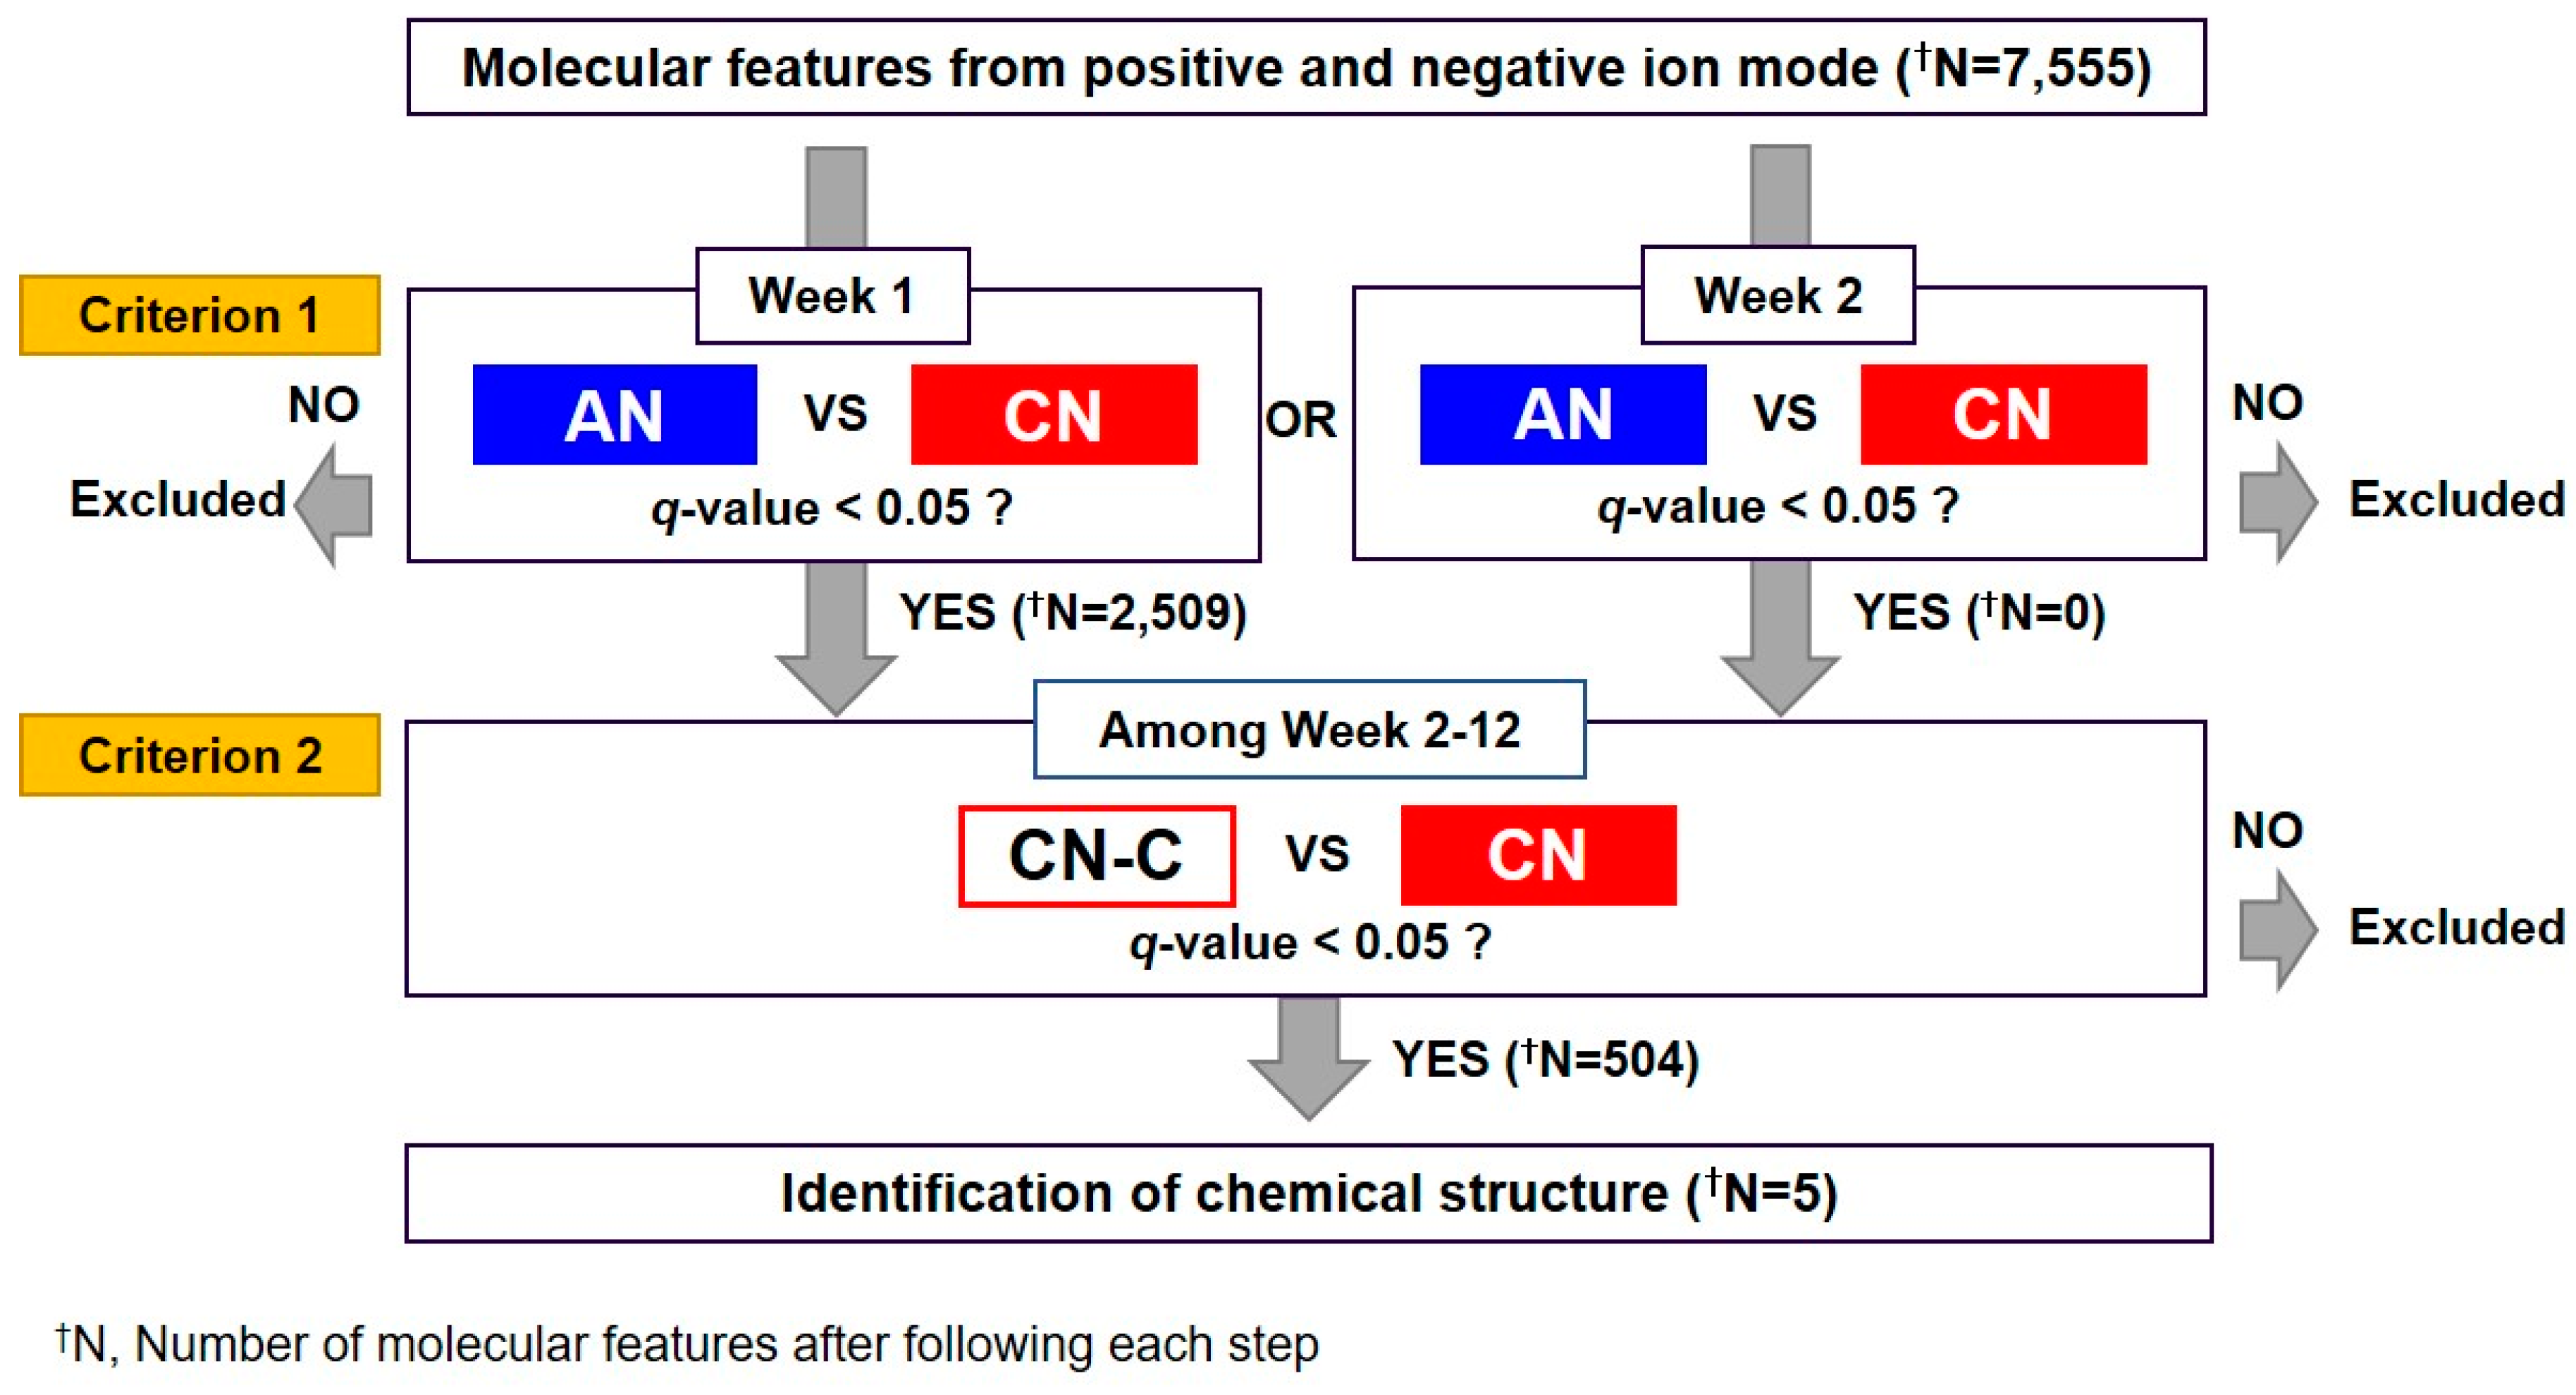
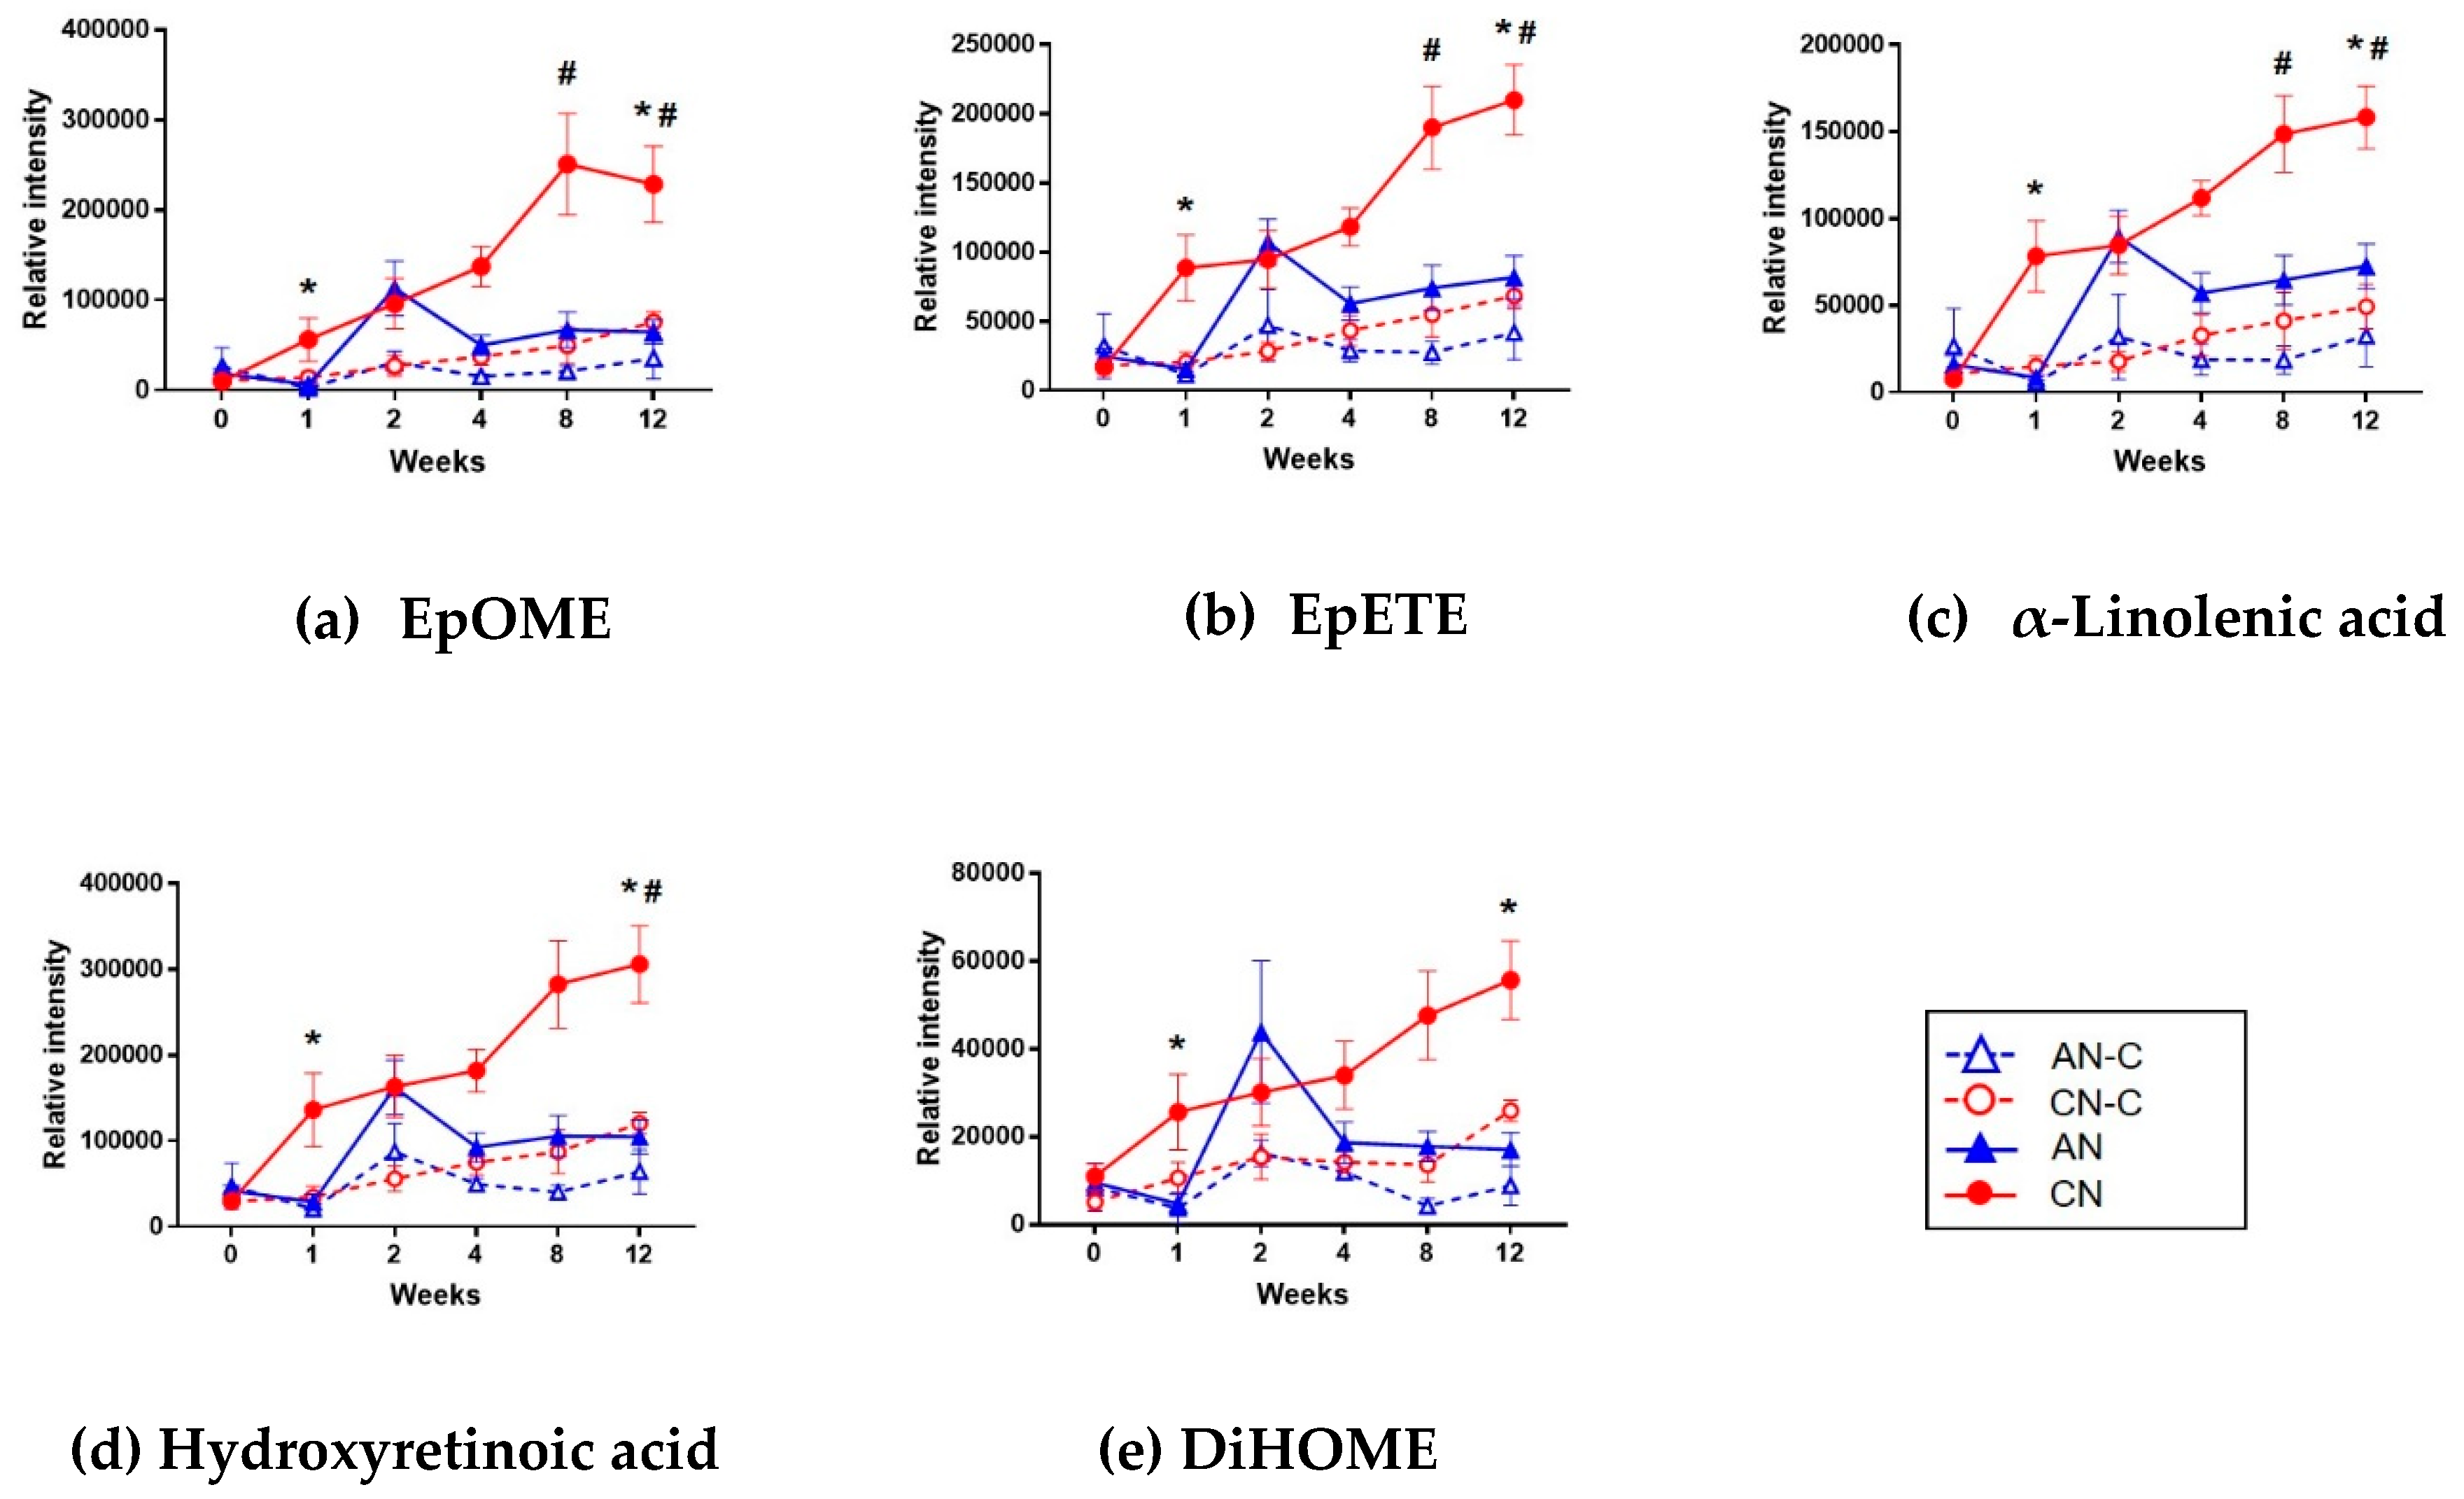
3.3. Metabolomics Analysis
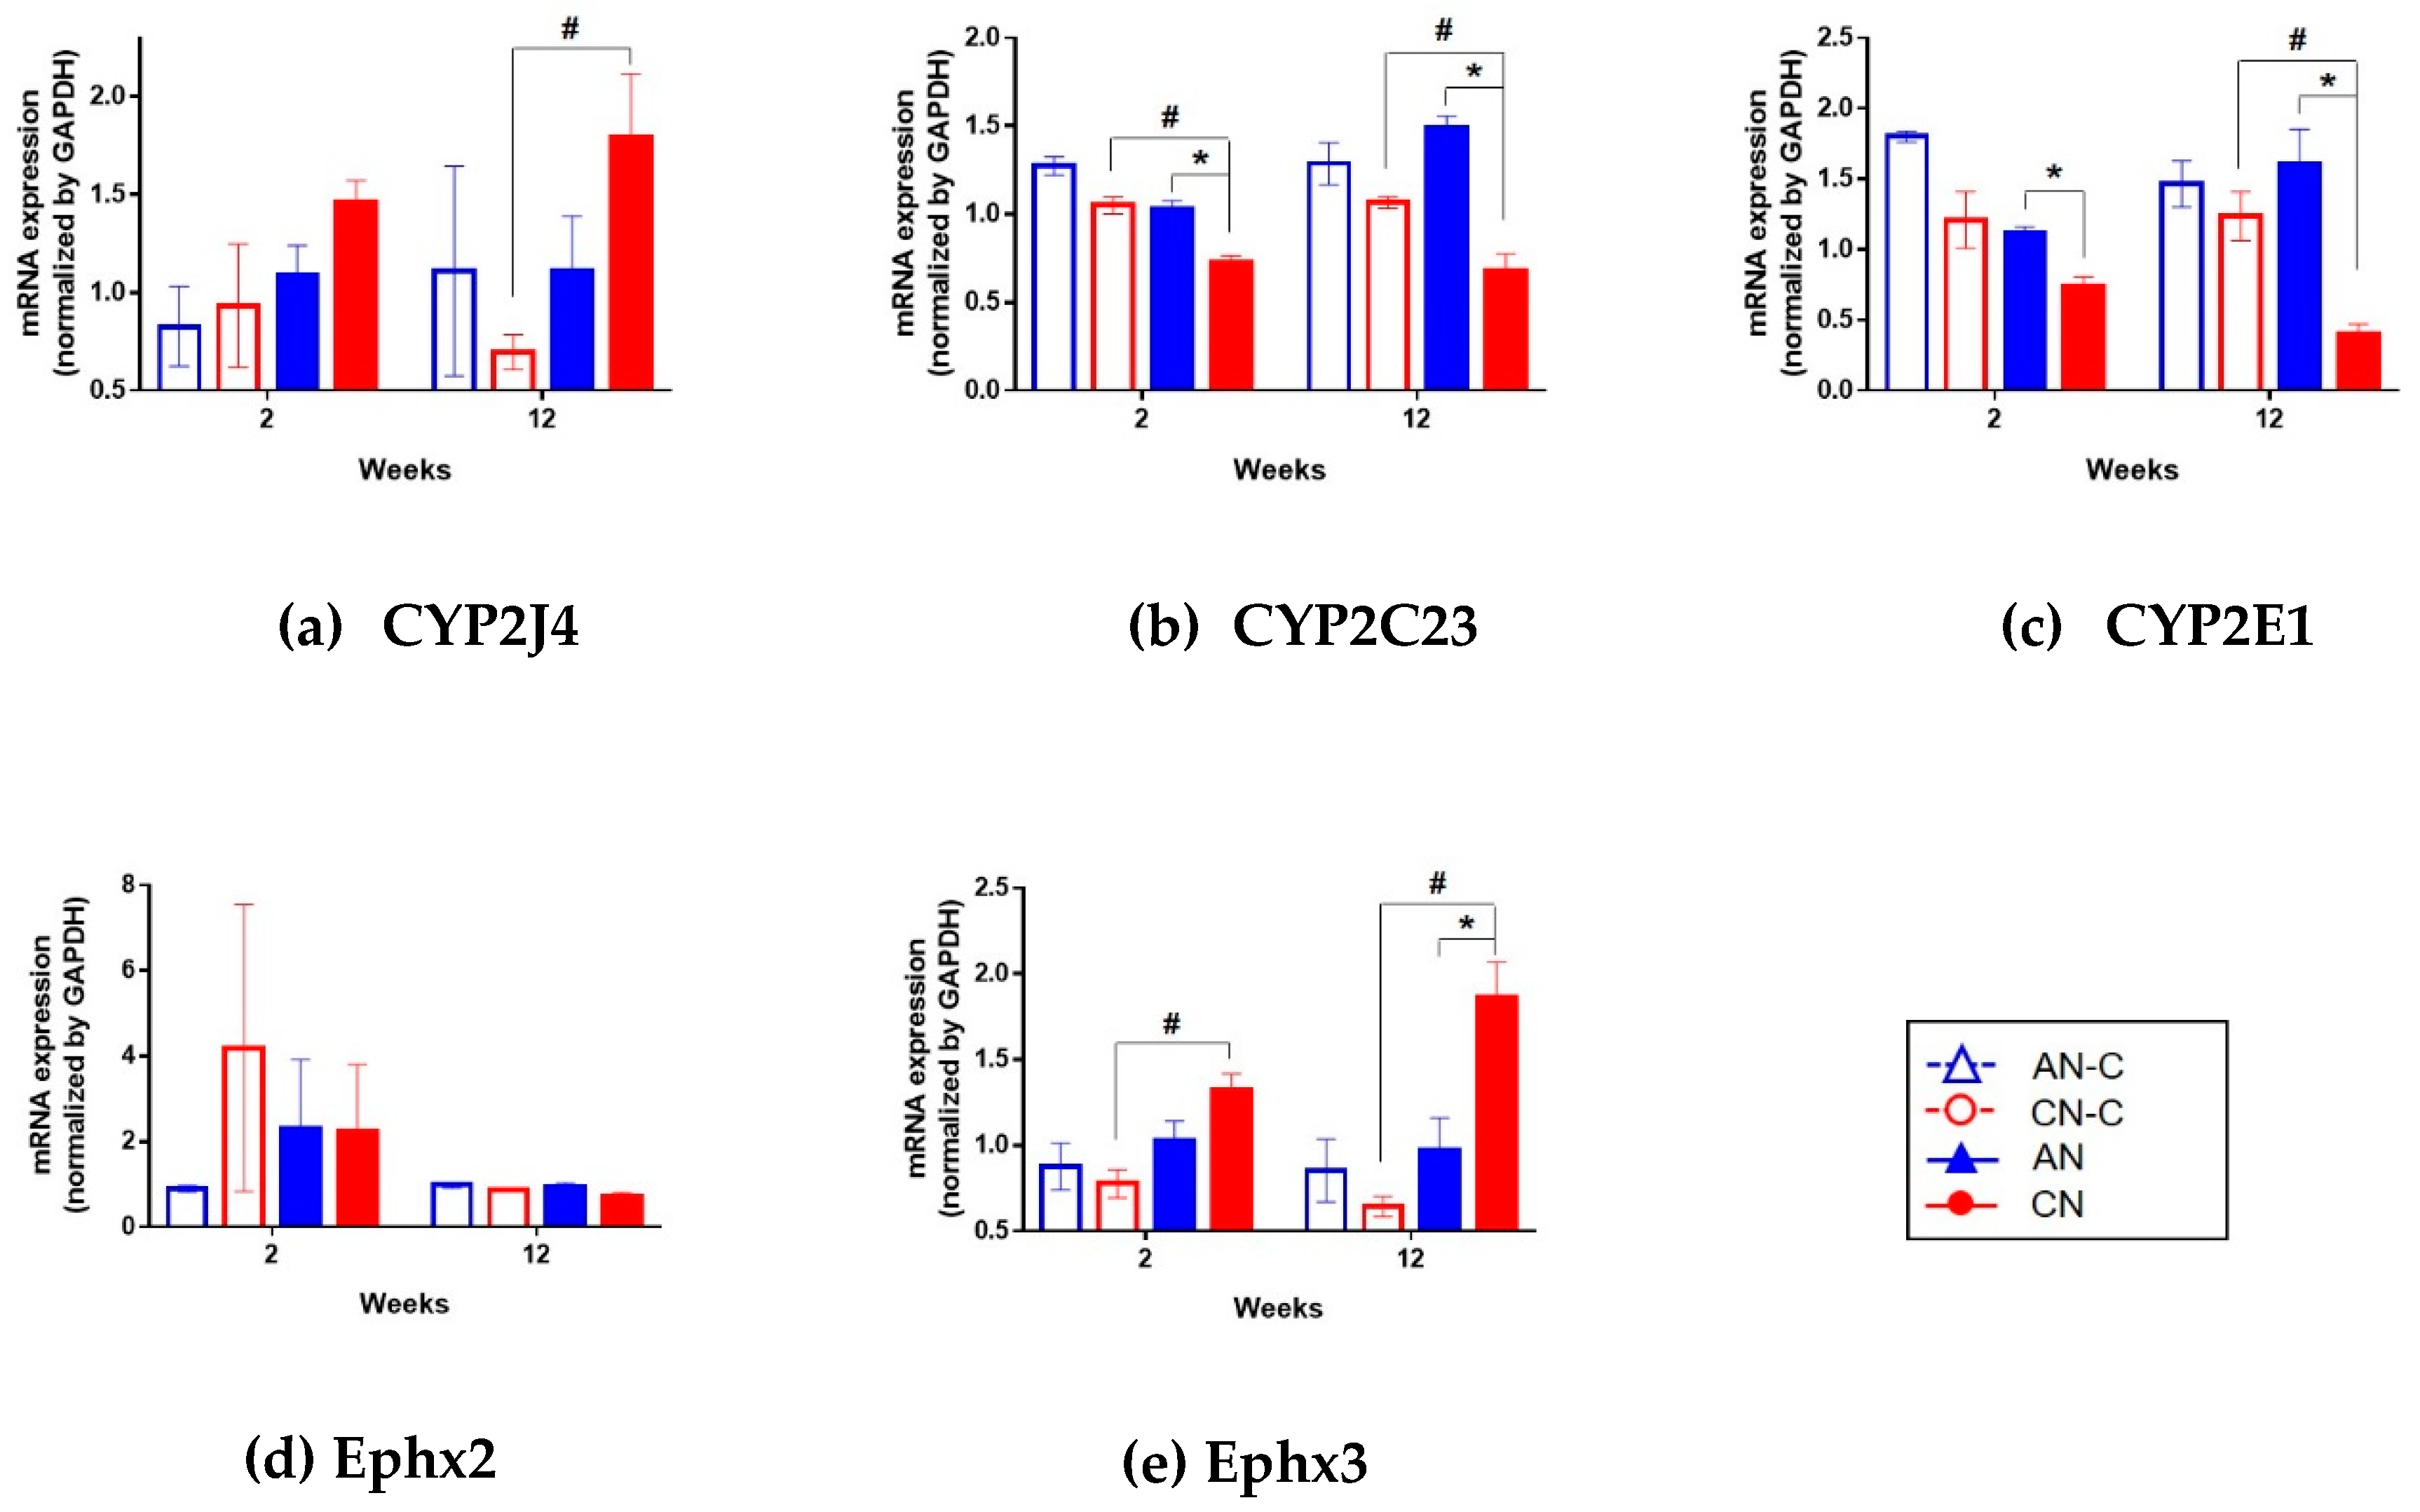
3.4. Renal mRNA Expression of CYP2J4, CYP2C23, CYP2E1, Ephx2, and Ephx3.
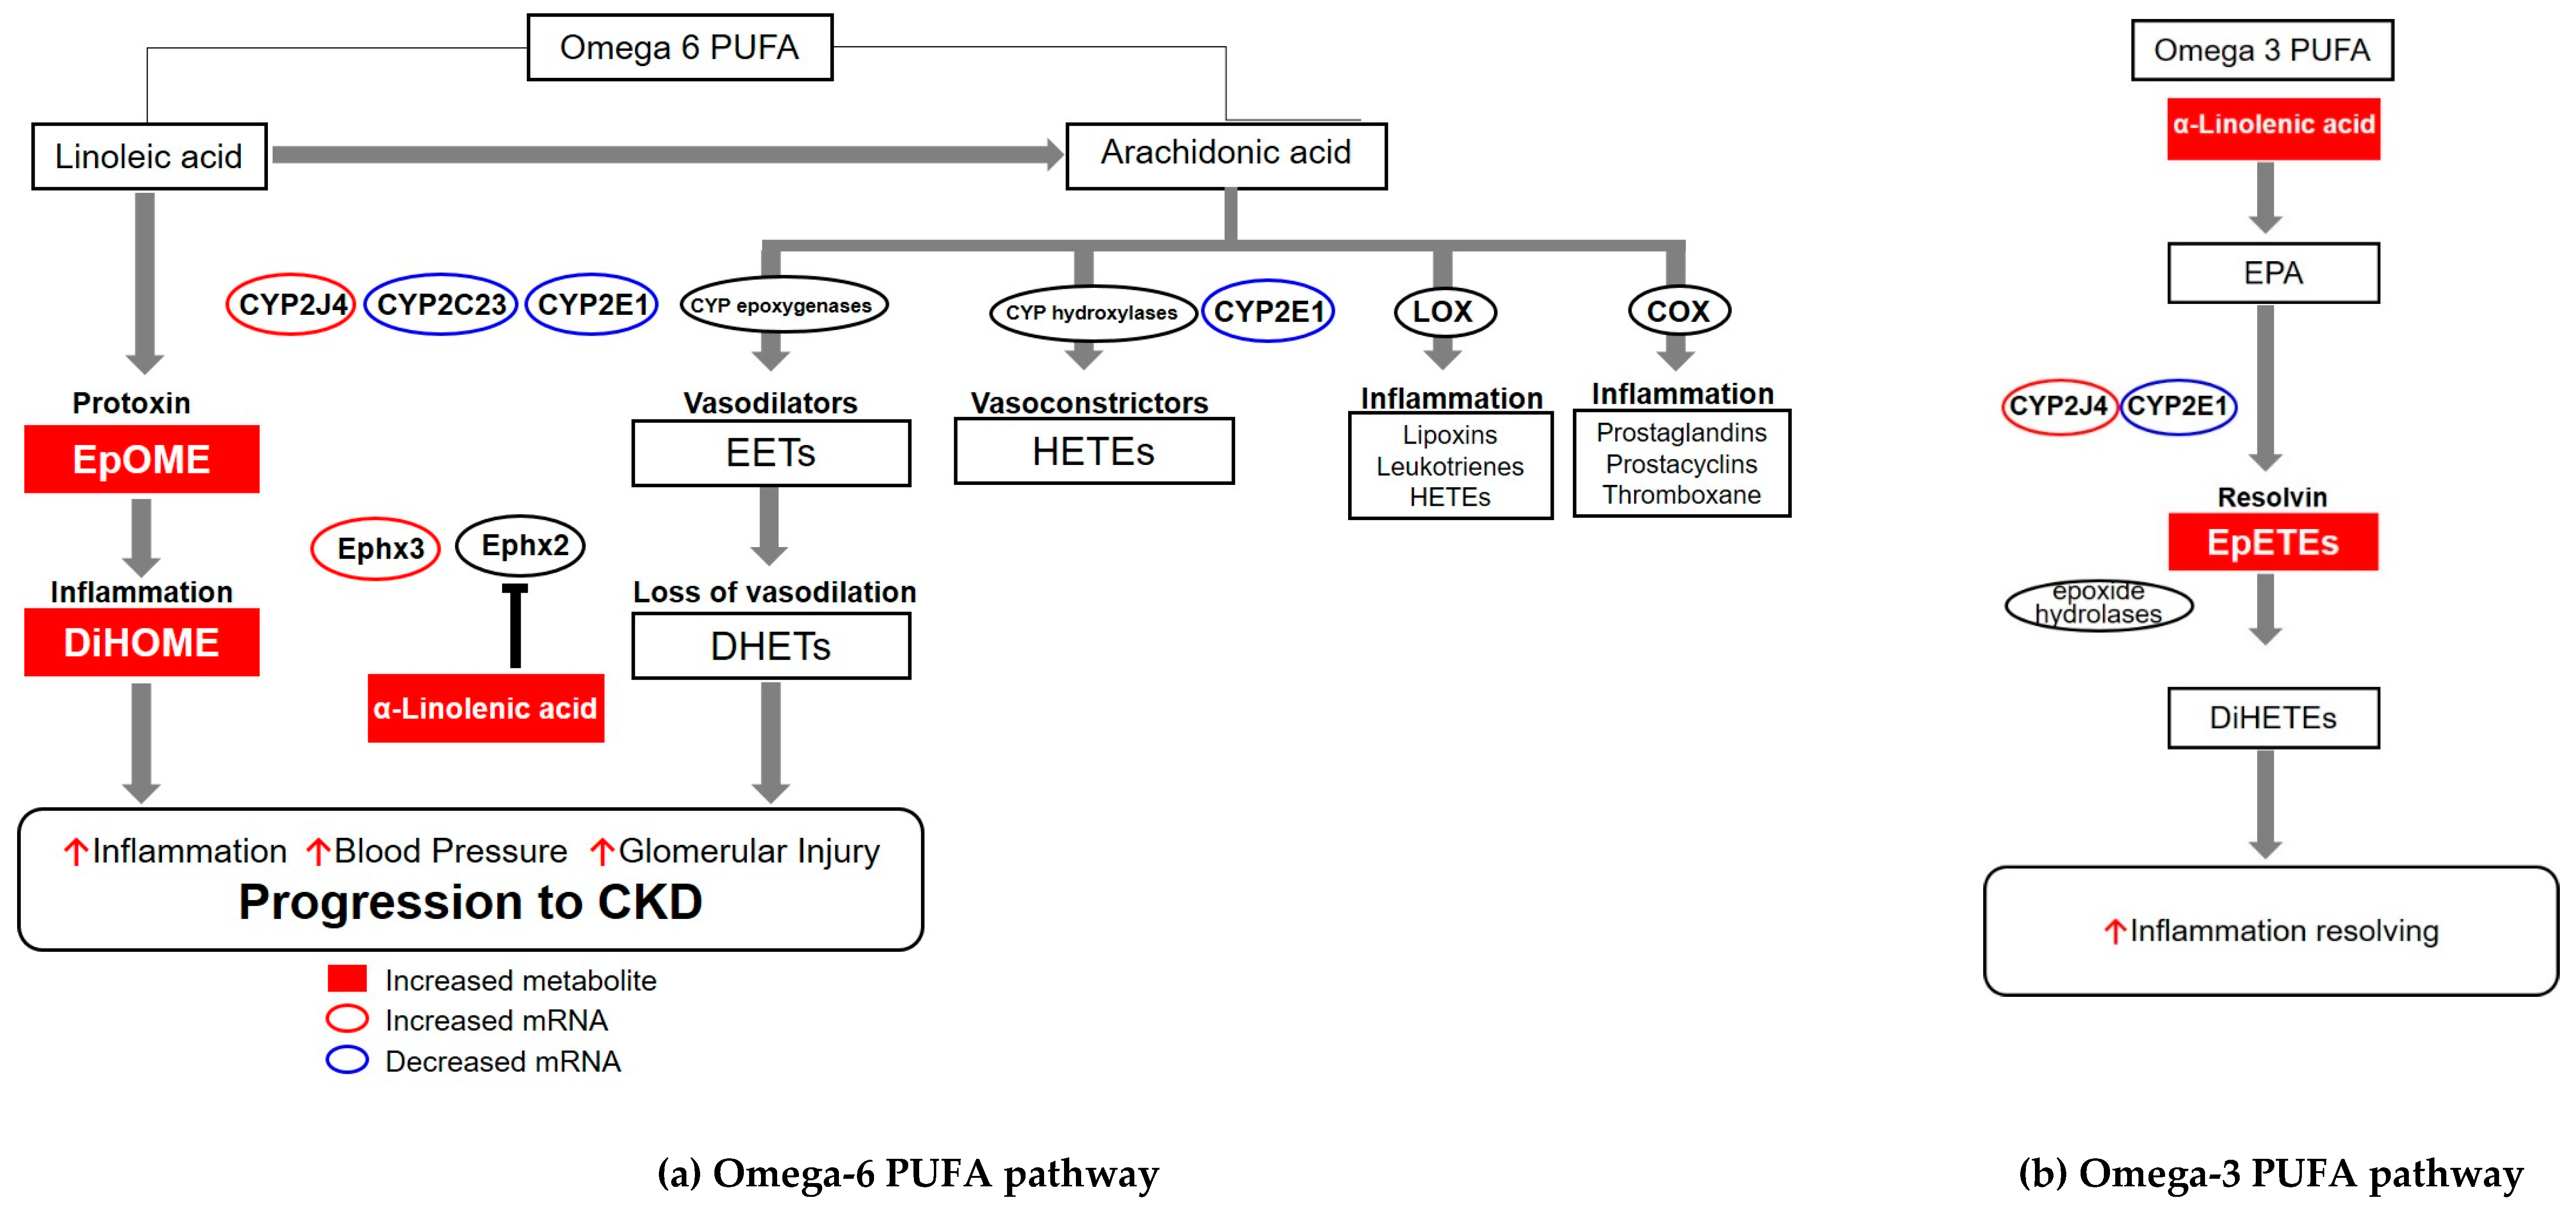
4. Discussion
5. Conclusions
Supplementary Materials
Author Contributions
Funding
Acknowledgments
Conflicts of Interest
Abbreviations
| AA | Arachidonic Acid |
| AAALAC International | Association for Assessment and Accreditation of Laboratory Animal Care International |
| AKI | acute kidney injury |
| ALA | α-linolenic acid |
| AN | acute nephritis |
| CKD | chronic kidney disease |
| CN | chronic nephritis |
| COX | cyclooxygenase |
| CYP | cytochrome |
| DHA | docosahexaenoic acid |
| DHET | dihydroxyeicosatrienoic acid |
| DiHETE | dihydroxyeicosatetraenoic acid |
| DiHOME | dihydroxyoctadecenoic acid |
| EET | epoxyeicosatrienoic acid |
| EPA | eicosapentaenoic acid |
| EpETE | epoxyeicosatetraenoic acid |
| Ephx2 | epoxide hydrolase 2 |
| Ephx3 | epoxide hydrolase 3 |
| EpOME | epoxyoctadecenoic acid |
| FDR | false discovery rate |
| HETE | hydroxyeicosatetraenoic acid |
| LA | linoleic acid |
| LOX | lipoxygenase |
| PBS | phosphate-buffered saline |
| PCA | principal components analysis |
| PUFA | polyunsaturated fatty acid |
| sEH | soluble epoxide hydrolase |
| TOF/MS | time-of-flight mass spectrometer |
| UPLC | ultra-performance liquid chromatography |
References
- Hakemi, M.S. Chronic kidney disease epidemiology. Iran J. Kidney Dis. 2014, 8, 261. [Google Scholar] [PubMed]
- Lopez-Giacoman, S.; Madero, M. Biomarkers in chronic kidney disease, from kidney function to kidney damage. World J. Nephrol. 2015, 4, 57–73. [Google Scholar] [CrossRef] [PubMed]
- Nkuipou-Kenfack, E.; Duranton, F.; Gayrard, N.; Argilés, À.; Lundin, U.; Weinberger, K.M.; Dakna, M.; Delles, C.; Mullen, W.; Husi, H.; et al. Assessment of metabolomic and proteomic biomarkers in detection and prognosis of progression of renal function in chronic kidney disease. PLoS ONE 2014, 9, e96955. [Google Scholar] [CrossRef] [PubMed] [Green Version]
- Edwards, K.D.; Whyte, H.M. Plasma creatinine level and creatinine clearance as tests of renal function. Australas. Ann. Med. 1959, 8, 218–224. [Google Scholar] [CrossRef]
- Cockcroft, D.W.; Gault, M.H. Prediction of creatinine clearance from serum creatinine. Nephron 1976, 16, 31–41. [Google Scholar] [CrossRef]
- Hojs, R.; Bevc, S.; Ekart, R.; Gorenjak, M.; Puklavec, L. Serum cystatin C as an endogenous marker of renal function in patients with chronic kidney disease. Ren. Fail. 2008, 30, 181–186. [Google Scholar] [CrossRef] [Green Version]
- Friedman, A. Laboratory assessment and investigation of renal function. In Pediatric Nephrology, 6th ed.; Avner, E., Harmon, W., Niaudet, P., Yoshikawa, N., Eds.; Springer: Berlin/Heidelberg, Germany, 2009; pp. 491–504. ISBN 978-3-540-76327-7. [Google Scholar]
- American Society of Nephrology. American society of nephrology renal research report. J. Am. Soc. Nephrol. 2005, 16, 1886–1903. [Google Scholar] [CrossRef]
- Herget-Rosenthal, S.; Marggraf, G.; Hüsing, J.; Göring, F.; Pietruck, F.; Janssen, O.; Philipp, T.; Kribben, A. Early detection of acute renal failure by serum cystatin C. Kidney Int. 2004, 66, 1115–1122. [Google Scholar] [CrossRef] [Green Version]
- Parikh, C.R.; Abraham, E.; Ancukiewicz, M.; Edelstein, C.L. Urine IL-18 is an early diagnostic marker for acute kidney injury and predicts mortality in the intensive care unit. J. Am. Soc. Nephrol. 2005, 16, 3046–3052. [Google Scholar] [CrossRef] [Green Version]
- Mishra, J.; Dent, C.; Tarabishi, R.; Mitsnefes, M.M.; Ma, Q.; Kelly, C.; Ruff, S.M.; Zahedi, K.; Shao, M.; Bean, J.; et al. Neutrophil gelatinase-associated lipocalin (NGAL) as a biomarker for acute renal injury after cardiac surgery. Lancet 2005, 365, 1231–1238. [Google Scholar] [CrossRef]
- Coca, S.G.; Yalavarthy, R.; Concato, J.; Parikh, C.R. Biomarkers for the diagnosis and risk stratification of acute kidney injury: A systematic review. Kidney Int. 2008, 73, 1008–1016. [Google Scholar] [CrossRef] [PubMed] [Green Version]
- Fan, L.; Zhang, W.; Yin, M.; Zhang, T.; Wu, X.; Zhang, H.; Sun, M.; Li, Z.; Hou, Y.; Zhou, X.; et al. Identification of metabolic biomarkers to diagnose epithelial ovarian cancer using a UPLC/QTOF/MS platform. Acta Oncol. 2012, 51, 473–479. [Google Scholar] [CrossRef] [PubMed] [Green Version]
- Posada-Ayala, M.; Zubiri, I.; Martin-Lorenzo, M.; Sanz-Maroto, A.; Molero, D.; Gonzalez-Calero, L.; Fernandez-Fernandez, B.; de la Cuesta, F.; Laborde, C.M.; Barderas, M.G.; et al. Identification of a urine metabolomic signature in patients with advanced-stage chronic kidney disease. Kidney Int. 2014, 85, 103–111. [Google Scholar] [CrossRef] [PubMed] [Green Version]
- Gao, Y. Urine is a better biomarker source than blood especially for kidney diseases. Adv. Exp. Med. Biol. 2015, 845, 3–12. [Google Scholar] [CrossRef]
- Jing, J.; Gao, Y. Urine biomarkers in the early stages of diseases: Current status and perspective. Discov. Med. 2018, 25, 57–65. [Google Scholar] [PubMed]
- Hwang, G.S.; Yang, J.Y.; Ryu, D.H.; Kwon, T.H. Metabolic profiling of kidney and urine in rats with lithium-induced nephrogenic diabetes insipidus by (1)H-NMR-based metabonomics. Am. J. Physiol. Renal Physiol. 2010, 298, F461–F470. [Google Scholar] [CrossRef]
- Zivkovic, A.M.; Yang, J.; Georgi, K.; Hegedus, C.; Nording, M.L.; O’Sullivan, A.; German, J.B.; Hogg, R.J.; Weiss, R.H.; Bay, C.; et al. Serum oxylipin profiles in IgA nephropathy patients reflect kidney functional alterations. Metabolomics 2012, 8, 1102–1113. [Google Scholar] [CrossRef] [Green Version]
- Chen, D.Q.; Cao, G.; Chen, H.; Argyopoulos, C.P.; Yu, H.; Su, W.; Chen, L.; Samuels, D.C.; Zhuang, S.; Bayliss, G.P.; et al. Identification of serum metabolites associating with chronic kidney disease progression and anti-fibrotic effect of 5-methoxytryptophan. Nat. Commun. 2019, 10, 1476. [Google Scholar] [CrossRef]
- Zhao, Y.Y.; Cheng, X.L.; Wei, F.; Bai, X.; Lin, R.C. Application of faecal metabonomics on an experimental model of tubulointerstitial fibrosis by ultra performance liquid chromatography/high-sensitivity mass spectrometry with MSE data collection technique. Biomarkers 2012, 17, 721–729. [Google Scholar] [CrossRef]
- Zhao, Y.Y.; Shen, X.; Cheng, X.L.; Wei, F.; Bai, X.; Lin, R.C. Urinary metabonomics study on the protective effects of ergosta-4,6,8(14),22-tetraen-3-one on chronic renal failure in rats using UPLC Q-TOF/MS and a novel MSE data collection technique. Process. Biochem. 2012, 47, 1980–1987. [Google Scholar] [CrossRef]
- Zhang, Z.H.; Wei, F.; Vaziri, N.D.; Cheng, X.L.; Bai, X.; Lin, R.C.; Zhao, Y.Y. Metabolomics insights into chronic kidney disease and modulatory effect of rhubarb against tubulointerstitial fibrosis. Sci. Rep. 2015, 5, 14472. [Google Scholar] [CrossRef] [PubMed] [Green Version]
- Zhao, Y.Y.; Wang, H.L.; Cheng, X.L.; Wei, F.; Bai, X.; Lin, R.C.; Vaziri, N.D. Metabolomics analysis reveals the association between lipid abnormalities and oxidative stress, inflammation, fibrosis, and Nrf2 dysfunction in aristolochic acid-induced nephropathy. Sci. Rep. 2015, 5, 12936. [Google Scholar] [CrossRef] [PubMed] [Green Version]
- Fang, J.; Wang, W.; Sun, S.; Wang, Y.; Li, Q.; Lu, X.; Hao, Z.; Zhang, Y. A urine metabonomics study of chronic renal failure and intervention effects of total aglycone extracts of Scutellaria baicalensis in 5/6 nephrectomy rats. RSC Adv. 2015, 5, 75612–75621. [Google Scholar] [CrossRef]
- Nagata, M. Immune-mediated glomerular injury. In Pediatric Nephrology, 6th ed.; Avner, E., Harmon, W., Niaudet, P., Yoshikawa, N., Eds.; Springer: Berlin/Heidelberg, Germany, 2009; pp. 703–742. ISBN 978-3-540-76327-7. [Google Scholar]
- Sakai, N.; Iseki, K.; Suzuki, S.; Mori, T.; Hagino, S.; Zhang, Y.; Yokoya, S.; Kawasaki, Y.; Suzuki, J.; Isome, M.; et al. Uninephrectomy induces progressive glomerulosclerosis and apoptosis in anti-Thy1 glomerulonephritis. Pathol. Int. 2005, 55, 19–26. [Google Scholar] [CrossRef] [PubMed]
- Kobayashi, Y.; Tateno, S.; Hiki, Y.; Shigematsu, H. IgA nephropathy: Prognostic significance of proteinuria and histological alterations. Nephron 1983, 34, 146–153. [Google Scholar] [CrossRef]
- Reich, H.N.; Troyanov, S.; Scholey, J.W.; Cattran, D.C. Remission of proteinuria improves prognosis in IgA nephropathy. J. Am. Soc. Nephrol. 2007, 18, 3177–3183. [Google Scholar] [CrossRef]
- Hara, M.; Yanagihara, T.; Kihara, I. Cumulative excretion of urinary podocytes reflects disease progression in IgA nephropathy and Schönlein-Henoch purpura nephritis. Clin. J. Am. Soc. Nephrol. 2007, 2, 231–238. [Google Scholar] [CrossRef]
- Becherucci, F.; Roperto, R.M.; Materassi, M.; Romagnani, P. Chronic kidney disease in children. Clin. Kidney J. 2016, 9, 583–591. [Google Scholar] [CrossRef] [Green Version]
- Kellum, J.A.; Lameire, N. The definition of acute kidney injury. Lancet 2018, 391, 202–203. [Google Scholar] [CrossRef] [Green Version]
- National Research Council; Division on Earth and Life Studies; Institute for Laboratory Animal Research; Committee for the Update of the Guide for the Care and Use of Laboratory Animals. Environment, housing, and management. In Guide for the Care and Use of Laboratory Animals, 8th ed.; National Academy Press: Washington, DC, USA, 2011; pp. 41–132. ISBN 978-0309154000. [Google Scholar]
- Steinmann-Niggli, K.; Ziswiler, R.; Küng, M.; Marti, H.P. Inhibition of matrix metalloproteinases attenuates anti-Thy1.1 nephritis. J. Am. Soc. Nephrol. 1998, 9, 397–407. [Google Scholar]
- Aben, J.A.; IJpelaar, D.H.; Baelde, H.; Worley, P.; Noble, N.; Bruijn, J.A.; de Heer, E. Glomerular expression of neuronal activity-regulated pentraxin precedes the development of anti-Thy-1-induced progressive glomerulosclerosis. Kidney Int. 2006, 70, 1279–1286. [Google Scholar] [CrossRef] [PubMed] [Green Version]
- Cheng, Q.L.; Orikasa, M.; Morioka, T.; Kawachi, H.; Chen, X.M.; Oite, T.; Shimizu, F. Progressive renal lesions induced by administration of monoclonal antibody 1-22-3 to unilaterally nephrectomized rats. Clin. Exp. Immunol. 1995, 102, 181–185. [Google Scholar] [CrossRef] [PubMed]
- Seegal, B.C.; Loeb, E.N. The production of chronic glomerulonephritis in rats by the injection of rabbit anti-rat-placenta serum. J. Exp. Med. 1946, 84, 211–222. [Google Scholar] [CrossRef]
- Schaefer, L.; Hausser, H.; Altenburger, M.; Ugorcakova, J.; August, C.; Fisher, L.W.; Schaefer, R.M.; Kresse, H. Decorin, biglycan and their endocytosis receptor in rat renal cortex. Kidney Int. 1998, 54, 1529–1541. [Google Scholar] [CrossRef] [PubMed] [Green Version]
- Terashima, H.; Kato, M.; Ebisawa, M.; Kobayashi, H.; Suzuki, K.; Nezu, Y.; Sada, T. R-268712, an orally active transforming growth factor-β type I receptor inhibitor, prevents glomerular sclerosis in a Thy1 nephritis model. Eur. J. Pharmacol. 2014, 734, 60–66. [Google Scholar] [CrossRef] [PubMed]
- Larsen, K. Creatinine assay by a reaction-kinetic principle. Clin. Chim. Acta 1972, 41, 209–217. [Google Scholar] [CrossRef]
- Okuda, S.; Languino, L.R.; Ruoslahti, E.; Border, W.A. Elevated expression of transforming growth factor-beta and proteoglycan production in experimental glomerulonephritis. Possible role in expansion of the mesangial extracellular matrix. J. Clin. Invest 1990, 86, 453–462. [Google Scholar] [CrossRef] [Green Version]
- Reinhard, M.K.; Hottendorf, G.H.; Powell, E.D. Differences in the sensitivity of Fischer and Sprague-Dawley rats to aminoglycoside nephrotoxicity. Toxicol. Pathol. 1991, 19, 66–71. [Google Scholar] [CrossRef]
- Benjamini, Y.; Hochberg, Y. Controlling the false discovery rate: A practical and powerful approach to multiple testing. J. R. Stat. Soc. Ser. B Methodol. 1995, 57, 289–300. [Google Scholar] [CrossRef]
- Karara, A.; Makita, K.; Jacobson, H.R.; Falck, J.R.; Guengerich, F.P.; DuBois, R.N.; Capdevila, J.H. Molecular cloning, expression, and enzymatic characterization of the rat kidney cytochrome P-450 arachidonic acid epoxygenase. J. Biol. Chem. 1993, 268, 13565–13570. [Google Scholar]
- Laethem, R.M.; Balazy, M.; Falck, J.R.; Laethem, C.L.; Koop, D.R. Formation of 19 (S)-, 19 (R)-, and 18 (R)-hydroxyeicosatetraenoic acids by alcohol-inducible cytochrome P450 2E1. J. Biol. Chem. 1993, 268, 12912–12918. [Google Scholar] [PubMed]
- Yu, Z.; Huse, L.M.; Adler, P.; Graham, L.; Ma, J.; Zeldin, D.C.; Kroetz, D.L. Increased CYP2J expression and epoxyeicosatrienoic acid formation in spontaneously hypertensive rat kidney. Mol. Pharmacol. 2000, 57, 1011–1020. [Google Scholar] [PubMed]
- Zhang, Q.Y.; Ding, X.; Kaminsky, L.S. cDNA cloning, heterologous expression, and characterization of rat intestinal CYP2J4. Arch. Biochem. Biophys. 1997, 340, 270–278. [Google Scholar] [CrossRef] [PubMed]
- Hoopes, S.L.; Gruzdev, A.; Edin, M.L.; Graves, J.P.; Bradbury, J.A.; Flake, G.P.; Lih, F.B.; DeGraff, L.M.; Zeldin, D.C. Generation and characterization of epoxide hydrolase 3 (EPHX3)-deficient mice. PLoS ONE 2017, 12, e0175348. [Google Scholar] [CrossRef] [PubMed]
- D’Amico, G.; Bazzi, C. Pathophysiology of proteinuria. Kidney Int. 2003, 63, 809–825. [Google Scholar] [CrossRef] [Green Version]
- Dubin, R.F.; Rhee, E.P. Proteomics and metabolomics in kidney disease, including insights into etiology, treatment, and rrevention. Clin. J. Am. Soc. Nephrol. 2020, 15, 404–411. [Google Scholar] [CrossRef] [Green Version]
- Fleming, I. The pharmacology of the cytochrome P450 epoxygenase/soluble epoxide hydrolase axis in the vasculature and cardiovascular disease. Pharmacol. Rev. 2014, 66, 1106–1140. [Google Scholar] [CrossRef] [Green Version]
- Edin, M.L.; Wang, Z.; Bradbury, J.A.; Graves, J.P.; Lih, F.B.; DeGraff, L.M.; Foley, J.F.; Torphy, R.; Ronnekleiv, O.K.; Tomer, K.B.; et al. Endothelial expression of human cytochrome P450 epoxygenase CYP2C8 increases susceptibility to ischemia-reperfusion injury in isolated mouse heart. FASEB J. 2011, 25, 3436–3447. [Google Scholar] [CrossRef] [Green Version]
- Spector, A.A.; Kim, H.Y. Cytochrome P450 epoxygenase pathway of polyunsaturated fatty acid metabolism. Biochim. Biophys. Acta 2015, 1851, 356–365. [Google Scholar] [CrossRef] [Green Version]
- Chaudhary, K.R.; Zordoky, B.N.; Edin, M.L.; Alsaleh, N.; El-Kadi, A.O.; Zeldin, D.C.; Seubert, J.M. Differential effects of soluble epoxide hydrolase inhibition and CYP2J2 overexpression on postischemic cardiac function in aged mice. Prostaglandins Other Lipid Mediat. 2013, 104–105, 8–17. [Google Scholar] [CrossRef] [Green Version]
- Stimers, J.R.; Dobretsov, M.; Hastings, S.L.; Jude, A.R.; Grant, D.F. Effects of linoleic acid metabolites on electrical activity in adult rat ventricular myocytes. Biochim. Biophys. Acta 1999, 1438, 359–368. [Google Scholar] [CrossRef]
- Honetschlägerová, Z.; Kitada, K.; Husková, Z.; Sporková, A.; Kopkan, L.; Bürgelová, M.; Varcabová, Š.; Nishiyama, A.; Hwang, S.H.; Hammock, B.D.; et al. Antihypertensive and renoprotective actions of soluble epoxide hydrolase inhibition in ANG II-dependent malignant hypertension are abolished by pretreatment with L-NAME. J. Hypertens. 2013, 31, 321–332. [Google Scholar] [CrossRef] [PubMed] [Green Version]
- Neckář, J.; Kopkan, L.; Husková, Z.; Kolář, F.; Papoušek, F.; Kramer, H.J.; Hwang, S.H.; Hammock, B.D.; Imig, J.D.; Malý, J.; et al. Inhibition of soluble epoxide hydrolase by cis-4-[4-(3-adamantan-1-ylureido)cyclohexyl-oxy] benzoic acid exhibits antihypertensive and cardioprotective actions in transgenic rats with angiotensin II-dependent hypertension. Clin. Sci. 2012, 122, 513–525. [Google Scholar] [CrossRef] [PubMed] [Green Version]
- Imig, J.D.; Zhao, X.; Zaharis, C.Z.; Olearczyk, J.J.; Pollock, D.M.; Newman, J.W.; Kim, I.H.; Watanabe, T.; Hammock, B.D. An orally active epoxide hydrolase inhibitor lowers blood pressure and provides renal protection in salt-sensitive hypertension. Hypertension 2005, 46, 975–981. [Google Scholar] [CrossRef] [PubMed] [Green Version]
- Jamieson, K.L.; Endo, T.; Darwesh, A.M.; Samokhvalov, V.; Seubert, J.M. Cytochrome P450-derived eicosanoids and heart function. Pharmacol. Ther. 2017, 179, 47–83. [Google Scholar] [CrossRef] [PubMed]
- Davidson, M.H. Omega-3 fatty acids: New insights into the pharmacology and biology of docosahexaenoic acid, docosapentaenoic acid, and eicosapentaenoic acid. Curr. Opin. Lipidol. 2013, 24, 467–474. [Google Scholar] [CrossRef]
- Pan, A.; Chen, M.; Chowdhury, R.; Wu, J.H.; Sun, Q.; Campos, H.; Mozaffarian, D.; Hu, F.B. α -Linolenic acid and risk of cardiovascular disease: A systematic review and meta-analysis. Am. J. Clin. Nutr. 2012, 96, 1262–1273. [Google Scholar] [CrossRef]
- Mozaffarian, D.; Wu, J.H. Omega-3 fatty acids and cardiovascular disease: Effects on risk factors, molecular pathways, and clinical events. J. Am. Coll. Cardiol. 2011, 58, 2047–2067. [Google Scholar] [CrossRef] [Green Version]
- Caligiuri, S.P.; Aukema, H.M.; Ravandi, A.; Guzman, R.; Dibrov, E.; Pierce, G.N. Flaxseed consumption reduces blood pressure in patients with hypertension by altering circulating oxylipins via an alpha-linolenic acid-induced inhibition of soluble epoxide hydrolase. Hypertension 2014, 64, 53–59. [Google Scholar] [CrossRef] [Green Version]
- Fujita, T.; Nakamura, N.; Kumasaka, R.; Shimada, M.; Murakami, R.; Osawa, H.; Yamabe, H.; Okumura, K. Comparison of lipid and fatty acid metabolism between minimal change nephrotic syndrome and membranous nephropathy. In Vivo 2006, 20, 891–893. [Google Scholar]
- Moorhead, J.F.; Chan, M.K.; El-Nahas, M.; Varghese, Z. Lipid nephrotoxicity in chronic progressive glomerular and tubulo-interstitial disease. Lancet 1982, 2, 1309–1311. [Google Scholar] [CrossRef]
- Weinberg, J.M. Lipotoxicity. Kidney Int. 2006, 70, 1560–1566. [Google Scholar] [CrossRef] [Green Version]
- Ruan, X.Z.; Varghese, Z.; Moorhead, J.F. An update on the lipid nephrotoxicity hypothesis. Nat. Rev. Nephrol. 2009, 5, 713–721. [Google Scholar] [CrossRef] [PubMed]
- Wahba, I.M.; Mak, R.H. Obesity aatcand obesity-initiated metabolic syndrome: Mechanistic links to chronic kidney disease. Clin. J. Am. Soc. Nephrol. 2007, 2, 550–562. [Google Scholar] [CrossRef] [Green Version]
- Capdevila, J.; Wang, W. Role of cytochrome P450 epoxygenase in regulating renal membrane transport and hypertension. Curr. Opin. Nephrol. Hypertens. 2013, 22, 163–169. [Google Scholar] [CrossRef] [PubMed]
- Imig, J.D. Epoxyeicosatrienoic acids, hypertension, and kidney injury. Hypertension 2015, 65, 476–482. [Google Scholar] [CrossRef] [Green Version]
- Kaergel, E.; Muller, D.N.; Honeck, H.; Theuer, J.; Shagdarsuren, E.; Mullally, A.; Luft, F.C.; Schunck, W.H. P450-dependent arachidonic acid metabolism and angiotensin II–induced renal damage. Hypertension 2002, 40, 273–279. [Google Scholar] [CrossRef] [Green Version]
- Zhao, X.; Pollock, D.M.; Inscho, E.W.; Zeldin, D.C.; Imig, J.D. Decreased renal cytochrome P450 2C enzymes and impaired vasodilation are associated with angiotensin salt-sensitive hypertension. Hypertension 2003, 41, 709–714. [Google Scholar] [CrossRef] [Green Version]
- Frömel, T.; Fleming, I. Whatever happened to the epoxyeicosatrienoic acid-like endothelium-derived hyperpolarizing factor? The identification of novel classes of lipid mediators and their role in vascular homeostasis. Antioxid. Redox. Signal. 2015, 22, 1273–1292. [Google Scholar] [CrossRef]
- Imig, J.D. Prospective for cytochrome P450 epoxygenase cardiovascular and renal therapeutics. Pharmacol. Ther. 2018, 192, 1–19. [Google Scholar] [CrossRef]
- Imaoka, S.; Wedlund, P.J.; Ogawa, H.; Kimura, S.; Gonzalez, F.J.; Kim, H.Y. Identification of CYP2C23 expressed in rat kidney as an arachidonic acid epoxygenase. J. Pharmacol. Exp. Ther. 1993, 267, 1012–1016. [Google Scholar] [PubMed]
- Singh, H.; Schwartzman, M.L. Renal vascular cytochrome P450-derived eicosanoids in androgen-induced hypertension. Pharmacol. Rep. 2008, 60, 29–37. [Google Scholar]
- Sun, P.; Lin, D.H.; Yue, P.; Jiang, H.; Gotlinger, K.H.; Schwartzman, M.L.; Falck, J.R.; Goli, M.; Wang, W.H. High potassium intake enhances the inhibitory effect of 11,12-EET on ENaC. J. Am. Soc. Nephrol. 2010, 21, 1667–1677. [Google Scholar] [CrossRef] [Green Version]
- Porubsky, P.R.; Meneely, K.M.; Scott, E.E. Structures of human cytochrome P-450 2E1. Insights into the binding of inhibitors and both small molecular weight and fatty acid substrates. J. Biol. Chem. 2008, 283, 33698–33707. [Google Scholar] [CrossRef] [PubMed] [Green Version]
- Behmoaras, J.; Diaz, A.G.; Venda, L.; Ko, J.H.; Srivastava, P.; Montoya, A.; Faull, P.; Webster, Z.; Moyon, B.; Pusey, C.D.; et al. Macrophage epoxygenase determines a profibrotic transcriptome signature. J. Immunol. 2015, 194, 4705–4716. [Google Scholar] [CrossRef] [PubMed] [Green Version]
- Westphal, C.; Konkel, A.; Schunck, W.H. CYP-eicosanoids--a new link between omega-3 fatty acids and cardiac disease? Prostaglandins Other Lipid Mediat. 2011, 96, 99–108. [Google Scholar] [CrossRef]
- Morisseau, C.; Hammock, B.D. Measurement of soluble epoxide hydrolase (sEH) activity. Curr. Protoc. Toxicol. 2007, 33, 1–18. [Google Scholar] [CrossRef]
- Imig, J.D. Epoxide hydrolase and epoxygenase metabolites as therapeutic targets for renal diseases. Am. J. Physiol. Renal Physiol. 2005, 289, F496–F503. [Google Scholar] [CrossRef] [Green Version]
- Kim, J.; Imig, J.D.; Yang, J.; Hammock, B.D.; Padanilam, B.J. Inhibition of soluble epoxide hydrolase prevents renal interstitial fibrosis and inflammation. Am. J. Physiol. Renal Physiol. 2014, 307, F971–F980. [Google Scholar] [CrossRef] [Green Version]
- Elmarakby, A.A.; Faulkner, J.; Al-Shabrawey, M.; Wang, M.H.; Maddipati, K.R.; Imig, J.D. Deletion of soluble epoxide hydrolase gene improves renal endothelial function and reduces renal inflammation and injury in streptozotocin-induced type 1 diabetes. Am. J. Physiol. Regul. Integr. Comp. Physiol. 2011, 301, R1307–R1317. [Google Scholar] [CrossRef]
- Hirahashi, J. Omega-3 polyunsaturated fatty acids for the treatment of IgA nephropathy. J. Clin. Med. 2017, 6, 70. [Google Scholar] [CrossRef] [PubMed] [Green Version]
- Barnadas, M.A.; Díaz Encarnación, M.M. Refractory cutaneous IgA vasculitis treated with omega-3 fatty acids. Case Rep. Dermatol. 2016, 8, 333–340. [Google Scholar] [CrossRef] [PubMed]
- Dixit, M.P.; Dixit, N.M.; Scott, K. Managing Henoch-Schonlein purpura in children with fish oil and ACE inhibitor therapy. Nephrology 2004, 9, 381–386. [Google Scholar] [CrossRef] [PubMed]
- Rižner, T.L. Enzymes of the AKR1B and AKR1C subfamilies and uterine diseases. Front. Pharmacol. 2012, 3, 34. [Google Scholar] [CrossRef] [Green Version]
- McIntosh, F.M.; Shingfield, K.J.; Devillard, E.; Russell, W.R.; Wallace, R.J. Mechanism of conjugated linoleic acid and vaccenic acid formation in human faecal suspensions and pure cultures of intestinal bacteria. Microbiology 2009, 155, 285–294. [Google Scholar] [CrossRef] [Green Version]
- Carta, G.; Murru, E.; Cordeddu, L.; Ortiz, B.; Giordano, E.; Belury, M.A.; Quadro, L.; Banni, S. Metabolic interactions between vitamin A and conjugated linoleic acid. Nutrients 2014, 6, 1262–1272. [Google Scholar] [CrossRef] [Green Version]
- Na, J.; Choi, S.A.; Khan, A.; Huh, J.Y.; Piao, L.; Hwang, I.; Ha, H.; Park, Y.H. Integrative omics reveals metabolic and transcriptomic alteration of nonalcoholic fatty liver disease in catalase knockout mice. Biomol. Ther. 2019, 27, 134–144. [Google Scholar] [CrossRef]
© 2020 by the authors. Licensee MDPI, Basel, Switzerland. This article is an open access article distributed under the terms and conditions of the Creative Commons Attribution (CC BY) license (http://creativecommons.org/licenses/by/4.0/).
Share and Cite
Han, K.H.; Kim, B.; Ji, S.C.; Kang, H.G.; Cheong, H.I.; Cho, J.-Y.; Ha, I.-S. Mechanism of Chronic Kidney Disease Progression and Novel Biomarkers: A Metabolomic Analysis of Experimental Glomerulonephritis. Metabolites 2020, 10, 169. https://doi.org/10.3390/metabo10040169
Han KH, Kim B, Ji SC, Kang HG, Cheong HI, Cho J-Y, Ha I-S. Mechanism of Chronic Kidney Disease Progression and Novel Biomarkers: A Metabolomic Analysis of Experimental Glomerulonephritis. Metabolites. 2020; 10(4):169. https://doi.org/10.3390/metabo10040169
Chicago/Turabian StyleHan, Kyoung Hee, Bora Kim, Sang Chun Ji, Hee Gyung Kang, Hae Il Cheong, Joo-Youn Cho, and Il-Soo Ha. 2020. "Mechanism of Chronic Kidney Disease Progression and Novel Biomarkers: A Metabolomic Analysis of Experimental Glomerulonephritis" Metabolites 10, no. 4: 169. https://doi.org/10.3390/metabo10040169