Article

A Visitor Assistance System Based on LoRa for Nature Forest Parks

by
Ana Elisa Ferreira
1,2,
Fernando Molano Ortiz
1,
Thales Teixeira de Almeida
1,3 and
Luís Henrique M. K. Costa
1,*
1
COPPE/PEE/GTA—Universidade Federal do Rio de Janeiro, Av. Athos da Silveira Ramos 149, Rio de Janeiro 21941-972, Brazil
2
Centro Federal de Educação Tecnológica Celso Suckow da Fonseca—UneD Petropolis/CEFET-RJ, Rua do Imperador 971, Petrópolis 25620-003, Brazil
3
Federal Technology Education Center of Minas Gerais—CEFET-MG, R. José Péres 558, Leopoldina 36700-001, Brazil
*
Author to whom correspondence should be addressed.
Electronics 2020, 9(4), 696; https://doi.org/10.3390/electronics9040696
Submission received: 1 April 2020 / Revised: 19 April 2020 / Accepted: 20 April 2020 / Published: 24 April 2020
(This article belongs to the Special Issue Application of Wireless Sensor Networks in Monitoring)

Abstract

:
Ecotourism activities are attracting more people each day, including national forest parks. Unfortunately, the number of incidents involving visitors to natural parks grows at the same pace. Among the most prevalent risks inside forests are getting lost and the occurrence of natural disasters. In this work, we propose a system for monitoring and assisting visitors of forest parks, based on a low power wide range wireless network, LoRa. The proposed visitor assisting system is composed of mobile terminals that communicate between them and with fixed infrastructure, using a protocol designed for exchanging visitor locations data. The infrastructure consists of wireless gateways distributed on the trails, the totems. User terminals, the mobile nodes, work collaboratively through a Delay and Disruption Tolerant Network (DTN), to cope with the possibility that the gateway infrastructure does not cover the whole trail. In addition to improvements and gains for minimizing risks, the proposal also brings contributions to the preservation of the environment, raising awareness of the influence of human presence in the natural environment and to the development of environmental education actions.

1. Introduction

Ecotourism, according to the World Economic Forum [1], is an economic activity that strongly contributes to income generation and distribution, especially in underdeveloped countries. In addition to helping to reduce poverty, ecotourism helps to preserve endangered ecosystems. Indeed, Environmental Conservation Units, such as parks and forest reserves, are extremely important because they promote environmental education and integrate the society with nature. Nonetheless, the natural environment presents inherent risks. Inside tropical forests, those mainly include getting lost, getting hurt, being in an unfamiliar environment, and the occurrence of natural disasters, such as flash flooding or forest fires.
Efficiently responding to the occurrence of lost visitors requires their geolocation, in addition to means of communication—or the search and rescue operation may take too long. The use of global navigation satellite systems (GNSS), such as the GPS, would make the task of determining the visitor’s position straightforward. The problem is, it is not possible to rely on a GNSS within conservation units, for example, inside dense forests or canyons. In these situations, alternative techniques need to be explored.
This work describes the project of a visitor assisting system where the localization is done collaboratively, using a low power wide range wireless network, and a DTN (Delay and disruption Tolerant Network) communication model. LoRa [2,3,4] is the wireless technology chosen, being the one that provided the largest range inside the tropical forest. Only the LoRa physical layer is used once our communication scenario does not justify the use of LoRaWAN [5,6]. Our main requirements for the mobile terminal, which will be carried by the user (a bracelet, ideally), are lightweight, very low energy consumption, and long-range communication. As such, we can consider this terminal as an Internet of Things (IoT) device. As a consequence, we also have some constraints: low memory, low processing capacity, and low data transmission rates.
The aim is to keep the project simple and inexpensive to facilitate its implementation in different conservation units. The goal is to maximize wireless network coverage while reducing infrastructure. This minimizes the cost of the project and also the environmental impacts that may be caused to fauna and flora.
The architecture of the proposed visitor assistance system has mobile and fixed nodes, which implement a security application. The mobile nodes are the visitor terminals and the fixed ones are the totems, an infrastructure to forward traffic to the application servers. The security application provides monitoring of visitors’ location, whether alone or in a group, and additionally allows help requests. To support the application, we design a protocol for exchanging location messages. As the application is designed to run directly above the LoRa physical layer, an alternate method to control access to the medium is developed.
In a nutshell, the contributions of our work are:
  • The proposal of a specific medium access control protocol for the LoRa network, which connects user terminals to totems and among themselves. A lightweight variation of CSMA (Carrier-Sense Multiple Access) is implemented using the different spreading factors of the LoRa PHY layer;
  • A protocol for the collaborative localization of visitors inside the park, which builds upon the one proposed in the CenWits project [7]. The proposed protocol includes visitor’s active requests for rescue and dynamic group creation. Groups allow to optimize terminal memory and battery utilization, as well as reducing the load offered to the network.
This work is organized as follows. Section 2 presents the main contributions of this work, and Section 3 shows existing related work in the literature. Section 4 briefly analyzes radio propagation in the forest environment. Section 5 details the visitor assistance system proposed, including architecture, protocol, and application. Section 6 presents a case study, the crossing trail between Petrópolis and Teresópolis cities. These two cities are in the mountainous region of the state of Rio de Janeiro, both with part of their area comprised of the Serra dos Órgão National Park (PARNASO). Finally, Section 7 concludes the paper and discusses our future work.

2. Contribution

This work is based on the CenWits [7] project, a system for locating and rescuing people in wilderness areas. In CenWits, each hiker wears a MICA2 sensor mote equipped with a GPS receiver and an RF transmitter, operating in the 900 MHz range. Each sensor is assigned a unique ID and maintains its current location based on the signal received by its GPS receiver. It also emits beacons periodically. When any two sensors are in the range of one another, they record the presence of each other (witness information) and also exchange the witness information they recorded earlier. The key idea here is that if two sensors come within range of each other at any time, they become each other’s witnesses. Later on, if the hiker wearing one of these sensors is lost, the other sensor can convey the last known (witnessed) location of the lost hiker. Furthermore, by exchanging the witness information that each sensor recorded earlier, the witness information is propagated beyond a direct contact between two sensors. To convey witness information to a processing center or a rescue team, access points are established. Whenever a sensor node is in the vicinity of an access point, all witness information stored in that sensor is automatically dumped to the access point.
From this system, our work adds a communication protocol, in which the sighting record is one of the messages. This protocol uses an initial handshake to optimize communication. Seven types of messages are created additionally to the sighting record to allow medium access control; filtering the data to be sent, reducing energy and time spent on transmission; active help request; and dynamic and transparent organization of groups.
After propagation tests were carried out in the forest environment, briefly described in Section 4, LoRa technology was chosen for the physical layer. This technology, besides presenting the best performance in the forest among all those tested, also has a very interesting feature: the possibility of communication using different spreading factors (SF) without interfering with each other. Thus, taking advantage of these characteristics, we developed a medium access control mechanism that uses a common signaling channel with SF12, and other channels for data exchange using the other SF. Each terminal announces its presence on the common channel by sending a beacon. Once two terminals enter each other’s coverage area, the handshake is initiated. One of the parameters agreed in the handshake is the SF of the channel to be used for data exchange. The choice is based on the quality of the received signal. However, before transmitting, the terminal listens to the chosen channel, in a mechanism similar to Clear Channel Assessment (CCA) to avoid collisions.
In CenWits, memory management is made using two parameters, the time of creating a record and the number of hops the record has already passed. However, these parameters are used only locally. In our project, these same parameters are used as metadata together with a new parameter that limits the maximum quantity of records, informed in the handshake, to describe the type of data that the terminal wishes to receive. So before sending records, the data is filtered, reducing time and energy spent on transmission. As communication is opportunistic, using the limited contact time efficiently is essential so that the data load offered to the network can be actually drained. Transmitting only the data that is requested also contributes to intelligent energy management, reducing battery consumption. Finally, a shorter transmission time also reduces channel occupation and, consequently, the probability of collisions.
The help request is an active signaling option on the part of the user who needs help. Thus, it is possible to attend to emergencies in which the visitor with problems, despite being in the coverage area of another node, is not visible or is not identified as being at risk, when in reality he is. So, he is more quickly rescued. Other types of emergencies continue to be attended when the visitor stops being reported in the sighting records of the other terminals, as in CenWits.
Finally, the proposed protocol allows the dynamic and transparent organization of groups. The creation of groups is foreseen in CenWits, but statically and requires its configuration before the visitors enter the trails. Dynamic group formation, without the need for visitor intervention, allows expanding its benefits in terms of optimized use of memory and battery, also reducing the total network load.
New fields and new types of messages are created, described in detail in Section 5.2, so that these improvements can be implemented, resulting in a new protocol different from the simple exchange of records proposed in CenWits.
The usage of LoRa, an important part of this proposal, also brings characteristics that make transmission in the forest a little less arduous. LoRa implements a modulation based on Chirp Spread Spectrum (CSS), which allows its operation with low values of received power, and resistance to interference. As propagation is extremely difficult in forests, especially in humid tropical forests as is the case at hand, these characteristics are very relevant. The specification of LoRa for the physical layer is the basis for the contributions described here.

3. Related Work

The use of positioning systems other than satellite-based has been increasing due to the growing demand for Location-Based Services (LBS), mainly in places where satellite communication is limited or unavailable. Those studies are important to the design of our visitor assistance system. On the other hand, the integration of tourism activities, environment preservation, and safety demands efficient communication systems. Miller et al. [8] discuss the importance of conservation tourism and protected destination system as a trade-off between healthy activity and economical investment for the host area. The authors suggest that a potential approach is the remote sensing data collected by individuals. Remote sensors/platforms with human components are interesting because humans have discretionary abilities influencing sensing that are not shared by other animals or platforms that are coupled with sensors.
A system capable of transmitting positioning data using LPWAN in outdoor environments is developed in [9] by Carbonés, demonstrating that it is feasible to locate a static terminal with an accuracy of 100 meters. The remote node sends data using the LoRaWAN protocol. Nearby gateways receive this data and forward the packets via UDP/IP to the server along with information about the received signal, such as the exact time the packet was received, the RSSI, the frequency, etc. The server then processes the data from different gateways and routes messages to the application using an MQTT client (Message Queuing Telemetry Transport) [10]. Finally, an algorithm running on the application server estimates the position using the Time Difference Of Arrival (TDOA) method.
In [11], Baharudin et al. present a long-range WSN for tracking the geographic location of moving objects. In the proposed system, the geographic location information of moving objects is collected with a GPS and sent through LoRa modules. The results demonstrated the usability of GPS technology to collect various additional data, such as speed and direction of travel, related to tracking the geographic location of moving objects. This work also reflects the high potential of LoRa technology as a reliable wireless communication interface for transmitting data from long-range sensors.
Bouras et al. [12] presented technology comparison scenarios for IoT concepts on rescue monitoring. The paper focuses on rescue monitoring, and the goal is the usage of Wi-Fi and LoRa for data transmission from IoT devices. A LoRa based gateway and Wi-Fi Router is used to connect the end-device. The collected data is sent to server applications as captured from installed sensors on the IoT modules and can be displayed to authorized users through a web or mobile application. The results through simulation and real-time experiments indicate that LoRa can be an ideal candidate for rescue monitoring.
Similar to the forest, maritime communications, presented by Sanchez in [13], are challenging due to the adverse transmission conditions and the lack of a pre-provided infrastructure. Communications in areas closer to the shore allow services as boat tracking and telemetry, data collection from moored monitoring systems, etc. The authors present a boat tracking and monitoring system based on LoRa and present the results extracted from a case of study where real-training sessions of Optimist Class sailboats have been monitored. A transmission range study is also presented.
Some studies estimate the location based on the RSSI (Received Signal Strength Indicator) values of the signal received from the infrastructure elements. In [14], RSSI is used in a system for locating small turtles on the Wildlife Institute of India. Four fixed points are used covering a square area, called by the authors of the environmental matrix. Based on the RSSI reading taken previously along the sides of the square, adjacent grid points are mapped. These points allow defining the limit values for the measured signal. Then, the RSSI values of signals sent by transmitters installed in the animals are compared by the fixed points, locating them inside the cells where the intersection occurs. Nevertheless, this approach is inefficient in the forest environment, since RSSI presents intense variability. The forest environment is very challenging due to the difficulties of propagating the electromagnetic wave. This difficulty becomes even more pronounced in humid tropical forests, such as the Brazilian Atlantic Forest.
Two works are very relevant for our purpose. They focus on locating visitors in natural parks, but none of them consider physical layer aspects. In the works described in [7,15], the authors introduce the concept of sighting registration as a way to subsidize the location of a sensor on a network with intermittent connection and its joint use with GPS, if available. The sighting record consists of storing the location data of the sensor when it contacts another sensor, together with the remote sensor identification. Both works only use one type of message, the sighting record. There is no handshake and, therefore, no metadata is produced to allow the filtering of records before transmitting them. If sensor memory is full, excess data received is discarded.
CenWits [7] is a search and rescue system in the wild, which uses RF transceivers carried by visitors, operating in the 900 MHz range. Each sensor receives its coordinates from location points, or a GPS, if available, and passes it on to other nodes during subsequent encounters. This information is uploaded at access points, distributed in several locations. This data, which consists of location history, can be used to estimate the location of a lost visitor. The system is designed for a network that provides only occasional connectivity. A prototype of CenWits has been implemented using Berkeley Mica2 motes, but the authors do not detail the type of location where the tests were performed, urban or natural.
The SenSearch project [15] is an outdoor GPS assisted personnel tracking system. SenSearch is based on CenWits [7] and works in much the same way, but with the exclusive use of GPS for determining the location, increasing the accuracy of the system. A study of the duty cycle is also made, reducing the periods of activation of the GPS and the transceivers to improve the use of the battery. The duty cycling may lead to a decrease in the localization accuracy of the system. This is discussed in the performance evaluation, using analytical, simulation, and experimental results. The experiments are held in urban areas, at the University of California-Merced campus and the University of Colorado-Boulder campus.
YushanNet [16] is another system for tracking walkers and the collected hiking traces can provide more precise information to rescue teams if there are hikers lost in the mountains. A demonstration is implemented in Yushan National Park, Taiwan. The park is a subtropical high mountain national park. The central ideas are based on [7,15], which apply a DTN technique and make use of opportunistic, ad hoc, and short-range wireless communications to disseminate data in a network. Hikers carry a matchbox-sized device, which consists of a ZigBee-based mote and a GPS receiver, and the device records its hiking trace, along with encounter information with other devices. In addition to supplying information about hikers’ whereabouts to park administrators and rescue services, the system allows family members to log on to a website and check that hikers have reached their planned destinations. The system design is demonstrated using a small-scale network scenario.
Also focused on natural environments, the WebPark [17,18] was a research and development project funded by the European Community, through the IST (Information Societies Technology) program, between October 2001 and September 2004. In the end, it was integrated into commercial service by the company Camineo (http://camineo.com/index.php?lang=en). The project aims to develop a series of LBS for visitors to natural and protected areas. It presents the concept and development of a service for searching for species information in a recreation area. WebPark uses caching in a client-server architecture to reduce the impact of the lack of a continuous connection to the Internet. This connection is made via the mobile data network GPRS (General Packet Radio Service), in which the coverage is intermittent in the considered area [19].
Public visits to parks may threaten the integrity not only of the visitor but also of the natural resources and the quality of the visitor experience. For providing visitor tracking data to the staff of conservation units, in [20], a computer simulation modeling application is presented. The goal is to deal with the visitation to the Arches National Park (Utah, USA) without damage to the environment. A travel simulation model of daily visitor use throughout the Park’s road and trail network and at selected attraction sites was developed. Simulations were conducted to estimate a daily social carrying capacity for Delicate Arch, one of its main attractions, and for the Park as a whole. In our project, similar information is generated, but we build a prototype to monitor the movement of visitors.
The proposal of Son et al. [21] is closely related to our work. It considers the forest environment, proposing a technological approach to fire detection. The proposed forest fire surveillance system is designed for the mountains of South Korea. It consists of a wireless sensor network (WSN), a middleware, and a web application. The sensors measure the temperature, humidity, and detect smoke. The middleware program and the web application analyze the data and information collected, generating a real-time alarm when the fire occurs.
Finally, the CenWits [7] project is extremely relevant for this work because it served as a basis for the elaboration of the system proposed here. Nevertheless, the location application proposed in this project used to provide the visitor monitoring and security service adds new types of messages and fields in its headers to allow for improvements and new features. These adjustments allow a faster service to visitors at risk, better media access control, efficient use of wireless communication technology and the resources of mobile terminals.
In the present work, we designed an application for visitor assistance within the rain forest environment. LoRa technology is used to exchange data with multiple hops, using DTN techniques, allowing the collaborative geolocation within the natural environment, using wearable terminals and access points, named communication totems. Our work builds upon the state of the art, investigating the use of Low Power Wide Area Network (LPWAN) technology in the forest and proposing appropriate communication protocols for the monitoring and rescuing of people visiting those natural parks.

4. Environment

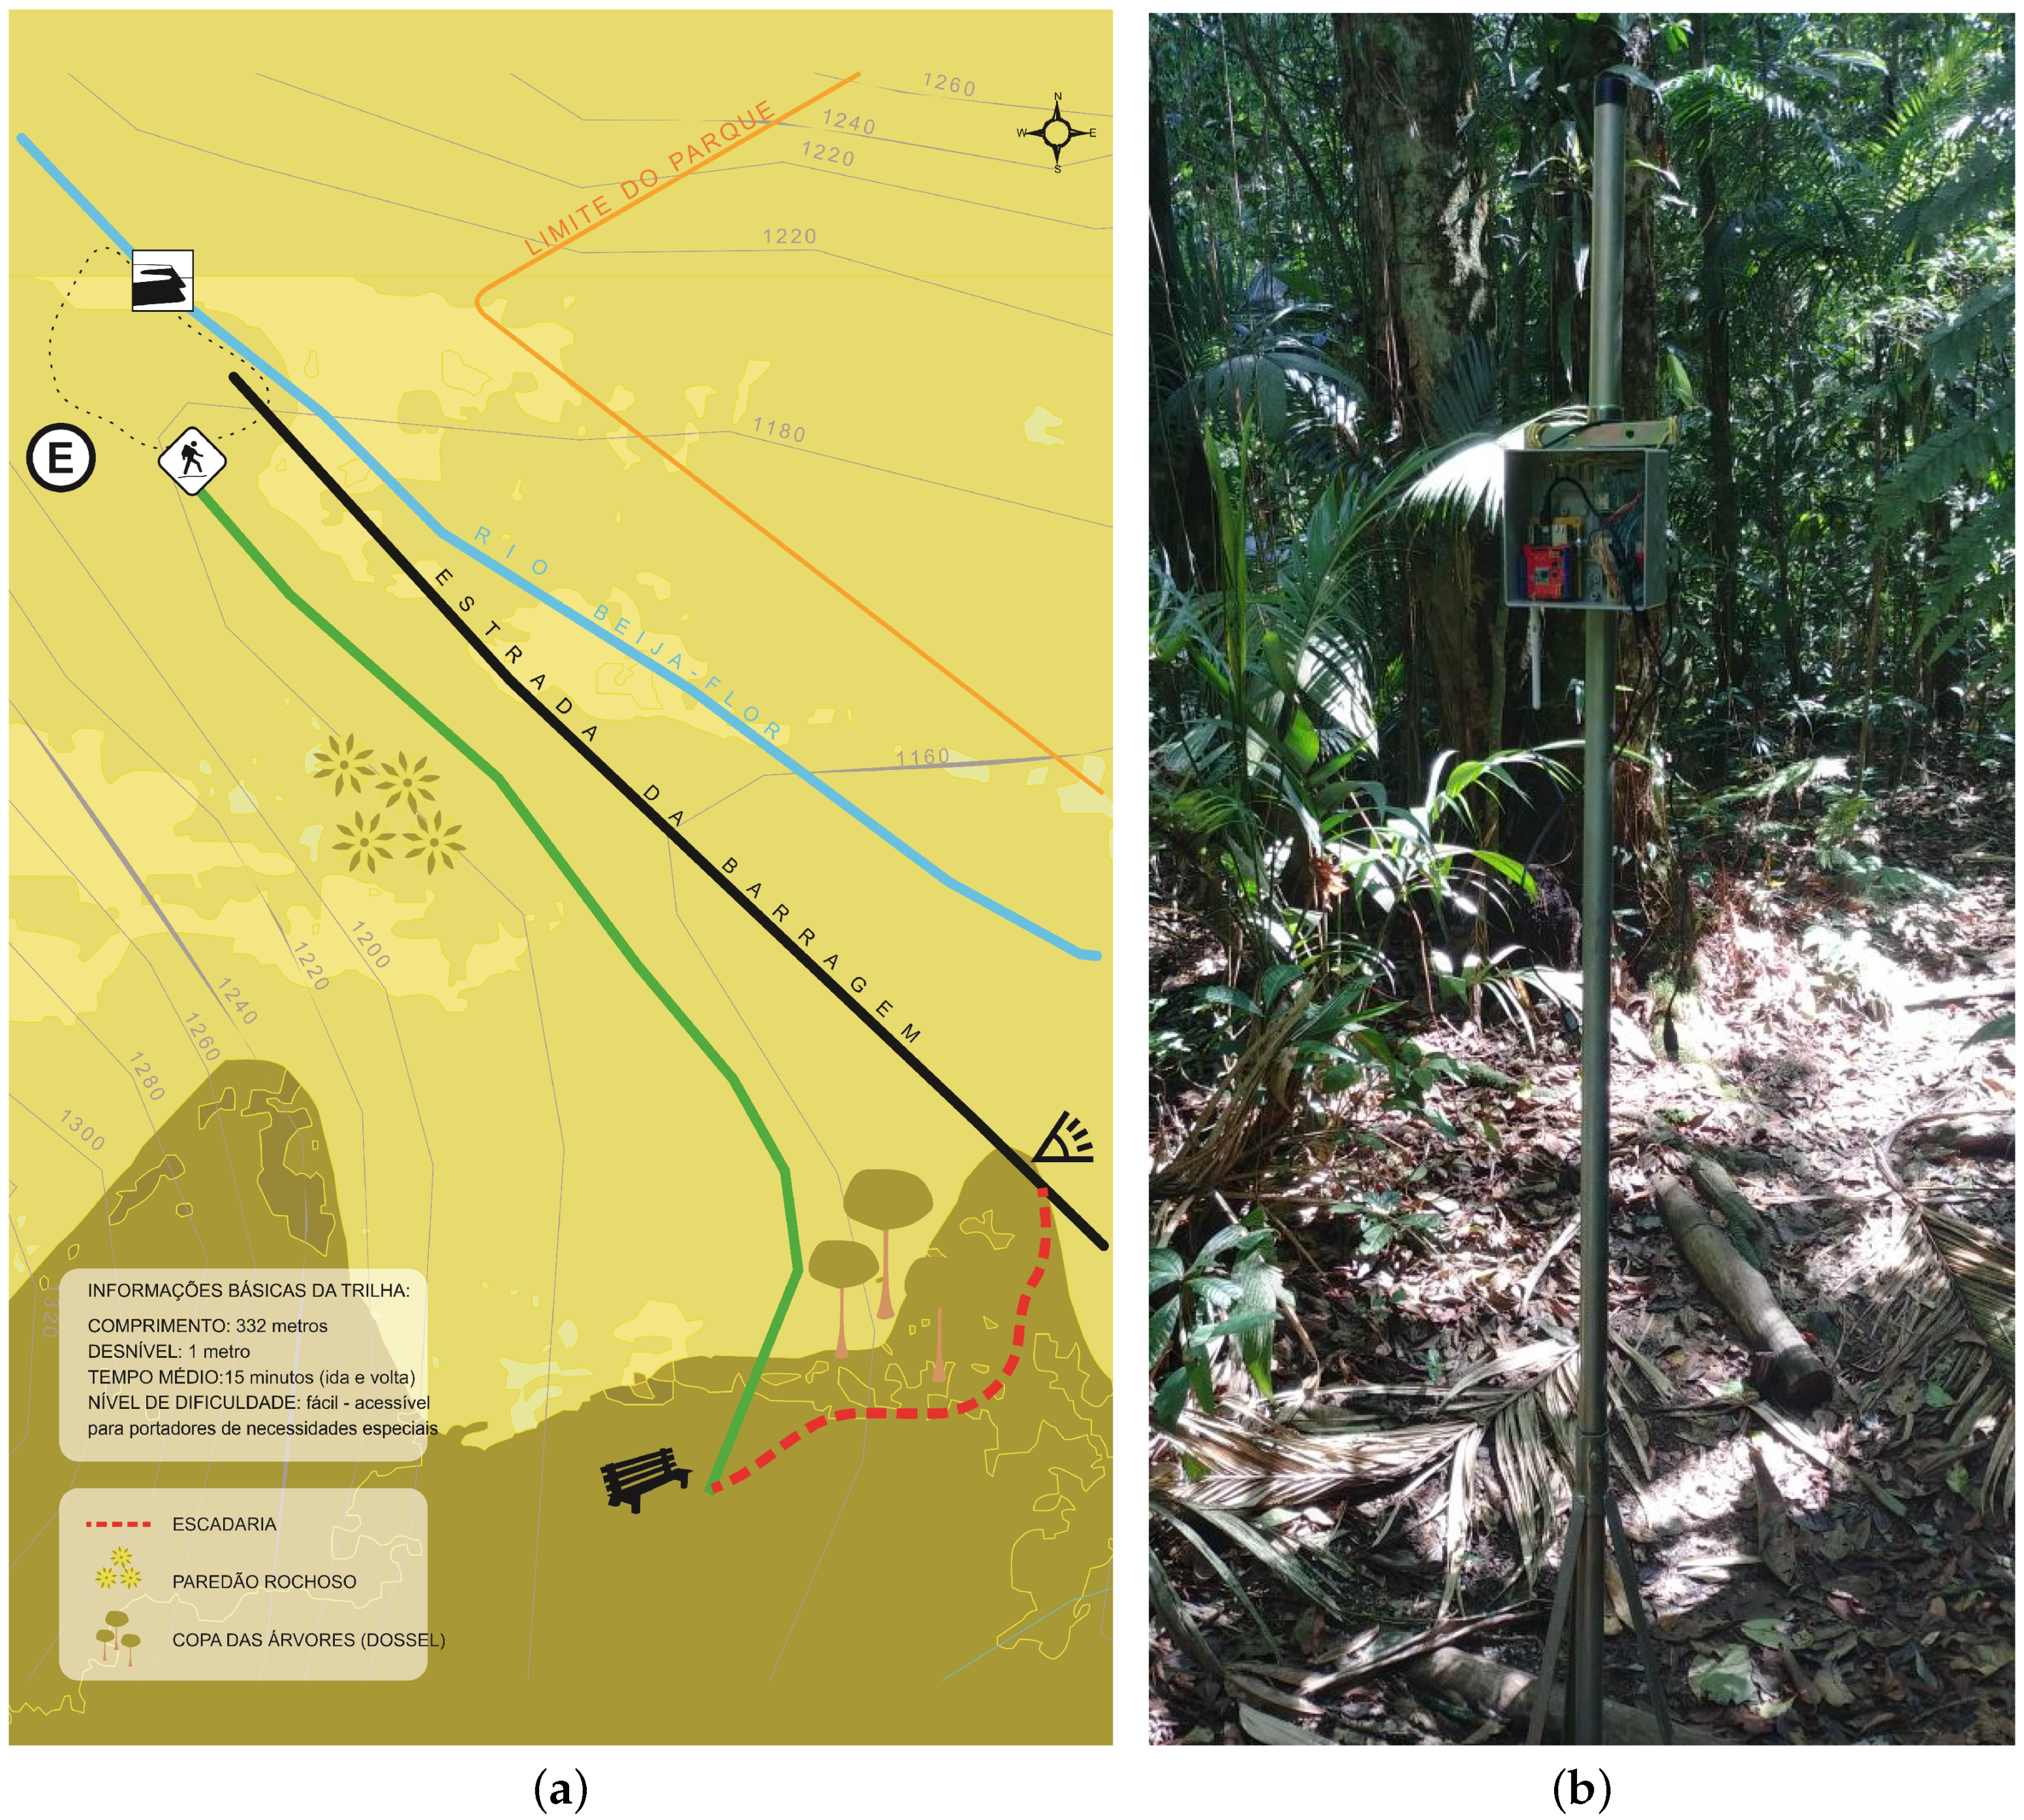
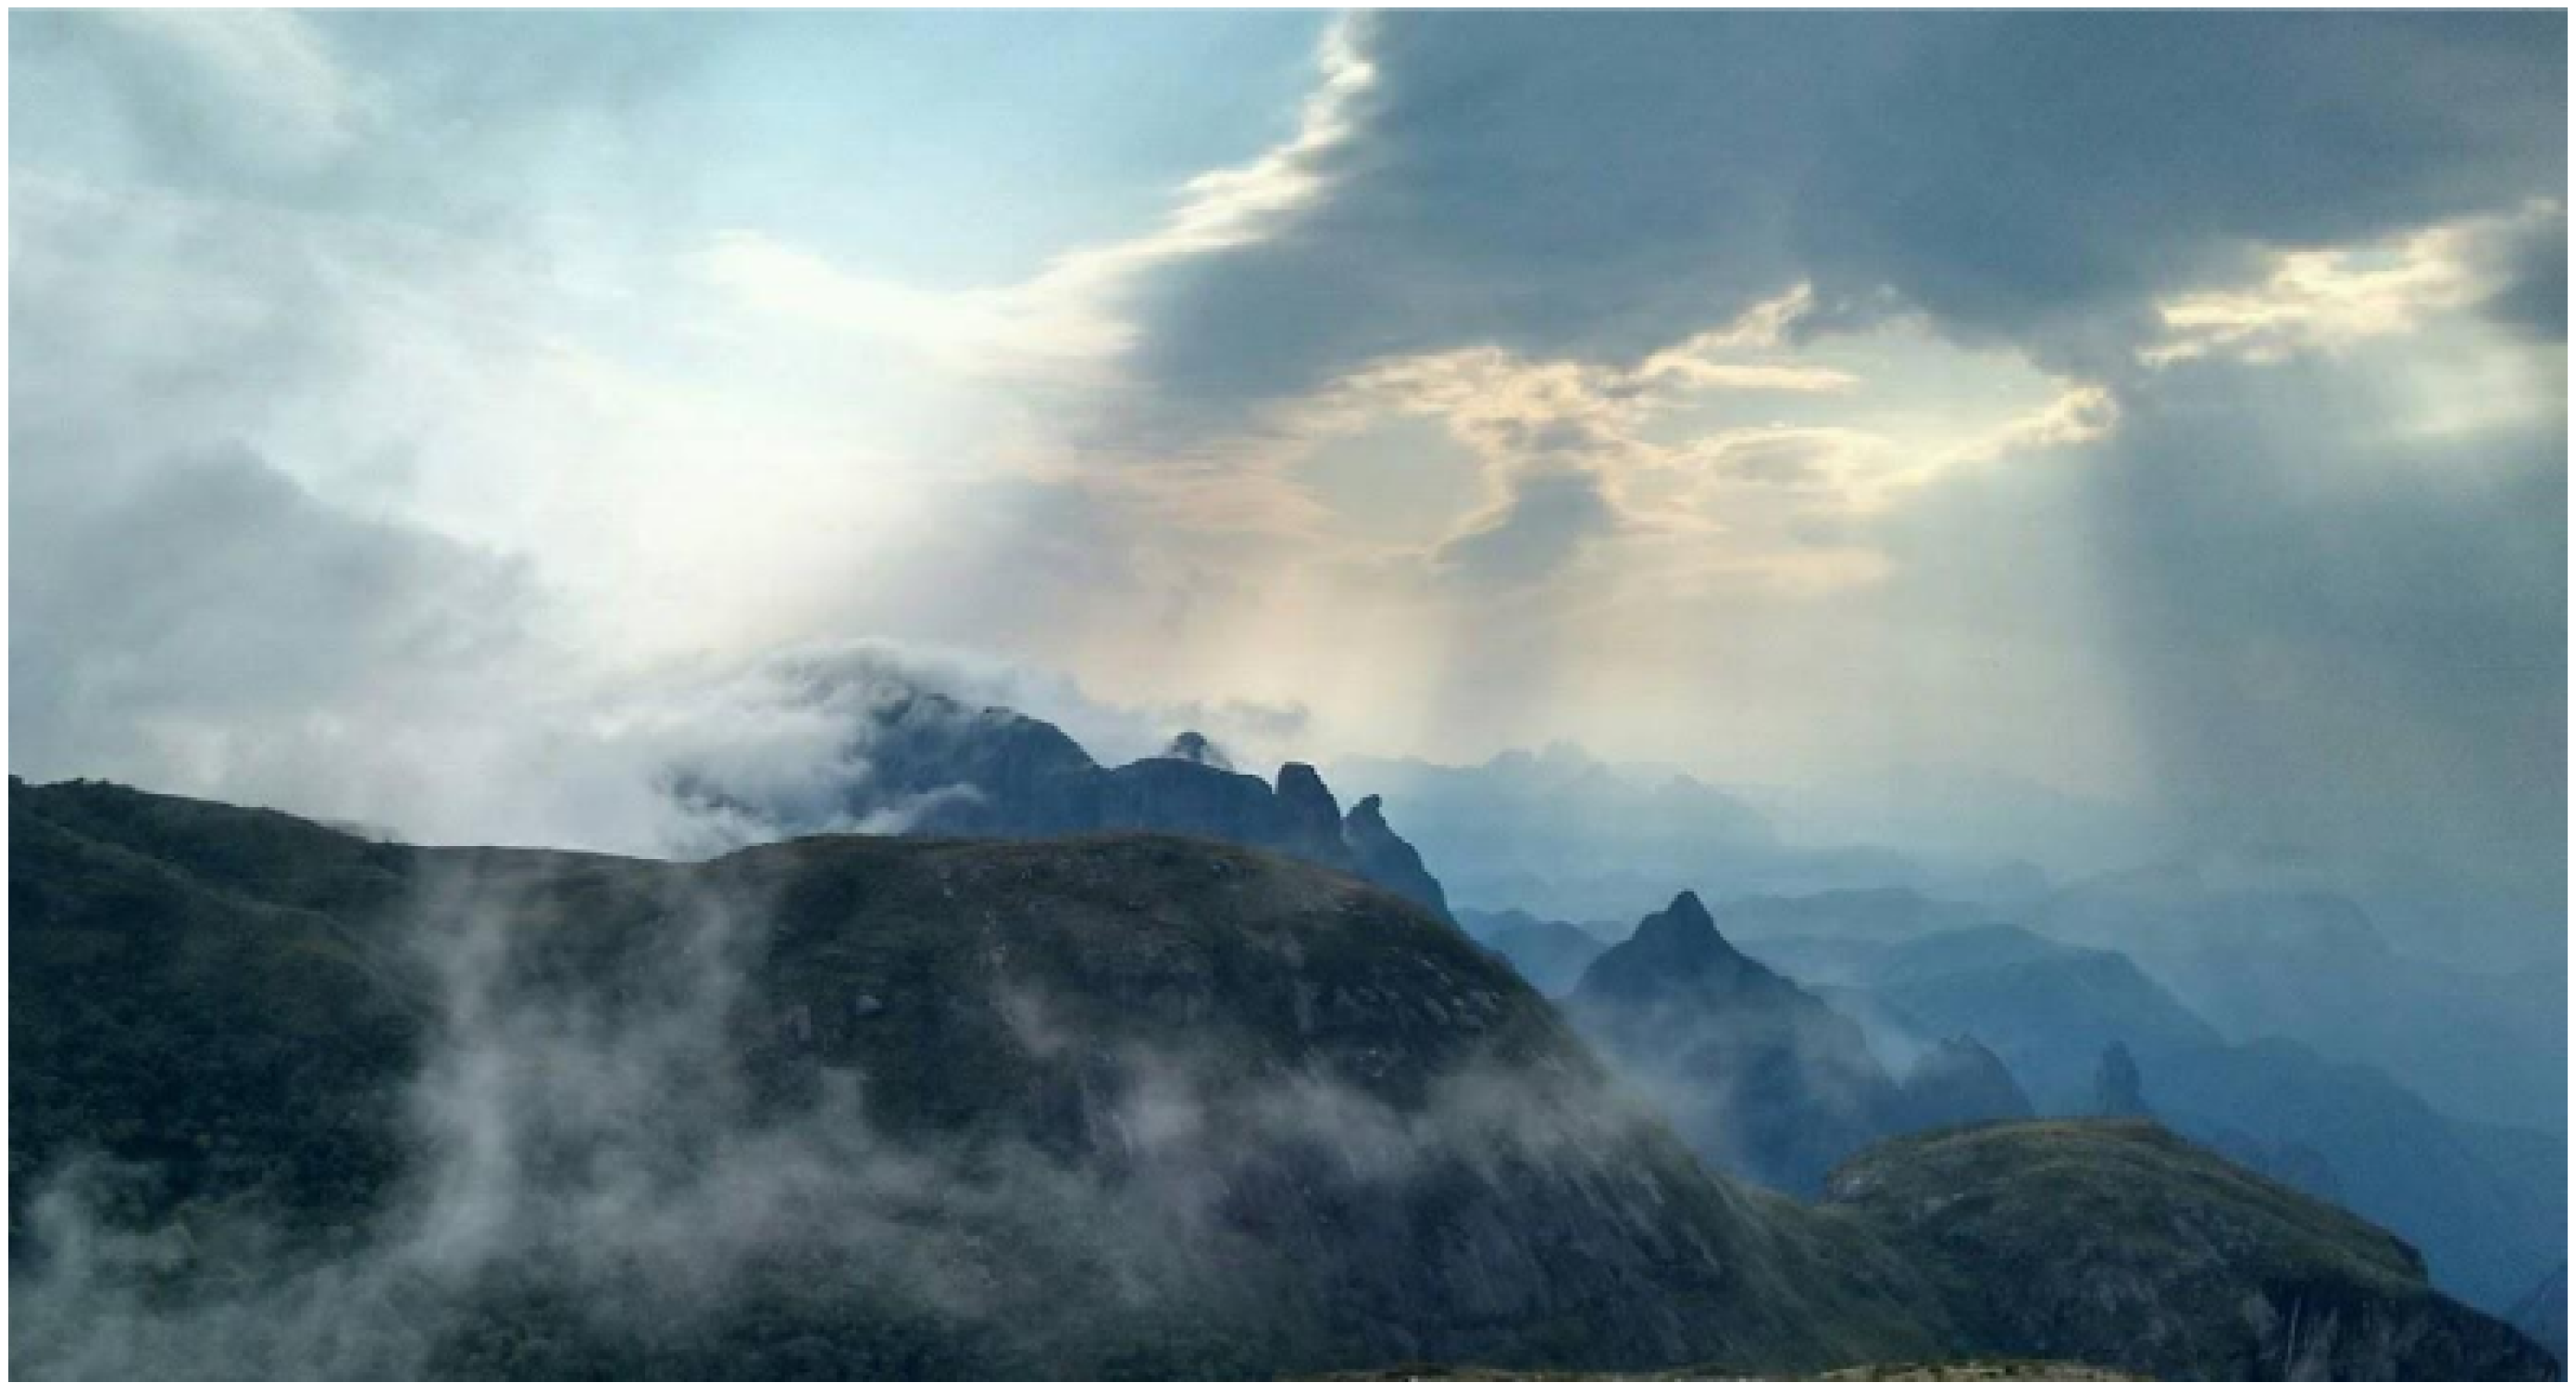
The forest is an environment hostile to propagation. From the viewpoint of radio signals, the forest is a random medium with many discrete scatters, such as the randomly distributed leaves, branches, and tree trunks. Radio waves propagating in the vegetation naturally experience multiple scattering, diffraction, and absorption of radiation. These different propagation mechanisms, when combined, result in severe fading of the received signal [22]. Figure 1a,b show the vegetation and the trail where the experiments were done.
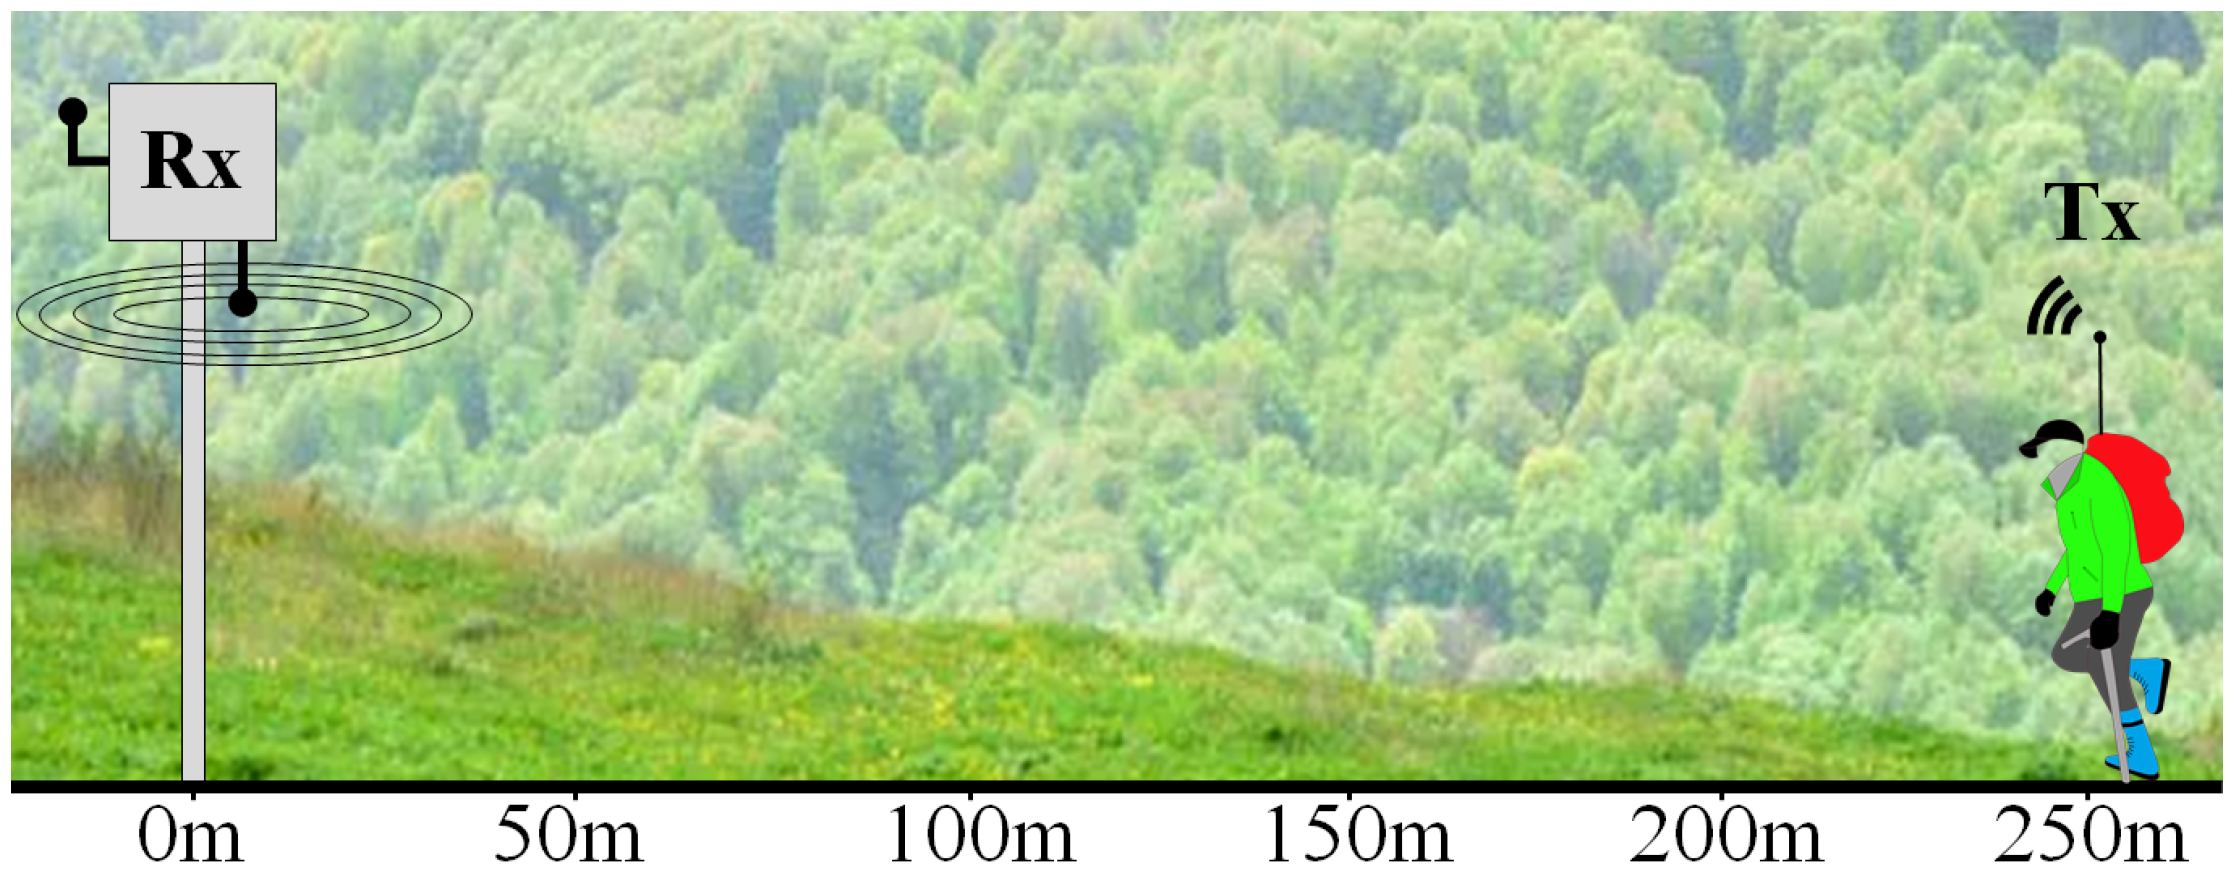
Large- and small-scale fading are related to slow and sudden variations in the signal envelope, respectively. Large-scale fading, or shading, is caused by path loss and slow, predictable variations around the average. Small-scale fading refers to sudden, fast, and small displacement attenuation. The main cause of small-scale fading is the occurrence of the multipath phenomenon, which consists of overlapping different versions of the same signal with different phases at the receiver. The composition of these signals can severely attenuate the received signal, reducing the received power and signal-to-noise ratio (SNR), and thereby reducing the link range and packet delivery ratio. As a result, the maximum range of LoRa in the forest, considering SF12, the most robust spreading factor, is reduced from several kilometers in the open air to just 250 m.
To evaluate the feasibility of LoRa in the rain forest, a measurement campaign was carried out to identify the behavior of a radio link within this environment. We have performed practical experiments with LoRa at 915 MHz. Two prototype nodes based on Arduino microcontrollers are used. Figure 2a shows a map of the test site, and Figure 2b shows the prototypes. This experimental equipment is summarized in Table 1, and its configuration parameters are listed in Table 2.
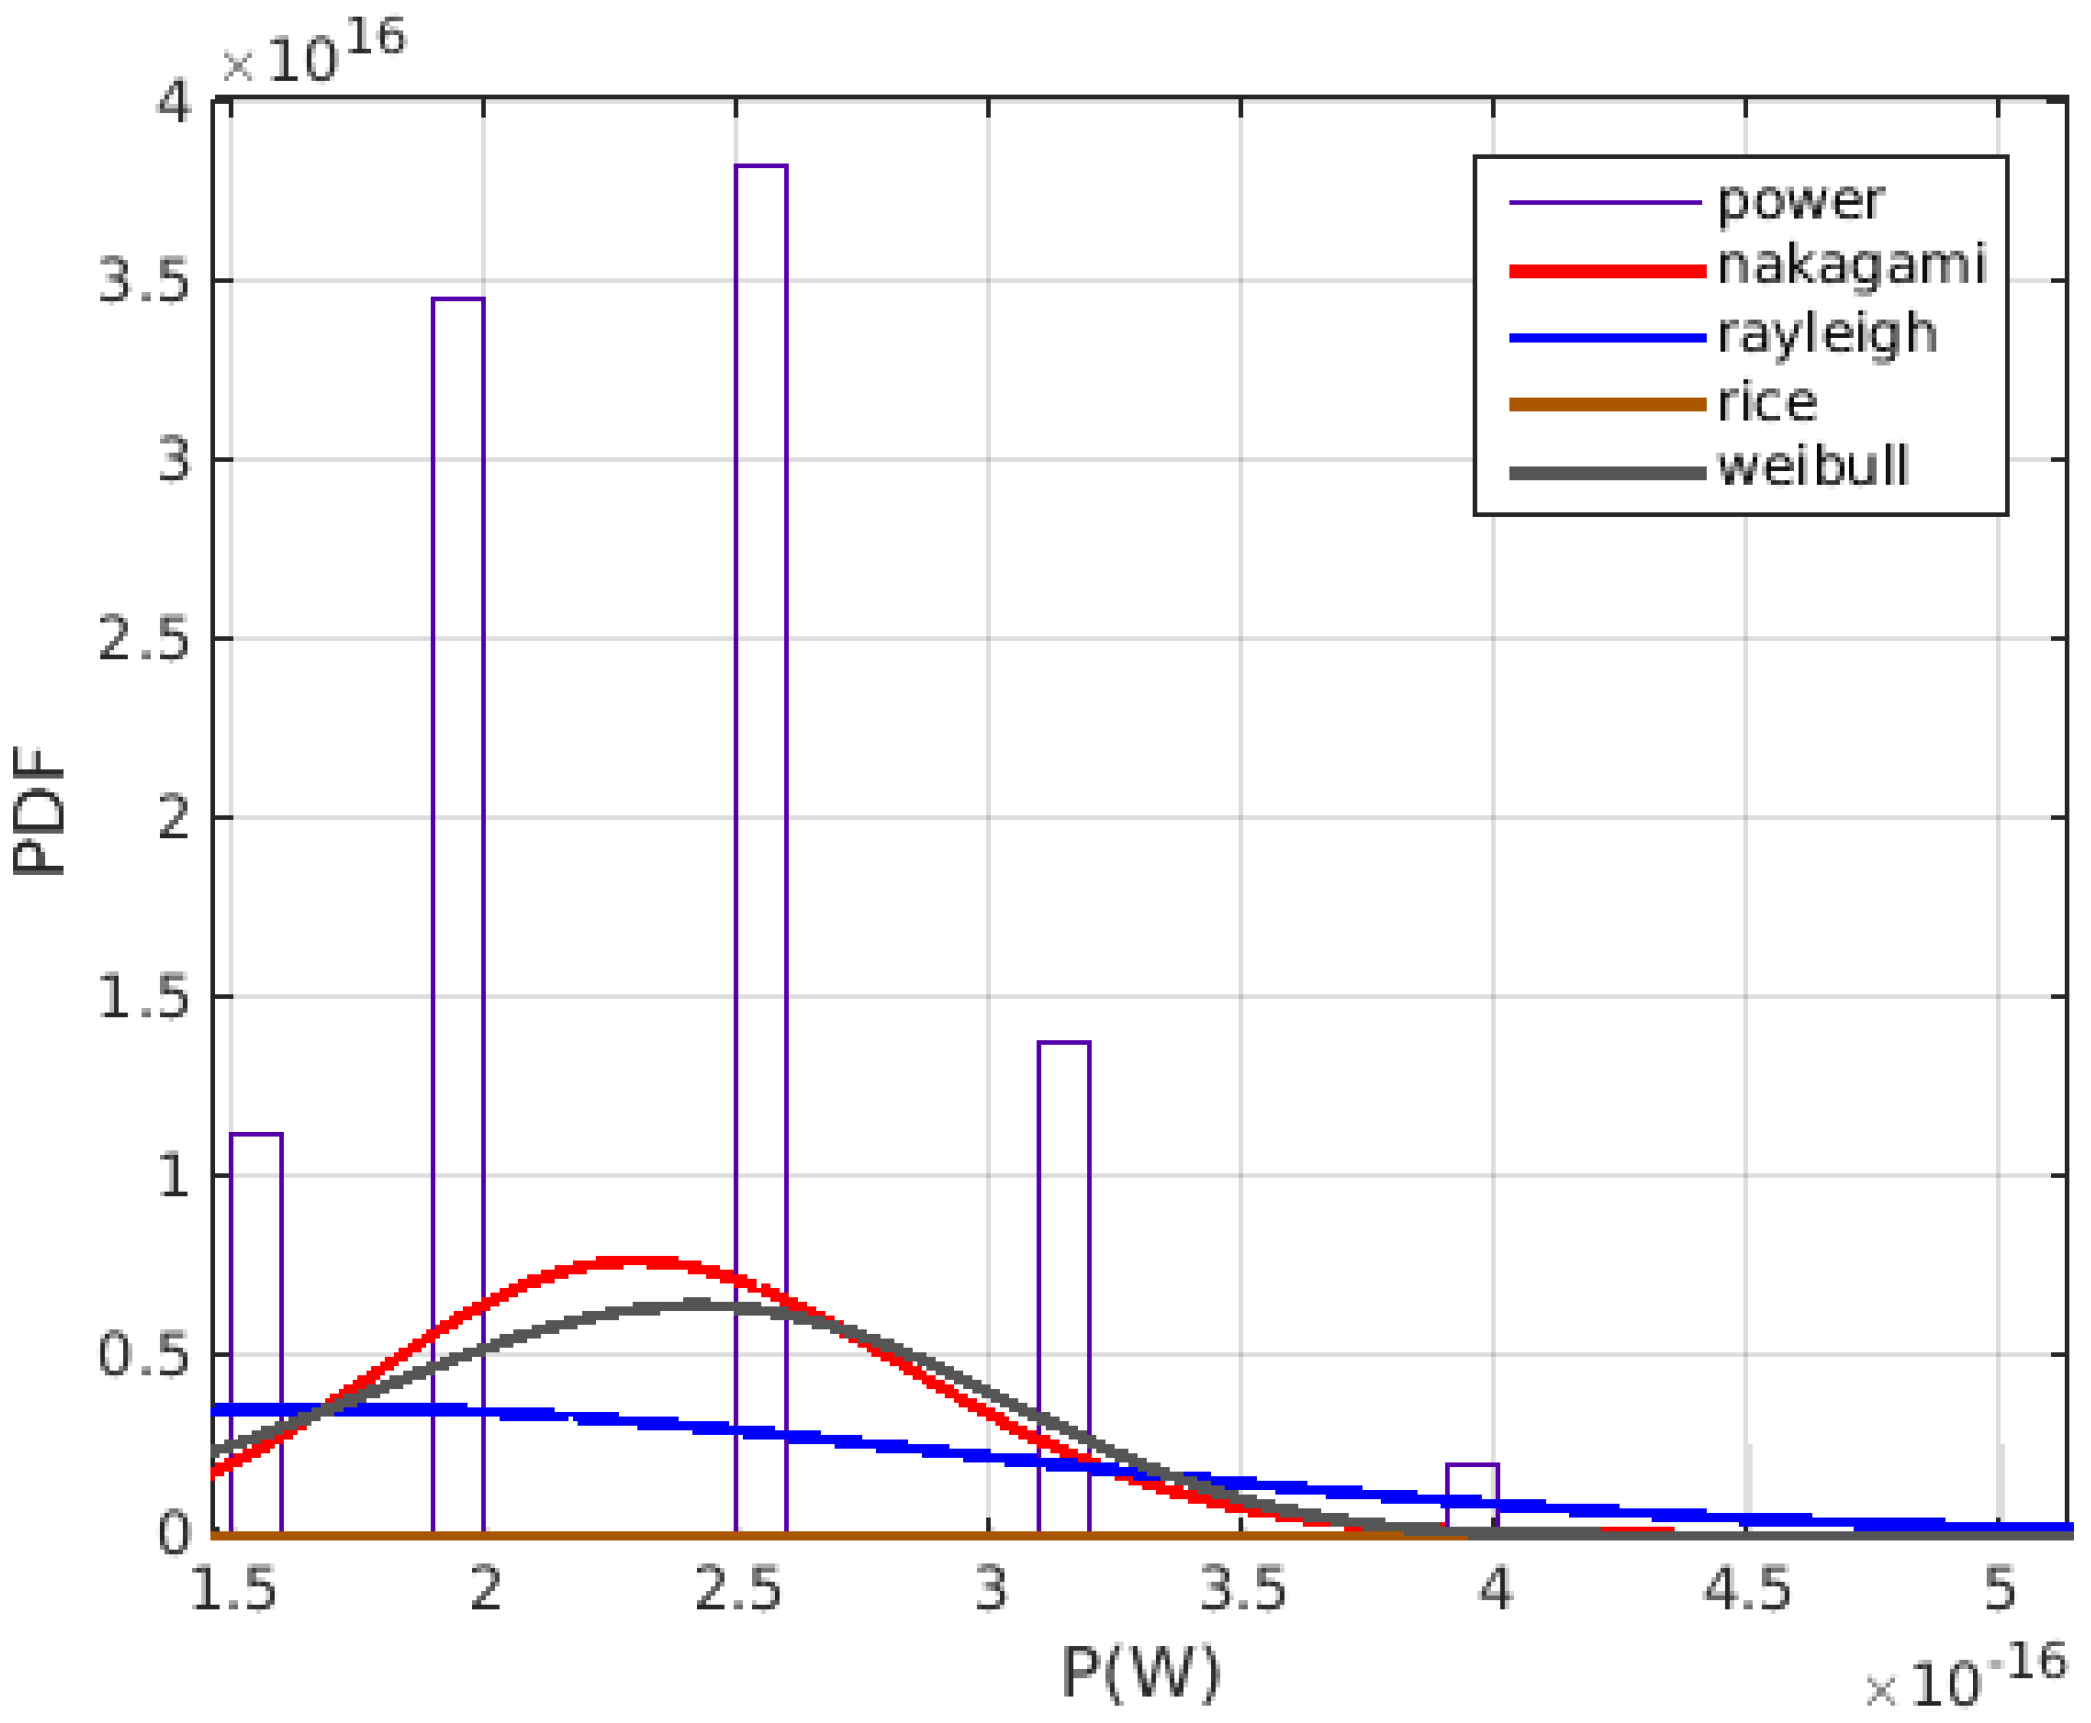
The Log-distance distribution is widely used to model large-scale fading [23]. To describe the behavior of the signal considering only large-scale fading, it is necessary to eliminate local variations caused by small-scale fading. For this, the averages of the various measurements performed were used. This behavior can be seen in Figure 3, which shows the RSSI histogram and the Probability Density Function (PDF) for the measured data.
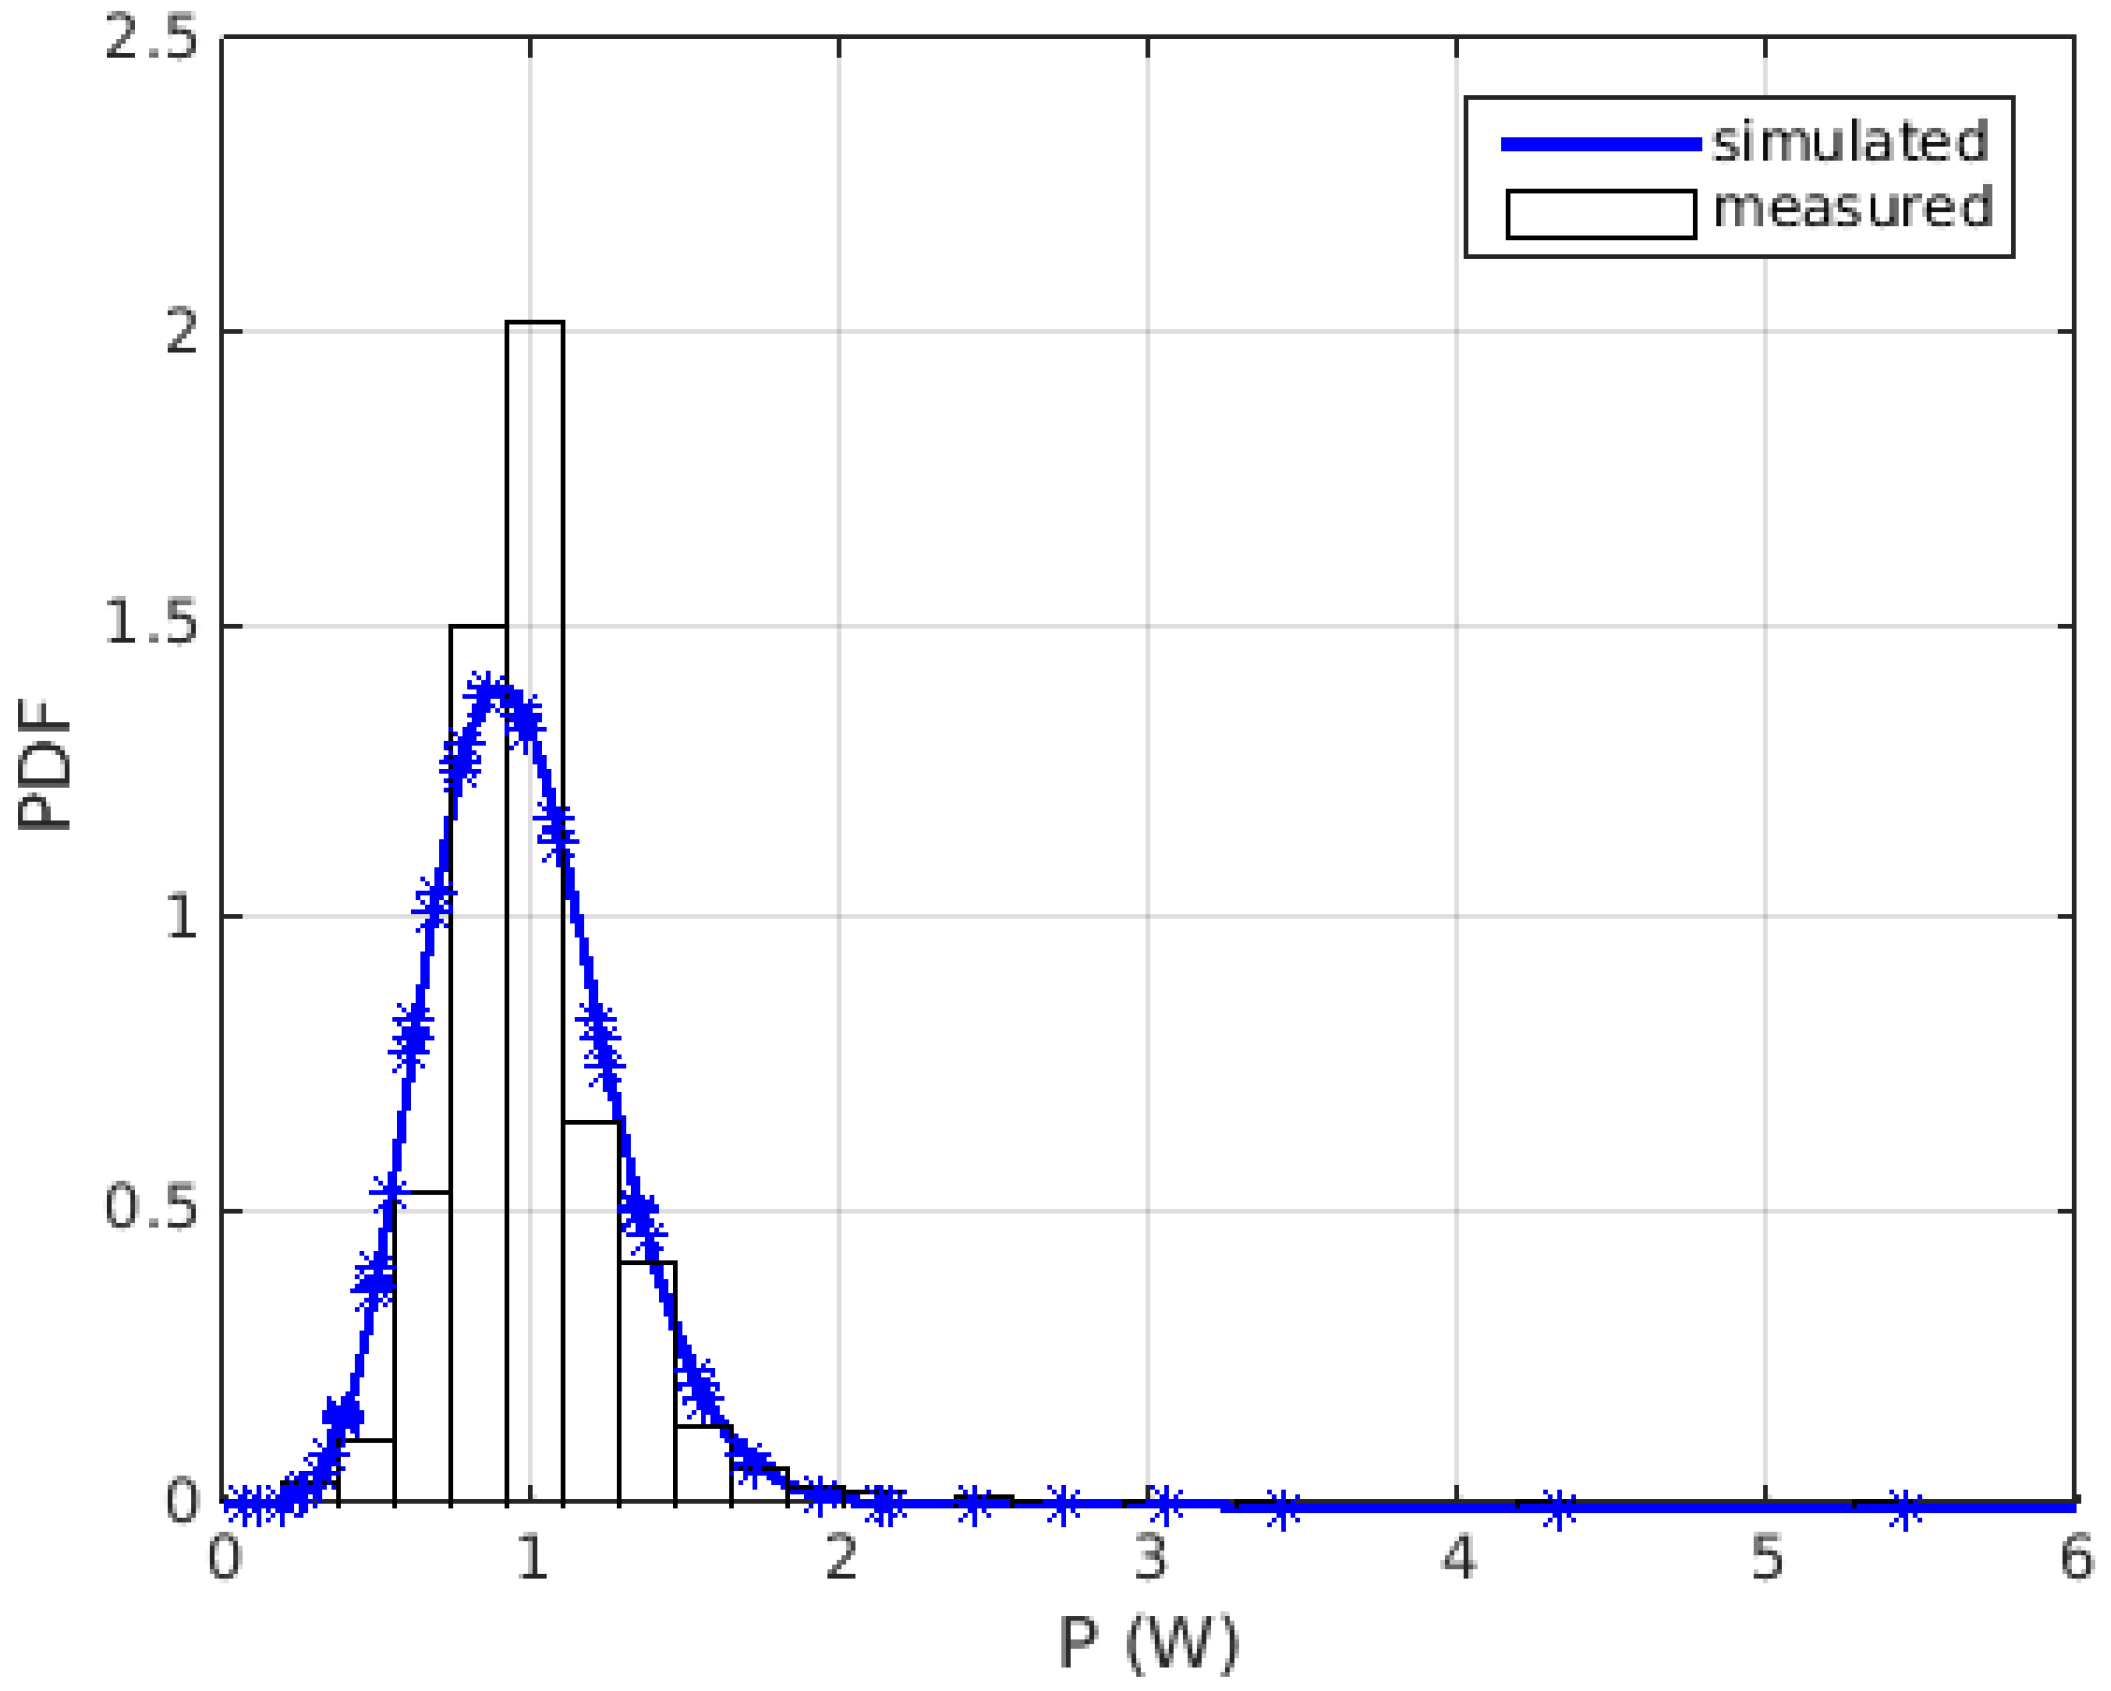
Figure 4 shows the RSSI histogram and the PDF for small-scale fading estimated using instantaneous power measurement. We observe that the Nakagami-m [24] distribution is the one that best fits forest propagation.
Signal attenuation in the forest environment is composed of small-scale fading superimposed on large-scale fading. In this situation, the PDF of the envelope can be considered as the composition of two probability distributions, and calculated by their convolution.
Although the Log-distance distribution is the best fit to large-scale fading, its combination with multipath model distributions results in open formulas. This resulting formulation is difficult to use in calculations, such as bit error rate, diversity schemes, outage probability, and coverage prediction, according to [25]. The Gamma distribution is then proposed as an approximation to the Log-distance distribution.
Figure 5 presents the composite probability density function, optimized for the data obtained in the field. Power data were used, normalized by the local average at each measurement point, comprising a total of 10,893 samples. This composition of the two types of attenuation is used to generate power levels in the receiver, in the simulation of the proposed network. The goal of the simulation is to extrapolate the results of the prototype measurements to a larger number of nodes, considering a realistic positioning of totems in the trail.

5. The Proposed Visitor Assistance System

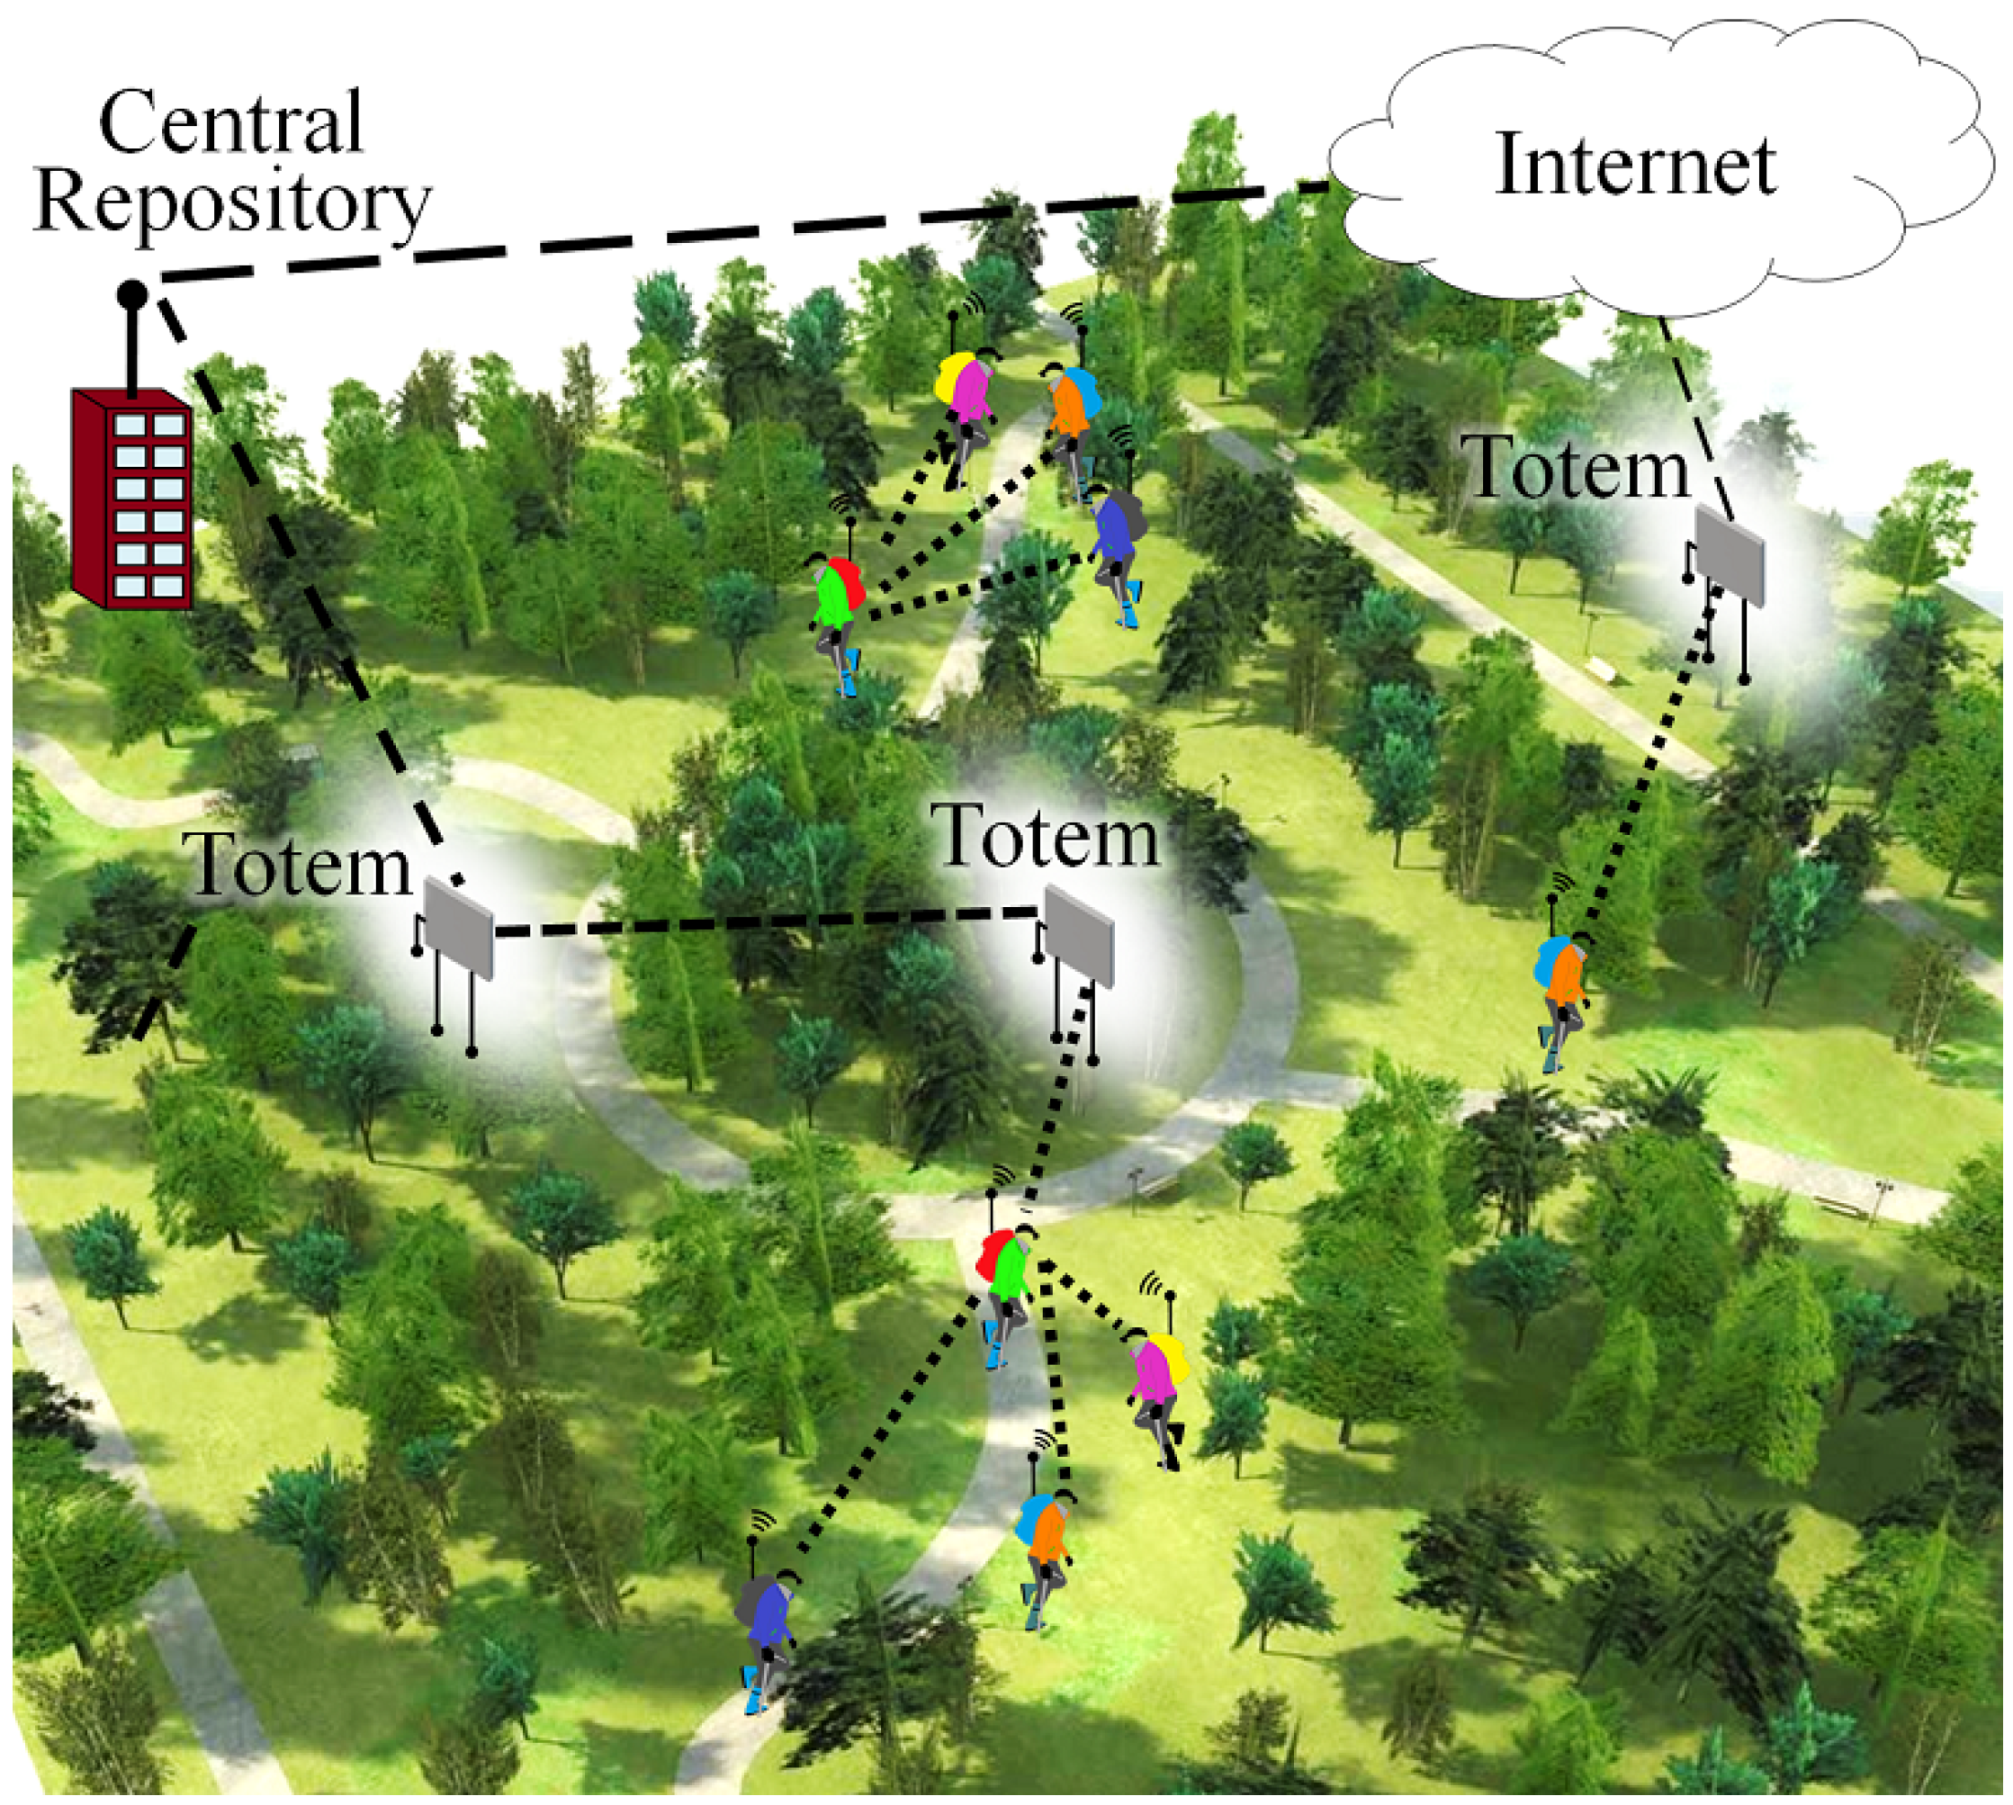
In this work, communication within the forest is used to support a location monitoring system for visitors to an environmental conservation unit. The proposed monitoring system is comprised of a sparse infrastructure of wireless access points, called totems, and wearable mobile terminals, used by visitors, as well as a location application and a protocol for message exchange between devices. The proposal includes a DTN composed of fixed and mobile points. The mobile points are the terminals of the visitors who, operating collaboratively, forward the packages between themselves and to the fixed points, the totems. The totems function as data kiosks, concentrating information and interconnecting with the park’s central server and the Internet. Figure 6 presents a network scheme, showing the communication between totems and mobile terminals, as well as the communication of mobile terminals with each other.

5.1. Infrastructure

Totems communicate with mobile terminals using LoRa technology, developed by Semtech for LPWAN [4,26]. LPWAN is designed to connect equipment over long distances, with a low transmission rate and low power consumption. They are therefore suitable for the use of battery-operated terminals, small lightweight and low cost, as required in this work. Only the physical layer (PHY) of LoRa is used, operating at the frequency of 915 MHz. LoRaWAN specifies a star network topology, with the gateway being the central node. Thus, since point-to-point communication between terminals is required in our project, LoRaWAN is not used.
The LoRa PHY uses Forward Error Correction and Chirp Spreading Spectrum modulation (CSS) [6], which varies the frequency without changing the phase between adjacent symbols. The Spread Factor (SF) defines the ratio between bit rate and chirp rate. LoRa specification defines six different spreading factors (SF7, SF8, SF9, SF10, SF11, and SF12), which allow the formation of orthogonal channels. Links with different spreading factors do not collide [3]. The SF defines the symbol duration and, together with the Bandwidth and Code Rate (CR) parameters, defines the data transmission rate. The CR defines how many bits are used for redundancy in the message, to perform error recovery. A higher SF increases the sensitivity of the reception threshold in terms of power, but also increases the duration of symbols and, as a consequence, decreases the transmission rate of the link [27].
Totems announce their coordinates through beacon messages and serve as communication gateways to mobile terminals, forwarding their data to the cloud. Figure 7 illustrates the scenario. We assume that communication between totems and the cloud will use any available means: cellular, Wi-Fi, etc. The specification of this communication is beyond the scope of this article.
The fixed infrastructure must be reduced, favoring the low cost of the whole system and considering that the area to be covered by the monitoring system is typically large—ecological conservation units. The totems must be positioned in places that allow optimizing the coverage, considering the signal on the trails, the attenuation caused by the height difference between the antennas and the risks of each stretch of the trail.
Nevertheless, the difficulties of propagation in the forest inevitably lead to a smaller radio range. Thus, the communication network in the forest will present connectivity gaps. Therefore, the proposed monitoring system is based on a DTN composed of fixed and mobile points. The mobile points are the visitors’ terminals which, operating collaboratively, forward packets between themselves and to the fixed points, the totems. Figure 8 shows mobile terminals moving toward each other and exchanging records. Totems perform as data kiosks, concentrating information and interconnecting with the park’s server. Packet forwarding between DTN nodes is done opportunistically when terminals have contact with each other or with a totem.
To keep the solution as simple as possible, we do not employ the whole DTN protocol stack [28], or the bundle protocol [29], in the proposed monitoring system. Instead, the main DTN techniques are implemented directly on top of LoRas physical layer, saving memory and processing resources. The terminals exchange data with each contact, using a store-carry-forward approach. The DTN concept of custody transfer is partially implemented since it only occurs in the communication between a mobile terminal and a totem. Mobile terminals exchange location data periodically with the totems and with each other, allowing the visitor’s movement to be monitored.

5.2. Protocol and Application

The proposed application is monitoring the visitor’s location, aiming at faster and more effective action by search and rescue teams. This monitoring is done transparently, without disturbing personal experience in the natural environment. The idea is that a wearable terminal, in the shape of a bracelet or key chain, sends location data periodically. Location can be obtained through a GPS, a totem or by exchanging location data in collaboration with other visitors.
Mobile terminals establish contact with each other when entering their coverage area, approximately a circle with a diameter of 500 m for LoRa SF12. Location data must be exchanged during this contact time, which depends on the speed of the person carrying the device. Considering the experimental measurements presented in [30], the shortest average contact time, which occurs when visitors are trained hikers, is about 2.5 min. During this interval, the terminals must discover each other’s presence, negotiate communication parameters and exchange records of location information. Every minute, the terminal emits a beacon that allows the start of communication with another node. This period keeps battery consumption low while still allowing at least two communication opportunities during each contact interval. The opportunity must not be unique as the transmission is unreliable and the beacon may be lost. The beacon contains the terminal identification, its last known position, and a timestamp associated to this position. This information is used to estimate their location and travel.
The location application used to provide the visitor monitoring and security service is based on [7,15]. They propose to estimate the visitor’s location through the exchange of messages between RF sensors. The concept of witness sensor is presented, which makes a sighting record to store and transmit location information, aiming to describe the movement of other sensors. When people meet along the way, the sensors become witnesses to each other and exchange their location data, which will be sent to a central repository via an access point. This data, which makes up the history of previous locations of various sensors, can be used to estimate their locations.
Our application runs directly on the physical layer, using its own medium access control mechanism. This simple mechanism is a variation of CSMA, with Clear Channel Assessment (CCA) considering the use of different spreading factors. Beacons are sent using SF12, but sighting records are exchanged using another SF, which allows the highest possible baud rate. The choice of SF is made based on the RSSI and SNR of the received beacon. If the measured values of RSSI and SNR are within the threshold that allows operation for a given SF, it is chosen. If not, another higher SF is evaluated. The lowest possible SF is always chosen to increase the transmission rate. The exception is SF7, used only for communication within groups.
Different from [7,15], the proposed system allows an active help request by the user. This is done by creating two new message types and adding a field, the help flag. The messages are the help request and rescue notification, identified by the help flag. These adjustments allow the faster rescue of the endangered visitor. There is no need to wait for a long time for the problem to be noticed through the absence of data from this specific visitor in other visitors’ records.
Additionally, groups composed of visitors who travel together are used to avoid the continuous exchange of messages between terminals that are constantly within range of each other. Only the group leader sends messages on behalf of other terminals in the group. A new message type and two new fields are also created to allow the dynamic formation of groups and the election of their leader. The choice of a leader is based on the participants’ available battery capacity.
Figure 9 shows the messages used in the proposed protocol. The following fields may be present depending on the message:
  • Type (4 bits)—indicates the message type. Currently, eight messages are defined, leaving space for future extensions. The defined types are:
    • help request—actively sent by the user at risk, requesting help, without the need to wait for processing other visitors’ records;
    • rescue notification—reports that there is a rescue team on the way, send by paramedics at the park headquarters;
    • totem beacon—announces the presence of a totem and its coordinates as a reference for the visitor;
    • totem ack—confirms receipt of records sent by the terminal;
    • terminal beacon—announces the presence of a mobile terminal, its most recent coordinates, obtained via GPS or received from a totem, and a timestamp associated to this last known position;
    • request/acceptance of records transmission—used during the initial handshake, to request/accept the transmission of records, as well as to inform the parameters to be used in the transmission and avoid transmitting unwanted records;
    • record—stores sighting data from another terminal or update position of the own terminal, used to estimate the displacement of each visitor;
    • group leader election—message used for group leader election.
  • Help Flag (HF, 4 bits)—informs if the visitor requested for help.
  • ID (mobile or totem) (15 bits)—an integer that identifies the totem or the mobile terminal. The first addresses are fixed and assigned to totems; the others are assigned on demand to terminals. Terminal addresses should remain unique to allow ubiquitous identification of visitors throughout the area during the monitored interval, set to 24 h. If the terminal is not located within the time limit within this range, rescue will be sent even without request.
  • Acknowledge (ACK, 1 bit)—indicates that it is a confirmation message for receiving records. If the records were received with errors or only partially, this field has a value of zero.
  • Group Flag (GF, 1 bit)—indicates if the terminal issuing the message is a group leader. Together with the mobile ID of the leader forms the group ID.
  • Record Time (16 bits)—records the moment of contact with another mobile terminal.
  • Latitude and Longitude (24 bits each)—stores the last coordinate obtained, accurate to 2.4 m. Geographic coordinates can be obtained by GPS every minute, if the GPS signal is available, or received from a totem when the mobile terminal is within range. The GPS receiver used in the experiments has an accuracy of 2.5 m [31].
  • Location Time (16 bits)—stores the moment the coordinates were obtained.
  • Hop Count (4 bits)—contains the number of times the message was forwarded, incremented with each transmission.
  • Max Records (11 bits)—reports the maximum number of sighting records that the terminal accepts to receive or received by a totem.
  • Battery (4 bits)—reports an estimate of battery life.
  • Channel (CH, 2 bits)—identifies the LoRa spreading factor to be used for record exchange.
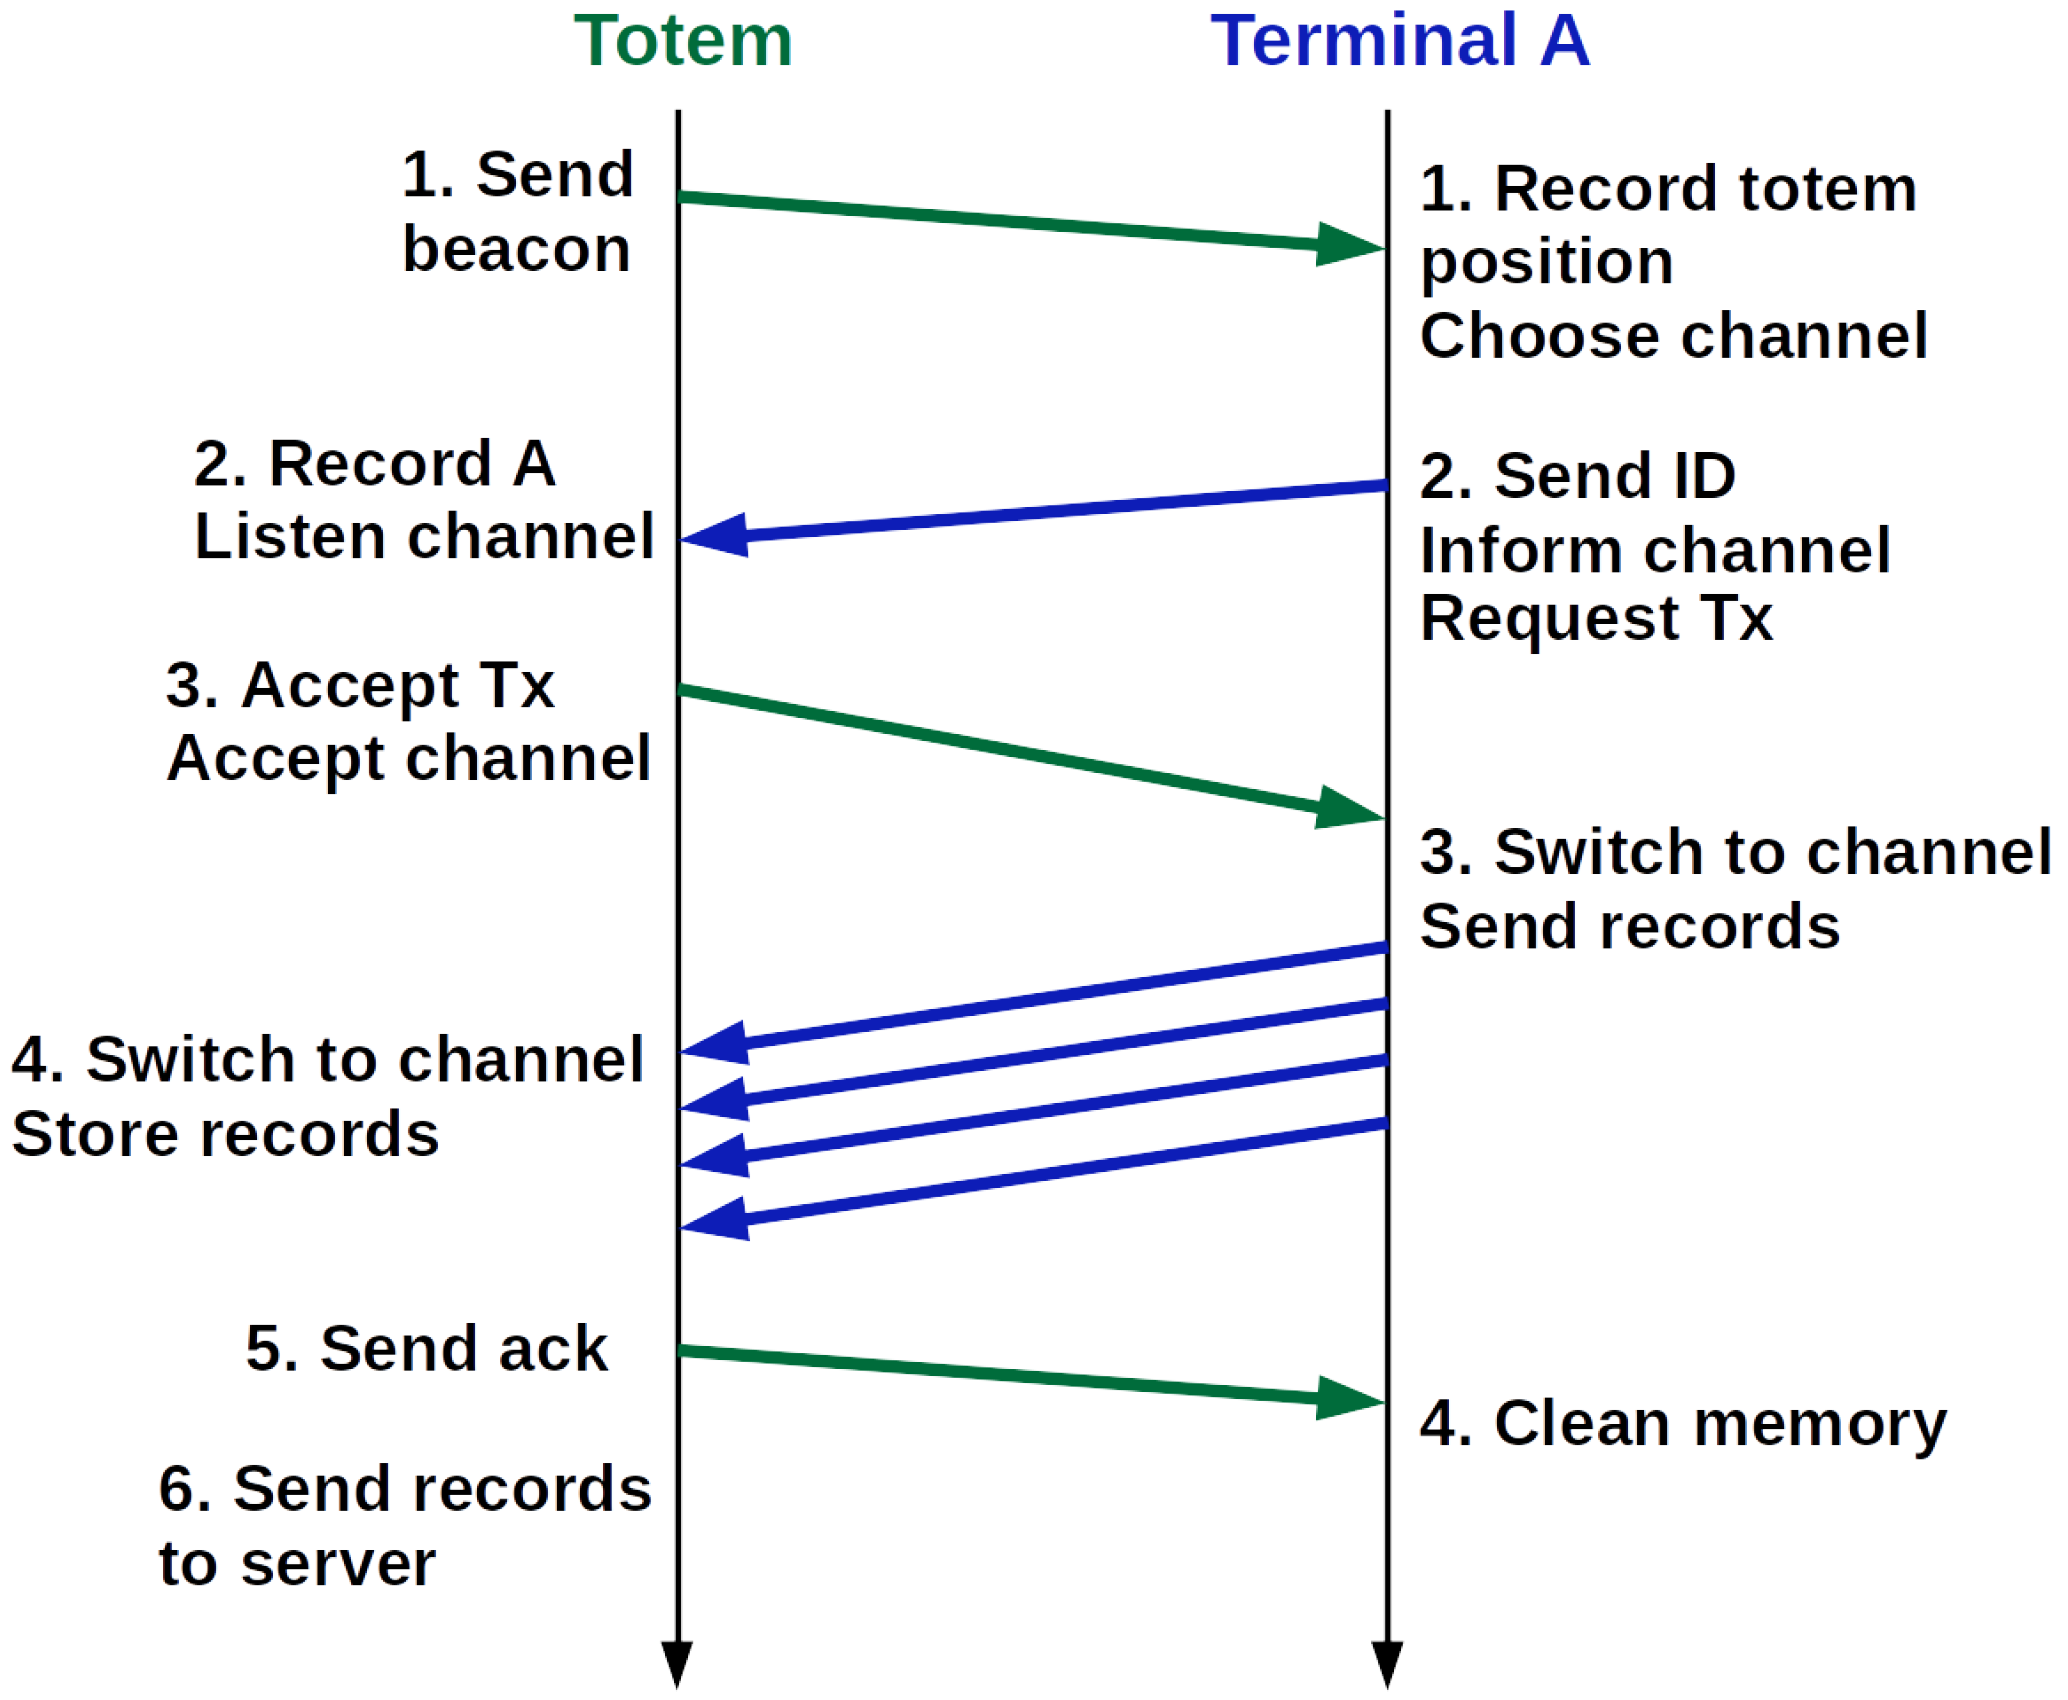
Message exchange between terminals and between terminals and totems is defined by the communication protocol developed for the application. Communication is asynchronous, as shown in Figure 10 and Figure 11. We illustrate protocol operation with an example. It begins with the reception of a beacon. Terminal B records the presence of terminal A. Terminal B then sends its ID and requests permission to transmit its stored records. Terminal B also declares the channel chosen to exchange records, and its reception limits values for hop count, record time and the maximum number of records to be received. If A, the remote terminal that originated the beacon, has available memory, it stores the current contact data, sends its own reception limits for hop count, record time and the maximum number of records, and accepts the transmission.
Both terminals also have to agree on which SF will be used to exchange the records. Upon receiving a beacon, Terminal B evaluates the RSSI and SNR level of the communication. Then B proposes the switch to another SF that allows a higher baud rate; when it is not possible, SF11 will be used. The definition of SF is made by the terminal that receives the beacon and informed along with its metadata (record time and hop count), sending its identification in the field CH. The choice of a channel can be accepted or changed by terminal A. If the values of RSSI and SNR in the reception of messages sent by B do not allow operation in the SF defined, then the terminal A changes to another higher SF. Only two bits in the message are needed for this purpose, once only SF8, SF9, SF10, and SF11 are available. SF12 is used exclusively for beacon transmission and the initial handshake, whereas SF7 is used for group communication. Exchanging the records using a different spreading factor reduces collisions by leaving the common channel provided by SF12 clear for more time. Before starting the transmission, terminal A listens to the chosen channel in a mechanism similar to CCA to avoid collisions.
After receiving all the transmissions from B, Terminal A then sends its own stored records. Hop count and record time allow improving terminal memory management by avoiding receiving records that are old or have been forwarded too many times. The max records field allows limiting the number of records received, even if they are in agreement with the hop count and record time parameters. Records that have values above the informed thresholds are not sent. Help request records are the first to be transmitted. After these, previous contact records with other devices and, finally, rescue notifications are forwarded.
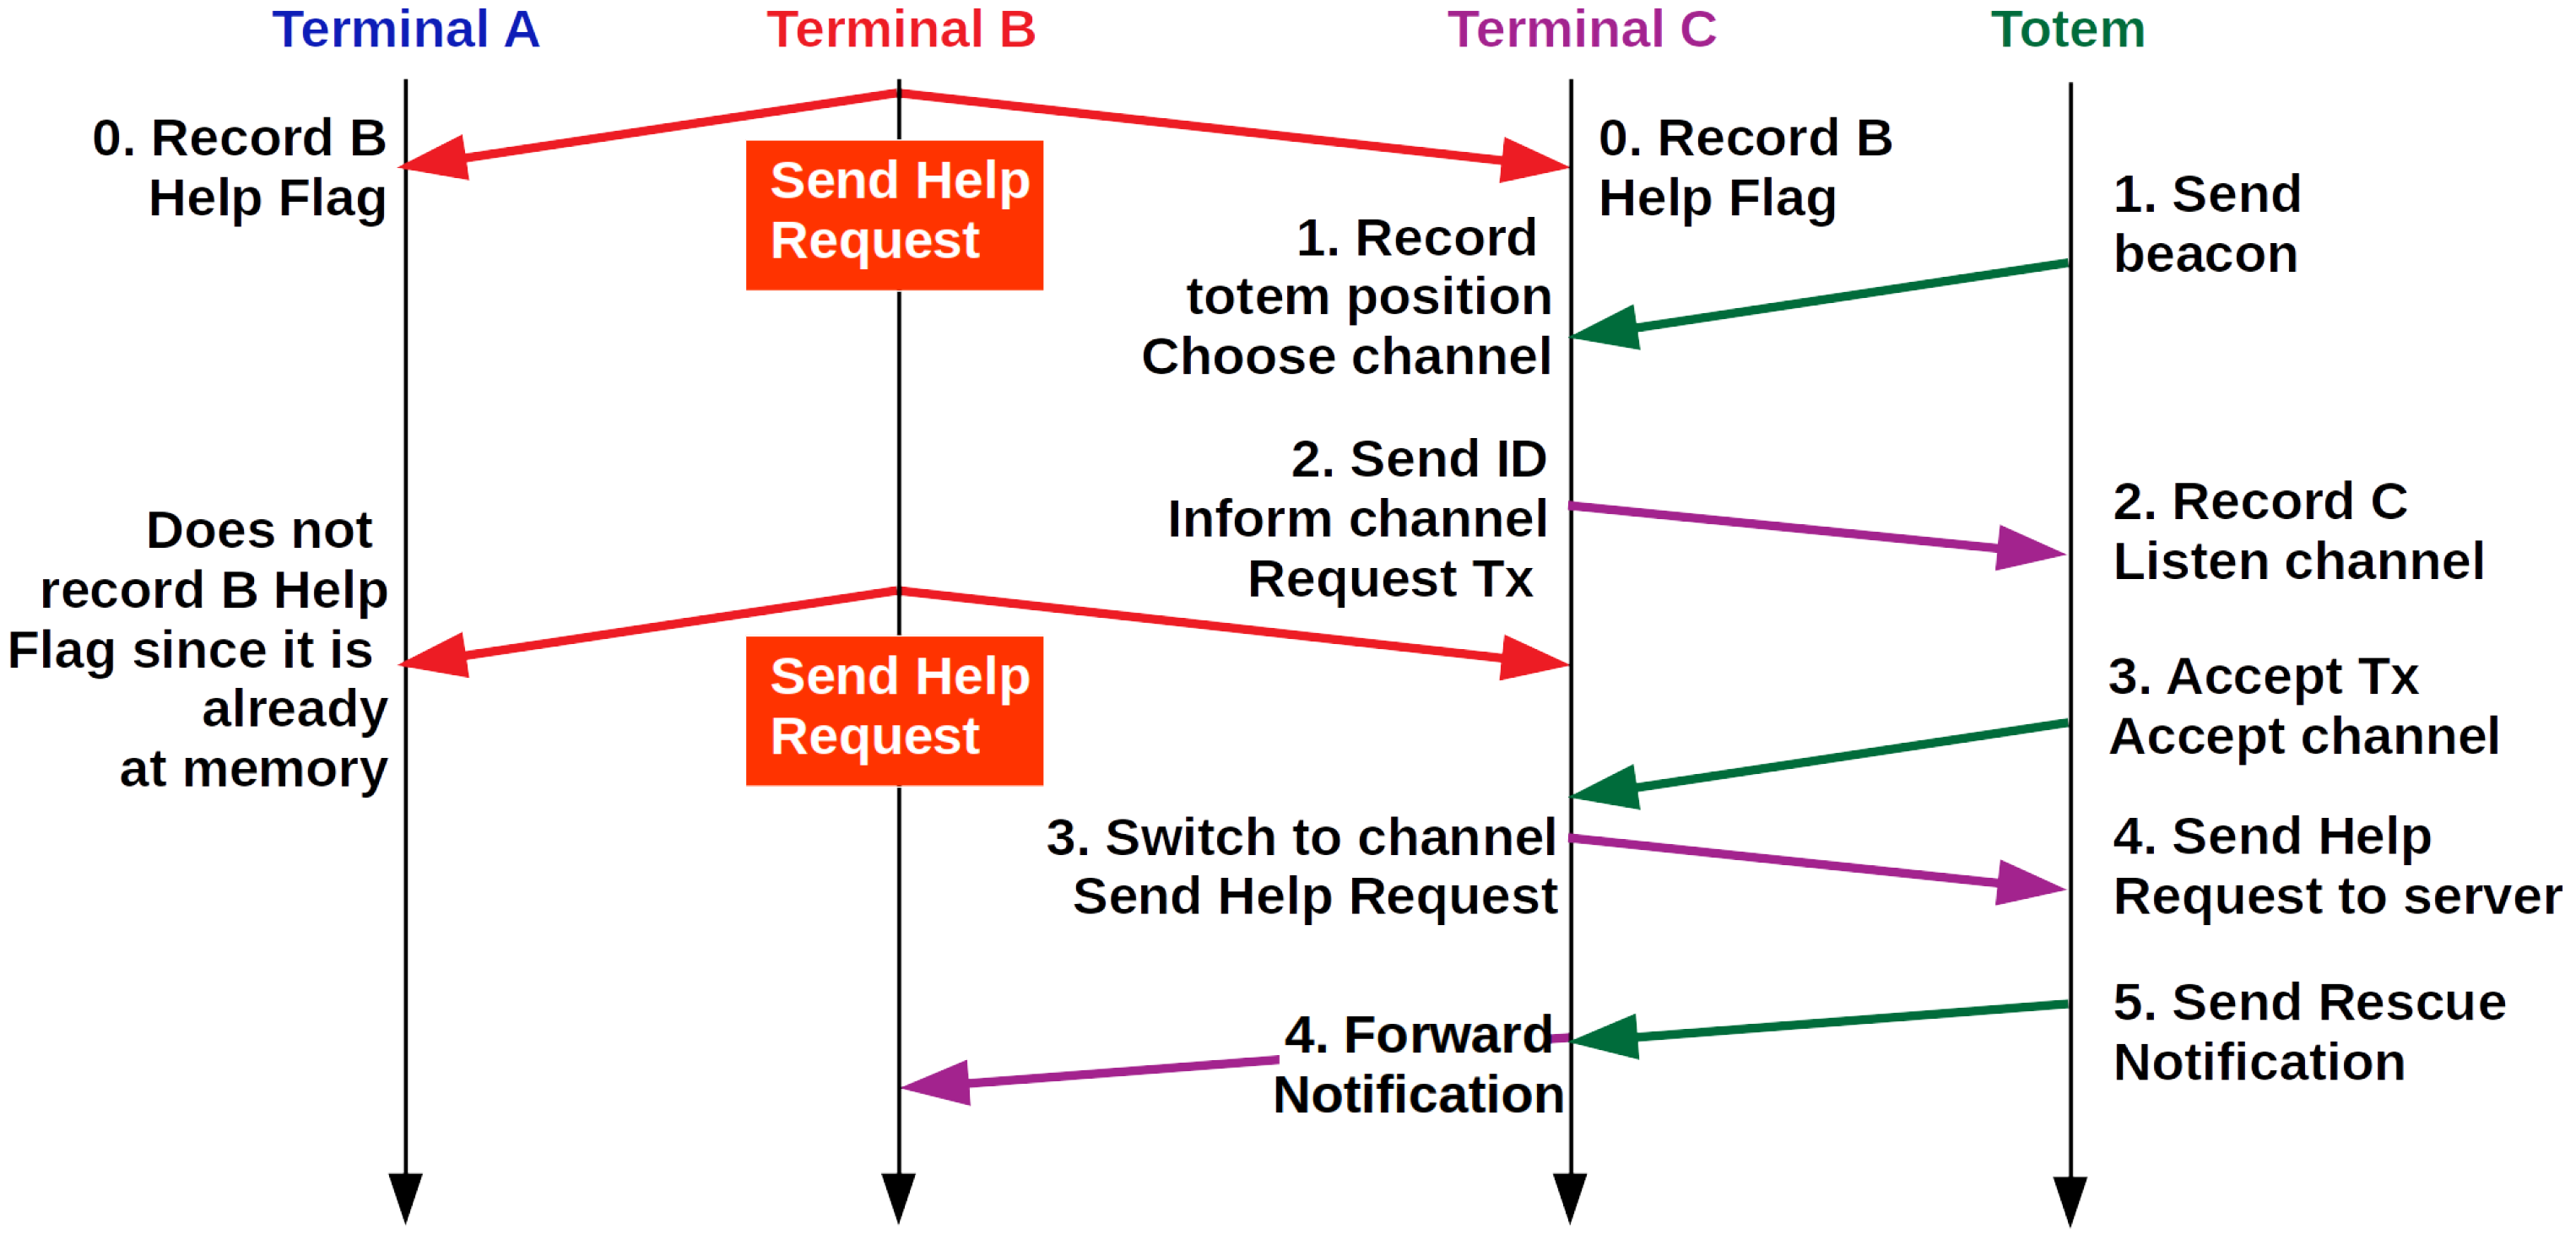
Help request messages are sent upon the visitor’s initiative. For those emergency messages, it is important to reduce latency. To accelerate the rescue, copies of emergency messages must be passed on to all other mobile nodes, passing through the visitor at risk until he is rescued or receives a notification. The terminals that receive the message also replicate it until they reach the nearest totem or receive a notification. Only nodes that already have a copy should discard an emergency message.
The response to the emergency message is a rescue notification message, informing the visitor that help is on the way, terminating the sending of help request messages. Notification messages should be sent by the totems closest to the location where the visitor at risk is. Thus, messages are replicated to other terminals that have a greater chance of reaching the visitor quickly and, therefore, be delivered with less latency. Figure 12 illustrates this communication.
To make bandwidth usage more efficient, the monitoring system has the possibility to create groups of visitors traveling together or in close proximity. Groups are created without the need for visitor intervention. Upon the receipt of 30 beacons generated by the same terminal within 30 minutes, group formation or inclusion in an existing group is initiated. The terminals involved then proceed on leader election using messages sent using SF7. This message contains the terminal ID and an estimate of the time for the battery to be exhausted. The leader will be the terminal with the longest expected battery life. Ties are broken based on the highest terminal ID. Once the group is formed, both the leader and other group participants have the same set of sighting records. The group stays synchronized by the leader beacon, identified by the group ID. The group ID consists of the leader ID and the group flag (GF) field. One who is not a group leader will have the GF field with zero value. The leader GF will have value 1.
Only the leader will send beacons and exchange sighting records with other contacting terminals. In this way, the other participants in the group save battery since the supply current in transmit mode is ten times greater than in receive mode, as shown by the values described in Table 1. There is no need for the leader to replicate data received from a terminal outside the group to the other participants, as everyone listens to the broadcast for the group ID. This way, every terminal in the group keeps the same sighting record set. If the leader’s beacon is not received for an interval longer than 10 minutes, a new leader election begins. If during the election, the terminal does not receive messages from other terminals, it is assumed that it is no longer part of any group and the person is moving alone. If the leader’s battery charge falls below a pre-established threshold, the device stops sending beacons forcing a new election. Communication within groups is done using SF7, which provides the smallest radio range, as its members are always close. This way a higher baud rate can be used while reducing the consumption and the chances of interfering with other communications. Sending beacons, either by a terminal traveling alone or by a group leader, is done using SF12.
The communication between terminal and totem (Figure 11) is also asynchronous and started by beacon reception, following a similar handshake with the choice of an SF for a record sending channel. Nevertheless, the totems advertise their coordinates every five seconds since totems have no power or storage constraints, differently from mobile terminals. On the other hand, it is important to increase the probability that a device entering a totem area will be able to communicate. Totems also record the presence of mobile terminals. The totems inform which trail the visitor is on: typically, there may be different trails inside a natural park.
A prediction is then made of when the visitor will pass the next totem of this same trail. This prediction is refined by accumulating records about each visitor and by estimating their average travel speed. Ideally, totems should be located at least at the entrances and junctions of trails, as well as places with specific hazards such as waterfalls and caves. In Section 5.3, we have proposed an optimization model for the positioning of totems considering risks and other specific requirements of each spot that was mapped as a point of interest by the administration of the natural park.
In Figure 11, terminal A, which passes through the totem coverage area, receives a beacon. The terminal updates its coordinates data, notifies its identification, and requests the transmission of the records saved in its memory to the totem, using a specific SF. Upon receiving the acceptance, it then forwards all the records of its memory and waits for confirmation by the totem via an ACK. Upon receiving the ACK, the mobile terminal empties its memory. This message contains the number of records received by the totem. If it is not the same number of records sent by the terminal, all of these are re-sent. Similar to the custody transfer mechanism of DTNs, the totem is now responsible for making this information reach the server. Totems send incoming records to servers that estimate visitor locations. If there is a help request, the message is forwarded to a rescue team, who responds with a notification by sending aid. The rescue notification has the function of terminating the help request broadcast from the distressed visitor’s terminal. The mobile terminal will again only transmit periodic beacons, reducing the battery drain.

5.3. Optimization

The location of totems is relevant to achieving the best possible performance in locating visitors. There are higher-risk locations that require greater connectivity and therefore better coverage. It is vitally important to maximize wireless network coverage, especially addressing risk points while maintaining minimal infrastructure. This reduces the cost of the visitor assistance system and also any environmental impacts that may be caused to fauna and flora.
The positioning of totems is treated as an optimization problem, which can be solved using Integer Linear Programming (ILP) [32]. For this, a matrix modeling of cubes that map the track in three-dimensional form is developed. This modeling considers the signal coverage on the trails, the attenuation caused by the height difference between the totem antennae and the antenna characteristics. Monopole antennas were assumed, of which an irradiation diagram shows differences in the azimuth plane and elevation plane [33]. To solve the proposed model, real parameters obtained from practical experiments were used. The cubes that represent sites of the grid where it is feasible to deploy a totem are delivered to CPLEX to solve the ILP problem.
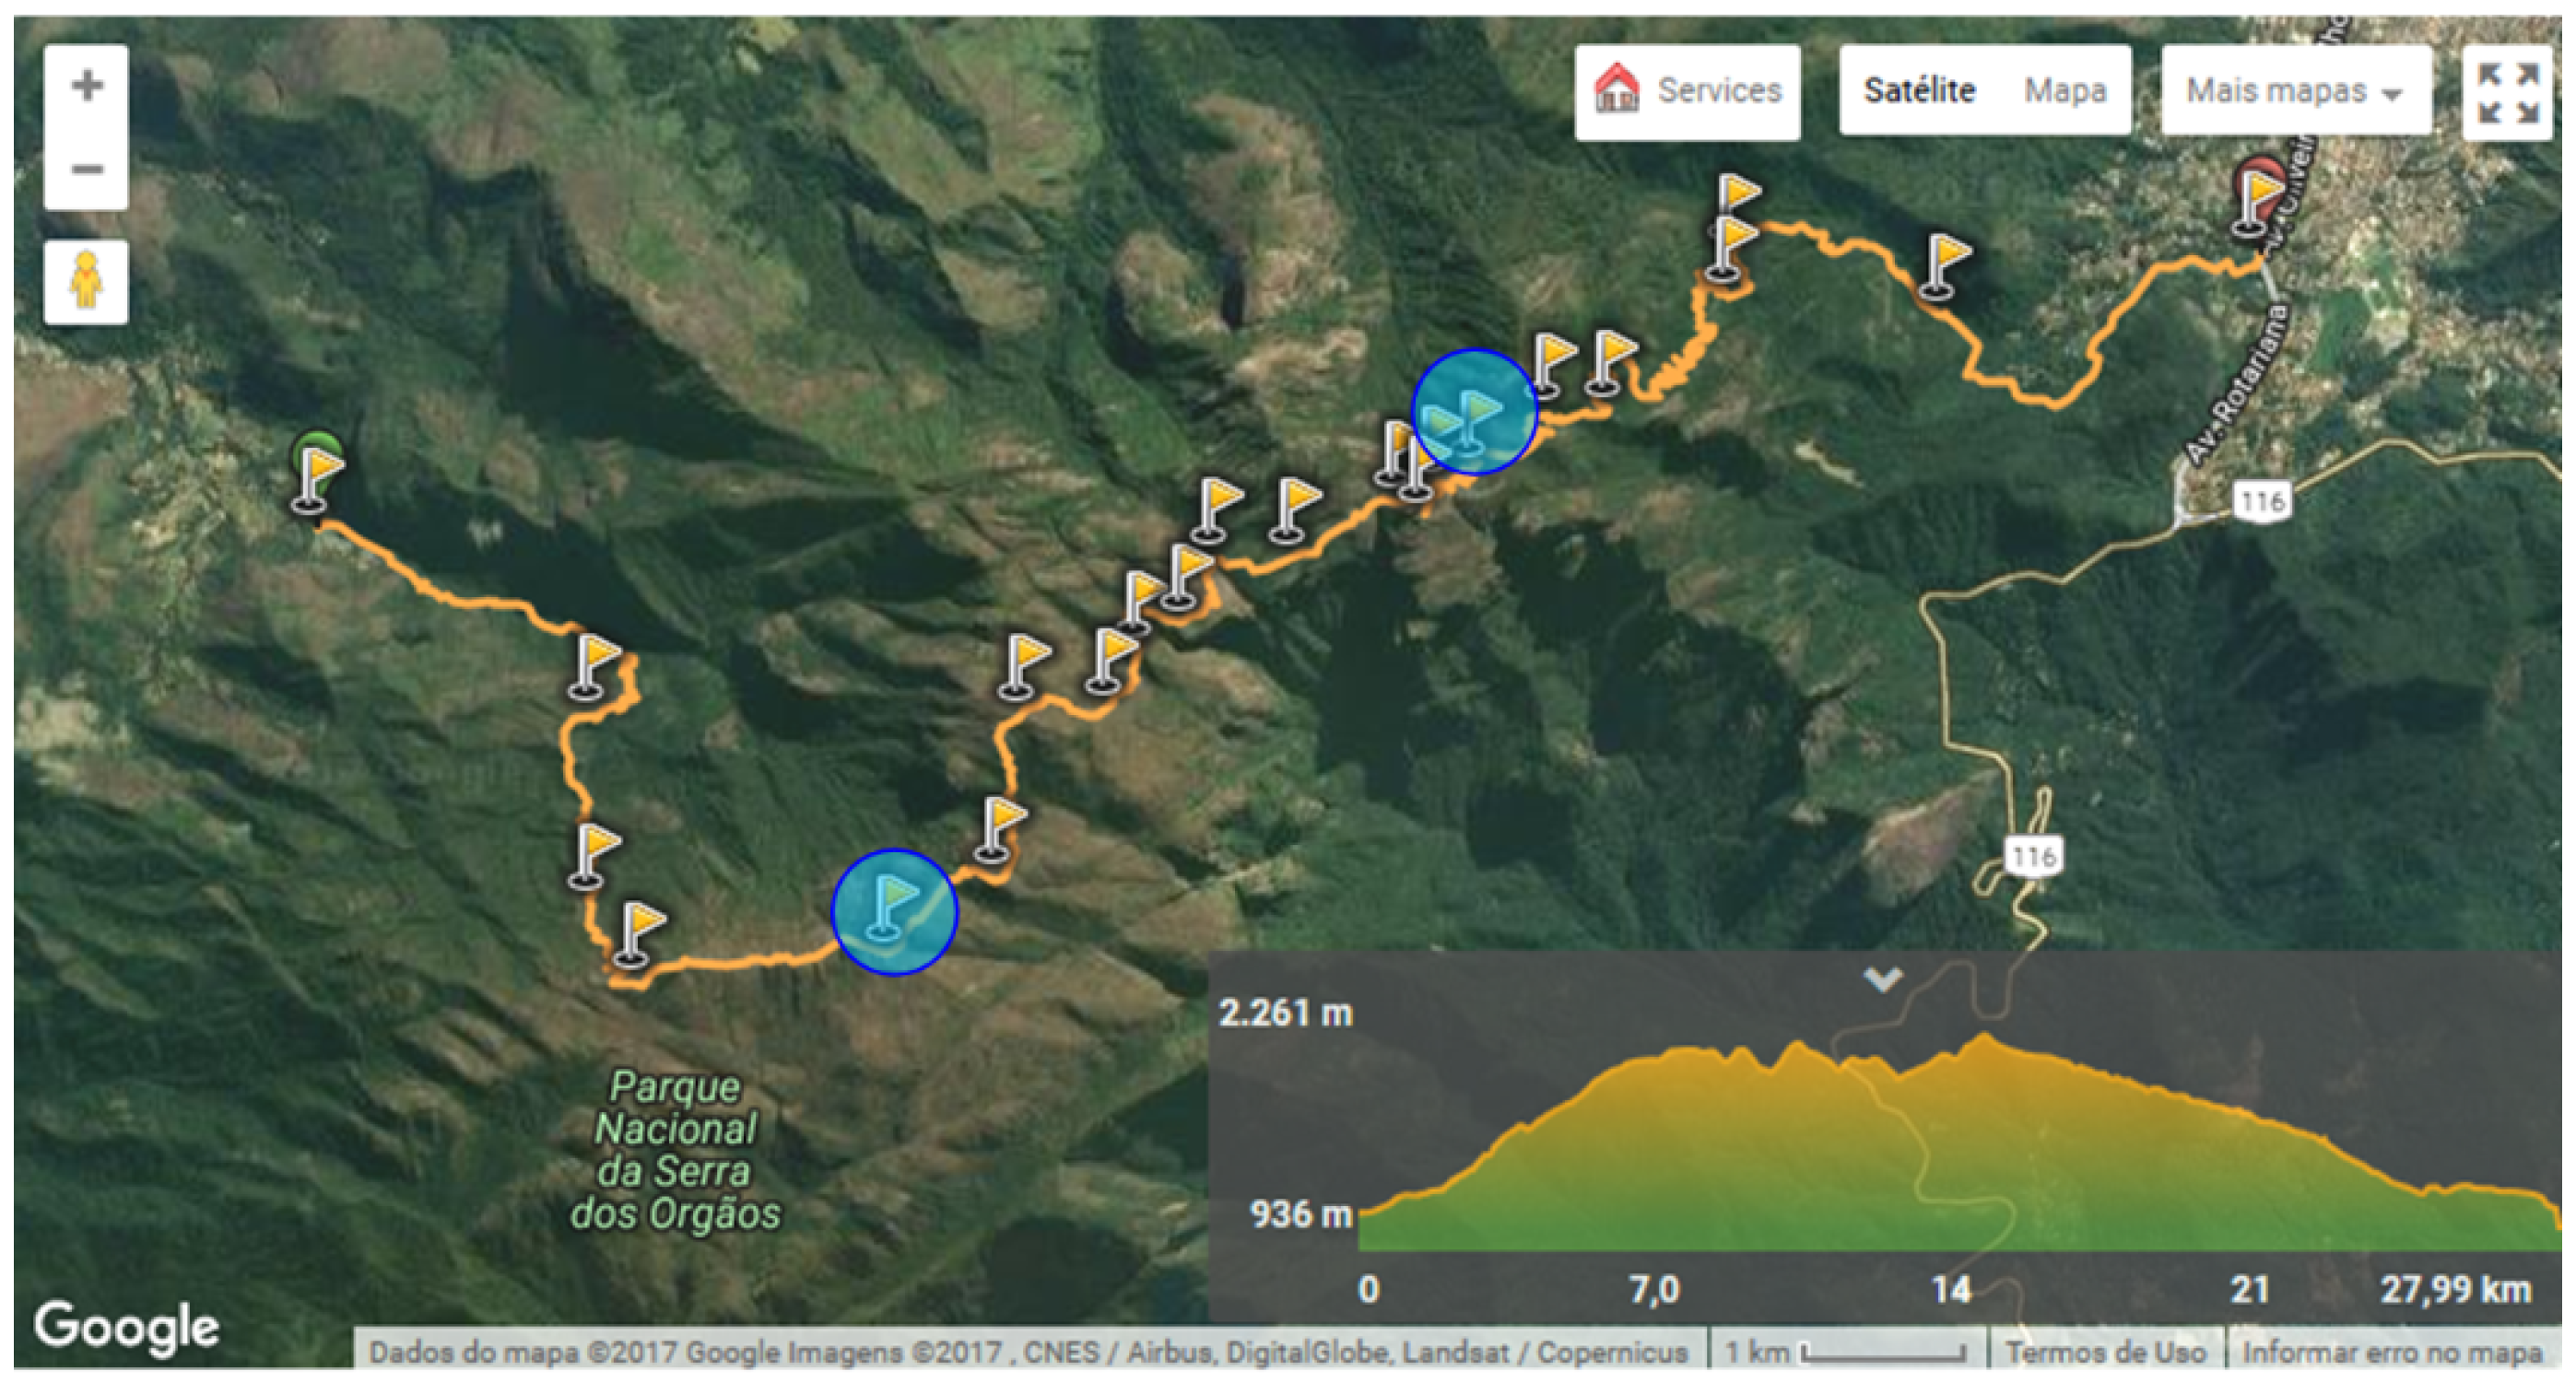
Our use-case trail is the crossing from Petrópolis to Teresópolis, made through the mountains of Serra dos Órgãos National Park (PARNASO). This route measures about 30 km and is covered in a three-day trek. To this trail, considering full track coverage, 200 LoRa technology totems are required. However, due to the cost-to-implement, maintaining full coverage is unfeasible. An initial survey of the trail makes it possible to identify danger points, water collection, trail intersection, and shelter. Thus, it is possible to estimate the use of 23 totems.

6. Simulation

The applicability of the proposal for the Petrópolis to Teresópolis crossing is verified through simulations performed in NS-3 [34], an event-driven network simulator. In NS-3, the propagation inside the forest was described by the Log-distance propagation model integrated to Nakagami-m. Since the propagation model is used only for the calculation of RSSI, the Log-distance distribution was kept for large-scale attenuation, with no approximation with the Gamma distribution. The average received power was simulated by the Log-Distance distribution, and the small-scale fading by the Nakagami-m model. Both contributions were added to allow the composition of the two effects. The Monte Carlo method was used for generating the received power values [35]. For each reference distance, 2000 independent samples of possible small-scale fading values were generated. In this case, based on the arbitrary choice of one of the 2000 samples for the reference distance, the power received by the totems was calculated.
Table 3 shows the parameters configured in the simulator to represent the scenario of a mobile node. The physical layer of the LoRa was defined with some adaptations to the LoRaWAN library developed by Magrin et al. [36]. The simulation parameters reflect the practical experiments carried out, as described in [37]. We employ the same level of radiated power, spreading factor, bandwidth, and code rate. The loss exponent of the Log-distance propagation model is empirically defined as 4.07. This value ranges between two and six, where two represents the propagation in free space [38]. The loss exponent is defined in the calibration step of the simulations, which consists of bringing the simulations closer to the practical experiments using the results of RSSI at 250 m as reference. Mobile terminals move at two different speeds: that of an average visitor and of a well-trained hiker. The heights of the antennas also reproduce the heights used in practical experiments.
Figure 13 illustrates the trail of PARNASO that we simulate. The points indicated within blue circles are the locations of the two overnight shelters. The trail stretch between the two shelters is the most prone to visitors getting lost. Figure 14 shows a landscape of this stretch. The points indicated by the orange triangular flags are the points of interest of the trail, and those that correspond to points suitable for installing totem installation, according to the park administration. Figure 15a,b shows typical totem installation points: the exit of the Petrópolis–Teresópolis crossing and a waterfall inside the PARNASO subject to flash flooding risk.
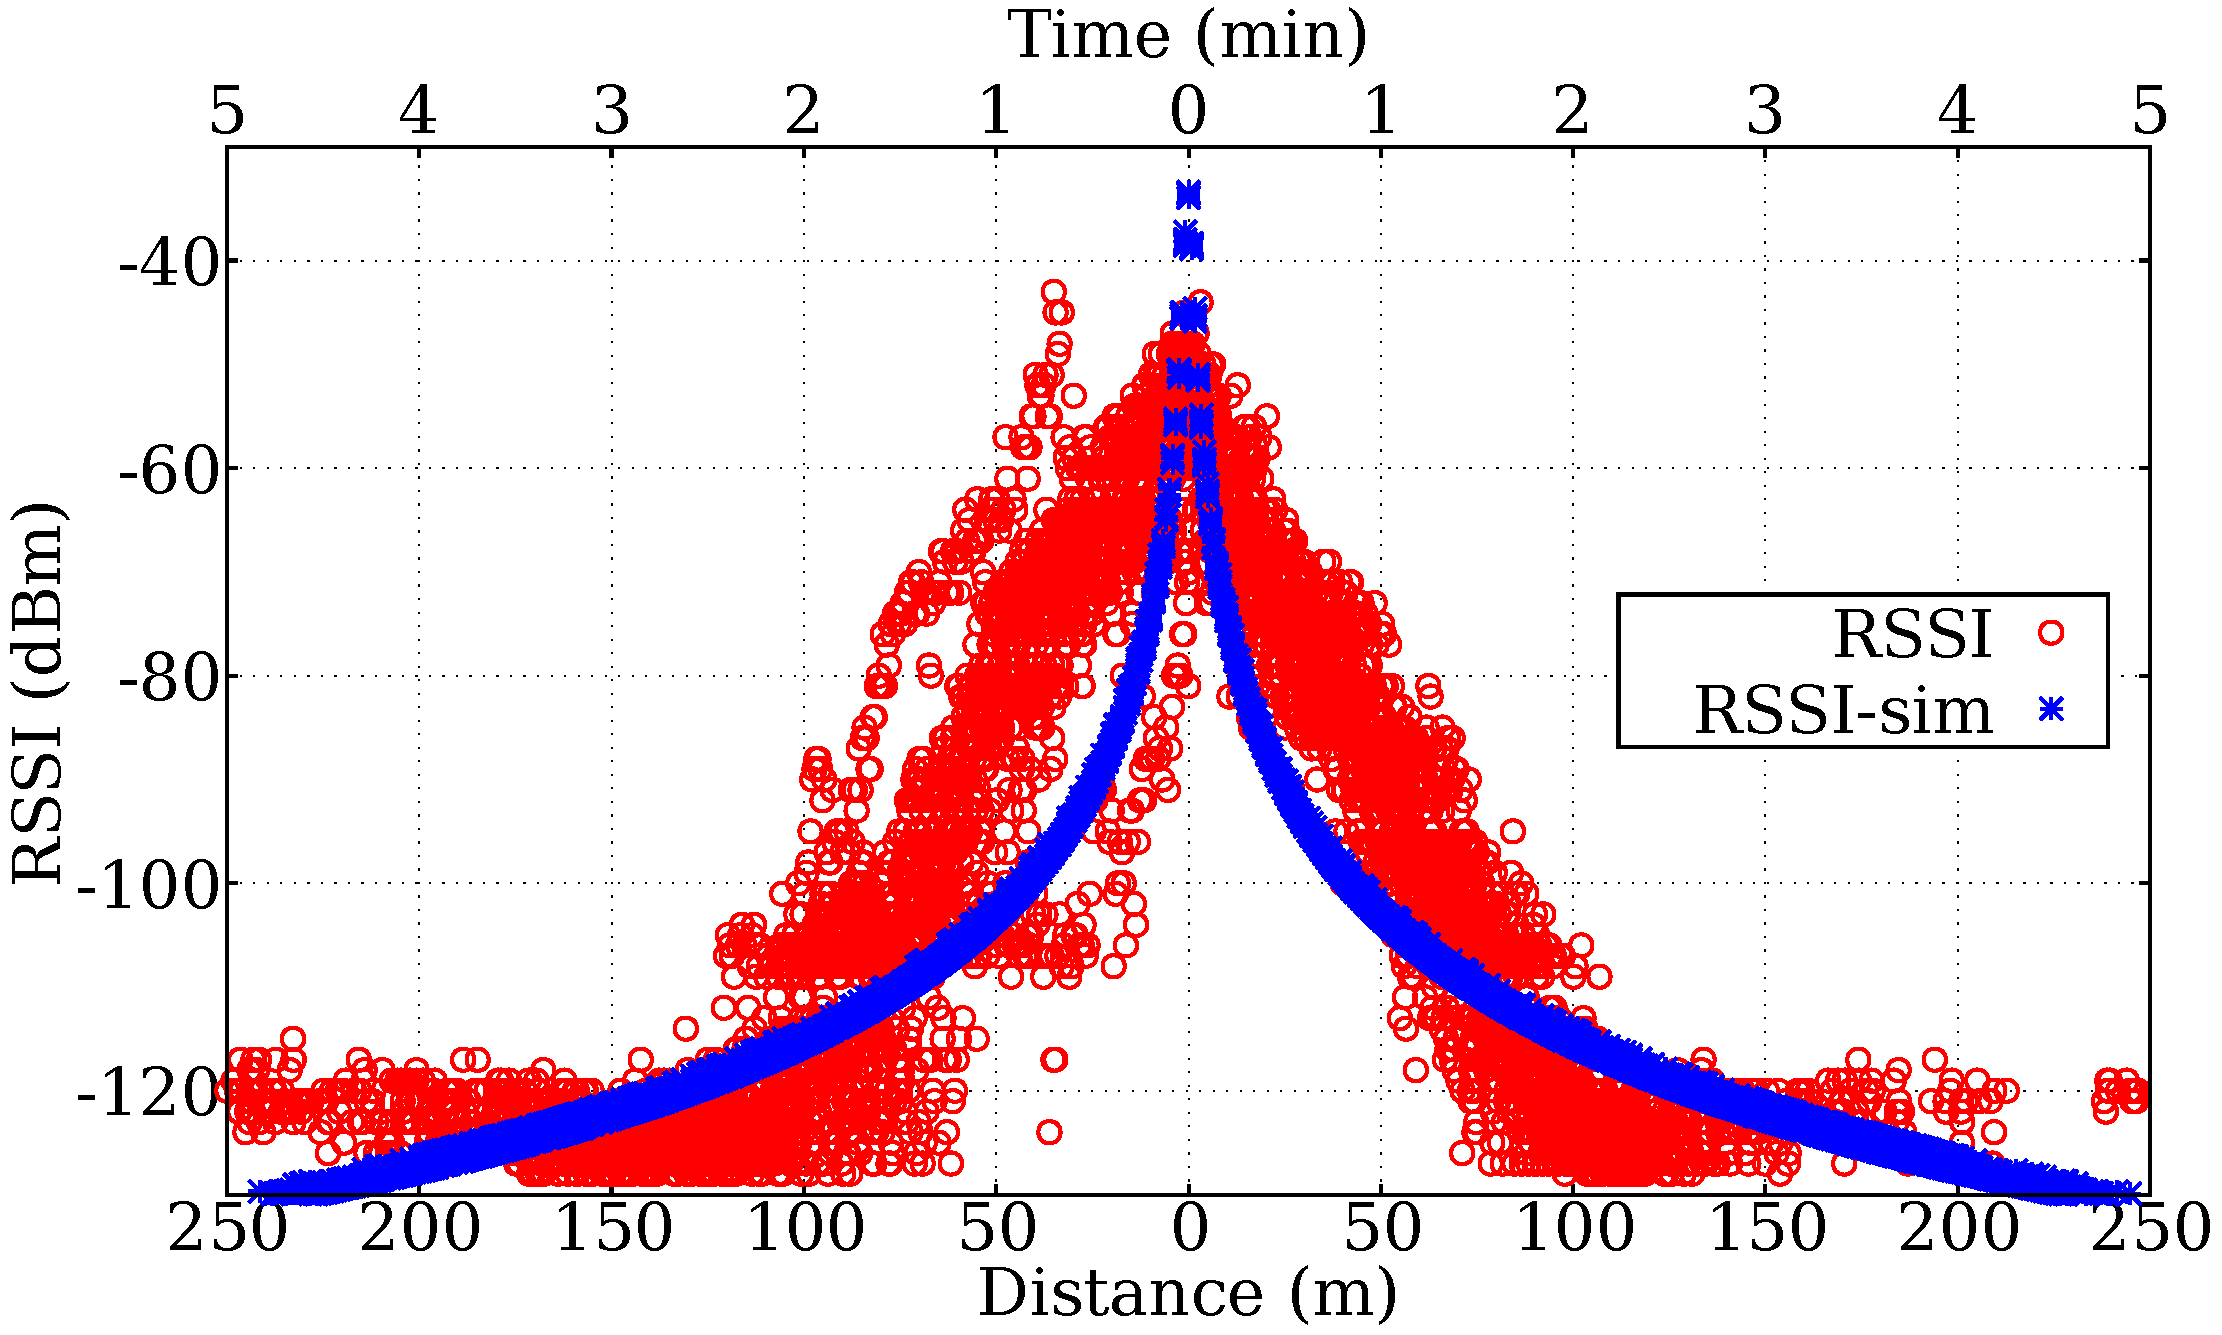
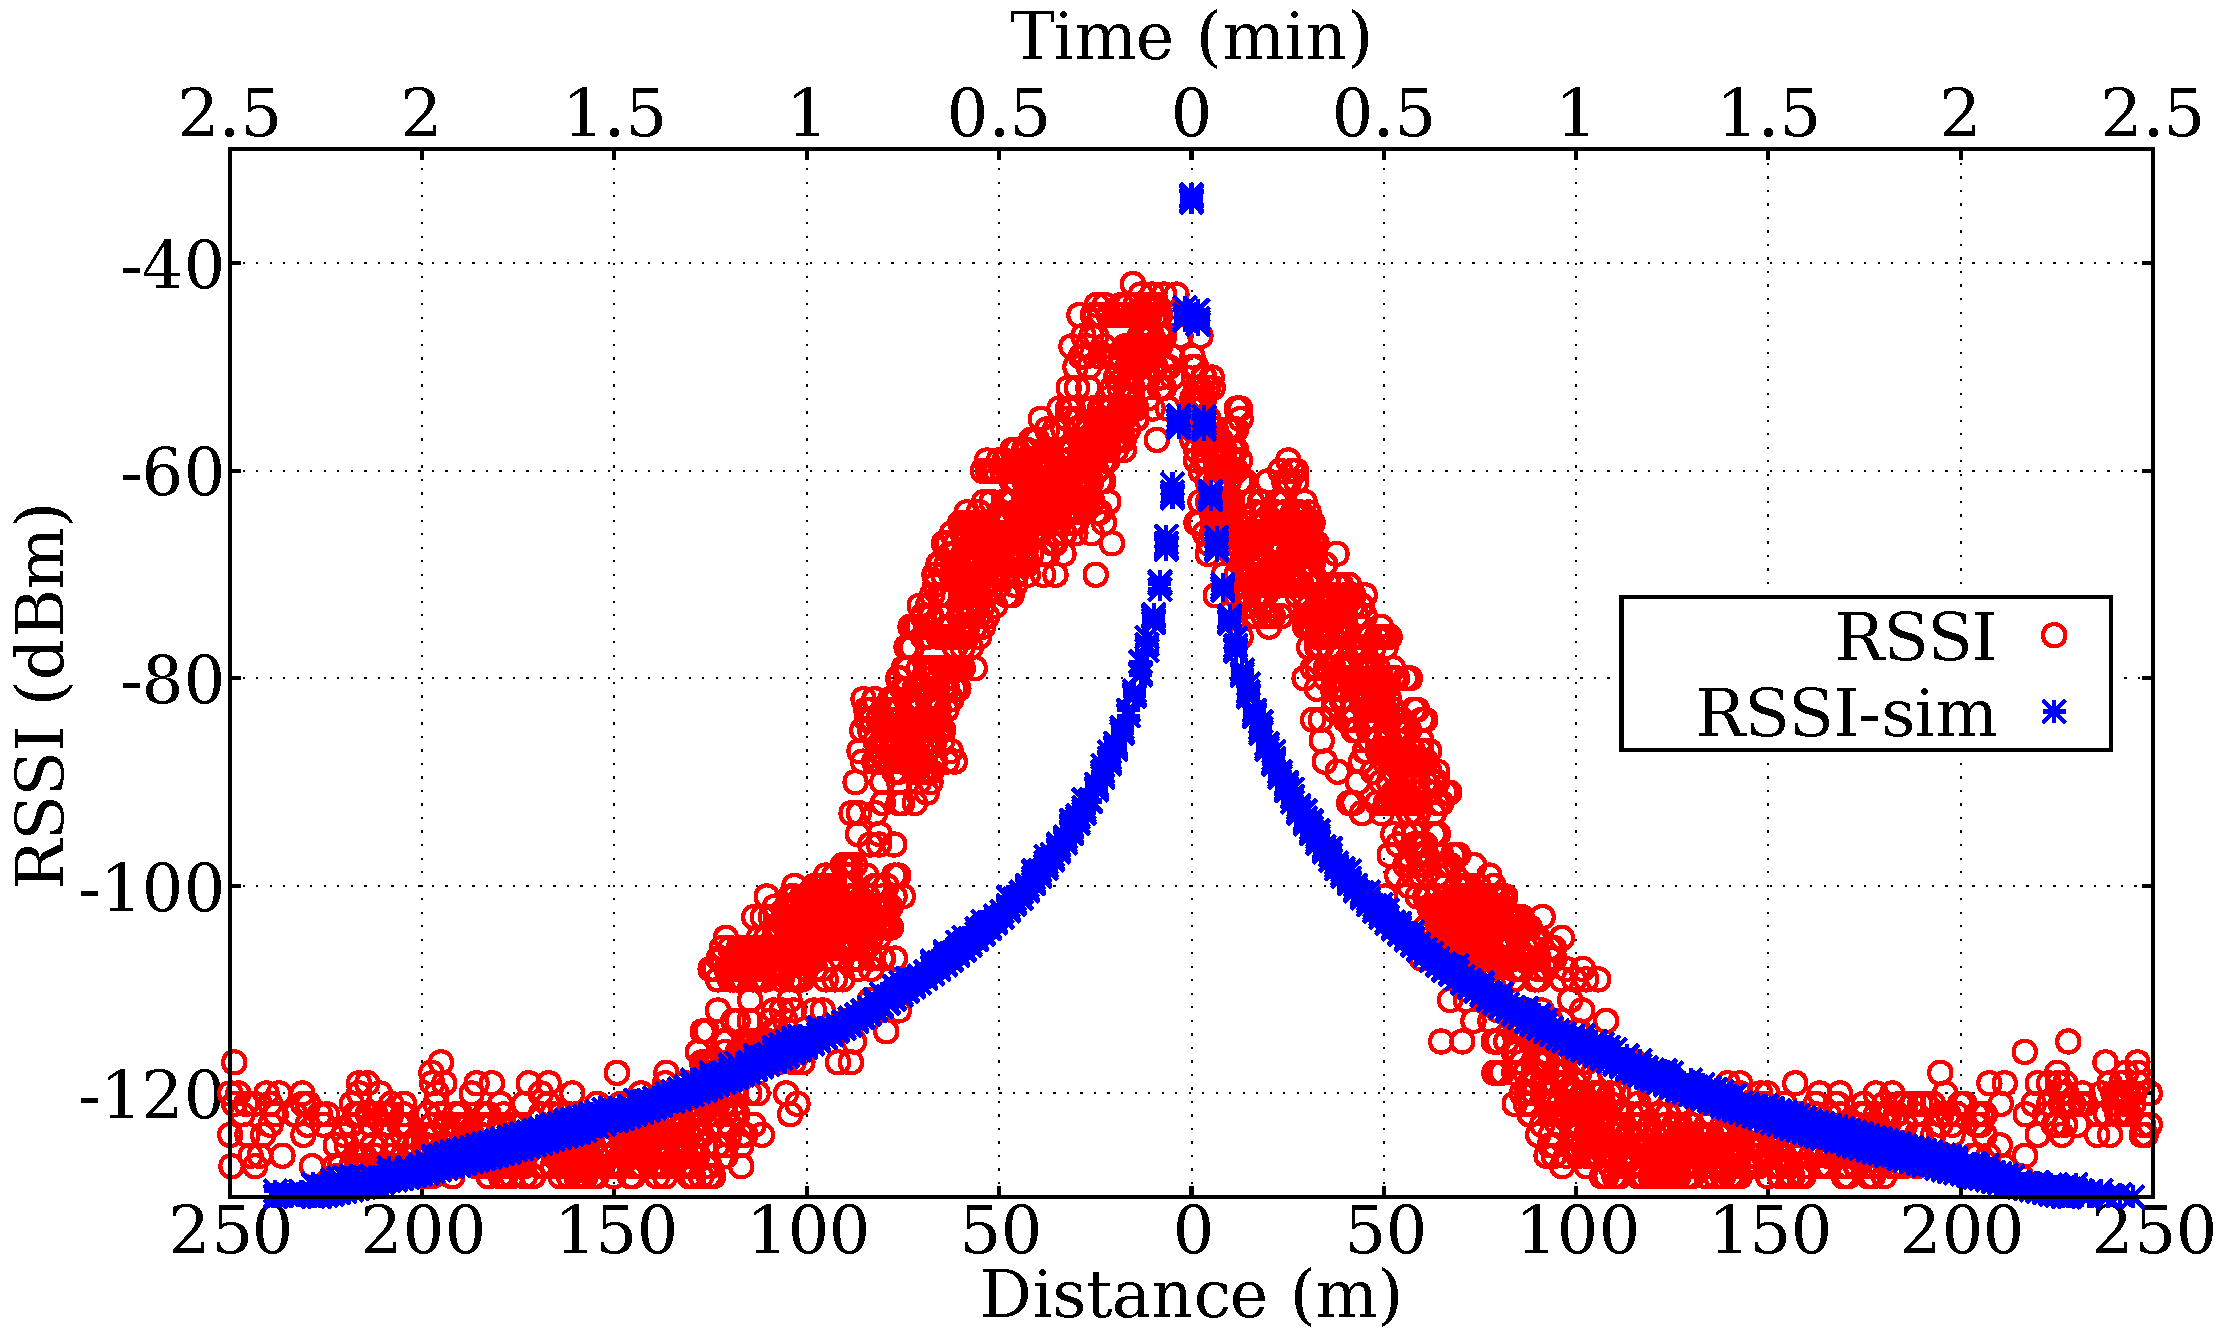
When the visitor travels at 3 km/h (50 m/min), the terminals send and receive more packets than at 6 km/h (100 m/min) as the contact time is longer. As a consequence, the measurements better show the variation in the sampled values. Figure 16 and Figure 17 show the variation of the power in the link, indicated by the RSSI, for the two travel speeds. The RSSI values for each packet received in the simulation and practical experiments are shown. As expected, experimental and simulation results do not perfectly match; nevertheless, there are important similarities between the two curves, especially for the lowest speed. The slower experiment—with more samples—shown in Figure 16 presents a better approximation between simulated data and measured data than the fastest experiment (Figure 17), with approximate correspondence between the contact intervals and the maximum and minimum values of measured power for practical and simulated experiments.
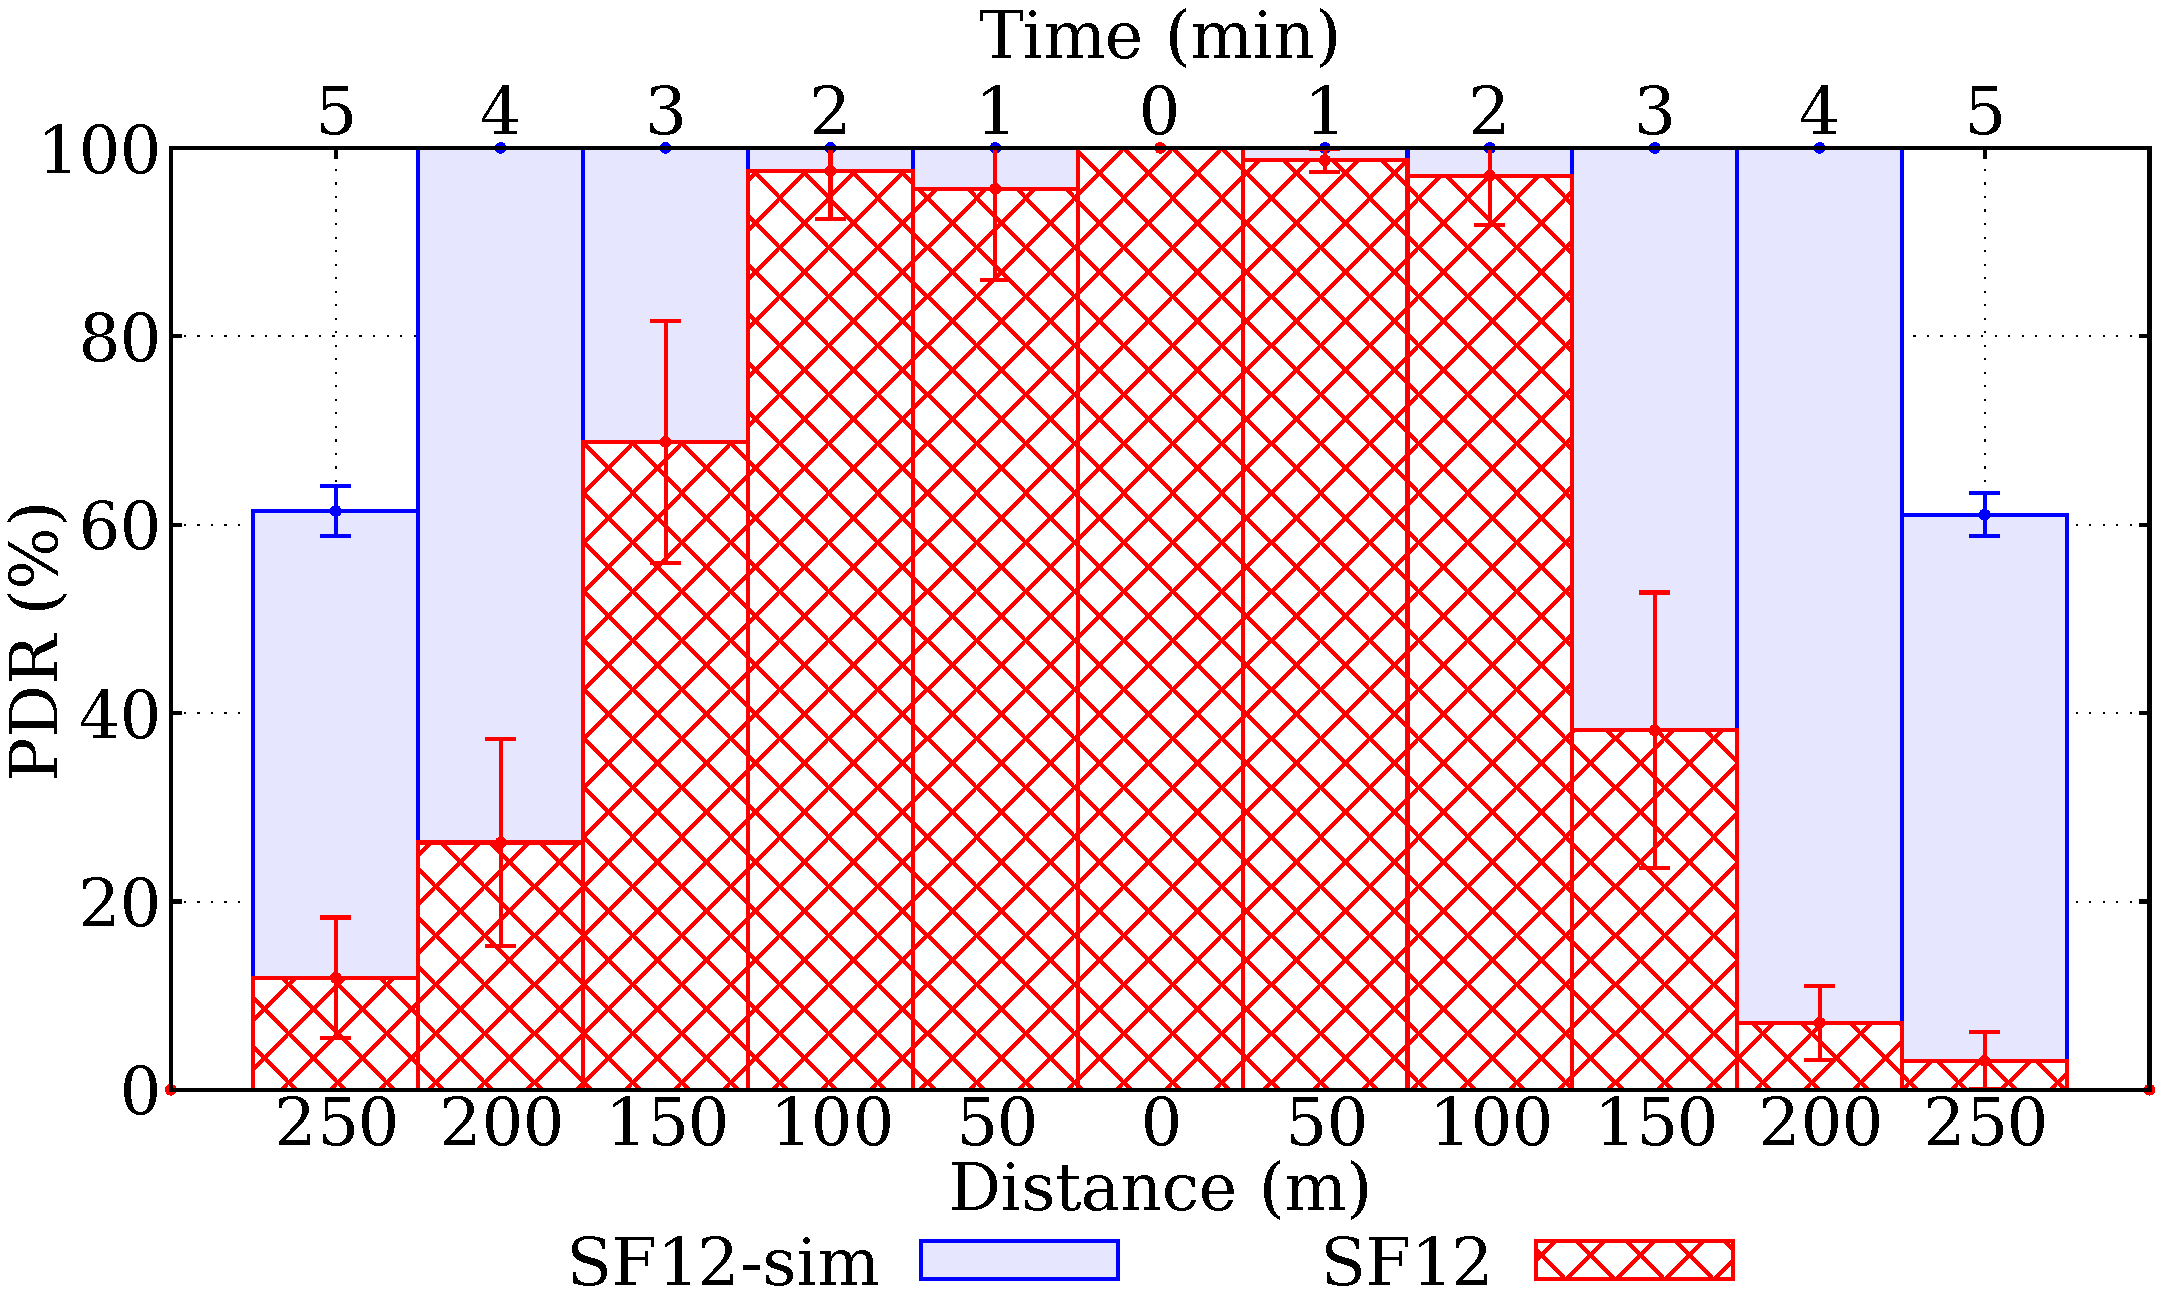
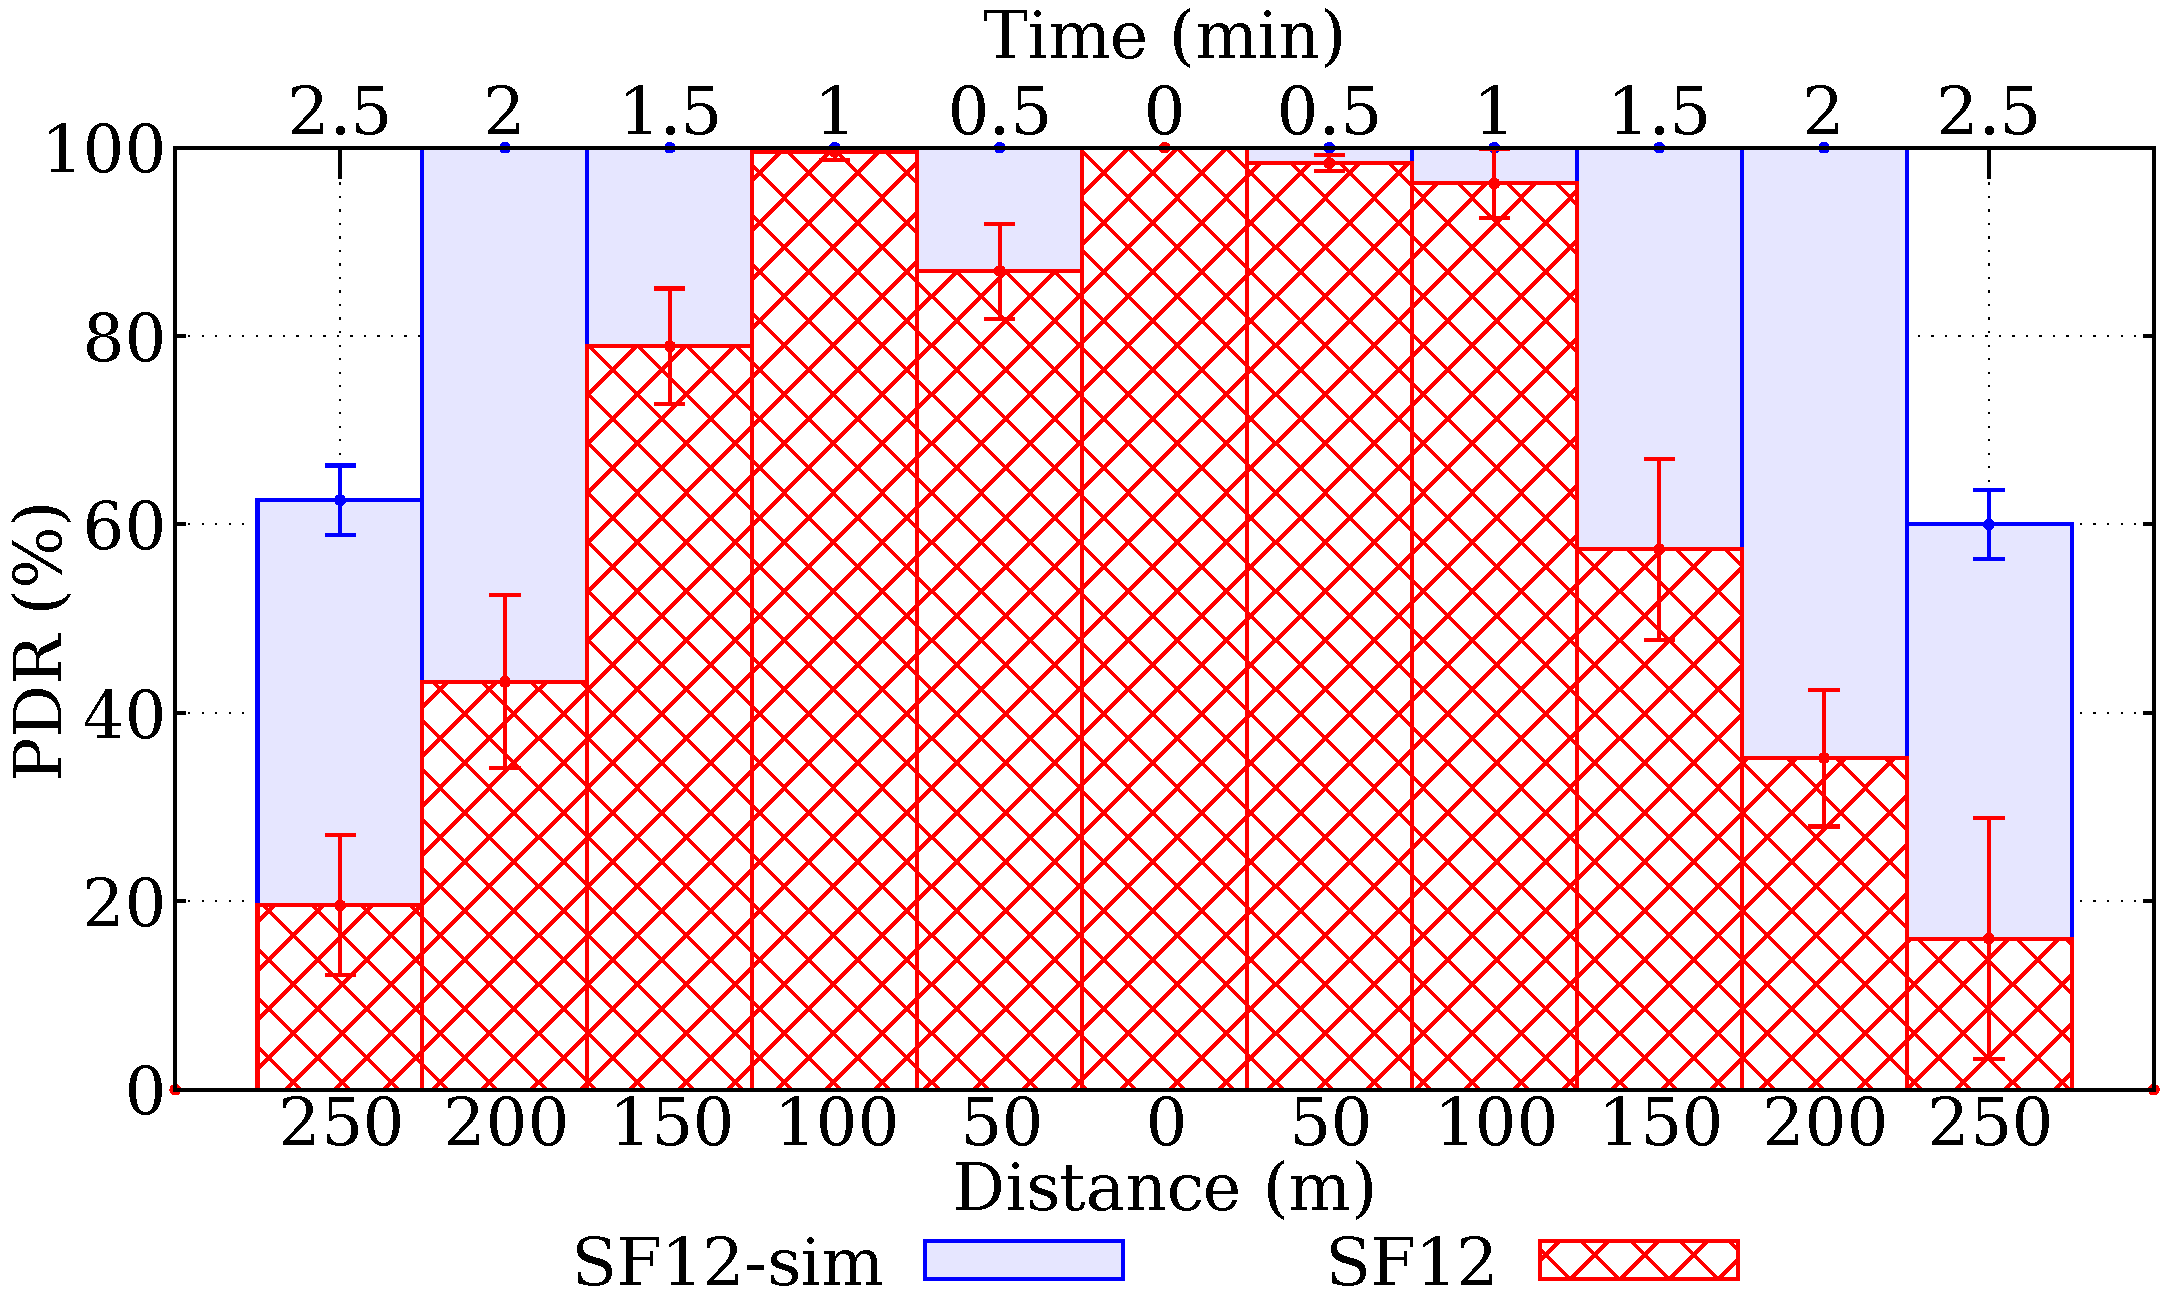
Figure 18 and Figure 19 show the variation of the Packet Delivery Ratio (PDR) between a mobile terminal and a totem. The increase in packet delivery reflects the increase of received signal strength. The values presented are the average of all of the 23 totems present in the simulated network. In the simulation, the occurrences of errors in the transmission or decoding of the packets are not modeled, explaining the PDR higher in the simulated experiments than in the practical experiments. In practical transmission, packets are subject to errors. Probably the main cause of errors is the multi-path phenomenon, in which the various reflected components can produce, in addition to variations in the signal envelope, noise and/or inter-symbolic interference, due to the temporal spreading of the bits. In the case of multiple transmitters on the same frequency, these can also be considered sources of noise.
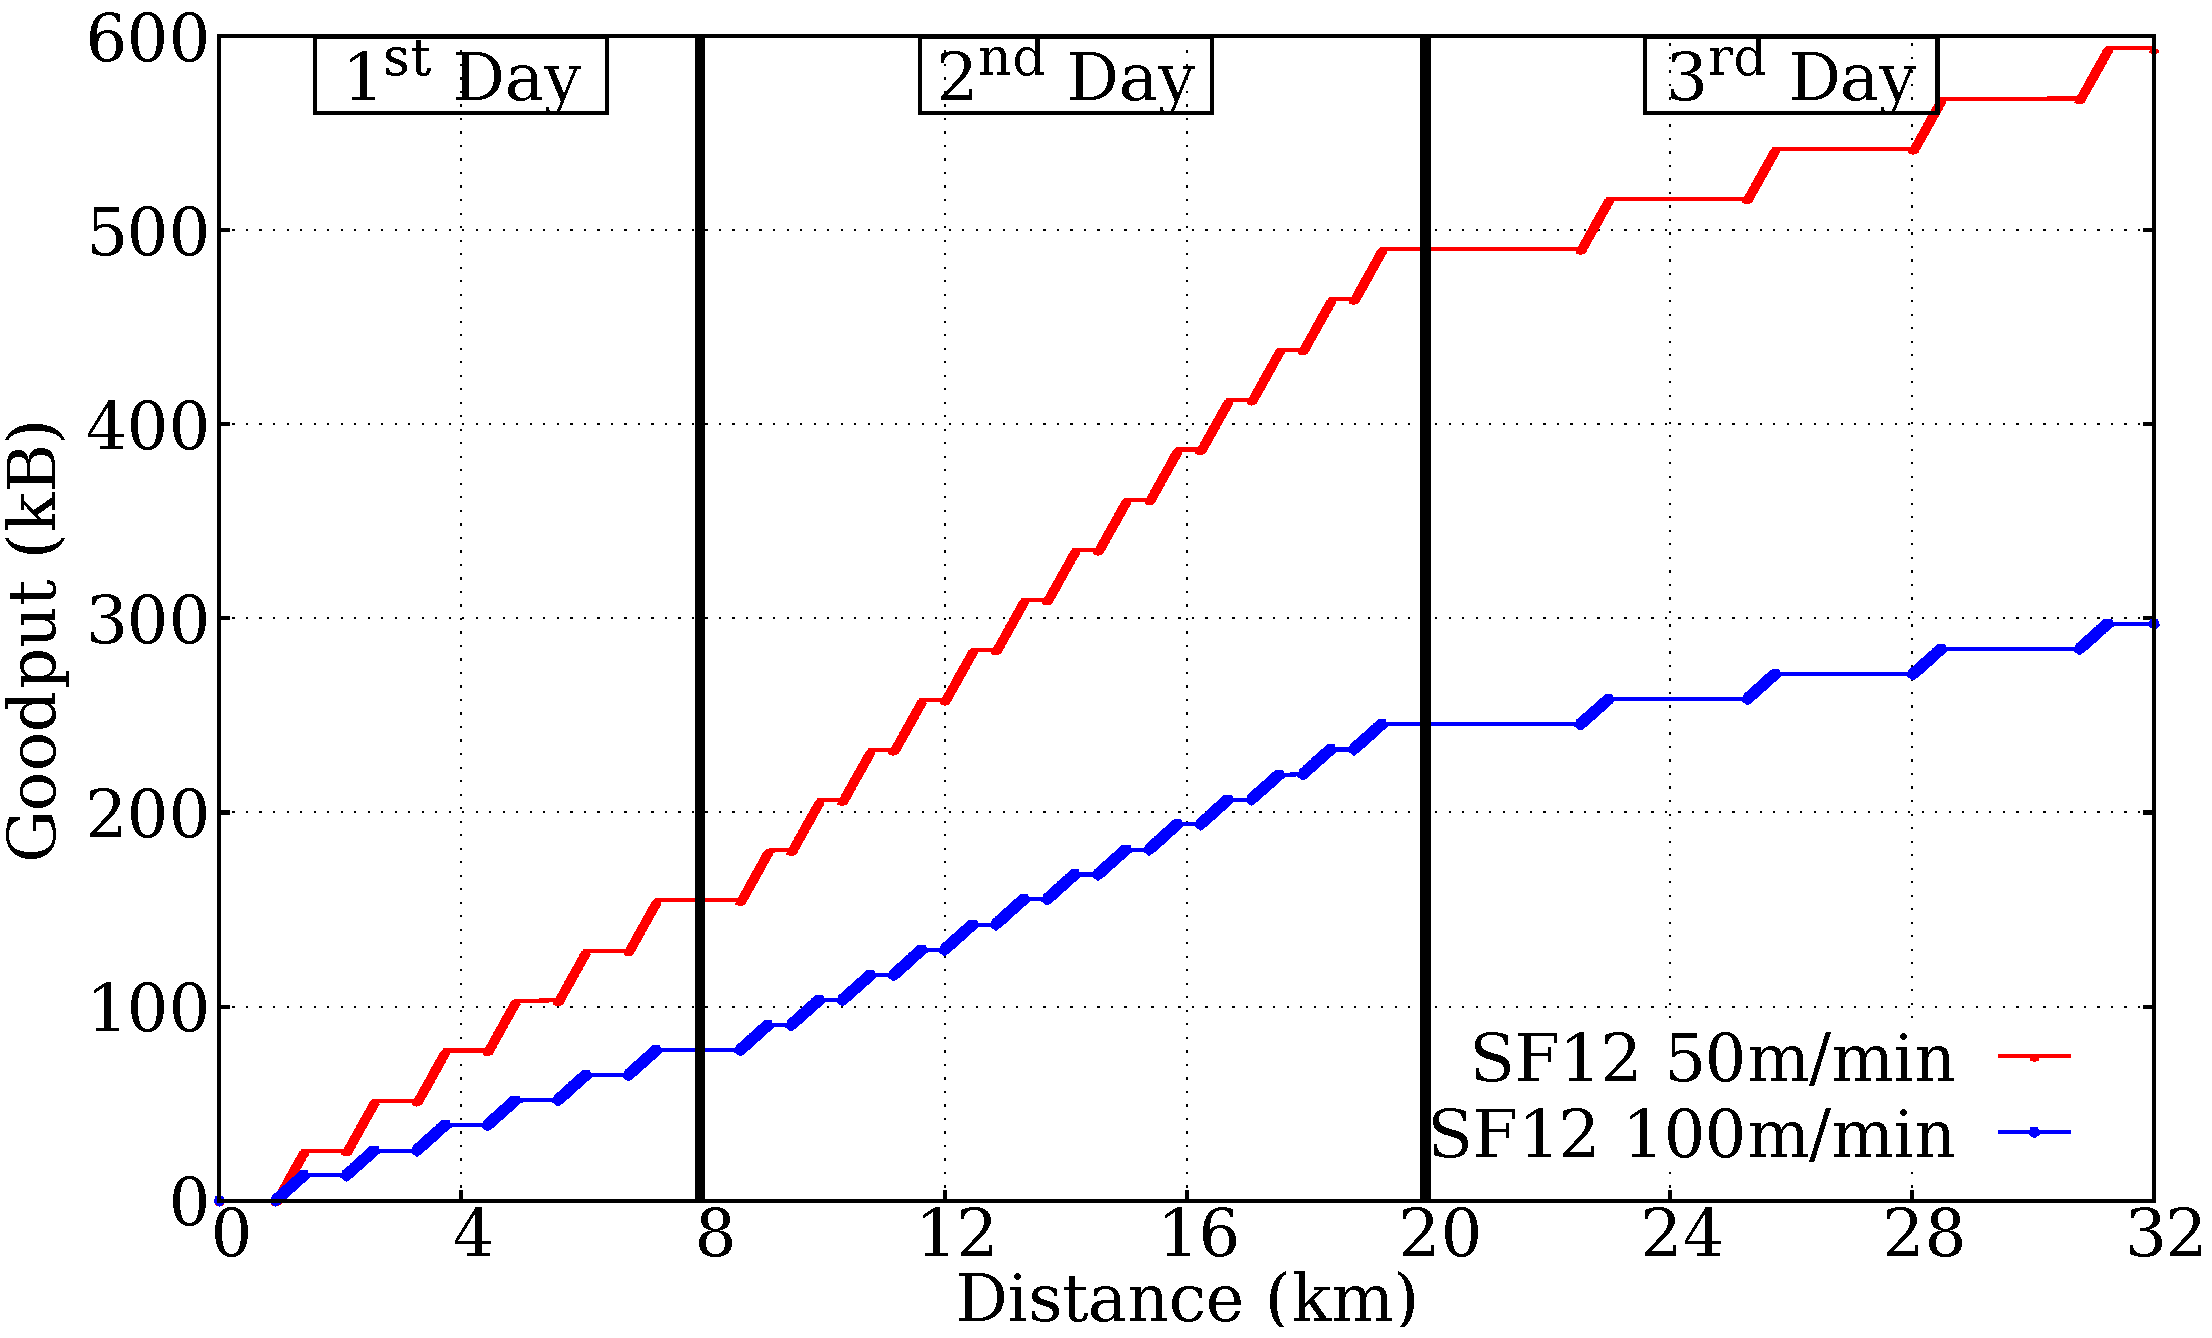
In Figure 20, we evaluate the capacity of transferring data of the simulated network. The maximum daily load produced per visitor expected is of the order of 182 kB in the worst case. This worst-case is defined using the maximum capacity of the mountain shelters, which are 100 visitors. If there is no formation of groups and these 100 visitors walk alone along the trail, their contacts must generate 4950 records per day, combining them 2 to 2. Considering the size of each record of 13 B, from the mobile terminal beacon of 10.5 B and the two acceptance messages added to 13.25 B, we have 36.75 B of transmitted data. Thus, the daily load of approximately 182 kB ( 4950 × 36.75 B) per visitor is reached in the worst-case, with no formation of groups.
However, this requirement is not met using the spreading factor SF12, especially in the stretch of the route with the least totems. This is because the load of data generated per visitor depends on the number of visitors on the trail and the records of encounters between them. The transfer capacity of the network depends on the number of totems in the network. Nevertheless, the amount and positioning of the totems are a function of the risks that each location offers to the visitor or its potential to assist in locating lost visitors. Moreover, the number of packets flowing over the network varies with the contact time, the size of the packets and the spreading factor used.
In Figure 20, we plot the load growth day by day, for the three travel speeds. The red curve represents this growth for a slower visitor, who moves at 3 km/h (50 m/min). As the contact time for this visitor is longer, more packets are sent favoring the greater data transfer. Data produced for each day of the trail have the following sizes:
  • 1st day: approximately 150 kB, below the worst-case load of 182 kB;
  • 2nd day: approximately 500 kB − 150 kB = 350 kB. Above 182 kB;
  • 3rd day: approximately 600 kB − 500 kB = 100 kB. Below 182 kB.
The blue curve represents this growth for a faster visitor, who travels at 6 km/h (100 m/min). As the contact time for this visitor is shorter, fewer packets are sent. We can see the evolution values over the days:
  • 1st day: approximately 80 kB, below the worst-case load of 182 kB;
  • 2nd day: approximately 250 kB − 80 kB = 170 kB. Below 182 kB;
  • 3rd day: approximately 300 kB − 250 kB = 50 kB. Below 182 kB.
The use of other spreading factors for the transfer of records and the grouping of visitors are ways provided in the proposed architecture to deal with this demand, improving the performance of the network, as described in Section 5.2. In this way, the capacity of the network is increased, and the daily data load per visitor transmitted over the network can be reduced, making the monitoring system feasible, even given the hard propagation conditions inside a rainforest.

7. Conclusions

This work dealt with the development of a project to offer an application of assistance to the visitor of forest systems, improving their security. The project consists of the development of a communication infrastructure capable of allowing communication, even in situations of intermittent connectivity. Communication within the forest is used to support an application for monitoring visitors’ location, in which totems and wearable mobile terminals exchange messages. The protocol for exchanging messages and also for controlling access to the medium is presented.
This proposal brings a new application to the concepts of IoT and DTN. This new application with its peculiar characteristics and environment also presents challenges about the networks employed, requiring future performance and safety studies.

Author Contributions

Original idea, formal analysis, experiments and data acquisition were prepared by A.E.F.; experiments and data acquisition were made by F.M.O.; simulation performance was made by T.T.d.A.; supervision, writing—review and technical review were made by L.H.M.K.C. All other work was jointly performed by the team. All authors have read and agreed to the published version of the manuscript.

Funding

This study was financed in part by the Coordenação de Aperfeiçoamento de Pessoal de Nível Superior, Brasil (CAPES), Finance Code 001. It was also supported by CNPq, FAPERJ, FAPERO, and FAPESP Grants 15/24494-8 and 15/24490-2.

Conflicts of Interest

The authors declare no conflict of interest.

References

  1. Crotti, R.; Misrahi, T. The Travel & Tourism Competitiveness Report 2017. Paving the Way for a More Sustainable and Inclusive Future; World Economic Forum: Geneva, Switzerland, 2017. [Google Scholar]
  2. LoRa™-Alliance. LoRa™-Alliance Technology. 2016. Available online: https://www.lora-alliance.org/technology (accessed on 20 December 2019).
  3. Augustin, A.; Yi, J.; Clausen, T.; Townsley, W.M. A study of LoRa: Long range & low power networks for the Internet of things. Sensors 2016, 16, 1466. [Google Scholar]
  4. Bor, M.; Vidler, J.; Roedig, U. LoRa for the Internet of Things. In Proceedings of the International Conference on Embedded Wireless Systems and Networks (EWSN), Graz, Austria, 15 February 2016; pp. 361–366. [Google Scholar]
  5. Marais, J.M.; Malekian, R.; Abu-Mahfouz, A.M. LoRa and LoRaWAN testbeds: A review. In Proceedings of the IEEE AFRICON, Cape Town, South Africa, 20 September 2017; pp. 1496–1501. [Google Scholar]
  6. Semtech Corporation. LoRa™ Modulation Basics AN1200.22. 2015. Available online: https://www.semtech.com/uploads/documents/an1200.22.pdf (accessed on 20 December 2019).
  7. Huang, J.H.; Amjad, S.; Mishra, S. CenWits: A sensor-based loosely coupled search and rescue system using witnesses. In Proceedings of the 3rd International Conference on Embedded Networked Sensor Systems, San Diego, CA, USA, 2–4 November 2005; pp. 180–191. [Google Scholar]
  8. Miller, M.; Lieske, S.; Carter, R.; Walsh, S. Understanding the Interaction Between a Protected Destination System and Conservation Tourism Through Remote Sensing. In Comprehensive Remote Sensing; Elsevier: Amsterdam, The Netherlands, 2018; pp. 123–143. [Google Scholar]
  9. Carbonés Fargas, B. IoT and Tracking Capabilities in LPWANs. Master’s Thesis, Universitat Politècnica de Catalunya, Barcelona, Spain, 2017. [Google Scholar]
  10. Hunkeler, U.; Truong, H.L.; Stanford-Clark, A. MQTT-S—A publish/subscribe protocol for Wireless Sensor Networks. In Proceedings of the 3rd International Conference on Communication Systems Software and Middleware and Workshops (COMSWARE), Bangalore, India, 5–10 January 2008; pp. 791–798. [Google Scholar]
  11. Baharudin, A.M.; Yan, W. Long-range wireless sensor networks for geo-location tracking: Design and evaluation. In Proceedings of the International Electronics Symposium (IES), Bali, Indonesia, 21 September 2016; pp. 76–80. [Google Scholar]
  12. Bouras, C.; Gkamas, A.; Kokkinos, V.; Papachristos, N. Using LoRa technology for IoT monitoring systems. In Proceedings of the 10th International Conference on Networks of the Future (NoF), Rome, Italy, 1 October 2019; pp. 134–137. [Google Scholar]
  13. Sanchez-Iborra, R.; G Liaño, I.; Simoes, C.; Couñago, E.; Skarmeta, A.F. Tracking and monitoring system based on LoRa technology for lightweight boats. Electronics 2019, 8, 15. [Google Scholar] [CrossRef] [Green Version]
  14. Joshi, A.; VishnuKanth, I.N.; Samdaria, N.; Bagla, S.; Ranjan, P. GPS-less animal tracking system. In Proceedings of the 4th International Conference on Wireless Communication and Sensor Networks (WCSN), Wuhan, China, 17 December 2008; pp. 120–125. [Google Scholar]
  15. Jiang, L.; Huang, J.H.; Kamthe, A.; Liu, T.; Freeman, I.; Ledbetter, J.; Mishra, S.; Han, R.; Cerpa, A. SenSearch: GPS and witness assisted tracking for delay tolerant sensor networks. In Proceedings of the International Conference on Ad-Hoc Networks and Wireless, Luxembourg, 3 October 2009; pp. 255–269. [Google Scholar]
  16. Huang, Y.T.; Chen, Y.C.; Huang, J.H.; Chen, L.J.; Huang, P. YushanNet: A delay-tolerant wireless sensor network for hiker tracking in Yushan national park. In Proceedings of the 10th International Conference on Mobile Data Management: Systems, Services and Middleware, Taipei, Taiwan, 25 October 2009; pp. 379–380. [Google Scholar]
  17. Burghardt, D.; Edwardes, A.; Weibel, R. WebPark–Entwicklung eines mobilen Informationssystems für Erholungs-und Naturschutzgebiete. Kartographische Nachrichten 2003, 53, 58–64. (In German) [Google Scholar] [CrossRef]
  18. Gonçalves, A. Projecto Webpark-Informação Geográfica Relevante para Visitantes de Áreas Protegidas. In Actas do eSIG2004-VIII Encontro de Utilizadores de Informação Geográfica, Lisboa (Poster); LNEC/DHA/GTI-Relatorios Cientificos: Lisboa, Portugal, 2004. (In Portuguese) [Google Scholar]
  19. Krug, K.; Mountain, D.; Phan, D. Location-based services for mobile users in protected areas. GeoInformatics 2003, 6, 26–29. [Google Scholar]
  20. Lawson, S.R.; Manning, R.E.; Valliere, W.A.; Wang, B. Proactive monitoring and adaptive management of social carrying capacity in Arches National Park: An application of computer simulation modeling. J. Environ. Manag. 2003, 68, 305–313. [Google Scholar] [CrossRef]
  21. Son, B.; Her, Y.s.; Kim, J.G. A design and implementation of forest-fires surveillance system based on wireless sensor networks for South Korea mountains. Int. J. Comput. Sci. Network Secur. 2006, 6, 124–130. [Google Scholar]
  22. Rao, T.R.; Balachander, D.; Kiran, A.N.; Oscar, S. RF propagation measurements in forest & plantation environments for Wireless Sensor Networks. In Proceedings of the International Conference on Recent Trends in Information Technology, Chennai, Tamil Nadu, India, 19–21 April 2012; pp. 308–313. [Google Scholar]
  23. Tsai, M. Path-Loss and Shadowing (Large-Scale Fading); Technical Report; National Taiwan University: Taipei, Taiwan, 2011. [Google Scholar]
  24. Nakagami, M. The m-distribution—A general formula of intensity distribution of rapid fading. In Statistical Methods in Radio Wave Propagation; Pergamon: Oxford, UK, 1960; pp. 3–36. [Google Scholar]
  25. Abdi, A.; Kaveh, M. On the utility of gamma PDF in modeling shadow fading (slow fading). In Proceedings of the IEEE 49th Vehicular Technology Conference, Houston, TX, USA, 20 May 1999; Volume 3, pp. 2308–2312. [Google Scholar]
  26. Goursaud, C.; Gorce, J.M. Dedicated networks for IoT: PHY/MAC state of the art and challenges. EAI Endorsed Trans. Int. Things 2015, 15, 1–11. [Google Scholar] [CrossRef]
  27. Raza, U.; Kulkarni, P.; Sooriyabandara, M. Low Power Wide Area Networks: An Overview. IEEE Commun. Surveys Tutor. 2017, 19, 855–873. [Google Scholar] [CrossRef] [Green Version]
  28. Cerf, V.; Burleigh, S.; Hooke, A.; Torgerson, L.; Durst, R.; Scott, K.; Fall, K.; Weiss, H. Delay-Tolerant Networking Architecture. RFC 4838. 2007. Available online: https://tools.ietf.org/html/rfc4838 (accessed on 20 December 2019).
  29. Scott, K.; Burleigh, S.C. Bundle Protocol Specification. RFC 5050. 2007. Available online: https://tools.ietf.org/html/rfc5050 (accessed on 20 December 2019).
  30. Ferreira, A.E.; Ortiz, F.M.; Costa, L.H.M.K. Avaliação de Tecnologias de Comunicação Sem-Fio para Monitoramento em Ambientes de Floresta. In Proceedings of the Anais do XXXVII Simpósio Brasileiro de Redes de Computadores e Sistemas Distribuídos, Gramado, Brazil, 6 May 2019; pp. 116–129. (In Portuguese). [Google Scholar]
  31. AG, U.H. NEO-6: U-blox 6 GPS Modules Data Sheet. 2011. Available online: https://www.u-blox.com/sites/default/files/products/documents/NEO-6_DataSheet_(GPS.G6-HW-09005).pdf (accessed on 20 December 2019).
  32. De Queiroz, G.F.C.; Ferreira, A.E.; Ortiz, F.M.; Couto, R.S.; Costa, L.H.M.K. Posicionamento de Pontos de Acesso Sem-fio para Segurança de Visitantes em Parques Florestais. In Proceedings of the Anais do XXXVI Simpósio Brasileiro de Redes de Computadores e Sistemas Distribuídos, Campos do Jordão, Brazil, 6 May 2018. (In Portuguese). [Google Scholar]
  33. Stutzman, W.L.; Thiele, G.A. Antenna Theory and Design, 3rd ed.; John Wiley & Sons: Hoboken, NJ, USA, 2012. [Google Scholar]
  34. Henderson, T.R.; Lacage, M.; Riley, G.F.; Dowell, C.; Kopena, J. Network simulations with the ns-3 Simulator. In SIGCOMM Demonstration; Association for Computing Machinery: Seattle, WA, USA, 2008; Volume 14, p. 527. [Google Scholar]
  35. Hammersley, J. Monte Carlo Methods; Springer Science & Business Media: Berlin/Heidelberg, Germany, 2013. [Google Scholar]
  36. Magrin, D.; Centenaro, M.; Vangelista, L. Performance evaluation of LoRa networks in a smart city scenario. In Proceedings of the IEEE International Conference on Communications (ICC), Paris, France, 25 May 2017; pp. 1–7. [Google Scholar]
  37. Ferreira, A.E.; Ortiz, F.M.; Costa, L.H.M.K. Caracterização de Disrupções na Faixa ISM de 900 MHz em Ambiente de Floresta. In Proceedings of the XXXVII Simpósio Brasileiro de Telecomunicações e Processamento de Sinais (SBrT), Petrópolis, Brazil, 2 October 2019. (In Portuguese). [Google Scholar]
  38. Rappaport, T.S. Wireless Communications: Principles and Practice; Prentice Hall: Upper Saddle River, NJ, USA, 1996; Volume 2. [Google Scholar]
Figure 1. Vegetation and experiment location.
Electronics 09 00696 g001
Figure 2. Measuring location map and prototypes. (a) Map of the site of experiments at PARNASO (https://www.icmbio.gov.br/parnaserradosorgaos/). (b) The pole-mounted prototype node.
Electronics 09 00696 g002
Figure 3. Probability Density Function (PDF) of average power measurements (W) for LoRa SF12 at a distance of 250 m.
Electronics 09 00696 g003
Figure 4. PDF of instantaneous power measurements (W) for LoRa SF12 at a distance of 250 m.
Electronics 09 00696 g004
Figure 5. Nakagami-m and Gamma composite PDF.
Electronics 09 00696 g005
Figure 6. Network scheme.
Electronics 09 00696 g006
Figure 7. Short-term static scenario.
Electronics 09 00696 g007
Figure 8. Two mobile nodes scenario.
Electronics 09 00696 g008
Figure 9. Message types and format.
Electronics 09 00696 g009
Figure 10. Communication between terminals.
Electronics 09 00696 g010
Figure 11. Communication between totem and terminal.
Electronics 09 00696 g011
Figure 12. Communication in an emergency situation.
Electronics 09 00696 g012
Figure 13. Route of Petrópolis—Teresópolis crossing.
Electronics 09 00696 g013
Figure 14. Second day trail landscape.
Electronics 09 00696 g014
Figure 15. Locations for installing totems.
Electronics 09 00696 g015
Figure 16. Received Signal Strength Indicator (RSSI) vs. distance—50 m/min—simulated vs. practical.
Electronics 09 00696 g016
Figure 17. RSSI vs. distance—100 m/min - simulated vs. practical.
Electronics 09 00696 g017
Figure 18. Packet Delivery Ratio (PDR) vs. distance—50 m/min—simulated vs. practical.
Electronics 09 00696 g018
Figure 19. PDR vs. distance—100 m/min—simulated vs. practical.
Electronics 09 00696 g019
Figure 20. Accumulated load offered to the network as a function of distance and speed of the visitor (mobile node) in the trail.
Electronics 09 00696 g020
Table 1. Hardware components used in the prototype nodes.
DescriptionValue
ControllerArduino Uno R3
Wireless interfaceDragino RF96
GPS ReceiverU-blox NEO-6M
AntennaMonopole 7dBi
Transmission antenna height1.5 m
Supply Current in Receive Mode10.8 mA
Supply Current in Transmit Mode120 mA
Table 2. Configuration parameters.
DescriptionValue
Frequency915 MHz
Bandwidth500 kHz
Code Rate4/5
Transmission Power14 dBm
Table 3. Simulation parameters in NS-3.
DescriptionValue
Track length29 km
Number of receivers (totems)23
Receiving antenna height2.5 m
PHY ProtocolLoRa
Spreading FactorSF12
Frequency915 MHz
Bandwidth500 kHz
Code Rate4/5
Mobile speed50 m/min (3 km/h)
100 m/min (6 km/h)
Transmission antenna height1.5 m
Transmission power14 dBm
Packet size47 bytes
Number of executions10 rounds