1. Introduction
Outdoor high voltage insulators are exposed to various types of stresses. Stresses include mechanical, electrical, thermal, and environmental stresses. To simulate the effect of these stresses in the laboratory, different types of techniques are used. High-voltage stresses and artificial rain and fog are a few examples. The critical flashover voltage of insulators depends on the insulator design, surface roughness, orientation, rain, humidity, temperature, fogs, Ultraviolet (UV) radiations, wind speed, direction, and distance from the pollution source [
1,
2]. Although the performance of outdoor insulators is affected by many parameters, pollution deposition on the insulator surface is considered a major factor in the deteriorating performance of insulators. Pollution deposition on outdoor insulators surface may be due to industrial emissions, salt spray from the sea, and chemicals’ emissions from vehicles and or agriculture. The change in the performance of outdoor insulators due to pollution deposition depends on the type of pollution constituents. Generally, pollution deposited on the insulator surface is classified into two major types: inert pollution and active pollution. The effect of active and inert pollution on the insulator performance is different resulting in errors of flashover voltage calculations [
3].
Intelligent techniques such as fuzzy logic [
4], Support Vector Machine (SVM) [
5], Artificial Neural Networks (ANN) [
6,
7,
8], Hidden Markov Model (HMM) [
9], K-means clustering [
10], Discrete Wavelet Transform (DWT) [
11], S-Transform [
12], have been extensively used in electrical power system and high voltage engineering problems. These intelligent systems can be successfully utilized for the condition monitoring of high-voltage outdoor insulators to increase the reliability of power system transmission and distribution as well as minimize human efforts and cost [
13].
With the increase in transmission line voltages and increased distance of renewable power sources from the loads, the importance of research on the pollution performance of insulators has significantly increased. The mechanism of flashover in high voltage porcelain, glass, and ceramic insulators under contamination has been studied extensively in the past [
14,
15,
16]. Many researchers have proposed mathematical models to predict the critical flashover voltage under uniform and non-uniform pollution [
17,
18]. An improved mathematical model has been proposed in Reference [
19] to estimate pollution flashover voltage of ceramic insulators based on dimensional analysis of the flashover influencing parameters. Shahabi et al. [
20] studied the flashover process of outdoor insulators by adding a random value to the discharge length to account for wind speed, direction, and thermal convection on the discharge. Palangar et al. [
21] proposed an improved dynamic model for predicting the critical flashover parameters of ceramic insulators by incorporating capacitance in the equivalent circuit of the dry band.
Apart from mathematical and numerical modeling, many researchers have proposed intelligent systems such as ANN for flashover voltage prediction [
6,
8,
22]. Salem et al. [
22] combined Adaptive Neuro Fuzzy Inference System (ANFIS) with ANN and used insulator height, diameter, form factor, creepage distance along with Equivalent Salt Deposit Density (ESDD) as input parameters to train the model. In Reference [
23], the authors applied dimensional analysis to the proposed ANFIS-based ANN network by establishing a relationship between critical flashover voltage and leakage current. The arc constant of the mathematical model for obtaining the test data was optimized using a Genetic Algorithm (GA) for improved results.
Another important intelligent technique used for flashover prediction is SVM, which offers the advantage of global optimality. Least Square SVM (LS-SVM) was proposed in Reference [
24] for prediction of pollution severity and critical flashover voltage based on insulator diameter, height, ESDD, and form factor. Ming-Yuan et al. [
25] estimated insulator leakage current using SVM by finding correlation between weather conditions and leakage current. Different meteorological parameters were combined with leakage current parameters generated from different types of insulators. Gencoglu et al. [
26] proposed LS-SVM for prediction of flashover voltage by generating the training data set from numerical models based on Finite Element Method (FEM). The LS-SVM parameters were tuned using a grid search algorithm for improved accuracy.
Saranya et al. [
27,
28] proposed a new method for condition monitoring of outdoor insulators by identifying insulator arc faults using phasor angle measurements. The insulator arcs have been classified using SVM to support the design of improved protection schemes for smart grids. A modified LS-SVM scheme has been proposed by applying a fixed set of support vectors to predict the critical flashover voltage under polluted conditions [
5]. The Quadratic Renyi Criterion (QRC) is used to select support vectors from the training data set.
The existing literature demonstrates considerable work on the application of intelligent systems in predicting the flashover voltage of outdoor high voltage insulators. However, there are specific gaps in the current knowledge which need to be further investigated. The existing ANN algorithms used the Gradient Descent (GD) algorithm due to its faster convergence and lower computation time by compromising the prediction accuracy. The current literature also considered insulator height, diameter, form factor, and ESDD as input parameters for flashover prediction, while the flashover voltage also depends on environmental conditions such as temperature, humidity, and non-soluble pollution. Apart from that, fixing the number of neurons, learning rates, and the number of hidden layers significantly changes the prediction accuracy of ANN, which needs to be investigated. One of the major limitations of existing ANN-based prediction models is that most of them rely on data from mathematical models which are based on a particular assumption. Additionally, current mathematical models are applicable to porcelain and glass insulators and cannot be applied to polymeric insulators without modification due to the different flashover mechanism of polymeric insulators as compared to porcelain and glass insulators.
2. Materials and Methods
ANN and other machine learning algorithms have been used to predict critical flashover voltage, leakage current, and ESDD. However, there are some limitations of the existing literature such as; (1) use of insulator dimensions and pollution severity as input parameters for learning and ignoring the environmental conditions (humidity and temperature); (2) using a single learning algorithm for training, for example, GD in most cases; (3) the training data set is either small or generated from mathematical models. This paper presents an intelligent system for flashover voltage prediction of polymeric insulators using experimental results as a training data set for training the ANN. The experimental results of critical flashover voltage are obtained under controlled environmental conditions. To increase the sample space and accuracy of the proposed model, bootstrapping is applied to the actual data set. The proposed NN model is tested for different learning algorithms such as GD, Levenberg-Marquardt (LM), Conjugate Gradient (CG), Quasi-Newton (QN), Resilient Backpropagation (RBP) and Bayesian Regularization Backpropagation (BRBP). The number of neurons in the hidden layer, the number of hidden layers, as well as learning rate, are varied to obtain the optimum parameters. The prediction accuracy of each model is tested using Root Mean Square Error (RMSE), Mean Absolute Percentage Error (MAPE), Regression Value (R) and Normalized Mean Square Error (NRMSE).
2.1. Experimental Setup and Test Methods
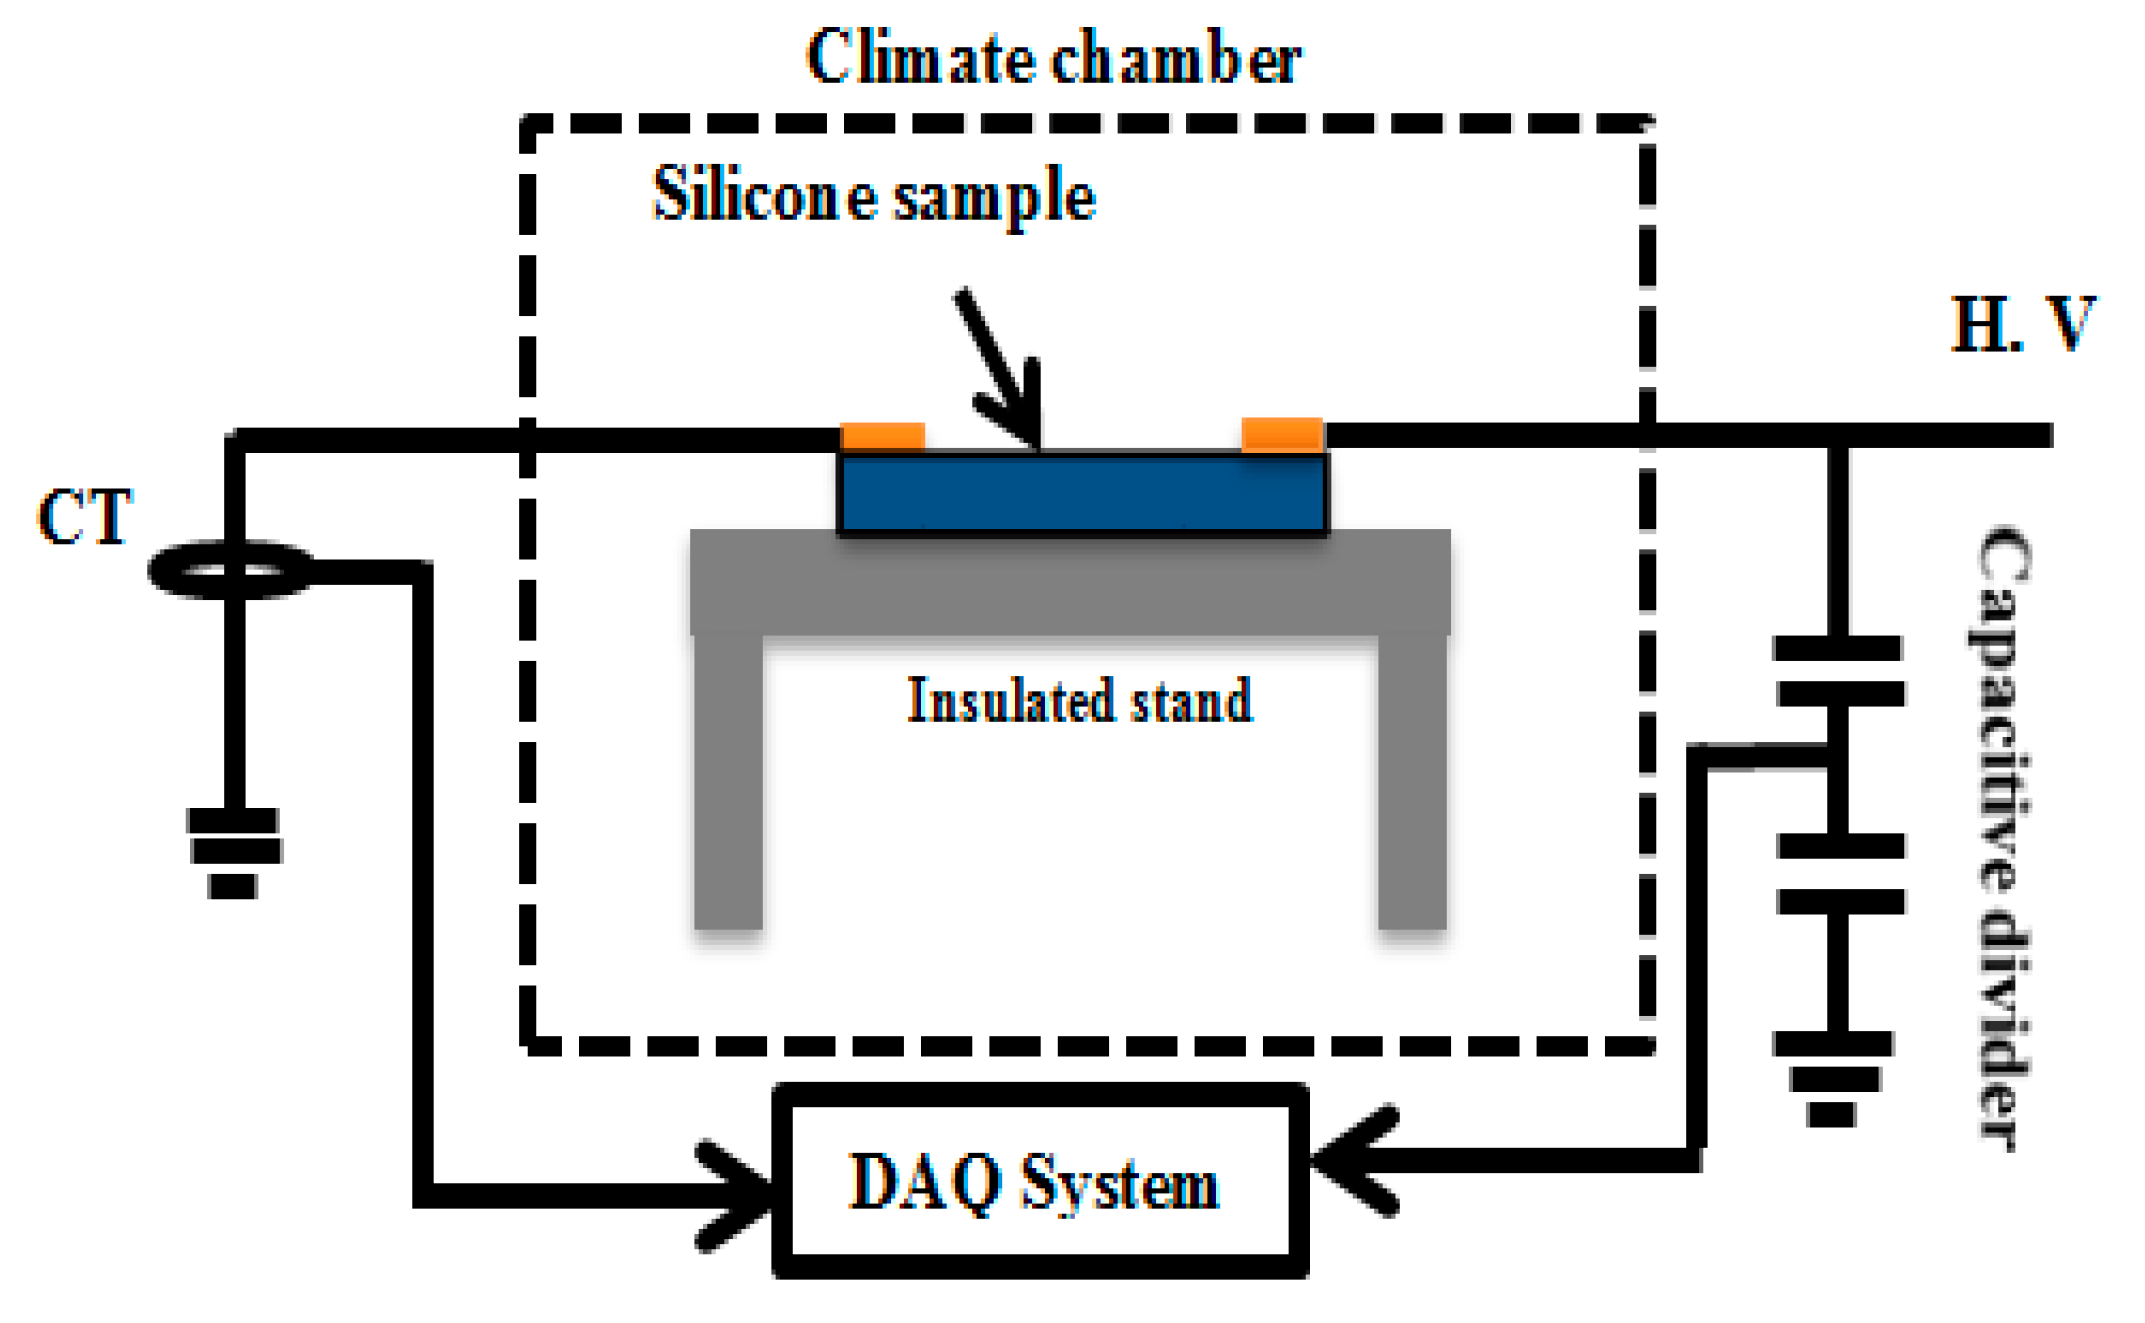
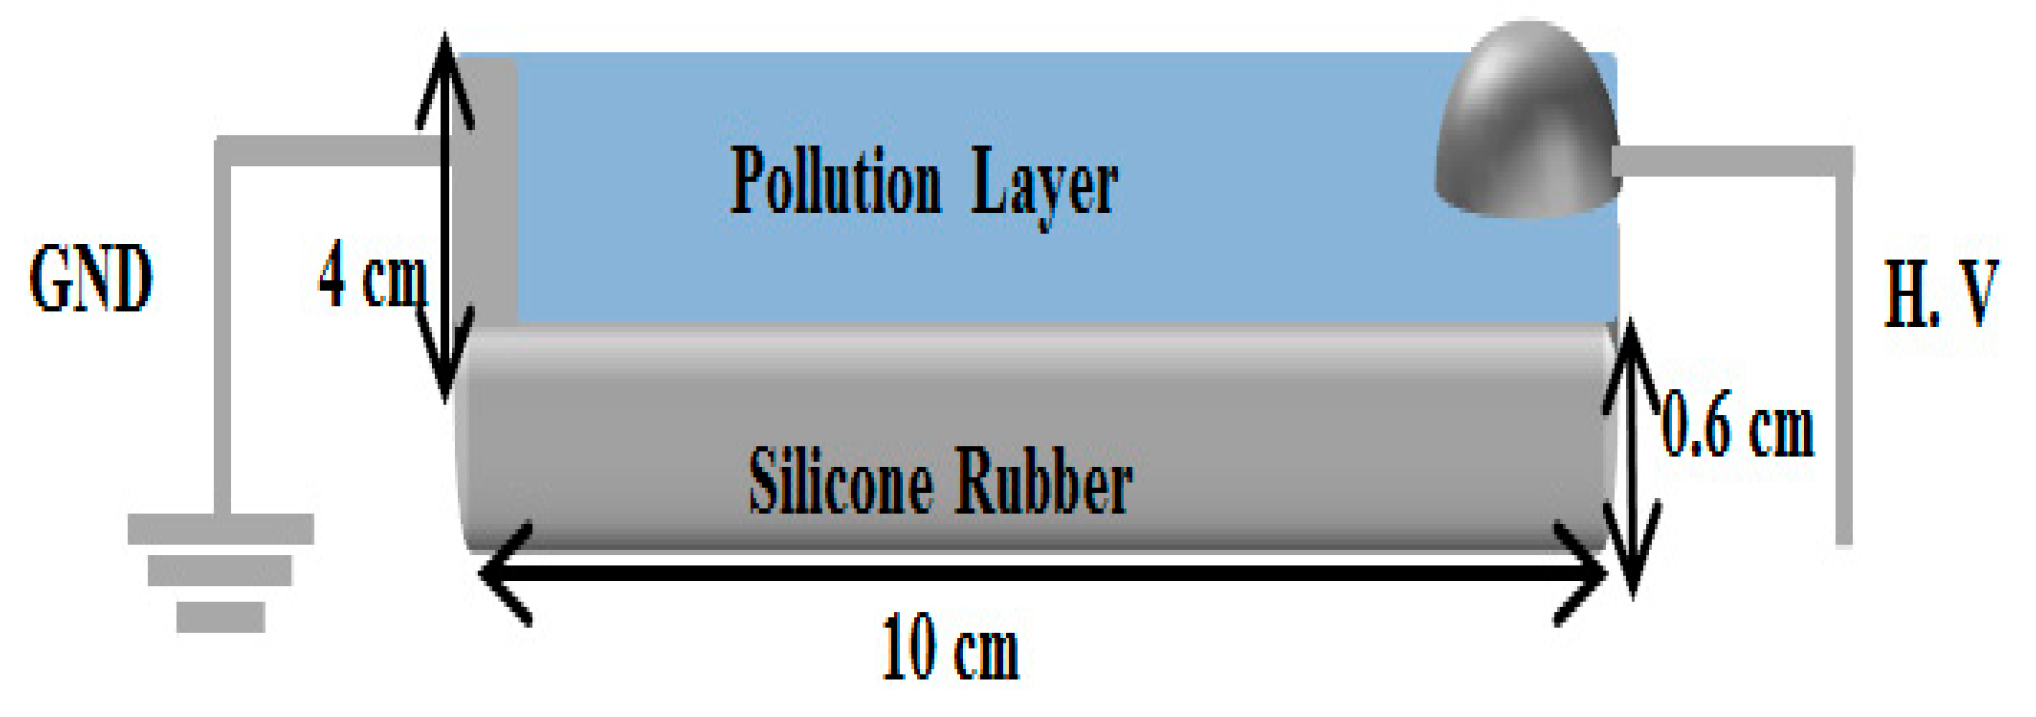
High voltage tests were performed on rectangular samples of HTV silicone rubber under controlled environmental conditions. The clean fog method (solid layer) based on modified IEC 60507 was used to apply soluble and non-soluble pollution on the insulator samples. The test setup and sample configuration are shown in
Figure 1 and
Figure 2, respectively. The insulator samples were energised using a power frequency 0–100 kV test transformer. Before energising, samples were placed in the climate chamber for a considerable amount of time to make sure no dry bands were present, and the samples were properly wetted. Initial tests were performed on a uniformly polluted sample to determine the probable flashover voltage. Once the probable flashover voltage was determined, the remaining tests were performed by applying voltage in steps of 5% of the probable flashover voltage. Each step was maintained for 2 min, and if no partial arcs appeared, the voltage was increased further. In the case of appearance of a partial arc, the voltage was kept constant at that step until the partial arc vanished or lead to flashover. This process was repeated for each sample. As silicone rubber loses its hydrophobicity under energization, the sample was replaced after every two tests. This helped in maintaining the uniform pollution layer and the hydrophobic nature of silicone rubber.
Experimental Results
Air pollution deposited on the insulator surfaces can be broadly classified into two major types: active and inert. Active pollution is represented with ESDD, while inert pollution is represented with NSDD. NSDD is the non-soluble part of pollution such as dust, cement, or sand, which does not dissolve in water but forms a thick layer on the surface of the insulator, which may affect the flashover behavior. The effect of ESDD and NSDD is different on flashover voltage of polymeric insulators as presented in Reference [
1].
Figure 3 shows the relationship between critical flashover voltage and ESDD at different values of NSDD. A total of 16 tests were performed at different combinations of ESDD and NSDD. The results show that as the value of ESDD and NSDD increases, the critical flashover voltage decreases. This is mainly due to the increase in leakage current due to the increased conductivity of the pollution layer, as well as the increased thickness of the pollution layer when NSDD is increased. The increase in the thickness of the pollution layer resists the recovery of hydrophobicity and facilitates uniform wetting of the pollution layer, resulting in increased leakage current. The temperature and humidity were kept constant during these tests to minimize the effect of environmental conditions.
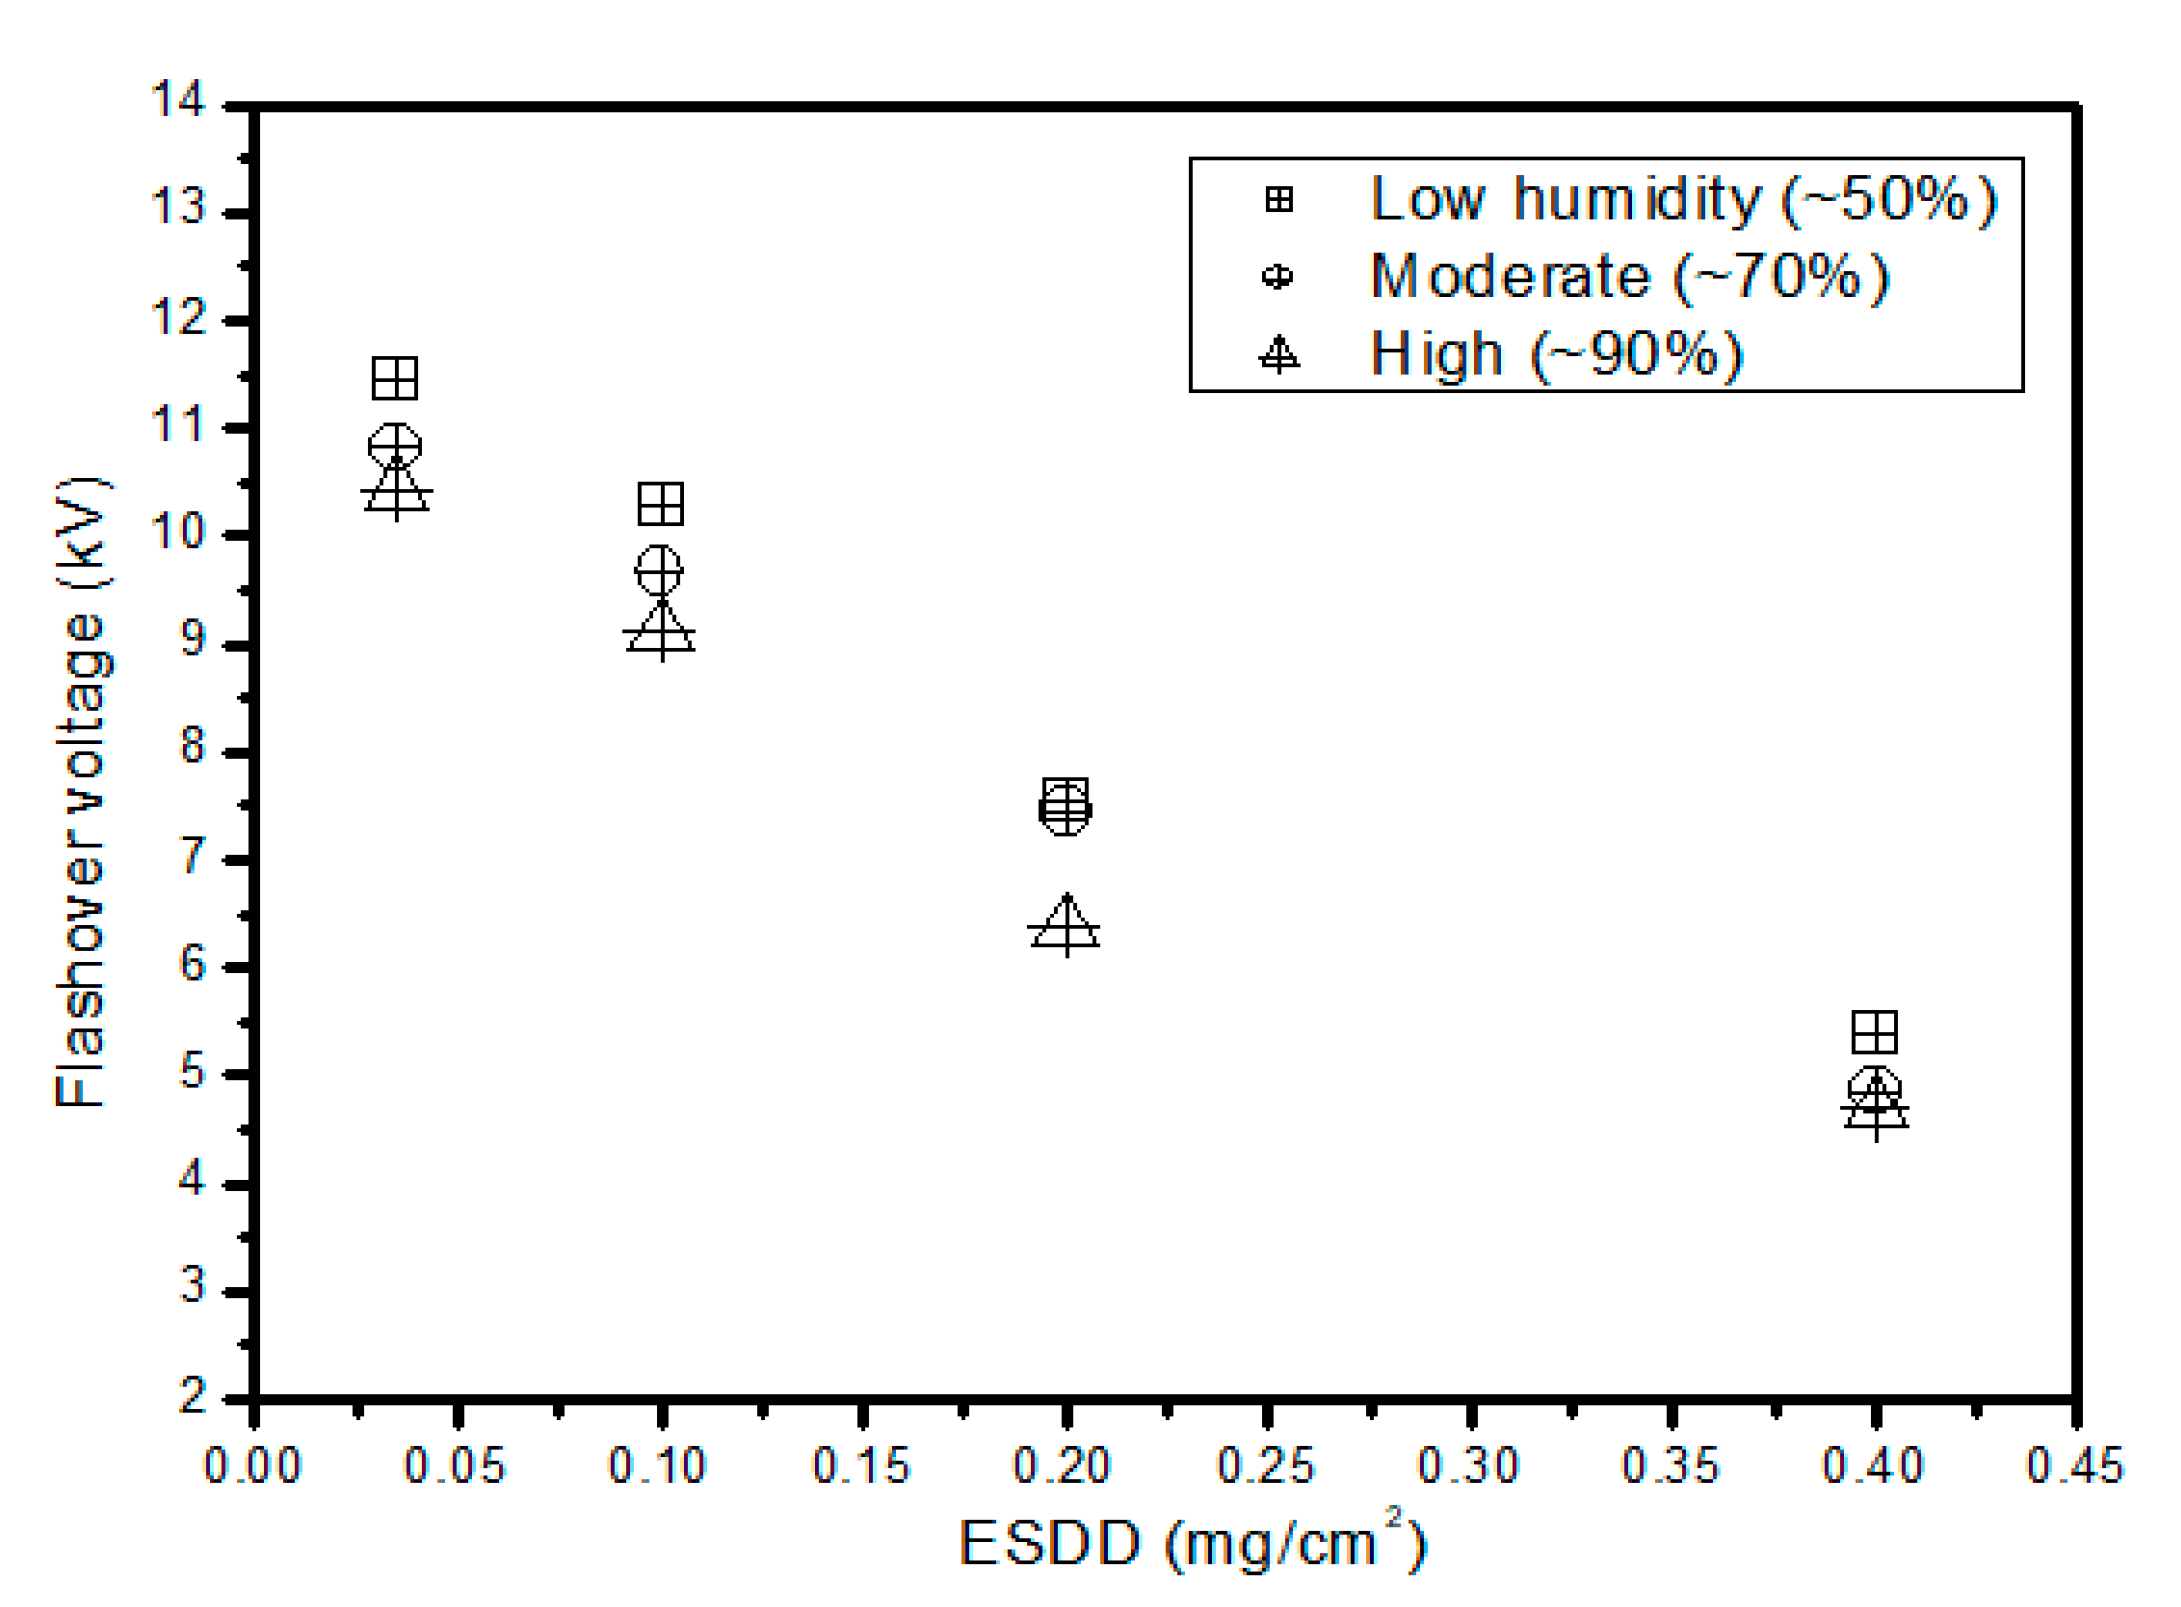
The effect of relative humidity on critical flashover voltage is shown in
Figure 4. The relative humidity was varied within the climate chamber, while temperature and NSDD were kept constant. Samples with different ESDD values were tested. The critical flashover voltage decreased as humidity and ESDD increased. This may be due to the increase in pollution constituent dissolving in the humid air surrounding the insulator.
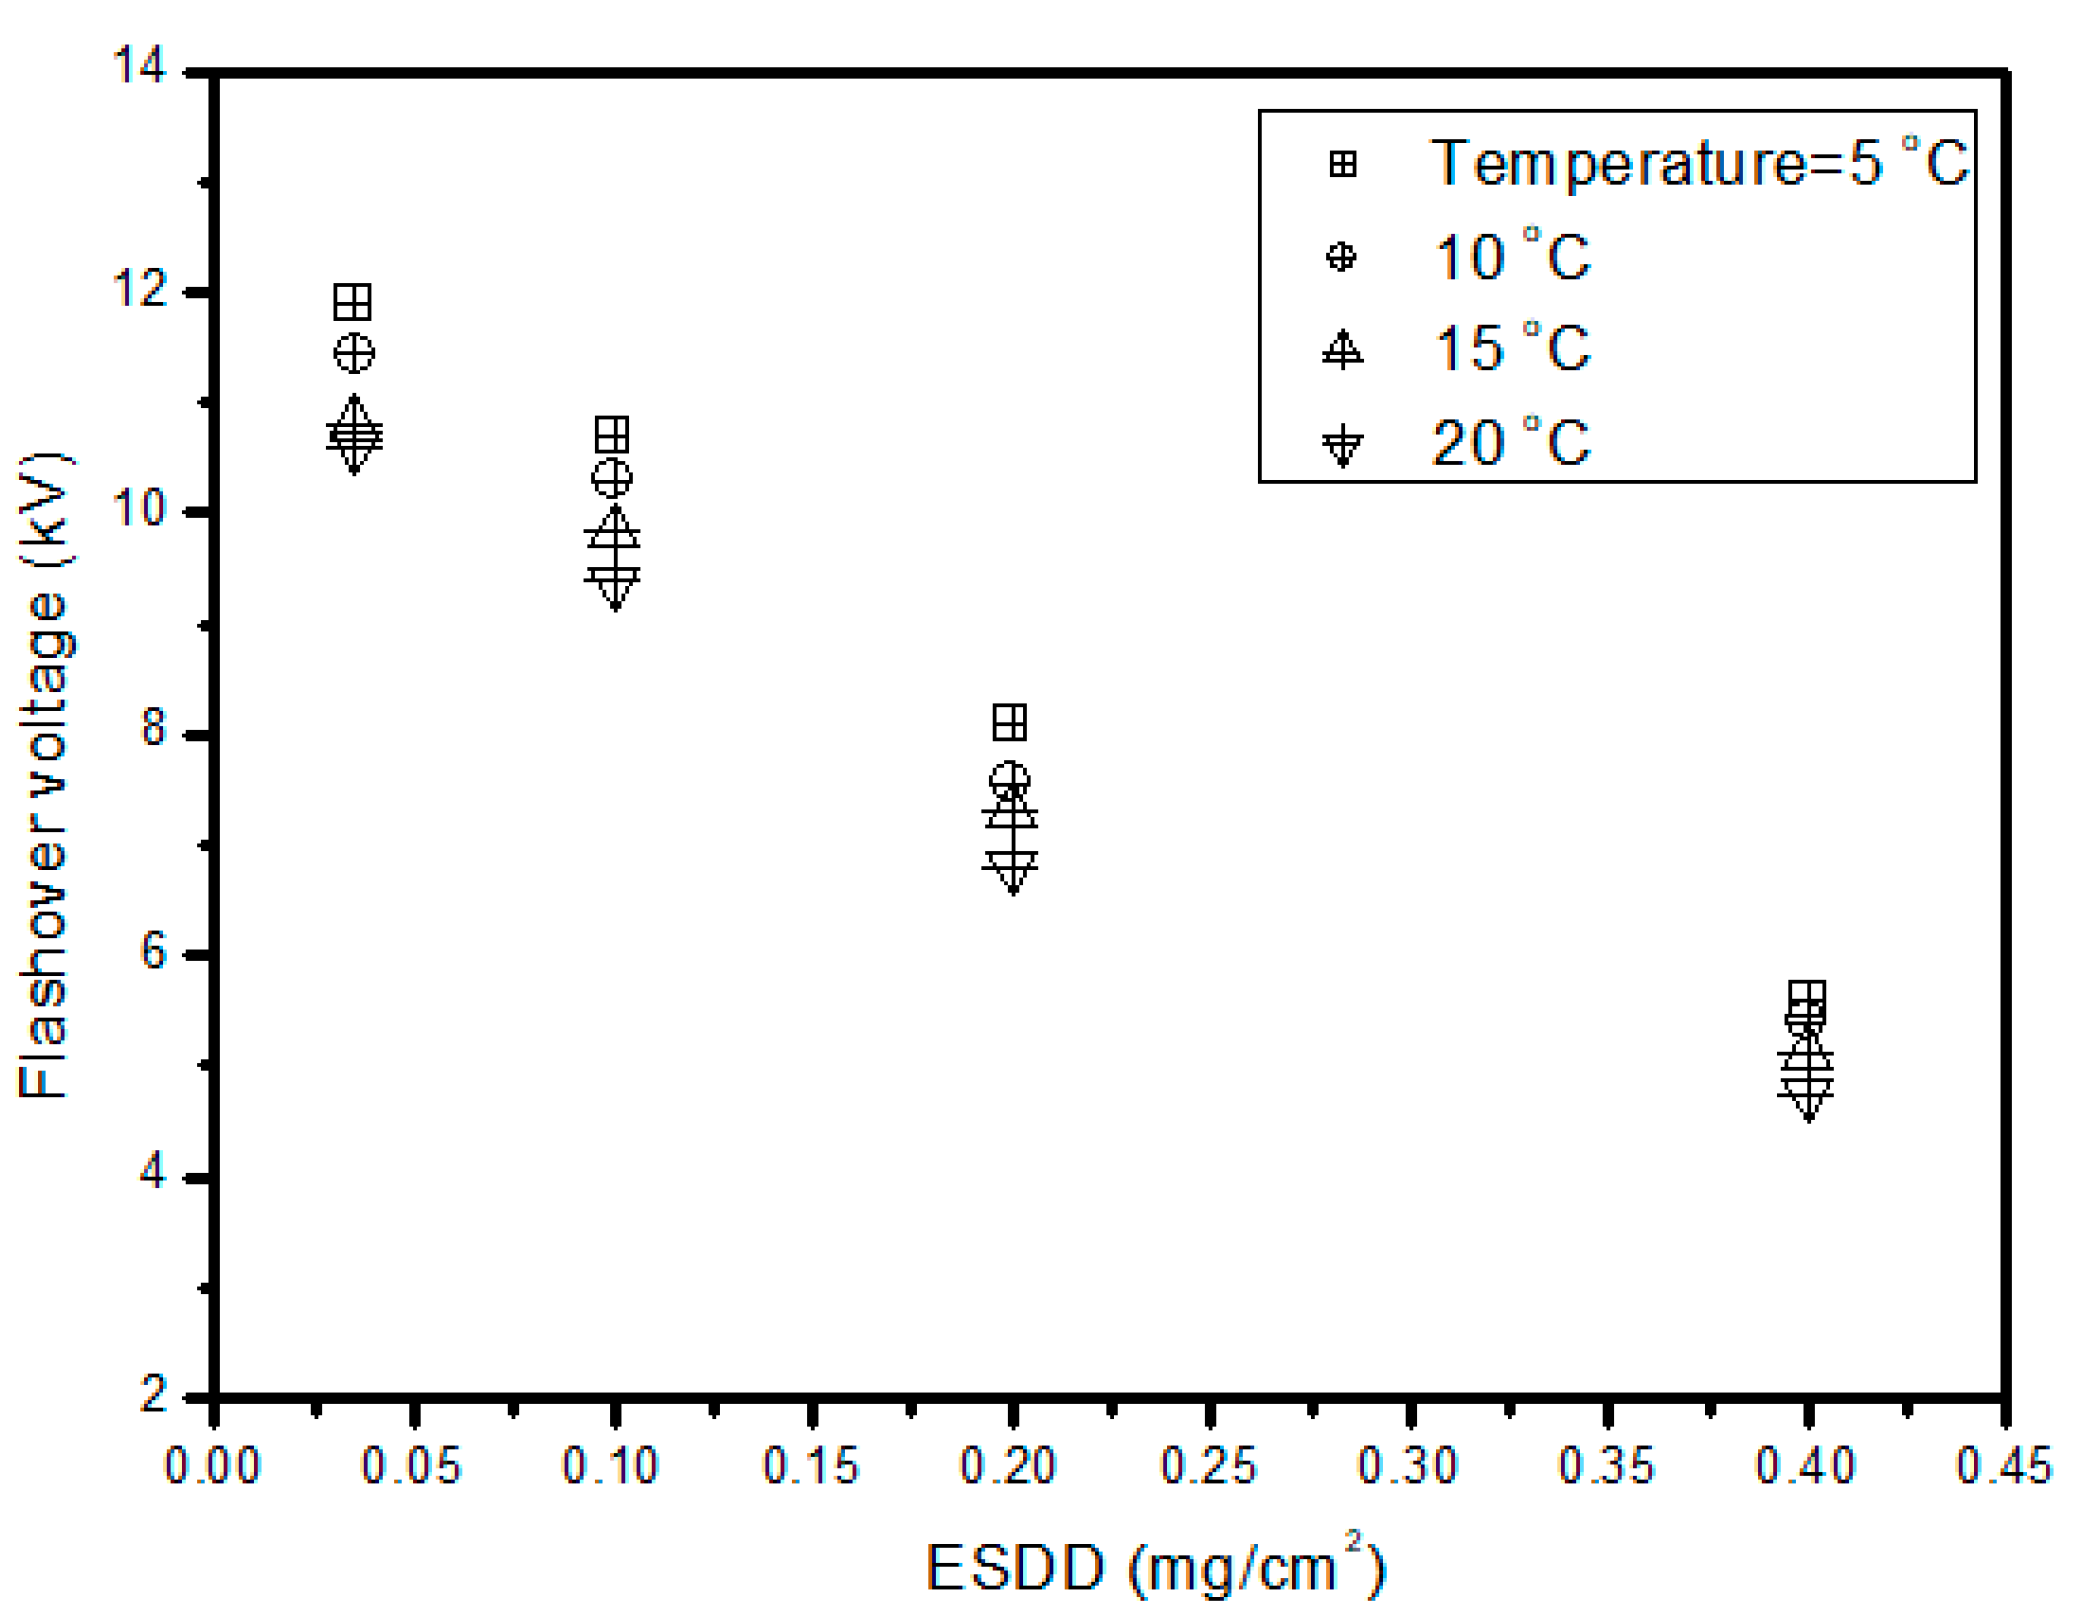
Apart from humidity, inert, and active pollution, ambient temperature also affects the flashover process. The influence of high temperature on insulator performance in desert conditions has been investigated in the literature. However, here, the focus is on the effect of temperature under polluted and humid conditions, which influence the hydrophobicity loss and recovery process of polymeric insulators. The results of the critical flashover voltage at four different temperature values are shown in
Figure 5. It can be observed that critical flashover voltage decreases with an increase in temperature and ESDD. There can be multiple explanations, such as a change in the hydrophobicity recovery process and conductivity of the pollution layer. However, the obtained results show that as the temperature increases, the conductivity of the pollution layer increases, which leads to an increase in leakage current, decrease in surface resistance, and critical flashover voltage.
2.2. Proposed Artificial Neural Network Algorithm
Machine learning algorithms such as ANN can be effectively used in high voltage engineering to minimize cost and time of experimentation. In this work, we proposed a machine learning algorithm based on NN to predict the critical flashover voltage of outdoor high voltage insulators. Details about the proposed machine learning algorithm are given in the following section.
2.2.1. Bootstrapping Method
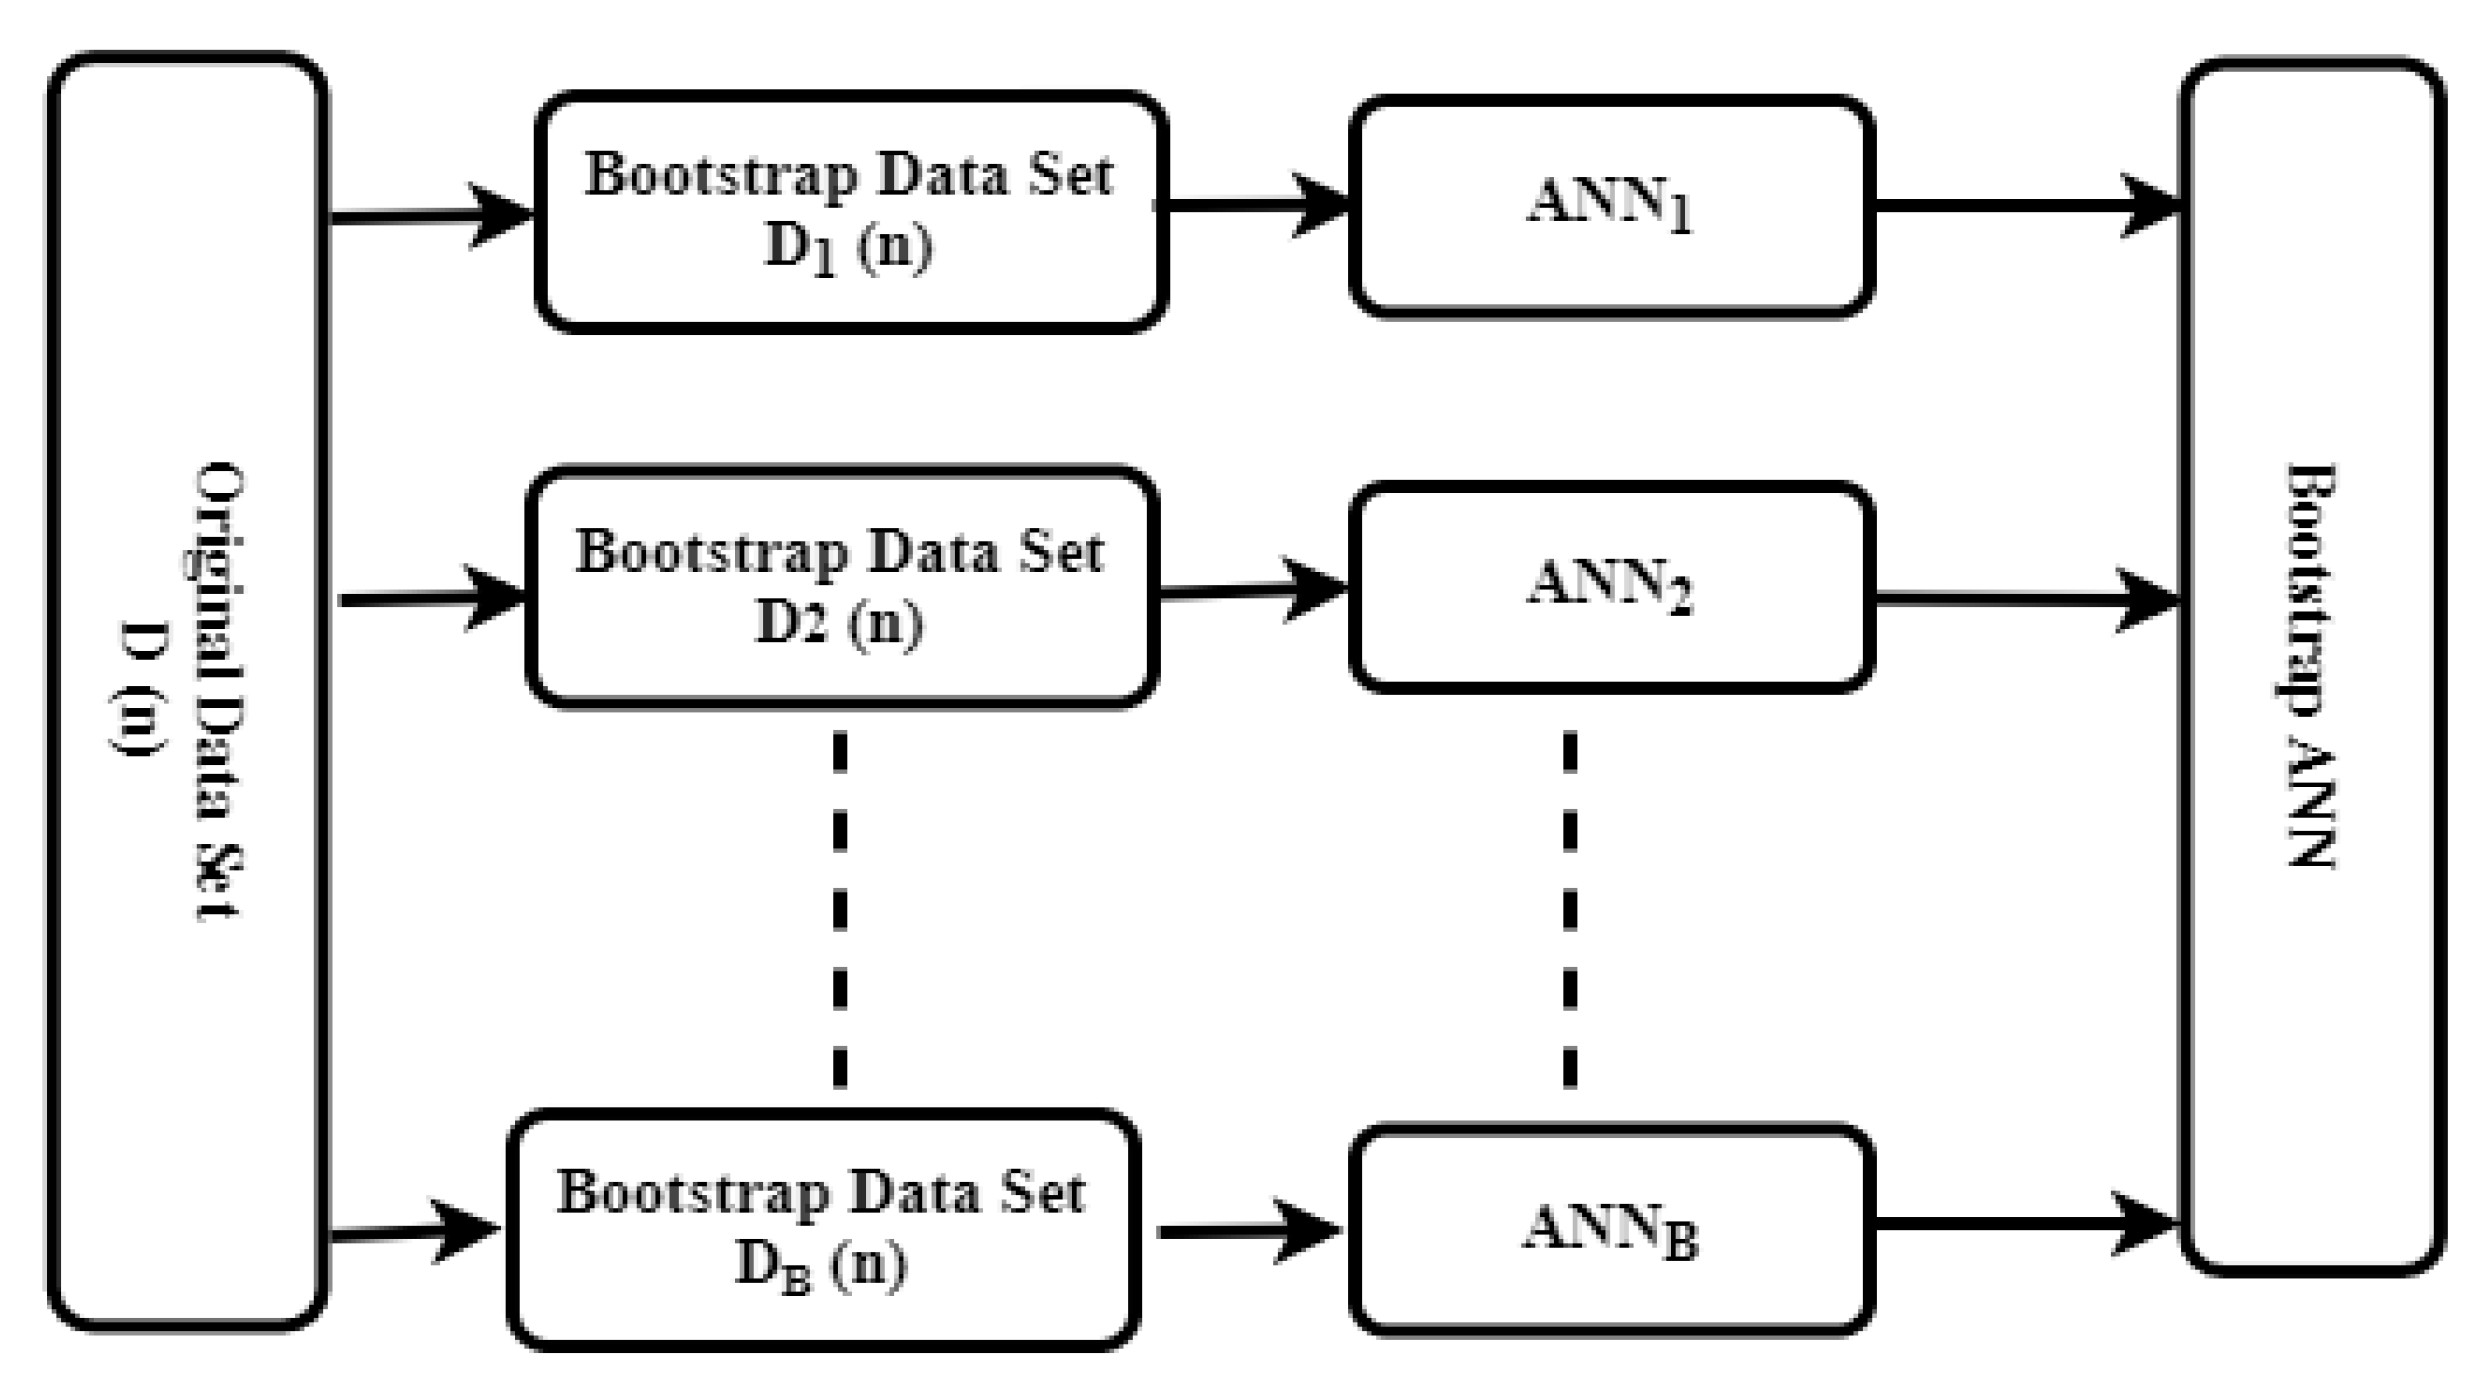
Bootstrapping, or sometimes called bagging, is a statistical technique to increase the sample space when a limited number of data samples are available for training machine learning algorithms. Apart from increasing the number of observations, bootstrapping also offers the advantage of improved accuracy as well as increased effectiveness of percentage estimation. A bootstrap sample is a random sample conducted with replacement; it means the number of times a random observation is selected from the real data. Rather than relying on the theory, which gives the sets of all possible estimates, the bootstrap generates estimates through re-sampling distribution named bootstrap distribution, and the standard deviation of all estimates is called the bootstrap standard error. There are two main reasons to use the bootstrap approach instead of large sample theory approach: one is the lack of large sample data, and the other is to workout with the standard error of the estimates.
In this technique, sampling is performed by extracting only one sample at a time from a given data, and the selected sample is returned to the data set. In this way, the sample appears more than once in the given test data in the next iteration. This method of sampling is known as sampling with replacement. The bootstrap method can be summarized as [
29]:
Select the number of samples which need to be extracted from given data
Select the appropriate size of selected samples
For each selected sample, perform sampling with replacement
Compute the various statistical parameters of the given data
Lastly, compute the mean of all statistical parameters.
In this paper, a two-dimensional chaos map known as Tangent Delay Ellipse Reflecting Cavity Map System (TD-ERCS) was applied for the random selection of samples. This technique is used widely for the generation of random numbers and permutations. This type of chaos system is preferred for the bootstrapping method because of its equiprobability and nonlinear nature [
30]. TD-ERCS can be generalized as:
where
n = 1, 2, 3, …
Here
μ,
,
α and
m are the seed parameters. These seed parameters are used as the key in random number generation from the TD-ERCS map. Random sequences are denoted by
and
in Equations (1) and (2). Machine learning algorithms were trained by taking 100 bootstrap samples, and 44 observations were made for each bootstrap sample. Given data was tested by using unselected observations. For each chosen sample, performance matrices as well as average value (
) were computed. Moreover, the deviation of each value from the average value was described in terms of standard deviation (STD). A schematic diagram of the bootstrapping method is shown in
Figure 6.
2.2.2. Artificial Neural Network
ANN is a specialized computer program that is trained through various learning algorithms for the identification of any linear or non-linear relationship between variables of interest in any raw data set. ANN is gaining importance in almost every field of life, ranging from business, social sciences, to engineering and sciences, mainly because of its exceptional large data handling and analyzing capability. A significant amount of research work has already been conducted, both for offline and online state monitoring, in power engineering through ANN [
31,
32]. In the implementation of ANN analysis, it is very crucial to devise a suitable ANN model with valid input and output variables. Proper scrutiny of data is very important as it ensures the preciseness of acquired results. Once the ANN model is developed, it can then be utilized for accurate estimation of an output variable by using a given set of input values.
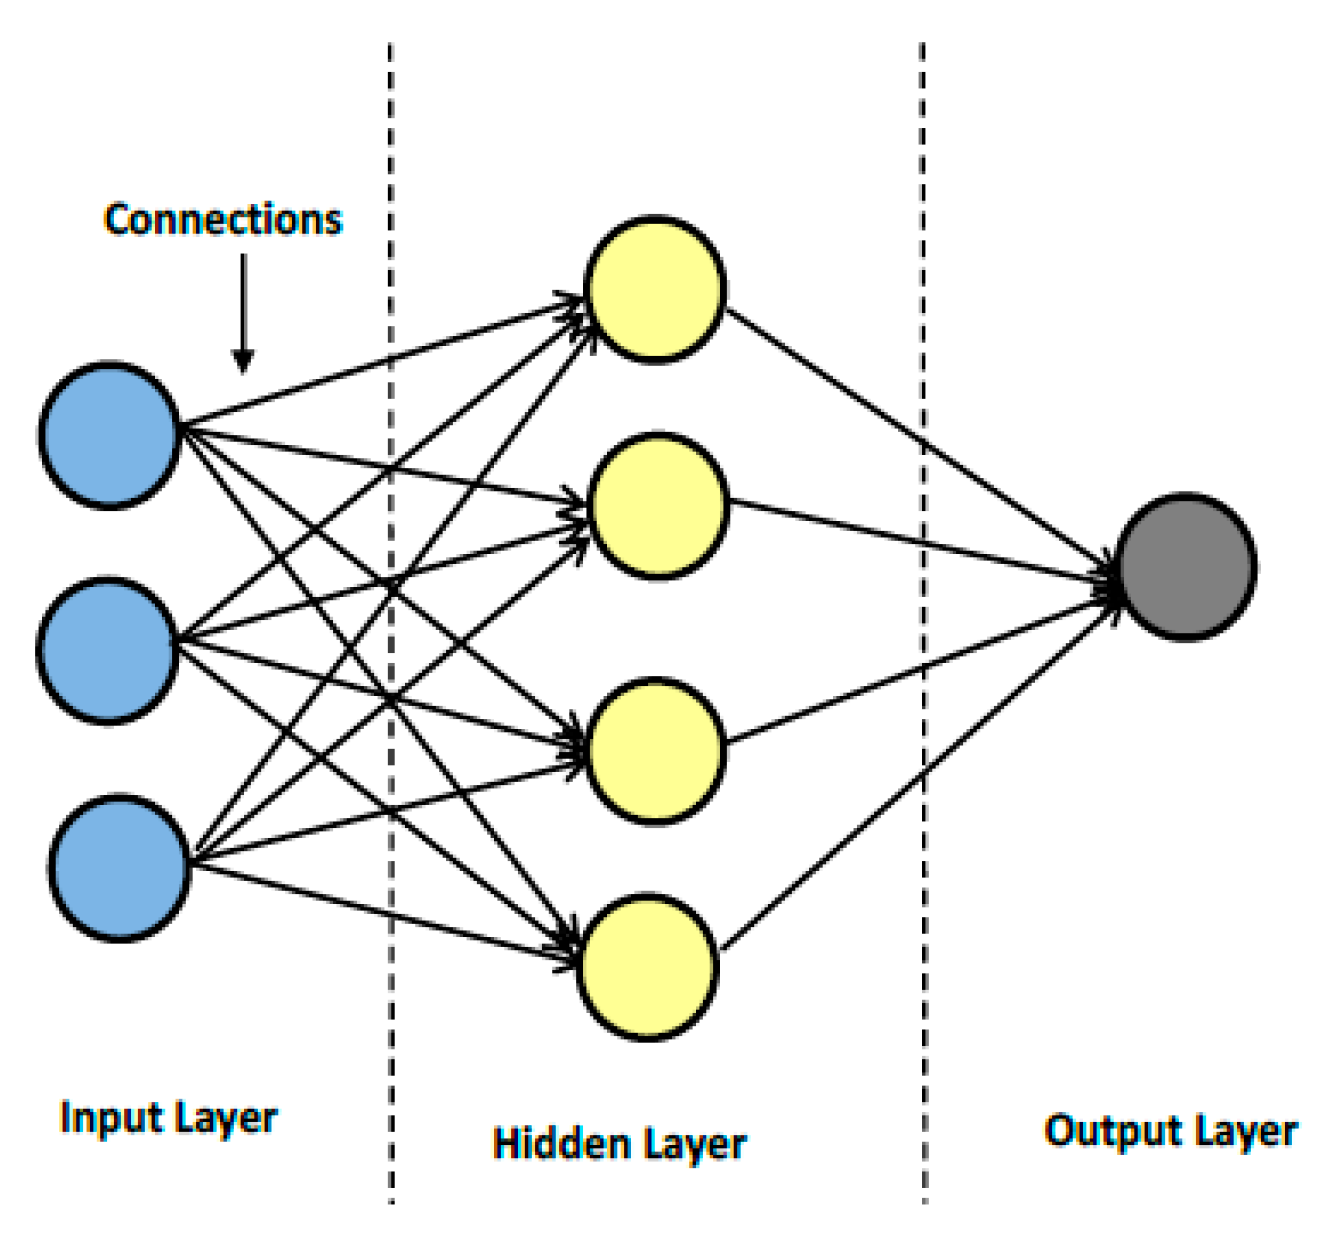
The main processing entity in the ANN model is the neuron. ANN contains many neurons which are linked to each other through specialized information-carrying pathways known as interconnections. There can be multiple inputs to a single neuron, and it can have one or more outputs. Generally, external stimuli or outputs of any other neuron act as the input to the given neuron. One possibility is that output of a neuron is fed back as the input to the same neuron. Each interconnection of neurons is associated with a weight. The output is produced only if the weighted sum of all neurons acting as input to a certain neuron crosses a predefined weighted sum limit. The ANN model contains three basic layers: the input layer, output layer, and one or more hidden layers. The number of neurons in each layer should be decided while implementing the ANN [
33]. A schematic diagram of a typical ANN network is shown in
Figure 7.
The ANN model used in this work has four inputs (ESDD, NSDD, humidity, temperature) and one output (Flashover voltage), as shown in
Figure 8. The number of neurons in the hidden layer and the number of hidden layers were varied to study the effect of varying the number of neurons and hidden layers on the performance of each algorithm. Apart from that, six different types of training algorithms were used.
To avoid saturation while training the ANN model, it is important to perform normalization of the given data set. There are two different ways in which normalization can be performed. In the first method, normalization is achieved by considering only maximum values of input and output variables, while in the second method, both maximum and minimum values are considered. In this case, we used the first method of normalization as described below. If there are
p = 1, 2, 3 …,
number of patterns,
i = 1, 2, 3,…,
number of input values, and
k = 1, 2, 3,…,
the number of output values. Then,
Therefore, normalized values are
After normalization, the input and output values will be between 0 and 1. The different types of learning algorithms used in this study such as GD, LM, CG, QN, RBP and BRBP are given in
Appendix A.
3. Results
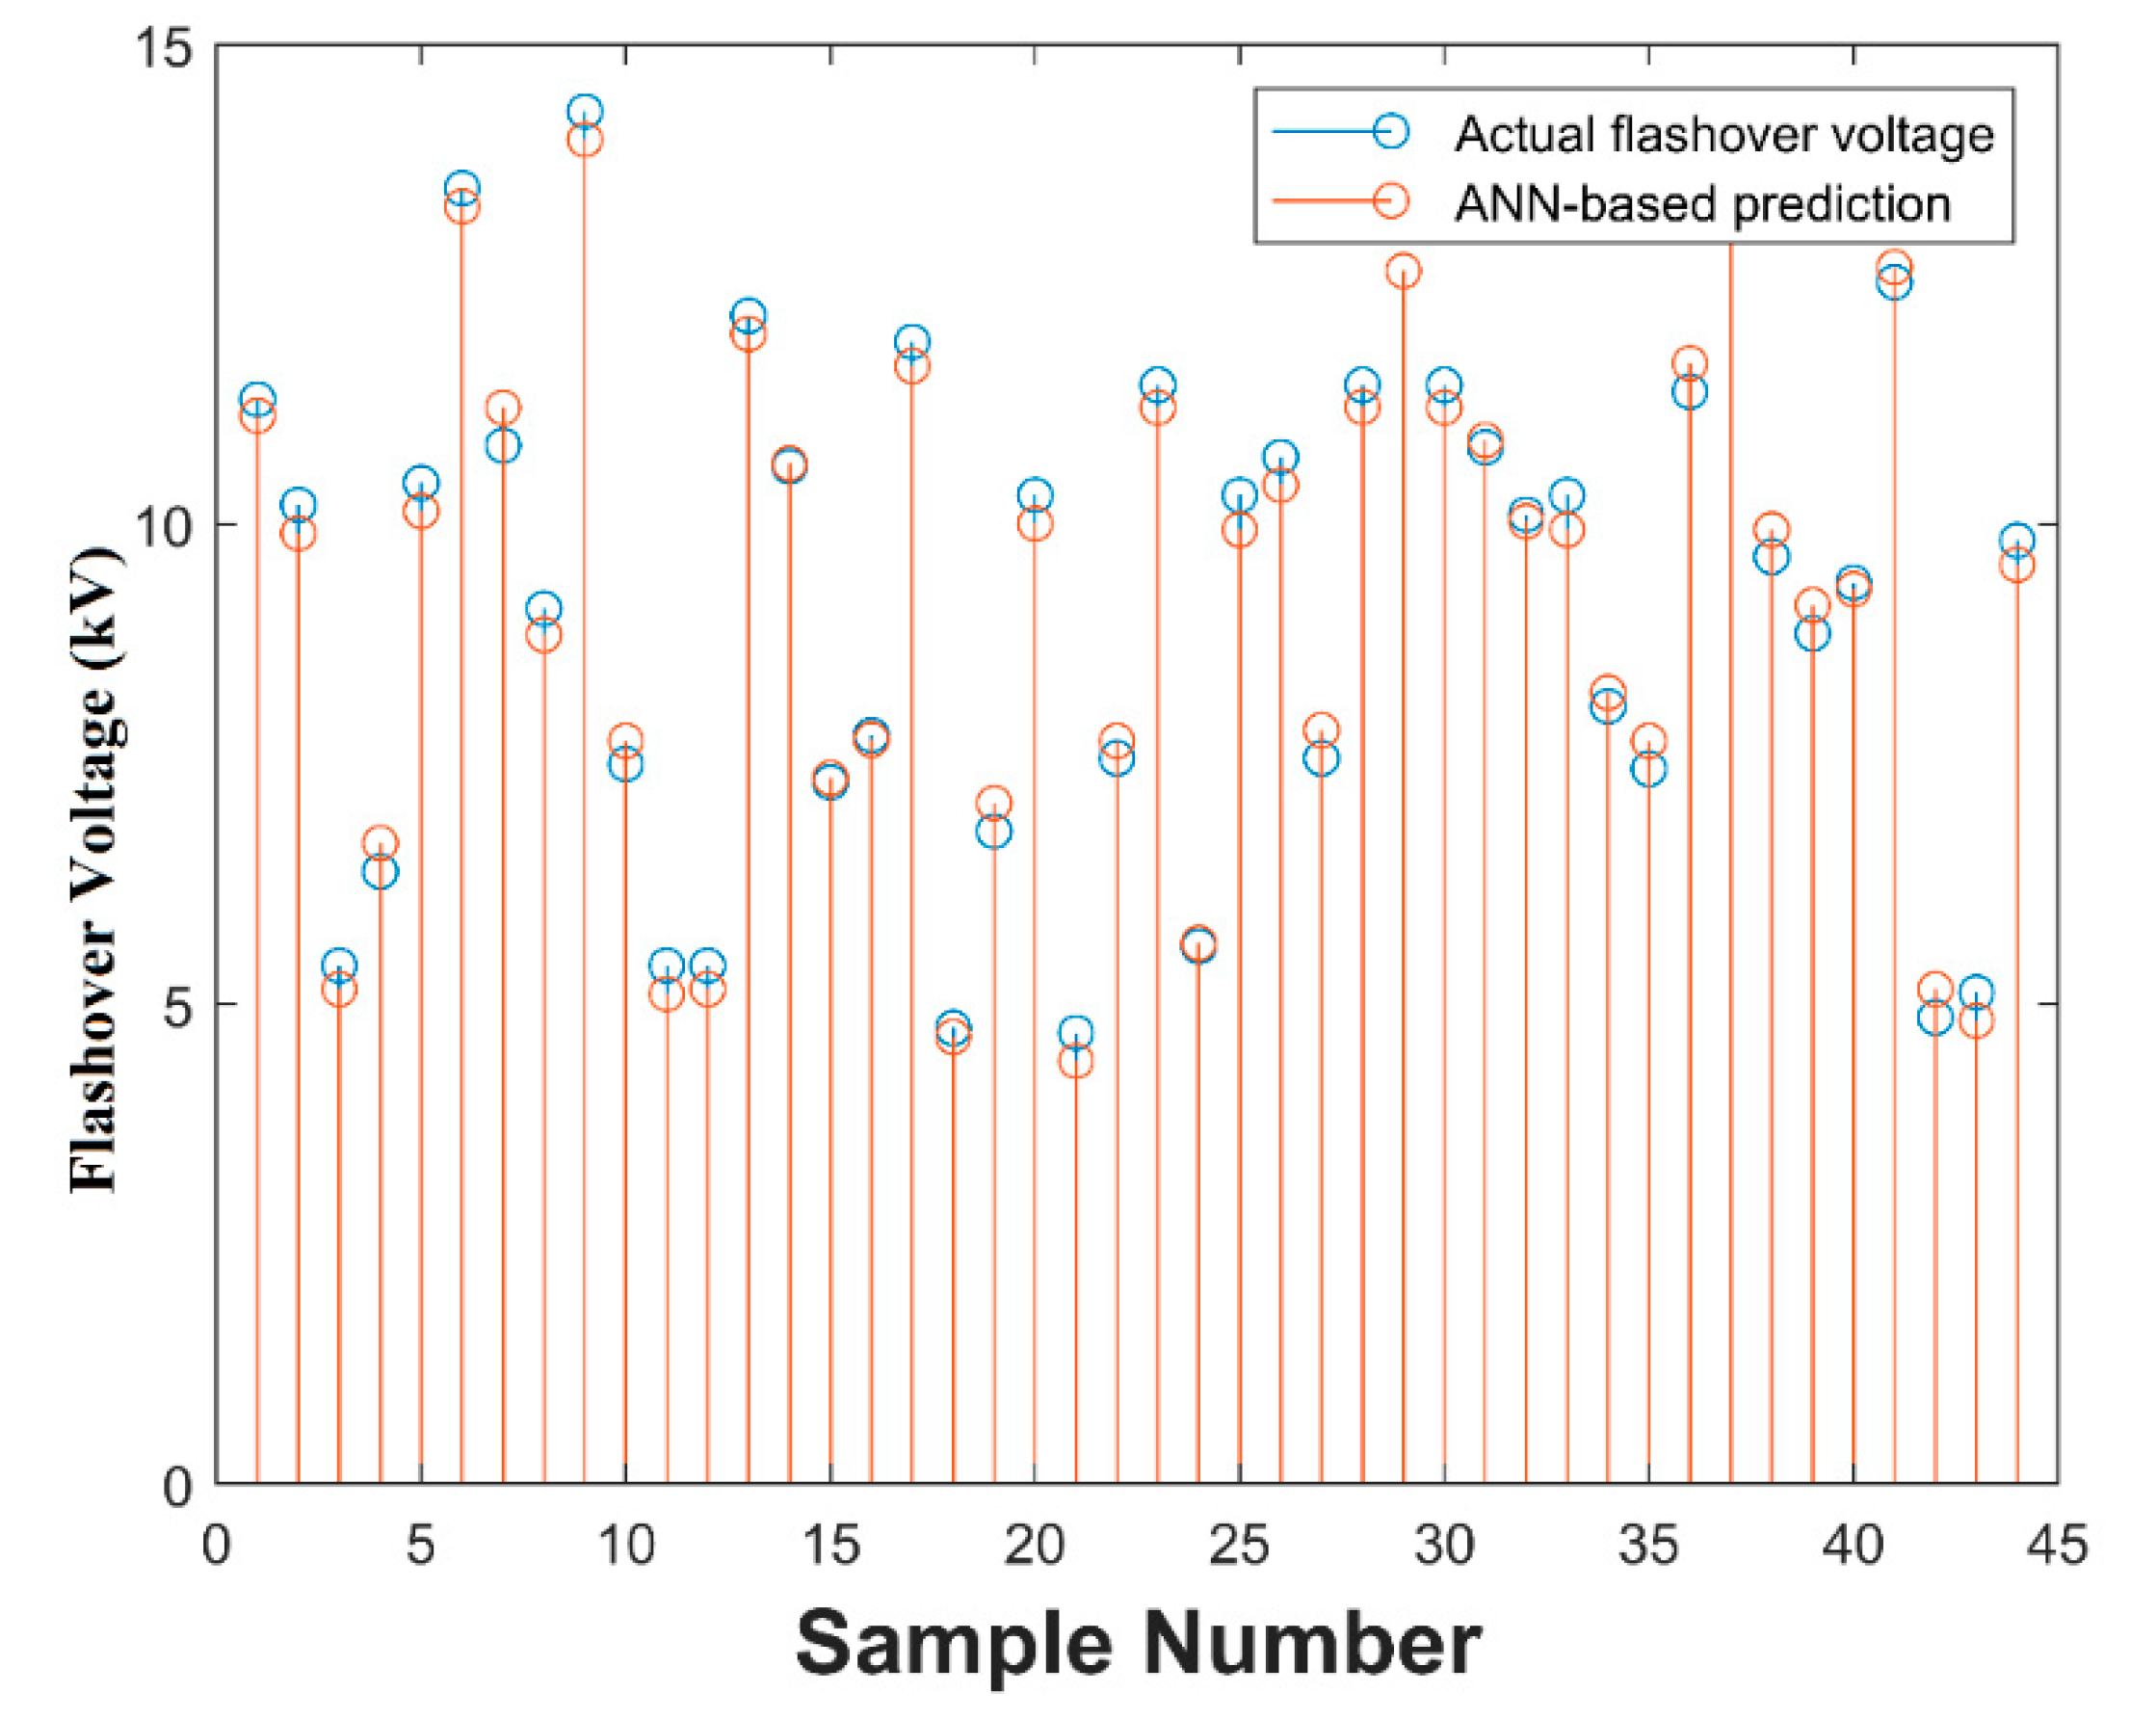
In this paper, various machine learning tools were applied to predict the critical flashover voltage of HTV silicone rubber outdoor insulators. A comparison between the predicted and actual value of flashover voltage obtained through the LM algorithm is shown in
Figure 9. It can be observed from
Figure 9 that forecasted values for flashover voltage are closer to the actual values. A similar comparison for the prediction of critical flashover voltages using machine learning techniques was done in Reference [
34], which validates the results presented in
Figure 9. For better visualization and comparison of these machine learning algorithms, it would be more appropriate to use some matrices for describing the accuracy and validity. In this paper, the accuracy and preciseness of the implemented algorithms were described in four matrices. These are Root Mean Square Error (RMSE), Normalized RMSE (N-RMSE), Mean Absolute Percentage Error (MAPE) and R value. RMSE is the square root of the average of squared errors, while NRMSE is the normalized value of RMSE. In MAPE, the percentage of the average of the error value is calculated. Mathematically, these matrices can be described as:
Here, ‘n’ is the number of samples, ‘’ and ‘’ are actual and forecasted critical flashover voltage values. The values of these performance metrics must be close to some definite value. Usually, values of RMSE, NRMSE, and MAPE, which are approaching zero imply the efficient operation of a machine learning algorithm. In other words, the machine learning algorithm will be considered reliable only if its error values obtained through RMSE, NRMSE, and MAPE are approaching zero, while in terms of the R parameter, the machine learning would be rated as good enough if its error value in terms of R is closer to 1.
A performance comparison, based on variation in the number of neurons in the hidden layers of different machine learning algorithms, is depicted in
Figure 10. For the GD algorithm, the error value for RMS, NRMSE, and MAPE decreases with the increasing number of neurons from 5 to 15. However, a further increase in the number of neurons to 20 results in an increase of error values. The R-value for GD first increases from 5 to 15 neurons, and further increment to 20 neurons results in a decrement of the R value. Thus, increasing the number of neurons from 15 to 20 adversely affects the performance of GD. In the case of the RP algorithm, error values for RMS, NRMSE, and MAPE first decrease on increasing neurons from 5 to10. Further increase in the number of neurons leads to an increase of error values (RMS, NRMSE and MAPE). A similar trend is followed by the R-value where the increase of the number of neurons beyond 10 decreases the R value.
Thus, increasing the number of neurons from 10 to 20 adversely affects the performance of RP. The SCG, LM and BFG Quasi newton algorithms exhibit rather random behavior. In these algorithms, an increase in the number of neurons from 5 to 10 strengthens the efficiency of the given machine learning algorithm. A further increase in neurons from 10 to 15 overshoots the error values for RMSE, NRMSE, and MAPE and decreases the regression value, R. The behavior of the BR backpropagation algorithm is quite distinct from the above-stated algorithms where an increase in the number of neurons boosts the performance of ANN. Overall, it can be concluded that increasing the number of neurons to a certain limit has a healing effect on the GD algorithm and BR backpropagation algorithm. For the rest of the algorithms, the number of neurons must be chosen as the optimum, and a general trend should not be followed.
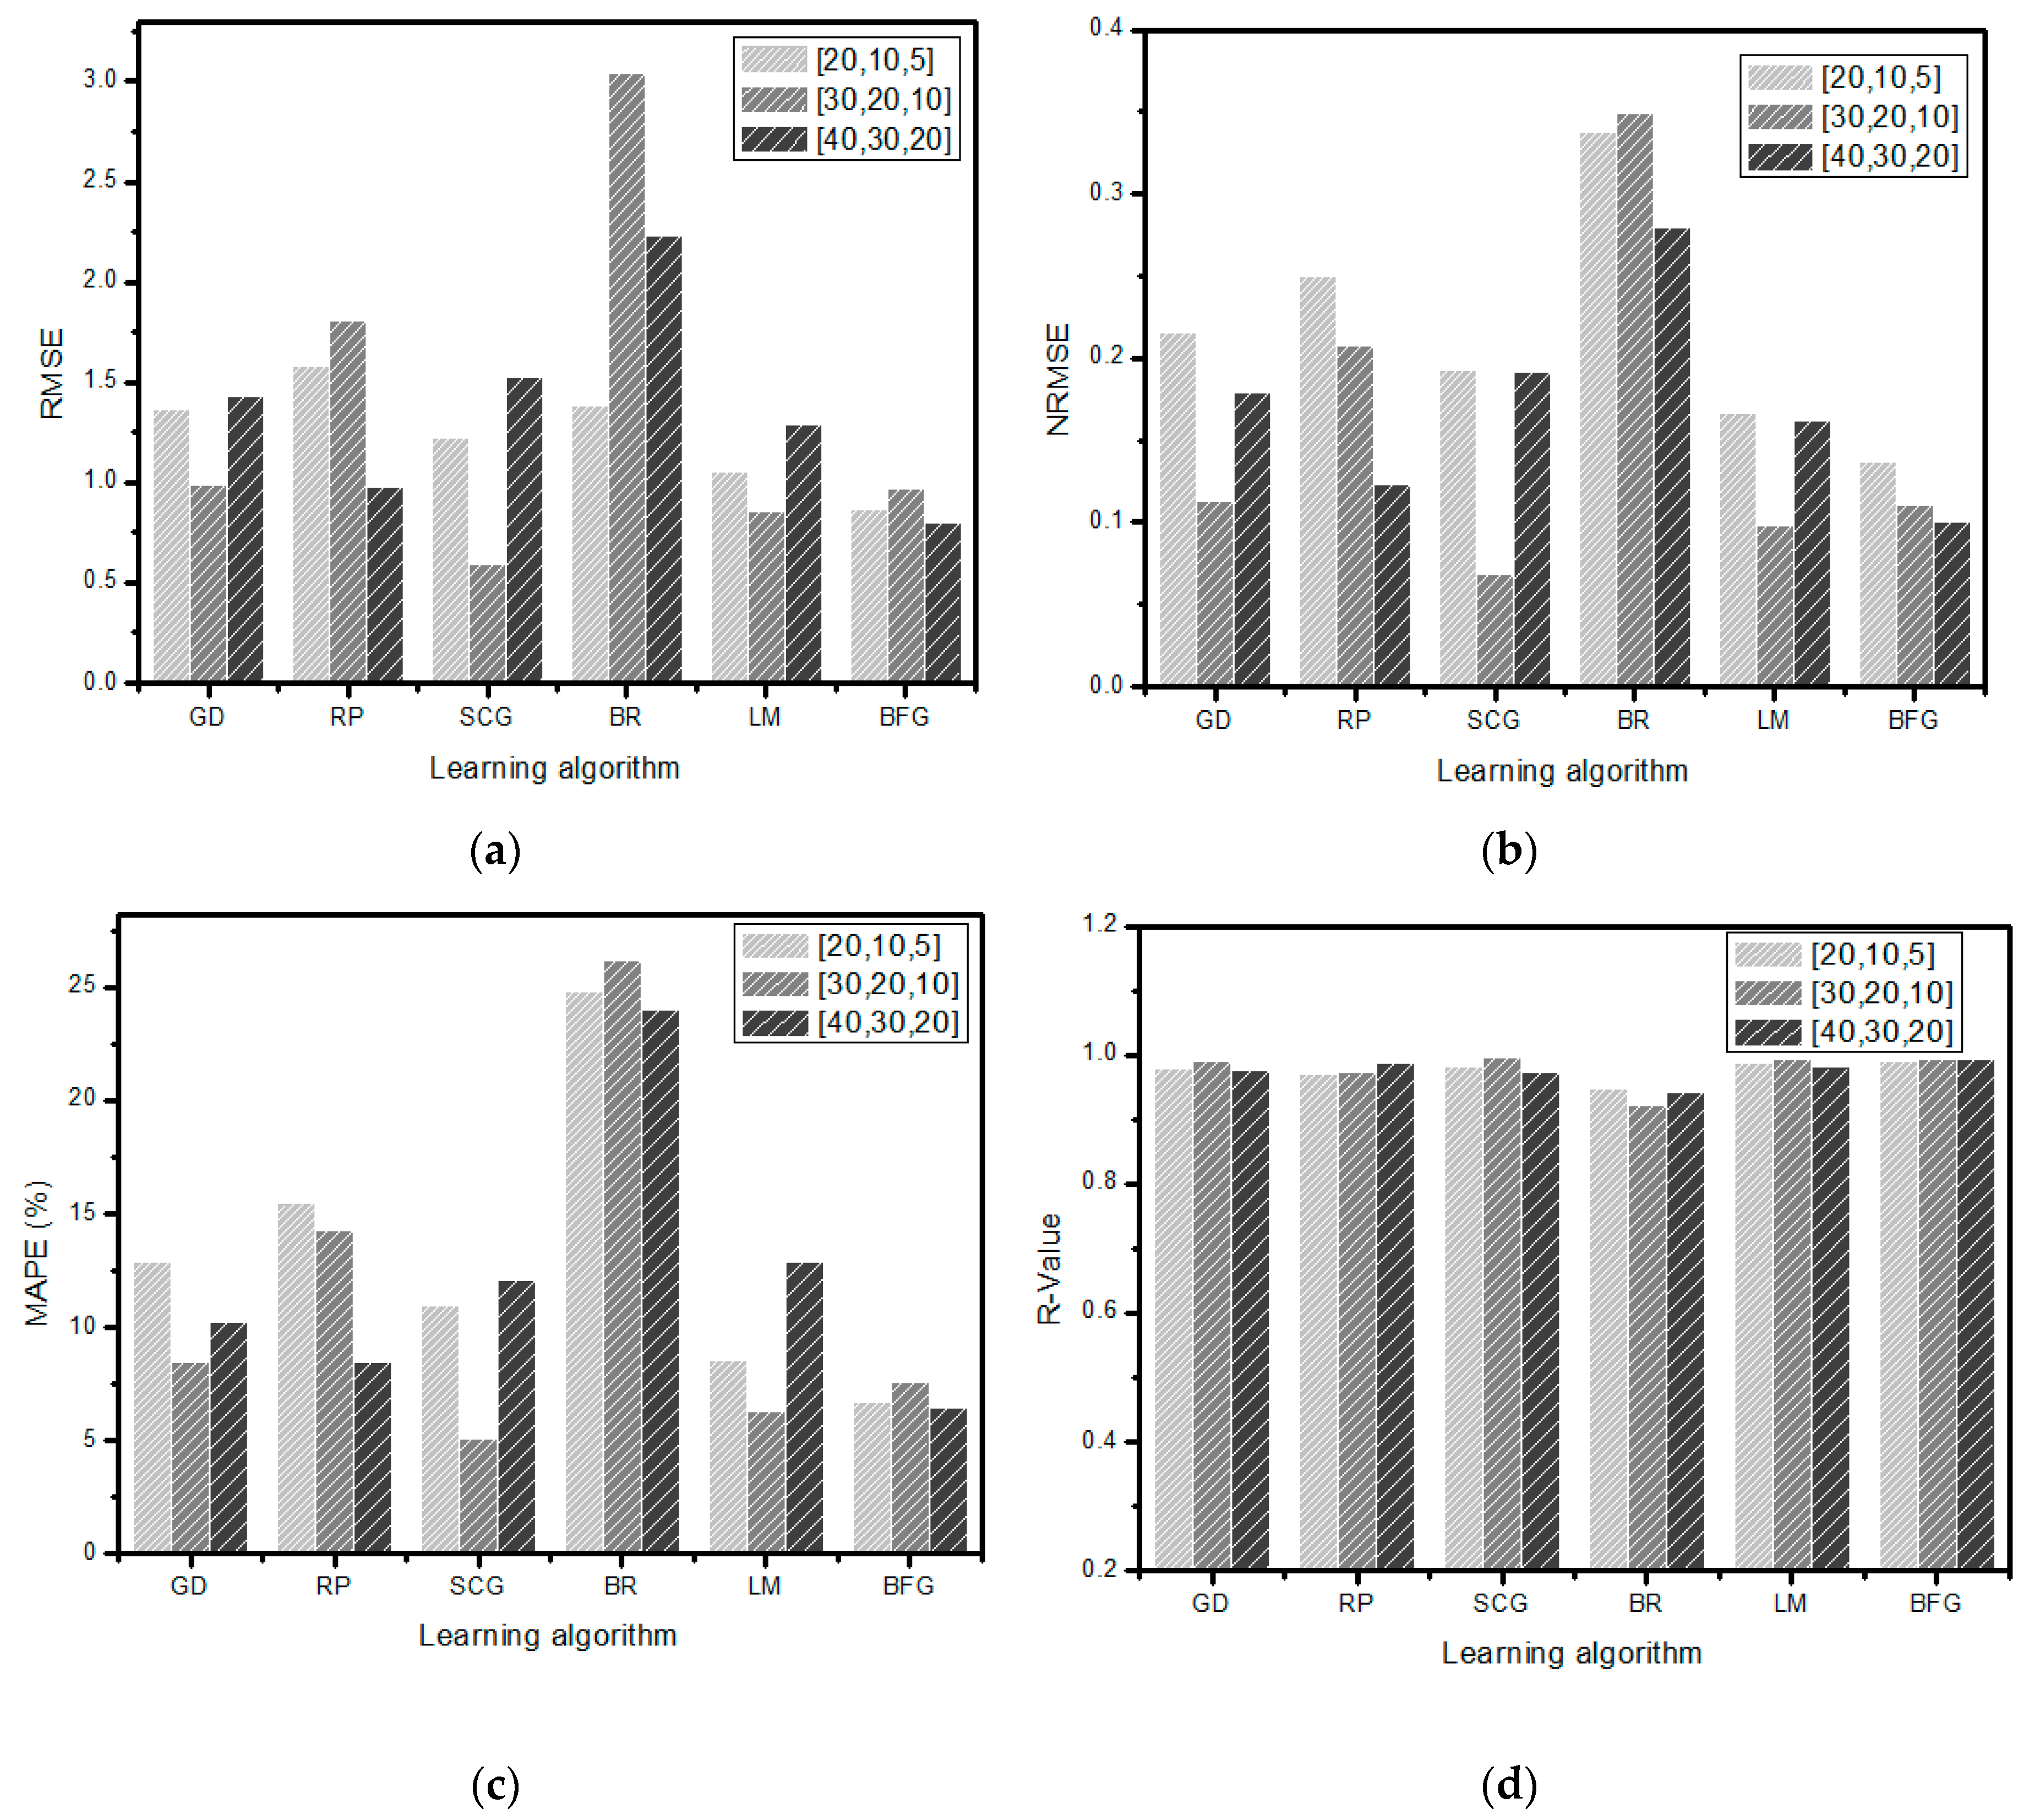
The above-mentioned results are based on a single hidden layer, and only the number of neurons in the hidden layer was varied. Increasing the number of hidden layers also effects the performance of the neural network. In this paper, three hidden layers with different numbers of neurons were considered. The results obtained are shown in
Figure 11, where [x, y, z] in the legend represents the number of neurons in each hidden layer. It was noted that by increasing the number of hidden layers, the computational complexity of the proposed neural network increased; however, the computational performance of proposed algorithms was not tested in this work. Comparing the results shown in
Figure 11 to that of
Figure 10, it can be noted that the performance of some algorithms improved with the increased number of hidden layers, while others deteriorated at the same time. The BR backpropagation algorithm which performed better for a single hidden layer worsened when increasing the number of hidden layers and neurons. In other words, increasing the number of hidden layers caused overfitting of the given data. Similarly, the performance of the RP algorithm is also adversely affected. On the other hand, the performance of the remaining algorithms has improved as indicated by their error values. It is very important to note here that the performance of any algorithm is also dependent on the number of neurons in that layer. All these algorithms exhibit random behavior. For example, in the case of the SCG algorithm, increasing the number of neurons in the hidden layer from [20, 10, 5] to [30, 20, 10] reduces the RMSE from 1.22 to 0.59, NRMSE from 0.19 to 0.069, and MAPE from 10.93 to 5.09%.
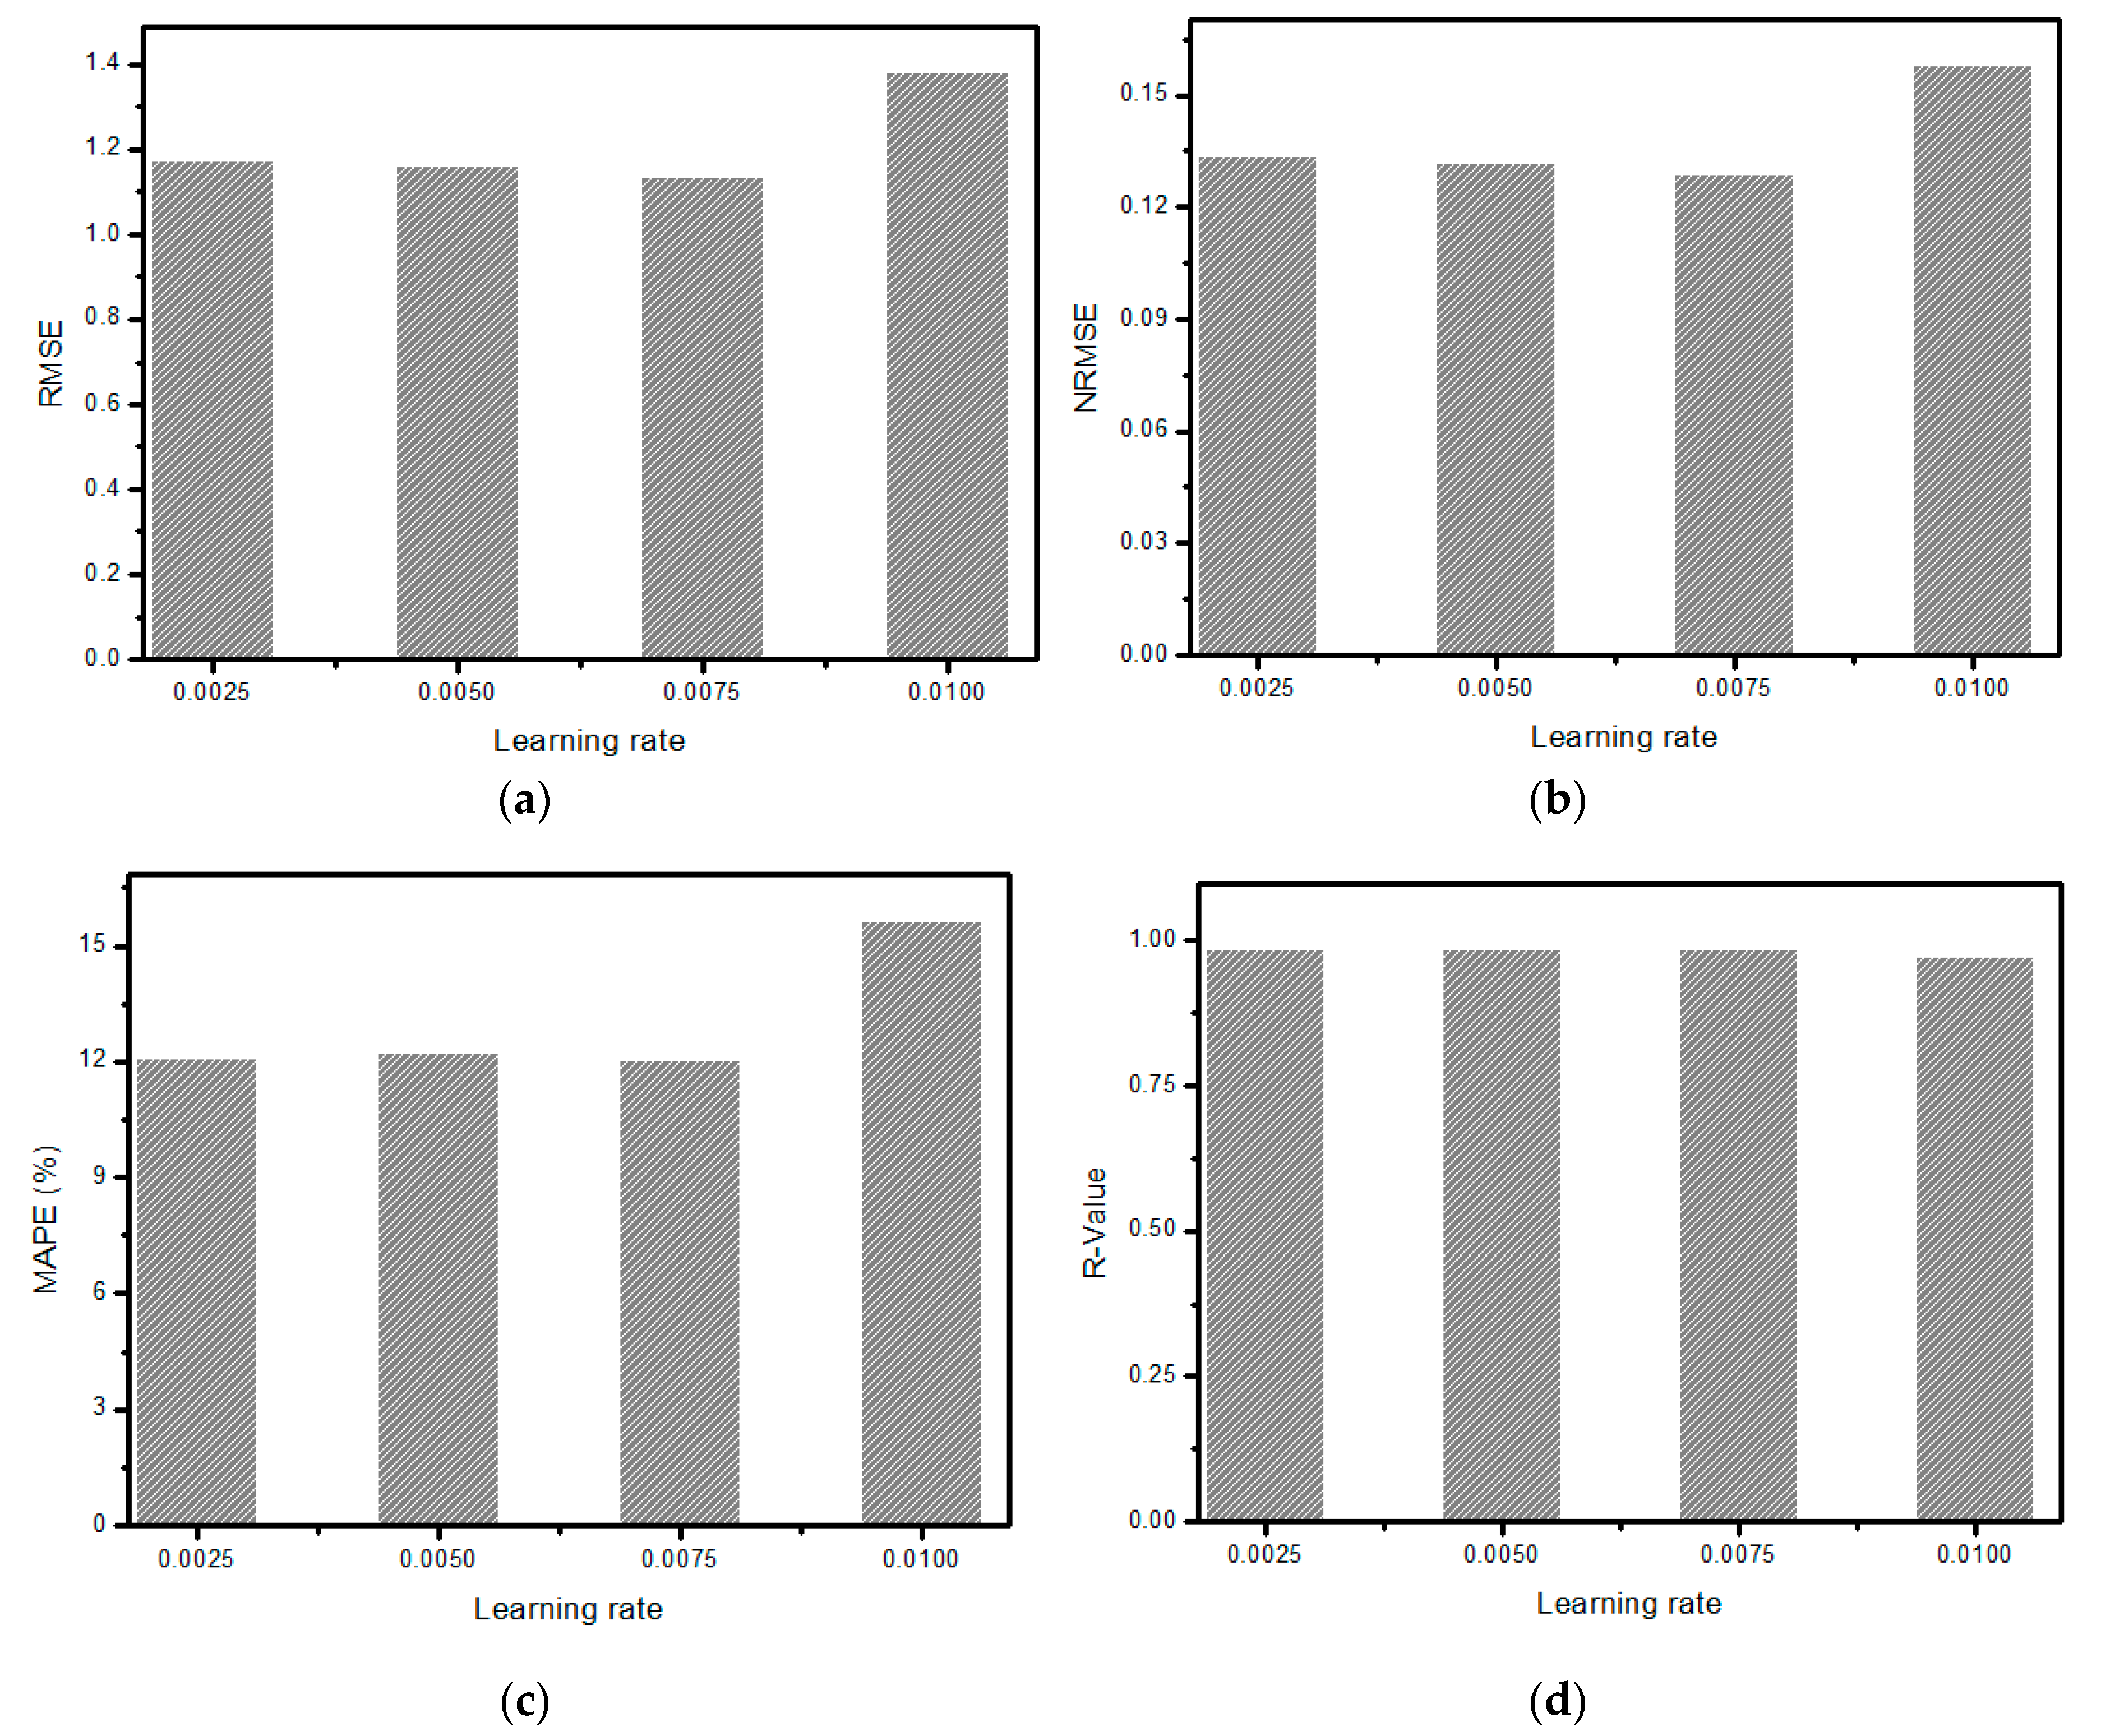
Choosing a certain learning rate for a neural network algorithm is also very important for improved performance. The learning rate is considered a hyperparameter in neural networks, and it accounts for alterations that should be made in the current model in response to calculated errors. A small value of the learning rate requires a large number of training epochs, whereas a large learning rate value may cause convergence of the algorithm rapidly to the local minima or maxima.
Figure 12 shows the performance comparison of the GD algorithm for different learning rates. It can be observed from these plots that increasing the learning rate from 0.0025 to 0.0075 apparently does not have any significant effect on error values obtained through RMS, N-RMS, and MAPE. However, a further increase in the learning rate value depicts the dominant increment in the value of these matrices, therefore indicating a drastic deterioration of the GD algorithm. On the other hand, the R-value did not account for any variation in the learning rate value, and it remains constant.
4. Conclusions
In this paper, different training algorithms of ANN were applied for the prediction of critical flashover voltage of insulators. These learning algorithms were applied by varying various parameters like the number of neurons, hidden layers, and learning rate. It was found that increasing the number of neurons to a certain limit can boost the performance of the machine learning algorithm for accurate prediction of flashover voltage, but after crossing a certain threshold, any further increase deteriorates the performance. Similarly, increasing the number of hidden layers had a positive influence on machine learning algorithms, except BR backpropagation, whose performance was affected badly with increasing hidden layers. The performance of the GD algorithm changed with the changing learning rate. Any inappropriate value may lead to large prediction errors of deployed algorithms. Therefore, it is important to choose the optimum values of the learning rate, number of neurons, and hidden layers for better performance of the machine learning algorithm. Additionally, the performance of the ANN algorithm is related to the type of learning algorithm utilized. These results can help scientists and engineers choose the best learning algorithm and associated parameters while predicting the critical flashover voltage of outdoor polymeric insulators.


 ,
, 