Anxiety Level Recognition for Virtual Reality Therapy System Using Physiological Signals


1
Department of Software Engineering, Kaunas University of Technology, Kaunas 51368, Lithuania
2
Institute of Mathematics, Silesian University of Technology, Gliwice 44-100, Poland
3
Department of Multimedia Engineering, Kaunas University of Technology, Kaunas 51368, Lithuania
4
Clinic of Psychiatry, Medical Academy, Lithuanian University of Health Sciences, Kaunas 50103, Lithuania
*
Author to whom correspondence should be addressed.
Electronics 2019, 8(9), 1039; https://doi.org/10.3390/electronics8091039
Submission received: 13 August 2019
/
Revised: 4 September 2019
/
Accepted: 12 September 2019
/
Published: 16 September 2019
(This article belongs to the Special Issue Computational Intelligence for Physiological Sensors and Body Sensor Networks)
Abstract
:Virtual reality exposure therapy (VRET) can have a significant impact towards assessing and potentially treating various anxiety disorders. One of the main strengths of VRET systems is that they provide an opportunity for a psychologist to interact with virtual 3D environments and change therapy scenarios according to the individual patient’s needs. However, to do this efficiently the patient’s anxiety level should be tracked throughout the VRET session. Therefore, in order to fully use all advantages provided by the VRET system, a mental stress detection system is needed. The patient’s physiological signals can be collected with wearable biofeedback sensors. Signals like blood volume pressure (BVP), galvanic skin response (GSR), and skin temperature can be processed and used to train the anxiety level classification models. In this paper, we combine VRET with mental stress detection and highlight potential uses of this kind of VRET system. We discuss and present a framework for anxiety level recognition, which is a part of our developed cloud-based VRET system. Physiological signals of 30 participants were collected during VRET-based public speaking anxiety treatment sessions. The acquired data were used to train a four-level anxiety recognition model (where each level of ‘low’, ‘mild’, ‘moderate’, and ‘high’ refer to the levels of anxiety rather than to separate classes of the anxiety disorder). We achieved an 80.1% cross-subject accuracy (using leave-one-subject-out cross-validation) and 86.3% accuracy (using 10 × 10 fold cross-validation) with the signal fusion-based support vector machine (SVM) classifier.
1. Introduction
In many cases, anxiety or stress is a normal organism reaction in order to cope with unexpected events. However, abnormal reactions to simple daily stress stimuli can cause enduring anxiety. These abnormal reactions are classified as anxiety disorders, which includes various phobias, panic, social anxiety, and generalized anxiety disorders, etc. More than 30% of people have suffered from an anxiety disorder at least once during their lifetime [1]. Anxiety can be caused by multiple causes, such as past experiences, exhaustion, job burnout, loneliness, abuse, etc., and can lead to reduced quality of life and labor productivity at work [2]. Anxiety can severely impact patients’ daily life, trigger social communication problems, and diminish life quality. Moreover, anxiety disorders are usually chronic conditions and require a prolonged treatment period [3].
Anxiety is usually noticeable in two dimensions: Psychological and physical. Psychological symptoms are recognized as irritability, tension, disturbance, and restlessness, while physical reactions involve the adrenal glands, the sympathetic system, and the production of hormones. Anxiety disorders are part of mental illnesses and manifest in various symptoms, like worry, avoidance of social contact, panic, fear, distress, and sleeplessness. These symptoms can be decoded by applying a variety of emotional stimuli, such as static and dynamic audio/video stimuli [4].
Anxiety disorders can be treated using cognitive behavioral therapy (CBT) [5]. CBT is focused on changing the patient’s cognitive patterns and behaviors when faced with feared stimuli and on learning new coping techniques. CBT is a popular treatment adapted by many therapists as interventions can be flexible and organized in many different forms. This includes group therapy sessions, individual interventions, or even self-therapy. An important distinction in CBT is how the patient confronts the feared object. It can be done either in vitro, when the feared stimuli are imagined and vividly described, or in vivo, when the stimuli are faced in the real world. The in vivo method is a key feature of exposure therapy, which provides the most efficient way of treating anxiety disorders. Therefore, in the clinical community, an exposure therapy was proven to be the “gold standard” for treating anxiety disorders [6].
However, it can be very costly to setup and manage a controlled environment for feared stimuli. Thus, cost-effectiveness is an important topic for anxiety disorder treatment using exposure therapy [7]. New advances in virtual reality (VR) technologies and high-quality consumer-grade devices [8] have opened up new prospects for virtual reality exposure therapy (VRET). VR systems for exposure therapy can offer reusable 3D environments and interactive scenarios for the feared stimuli that can be difficult to replicate in the real life, such as a virtual battle environment for post-traumatic stress disorder (PTSD) [9] or a virtual flying environment [10]. Moreover, a recent survey of VRET studies showed that it can be equally effective as in vivo exposure therapy and even has a slightly lower dropout rate compared to traditional treatment [11].
We can improve and analyze VRET systems better by tracking the patient’s physiological signals [12,13]. The ability to track and recognize the patient’s anxiety levels during VRET interventions can help to adapt and individualize therapy. By implementing these capabilities in VRET systems, we can move them closer to achieving the goals of affective computing (AC) to detect and recognize human affective states or their disorders, such as depression [14]. AC has become an important branch of the human–computer interaction (HCI) field [15]. Systems with AC capabilities can sense the emotions of the user. With this information the system can adapt to the user by performing a predefined sequence of actions [16], such as changing the reactions of 3D avatars in the VR environment based on the patient’s anxiety [17]. Many psychological cues can indicate a change of the user’s affective state, such as facial expressions, posture, pulse, temperature, electrodermal activity (EDA), etc. In order to detect an emotional state, these emotional cues need to be gathered from biofeedback devices, and then strong patterns and features can be extracted. Like many studies have shown before, the most advanced way to implement these requirements is to use machine learning models that can learn from features acquired from physiological signals, such as blood volume pressure (BVP), photopletysmography (PPG), heart rate variability (HRV), galvanic skin response (GSR), electroencephalography (EEG), electromyography (EMG), and others [18,19,20,21].
Additionally, it is important to select the correct physiological signal sensor device, which can be comfortably used with the VR headset. A recent survey of physiology-based mental stress detection systems that use machine learning methods reported over 25 different wearable sensors employed to collect such signals [22]. However, for data collection during VRET sessions, it is important that the VR device itself does not create additional discomfort and stress for the patient. Thus, the wristband-based biofeedback devices are preferable for VRET users. However, EEG data collection in combination with the VR systems is limited to custom-made setups and is not widely used with the VR headsets.
Beidel et al. [9] investigated VRET efficiency for PTSD treatment by conducting a randomized controlled trail. During the study more than 90 war veterans underwent VRET sessions, with the effectiveness evaluated mid and post-treatment, and at 3- and 6-month follow-ups. The participants’ anxiety levels throughout the VRET session were assessed using the subjective unit of distress scale (SUDS) and were collected at 10-min intervals. This study confirmed the hypothesis that VRET resulted in a significant decrease in PTSD symptoms.
Another VRET study for anxiety disorder treatment was conducted by Diemer et al. [23]. The study included 40 patients with acrophobia and 40 healthy participants targeting the fear of height. The VR scenario increased the scene height every 2 min and the participants’ subjective fear was also assessed using SUDS. Additionally, the authors collected GSR and HRV signals during VRET sessions. The study found that the VR height scenario activated physiological fear reactions for both experiment groups.
Raghav et al. [24] suggested the use of VRET for dealing with dental phobias in adults. A randomized clinical trial was conducted among 30 patients. Two groups were separated and one of them had a VRET session, and another group was given informational pamphlets. The visual analogue scale for anxiety (VAS-A), measured from 0 to 100, was used to record subjective fear, and participants’ HRV signals were collected. The study showed a significant reduction in anxiety scores in the VRET group.
Freeman et al. used [25] immersive VR for treating the fear of heights. During the experiment, electrocardiogram (ECG), GSR, and respiration data were collected. The experiment involved 61 participants that conducted relaxation–stress–relaxation type tasks, while each participant repeated this for 15 times in the interval of 4 weeks. Using this data, a binary classifier was trained for two classes: Relaxed or stressed. The authors achieved an 88% accuracy with the fused signal feature set using support vector machine (SVM).
A speech and GSR-based system was suggested by Kurnianwan et al. [26]. These signals were recorded while the experiment participants were solving light or heavy workload mental tasks. Additionally, the baseline of the relaxation period was recorded. Like in the previous studies, a higher accuracy was achieved using signal fusion. Finally, a 92% accuracy for three-class stress detection was achieved.
Gjoreski et al. [27] describes a continuous stress detection system, which used an Empatica wristband to physiological signals. Their experiments consisted of two parts—one in laboratory conditions and the second in real life. During experiments in the laboratory settings, the participants solved the stress-inducing task proposed by Dedovic et al. [28]. For real-life stress prediction, the participants were asked to manually note the hours that were stressful. The authors achieved an 83% accuracy for the classification of “no stress”, “low stress”, and “high stress” states.
Here, we describe the anxiety level prediction framework that can be used with the VRET system. We discuss physiological signals processing, feature extraction, and machine learning techniques used to predict patients’ anxiety during VRET interventions. Finally, we evaluate our suggested framework with a dataset collected during VRET for dealing with public speaking anxiety from 30 participants and compare our results with similar anxiety/stress detection systems.
2. System for Virtual Reality Exposure Therapy
2.1. VRET System
This paper is based on our developed VRET system previously described in more detail in [29,30]. This cloud-based VRET application consists of two main components: The psychologist dashboard and the subject’s VRET application. Every psychologist in our system gets an individual account. Using the dashboard, the psychologist can register a new subject, start a new VRET scenario, or review previous interventions. After adding a new subject, the psychologist can start a new VRET session by selecting a phobia that needs to be treated and selecting one of the available VR scenarios. Once the VR scenario is selected, the virtual scene is loaded on the web browser as a WebGL (Web Graphics Library) application. At this point, the subject can launch the VR application on the VR headset. The virtual camera is synchronized between the subject’s VR headset and the psychologist’s dashboard, thus the psychologist can see through the subject’s eyes, analyze what is happening in the VRET scenario, and even adapt the 3D environment for the needs of the VRET session (Figure 1).
Currently, our system supports three types of anxiety disorders—public speaking anxiety, fear of heights, and panic disorder. In this paper, we focused on the public speaking anxiety scenario, which involves delivering a public speech in an auditorium in front of virtual conference listeners (the avatars).
2.2. Anxiety Recognition Framework
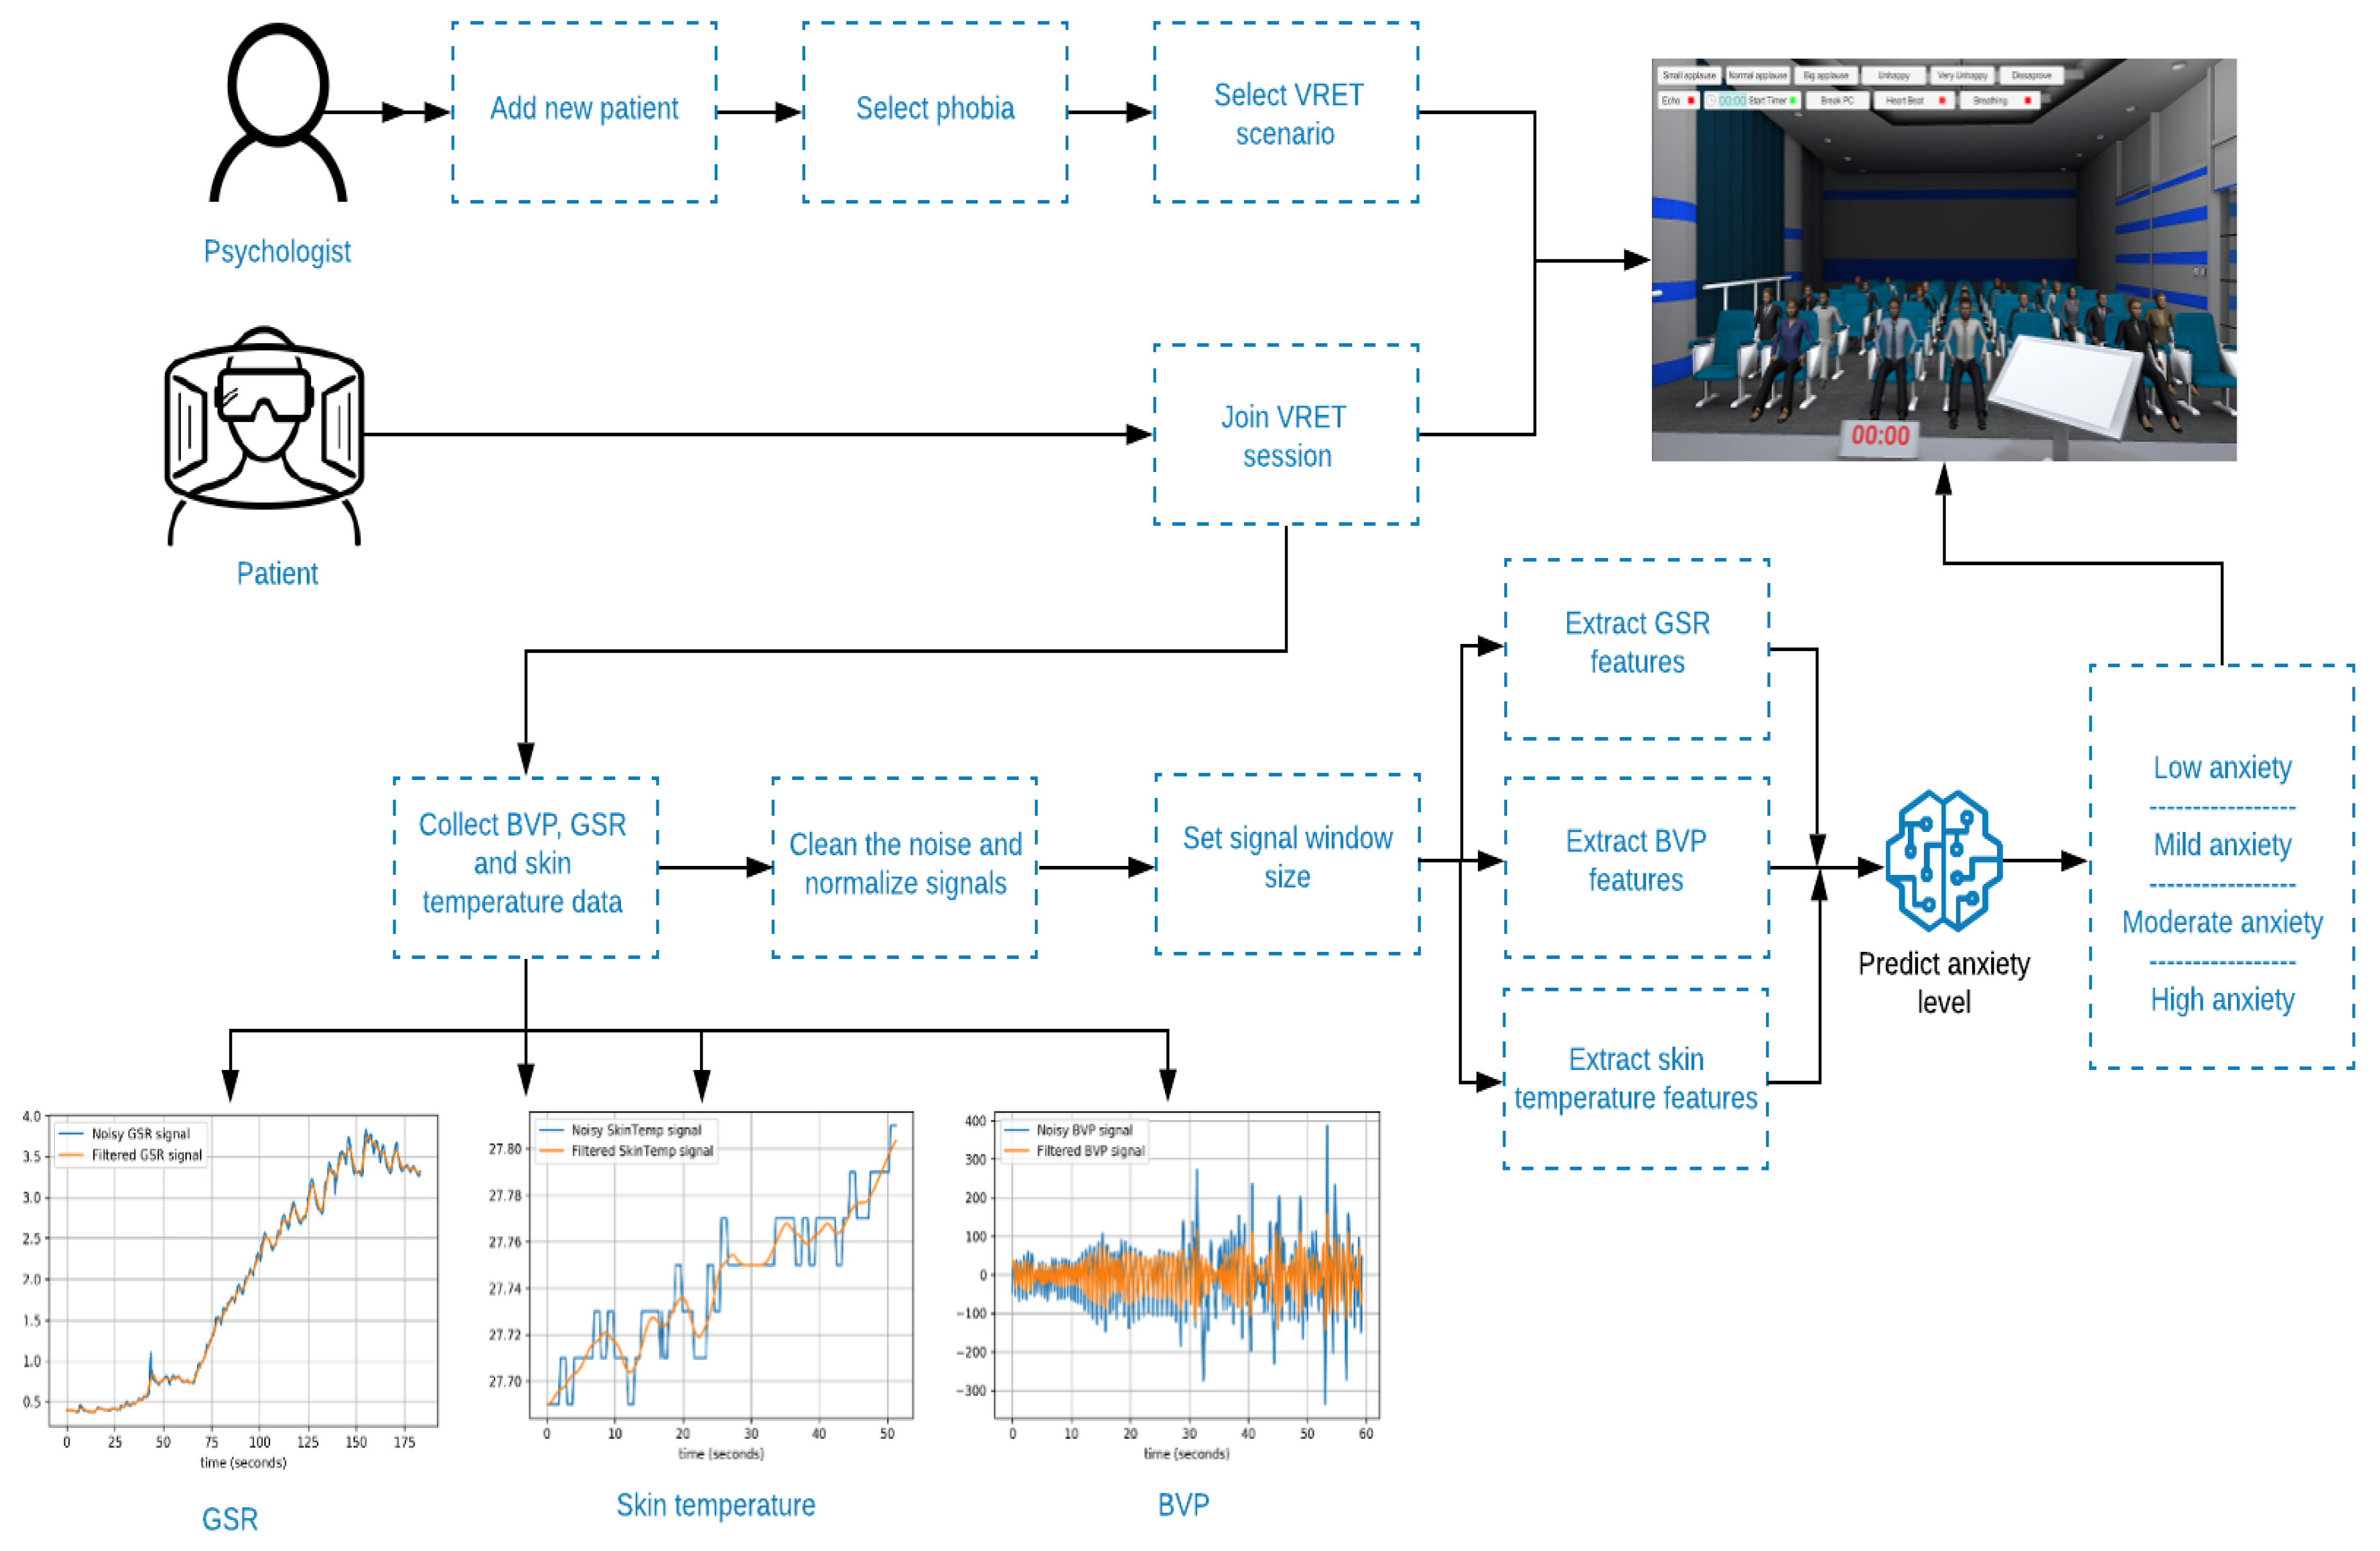
To expand our developed VRET system to have the ability to detect anxiety during therapy sessions, we implemented a mental stress prediction framework, which can be used during VRET sessions. Using this framework, we can collect GSR, BVP, and skin temperature signals, process them, extract the significant features, and finally use them to predict the anxiety level. This framework is within the bounds of our VRET system as presented in Figure 2.
2.3. System Implementation and Tools
The VRET system and virtual 3D environments were developed using the Unity (Unity Technologies, San Francisco, CA, USA) game engine. The networking system between the WebGL application running on the therapist machine and the VR application was implemented with Photon Unity 3D networking framework. The therapist dashboard and system cloud application were designed using the .NET Web API framework and AngularJS web framework.
The physiological signals were analyzed using Python language. Pandas library was used for data handling and manipulation. Numpy [31] and scipy were used for signal filtering and extraction of statistical features. BioSSPy library was used for GSR signal analysis [32] and Heartpy [33] library was used for the BVP signal. Matplotlib library was used to plot various graphs and visualizations. Finally, we used scikit-learn [34] for the anxiety classification.
3. Experimental Setup
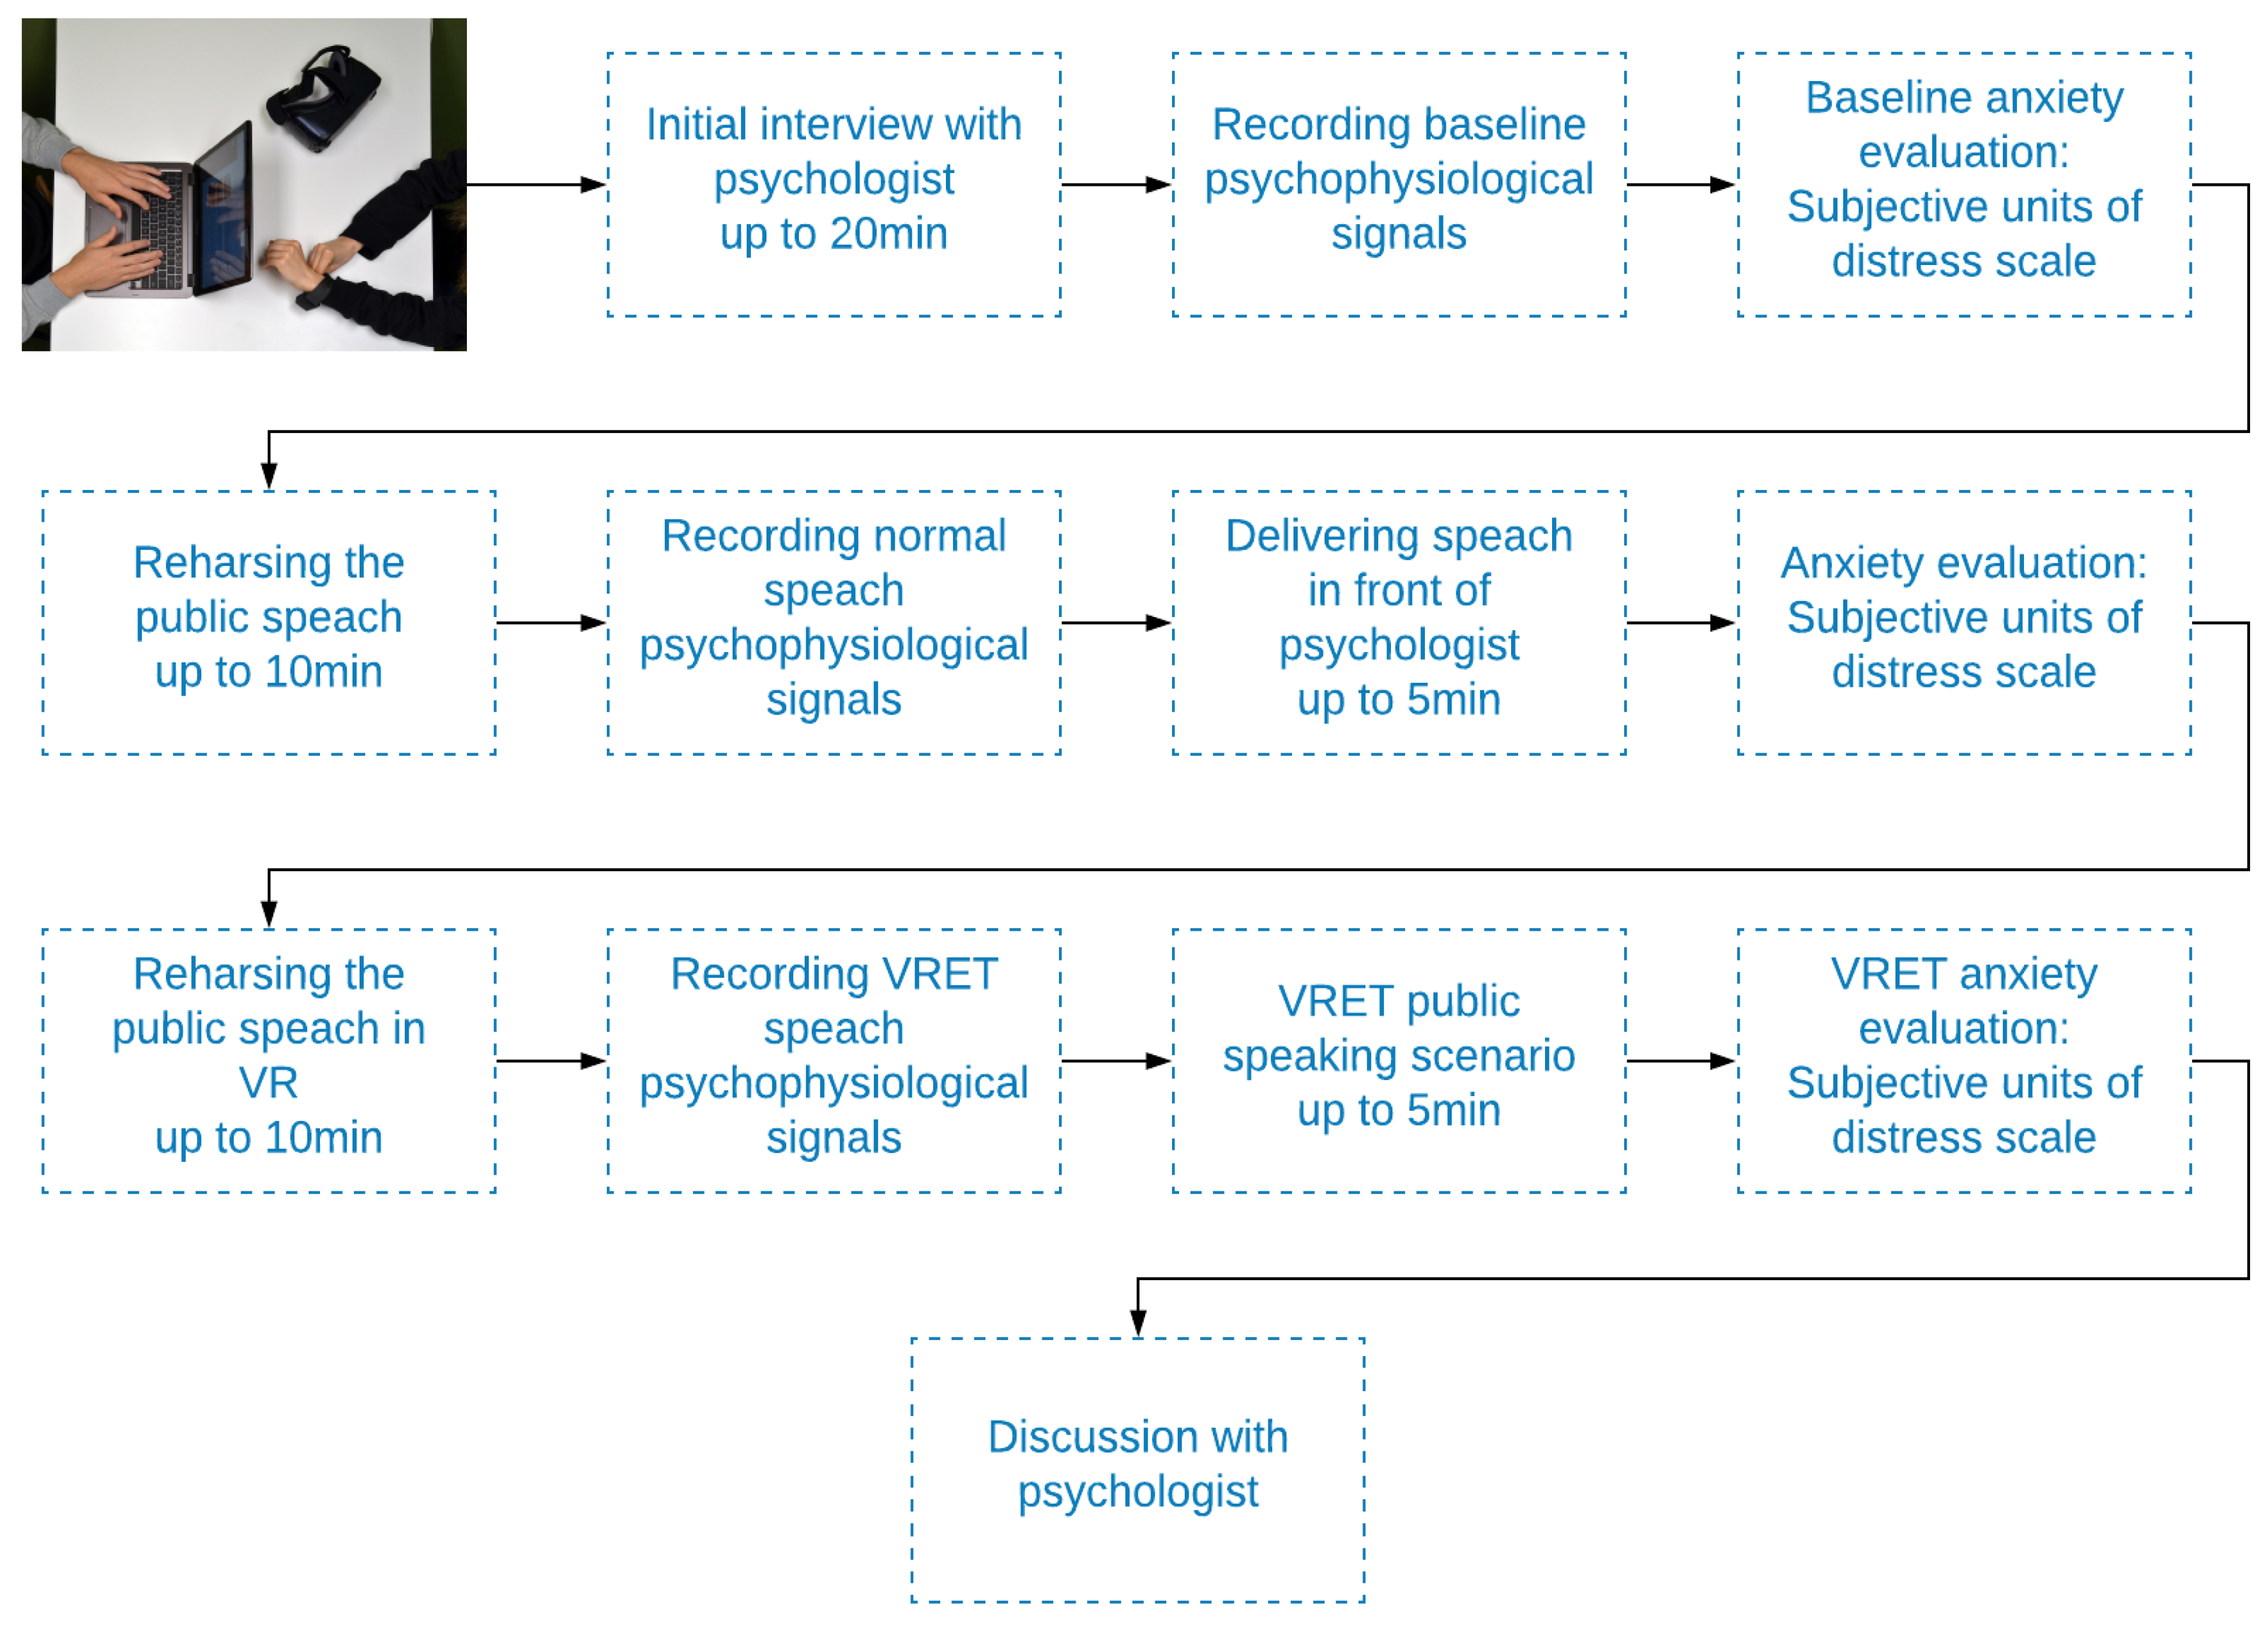
In our experiment, we focused on public speaking anxiety VRET sessions. We invited a group of 30 participants (this experiment was completed under approval (ref. BE-2-60; 2018-09-12) of Kaunas regional biomedical research ethics committee) to undergo a public speaking anxiety intervention. The session of the experiment began with the interview with the psychologist. The goal of this interview was to explain what usually happened during an anxiety attack and to collect initial demographical and psychological data. This took up to 20 min.
Later, we recorded baseline physiological signals, while the participant was in a calm and relaxed state. Also, the patient evaluated their anxiety levels using the subjective units of distress scale (SUDS) [35] as this scale provides a simple and understandable way for the subject to describe their current level of anxiety or stress.
The session continued with a preparation and rehearsal of a public speech, and the participant was given up to 10 min to prepare for it. Then, the participant delivered the speech for the psychologist, while the physiological signals were tracked. After this, the participant once again evaluated their anxiety levels using SUDS and discussed it with the psychologist.
Finally, the participant prepared for a VRET session by rehearsing the public speech for up to 10 min. As soon as the participant felt ready, the psychologist started the VR scenario with a conference presentation in front of the auditorium and controlled the reaction of the 3D avatars. During this session, the physiological signals were tracked once again. After the VR scenario was finished, the patient filled out the SUDS form and started a final discussion with the psychologist about the session.
The process of the experiment is visualized in Figure 3.
3.1. Participant Group
A group of 30 subjects participated. All of them provided a written consent. The age of the group was from 21 to 34 years old, with a mean of 27.5 years and a standard deviation of 4.18 years. The group had 17 males and 13 females. The participants had diverse experiences with public speaking anxiety, as one third of the group recognized themselves as having strong fear during public speaking. This provided us with a broad spectrum of recorded anxiety levels, which was useful to balance the training set with negative and positive data samples.
3.2. Psychological Signal Recording
During the whole experiment, the participants were using the wristband sensor Empatica E4 [36]. The sensors were connected with a computer using Bluetooth connection. The acquired data included GSR, BVP, and skin temperature throughout the session.
Three time series were recorded for each signal type and for each participant:
- Baseline—recorded during a calm and relaxed state;
- Speaking assignment—recorded during speaking exercise in front of the psychologist;
- VRET—recorded during the VRET public speaking scenario.
3.3. VRET As Stimuli
There are multiple studies for emotion recognition while using videos, images, or music as an emotional stimulus [37,38,39]. Moreover, a recent survey showed that many studies that use machine leaning to detect stress and anxiety are creating stress stimuli through mental tasks in a laboratory setup [40]. However, in our case, anxiety was induced through VRET stimuli, which cannot be easily compared with a video or images.
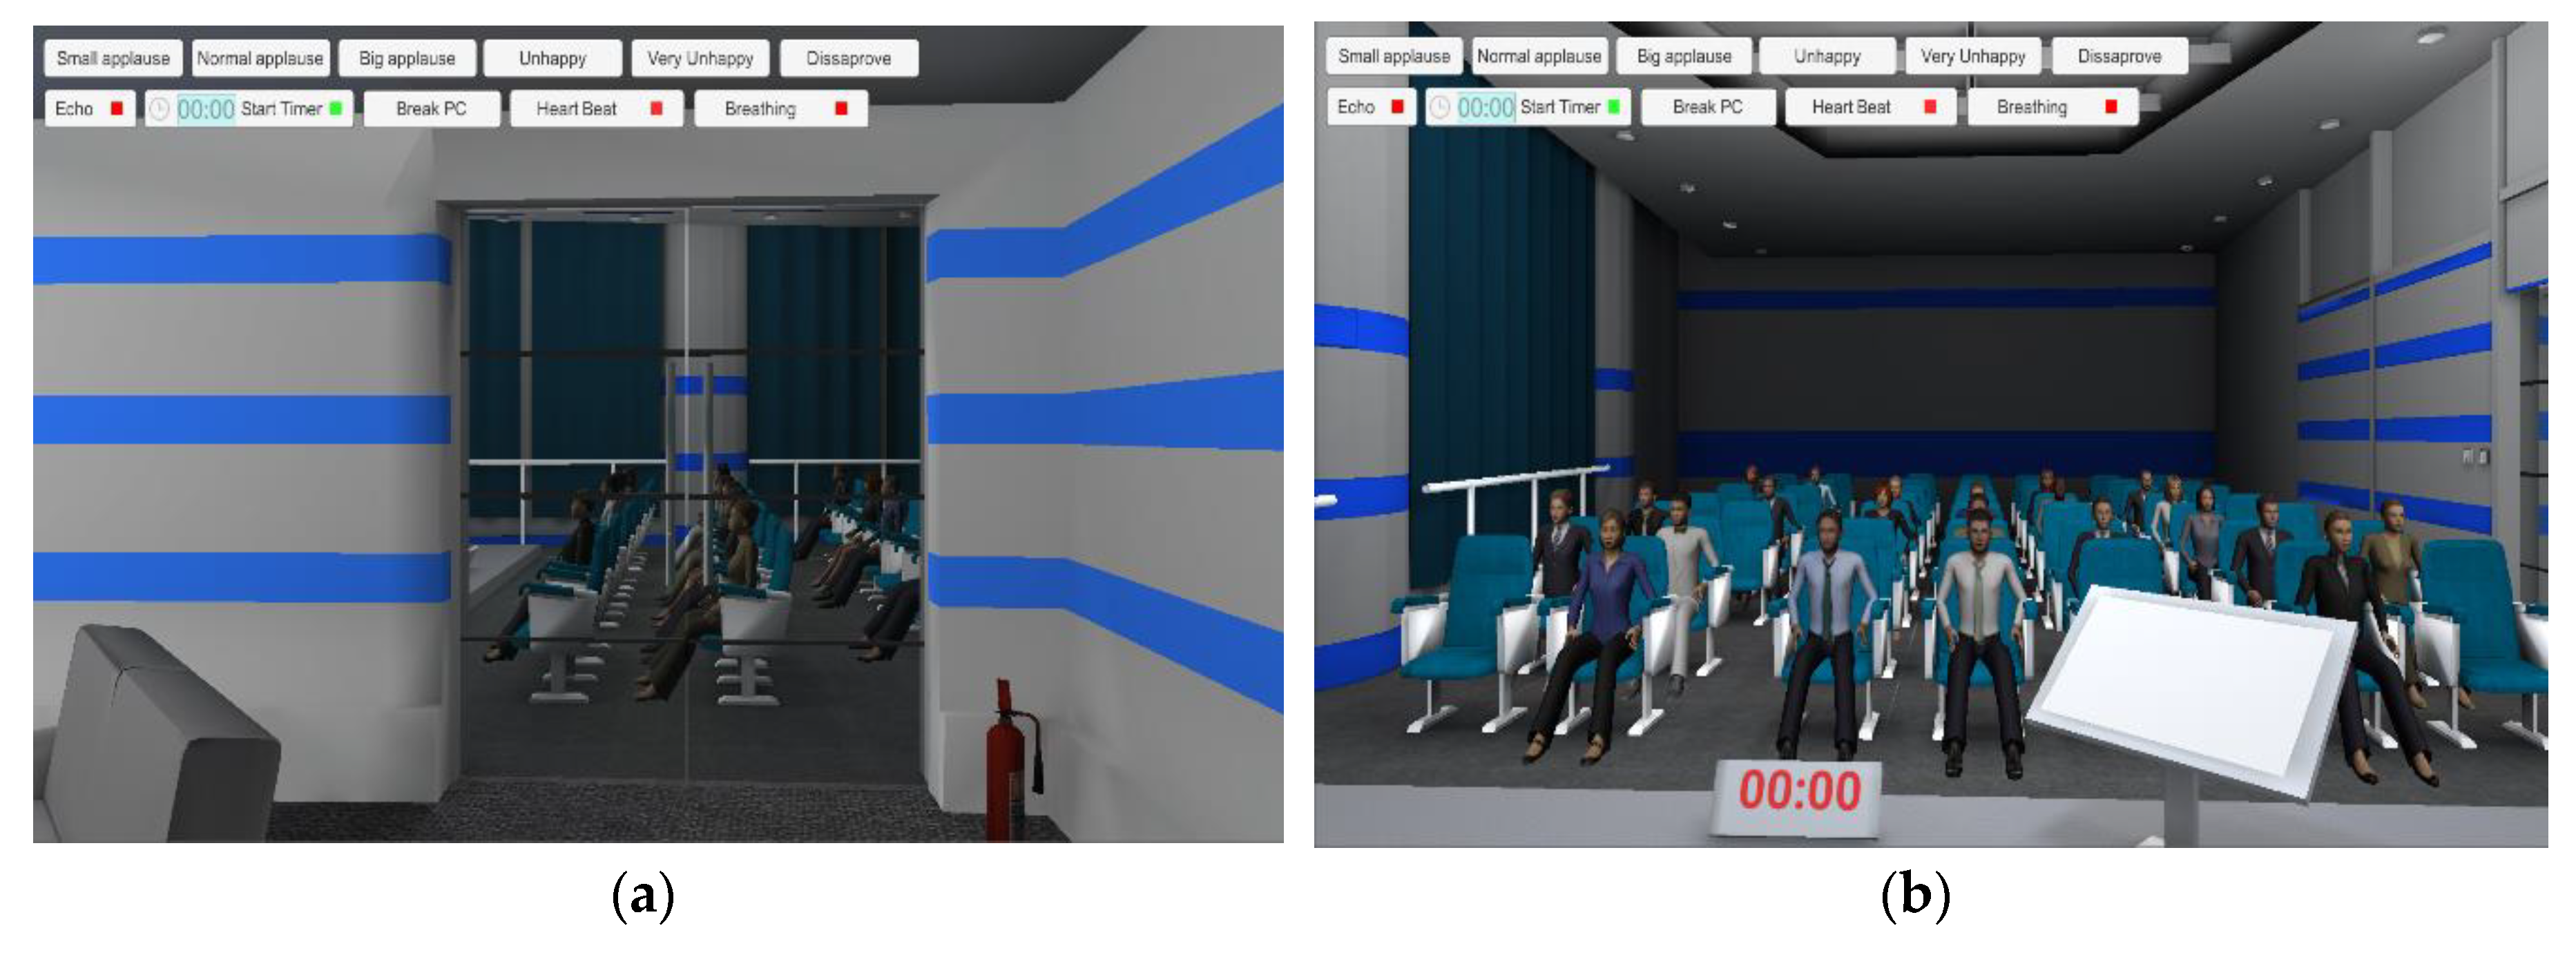
The VRET sessions started with the participant waiting in the backstage of a virtual conference hall. After a short period of acclimation, the virtual character started moving through the door to the virtual stage. Finally, the participant reached the stage, was greeted by virtual listeners, and started the presentation within the time limit. This initial period of the scenario acted as an emotional activator, and from this point, we started to track the psychological signals of the subject. These stages of the virtual scenario are shown in Figure 4.
3.4. Participant’s Anxiety Self-Assessment
Based on experience from other VRET studies, in order to measure the participant’s anxiety level throughout the experiment, we used the subjective unit of distress scale (SUDS). This scale is measured from 0 to 100 (sometimes from 0 to 10), where 0 represents total relaxation and 100 represents the strongest anxiety attack in your life. The advantage of this scale is its simplicity and shortness, which allows anxiety in a specific moment of time to be captured.
4. Signal Feature Extraction
4.1. Preprocessing
The main initial challenge when processing physiological signals acquired from a human body is random noise. This was especially impactful to our dataset as a wristband tends to move and lose contact with the skin. We selected a moving average as one of the most common signal filters in order to reduce noise and artifacts while keeping a fast step response. This filter averages multiple input points to generate the output signal (Equation (1)):
where p is the output signal, s is the input signal, and N is the number of signal steps to put in the average. This filter was applied for all collected signals.
4.2. Normalization
When working with physiological signals, it is important to avoid subject-wise dependency. One person’s skin can normally be hotter than others or sweating can be exceptionally high. Thus, collected signals have to be normalized. It is important to note that some features require the range of to work correctly, while other features can have negative values. Therefore, we used two normalization methods. The first one is min-max normalization (Equation (2)):
where Xn is the min-max normalized signal value, X is the value of the raw signal, Xmax is the maximal value of the signal, and Xmin is the minimal value of the signal.
The second one is zero means normalization (z-score) (Equation (3)):
where Xzn is the zero means normalized signal, X is the value of the raw signal, Xmean is the mean of the signal, and Xstd is the standard deviation of the signal.
4.3. Windowing
Different stimuli can have varying emotional activation times. Therefore, it is important to select a correct signal window size to get the best prediction accuracy. We decided to investigate what window size is best for VRET stimuli. A sliding window with a 1-s interval was applied to all collected signals with these window sizes in seconds: 3, 5, 8, 10, 13, 15, 18, 20, 23, 25, 28, 29, and 30.
4.4. Physiological Signal Features
The most important part of creating a model that can recognize anxiety level from physiological signals is feature extraction. We selected the features, which were suggested in the literature, and grouped them by the signal type and origin.
Firstly, there are mathematical features that can be applied to all signals. The statistical group contained common statistical features that can be extracted with any math package. Extended statistical features are comprised of different statistical momentums and some less used statistical features. The differential group includes features that are obtained using signal differentiation. Lastly, we dedicated a separate group for psychological features as researched by Picard et al. [16].
For the GSR signal, we focused on finding the peaks and amplitudes of the skin conduction response (SCR). This was done by applying the Bartlett window and marking the SCR peaks between two consecutive zero crossings. The amplitudes of the peaks were calculated by measuring the maximum value between these. Once all peaks were detected, we calculated the number of peaks in the sliding window and the length of the maximum and mean amplitudes.
The BVP signal measures the volume of blood that is passing with each pulse in capillary beds on the skin. When processing BVP signals, it is important to extract heart rate features, inter-beat intervals, and HRV features. All extracted features are enumerated in Table 1.
4.5. Anxiety Level Class Assignment
Each physiological signal time series from each participant had an associated SUDS evaluation score. The minimal recorded SUDS score during our experiment was 10 and the maximum was 80. The highest values of 90 and 100 were not recorded, since they would indicate only extreme panic attacks. In order to perform classification, we needed to assign a class for each value. Thus, we used some formulations from the SUDS description and assigned four classes for low, mild, moderate, and high anxiety (Figure 5).
4.6. Validation
We decided to use accuracy metric for model-by-model comparison, as the majority of articles on anxiety prediction publish their results by accuracy. For cross-validation, we used 10 × 10 fold cross-validation, as in this way, we first divided participants into 10 folds and used 90% of participants’ data for training (27 participants), and the remaining for testing (3 participants), and we repeated this process 10 times across 10 folds. Thus, there was no data sample spill-over from the training set to the testing set [26,42].
Additionally, we tested our models with a randomly assigned class to ensure that they were not biased. All discussed models had a 25% to 26% accuracy, which was expected from the four-class classification model with random labels.
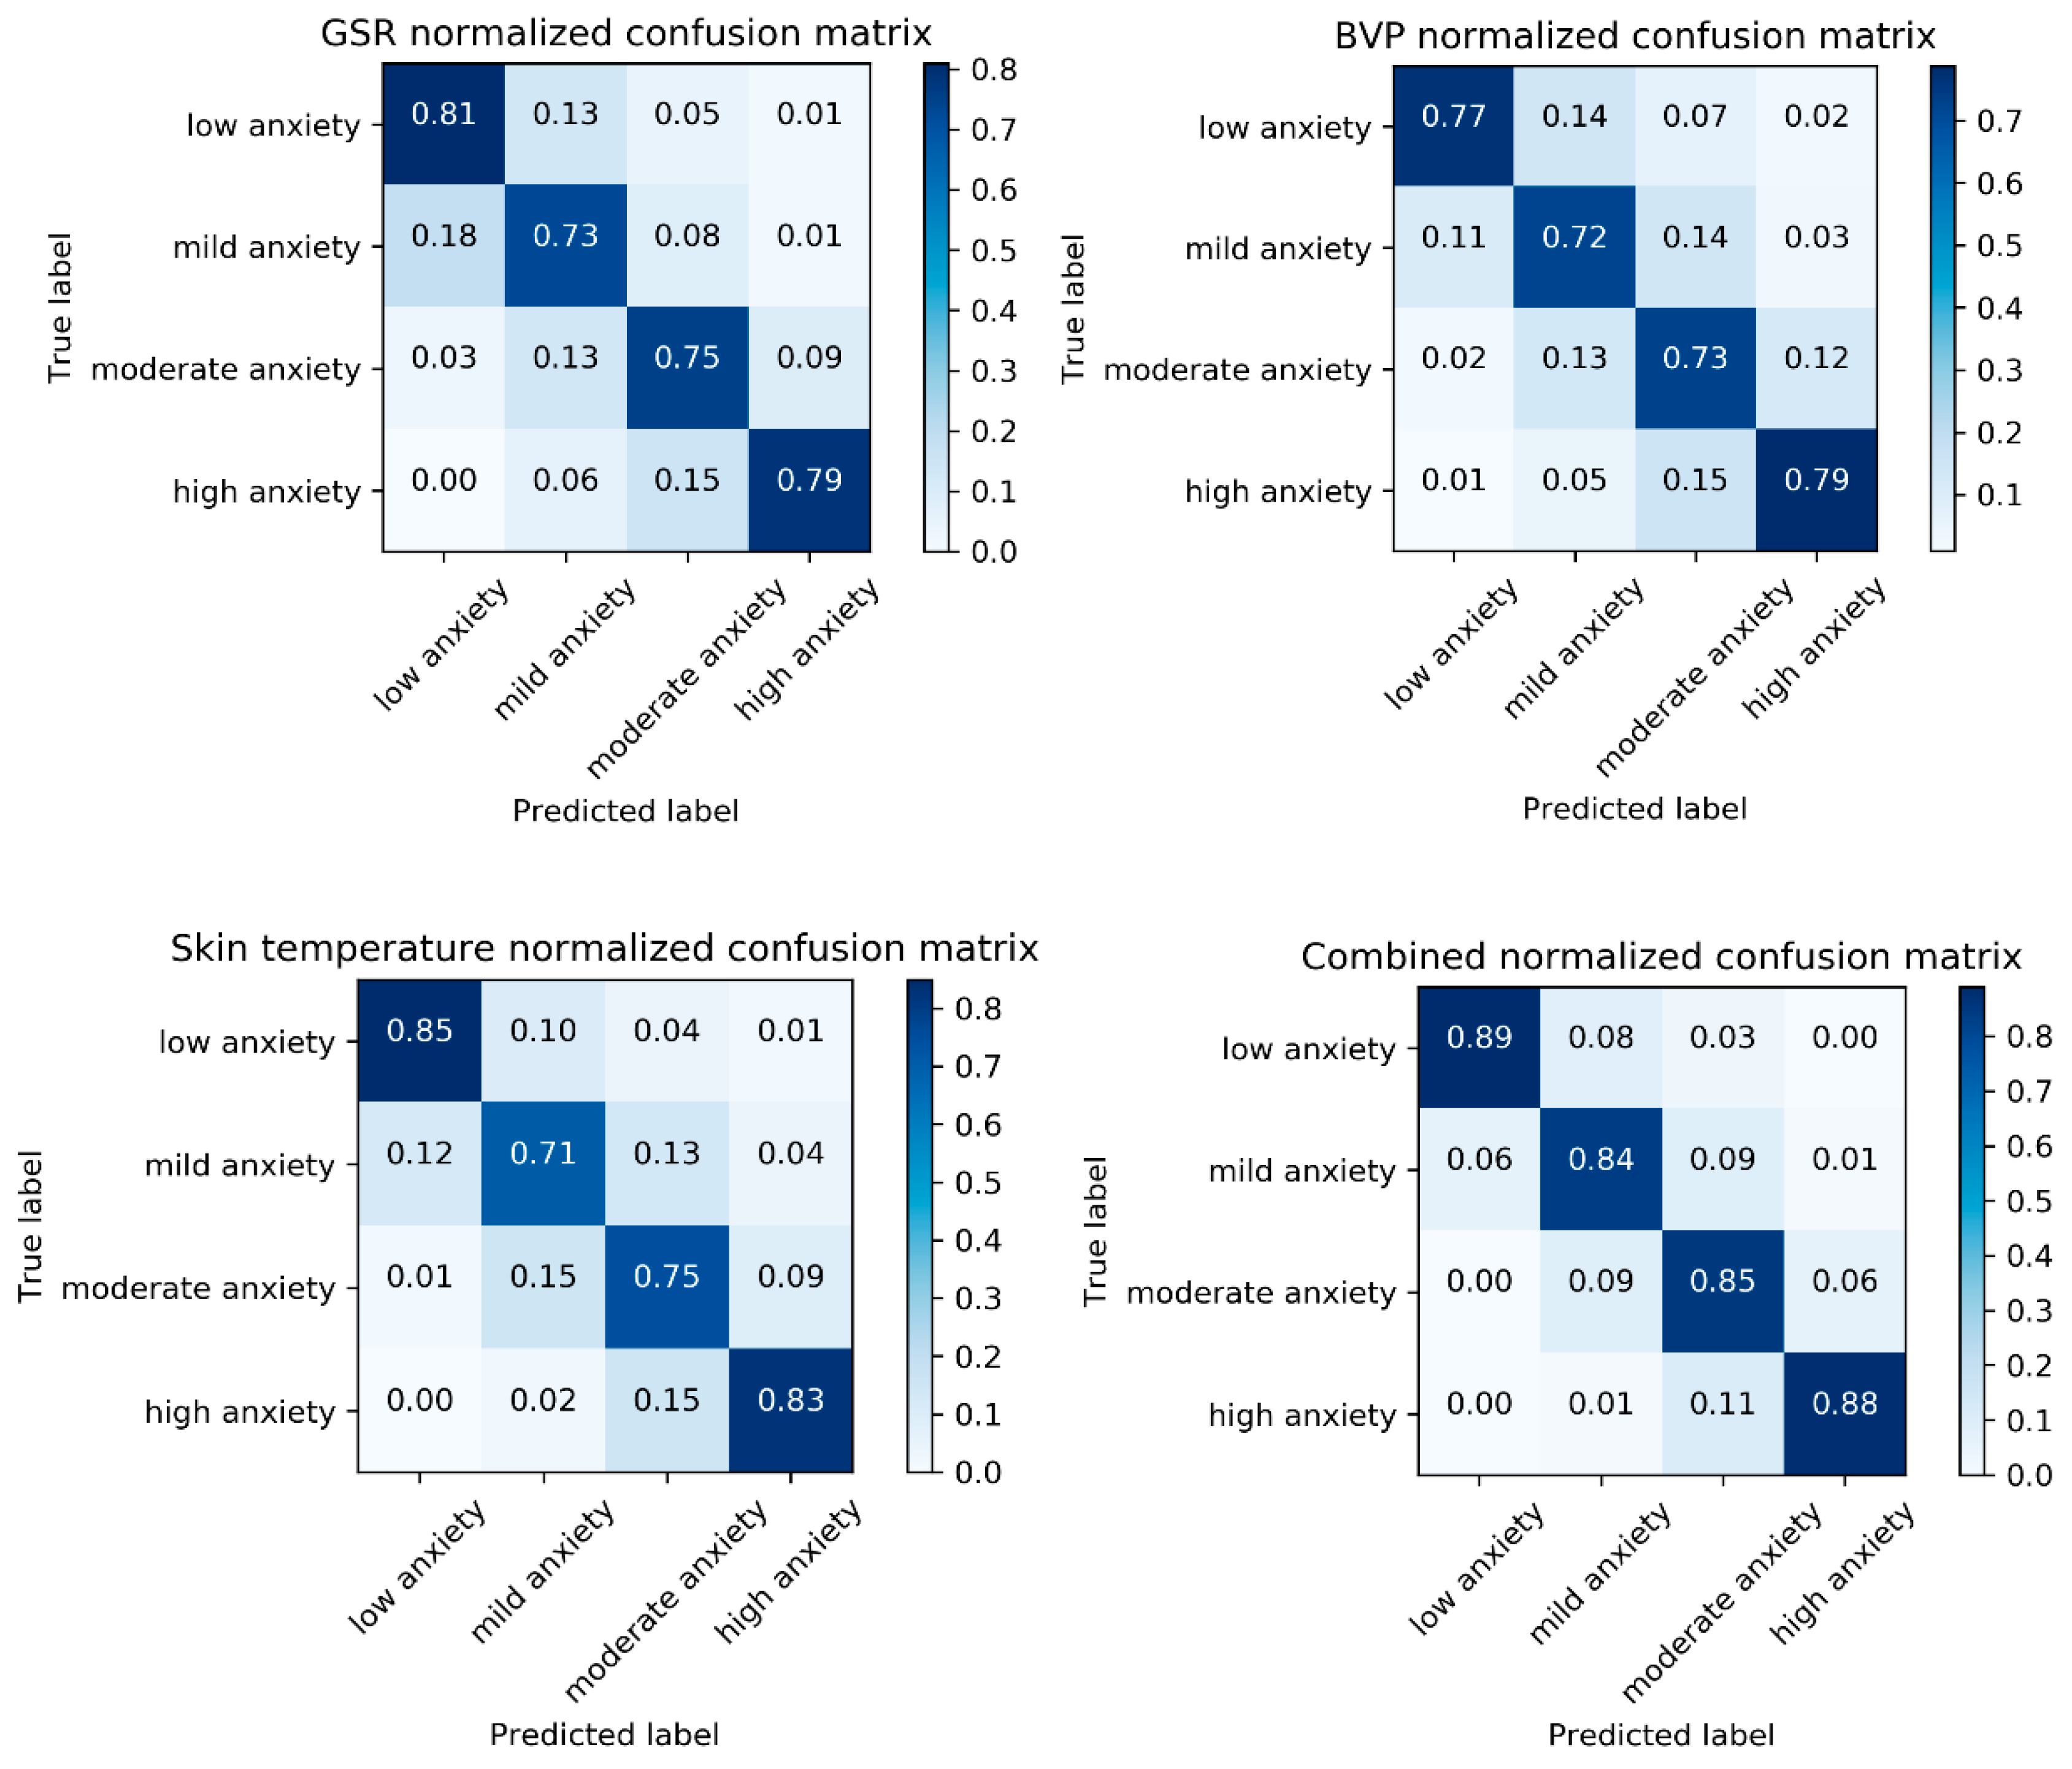
The class distribution in our research mostly focused on mild and moderate anxiety (Figure 6). However, we demonstrated that our models did not have strong bias to one particular class by plotting normalized confusion matrixes, as shown in Figure 8.
5. Classification and Anxiety Level Detection
In order to evaluate the influence of the signal window size and signal type on the accuracy of anxiety level classification, we divided our analysis into multiple stages. First, we analyzed different sliding window lengths. Second, we investigated the feature importance for every signal and fused dataset. Last, we evaluated the classification accuracy of the GSR, BVP, and skin temperature signals separately and compared them with a combined dataset.
All classification models were trained using an SVM classifier, as it has been used by many previous studies for anxiety recognition. We used the radial basis function (RBF) as the SVM kernel and the penalty parameter, C, was set to 100, with C used for class-balancing by automatically adjusting weights inversely proportional to the class frequencies.
Model training and data processing was done offline after all VRET experiments were finished.
5.1. Window Size Evaluation
The window’s size can severely impact the results of classification. Therefore, we trained all of our models using 3, 5, 8, 10, 13, 15, 18, 20, 23, 25, 28, 29, and 30 s window lengths.
For GSR and BVP signals, the window size had a significant impact on the results, while skin temperature was less impacted by the window size. For all signals, the accuracy steadily increased as the window size increased. The peak was reached at around 18 to 23 s.
A visual comparison of the accuracy dependency on window size is shown in Figure 7.
Based on our findings, we can conclude that it is best to use a signal window size of around 20 s. For smaller window lengths, the accuracy is lower; however, long window sizes have the downside of a slower update rate as it would take around 20 s to update the affective state change. A detailed comparison of the results is listed in Table 2.
5.2. Signal Evaluation and Signal Fusion
When evaluating our final models, we focused on confusion matrixes. In multi-class classifications, sometimes, classifiers tend to over-fit and can be biased to a particular class. However, in our case, all four classes had strong prediction accuracies and the classifier did not learn on one majority class. The confusion matrices of all classifiers are visualized in Figure 8.
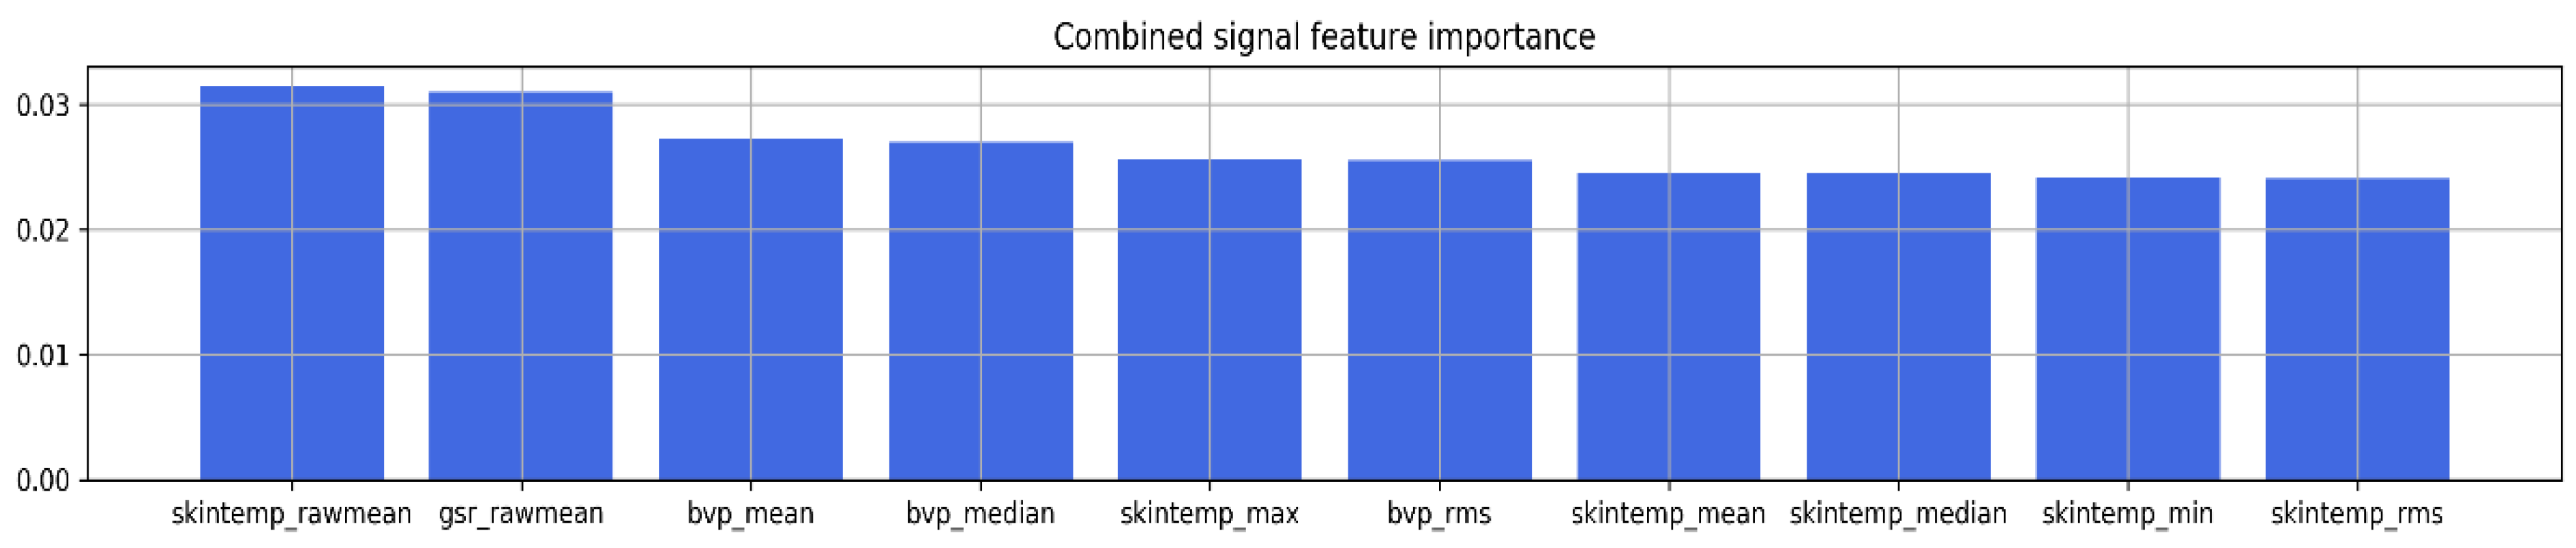
We applied random forest (RF) for feature selection. The method can expose the feature importance of a classification task using the Gini index [43]. This index shows a correlation between the signal feature and anxiety label. The stronger relationship is indicated by a higher index value. In the case of signal fusion, we can state that the strongest features were extracted from all signals. Interestingly, the method selected six features from skin temperature, three features from BVP, and one feature from GSR. The 10 most-impactful features of the fused signal (with the highest Gini index values) are displayed in Figure 9.
As in many previous studies, we employed the signal fusion approach for all modalities. There are several methods of how signal fusion can be implemented. The most notable ones are early fusion and late fusion. During early fusion, signals from all modalities are mixed together and go through the feature selection stage as a combined dataset. Alternatively, during the process of late fusion, signals from all modalities are kept separate and signals are fused only at the classification stage.
We achieved results showing that the model that used signal fusion outperformed models that used standalone GSR, BVP, and skin temperature signals. In our case, the method of early fusion performed slightly better than late fusion, achieving an accuracy of 86.3% and 83.2%, respectively.
Based on the feature importance analysis, we can see that the early fused model used all the strongest features from every signal. The final anxiety level classification results are detailed in Table 3.
5.3. One-Subject-Leave-Out Validation
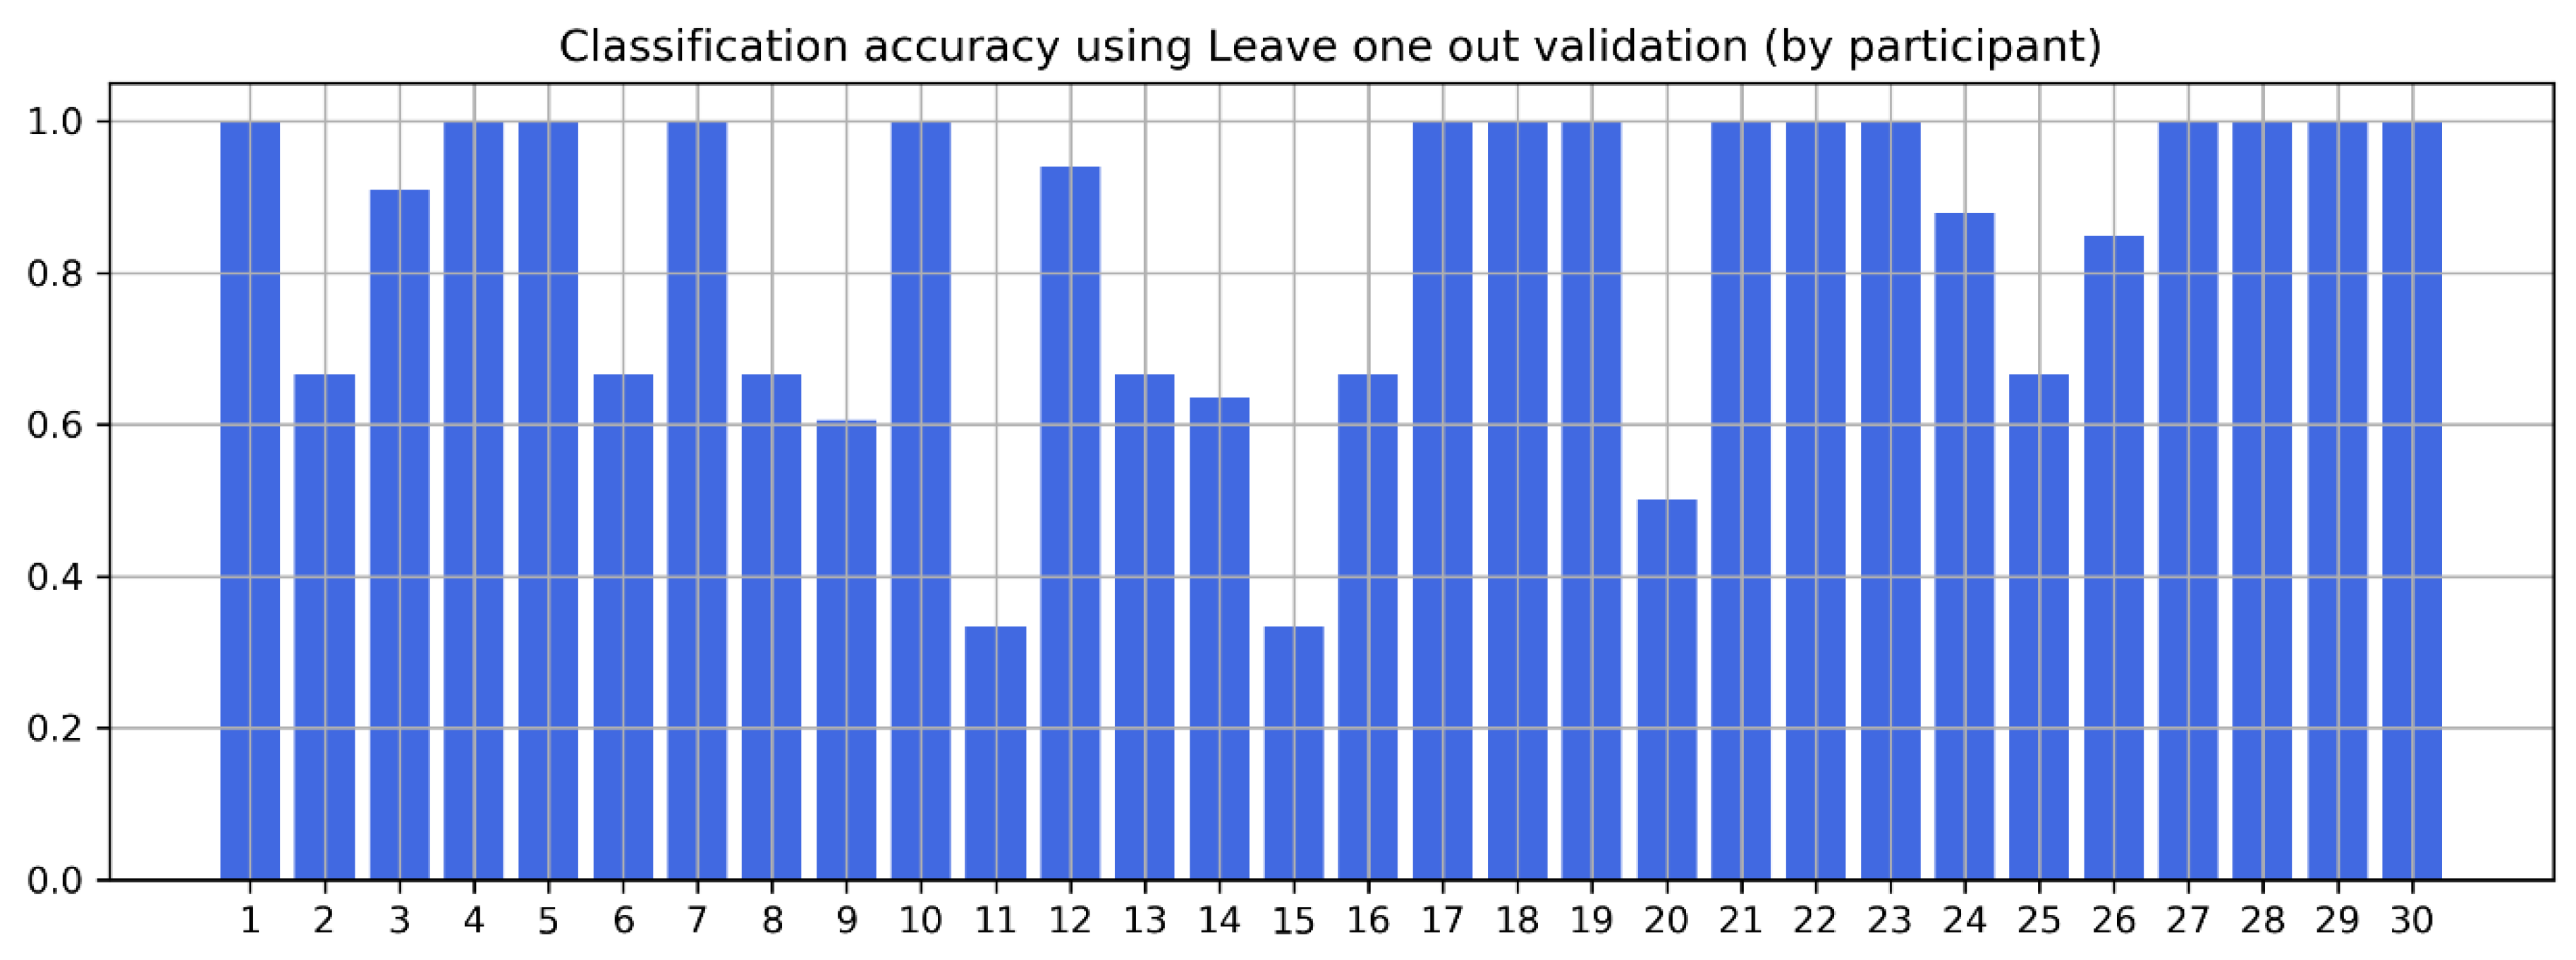
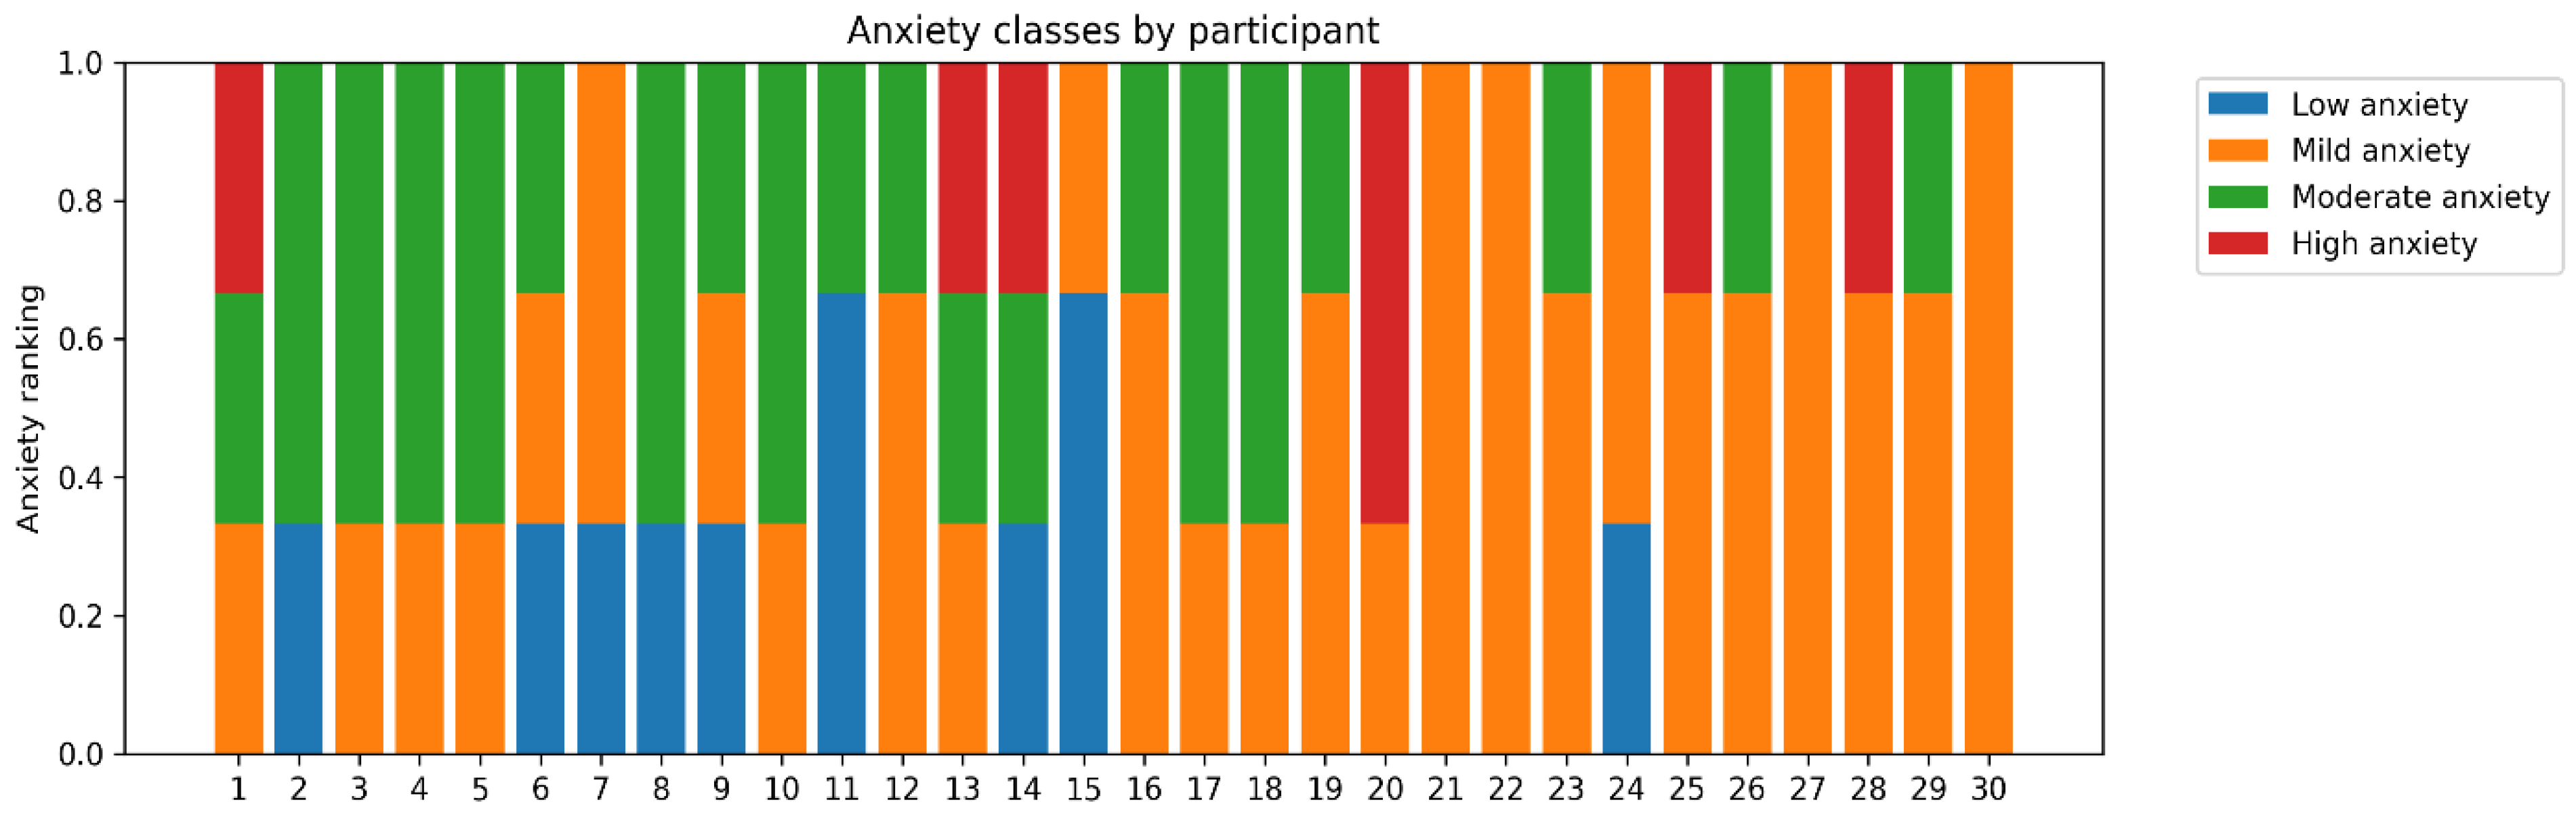
Standard k-fold validation cannot demonstrate a good validation measurement for a subject to subject basis as it mixes data from all participants into separate folds. Therefore, for a subject independent validation, it is useful to perform “one-subject-leave-out” validation. This means that in our case, we used signals of 29 participants and then tested it against one. Our signal fusion (early) model achieved an 80.1% accuracy on average with this type of validation. From Figure 10, we can see that the anxiety prediction accuracy remains high for most of the participants; however, it sharply drops for subjects 11, 15, and 20 (see Figure 10). This highlights the challenges of predicting anxiety for every subject individually as the results can be impacted by the subjective nature of the SUDS scale and challenges of the generalization of the autonomic nervous system response through psychophysiological signals (class distribution by participant is visualized in Figure 11).
5.4. Comparison of Results
Multiple studies have been done in the area of stress recognition. The majority of them use various physiological signals in order to detect and classify stress or anxiety, similar to those that were used in our research. Although, during these studies, anxiety is induced using different methods, like completing mental tasks in the laboratory environment, driving, or public speaking. Moreover, authors describe anxiety in multiple ways: Binary (stressed or relaxed), three classes (no anxiety, low anxiety, and high anxiety), or even four classes (no, low, mild, or high anxiety).
We compared our results to previous research and can state that our results are on the same scale as other researchers. However, each study and experiment are different, and it is hard to make strict one-to-one comparisons with our research, which measures VRET-induced anxiety.
Thus, we decided to perform a comparison with our mental stress detection system within three separate research streams. Firstly, we compared our results with anxiety recognition systems that were trained using data collected during stress periods that were induced in the laboratory. Then, we discussed the comparison with studies that used driving-induced stress, and, lastly, we considered several studies that measured stress during a public speaking exercise and trained anxiety prediction models for them.
Many research studies use psychophysiological signals collected during stress induced by solving mental tasks in the laboratory environment [42,44,45,46,47,48]. These tasks usually involve solving logical puzzles, mathematical equations, or dealing with time-sensitive challenges. Usually, they have bigger participant groups and measure two anxiety classes: One during the relax period (no stress class), and one during the solving of the task (stress class). While our stress stimuli were different, we feel that it is important to compare our results with these works as they represent a majority of the analyzed mental stress detection systems (Table 4).
Another group of research papers classified an anxiety that is induced by driving around the city. These studies split the anxiety level not in two but in three classes: Calm, low stress (low traffic), and high stress (high traffic) situations. Therefore, it is interesting to compare our results with datasets that identify stress level stressing the context of multi-level stress classification (Table 5).
Finally, we found several papers that present anxiety prediction frameworks based on data collected during public speaking exercises. While they are not based on public speaking in the VRET environment, conceptually, they are the closest to our research (Table 6).
5.5. VRET and Anxiety Detection Limitations
Various factors can affect the reliability of mental stress (anxiety) recognition systems. One of the latest systematic reviews of stress recognition systems that uses wearable sensors as a source identifies these main challenges [40]:
- Discrimination of similar emotions: The nature of human psychology can greatly impact the reliability of an anxiety recognition system. Some psychophysiological signals, like heart rate, can show up as a similar signal for different emotions. Thus, discrimination of human emotions remains a challenge for all researchers.
- Unknown context and conditions: Unless the experiment is conducted in artificial (perfect) laboratory conditions, we have to deal with non-restricted environments and stimuli. Even in the psychology clinic, we cannot control external factors like room temperature or audio-visual stimuli from the environment.
- Artifacts from movement: As the psychophysiological measurements are done through wearable sensors, artifacts can contaminate the data. Even when the data is collected with the supervision of a professional, wearable devices can inadvertently be moved from their proper position. This is also a relevant issue for VRET studies due to the implied nature of 360° movement in virtual reality.
- Subjective ground truth: In order to use classification methods, each point of the data must be labeled and assigned a specific value for it. However, as we do not know the ground truth, we have to trust the subject to correctly fill out a subjective report, form, or survey. Moreover, as these labels are subjective, they can change from person to person; even two subjects with identical psychophysiological signals can report different anxiety levels. Finally, the time to label the anxiety level (to fill out a survey or questionnaire) can also have a major influence on the labeling accuracy.
On the other hand, two recent systematic surveys of VRET studies indicated these conclusions and limitations of the VR-based treatment [11,52]:
- VRET is not less or more effective than traditional in vivo exposure therapy;
- VRET could be a preferential choice only in cases when it can be more accessible or preferable than traditional alternatives;
- Use of VRET does not lower attrition and dropout rates from therapy courses.
The limitations of our anxiety recognition methods include the reliance on the subjective anxiety scale (SUDS), which was used to add classification labels to our dataset. Additionally, the current experiment was limited to a single treatment session per participant, while anxiety treatment usually occurs over multiple sessions.
Anxiety level prediction during public anxiety treatment sessions could benefit from temporal processing as an additional source of auditory signals. While in our experiment, we did not record speech itself, we strongly believe that future research should consider recording participants’ speech patterns and add them as an additional modality for the feature extraction phase.
6. Discussion and Conclusions
We designed an anxiety prediction framework for a VRET system. The combination of anxiety detection and VRET demonstrates the possibility of measuring mental anxiety by adding real-time stress recognition capabilities. Our best classification model was capable of predicting a four-class anxiety level with a high 80.1% accuracy (one-subject-leave-out validation) and 86.3% (10 × 10 fold cross-validation). This should encourage other researchers and VRET system developers to invest time into psychophysiological signal analysis for their VR solutions. However, in our work, we also investigated the limitations of VRET solutions and mental stress recognition systems that have to be taken into account for further research. This was also highlighted through one-subject-out validation, as the anxiety prediction of some subjects showed lower results.
We also investigated the impact of signal window sizes on anxiety prediction accuracy as different stimuli can have different emotional activation lengths. Our results showed that the best performing VRET stimuli-based models had a window length between 20 and 25 s. We reconfirmed the results of many previous studies, which claim that fused signal datasets perform better than stand-alone signals, and we showed that this applies for VRET-based anxiety stimuli, too. The classification model with signal early fusion performed 9.7% better than the GSR-based model, 11.2% better than the skin temperature-based model, and 12.2% better than the BVP-based model.
While there are many studies that cover VRET systems and mental anxiety recognition frameworks, our designed system combines these fields together. We demonstrated that it is feasible to estimate the anxiety levels of patients who are undergoing VRET sessions. This information could prove to be very valuable in designing adaptive and personalized VRET systems that refine their functionalities based on the patient’s mental stress.
Our further work will focus on integrating the anxiety level prediction framework into the user interface of our cloud-based VRET system, so the psychologist could easily track and react to changes in the patient’s anxiety during VRET.
Author Contributions
Conceptualization, J.S. and I.L.; Formal analysis, J.S. and I.L.; Methodology, R.D. and J.S.; Supervision, R.D.; Visualization, J.S. and R.D.; Writing—original draft, J.S.; Writing—review and editing, R.D. and R.M.
Funding
This research was partially financed by the European Regional Development Fund within the "Intelektas. Bendri mokslo-verslo projektai" program (project reference number: J05-LVPA-K-01-0232).
Acknowledgments
We acknowledge the support of SneakyBox in implementation of this research.
Conflicts of Interest
The authors declare no conflict of interest.
References
- Bandelow, B.; Michaelis, S. Epidemiology of anxiety disorders in the 21st century. Dialogues Clin. Neurosci. 2015, 17, 327–335. [Google Scholar] [PubMed]
- Raudonis, V.; Maskeliūnas, R.; Stankevičius, K.; Damaševičius, R. Gender, age, colour, position and stress: How they influence attention at workplace? In Computational Science and Its Applications—ICCSA 2017; Springer International Publishing: Cham, Switerland, 2017; pp. 248–264. [Google Scholar] [CrossRef]
- Carpenter, J.K.; Pinaire, M.; Hofmann, S.G. From extinction learning to anxiety treatment: Mind the gap. Brain Sci. 2019, 9, 164. [Google Scholar] [CrossRef] [PubMed]
- Scibelli, F.; Troncone, A.; Likforman-Sulem, L.; Vinciarelli, A.; Esposito, A. How major depressive disorder affects the ability to decode multimodal dynamic emotional stimuli. Front. ICT 2016, 3, 16. [Google Scholar] [CrossRef]
- Carpenter, J.K.; Andrews, L.A.; Witcraft, S.M.; Powers, M.B.; Smits, J.A.J.; Hofmann, S.G. Cognitive behavioral therapy for anxiety and related disorders: A meta-analysis of randomized placebo-controlled trials. Depress. Anxiety 2018, 35, 502–514. [Google Scholar] [CrossRef] [PubMed]
- Hood, H.K.; Antony, M.M. Evidence-Based Assessment and Treatment of Specific Phobias in Adults; Springer: New York, NY, USA, 2012; pp. 19–42. [Google Scholar]
- Le, Q.A.; Doctor, J.N.; Zoellner, L.A.; Feeny, N.C. Cost-effectiveness of prolonged exposure therapy versus pharmacotherapy and treatment choice in posttraumatic stress disorder (the optimizing PTSD treatment trial). J. Clin. Psychiatry 2014, 75, 222–230. [Google Scholar] [CrossRef] [PubMed]
- Maskeliunas, R.; Damasevicius, R.; Martisius, I.; Vasiljevas, M. Consumer grade EEG devices: Are they usable for control tasks? PeerJ 2016, 4, e1746. [Google Scholar] [CrossRef] [PubMed]
- Beidel, D.C.; Frueh, B.C.; Neer, S.M.; Bowers, C.A.; Trachik, B.; Uhde, T.W.; Grubaugh, A. Trauma management therapy with virtual-reality augmented exposure therapy for combat-related PTSD: A randomized controlled trial. J. Anxiety Disord. 2019, 61, 64–74. [Google Scholar] [CrossRef]
- Buzys, R.; Maskeliūnas, R.; Damaševičius, R.; Sidekerskienė, T.; Woźniak, M.; Wei, W. Cloudification of Virtual Reality Gliding Simulation Game. Information 2018, 9, 293. [Google Scholar] [CrossRef]
- Benbow, A.A.; Anderson, P.L. A meta-analytic examination of attrition in virtual reality exposure therapy for anxiety disorders. J. Anxiety Disord. 2019, 61, 18–26. [Google Scholar] [CrossRef]
- Mertens, G.; Wagensveld, P.; Engelhard, I.M. Cue conditioning using a virtual spider discriminates between high and low spider fearful individuals. Comput. Human Behav. 2019, 91, 192–200. [Google Scholar] [CrossRef]
- Norrholm, S.D.; Jovanovic, T.; Gerardi, M.; Breazeale, K.G.; Price, M.; Davis, M.; Duncan, E.; Ressler, K.J.; Bradley, B.; Rizzo, A.; et al. Baseline psychophysiological and cortisol reactivity as a predictor of PTSD treatment outcome in virtual reality exposure therapy. Behav. Res. Ther. 2016, 82, 28–37. [Google Scholar] [CrossRef] [PubMed] [Green Version]
- Maskeliūnas, R.; Blažauskas, T.; Damaševičius, R. Depression behavior detection model based on participation in serious games. In Rough Sets 2017; Springer International Publishing: Cham, Switzerland, 2017; pp. 423–434. [Google Scholar] [CrossRef]
- Picard, R.W. Affective Computing; MIT Press: Cambridge, MA, USA, 2000. [Google Scholar]
- Picard, R.W.; Vyzas, E.; Healey, J. Toward machine emotional intelligence: Analysis of affective physiological state. IEEE Trans. Pattern Anal. Mach. Intell. 2001, 23, 1175–1191. [Google Scholar] [CrossRef]
- Vaškevičius, E.; Vidugirienė, A.; Kaminskas, V. Identification of human response to virtual 3D face stimuli. Inf. Technol. Control 2014, 43, 47–56. [Google Scholar] [CrossRef]
- Katsigiannis, S.; Ramzan, N. DREAMER: A database for emotion recognition through EEG and ECG signals from wireless low-cost off-the-shelf devices. IEEE J. Biomed. Heal. Inform. 2018, 22, 98–107. [Google Scholar] [CrossRef] [PubMed]
- Abadi, M.K.; Subramanian, R.; Kia, S.M.; Avesani, P.; Patras, I.; Sebe, N. DECAF: MEG-based multimodal database for decoding affective physiological responses. IEEE Trans. Affect. Comput. 2015, 6, 209–222. [Google Scholar] [CrossRef]
- Moraes, J.; Rocha, M.; Vasconcelos, G.; Vasconcelos Filho, J.; de Albuquerque, V.; Alexandria, A. Advances in photopletysmography signal analysis for biomedical applications. Sensors 2018, 18, 1894. [Google Scholar] [CrossRef] [PubMed]
- Murali Krishna, N.; Sekaran, K.; Naga Vamsi, A.V.; Pradeep Ghantasala, G.S.; Chandana, P.; Kadry, S.; Blazauskas, T.; Damasevicius, R. An efficient mixture model approach in brain-machine interface systems for extracting the psychological status of mentally impaired persons using EEG signals. IEEE Access 2019, 7, 77905–77914. [Google Scholar] [CrossRef]
- Panicker, S.S.; Gayathri, P. A survey of machine learning techniques in physiology based mental stress detection systems. Biocybern. Biomed. Eng. 2019, 39, 444–469. [Google Scholar] [CrossRef]
- Diemer, J.; Lohkamp, N.; Mühlberger, A.; Zwanzger, P. Fear and physiological arousal during a virtual height challenge—Effects in patients with acrophobia and healthy controls. J. Anxiety Disord. 2016, 37, 30–39. [Google Scholar] [CrossRef] [PubMed]
- Raghav, K.; Van Wijk, A.; Abdullah, F.; Islam, M.N.; Bernatchez, M.; De Jongh, A. Efficacy of virtual reality exposure therapy for treatment of dental phobia: A randomized control trial. BMC Oral Health 2016, 16, 25. [Google Scholar] [CrossRef]
- Freeman, D.; Haselton, P.; Freeman, J.; Spanlang, B.; Kishore, S.; Albery, E.; Denne, M.; Brown, P.; Slater, M.; Nickless, A. Automated psychological therapy using immersive virtual reality for treatment of fear of heights: A single-blind, parallel-group, randomised controlled trial. Lancet Psychiatry 2018, 5, 625–632. [Google Scholar] [CrossRef]
- Kurniawan, H.; Maslov, A.V.; Pechenizkiy, M. Stress detection from speech and galvanic skin response signals. In Proceedings of the 26th IEEE International Symposium on Computer-Based Medical Systems, Porto, Portugal, 20–22 June 2013; pp. 209–214. [Google Scholar]
- Gjoreski, M.; Gjoreski, H.; Luštrek, M.; Gams, M. Continuous stress detection using a wrist device. In Proceedings of the 2016 ACM International Joint Conference on Pervasive and Ubiquitous Computing Adjunct—UbiComp ’16, Heidelberg, Germany, 12–16 September 2016; ACM Press: New York, NY, USA, 2016; pp. 1185–1193. [Google Scholar]
- Dedovic, K.; Renwick, R.; Mahani, N.K.; Engert, V.; Lupien, S.J.; Pruessner, J.C. The Montreal imaging stress task: Using functional imaging to investigate the effects of perceiving and processing psychosocial stress in the human brain. J. Psychiatry Neurosci. 2005, 30, 319–325. [Google Scholar] [PubMed]
- Salkevicius, J.; Navickas, L. Battling the fear of public speaking: Designing software as a service solution for a virtual reality therapy. In Proceedings of the 2018 6th International Conference on Future Internet of Things and Cloud Workshops (FiCloudW), Barcelona, Spain, 6–8 August 2018; pp. 209–213. [Google Scholar]
- Šalkevičius, J.; Miškinytė, A.; Navickas, L. Cloud based virtual reality exposure therapy service for public speaking anxiety. Information 2019, 10, 62. [Google Scholar] [CrossRef]
- Van der Walt, S.; Colbert, S.C.; Varoquaux, G. The numpy array: A structure for efficient numerical computation. Comput. Sci. Eng. 2011, 13, 22–30. [Google Scholar] [CrossRef]
- Carreiras, C.; Alves, A.P.; Lourenço, A.; Canento, F.; Silva, H.; Fred, A. BioSPPy: Biosignal Processing in Python. 2015. Available online: https://github.com/PIA-Group/BioSPPy (accessed on 13 September 2019).
- Van Gent, P.; Farah, H.; Nes, N.; van Arem, B. Heart rate analysis for human factors: Development and validation of an open source toolkit for noisy naturalistic heart rate data. In Proceedings of the 6th HUMMANIST Conference, Hague, The Netherlands, 13–14 June 2018; pp. 173–178. [Google Scholar]
- Pedregosa, F.; Varoquaux, G.; Gramfort, A.; Michel, V.; Thirion, B.; Grisel, O.; Blondel, M.; Prettenhofer, P.; Weiss, R.; Dubourg, V.; et al. Scikit-learn: Machine learning in python. J. Mach. Learn. Res. 2011, 12, 2825–2830. [Google Scholar]
- Wolpe, J. The Practice of Behavior Therapy; Pergamon Press: New York, NY, USA, 1969. [Google Scholar]
- Garbarino, M.; Lai, M.; Bender, D.; Picard, R.W.; Tognetti, S. Empatica E3—A wearable wireless multi-sensor device for real-time computerized biofeedback and data acquisition. In Proceedings of the 4th International Conference on Wireless Mobile Communication and Healthcare—Transforming Healthcare through Innovations in Mobile and Wireless Technologies (MOBIHEALTH), Athens, Greece, 3–5 November 2014; pp. 39–42. [Google Scholar] [CrossRef]
- Koelstra, S.; Muhl, C.; Soleymani, M.; Lee, J.-S.; Yazdani, A.; Ebrahimi, T.; Pun, T.; Nijholt, A.; Patras, I. DEAP: A database for emotion analysis using physiological signals. IEEE Trans. Affect. Comput. 2012, 3, 18–31. [Google Scholar] [CrossRef]
- Ayata, D.; Yaslan, Y.; Kamasak, M.E. Emotion based music recommendation system using wearable physiological sensors. IEEE Trans. Consum. Electron. 2018, 64, 196–203. [Google Scholar] [CrossRef]
- Wen, W.; Liu, G.; Cheng, N.; Wei, J.; Shangguan, P.; Huang, W. Emotion recognition based on multi-variant correlation of physiological signals. IEEE Trans. Affect. Comput. 2014, 5, 126–140. [Google Scholar] [CrossRef]
- Can, Y.S.; Arnrich, B.; Ersoy, C. Stress detection in daily life scenarios using smart phones and wearable sensors: A survey. J. Biomed. Inform. 2019, 92, 103–139. [Google Scholar] [CrossRef]
- Delmastro, F.; Di Martino, F.; Dolciotti, C. Physiological impact of vibro-acoustic therapy on stress and emotions through wearable sensors. In Proceedings of the 2018 IEEE International Conference on Pervasive Computing and Communications Workshops (PerCom Workshops), Athens, Greece, 19–23 March 2018; pp. 621–626. [Google Scholar]
- (Gert-Jan) de Vries, J.J.G.; Pauws, S.C.; Biehl, M. Insightful stress detection from physiology modalities using Learning Vector Quantization. Neurocomputing 2015, 151, 873–882. [Google Scholar] [CrossRef]
- Cao, W.-H.; Xu, J.-P.; Liu, Z.-T. Speaker-independent speech emotion recognition based on random forest feature selection algorithm. In Proceedings of the 2017 36th Chinese Control Conference (CCC), Dalian, China, 26–28 July 2017; pp. 10995–10998. [Google Scholar]
- Xu, Q.; Nwe, T.L.; Guan, C. Cluster-based analysis for personalized stress evaluation using physiological signals. IEEE J. Biomed. Health Inform. 2015, 19, 275–281. [Google Scholar] [CrossRef] [PubMed]
- Akmandor, A.O.; Jha, N.K. Keep the stress away with SoDA: Stress detection and alleviation system. IEEE Trans. Multi Scale Comput. Syst. 2017, 3, 269–282. [Google Scholar] [CrossRef]
- Vanitha, V.; Krishnan, P. Real time stress detection system based on EEG signals. Biomed. Res. 2016, 27, 271–275. [Google Scholar]
- Sandulescu, V.; Andrews, S.; Ellis, D.; Bellotto, N.; Mozos, O.M. Stress detection using wearable physiological sensors. In Proceedings of the International Work-Conference on the Interplay between Natural and Artificial Computation IWINAC 2015: Artificial Computation in Biology and Medicine, Elche, Spain, 1–5 June 2015; Springer: Cham, Switzerland, 2015; pp. 526–532. [Google Scholar]
- Castaldo, R.; Montesinos, L.; Melillo, P.; Massaro, S.; Pecchia, L. To what extent can we shorten HRV analysis in wearable sensing? A case study on mental stress detection. In Proceedings of the European Medical and Biological Engineering Conference Nordic-Baltic Conference on Biomedical Engineering and Medical Physics EMBEC 2017, NBC 2017: EMBEC & NBC 2017, Tampere, Finland, 11–15 June 2017; Springer: Singapore, 2017; pp. 643–646. [Google Scholar]
- Chen, L.; Zhao, Y.; Ye, P.; Zhang, J.; Zou, J. Detecting driving stress in physiological signals based on multimodal feature analysis and kernel classifiers. Expert Syst. Appl. 2017, 85, 279–291. [Google Scholar] [CrossRef]
- Ghaderi, A.; Frounchi, J.; Farnam, A. Machine learning-based signal processing using physiological signals for stress detection. In Proceedings of the 2015 22nd Iranian Conference on Biomedical Engineering (ICBME), Tehran, Iran, 25–27 November 2015; pp. 93–98. [Google Scholar]
- Zhang, X.; Wen, W.; Liu, G.; Hu, H. Recognition of public speaking anxiety on the recurrence quantification analysis of GSR signals. In Proceedings of the 2016 Sixth International Conference on Information Science and Technology (ICIST), Dalian, China, 6–8 May 2016; pp. 533–538. [Google Scholar]
- Carl, E.; Stein, A.T.; Levihn-Coon, A.; Pogue, J.R.; Rothbaum, B.; Emmelkamp, P.; Asmundson, G.J.G.; Carlbring, P.; Powers, M.B. Virtual reality exposure therapy for anxiety and related disorders: A meta-analysis of randomized controlled trials. J. Anxiety Disord. 2019, 61, 27–36. [Google Scholar] [CrossRef] [PubMed]
Figure 1.
Key components of the virtual reality exposure therapy (VRET) system.

Figure 2.
VRET system with anxiety level prediction using physiological signals.

Figure 3.
Flow of the VRET public speaking anxiety treatment session during the experiment.

Figure 4.
VRET public speaking environment: (a) backstage; (b) stage in the virtual conference hall.
Figure 4.
VRET public speaking environment: (a) backstage; (b) stage in the virtual conference hall.

Figure 5.
Anxiety level class assignment by Subjective Units of Distress Scale (SUDS) value.

Figure 6.
Anxiety class distribution.

Figure 7.
Anxiety level prediction using blood volume pressure (BVP), galvanic skin response (GSR), and skin temperature: accuracy dependency upon the length of the signal window.
Figure 7.
Anxiety level prediction using blood volume pressure (BVP), galvanic skin response (GSR), and skin temperature: accuracy dependency upon the length of the signal window.

Figure 8.
Confusion matrixes for each signal (GSR, BVP, skin temperature) and signal fusion (early).
Figure 8.
Confusion matrixes for each signal (GSR, BVP, skin temperature) and signal fusion (early).

Figure 9.
Feature importance signal fusion (top 10 features are shown).

Figure 10.
Results of leave-one-subject-out validation by each participant.

Figure 11.
Anxiety levels reported by each participant.


Table 1.
Feature set of physiological signals.
| Signal Type | Group | Feature |
|---|---|---|
| All | Statistical | Minimum |
| Maximum | ||
| Average | ||
| Variance | ||
| Standard deviation (SD) | ||
| Median | ||
| Kurtosis | ||
| Skewness | ||
| Expanded statistical [38] | Mean absolute deviation | |
| 6th moment | ||
| 5th moment | ||
| 4th moment | ||
| 3rd moment | ||
| Root mean square | ||
| Differential [38] | 1st difference | |
| 1st difference divided by SD | ||
| 2nd difference | ||
| 2nd difference divided by SD | ||
| Piccard et al. [16] | Mean absolute of the raw signal | |
| Standard deviation of the raw signal | ||
| Mean absolute of first difference of the raw signal | ||
| Mean absolute of first difference of the normalized signal | ||
| Mean absolute of second difference of the raw signal | ||
| Mean absolute of first difference of the normalized signal | ||
| GSR | Peaks and amplitudes [41] | Number of SCR peaks |
| Average SCR peak amplitude | ||
| Max SCR amplitude | ||
| BVP | Heart rate [42] | Beats per minute |
| Inter-beat interval | ||
| Root mean square of successive differences between adjacent R-R intervals | ||
| Standard deviation of successive differences between adjacent R-R intervals | ||
| Standard deviation if intervals between adjacent beats | ||
| Heart rate mean absolute deviation |
Table 2.
Anxiety level prediction accuracy by signal type and window size (best results are shown in bold), 10 × 10 fold cross-validation.
Table 2.
Anxiety level prediction accuracy by signal type and window size (best results are shown in bold), 10 × 10 fold cross-validation.
| Window Size, s | Accuracy Using GSR | Accuracy Using BVP | Accuracy Using Skin Temperature |
|---|---|---|---|
| 3 | 70.9% | 66.2% | 72.6% |
| 5 | 73.2% | 68.3% | 73.7% |
| 8 | 74.3% | 74.0% | 73.3% |
| 10 | 74.3% | 73.1% | 73.8% |
| 13 | 74.0% | 73.8% | 73.2% |
| 15 | 74.4% | 73.7% | 73.7% |
| 18 | 75.8% | 74.1% | 75.1% |
| 20 | 75.9% | 73.8% | 73.3% |
| 23 | 76.6% | 73.0% | 72.6% |
| 25 | 76.2% | 70.2% | 71.7% |
| 28 | 73.7% | 72.6% | 68.8% |
| 30 | 73.8% | 71.8% | 69.1% |
Table 3.
Anxiety level prediction accuracy by signal type (using 10 × 10 fold cross validation).
| Signal Type | Best Accuracy | Windows Size |
|---|---|---|
| BVP | 74.1% (SD = 0.036) | 18 s |
| GSR | 76.6% (SD = 0.039) | 23 s |
| Skin temperature | 75.1% (SD = 0.36) | 18 s |
| Signal fusion (early) | 86.3% (SD = 0.025) | 20 s |
| Signal fusion (late) | 83.2% (SD = 0.032) | 20 s |
Table 4.
Comparison with laboratory-induced stress recognition systems.
| Study | Physiological Signals | Anxiety Stimuli | Method | # Of Subjects | # Of Classes | Accuracy |
|---|---|---|---|---|---|---|
| Vries et al. [42] | GSR, ECG, respiratory | Tasks in laboratory | Learning vector quantization (LVQ) | 61 | 2 | 88% (10 × 10 fold) |
| Xu et al. [44] | GSR, EMG, HR, EEG | Tasks in laboratory | General regression neural network (GRNN) | 39 | 2 | 85.2% (leave-1-out) |
| Akamandor et al. [45] | GSR, ECG | Tasks in laboratory | SVM | 32 | 2 | 95.8% (train/test split, subject independent) |
| Vanitha et al. [46] | EEG | Tasks in laboratory | SVM | 6 | 4 | 89% (10-fold) |
| Sandulescu et al. [47] | GSR, BVP | Tasks in laboratory | SVM | 5 | 2 | 80% (75%/25% split, subject dependent) |
| Castaldo et al. [48] | GSR | Tasks in laboratory | Linear discriminant analysis (LDA) | 42 | 2 | 98.8% (10-fold subject dependent) |
| Our system | GSR, BVP, skin temperature | VRET (public speaking) | SVM | 30 | 4 | 80.1% (leave-one-out 86.3% (10 × 10 fold) |
Table 5.
Comparison with driving-induced stress recognition systems.
| Study | Physiological Signals | Anxiety Stimuli | Method | # Of Subjects | # Of Classes | Accuracy |
|---|---|---|---|---|---|---|
| Chen et al. [49] | GSR, ECG, respiratory | Driving | Extreme learning machine (ELM) | 14 | 3 | 99% (cross-drive validation) |
| Ghaderi et al. [50] | GSR, EMG, ECG | Driving | SVM | 7 | 3 | 98% (cross validation, no details) |
| Our system | GSR, BVP, skin temperature | VRET (public speaking) | SVM | 30 | 4 | 80.1% (leave-1-out) 86.3% (10 × 10 fold) |
Table 6.
Comparison with public speaking-induced stress recognition systems.
| Study | Physiological Signals | Anxiety Stimuli | Method | # Of Subjects | # Of Classes | Accuracy |
|---|---|---|---|---|---|---|
| Zhang et al. [51] | GSR | Public speaking | Neural network (BP) | 22 | 2 | 86.7% (leave-one-out) |
| Kurnia-wian et al. [26] | GSR, speech | Public speaking | SVM | Not specified | 3 | 92% (10 × 10 fold) |
| Our system | GSR, BVP, skin temperature | VRET (public speaking) | SVM | 30 | 4 | 80.1% (leave-one-out) 86.3% (10 × 10 fold) |
© 2019 by the authors. Licensee MDPI, Basel, Switzerland. This article is an open access article distributed under the terms and conditions of the Creative Commons Attribution (CC BY) license (http://creativecommons.org/licenses/by/4.0/).
Share and Cite
MDPI and ACS Style
Šalkevicius, J.; Damaševičius, R.; Maskeliunas, R.; Laukienė, I. Anxiety Level Recognition for Virtual Reality Therapy System Using Physiological Signals. Electronics 2019, 8, 1039. https://doi.org/10.3390/electronics8091039
AMA Style
Šalkevicius J, Damaševičius R, Maskeliunas R, Laukienė I. Anxiety Level Recognition for Virtual Reality Therapy System Using Physiological Signals. Electronics. 2019; 8(9):1039. https://doi.org/10.3390/electronics8091039
Chicago/Turabian StyleŠalkevicius, Justas, Robertas Damaševičius, Rytis Maskeliunas, and Ilona Laukienė. 2019. "Anxiety Level Recognition for Virtual Reality Therapy System Using Physiological Signals" Electronics 8, no. 9: 1039. https://doi.org/10.3390/electronics8091039
Note that from the first issue of 2016, this journal uses article numbers instead of page numbers. See further details here.