Article

Experimental and Numerical Analysis of the Effect of a New Lightning Protection System on Lightning Protection and Aerodynamic Noise Performance of Wind Turbine Blades

1
China Huadian Engineering Co., LTD (CHEC), Beijing 100160, China
2
Institute of Engineering Thermo physics, Chinese Academy of Sciences, Beijing 100190, China
3
China Electric Power Research Institute, Beijing 100192, China
4
College of Energy, Power and Mechanical Engineering, North China Electric Power University, Beijing 102206, China
*
Author to whom correspondence should be addressed.
Electronics 2019, 8(9), 1020; https://doi.org/10.3390/electronics8091020
Submission received: 16 August 2019 / Revised: 3 September 2019 / Accepted: 3 September 2019 / Published: 12 September 2019
(This article belongs to the Section Power Electronics)

Abstract

:
In order to tackle the problem of the high failure rate of blades of large wind turbine units due to lightning damage, a new lightning protection system (NLPS) for wind turbine blades is proposed based on the lightning damage mechanism of blades. Firstly, 10 high-voltage discharge tests are performed for blades with and without the NLPS to study the effect of lightning protection. The results show that when the surface of the blade without the NLPS is struck by lightning 10 times, the damage rate of the blade is 100%; for the blade with the NLPS and the lightning attachment position is always on the NLPS in 10 discharge tests, the damage rate of blades is 0% and the lightning protection rate of blades is 100%, indicating that the lightning protection effect for blades with the NLPS is greatly improved. Moreover, the static electric fields of the blades with and without the NLPS are calculated. The results show that the NLPS can shield the electric field around the lower lead wire of the blade, thus effectively reducing the electric field intensity. The NLPS initiates the upward leader more easily than the lower lead wire; therefore, the lightning attachment point is located on the NLPS, thus protecting the blade. Secondly, the aerodynamic and aero-noise characteristics of the blade with and without the NLPS are calculated. The results indicate that the NLPS has little influence on the aerodynamic performance of the blade but has some influence on the aero-noise of the blade. The aero-noise of the airfoil can be reduced at angles of attack of 4°, 8°, 11°, and 15°, but the influence of different phase angles of the airfoil on the amplitude of the sound pressure level (SPL) varies. The aero-noise of the airfoil with the NLPS decreases by 16% and 8% at angles of attack of 4° and 8°, respectively. In general, the design of the NLPS reaches the desired requirements, but it still needs to be further optimized in combination with the blade manufacturing process.

1. Introduction

Lightning is one of the main factors affecting the safe operation of wind turbines [1]. Wind turbine blades are high, prominent, and often located in the wilderness or mountainous areas and thus suffer from lightning. Moreover, due to the increase of tip height of wind turbine, the effect of lightning strikes on wind turbines in space is obviously enhanced, resulting in a further increase in the accident rate of lightning damage for large capacity units. The operating data of Europe, America, Japan, and China show that most of the lightning strike points of wind turbines are positioned on the blades of the wind turbines [2,3,4,5]. Literature [2] statistics of the lightning damage of blades in a wind farm in Kansas, USA in 2012 and 2013. Literature [3] has pointed out that the frequency of wind turbine blade lightning faults in winter is higher than that in summer in Japan’s coastal areas. Wang et al. [4] analyzed the electric field changes of 14 leads on a wind turbine and its lightning tower. It was found that the rotating wind turbine was more likely to start an upward pilot than a stationary tower without the help of the rising electric field generated by nearby lightning discharges. Myers et al. [5] observed a large wind farm in the central plain of the USA, which showed video observation, radiated magnetic field and lightning peak current measurements. The hub height of all wind turbines was 80 m, and the maximum height of blade tip was 125 m. Large lightning currents are usually injected into the unit through the blade, and electric arcs are often induced inside or on the surface of the blade. The blades of modern wind turbines are made of composite materials, such as glass fiber reinforced composites (GFRP) with a huge hollow structure. These composites have poor resistance to high temperature, so the arc causes serious damage to the blades, as shown in Figure 1. According to the statistics of wind farm operation data, the lightning damage rate of wind turbine blades with a capacity of 1.5 MW and above is as high as 11.9 times per 100 sets per year [6]. Therefore, lightning protection for heavy capacity wind turbine blades has become one of the bottleneck problems that need to be solved to improve the operational reliability of wind turbines.
At present, the lightning protection system design for wind turbine blades is mainly based on IEC/TR (the Inclusive Engineering Consortium/Technical Report) 61400-24 [7], which was published by the IEC in 2002. However, the failure rate of the lightning protection system for wind turbines is usually very high when the design of IEC/TR 61400-24 is adopted, and the main reason for this is that IEC/TR 61400-24 gives general and empirical design principles but does not fully consider the mechanism of upward leader generation as well as the upward and downward leaders’ flashover mechanism. Therefore, it is not feasible to give quantitative design terms and specific implementation rules. The typical lightning protection system recommended by IEC/TR 61400-24 for wind turbine generation blades is given in Figure 2. The lightning protection system is usually composed of a lightning receptor inlaid on the surface of the blade and a lower lead wire located in the cavity of the blade. The current lightning protection system has the disadvantage of a high failure rate, but the reason for this is not entirely clear. In recent years, many studies have explored new lightning protection systems for wind turbine blades, but most of these lightning protection systems have been improved on the basis of the recommendation given by IEC/TR 61400-24. Because the mechanism of upward leader generation and the mechanism of upward and downward leader flashover are not fully considered for the general and empirical design principles of IEC/TR 61400-24, lightning protection systems based on it also do not consider the lightning flashover mechanism of the blade, and the efficiency still needs to be tested.
Research on the mechanism of lightning can be traced to the invention of the Franklin lightning rod (in 1760) [8,9]. In recent years, due to the continuous establishment and improvement of high voltage experimental methods, the research on the mechanism of lightning has made wonderful progress. In particular, from the 1960s to the 1970s, high voltage and long air gap discharge experiments have greatly promoted understanding of the phenomenon of lightning [10,11,12,13,14,15,16]. Watanabe [10] experimentally studied the switching surge flashover with long air gap under dry conditions. Under the condition of positive discharge, the flashover voltage of switching surge with a duration of 180 A along a wave front up to 13 m was obtained. Paris [11] made a series of experiments to simulate the switching bursts of different shapes of electrode gap with pulse waves. From the test results, we can draw some important conclusions about the influence of electrode shape on air insulation performance, and we can provide some simple rules for the pre-determination of air insulation performance. These rules are particularly useful for design purposes. Suzuki [12] used a variety of techniques to describe the measurement results of the complete sequence of events from corona streamer to spark transition arc phase which occur in the large rod gap under the action of positive switching pulses. Les [13,14,15,16] studied the long gap discharge test, discharge mechanism and simulation discharge model. The results showed that the experimental study in the laboratory can neither fully reproduce all the gap configurations of the actual high voltage power system nor obtain the gap insulation characteristics under the actual switching overvoltage waveform.
On this basis, at some stage of the lightning process (such as the initiation and development of the upward leader), the real lightning process can be approximated by using the double exponential shock voltage wave discharges generated by a high voltage shock generator [17]. In 2011, a lightning experiment was carried out by the Central Electric Power Research Institute of Japan to investigate the ability of lightning interception in a traditional lightning protection system [18], in which a 3 m long blade tip was used as the trial product. In each case, the standard lightning impulse voltage and the standard operating voltage of the standard operation were applied to the rod electrode, and the discharge of the gap between the rod and the blade was observed. In 2012, Anna et al. [19] studied the blade lightning attachment process using a long air gap between a ball electrode and a flat plate made of a copper wire receptor in the laboratory. In the tests, the inequivalence between standard lightning impulse voltage wave and the electric field near the negative ground flashover with time, and the inequivalence between the electric field distribution around the target and the actual situation in the simulation experiment. At the same time, because the gap between the ball and target was too short, the results of the experiment showed a great difference from the actual situation and thus cannot be used to study the mechanism of lightning attachment. The lightning attachment process of a wind turbine is influenced by the wind speed of the blade surface. In order to investigate the influence of the wind speed on the lightning attachment process of blades, a simulated experiment was designed by Radičević [20,21]. The experiment adopted a 1:33.3 scale wind turbine model (2 MW) and a circular arc electrode to form the discharge gap (the gap distance between the blade tip and the arc electrode was 2 m), and the lightning attachment process was tested by the discharge between the circular arc electrode and blade. In the experiment, the wind turbine model was dragged by the motor, and the blade could rotate at a different angular velocity; thus, the influence of the wind speed on the blade surface on the lightning attachment process could be studied.
A lightning model of wind turbines is generally recommended by IEC/TR 61400-24 (the one-dimensional electrical geometric modelling method). In many cases, the prediction range of the wind turbine calculated by this method is very different from the actual situation. In 2009, Peesapati et al. [22] used the finite element method to calculate the spatial distribution of the electric field around a wind turbine under excitation by a thundercloud and deduced the starting point of the lightning upward leader based on the calculated spatial distribution of the electric field. In 2012, Rodrigues et al. [23], based on a wind turbine with generator, analyzed the transient phenomena occurring due to a direct lightning strike to a blade. Comprehensive simulation results can be provided by using models of the restructured version of the Electro-Magnetic Transients Program (EMTP), and conclusions can be duly drawn. In 2014, Pironnec et al. [24] introduced the lightning probability distribution model of an Airbus A400M to calculate the spatial distribution of the electric field around wind turbine blades under the thundercloud condition. The spatial distribution of the electric field was obtained based on the calculation, and the starting point of the lightning upward leader was also analyzed. Madsen [25] established a mathematical model for calculating the time and space distribution of the electric field around the blade under the excitation of the downward leader, and a 3-D model of the risk assessment for the blade lightning was established. Wen et al. [26] studied the effect of wind turbine rotation on triggering lightning was via the high voltage discharge test method. The analysis showed that the blade rotation could be altering the charge distribution on the blade tip, resulting in varied ascending leader development on the blade tip, which affected the discharge development process. Zhang et al. [27] presented a new electro-geometric model for multiple turbines, and the calculation results showed that the larger the relative air density and the absolute humidity and the lower the altitude, the larger the lightning shielding distance between wind turbines. Zhou et al. [28] studied the lightning attachment process of a full-scale wind turbine blade and downward leader; the results showed that the interception was more effective when the cross-sectional area of the receptor was in accordance with the minimum value of 50 mm2, and the interception effect could not be improved significantly when the number of receptors was increased. Yan et al. [29] investigated the puncture position distribution and the arc path inside the blade chamber based on an arc simulation test, and an impulse voltage was applied to the blade structure. The results reflected that most puncture points are located in the sandwich structure and thinner glass fiber cover. Wang et al. [30] proposed a finite element model, which included the full length of the leader and allowed for the incorporation of various uniform and non-uniform charge density models. The electric fields in the blade due to the lightning stepped leader were studied, and the dielectric breakdown was assessed.
In order to design the lightning protection system of blade, it is necessary to consider the lightning protection system on the aerodynamic performance and aerodynamic noise of blade. If the lightning protection system has good lightning flashover ability but it has great influence on the aerodynamic performance or aerodynamic noise of blades, it is also unqualified. The research on the aerodynamic noise of the airfoil is mainly divided into experimental methods and numerical simulation methods.
In 2002, Tomimatsu et al. [31] studied the physical characteristics of aerodynamic noise generated by a NACA 0018 (National Advisory Committee for Aeronautics) symmetrical airfoil in uniform flow field using flow visualization and Particle Image Velocimetry (PIV) analysis methods. The PIV analysis showed that large eddies periodically generate from the pressure side of the trailing edge and form an asymmetric vortex street at the trailing edge of the airfoil. It was found that the periodicity of shedding vortices was consistent with the frequency of noise generation. In 2008, Munekata et al. [32] studied the influence of airfoil-cylinder interference on aerodynamic noise of the airfoil shedding vortex by an experimental method. The influence of pressure fluctuation on the sound pressure level of the airfoil surface was obtained through the flow visualization and detection experiments of sound source.
At present, a lot of research methods have been based on numerical calculation to predict the aerodynamic noise of an airfoil. In 2006, Kim et al. [33] used large eddy simulation to simulate NACA symmetrical airfoils and studied the non-linear relationship between trailing edge shedding vortices and aerodynamic noise of airfoils. In 2013, Peixun et al. [34] studied the aerodynamic noise of an airfoil by using an acoustic analogy method combined with computational fluid dynamics. Compared with the traditional semi-empirical method, this method has less computational complexity and accurate calculation results. Most importantly, it can calculate the non-linear noise and is easy to use. In the time domain and the frequency domain, the change of sound pressure and the change of sound pressure level with time step are calculated, respectively. The results have been in good agreement with the experiments. In 2015, Chen et al. [35] used numerical methods to optimize the aerodynamic and aero-noise performance of wind turbine airfoils. The results showed that the lift–drag ratio of the optimized airfoil increased near the design working attack of angle, and the overall noise decreased compared with the initial airfoil, which means that the optimized airfoil had better aerodynamic and aero-noise performance. In 2015, Liu et al. [36] used computational fluid dynamics (CFD) and acoustic analogy to simulate the aerodynamic noise of a NACA0018 airfoil and its improved airfoil. The results showed that the hybrid method could predict the aerodynamic noise of an airfoil very well. In 2017, Wang et al. [37] designed a bionic airfoil with a leading edge wave, a sawtooth trailing edge and a surface ridge. The aerodynamic and acoustic performances of NACA 0012 and bionic airfoils were compared using large eddy simulation (LES) and acoustic analogy methods. The results showed that the laminar shedding vortices of the NACA 0012 airfoil could be transformed into regular horseshoe vortices in the wake by the bionic structure, which could reduce the spread correlation of the large-scale vortices and thus suppress the shedding noise around the bionic airfoil. In 2019, Andrew et al. [38] used a numerical simulation method to study the mechanism of airfoil trailing edge noise reduction. The simulation results showed that increasing the edge separation distance of source scattering is one of the mechanisms of noise reduction. In 2019, Yannick et al. [39] developed an engineering noise prediction model. This model can consider both the destructiveness and constructiveness of acoustic interference, and it has many advantages over the Howe model. By using the computational fluid dynamics (CFD) method, the boundary layer parameters required for wave number frequency model could be obtained. The results showed that the aerodynamic noise performance of the sawtooth trailing edge airfoil could be accurately evaluated by the proposed engineering model, but its accuracy depended largely on reliable near-field boundary layer information. In 2019, Jie et al. [40] used improved delayed separation eddy simulation (IDDES) technology and the Ffowcs Williams and Hawkins acoustic simulation method to simulate the instantaneous flow field of vertical axis wind turbine, and they predicted the far field noise. The results showed that this method can be used to design vertical axis wind turbines with less noise and to determine the location of wind turbines with the least noise pollution. In 2019, Li et al. [41] used computational fluid dynamics (CFD) and acoustic analogy to study the influence of the trailing edge thickness of a wind turbine airfoil on the aerodynamic noise of the airfoil. The results showed that the blunt trailing edge airfoil had a higher lift, but the aerodynamic noise of the trailing edge was also large.
From the above, although some scholars have explored and studied new protection systems for wind turbine blades, they have been improved on the basis of the system recommendation given by IEC/TR 61400-24, and the lightning protection effect is general. No author has studied the influence of lightning protection system on the aero-noise performance of wind turbine blades. In this paper, a new type of lightning protection system (NLPS) is proposed. Its structure is similar to that of an aircraft discharge brush and consists of external metal receptors arranged on the trailing edge of the blade. Firstly, a high-voltage discharge experiment and an electrostatic field calculation were carried out to study the lightning protection effect. Then, the effects of the NLPS on aerodynamic and aerodynamic noise characteristics of blades were evaluated by combining computational fluid dynamics (CFD) with acoustic analogy.

2. Methods

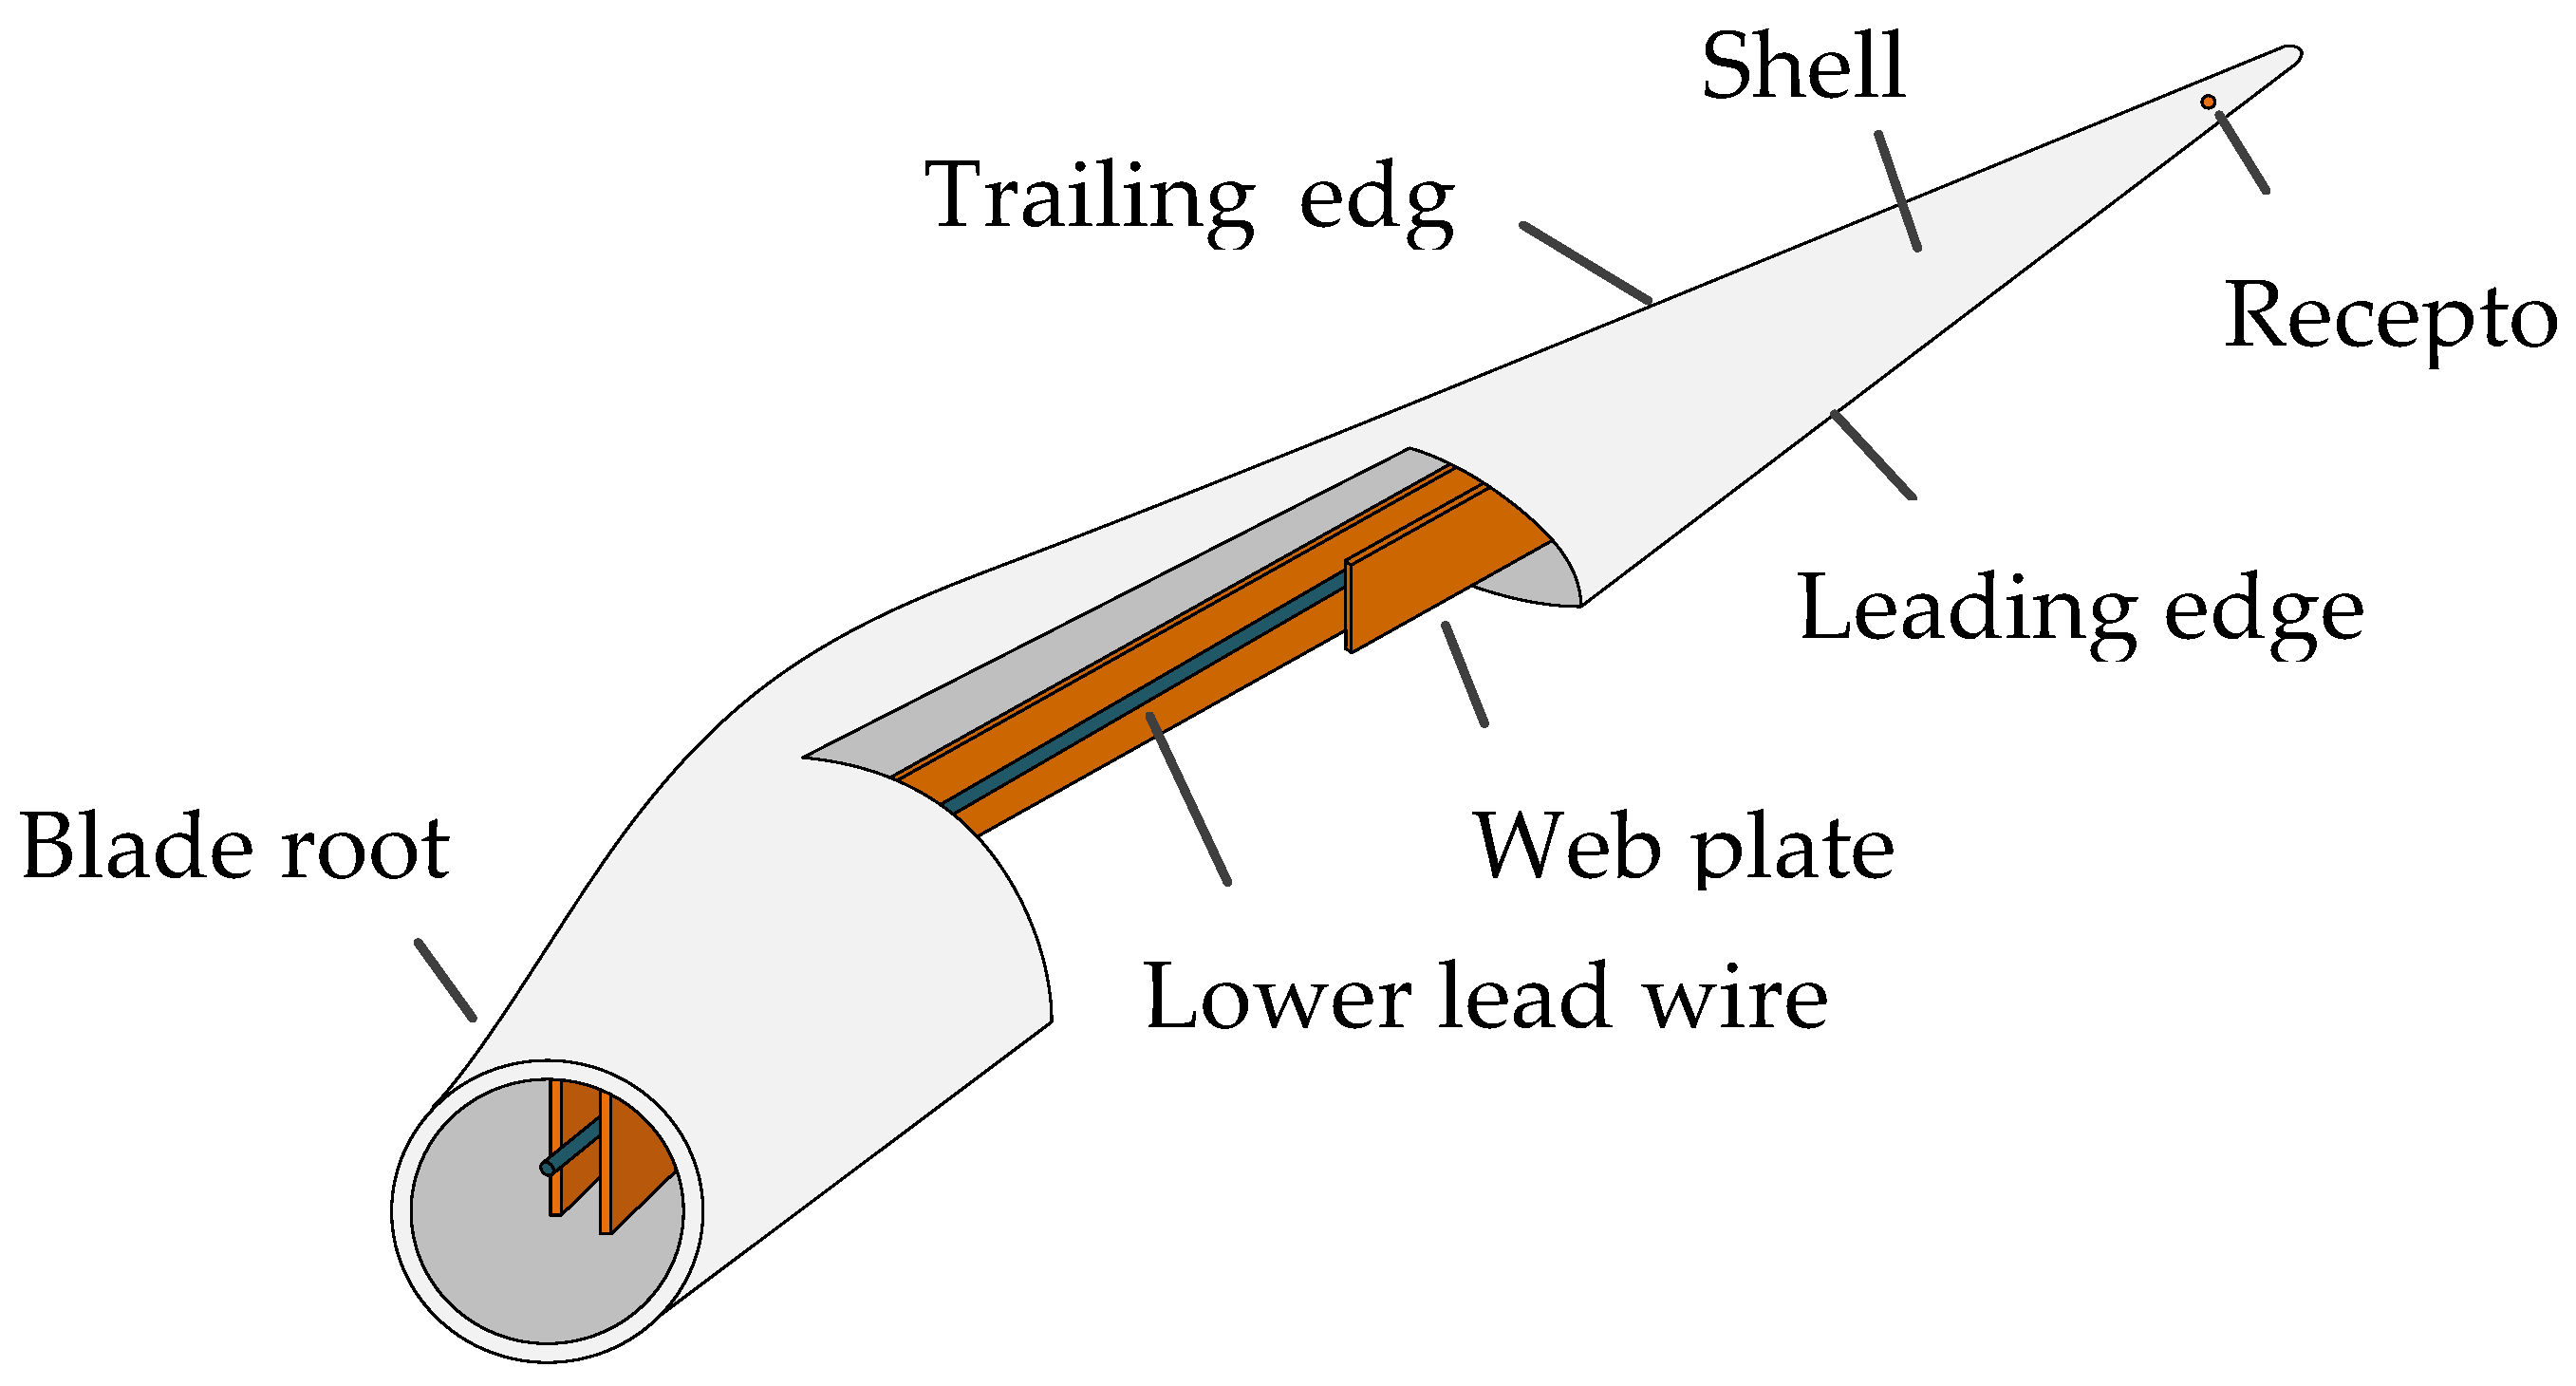
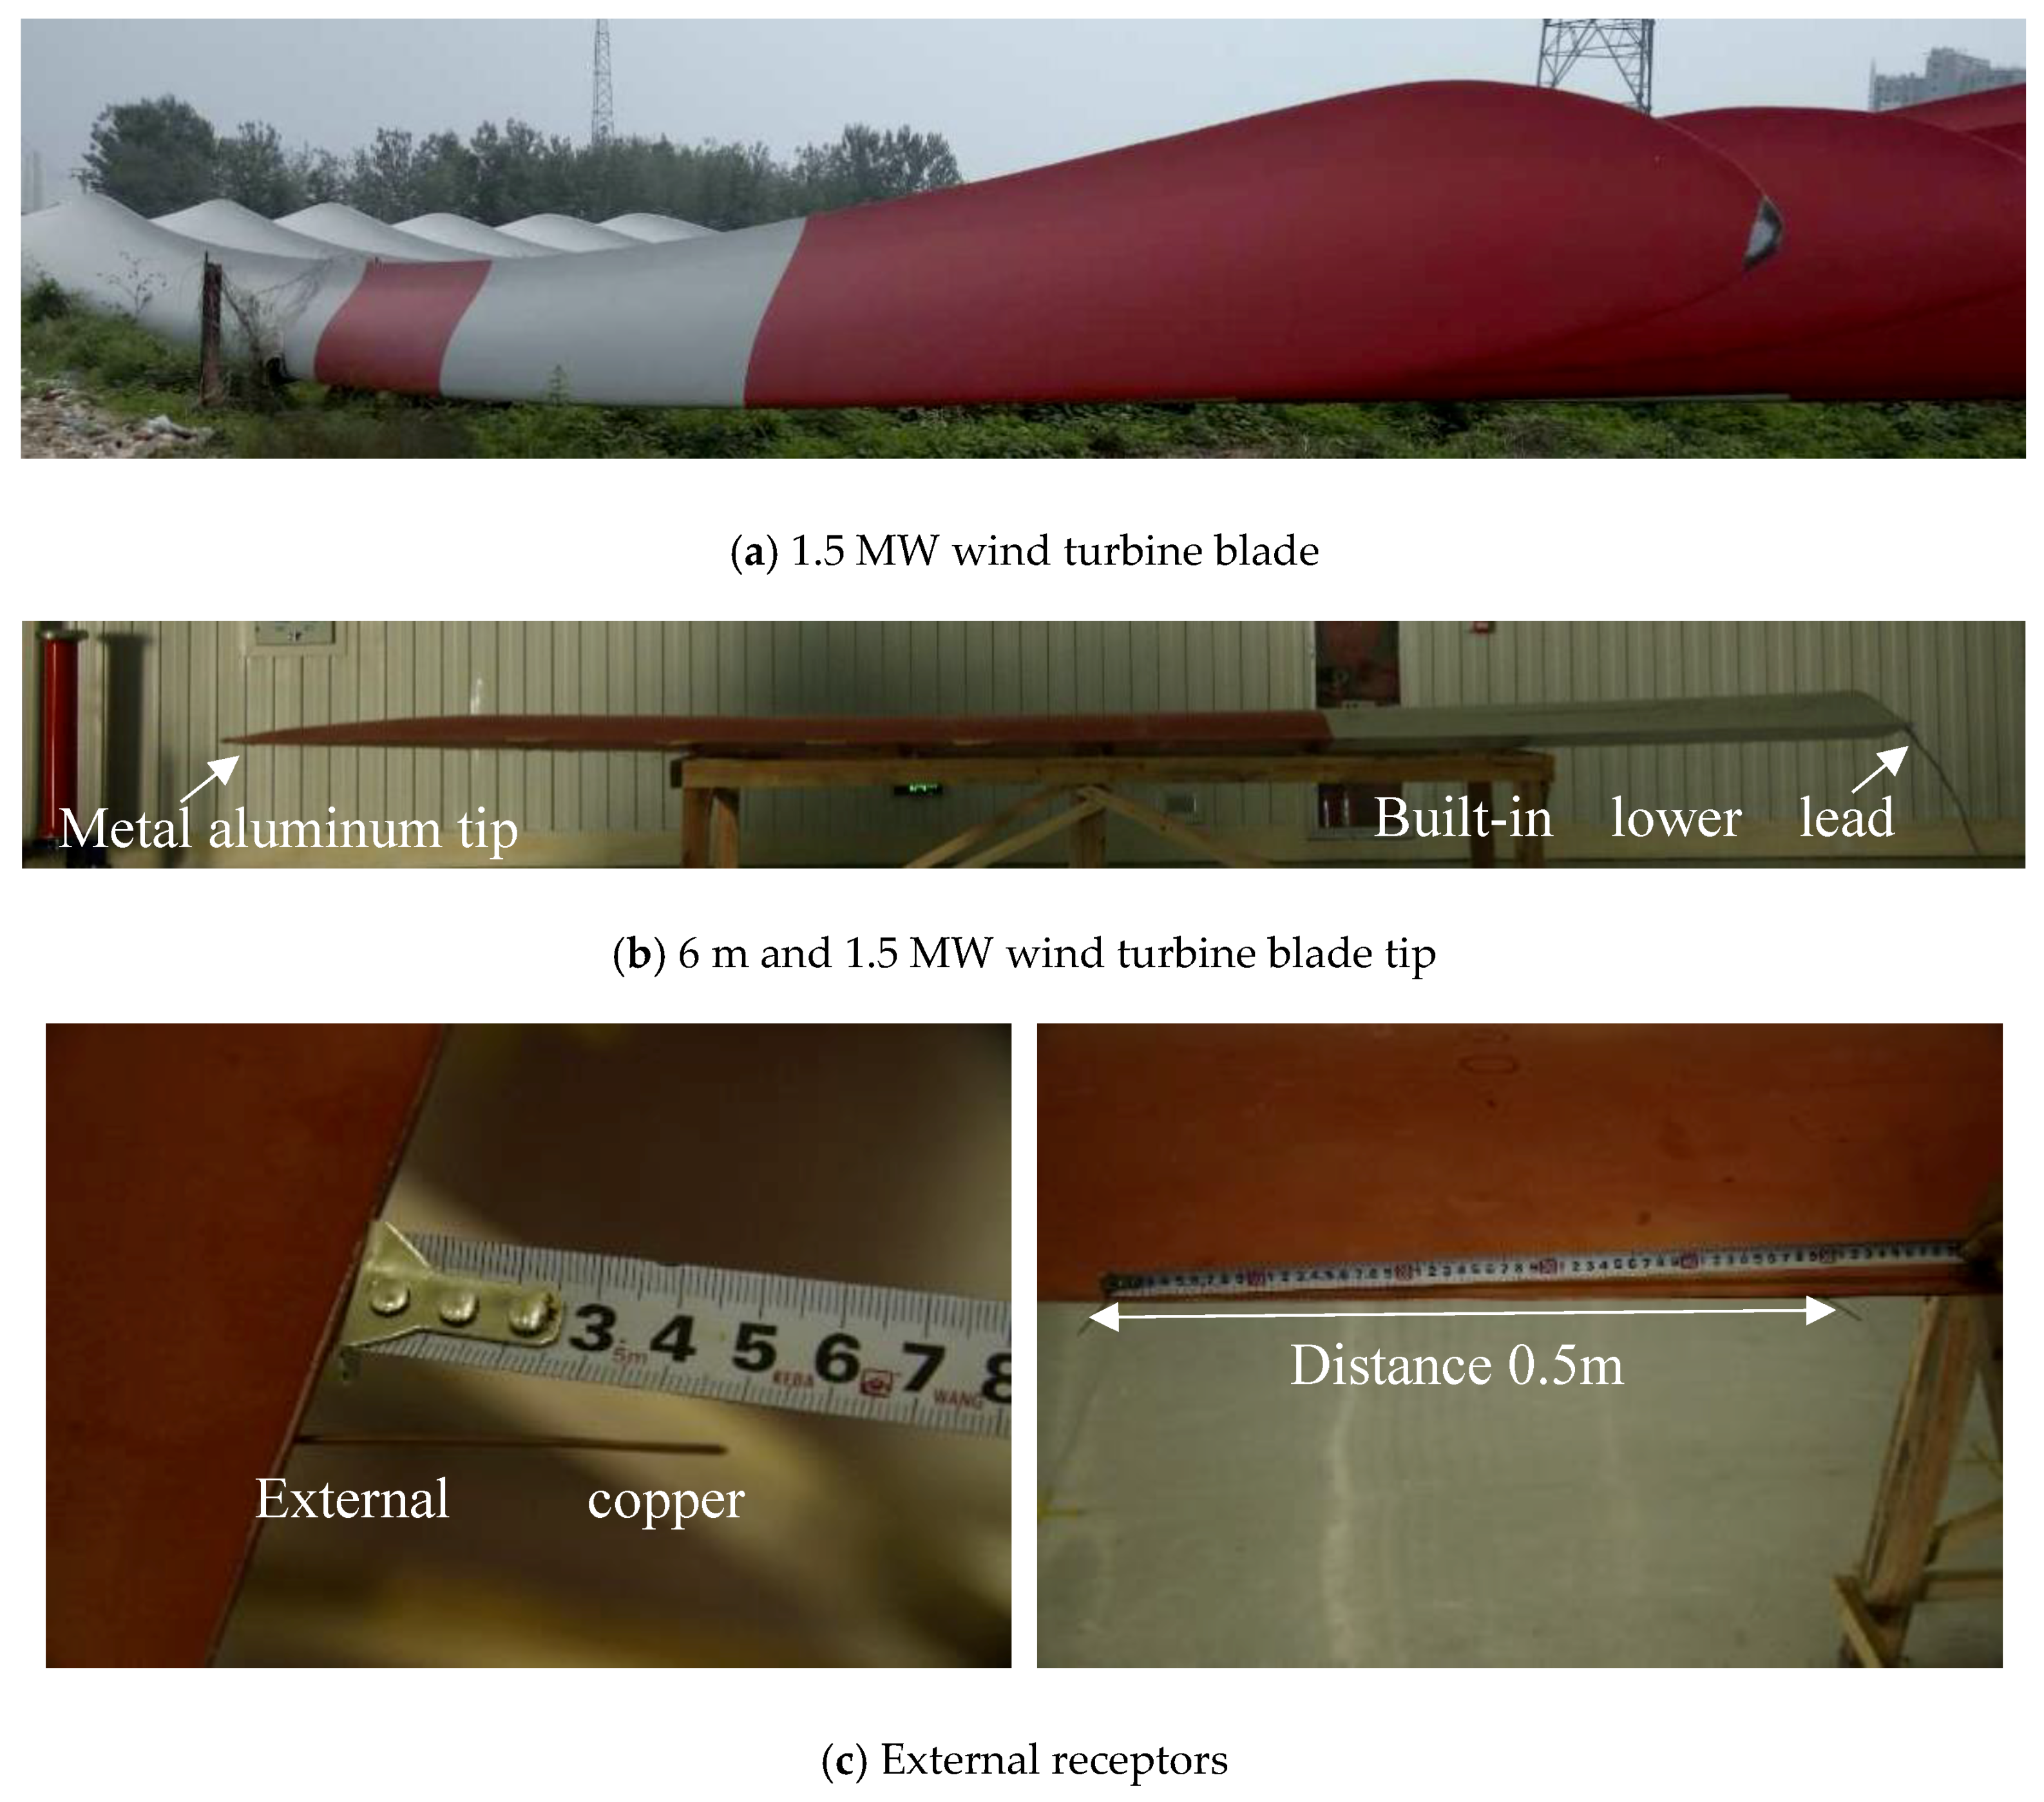
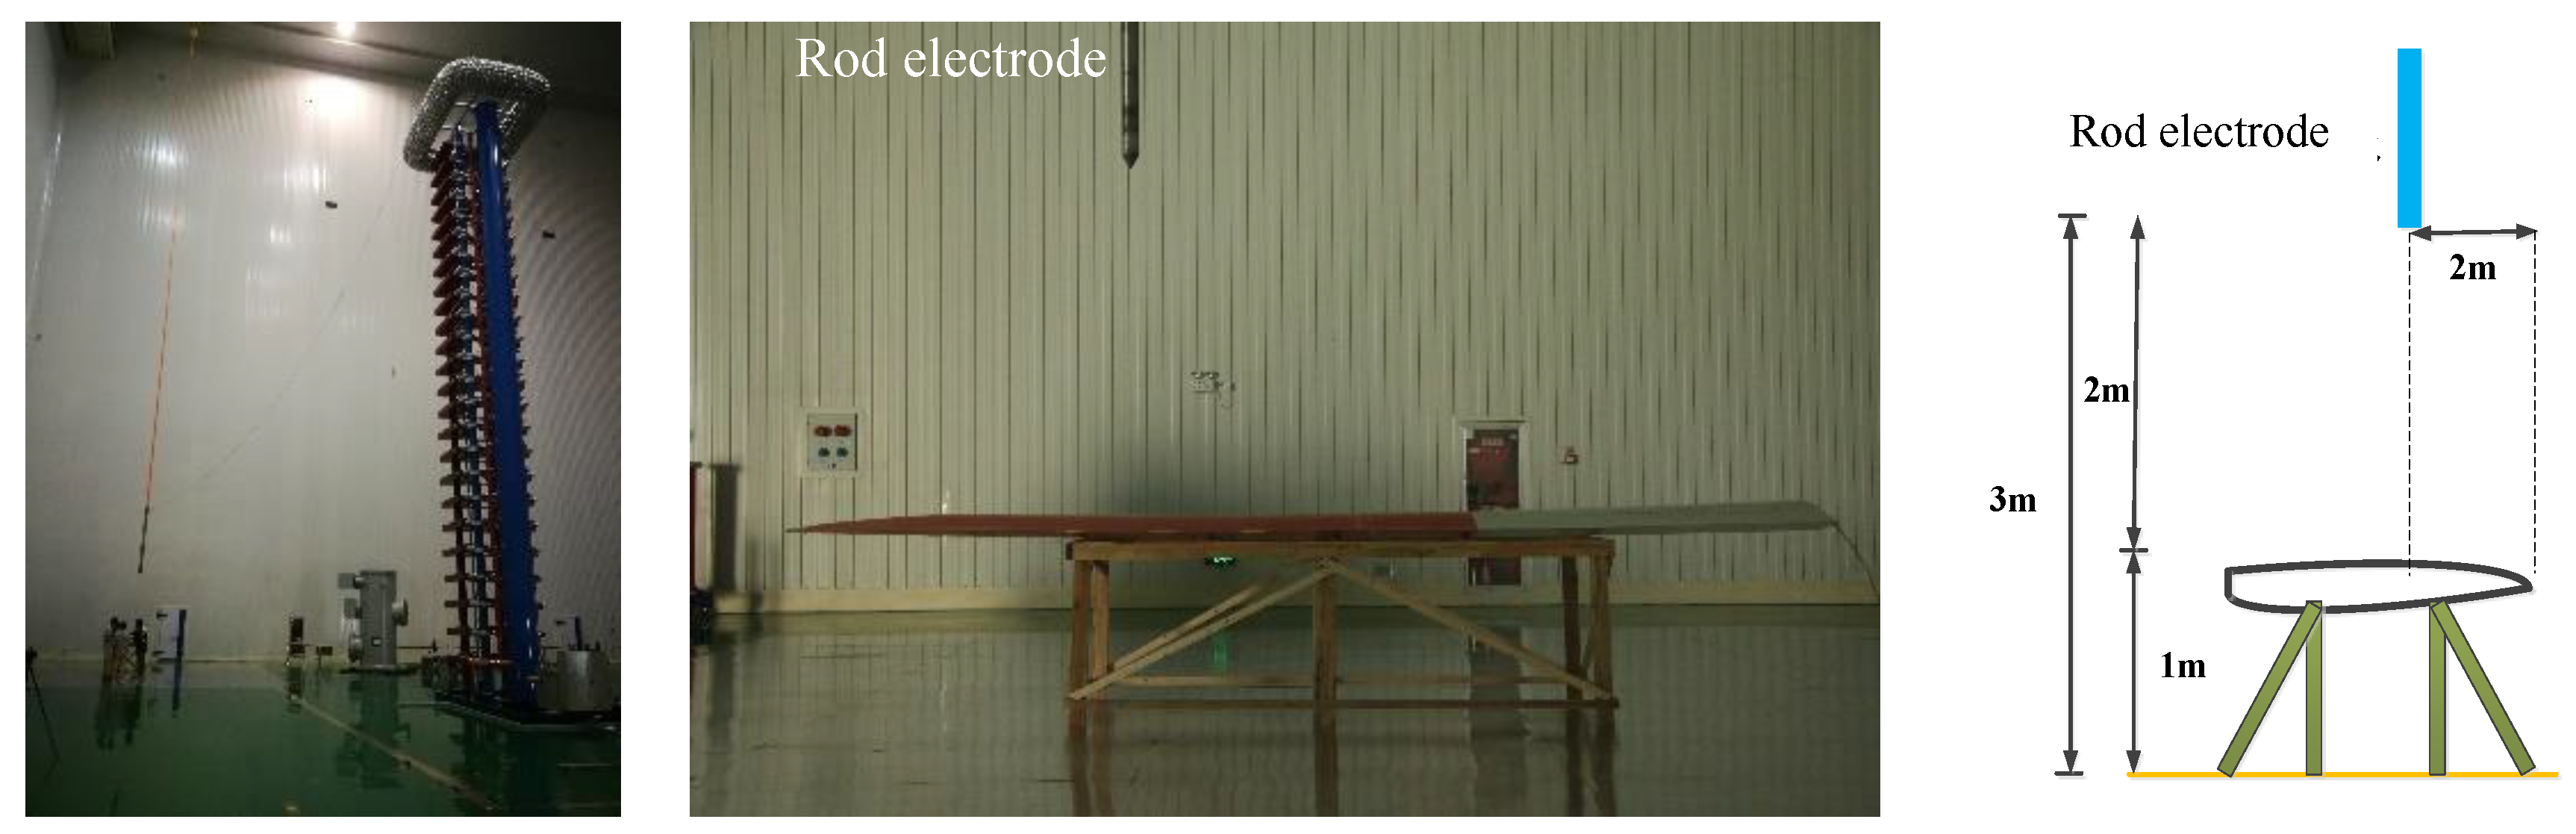
2.1. Experimental Setup

The 6 m length of the wind turbine blade tip was taken as the experimental model, as shown in Figure 3a,b. The experimental model was equipped with a metal aluminum blade tip and built-in lower lead wire. The NLPS consisted of a row of external copper wires evenly arranged at the trailing edge of the blade. One end of the external copper wire was connected to the grounding to ensure zero potential, and the other end extended 5 cm from the tail edge of the blade. The diameter of the external copper wire was 1.5 mm, the spacing between two external copper wires was 0.5 m, and the external copper wires were arranged evenly. When the NLPS was arranged in the experimental scheme, one end of the copper wire was fixed with the lower lead wire, which could be effectively connected to prevent loosening of the connection. The other end of the copper wire exposed the trailing edge of the blade, and the copper wire was bonded to the back of the blade with colloid to prevent loosening. The blade geometry and the arrangement of the NLPS are shown in Figure 3c. The test platform was a high voltage generator, and the experimental device was mainly composed of a high voltage discharge device, rod electrode, and leaf tip model, as shown in Figure 4. The test waveform was a negative standard lightning impulse voltage (1.2/50 μs), the voltage amplitude was 2300 kV, the discharge gap of the rod electrode to ground was 3 m, that to the blade was 2 m, and a high frequency camera was placed in the square and side of the blade.

2.2. Numerical Method

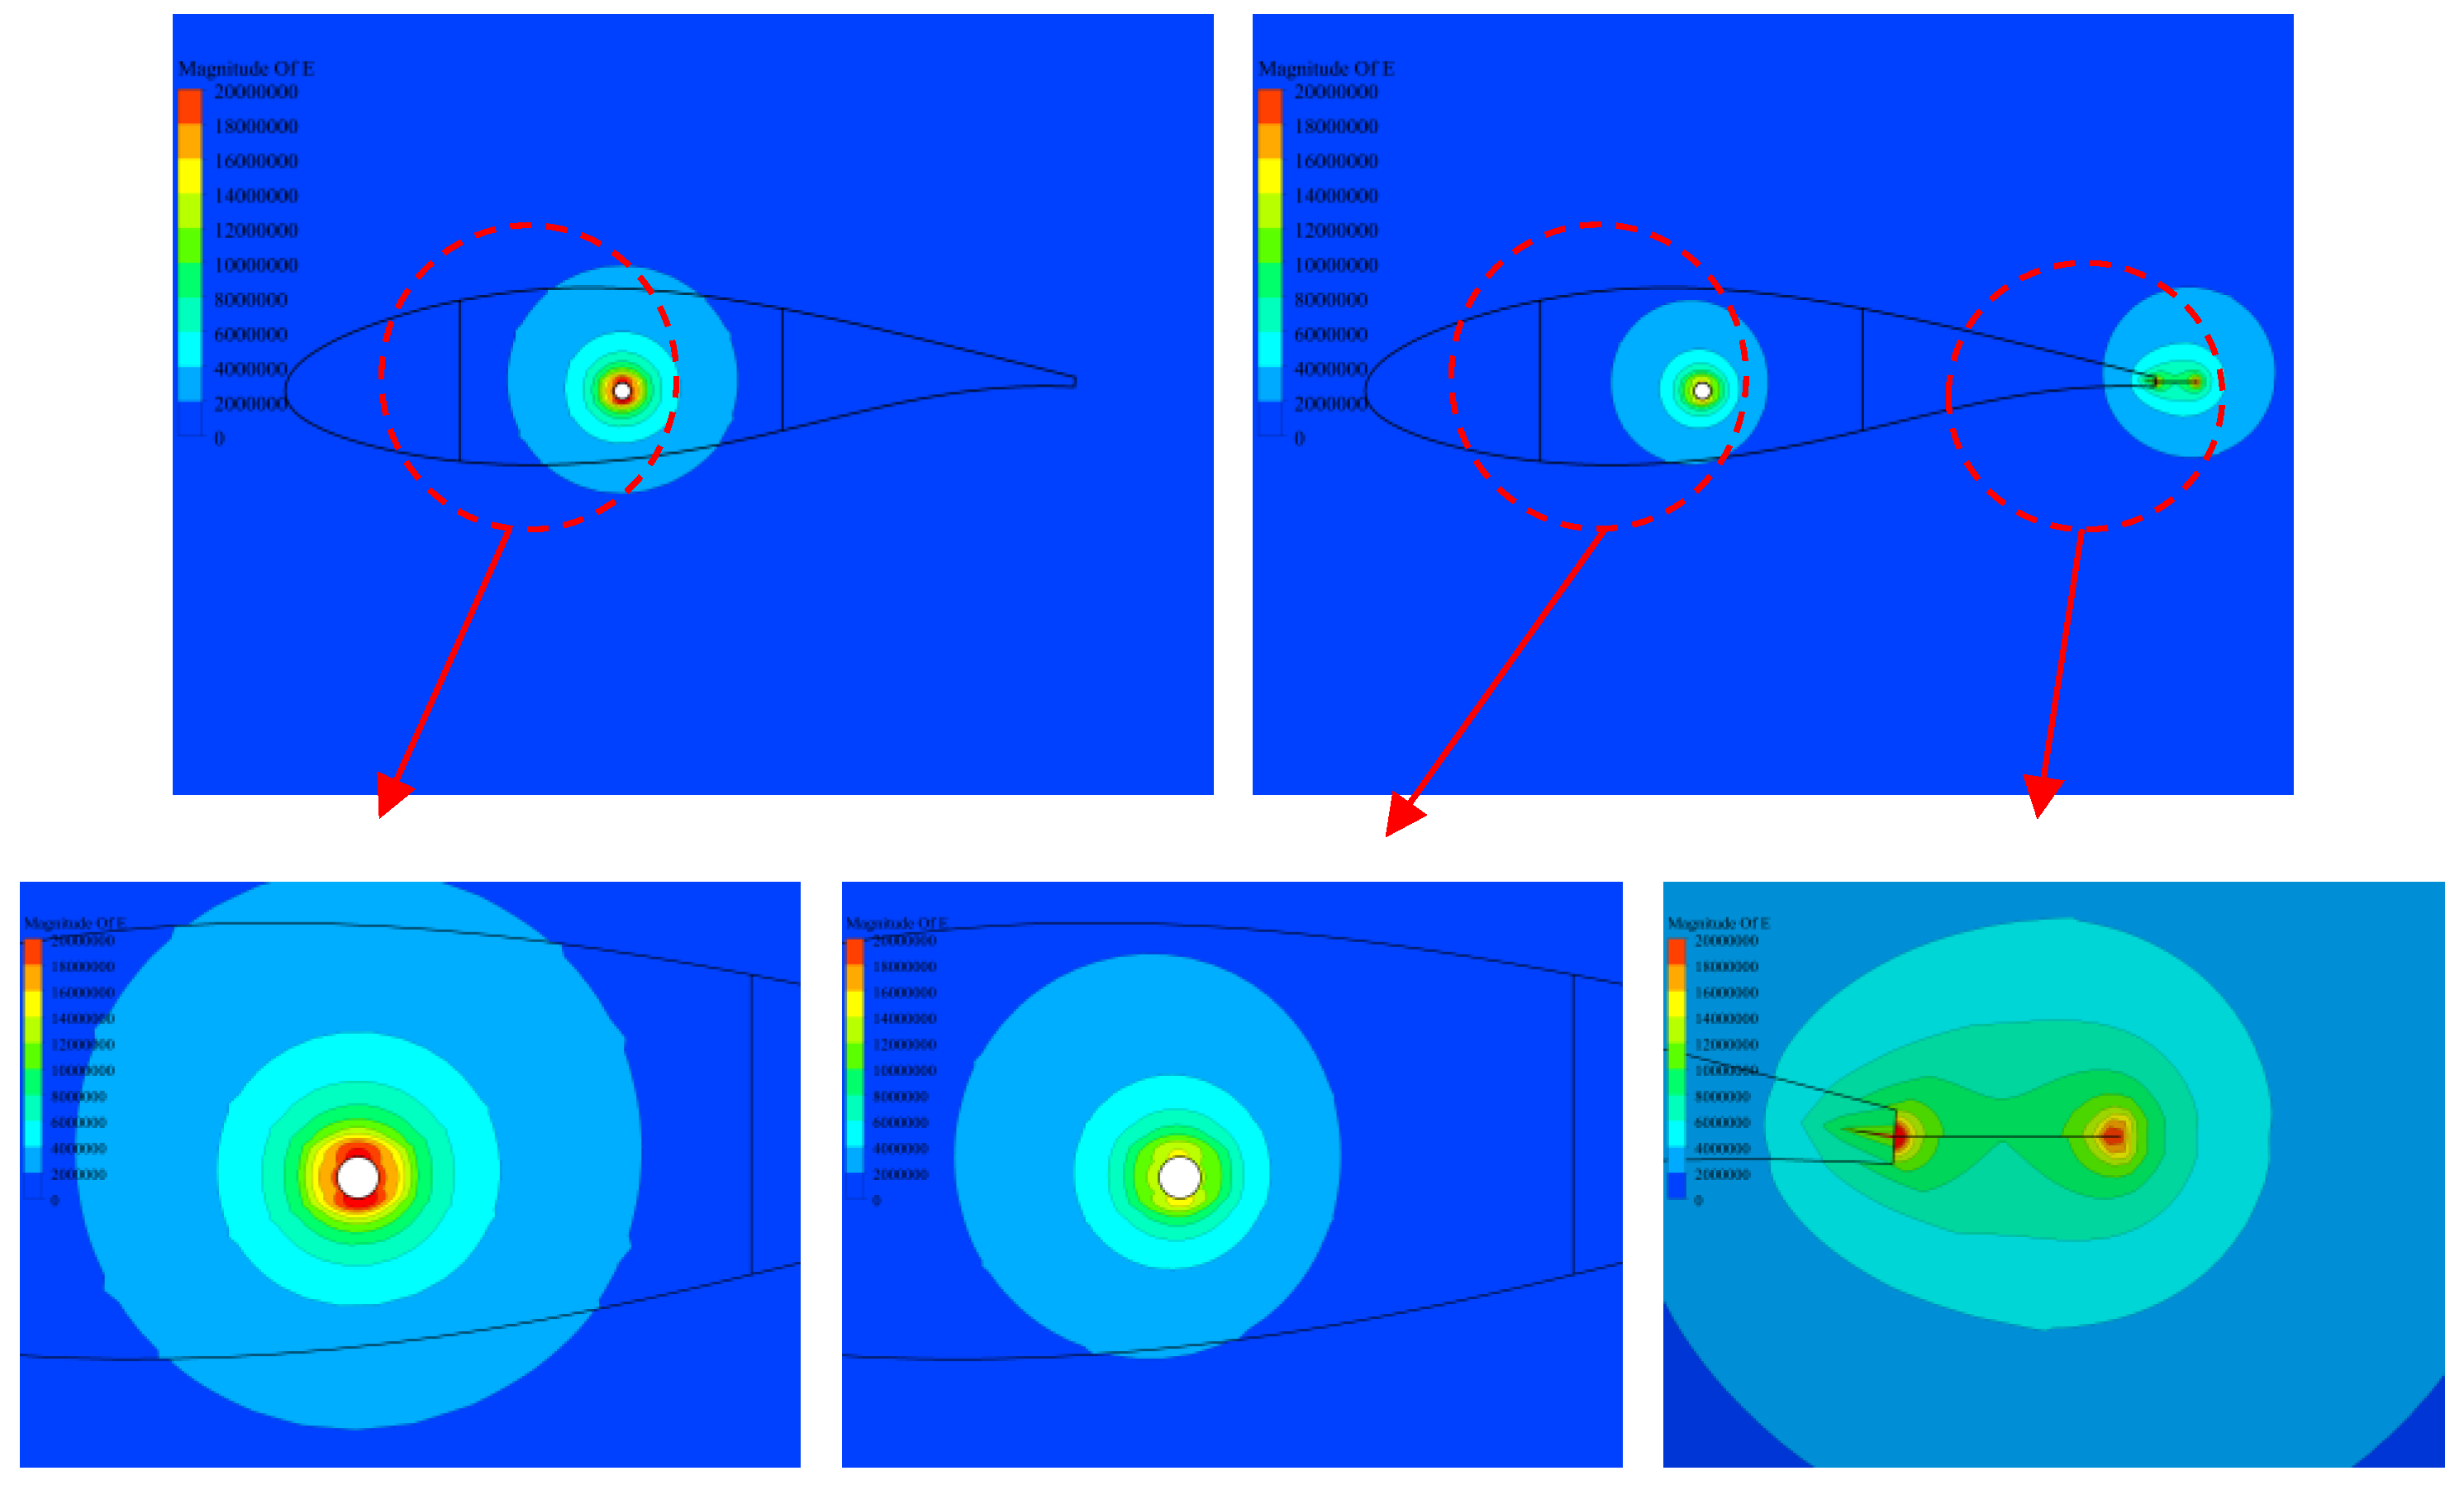
2.2.1. Numerical Method for Electromagnetic Field

The downward leader can be regarded as a high voltage electrode, and the calculation of the electrostatic field can be obtained by the Maxwell equation. According to the Maxwell equation, the differential form of the electrostatic field equation can be deduced, considering that the source and field do not change with time [42]:
{ × E = 0 · D = ρ
where E is the electric field intensity, D is the magnetic field intensity, and ρ is the charge volume density.
In Equation (1), the equation × E = 0 is a scalar electric potential gradient.
E = φ
where φ is the potential function of the electrostatic field.
The Poisson equation can be obtained from Equations (1) and (2):
2 φ = ρ ε
The ε is the dielectric constant.

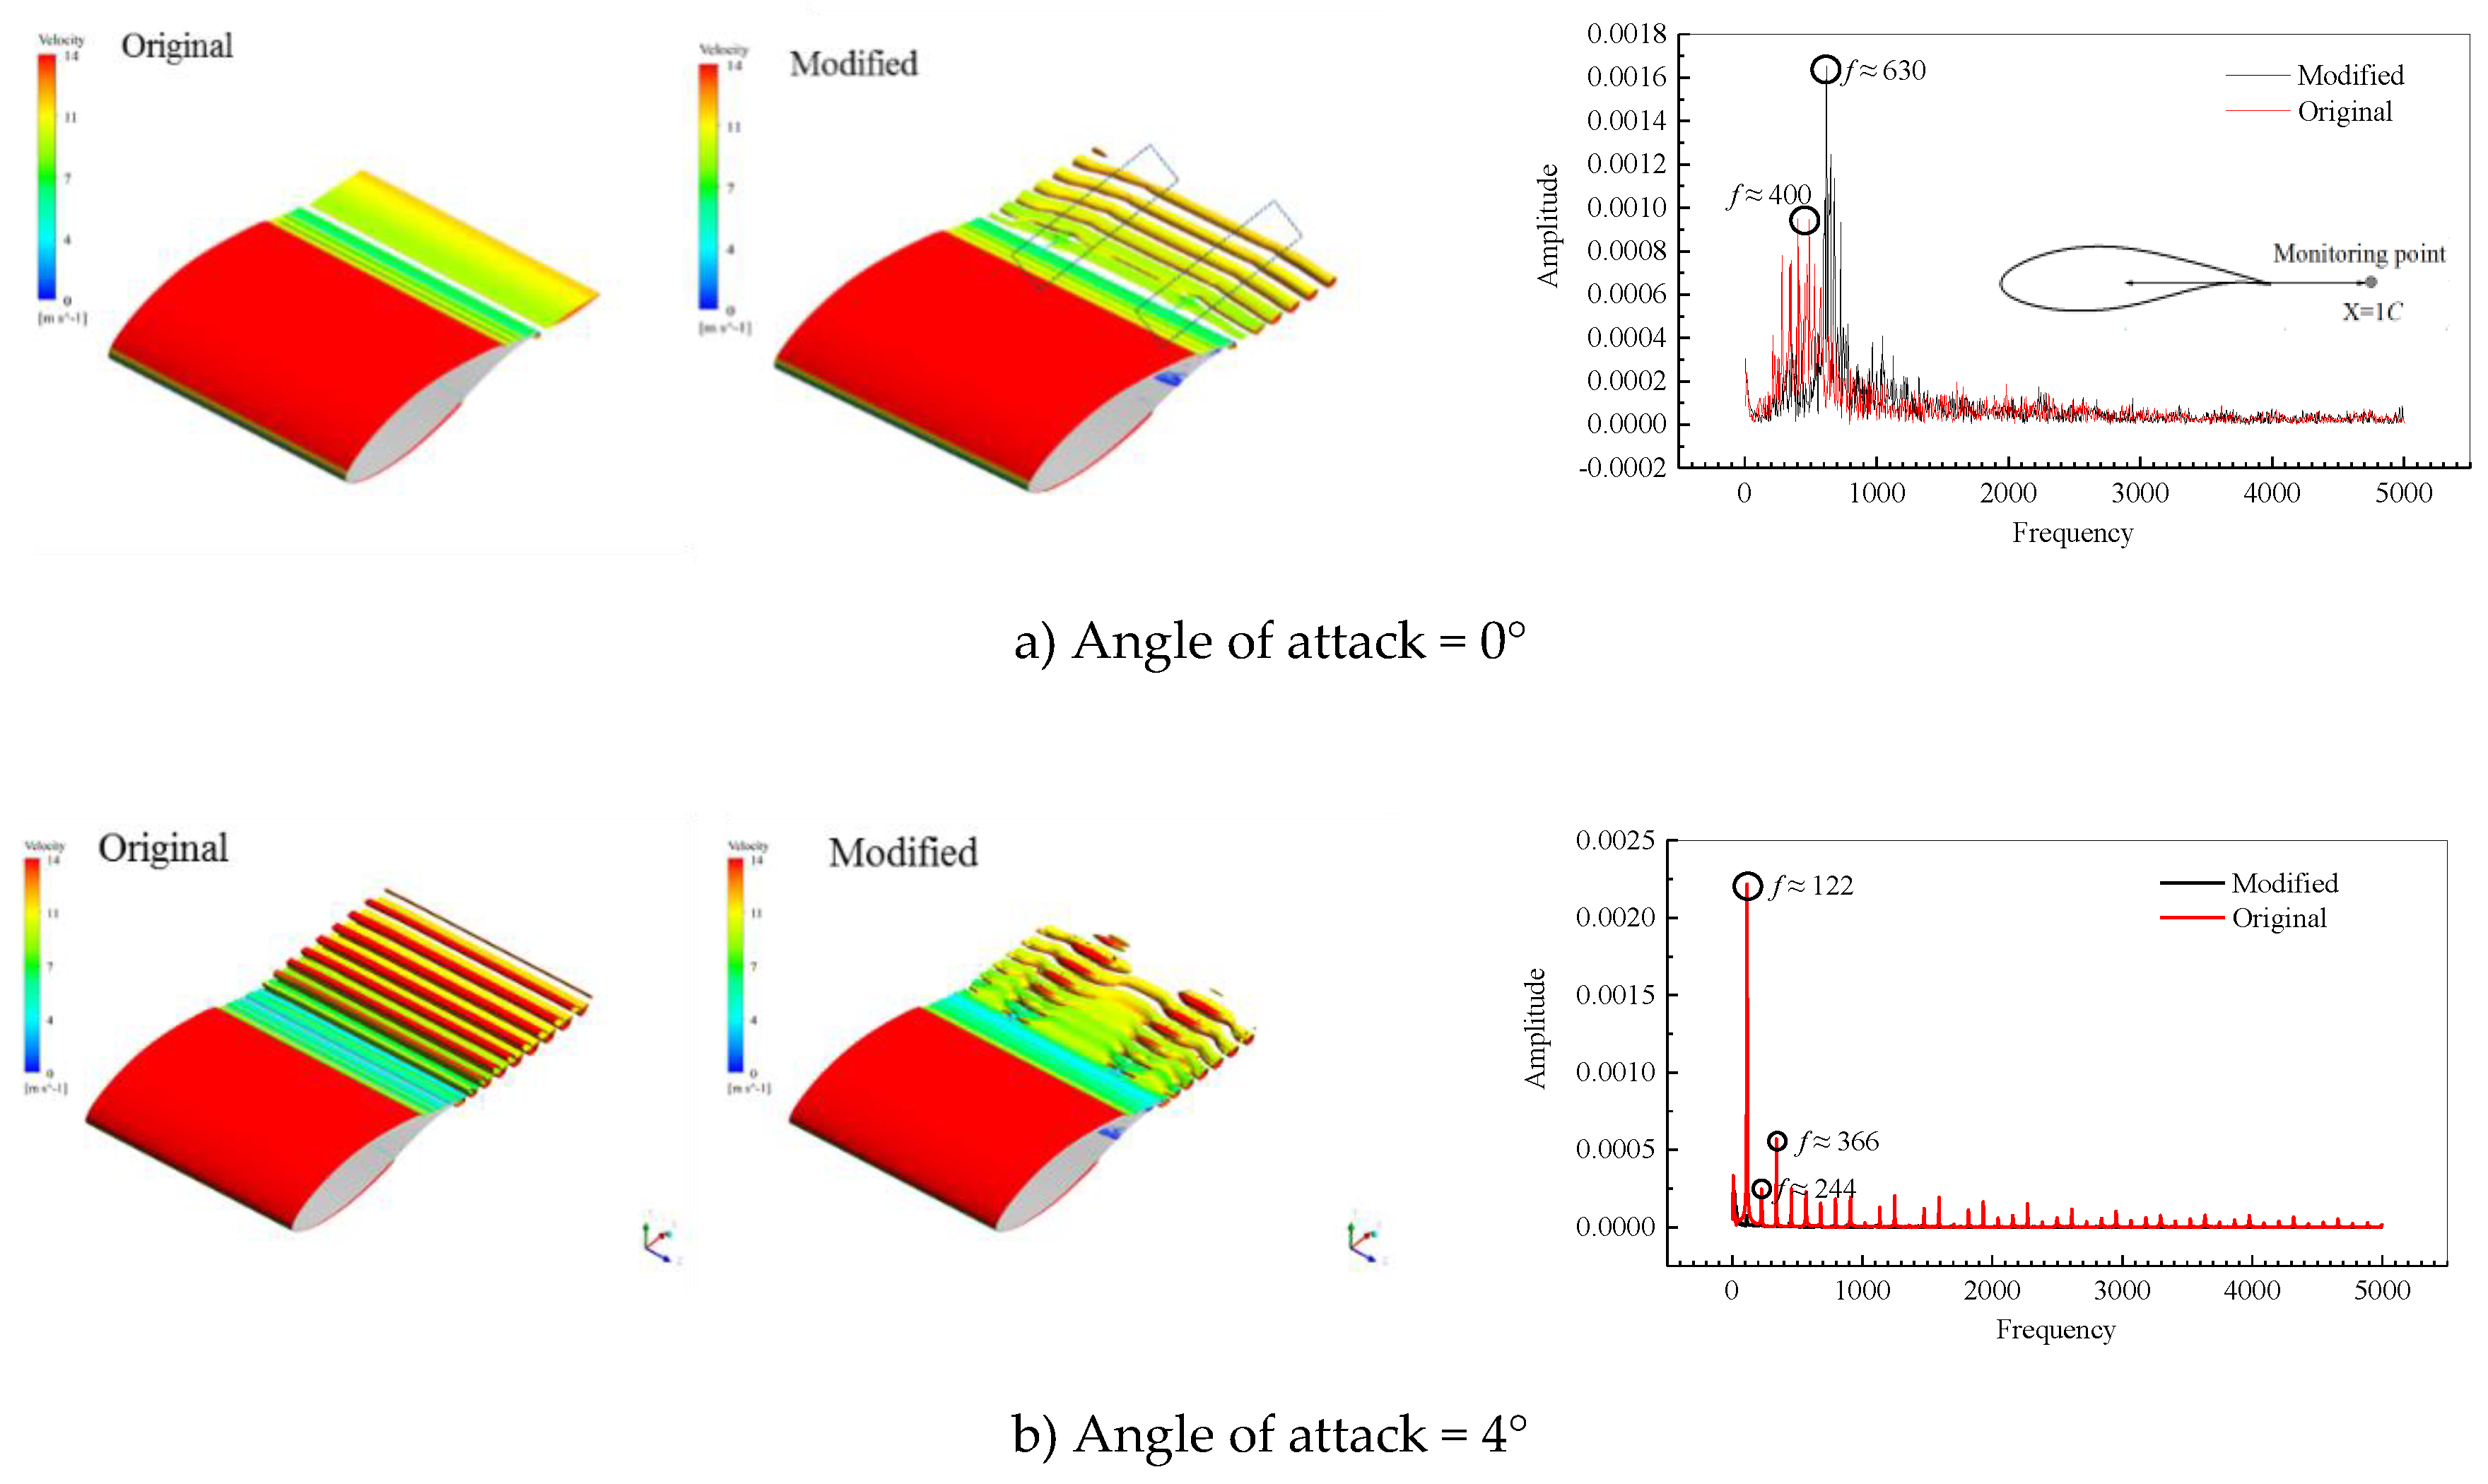
2.2.2. Numerical Method for Aero-Noise Calculation

In this paper, computational fluid dynamics (CFD) and acoustic analogy were used to evaluate the effect of the NLPS on aerodynamic noise of airfoils. A detached eddy simulation (DES) was used to calculate the flow field, and the noise prediction was performed using the Ffowcs Williams–Hawkings (FW–H) equation.
The detached eddy simulation (DES) method is a hybrid simulation method of Reynolds average Navier–Stokes (RANS)/large eddy simulation (LES) [41].
The basic form of DES is as follows:
D v ˜ D t = c b 1 S ˜ v ˜ + 1 σ [ ( ( v + v ˜ ) v ˜ ) + c b 2 ( v ˜ ) 2 ] c w 1 f w [ v ˜ d ] 2
where d is the length scale, and the relationship between variable v ˜ , turbulent viscous v t is given by the following formula:
v t = v ˜ f v 1
f v 1 = χ 3 χ 3 + c v 1 3
χ v ˜ v
where v is fluid viscous and the generating term S ˜ is:
S ˜ f v 3 S + v ˜ κ 2 d w 2 f v 2
where:
f v 2 = [ 1 + χ c v 2 ] 3 ,   f v 3 = ( 1 + χ f v 1 ) ( 1 f v 2 ) χ ,   f w = g [ 1 + c w 3 6 g 6 + c w 3 6 ] ,   g = r + c w 2 ( r 6 r ) ,   r v ˜ S ˜ κ 2 d w 2
The values of the constant terms are:
κ =   0.41 ,   σ =   2 / 3 ,   c b 1 = 0 . 1355 ,   c b 2 = 0 . 622 ,   c w 1 c b 1 κ 2 + 1 + c b 2 σ ,   c w 2 = 0 . 3 ,   c w 3 = 2 ,   c v 1 = 7 . 1

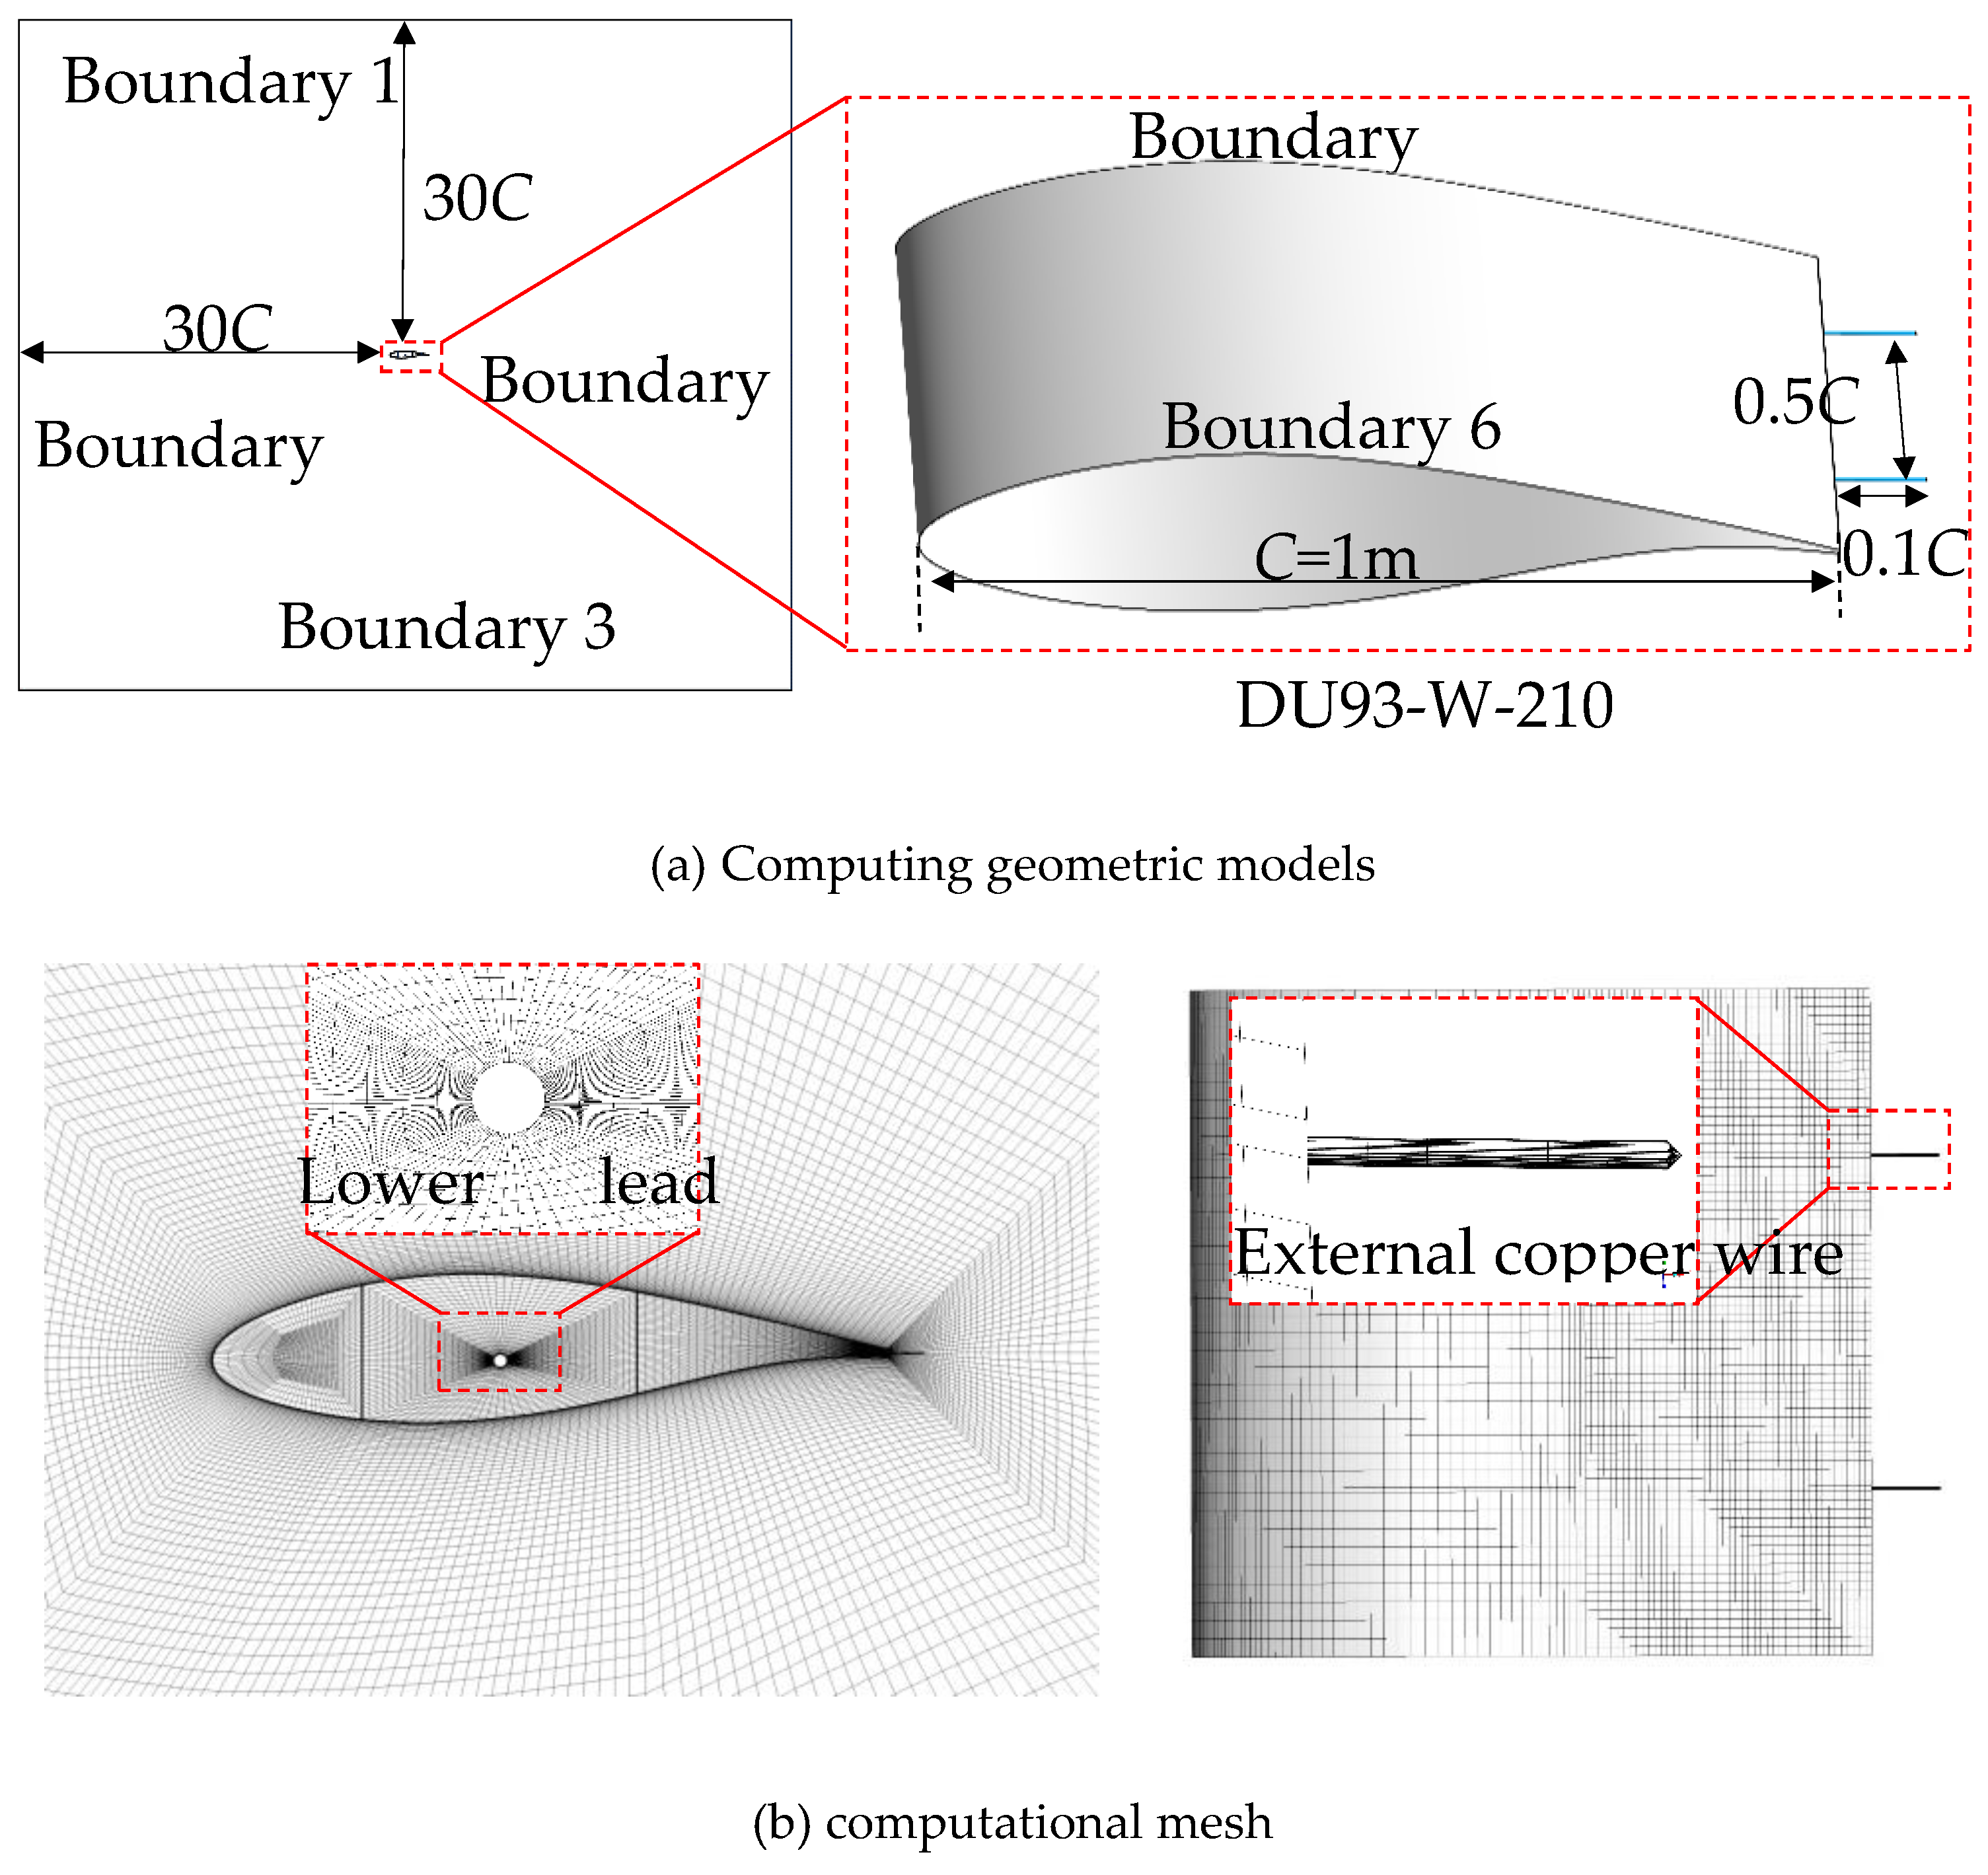
2.2.3. Numerical Setup

The spatial electric field distribution can be obtained by solving Equation (3). The magnetohydrodynamics (MHD) module in fluent can provide the calculation method of electrostatic field, and the whole field potential and electric field distribution can be obtained by solving the Poisson equation. The airfoil of the simulation was DU93-W-210. The geometric parameters and spacing of the NLPS were the same as those of the experimental model, and the airfoil geometry is shown in Figure 5. The mesh was generated using ICEM software, and the total number of mesh elements was approximately 4,600,000. Unlike the flow field calculation, the electric field calculation also needed to be meshed in the airfoil, and there was a lower lead wire in the airfoil. The boundaries were 30C from the center of the airfoil, and the chord length of the airfoil was 1 m. The voltage amplitude of boundary 1 was set as −4 MV; the voltage amplitude of boundary 3 was set as 0 V; the boundaries 2 and 4 were set to infinite far field boundary; and boundaries 5 and 6 were set to symmetrical boundary. The voltage amplitude of the external copper wire receptors and lower lead wire was 0 V, and the blade surface was set as insulators. The calculation of electric field was steady, and the calculation residual decreased to 10−4, the calculation convergent.
The aerodynamic and aero-noise calculation was based on the Fluent solver, the turbulence calculation method used DES, and the bottom layer of the boundary layer adopted the Spalart–Allmaras (S–A) turbulence model. The time step of aero-noise calculation was 1 × 10⁻⁴ s, and each physical time step iterated 20 times, guaranteeing that the residual error of each physical time step decreased by three orders of magnitude. In the calculation of sound field, 8000 physical time steps were first calculated, and a stable flow field was obtained. Then, 4000 steps were calculated, and the last 4000 steps were averaged in time.
Aerodynamic calculation and electrostatic field calculation adopted the same geometric model and the same set of grids (Figure 5). But the electrostatic field calculation and the flow field calculation were not carried out at the same time. First, the electrostatic field calculation was carried out, and then the aerodynamic calculation was carried out. In the aerodynamic calculation, the interior of airfoil was not involved in calculation. The boundaries 2 and 3 were set as the velocity inlet, 1 and 4 were set as pressure outlet, and 5 and 6 were set as symmetrical boundary. The blade surface and the external copper wire receptors were set as a nonslip wall. The calculated angle of attack (AOAs) were 0°, 4°, 8°, 11°, 15°, and 19°. The inflow velocity was 14.53 m/s and the Reynolds number was 1 × 10⁶ based on the chord length of the airfoil.

3. Results and analysis

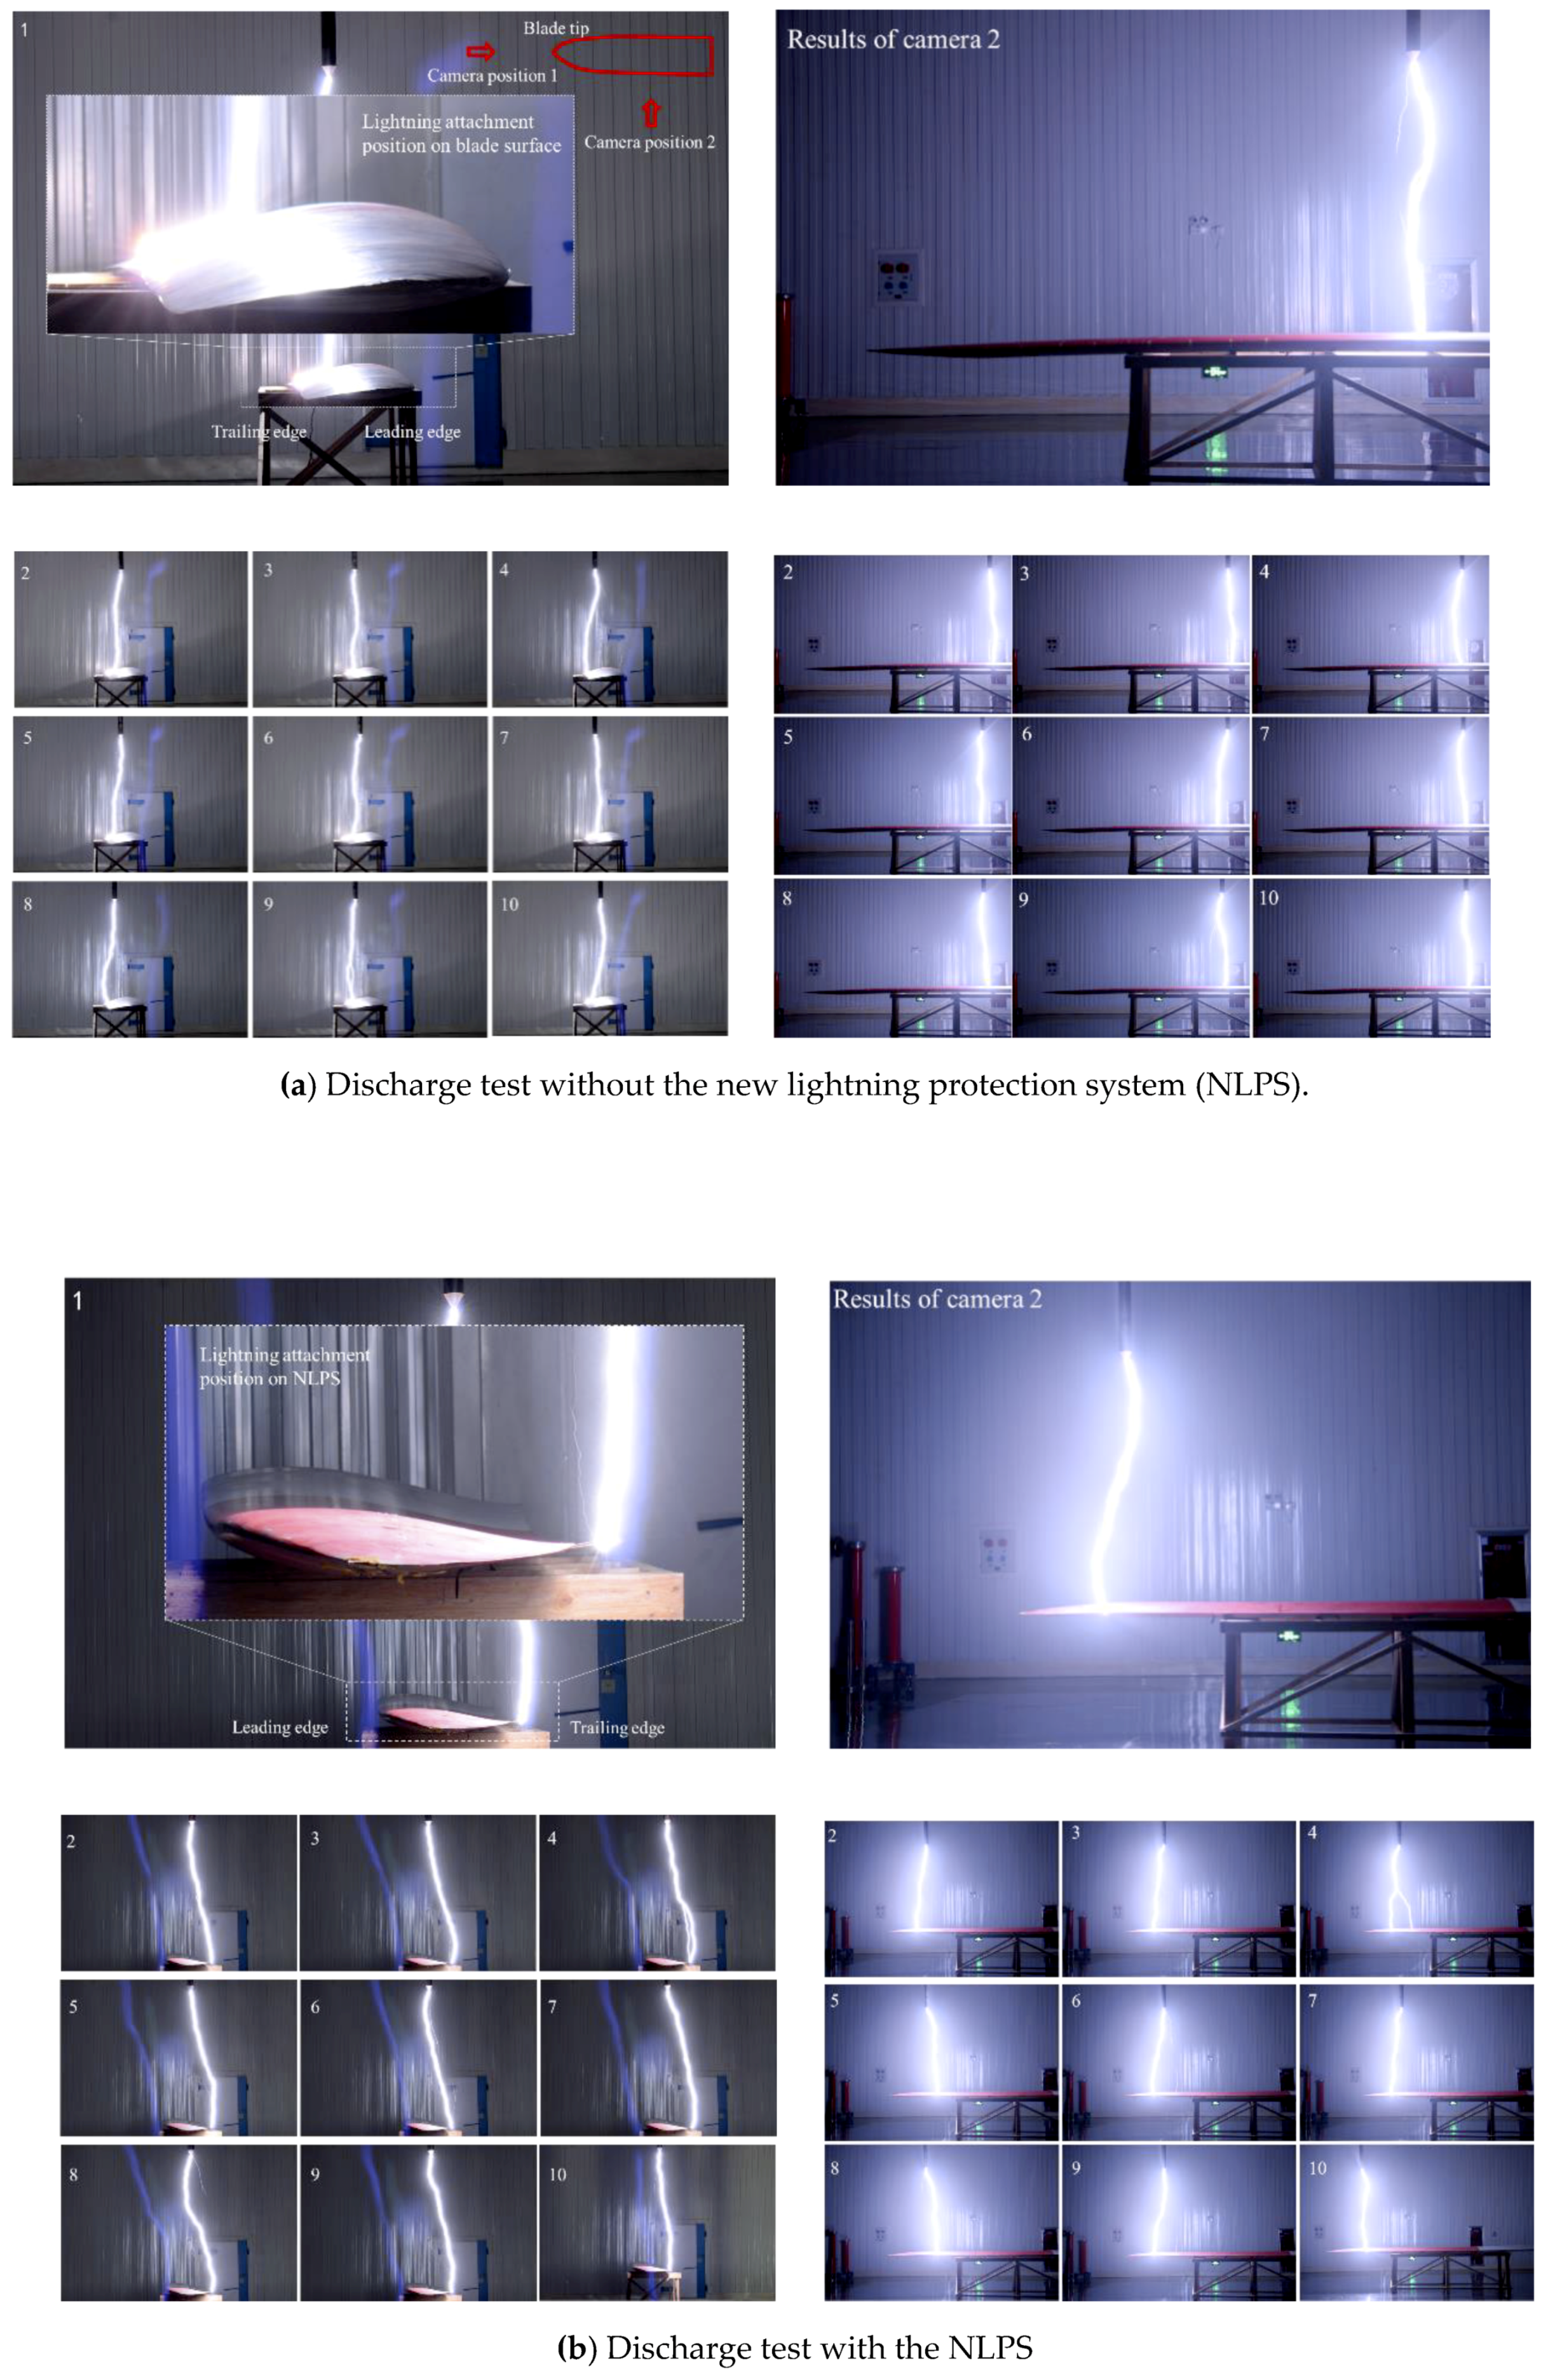
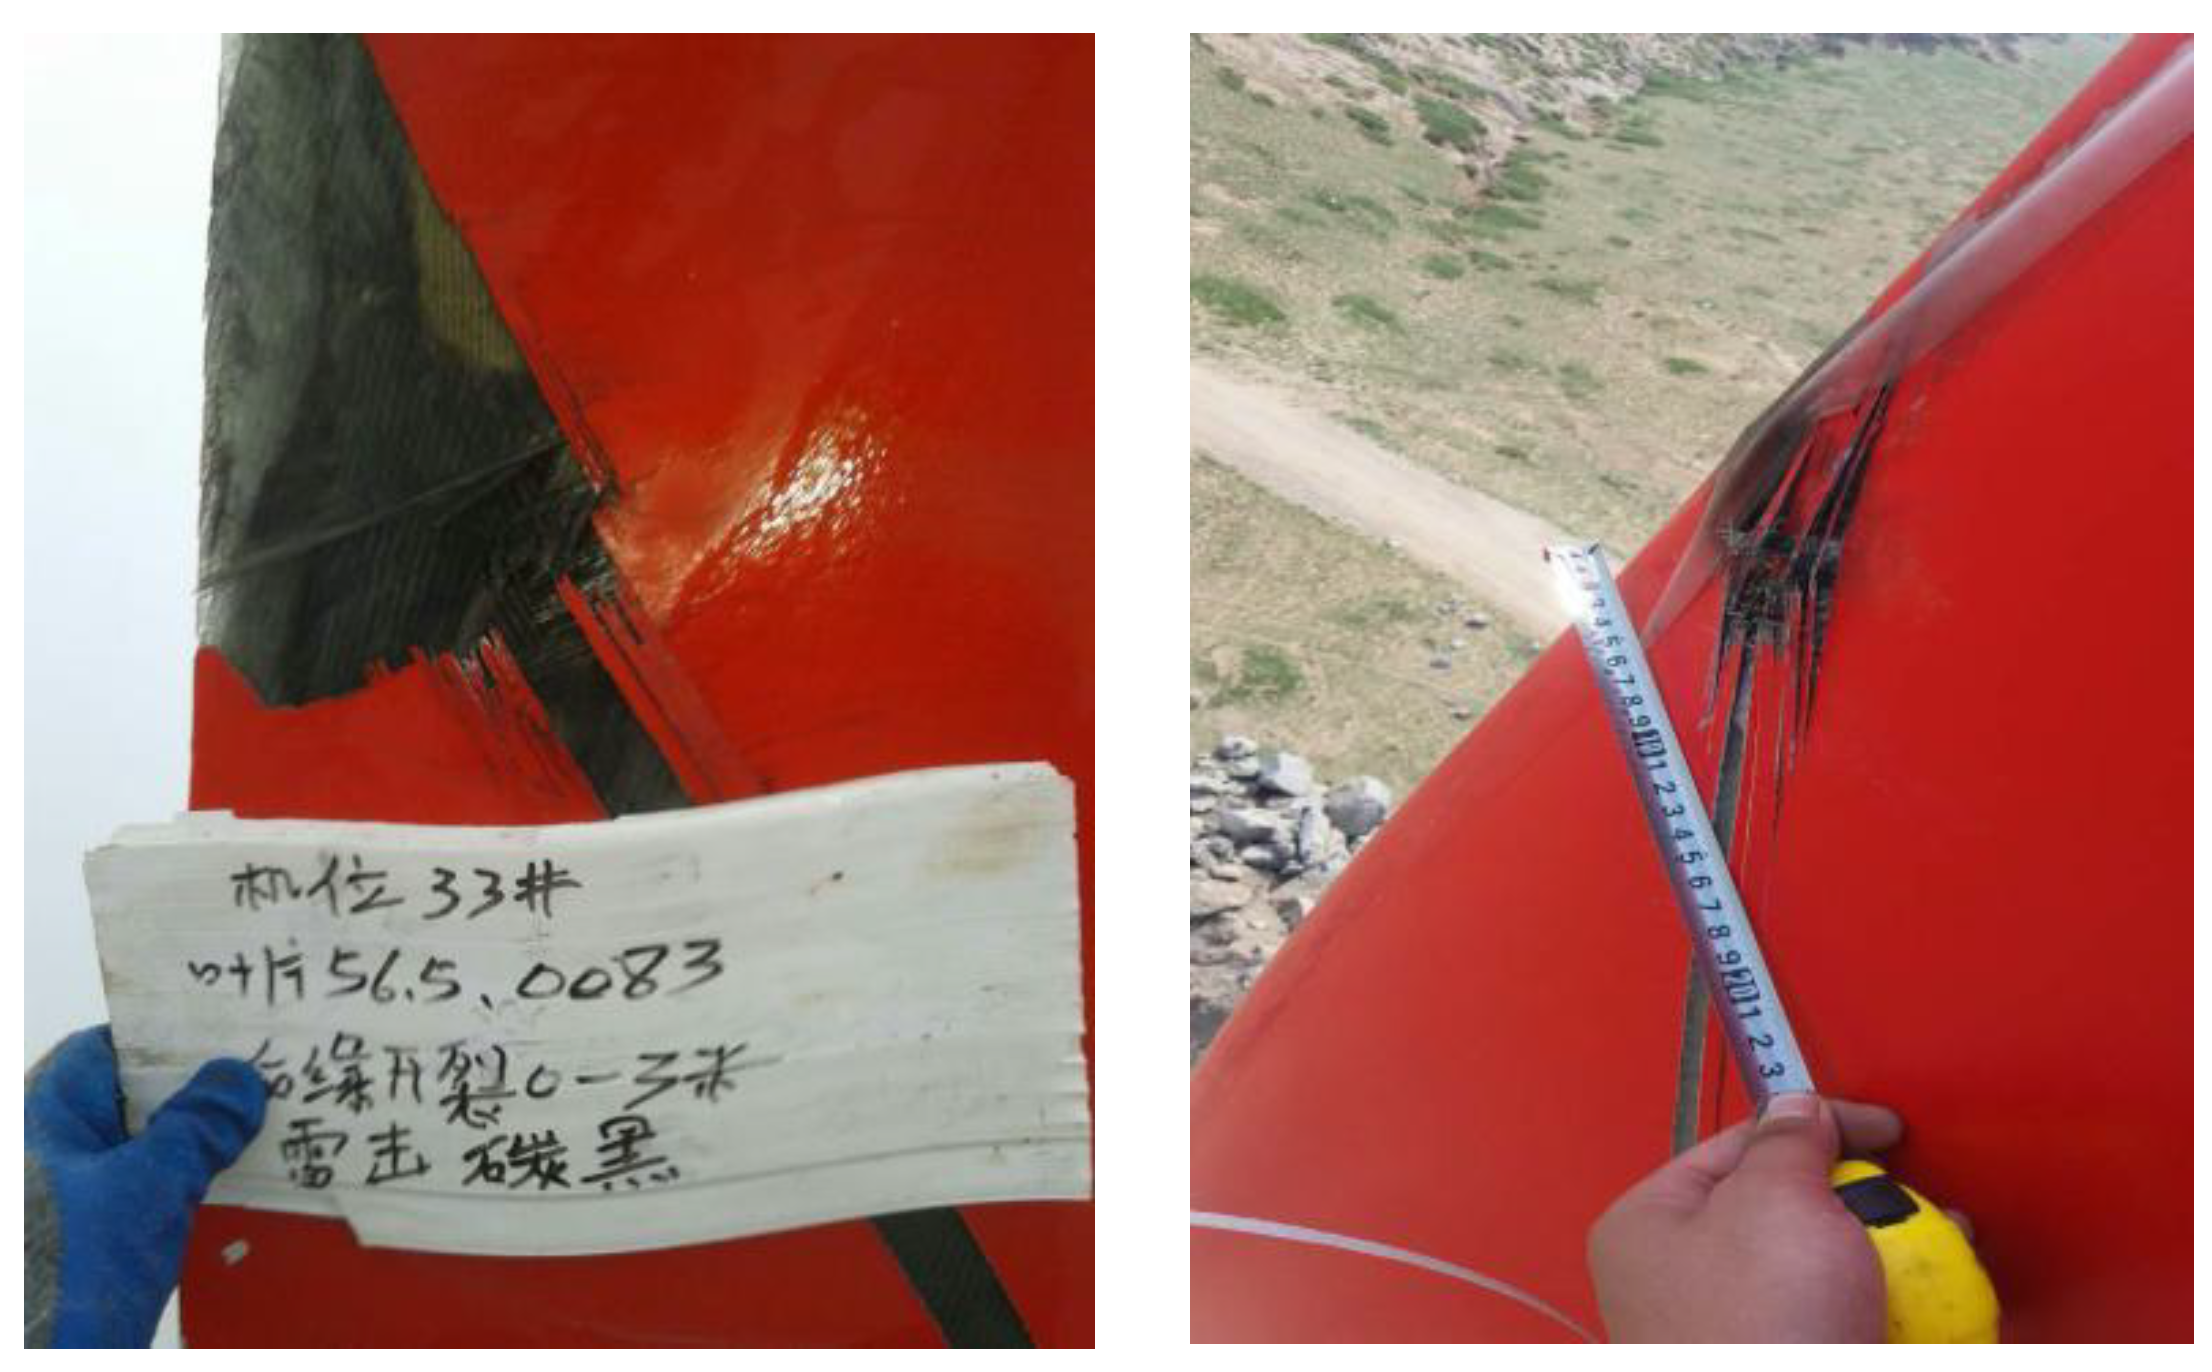
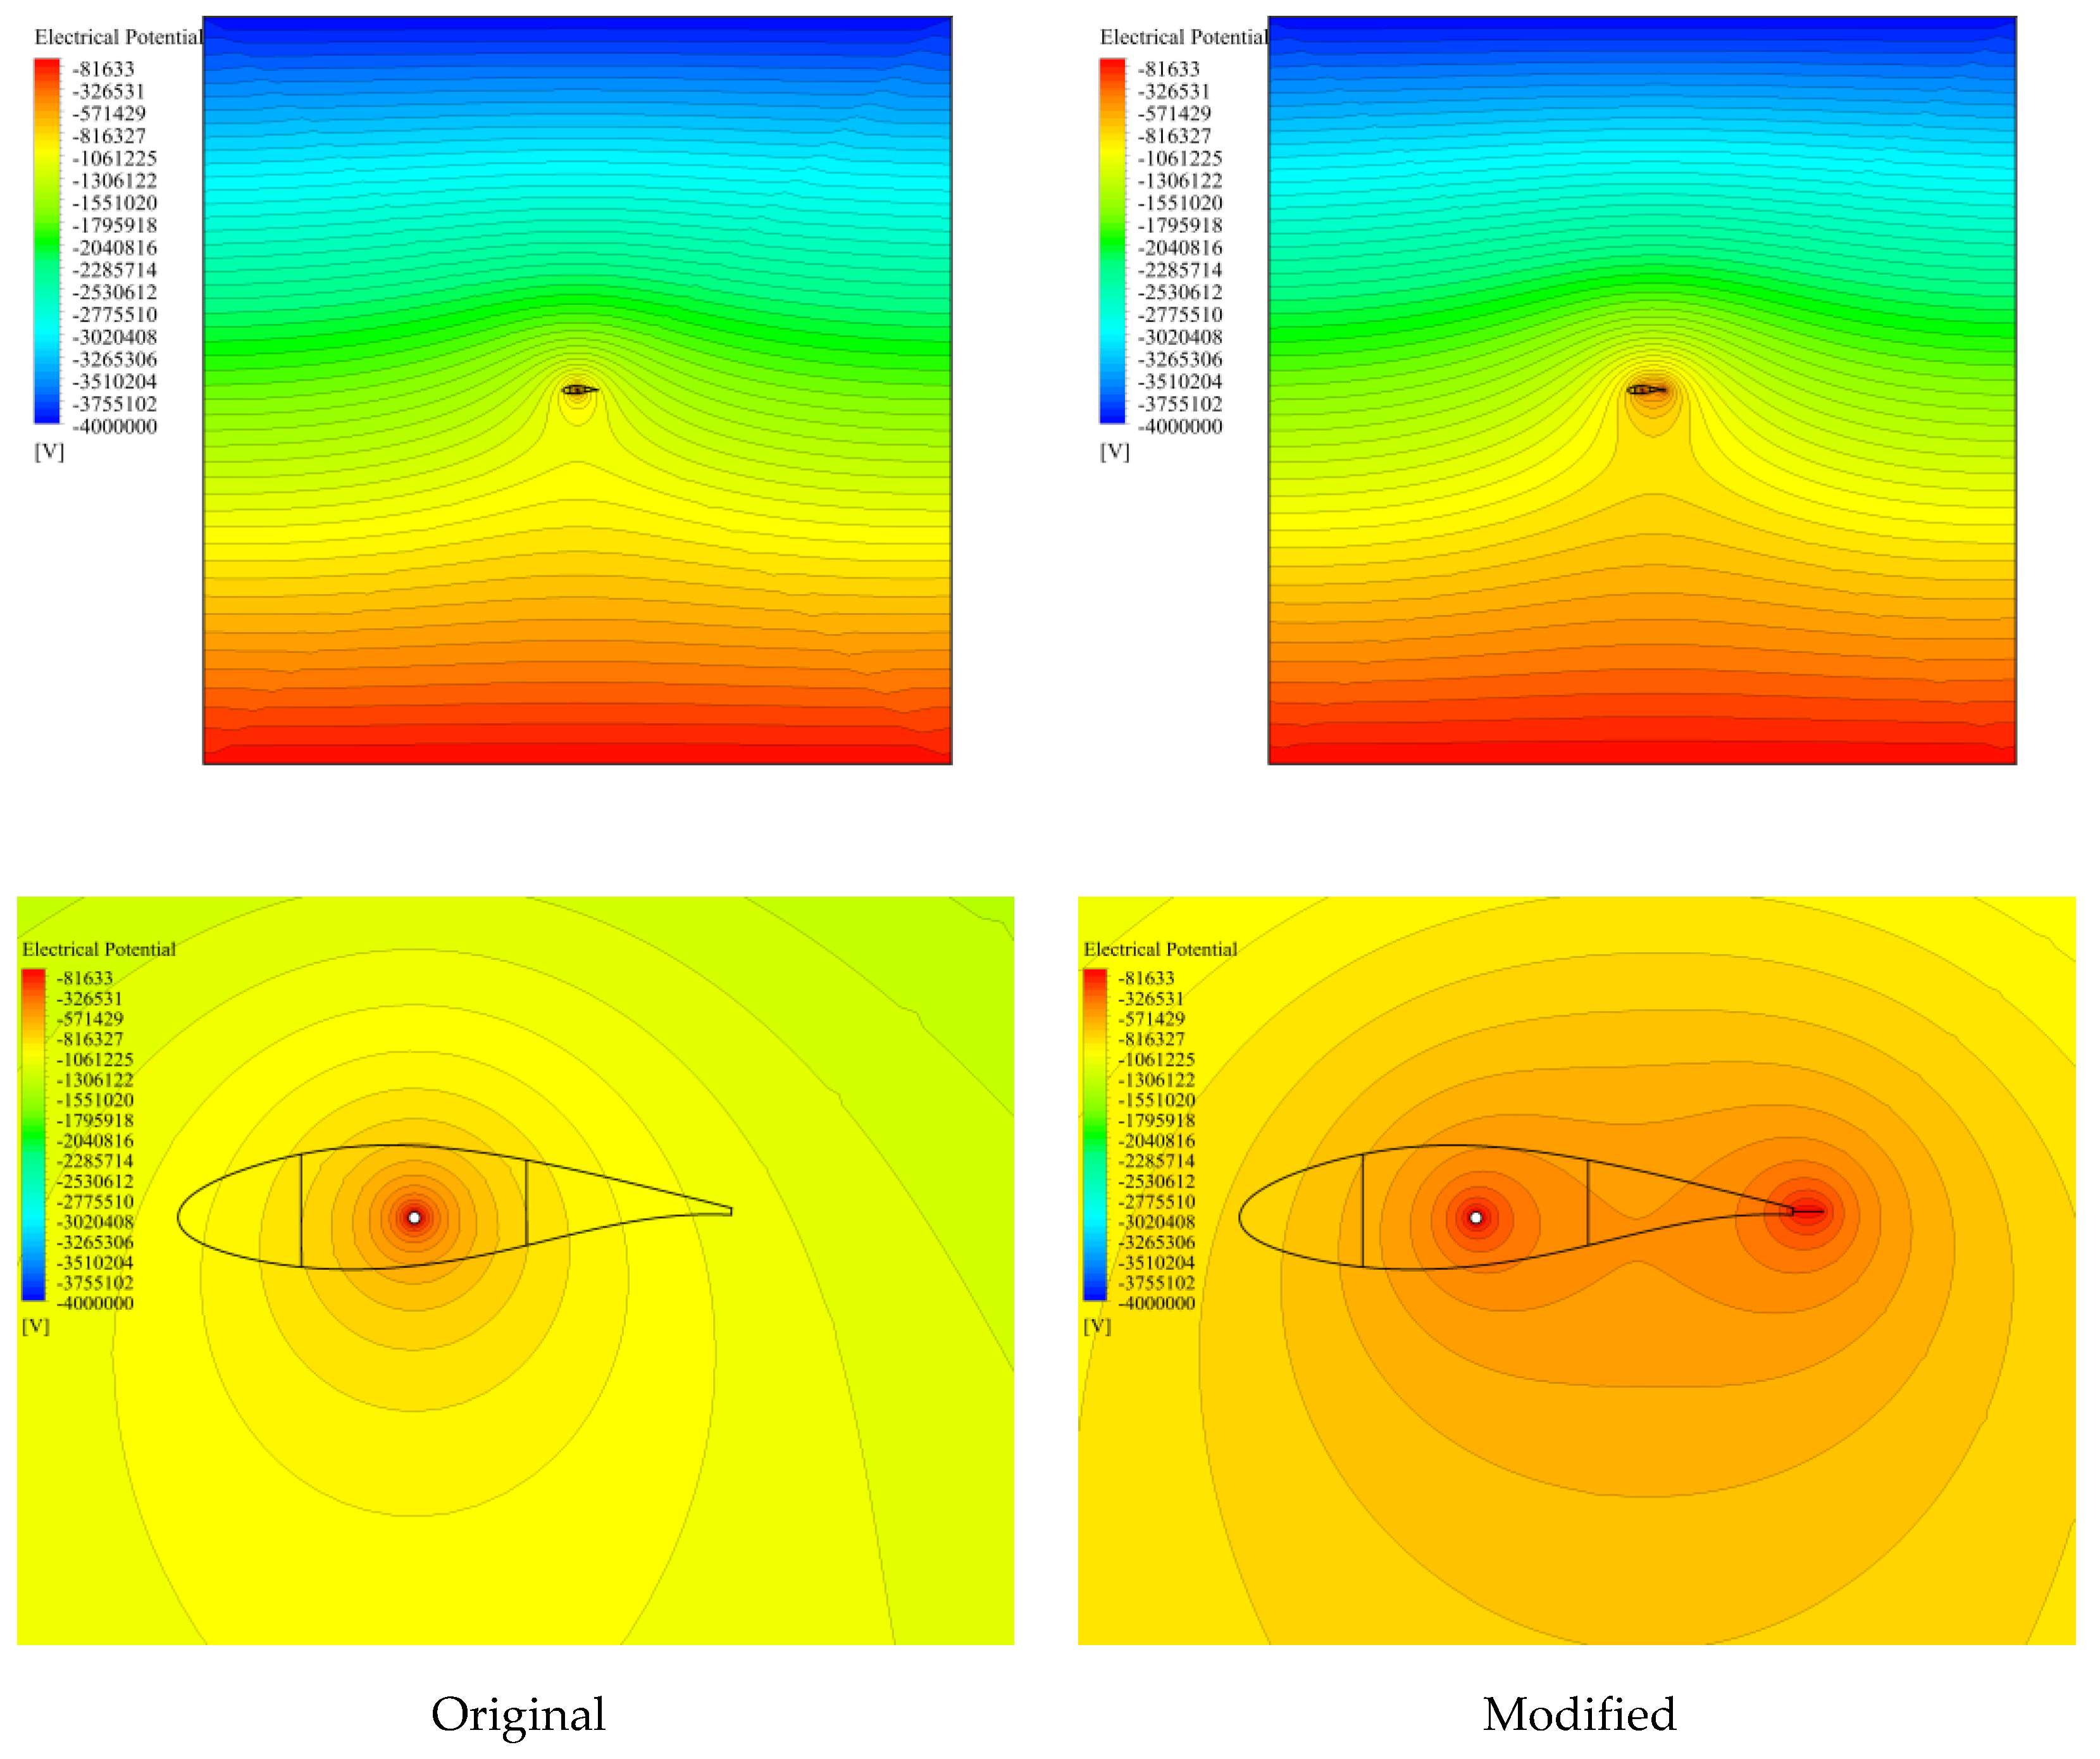
3.1. Effect of NLPS on Protection Efficiency

Ten discharges were applied to the blades with and without the NLPS in the test, and the lightning protection effect of the NLPS was obtained by counting the locations of the lightning attachment positions. The rod electrode could be moved in parallel with the blade, placed the rod electrode in two positions, corresponding to the blades with or without the NLPS, and conducted ten discharge experiments for each scheme, which did not affect our experimental conclusion. Table 1 shows the results of the discharge test under the negative standard lightning impulse voltage. The results show that without the NLPS (original), the lightning struck the blade surface 10 times, and the blade damage rate was 100%. With the NLPS (modified), the lightning struck the NLPS 10 times (external copper wire receptors) but struck the surface of the blade zero times, indicating that the blade damage rate was 0% and the protection rate of the NLPS was 100%. From the statistics of the lightning attachment position, it can be seen that after adding the NLPS to the blade, the lightning protection efficiency increased from 0% to 100%, and the damage rate of the blade decreased to zero, indicating that the lightning protection efficiency of the blade was greatly improved.
Figure 6 presents the lightning path and lightning attachment position during high voltage discharge. For the blade without the NLPS, an interesting phenomenon could be observed in the first discharge test. First, the attachment point of the lightning arc was located near the trailing edge of the blade, and the lightning sliding flashover phenomenon could be observed on the blade surface. The lightning arc moved from the lightning strike attachment position to the blade trailing edge, which caused erosion of the blade surface. The intensity of the induced electric field around the lower lead wire became stronger and stronger with the process of downward movement of the lightning downward leader, and when the downward leader developed to a certain distance, the induced electric field around the lower lead wire formed a streamer discharge. When the downward leader continued to develop downward, the electric field intensity around the lower lead wire continued to increase; at this time, the streamer discharge formed an upstream leader. The lower lead wire was located at the plate of the blade cavity. In theory, the lightning discharge path will form the shortest path, breaking down the blade directly above the lower lead wire to form the discharge path. However, the blade material above the lower lead wire was thicker, whereas at the trailing edge the blade material was thin and the arc was easy to break down. Therefore, the downward leader first attached to the blade near the trailing edge, then slid to the trailing edge of the blade, and connected with the upward leader of the lower lead wire. The above process is also the main reason for the high failure rate of the existing lightning protection system of wind turbine blades, leading to the high lightning damage rate of blades.
For the blade with the NLPS, under the influence of the lightning downward leader, the inductive electric field generates around the NLPS and the lower lead wire. On the one hand, the existence of the NLPS weakens the electric field intensity around the lower lead wire, making it difficult for the lower lead wire to start the upward leader; thus, it is impossible to form a discharge path. On the other hand, the NLPS is exposed on the outside of the blade, and the starting rate of the upward leader of the NLPS is faster than that of the lower lead wire; thus, the downward leader first connects with the starting upward leader of the NLPS to form a discharge path. This is also the design idea of the NLPS as well as the principle of lightning protection. From the discharge test results, it was found that the protection efficiency of the NLPS was greatly improved.
Figure 7 presents the pattern of spatial potential distribution. First, it can be seen that the distribution of the potential distribution from the upper boundary to the lower boundary was a uniform gradient; however, the gradient changed around the lower lead wire and the NLPS. As the blade is an insulator, the electric potential was not changed around the blade, but the lower lead wire and the NLPS had zero potential, so the potential gradient around them was changed. The local large map around the blade indicates that the potential gradient around the lower lead wire was larger without the NLPS; the NLPS had a certain shielding effect on the potential around the lower lead wire after the NLPS was installed, and, thus, the potential gradient around the lower lead was weakened.
Figure 8 shows the distribution of the electric field intensity around the airfoil, in which the gradient of the electric potential can be described by the electric field intensity. Moreover, the electric field intensity presents the degree of charge concentration. The stronger the electric field intensity, the easier it is to start the leader and strike by the lightning. It can be observed that the electric field intensity around the lower lead wire was stronger when the blade did not have the NLPS. The lightning downward leader could easily connect with the upward leader of the built-in lower lead wire to form a discharge path, breakdown injury, or a high temperature arc entering the interior of the blade along the breakdown position to form ablation or an air-burst blasted blade. After adding the NLPS, the electric field intensity around the lower lead wire of the blade was weakened. At the same time, the electric field intensity around the NLPS was greater compared to the electric field intensity around the lower lead wire. This also theoretically verifies the conclusion of the high voltage discharge test.

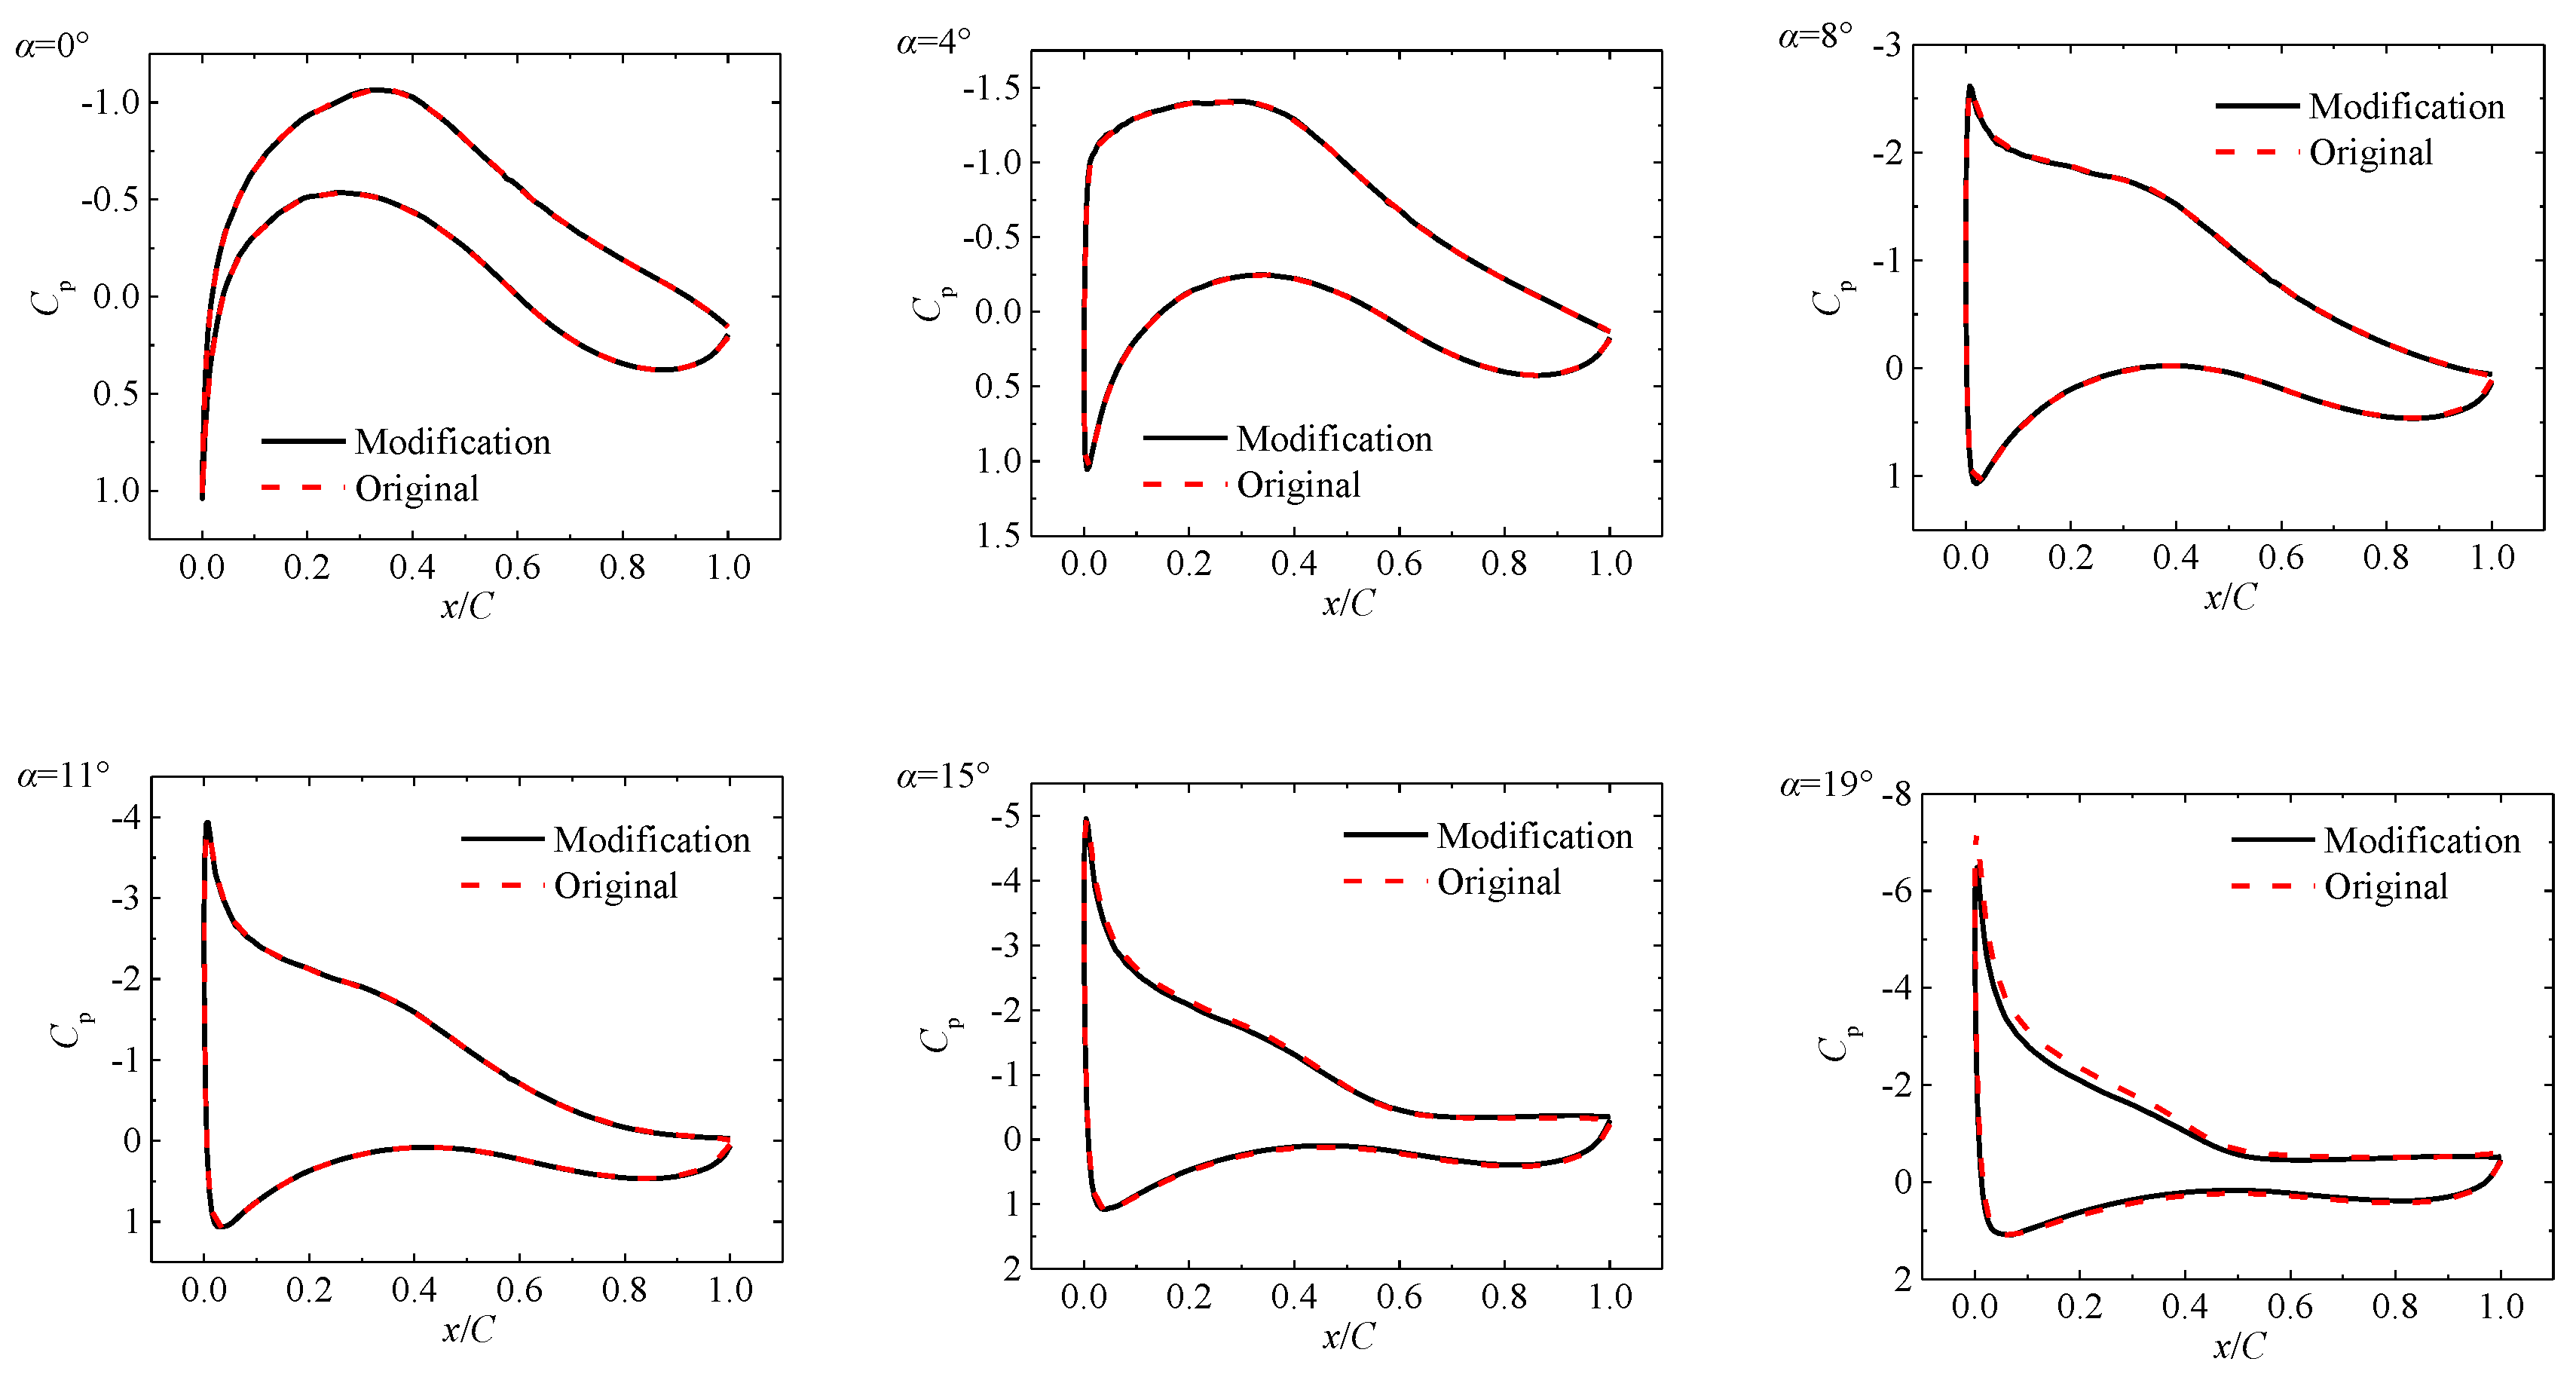
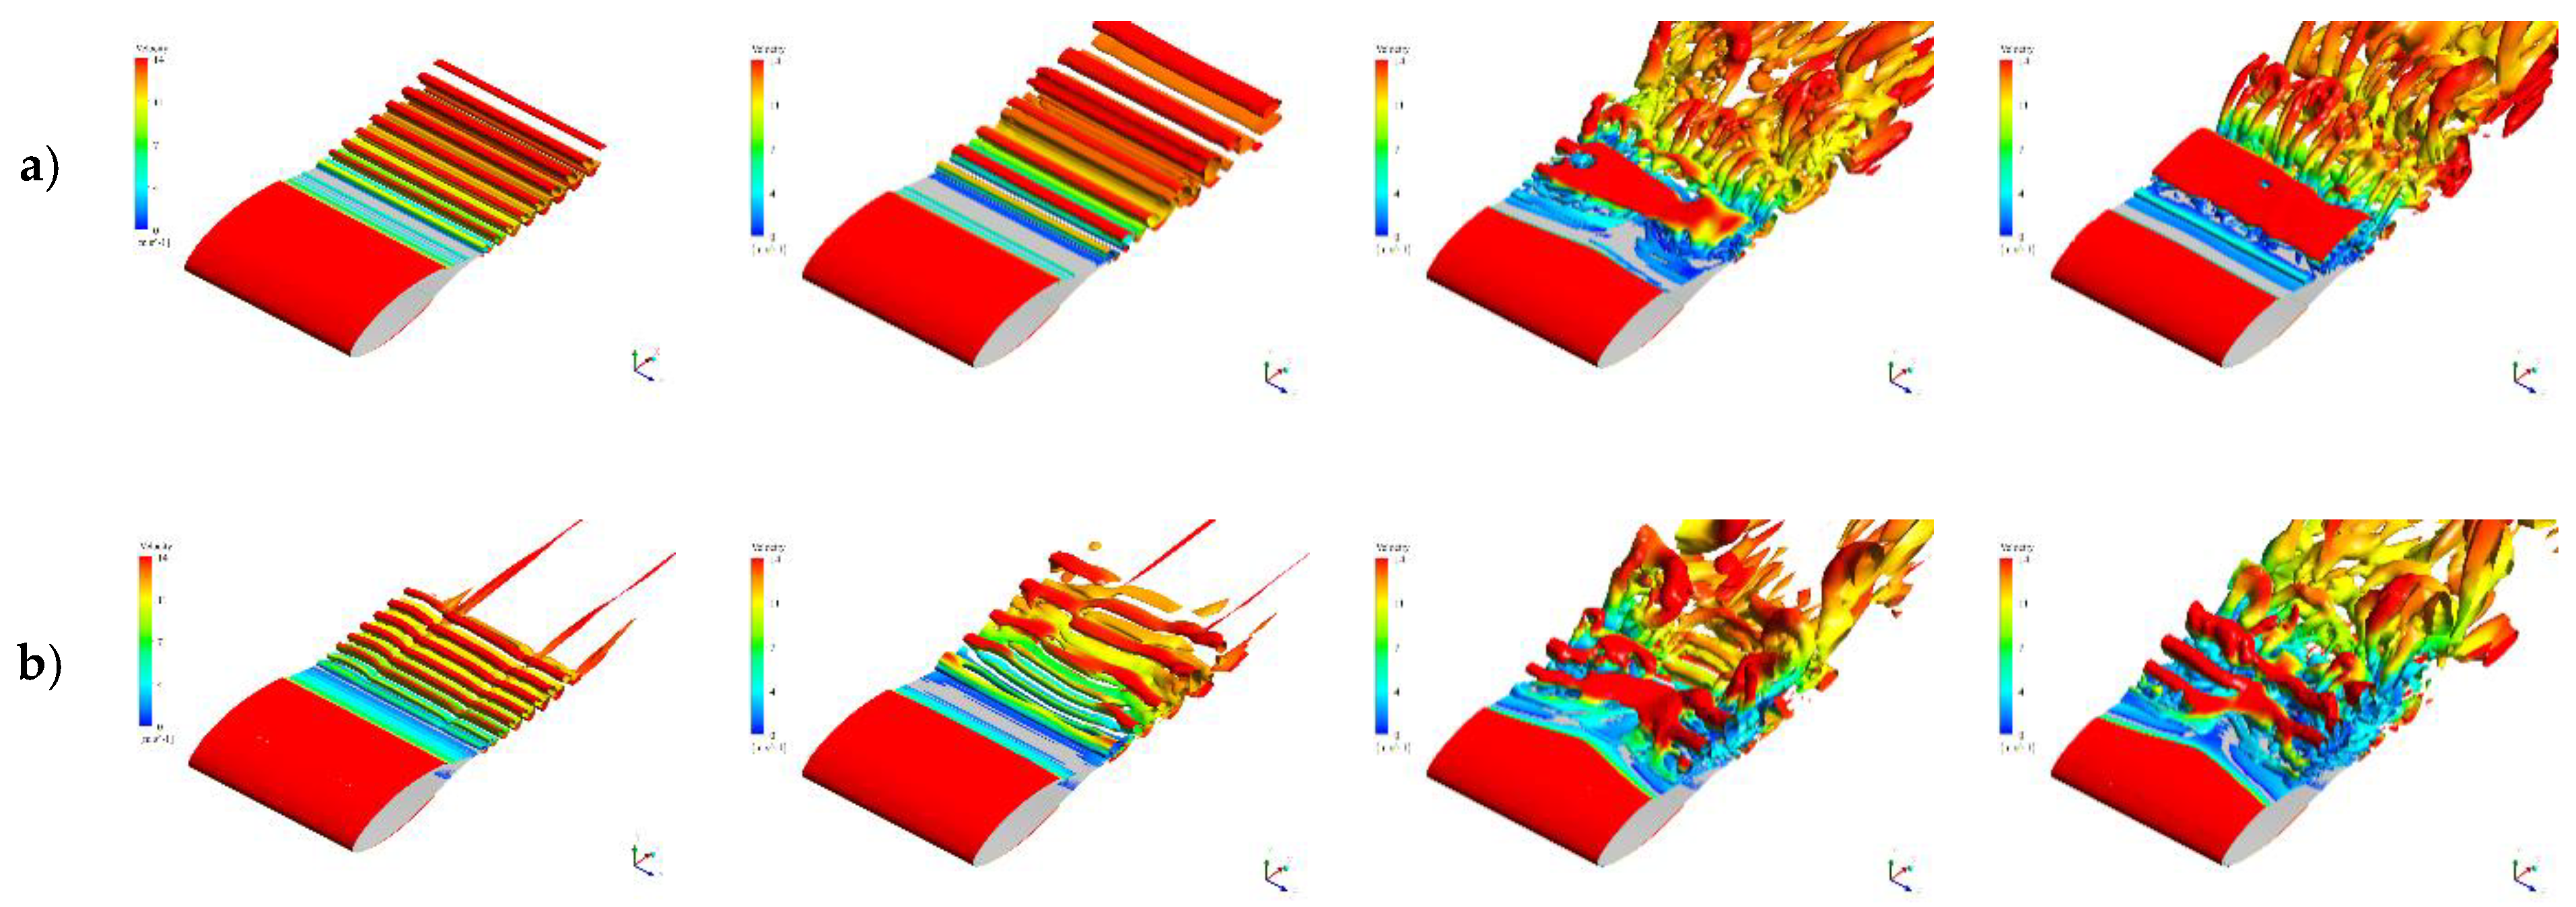
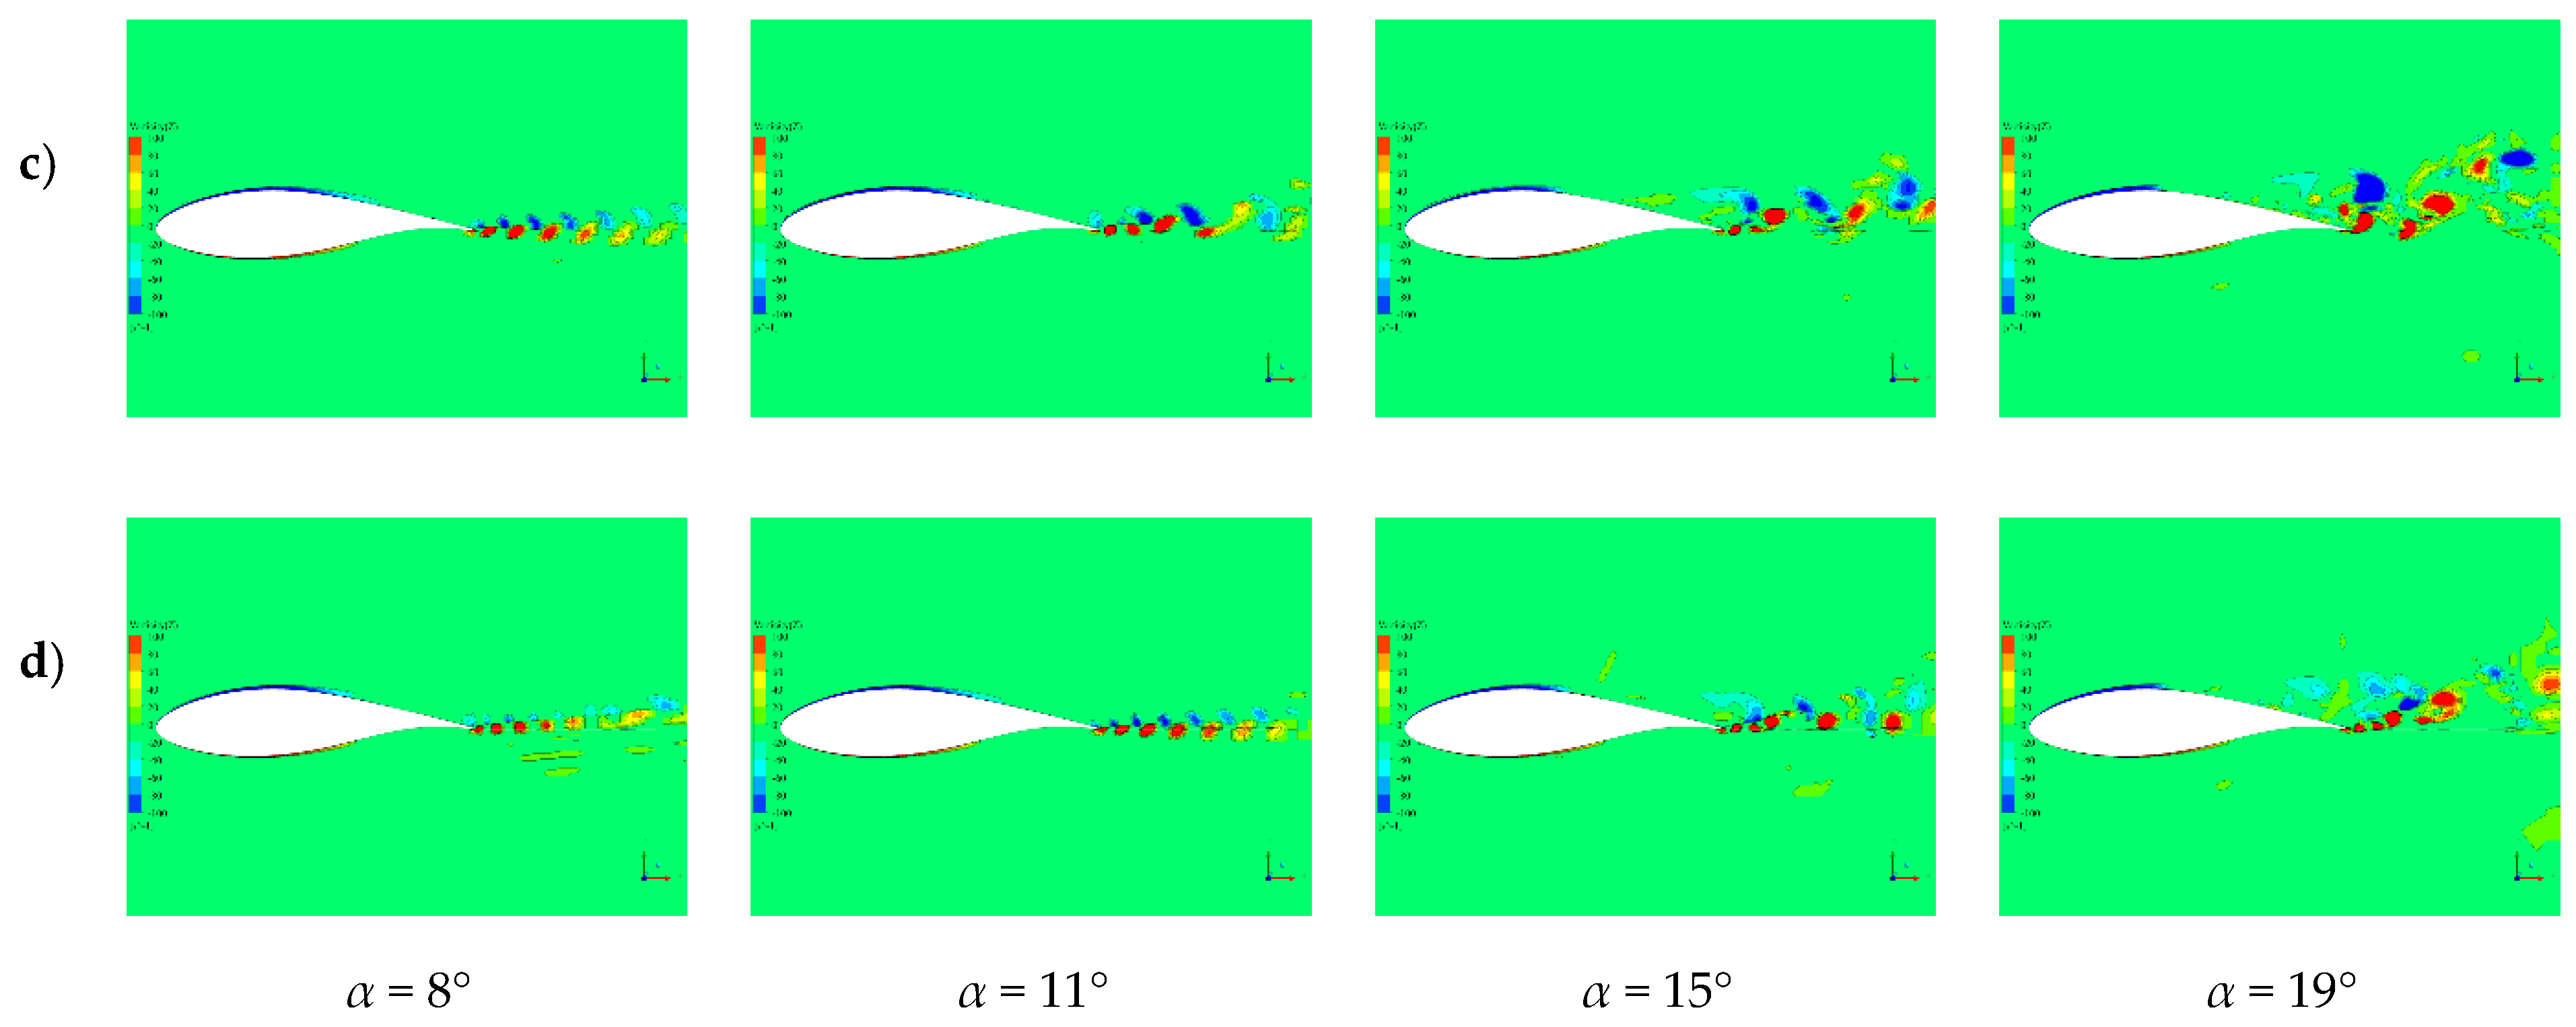
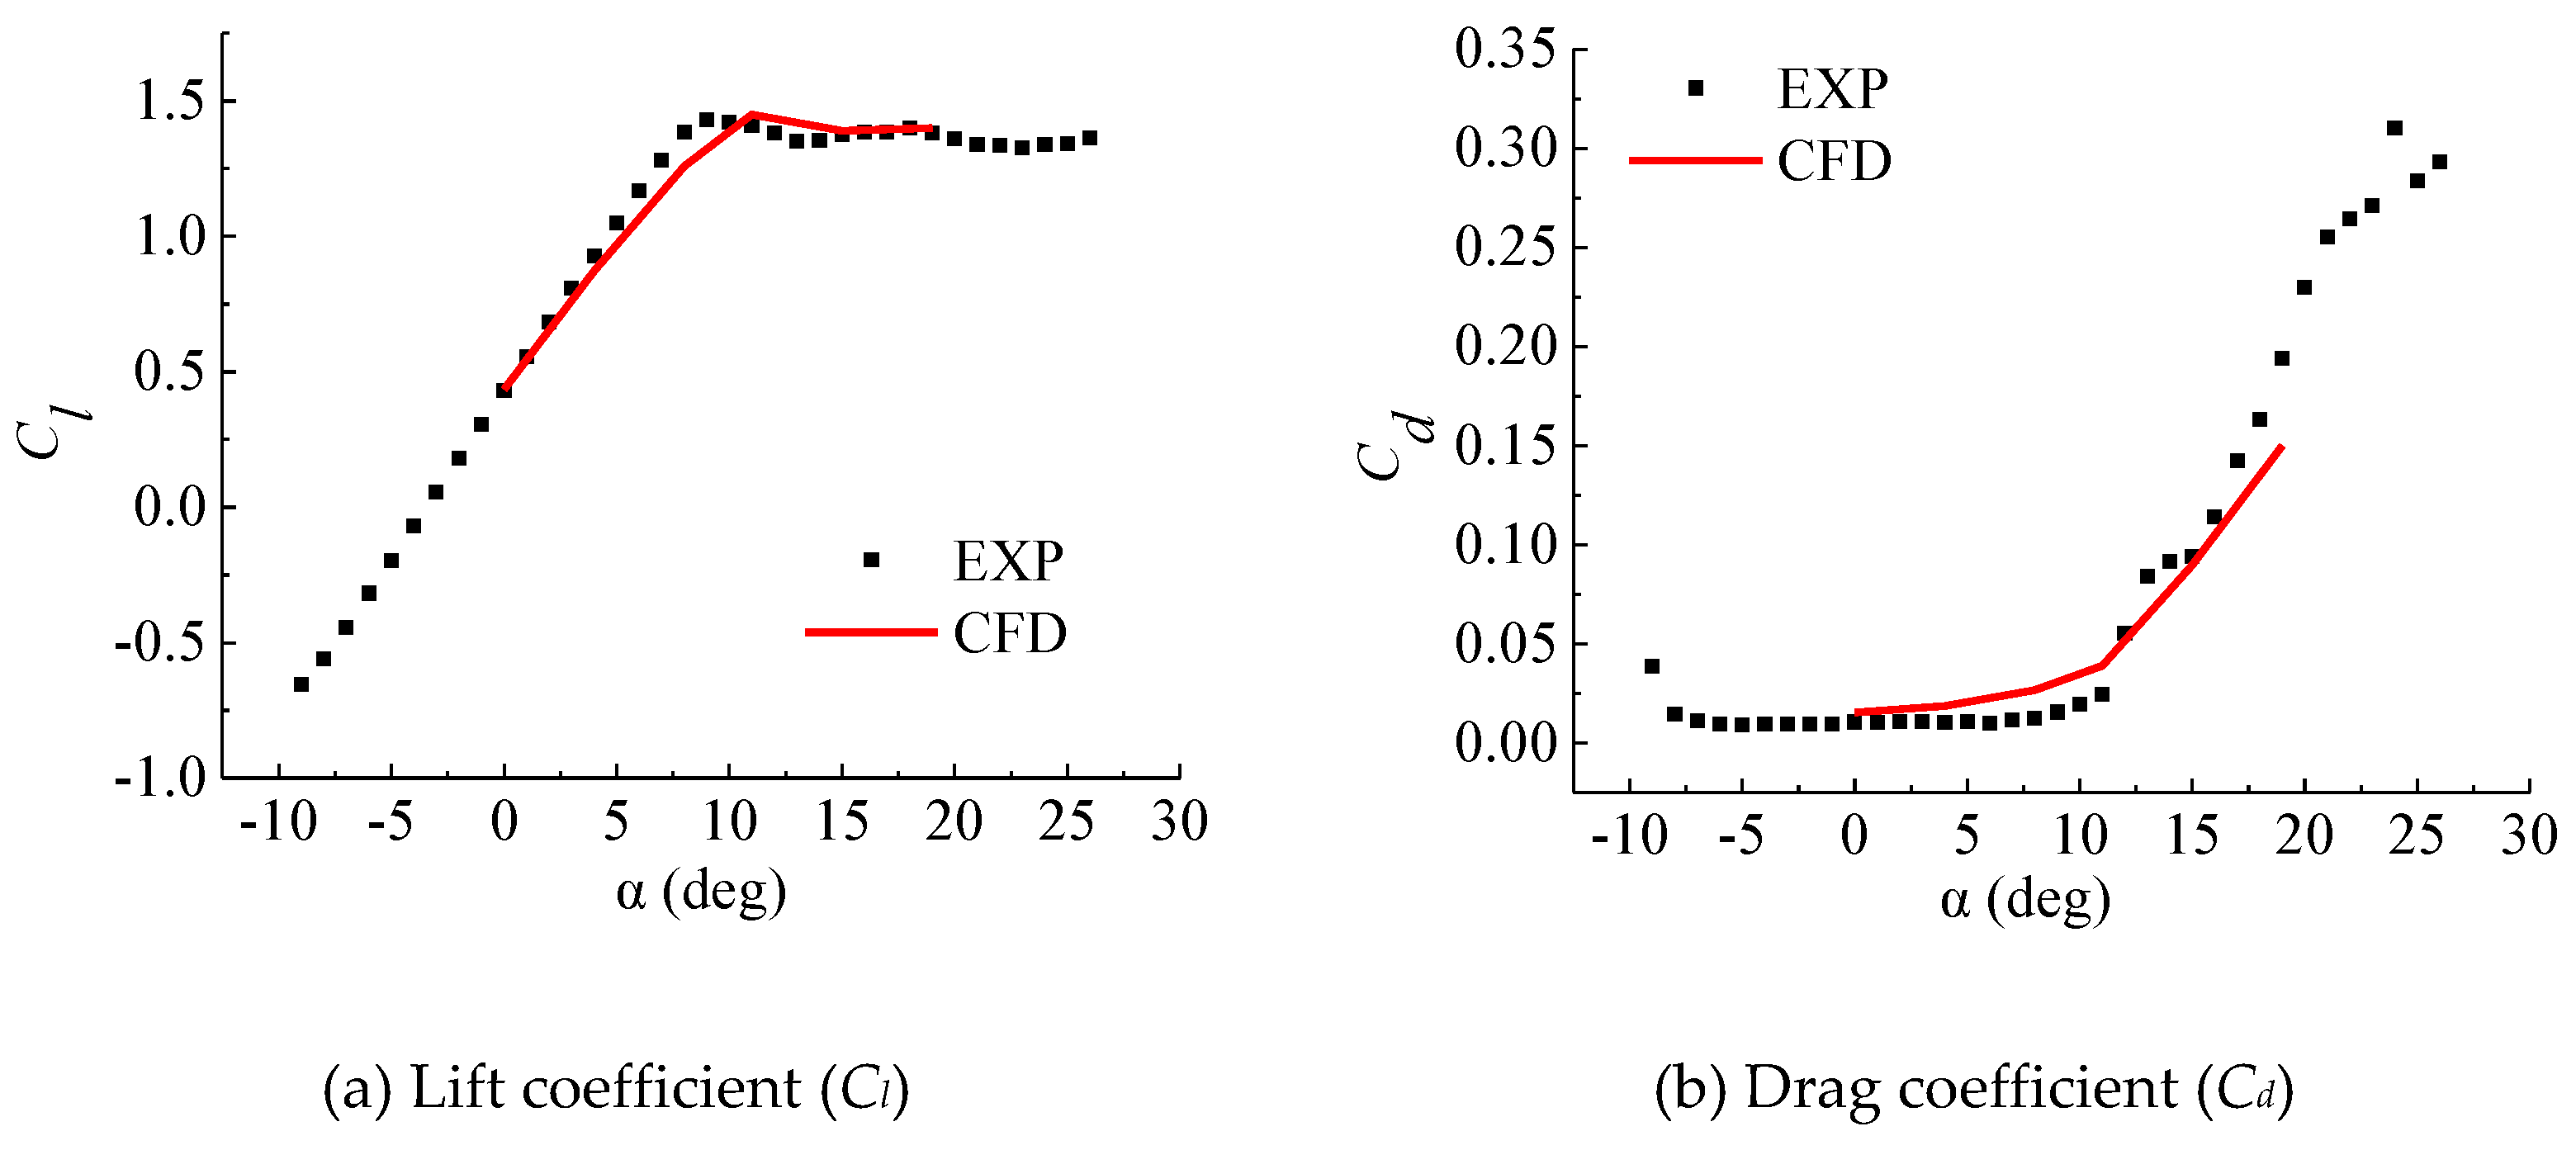
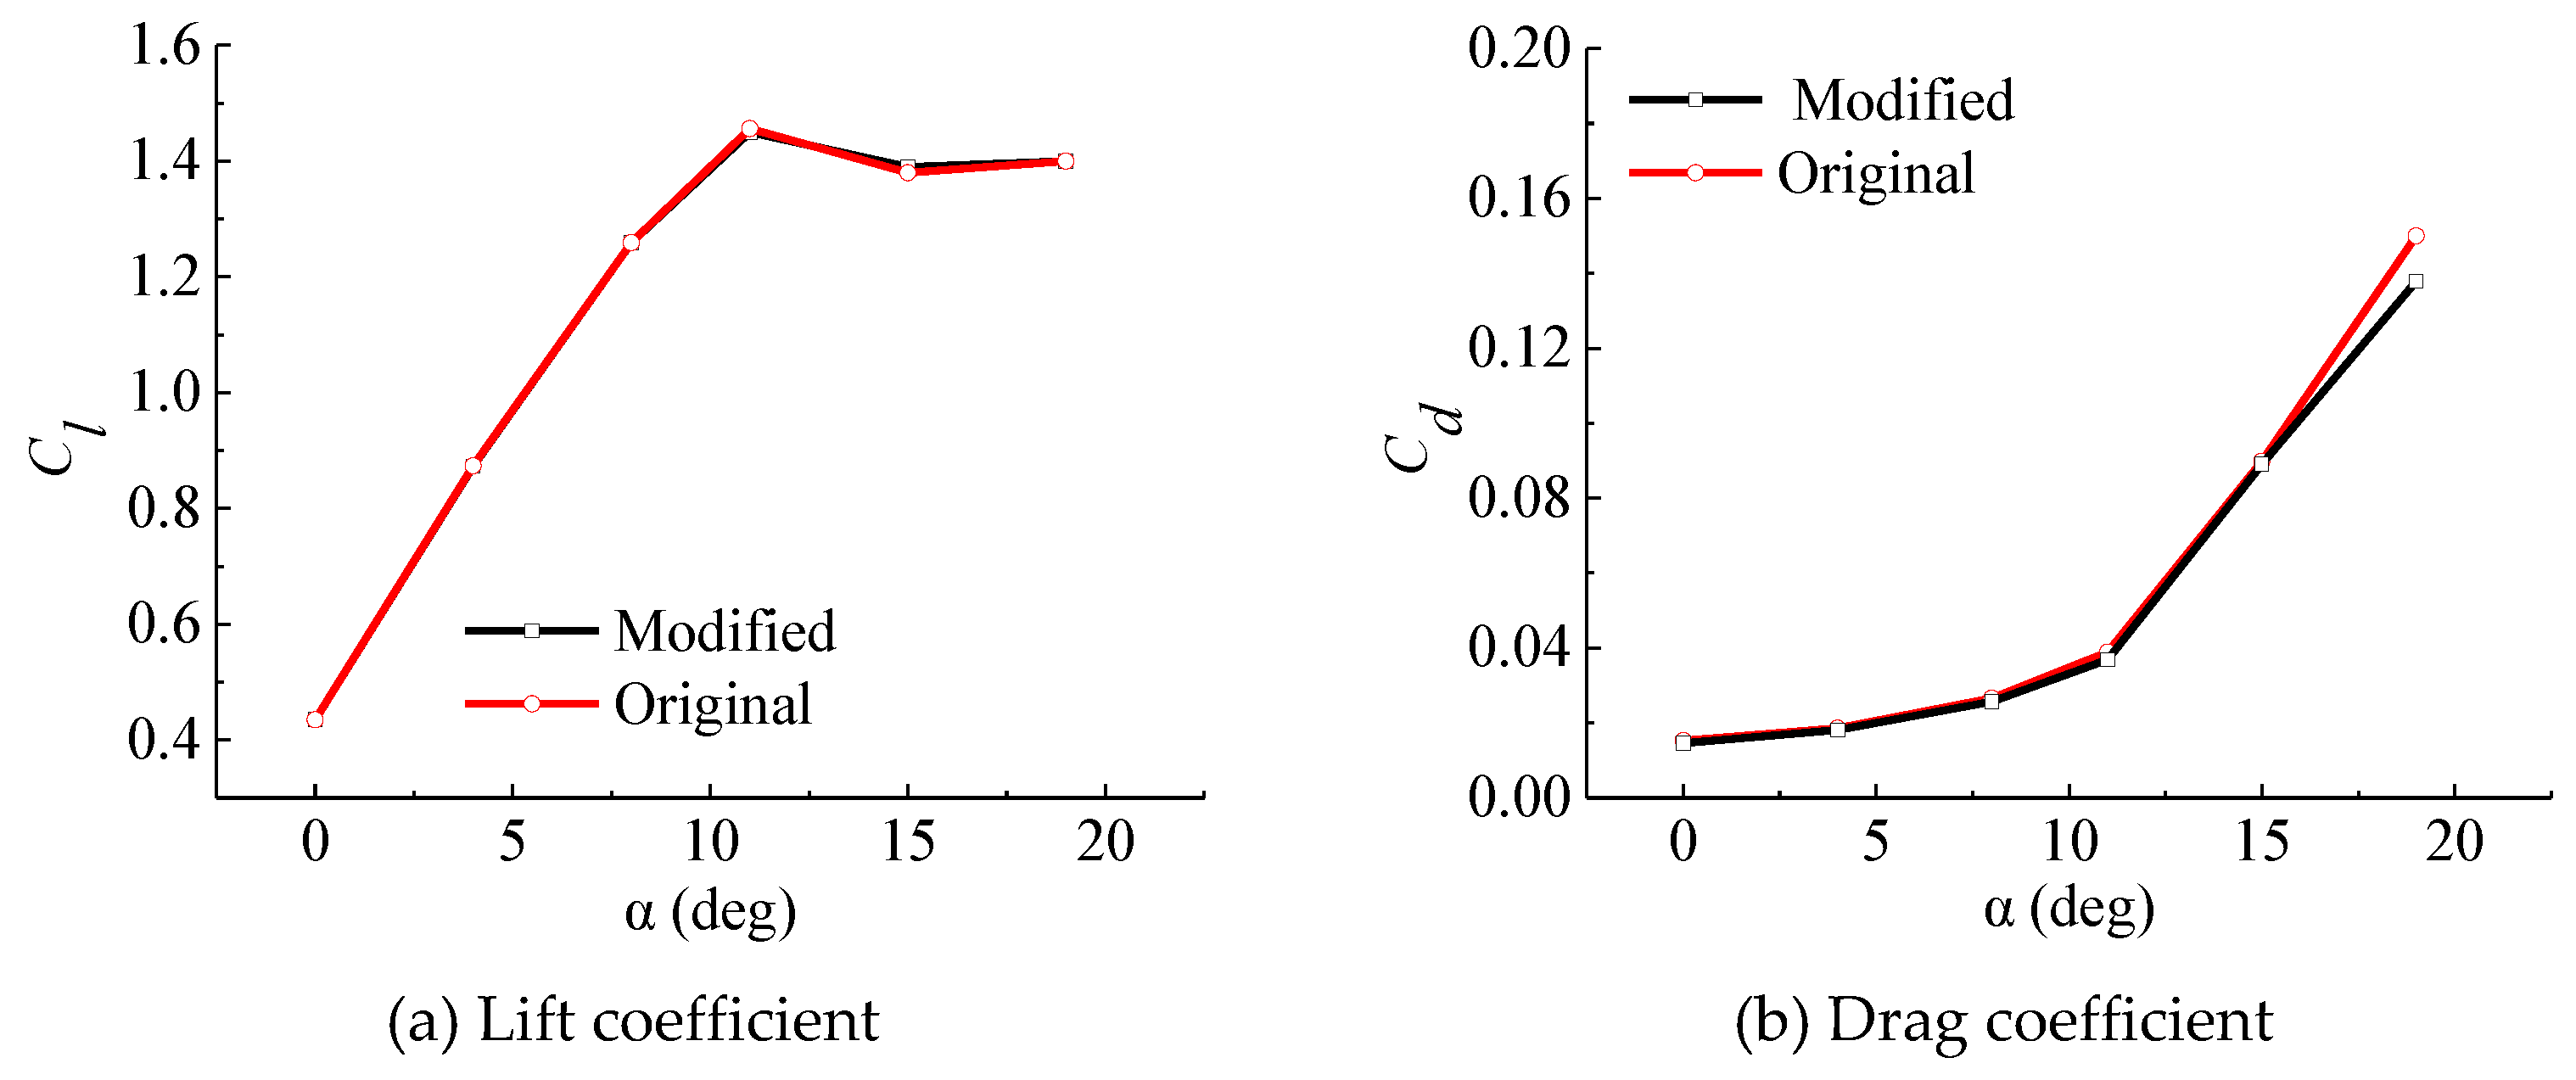
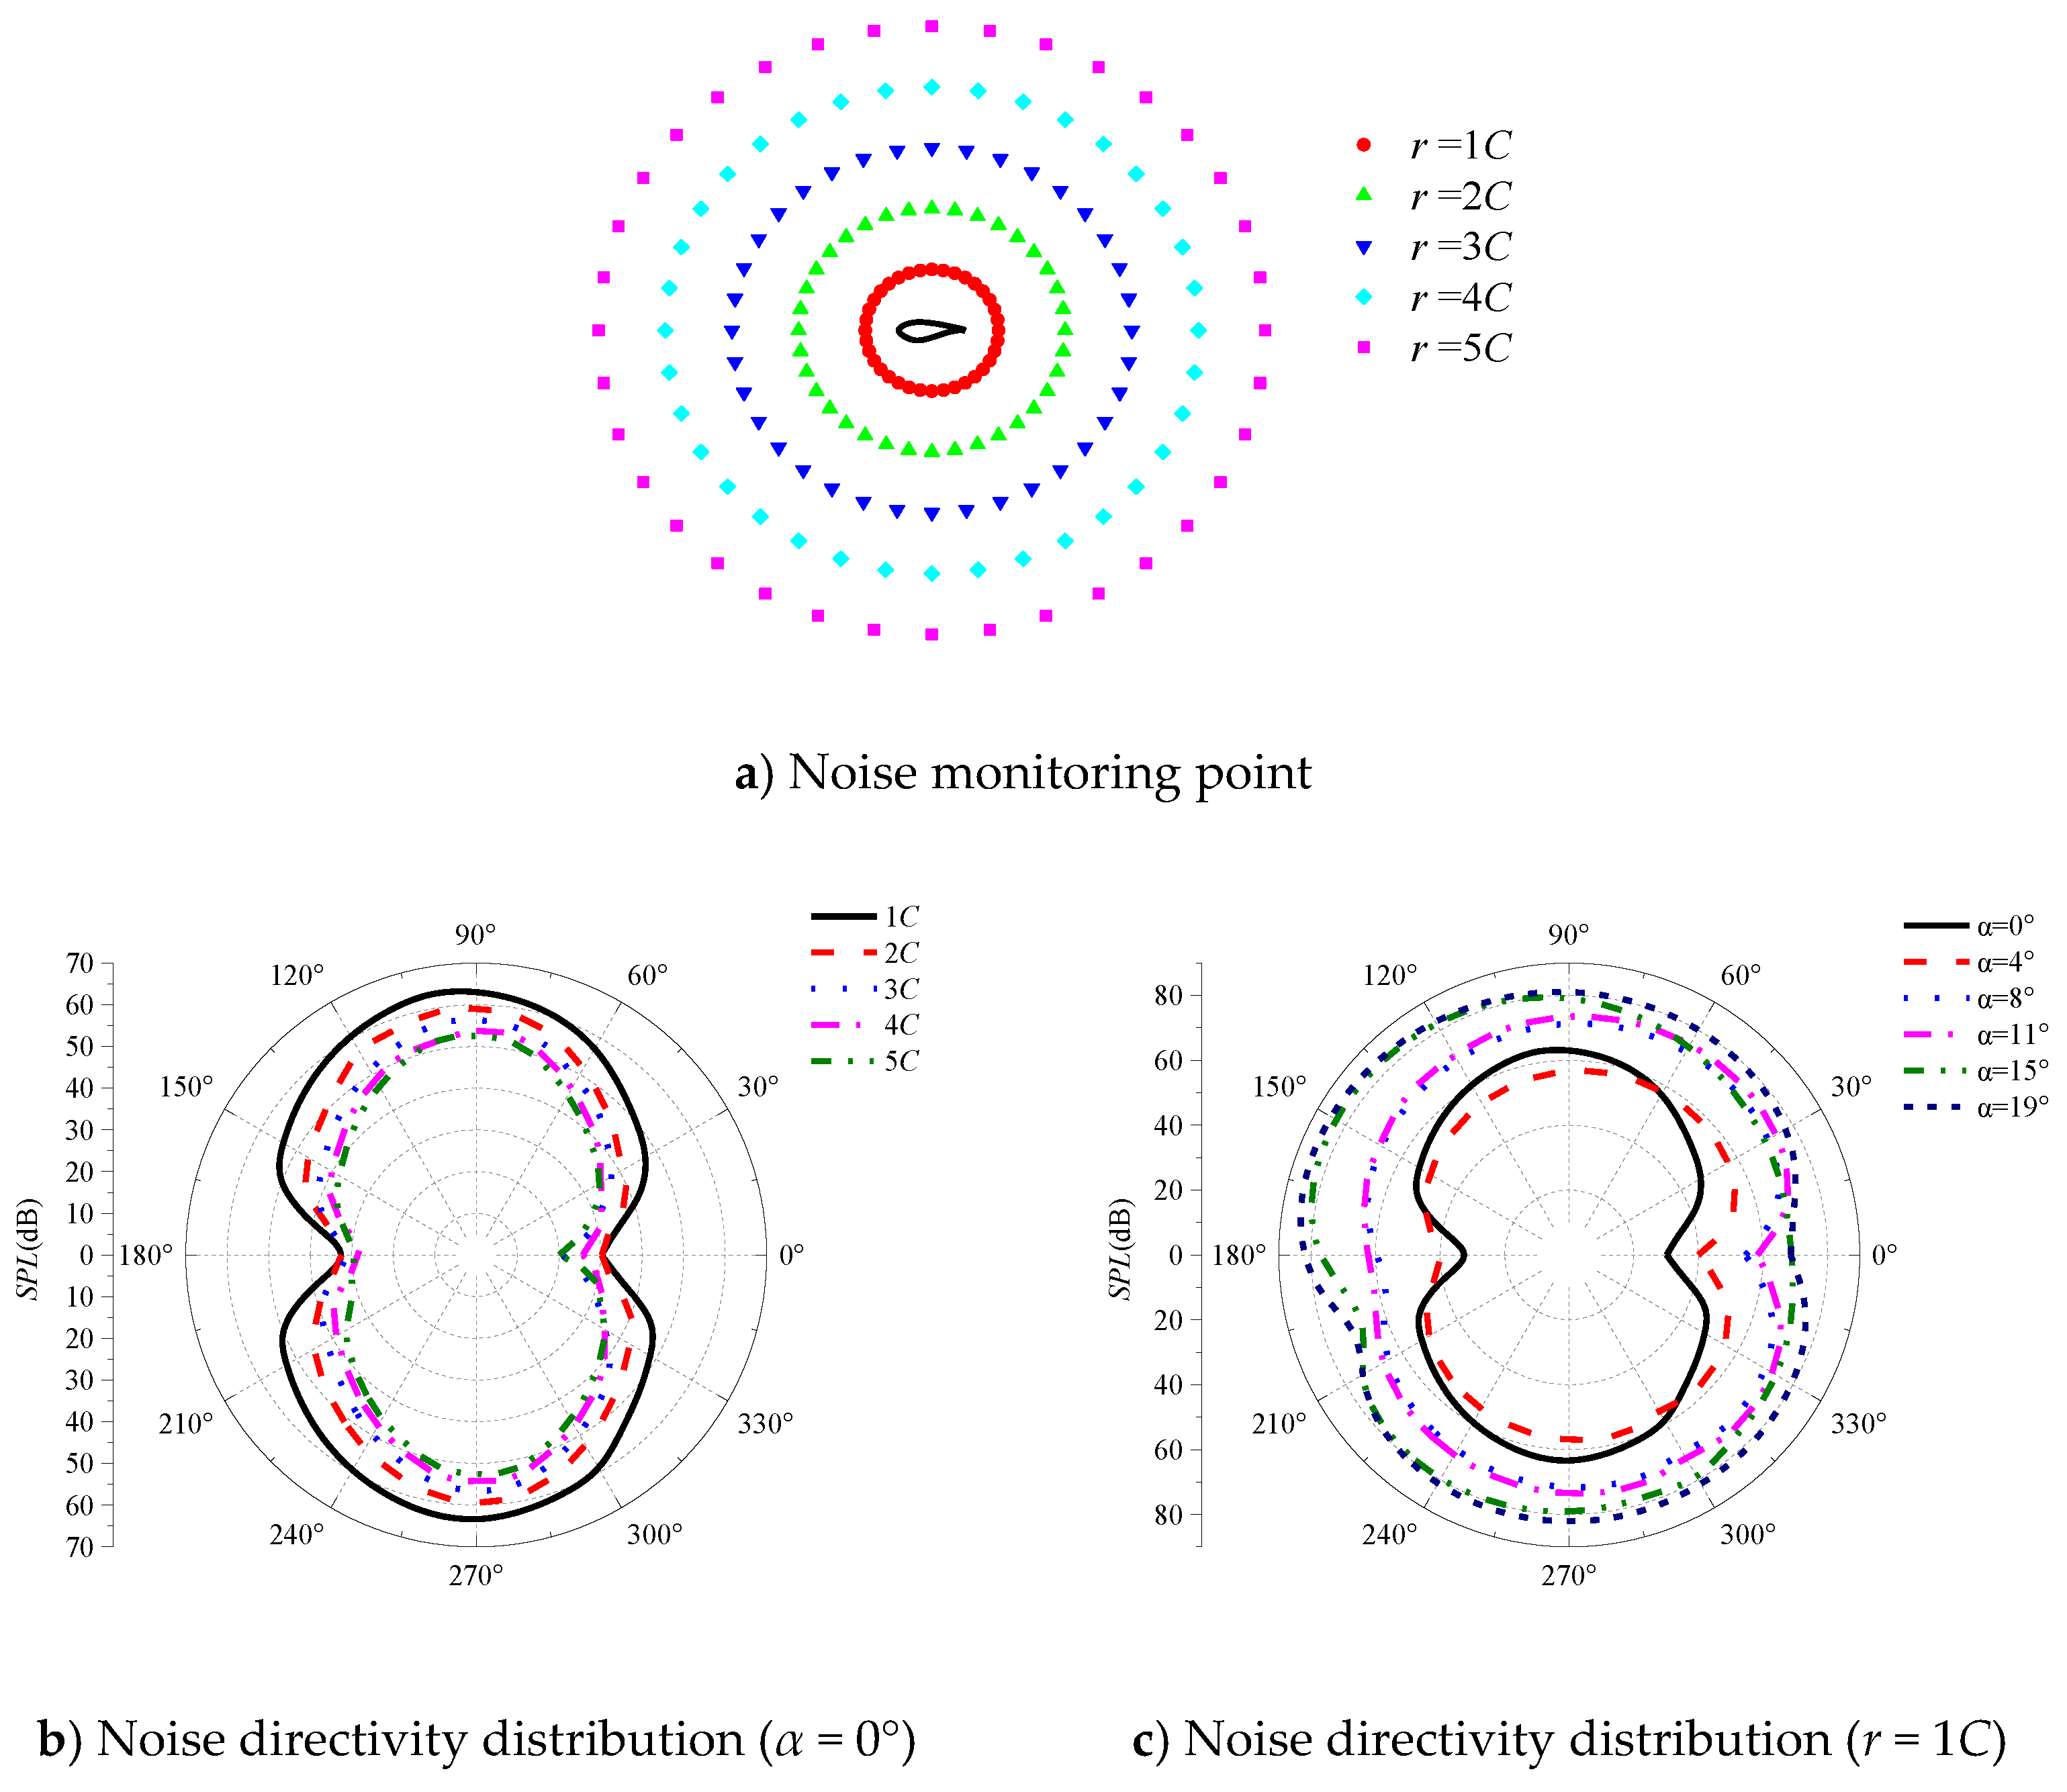
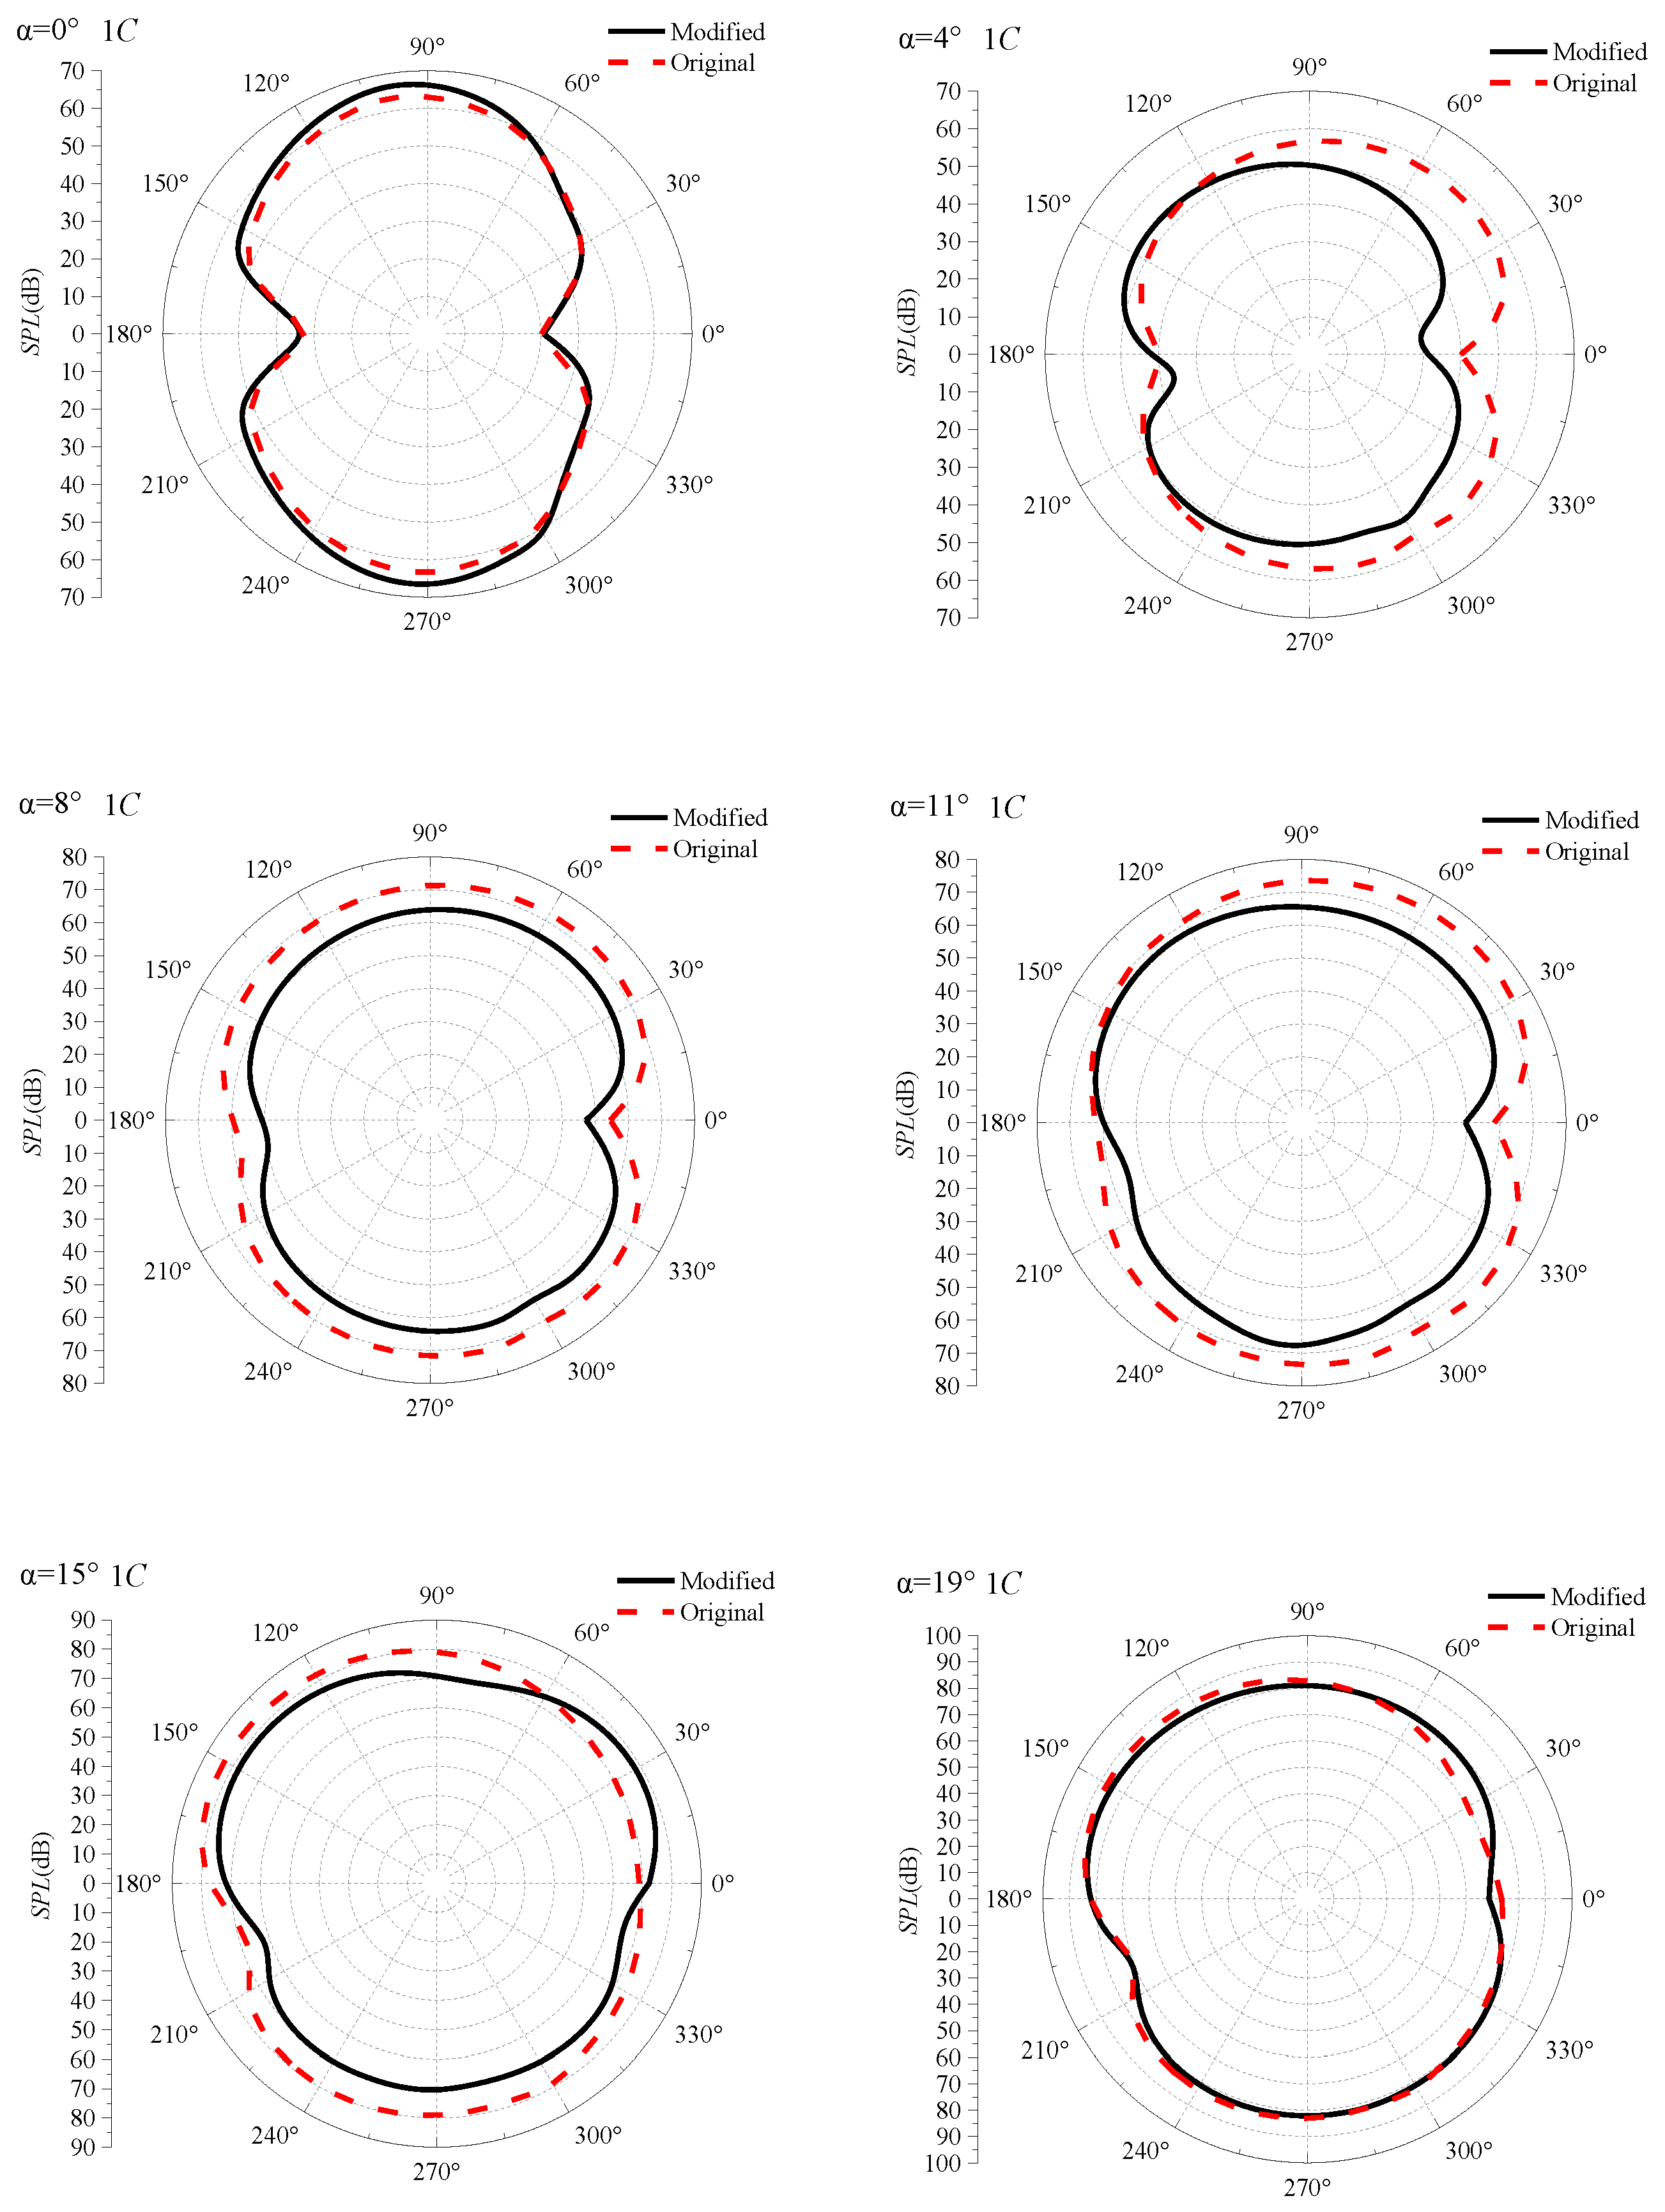
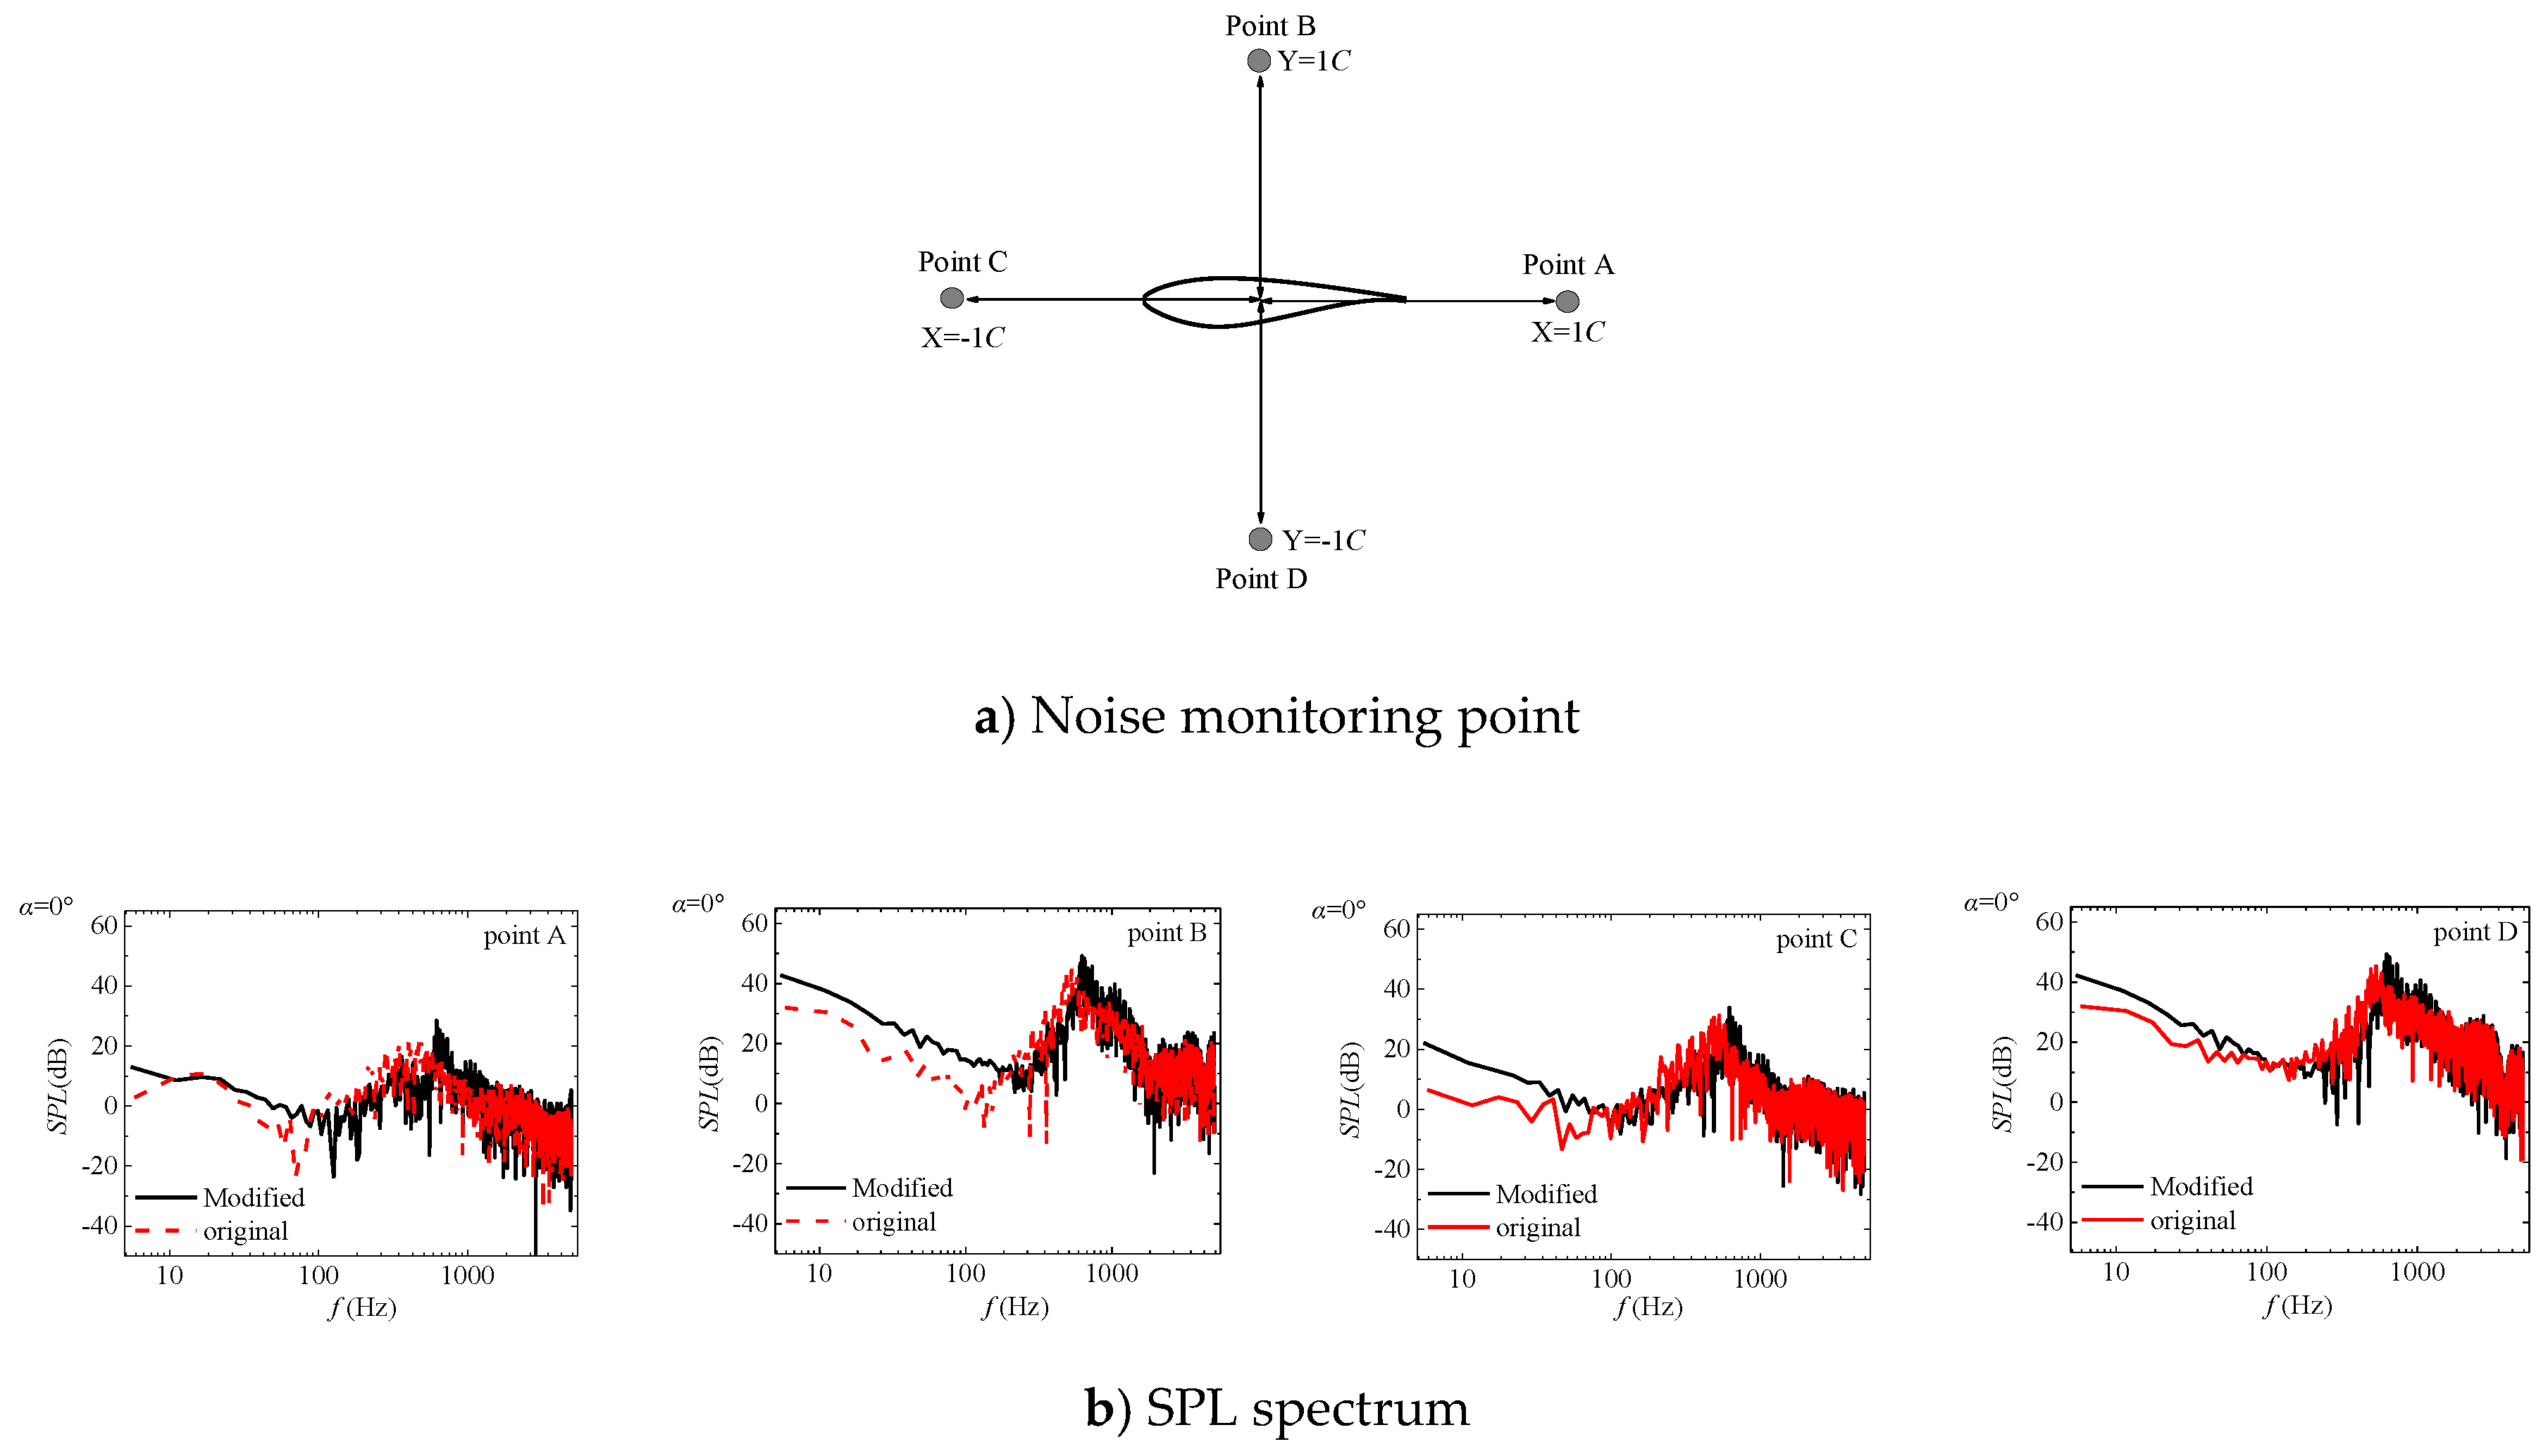
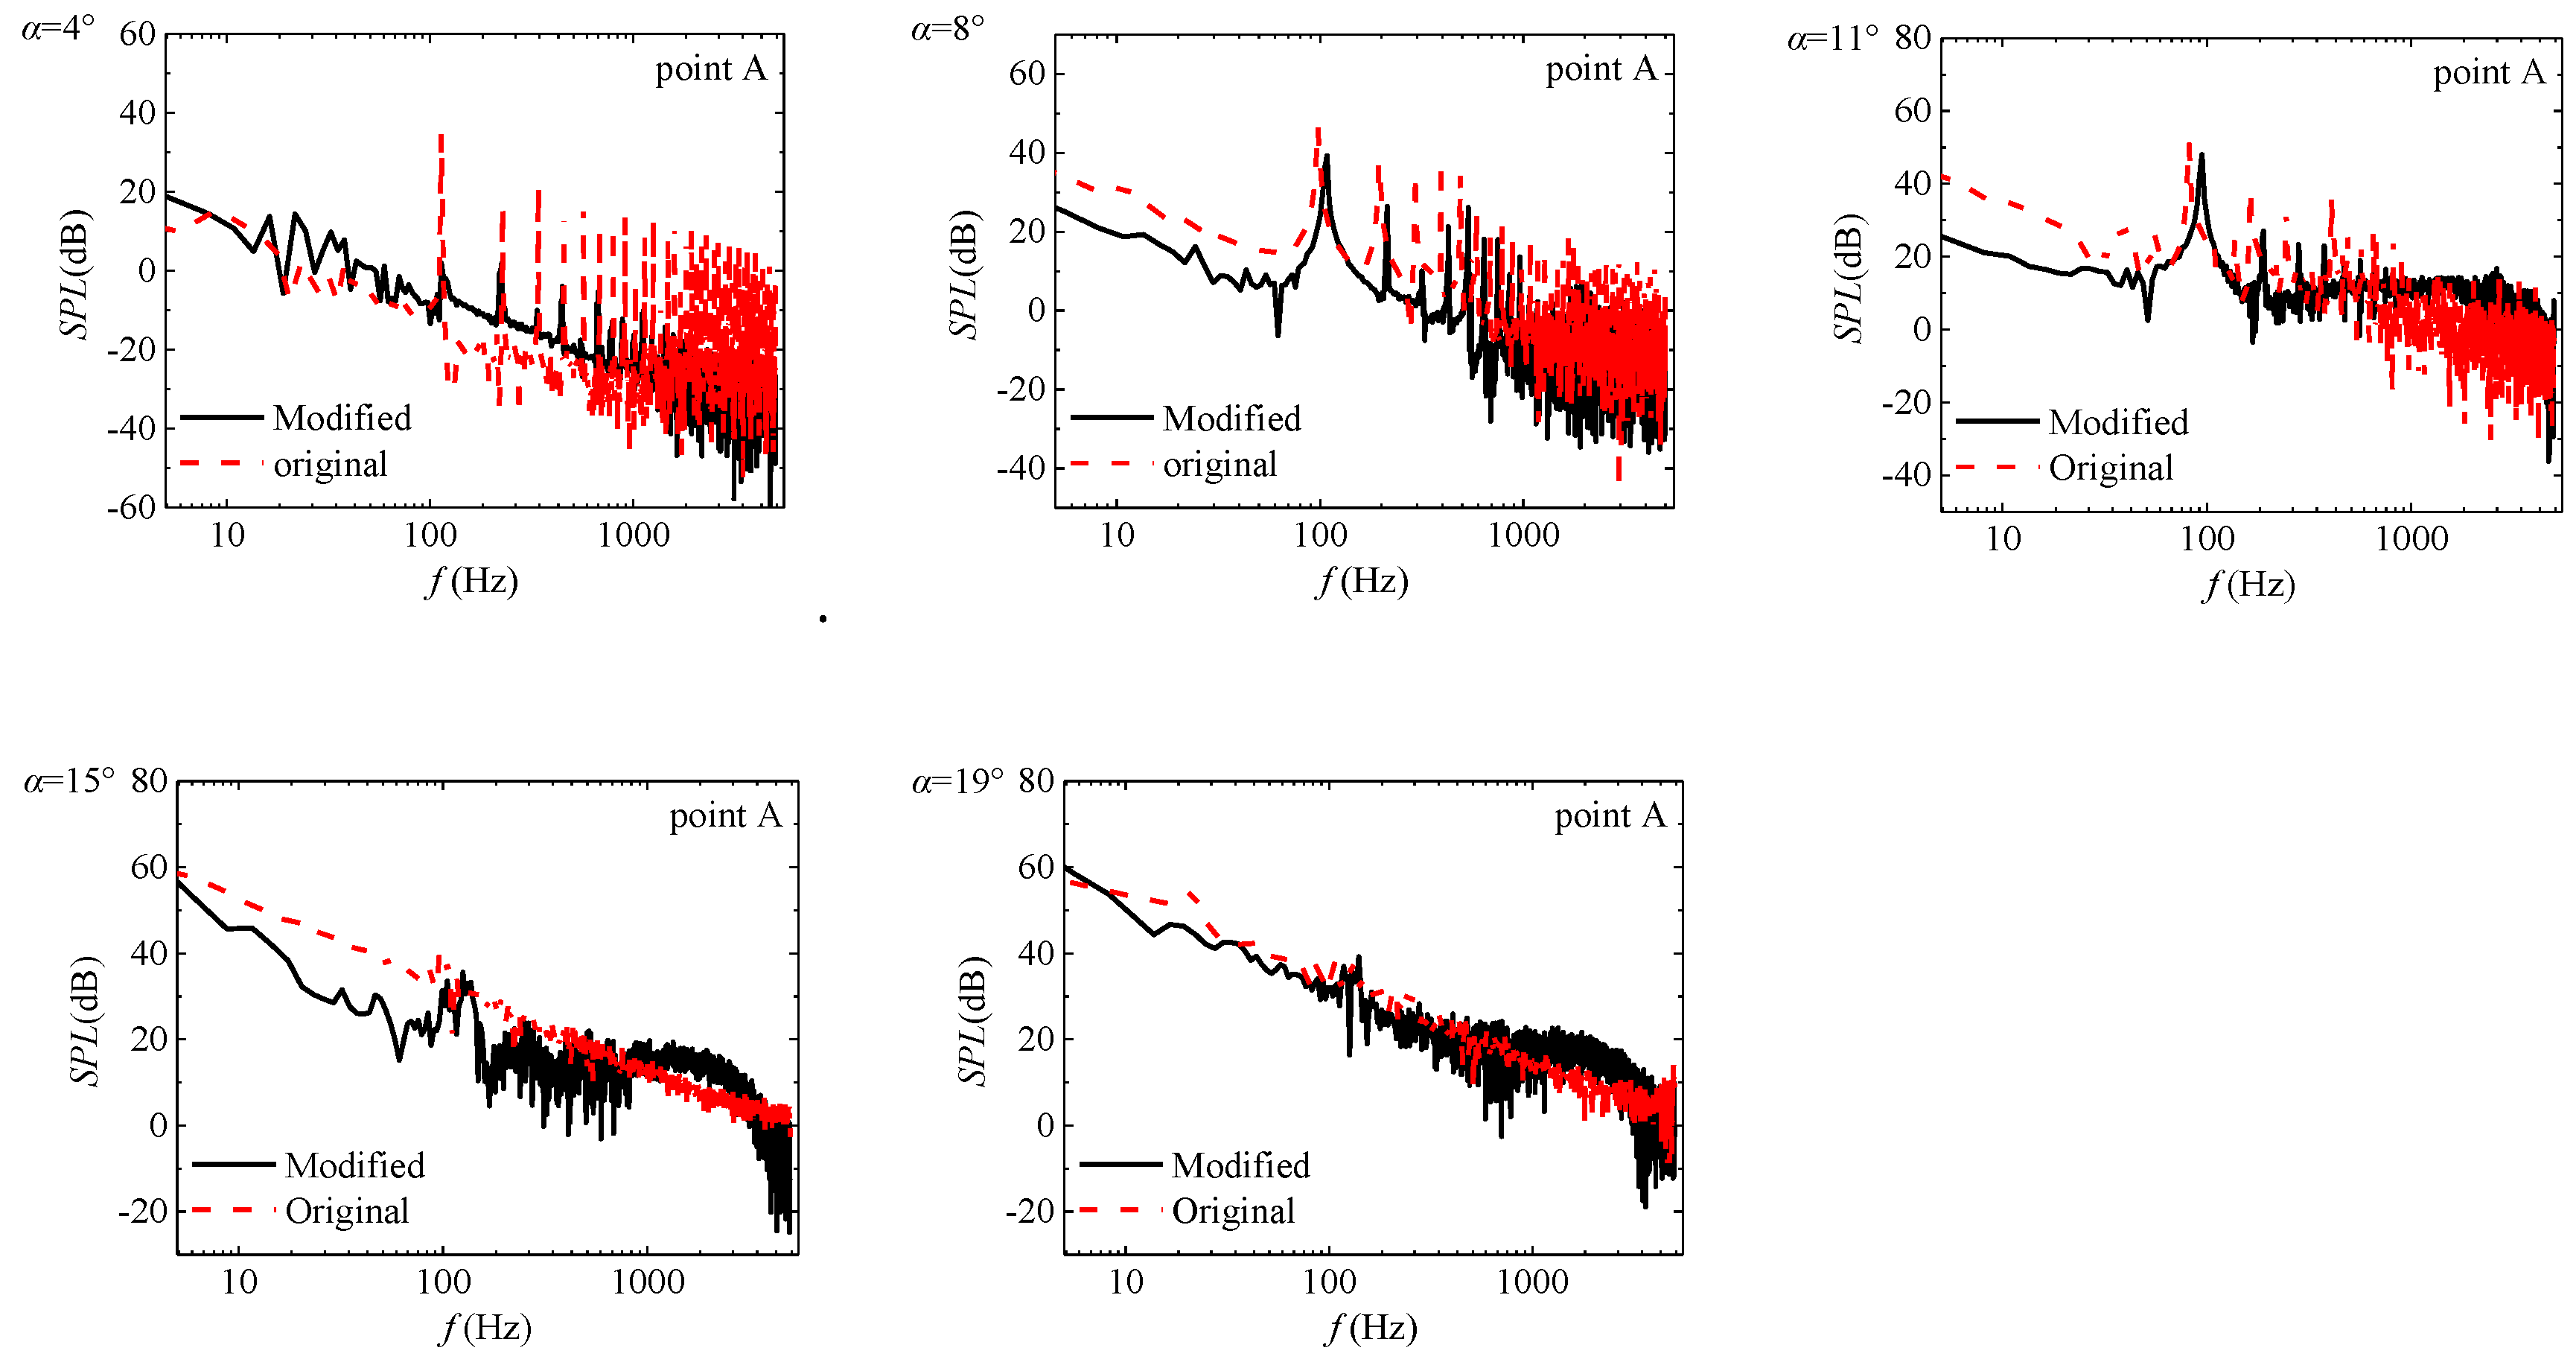
3.2. Effect of NLPS on Aerodynamic Calculation

The numerical method was verified using the airfoil without the NLPS, and the wind tunnel experiment was completed at North China Electric Power University. Figure 9 shows the comparison curve between the value calculated numerically and the experimental results. It can be seen that the calculated value was quite different from the experimental one at the maximum lift coefficient of the airfoil at an angle of attack of 8°. The numerical results for both the lift angle and the drag coefficient at the remaining angles of attack were lower than the experimental ones, verifying the reliability of the numerical method.
Figure 10 presents the comparison curve for the aerodynamic performance of the airfoil with and without the NLPS. It can be seen that the lift coefficient curves for the airfoil with and without the NLPS were basically the same as each other. For the drag coefficient, the difference was larger only at the 19° angle of attack, and the drag coefficient of the airfoil with the NLPS was lower than that of the airfoil without the NLPS. This is because the airfoil was in a state of deep stall at the 19° angle of attack, and there was a large-scale flow separation at the tail edge of the airfoil. The NLPS could break the heavy scale separation and reduce the airfoil drag. But in general, the NLPS had a negligible effect on the aerodynamic performance of the airfoil.
Figure 11 shows the pressure coefficient (Cp) curve on the symmetrical surface of the airfoil section with and without the NLPS. It can be seen that the NLPS had little effect on the Cp distribution in the range of angles of attack of 0–15°. At the 19° angle of attack, the peak value of the Cp of the original airfoil was slightly higher, and similar results could also be found for the Cp distribution of the two models.
Figure 12 indicates the noise directivity distribution of the airfoil without the NLPS. Figure 12a shows the distribution of noise monitoring points, which were located on the inner symmetrical surface of the airfoil section. The airfoil was equipped with 36 monitoring points in a circle. Figure 12b presents the distribution of the noise directivity at different radius positions. Figure 12c shows the distribution of noise directivity for different angles of attack. Firstly, the directivity distribution of airfoil noise was distributed as a dipole. The noise could be subdivided into monopole, dipole, and quadrupole noise. The dipole noise was caused by the interaction of turbulence with the boundaries of objects. Therefore, the theoretical conclusions qualitatively verified the reliability of the calculation results. The magnitude of the sound pressure level (SPL) decreased with increases of the radius; therefore, the SPL was low far away from the noise source. Secondly, the amplitude of the SPL increased with increases of the angle of attack, and the plane of symmetry of the dipole distribution varied with the angle of attack.
Figure 13 presents the noise directivity distribution of the airfoil with and without the NLPS. At the 0° angle of attack, the SPL for the upper and lower surfaces of the airfoil with the NLPS was slightly increased by 2.4%, and the change in both the leading edge and the trailing edge of the airfoil was not obvious. At the 4° angle of attack, the most obvious change appeared at the trailing edge of the airfoil, and the decrease of the SPL for the airfoil with the NLPS reached 16%; however, at the 160° angle above the airfoil leading edge, the SPL was slightly increased, and the NLPS changed the SPL directional distribution of the airfoil in a circular range. From previous studies, it can be seen the trailing edge shedding vortices account for a large proportion of the main noise sources, especially at small angles of attack. The trailing edge vortex was the main noise source at the 4° angle of attack. The large-scale vortex was easily broken into a small eddy under the action of the NLPS, thus reducing the amplitude of the SPL and even affecting the directional distribution of the SPL in one circle of the airfoil. When the angle of attack was 8°, the directional distribution of the airfoil with and without the NLPS was consistent in one circle, and the average decrease of the SPL in one circle was about 8%. When the angle of attack was 11°, and the amplitude phase decreased by about 8%. At the same time, the angles of attack at 15° and 19° were similar to each other. The NLPS increased the SPL at the azimuth of the airfoil at 30°; at the other azimuth, the SPL was slightly reduced by 3.5% when the angle of attack was 15°; and at the other azimuth, the SPL changed less when the angle of attack was 19°. Because the airfoil was in a large-scale flow separation state at 15° and 19° and the main noise sources of the airfoil were turbulence separation noise, the trailing edge vortex noise occupied small components, and the NLPS had almost no effect on the large-scale flow separation. This was also the main reason why the noise value above the tailing edge of the airfoil increased under the angles of attack of 15° and 19°. However, the NLPS increased the noise intensity above the trailing edge due to the interference between the NLPS and the separated vortex.
Figure 14 indicates the Q isosurface and spectrum distribution at the monitoring point. The monitoring point was located at 1C downstream of the trailing edge from the airfoil center. The purpose of this section is to study the effect of the NLPS on the trailing edge vortex and the variation of the trailing edge vortex frequency. Firstly, when the angle of attack was 0°, the trailing edge vortices of an airfoil without the NLPS were very uniform in the spanwise direction and showed no sign of breakage. Under the action of the NLPS, the trailing edge vortices of airfoils with the NLPS broke up in the spanwise direction, but the effect of the NLPS was not obvious. From the spectrum of the trailing edge vortex, the main frequency of the trailing edge shedding vortices of airfoils with the NLPS was 630 Hz, while that of the airfoils without the NLPS was 400 Hz. The frequency of trailing edge shedding vortices of airfoils with the NLPS increased by 32.5% and had obvious main frequency peaks, and the amplitude was higher than that of airfoils without the NLPS. At the 4° angle of attack, the trailing edge of an airfoil without the NLPS had regular spanwise vortices, while the spanwise vortices of an airfoil with the NLPS broke up into smaller shedding vortices under the action of the NLPS. From the spectrum, there were obvious main frequency peaks and high-order harmonic frequencies in the trailing edge shedding vortices of airfoils without the NLPS, while there were no obvious main frequency peaks in the trailing edge shedding vortices of airfoils with the NLPS.
Figure 15 shows the isosurface of Q and the vorticity nephogram at the symmetric surface of the airfoil. At the 8° and 11° angles of attack, the complete vortex was formed along the trailing edge of the airfoil without the NLPS, and the corresponding vorticity nephogram shows that the spanwise vortex periodicity was downward. At this time, both the vortex scale and the radius of the vortex core were larger, indicating that the strength of the trailing edge vortex was greater. For the airfoil with the NLPS, the trailing edge shedding vortices interfered with the NLPS. Under the action of the NLPS, the trailing edge shedding vortices were broken into smaller scale vortices. The corresponding vorticity nephogram shows that the scale of the vortices was weakened at this time and the strength of the trailing edge shedding vortices was weakened, so the noise reduction effect of the NLPS at these two angles of attack was obvious. At the 15° and 19° angles of attack, large scale flow separation occurred on the tail edge of the upper surface. At this time, the large scale separation vortex was broken into a number of small vortices; the NLPS was in the separation area and did not play the role of breaking the direction of the vortex.
Figure 16 shows the sound pressure level (SPL) spectrum distribution of the monitoring point at the 0° angle of attack; Figure 16a presents the location of the monitoring points, and Figure 16b shows the SPL spectrum of the four monitoring points. From Figure 16b, it can be seen the SPL frequency main peak of the airfoil with the NLPS was slightly higher than that of the airfoil without the NLPS, which is consistent with the information reflected in Figure 14. The SPL amplitude of points B and D was lower than that of points A and C, which is also consistent with the dipole distribution of Figure 13. Generally, there was a consistent trend of the spectrum distribution of the SPL with and without the NLPS.
Figure 17 shows the sound pressure spectrum at different angles of attack of point A. It can be seen that the overall trend of the SPL spectrum with and without the NLPS was consistent at the 4° and 8° angles of attack. At the 4° angle of attack, the main peaks of SPL frequency and high order harmonic frequency with and without the NLPS were basically the same, but the SPL of the airfoil without the NLPS was higher than that of the airfoil with the NLPS in the main frequency region. Therefore, the decrease of the amplitude for the airfoil with the NLPS was larger. At the 8° angle of attack, the frequency main peaks and the higher order harmonic frequency of the airfoil with and without the NLPS were basically the same, but the frequency of the main frequency peak of the airfoil without the NLPS was slightly lower than that of the airfoil with the NLPS, and the main energy area was higher than that of the airfoil with the NLPS. When the angle of attack was 11°, there was a significant frequency peak in the SPL of the airfoil with the NLPS, but the SPL of the airfoil with the NLPS was slightly higher than that of the airfoil without the NLPS in the high frequency zone; however, the low frequency area contained less energy, so it had less influence on the total SPL. At the 15° and 19° angles of attack, the airfoil had a large scale flow separation; as such, the frequency distribution of the SPL had no obvious frequency peak, and the SPL of the airfoil with the NLPS was higher than that of the airfoil without the NLPS in the high frequency area, but the airfoil with NLPS had little influence on the total SPL.

4. Conclusions

In this study, a new type of lightning protection system was presented based on the mechanism of lightning. A high voltage discharge test and electrostatic field calculation for the NLPS were carried out, and the effect of the NLPS on the lightning protection efficiency of blades was studied. On this basis, the aerodynamic performance and aero-noise of the airfoil with and without the NLPS were calculated, and the effect of the NLPS on the aerodynamic and aero-noise performance of the airfoil was studied. The results of 10 discharge tests showed that for the blade without the NLPS, the 10 lightning attachment points were located near the trailing edge of the blade surface, causing blade damage. The damage rate of the blade without the NLPS was 100%, and the protection rate of the blade was 0%. For the blade with the NLPS, in 10 high voltage discharge tests, the lightning attachment points were all on the NLPS, so the blade was protected against lightning damage. The damage rate of the blade with the NLPS was zero, the lightning protection rate of the blade was 100%, and the lightning protection effect was improved.
The NLPS had little effect on the aerodynamic performance of blades, but it had an effect on the aero-noise. The aero-noise of the airfoil could be reduced at angles of attack of 4°, 8°, 11°, and 15°, but the influence of different phase angles of the airfoil on the amplitude of SPL varied. The aero-noise of the airfoil with the NLPS decreased by 16% and 8%, respectively, at angles of attack of 4° and 8°. In general, the designed NLPS met the desired requirements, but the process design was not considered. The high voltage discharge test had some limitations, and the number of discharges that could be performed in the laboratory was limited. Therefore, the protective effect of a lightning strike still needs to be further verified. In addition, the lightning protection device proposed in this paper needs to be further optimized in combination with the blade manufacturing process before it can be implemented in practice. Overall, the designed NLPS meets the expected requirements, but it still needs to be further optimized in combination with the blade manufacturing process. If this method or technology is applied to engineering practice, it can greatly reduce the lightning damage accident of wind turbine blades, improve the safety and stability of the wind turbine, increase the utilization rate of the wind turbine, and have great economic and social benefits.

Author Contributions

X.-k.L., J.-x.G., X.-m.C., K.Y., T.-y.H., and X.-d.W. conceived the research idea. X.-k.L., J.-x.G., X.-m.C., and T.-y.H. implemented the experiment scheme; X.-d.W. performed numerical simulation; X.-k.L., K.Y. and T.-y.H. analyzed data and numerical results. All authors contributed to the writing, editing and revising of this manuscript.

Funding

This research was funded by the National Natural Science Foundation of China, grant number 51806221 and development Plan of Key Scientific and Technological Projects of China Huadian Engineering Co., LTD (CHEC), grant number CHECKJ 19-02-03.

Conflicts of Interest

The authors declare no conflict of interest.

References

  1. Wang, Y.; Zhupanska, O.I. Lightning strike thermal damage model for glass fiber reinforced polymer matrix composites and its application to wind turbine blades. Compos. Struct. 2015, 132, 1182–1191. [Google Scholar] [CrossRef]
  2. Cummins, K.L.; Quick, M.G.; Rison, W. Overview of the Kansas windfarm 2013 field program. In Proceedings of the 23rd International Lightning Detection Conference, Tucson, AZ, USA, 18–19 March 2014. [Google Scholar]
  3. Ishii, M.; Saito, M.; Natsuno, D. Lightning current observed at wind turbines in winter in Japan. In Proceedings of the International Conference on Lightning and Static Electricity (ICOLSE), Seattle, WA, USA, 18–20 September 2013; pp. 136–137. [Google Scholar]
  4. Wang, D.; Takagi, N.; Watanabe, T. Observed characteristics of upward leaders that are initiated from a windmill and its lightning protection tower. Geophys. Res. Lett. 2008, 35, 15. [Google Scholar] [CrossRef]
  5. Myers, J.; Cummins, K.L.; Hutchinson, M.; Nag, A. Lightning attachment to wind turbines in Central Kansas: Video observations, correlation with the NLDN and in-situ peak current measurements. Eur. Wind Energy Assoc. EWEA 2013, 284–291. [Google Scholar]
  6. Candela, G.A.; Madsen, S.F.; Nissim, M.; Myers, J.D.; Holboell, J. Lightning damage to wind turbine blades from wind farms in the U.S. IEEE Trans. Power Deliv. 2016, 31, 10431–11049. [Google Scholar]
  7. IEC/TR. Wind Turbine Generator Systems-Part 24; International Electrotechnical Commission (IEC): Geneva, Switzerland, 2002; p. 24. [Google Scholar]
  8. Golde, R.H. Lightning; Academic Press: New York, NY, USA, 1977; pp. 444–445. [Google Scholar]
  9. Cooray, V. The Lightning Protection; Institution of Engineering and Technology: London, UK, 2010; pp. 1661–1667. [Google Scholar]
  10. Watanabe, Y. Switching surge flashover characteristics of extremely long air gaps. IEEE Trans. Power Appar. Syst. 1967, 86, 9339–9436. [Google Scholar] [CrossRef]
  11. Paris, L. Influence of air gap characteristics on line to ground switching surge strength. IEEE Trans. Power Appar. Syst. 1967, 86, 936–947. [Google Scholar] [CrossRef]
  12. Suzuki, T.; Miyake, K. Breakdown process of long air gaps with positive switching impulses. IEEE Trans. Power Appar. Syst. 1975, 94, 10211–11043. [Google Scholar] [CrossRef]
  13. Les, R.G. Research on long air gap discharges at Les Renardières. Electra 1972, 23, 1531–1557. [Google Scholar]
  14. Les, R.G. Research on long air gap discharges—1973 results. Electra 1974, 35, 47–155. [Google Scholar]
  15. Les, R.G. Positive discharges in long air gaps at Les Renardières—1975 results and conclusions. Electra 1977, 53, 311–352. [Google Scholar]
  16. Les, R.G. Negative discharges in long air gaps at Les Renardières—1978 results. Electra 1981, 74, 672–718. [Google Scholar]
  17. Qian, G.J.; Wang, X.Y.; Yan, J. The lightning shielding simulation theory and test technology. High Volt. Eng. 1998, 24, 263–271. [Google Scholar]
  18. Yokoyama, S. Lightning protection of wind turbine generation systems. In Proceedings of the IEEE 7th Asia-Pacific International Conference on Lightning (APL), Chengdu, China, 1–4 November 2011; pp. 9419–9447. [Google Scholar]
  19. Garolera, A.C.; Holboell, J.; Madsen, S.F. Lightning attachment to wind turbine surfaces affected by internal blade conditions. In Proceedings of the IEEE 2012 International Conference on Lightning Protection (ICLP), Vienna, Austria, 2–7 September 2012; p. 17. [Google Scholar]
  20. Radičević, B.M.; Savić, M.S.; Badea, I. Impact of wind turbine blade rotation on the lightning strike incidence. In Proceedings of the IEEE 2012 International Conference on Lightning Protection (ICLP), Vienna, Austria, 2–7 September 2012; p. 19. [Google Scholar]
  21. Radičević, B.M.; Savić, M.S.; Madsen, S.F. Impact of wind turbine blade rotation on the lightning strike incidence–A theoretical and experimental study using a reduced-size model. Energy 2012, 45, 6446–6454. [Google Scholar] [CrossRef]
  22. Peesapati, V.; Cotton, I. Lightning protection of wind turbines—A comparison of real lightning strike data and finite element lightning attachment analysis. Sustain power generation and supply. In Proceedings of the 2009 International Conference on Sustainable Power Generation and Supply (SUPERGEN ’09), Nanjing, China, 6–7 April 2009; p. 18. [Google Scholar]
  23. Rafael, B.R.; Victor, M.F.M.; João, P.S.C. Analysis of transient phenomena due to a direct lightning strike on a wind energy system. Energies 2012, 5, 2545–2558. [Google Scholar] [CrossRef]
  24. Le, P.F.; Aspas-Puertolas, J. Electrostatic field and lightning zoning analysis of a windmill: Study of current and innovative protection strategies. In Proceedings of the IEEE 2014 International Conference on Lightning Protection (ICLP), Shangai, China, 11–18 October 2014; pp. 6596–6666. [Google Scholar]
  25. Madsen, S.F.; Mieritz, C.F.; Candela, G.A. Numerical tools for lightning protection of wind turbines. In Proceedings of the 2013 International Conference on Lightning and Static Electricity, Seattle, WA, USA, 18–20 September 2013. [Google Scholar]
  26. Wen, X.H.; Qu, L.; Wang, Y.; Chen, X.Y.; Lan, L.; Si, T.J.; Xu, J.W. Effect of wind turbine blade rotation on triggering lightning: An experimental study. Energies 2016, 9, 1029. [Google Scholar] [CrossRef]
  27. Zhang, L.; Wang, G.Z.; Zhang, W.F.; Ma, Y.F.; Guo, Z.X.; Li, Q.M. An electro-geometric model for lightning shielding of multiple wind turbines. Energies 2017, 10, 1272. [Google Scholar] [CrossRef]
  28. Zhou, Q.; Liu, C.; Bian, X.; Lo, K.L.; Li, D. Numerical analysis of lightning attachment to wind turbine blade. Renew. Energy 2018, 116, 5849–5853. [Google Scholar] [CrossRef]
  29. Yan, J.; Li, Q.; Guo, Z. Puncture position on wind turbine blades and arc path evolution under lightning strikes. Mater. Des. 2017, 122, 1972–1975. [Google Scholar] [CrossRef]
  30. Wang, Y.; Zhupanska, O.I. Estimation of the electric fields and dielectric breakdown in non-conductive wind turbine blades subjected to a lightning stepped leader. Wind Energy 2017, 20, 9274–9282. [Google Scholar] [CrossRef]
  31. Tomimatsu, S.; Fujisawa, N. Measurement of aerodynamic noise and unsteady flow field around a symmetrical airfoil. J. Vis. 2002, 5, 3813–3888. [Google Scholar] [CrossRef]
  32. Munekata, M.; Koshiishi, R.; Yoshikawa, H.; Ohba, H. An experimental study on aerodynamic sound generated from wake interaction of circular cylinder and airfoil with attack angle in tandem. J. Therm. Sci. 2008, 17, 2122–2217. [Google Scholar] [CrossRef]
  33. Kim, H.J.; Lee, S.; Fujisawa, N. Computation of unsteady flow and aerodynamic noise of NACA0018 airfoil using large-eddy simulation. Int. J. Heat Fluid Flow 2006, 27, 2292–2342. [Google Scholar] [CrossRef]
  34. Peixun, Y.U.; Junqiang BA, I.; Jiangtao, H.; Shu, J. Aerodynamic noise of the rod-airfoil computed by using acoustic analogy. Acta Aerodyn. Sin. 2013, 31, 2042–2108. [Google Scholar]
  35. Chen, Y.Q.; Fang, Y.F. Research on improved method of wind turbine Airfoil S834 based on noise and aerodynamic performance. Appl. Mech. Mater. 2015, 744, 2532–2558. [Google Scholar] [CrossRef]
  36. Liu, S.; Li, X.; He, C.; Wu, K.; Ye, S.; Wang, Y. Hybrid RANS/LES simulation and optizimation of aerodynamic noise of wind turbine. In Proceedings of the ISFMFE-International Symposium on Fluid Machinery & Fluid Engineering, Wuhan, China, 22–25 October 2014. [Google Scholar]
  37. Wang, J.; Zhang, C.; Wu, Z.; Wharton, J.; Ren, L. Numerical study on reduction of aerodynamic noise around an airfoil with biomimetic structures. J. Sound Vib. 2017, 394, 465–468. [Google Scholar] [CrossRef]
  38. Andrew, B.; Anupam, S. Numerical investigation of noise reduction mechanisms in a bio-inspired airfoil. J. Sound Vib. 2019, 453, 3143–3227. [Google Scholar]
  39. Yannick, D.M.; Benshuai, L.; Hasan, K.J.; Mahdi, A. A semi-analytical noise prediction model for airfoils with serrated trailing edges. Renew. Energy 2019, 143, 6796–6891. [Google Scholar]
  40. Jie, S.; Hang, L.; Dai, Z.; Zhaolong, H.; Yan, B.; Hongbo, Z.; Lei, Z. Aerodynamic noise assessment for a vertical axis wind turbine using improved delayed detached eddy simulation. Renew. Energy 2019, 141, 5595–5769. [Google Scholar] [CrossRef]
  41. Xinkai, L.; Ke, Y.; Hao, H.; Xiaodong, W.; Shun, K. Effect of tailing-edge thickness on aerodynamic noise for wind turbine airfoil. Energies 2019, 12, 270. [Google Scholar] [CrossRef]
  42. Chari, M.V.K.; Konrad, A.; D’Angelo, J. Finite element computation of three-dimensional electrostatic and magnetostatic field problem. IEEE Trans. Magn. 2003, 19, 23212–23324. [Google Scholar] [CrossRef]
Figure 1. Lightning damage of wind turbine blades (Picture source: Blade manufacturers).
Electronics 08 01020 g001
Figure 2. Lightning protection system recommended by IEC/TR 61400-24.
Electronics 08 01020 g002
Figure 3. Experimental geometric model.
Electronics 08 01020 g003
Figure 4. Experimental device.
Electronics 08 01020 g004
Figure 5. Computing geometric models (a) and computational mesh (b).
Electronics 08 01020 g005
Figure 6. High voltage discharge test results.
Electronics 08 01020 g006
Figure 7. Distribution of space potential.
Electronics 08 01020 g007
Figure 8. Cloud map of electric field intensity around the airfoil.
Electronics 08 01020 g008
Figure 9. Lift coefficient curve (a), and drag coefficient curve (b) of DU93-W-210 airfoil.
Electronics 08 01020 g009
Figure 10. Aerodynamic performance comparison of the airfoil with and without the NLPS.
Electronics 08 01020 g010
Figure 11. Cp distribution of the airfoil with and without the NLPS.
Electronics 08 01020 g011
Figure 12. Noise directivity distribution of the airfoil without the NLPS.
Electronics 08 01020 g012
Figure 13. The directivity distribution of airfoil noise with and without the NLPS.
Electronics 08 01020 g013
Figure 14. Isosurface of Q and spectrum distribution at monitoring points.
Electronics 08 01020 g014
Figure 15. Isosurface of Q (a,b) and vorticity cloud diagram (c,d) at the symmetric plane. (a,c) are original; (b,d) are modified.
Electronics 08 01020 g015aElectronics 08 01020 g015b
Figure 16. Sound pressure spectrum at the monitoring point; the AOA is 0°.
Electronics 08 01020 g016
Figure 17. Sound pressure spectrum at monitoring point A.
Electronics 08 01020 g017
Table 1. The result of the discharge test under the negative standard lightning impulse voltage.
Test ModelThe Position of Lightning Attachment (time)Damage Rate of Blade (%)Protection Rate of Blade (%)
Surface of BladeMetal TipExternal Copper Wire (NLPS)
Original10001000
Modified00100100

