Article

Improved Heart-Rate Measurement from Mobile Face Videos

Department of Electronic Engineering, Pukyong National University, 45 Yongso-ro, Nam-gu, Busan 48513, Korea
*
Author to whom correspondence should be addressed.
Electronics 2019, 8(6), 663; https://doi.org/10.3390/electronics8060663
Submission received: 9 May 2019 / Revised: 10 June 2019 / Accepted: 10 June 2019 / Published: 12 June 2019
(This article belongs to the Special Issue Electronic Solutions for Artificial Intelligence Healthcare)

Abstract

:
Newtonian reaction to blood influx into the head at each heartbeat causes subtle head motion at the same frequency as the heartbeats. Thus, this head motion can be used to estimate the heart rate. Several studies have shown that heart rates can be measured accurately by tracking head motion using a desktop computer with a static camera. However, implementation of vision-based head motion tracking on smartphones demonstrated limited accuracy due to the hand-shaking problem caused by the non-static camera. The hand-shaking problem could not be handled effectively with only the frontal camera images. It also required a more accurate method to measure the periodicity of noisy signals. Therefore, this study proposes an improved head-motion-based heart-rate monitoring system using smartphones. To address the hand-shaking problem, the proposed system leverages the front and rear cameras available in most smartphones and dedicates each camera to tracking facial features that correspond to head motion and background features that correspond to hand-shaking. Then, the locations of facial features are adjusted using the average point of the background features. In addition, a correlation-based signal periodicity computation method is proposed to accurately separate the true heart-rate-related component from the head motion signal. The proposed system demonstrates improved accuracy (i.e., lower mean errors in heart-rate measurement) compared to conventional head-motion-based systems, and the accuracy is sufficient for daily heart-rate monitoring.

1. Introduction

Human health is a very important factor for the development and progress of society. Home or personal healthcare technologies can resolve the inconvenience of visiting a medical office and help users to handle their health conditions well [1,2].
As one of the home or personal healthcare technologies, daily monitoring of vital signs, such as blood pressure and heart rate, is important to prevent and manage various conditions, and patients who have their vital signs monitored are more likely to take control of their health [3]. Imbalance or variation in heart rate may be a symptom of heart-related diseases, which are the primary cause of mortality worldwide [4]. Thus, developing effective daily heart-rate monitoring systems that allow at risk and elderly populations to recognize potential heart-related diseases in early or curable stages is critical.
The heart rate has been estimated using electrical or electronic sensors, such as electrocardiogram sensors [5], oximeters [6], ultrasound sensors [7], thermal imaging sensors [8], and micro-impulse radar [9]. In addition, commercially available wearable devices, such as watches [10], rings, gloves [11], smart chairs and car seats [12,13,14], and chest and ankle belts [15,16,17], have also been used to estimate the heart rate. However, such equipment is not commonly available or not always accessible in daily life. In addition, some equipment can harm to the body [18], or can cause rashes or discomfort when used for long periods [19].
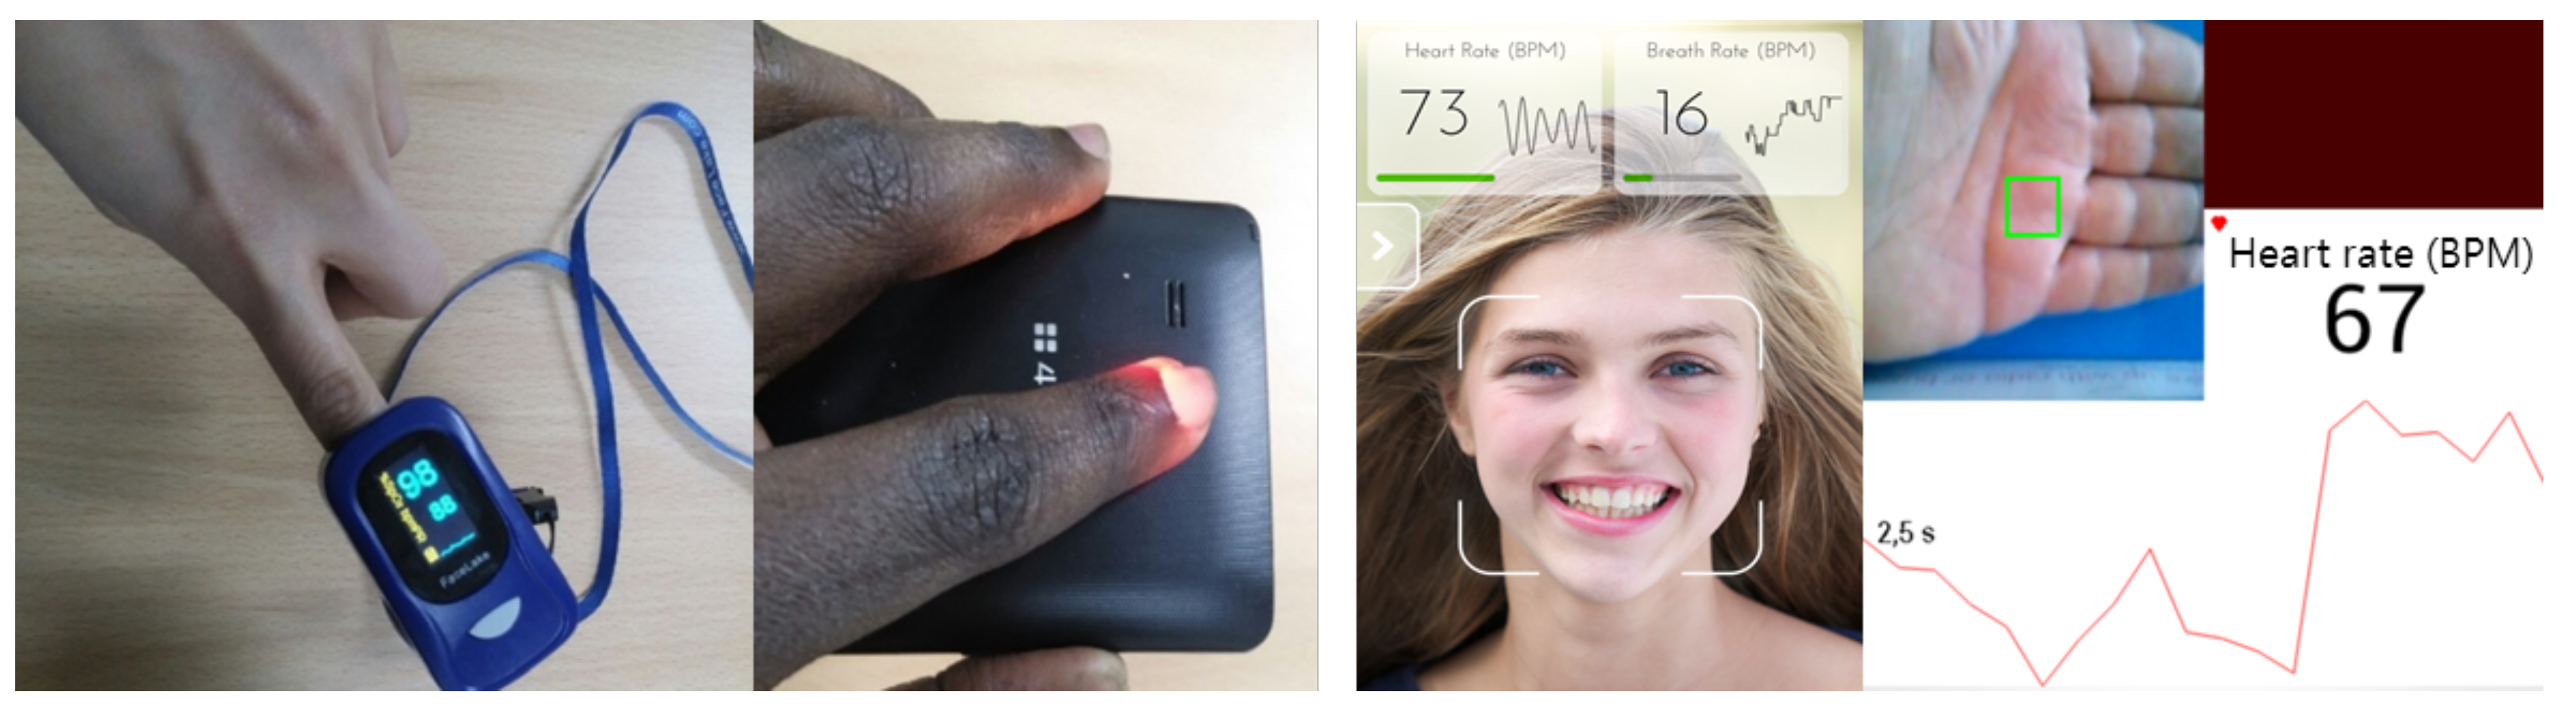
Currently, low-cost and high-resolution cameras are widely available. Thus, many previous studies have proposed heart-rate estimation approaches using video input. These approaches can be classified as touchless [20,21,22,23,24,25] and touch-based monitoring systems [26,27] (Figure 1). Detailed reviews of vision-based heart-rate monitoring systems are available in the literature [28,29]. Touch-based systems use the same framework as oximeters [6], i.e., photoplethysmography (PPG) light intensity analysis. A photoplethysmogram is obtained as follows. The patient places a fingertip between a light source and a camera. Then, the camera measures the light intensity in each frame. The concept behind this is that, at each heartbeat, blood is pushed from the heart to extremities, such as earlobes or fingertips, causing more light to be absorbed by the blood, which results in darker frames. The blood circulates back to the heart through the venous system, which results in brighter frames. The cyclic variation of blood volume in the fingertip is converted to a signal used to estimate the heart rate. Touch-based systems are generally accurate and efficient, and are less sensitive to environmental conditions, such as camera specifications and changes in lighting conditions. However, touch-based systems require touching the lens surface and an LED lamp, which can smear the lens surface and cause heat pain or discomfort [23].
To eliminate such problems, touchless methods track a body part (typically the face), do not require physical contact with a device, and extract features (color or motion) that are used to estimate the heart rate. In a previous study, Poh et al. measured subtle skin color changes remotely to extract heart-rate signals [20]. Their method is similar to PPG-based approaches in that it exploits color intensity changes caused by variations in blood volume. However, color-based touchless methods are sensitive to motion artifacts caused by subject movement or changes in environmental illumination; thus, they tend to be less accurate [21,24].
A desktop-based touchless system that tracks patient head motion from video input to estimate the heart rate has been proposed previously [21]. In another study, 3D head motion was tracked using a depth sensor [22]. That approach, referred to as ballistocardiography (BCG), was based on the fact that the influx of blood through the carotid artery causes a Newtonian reaction that results in subtle head motion (approximately 5 mm) that can be used to determine the heart rate. Motion-based touchless methods use image features invariant to light changes and well-designed signal processing algorithms to provide more accurate heart-rate measurements than the color-based methods. Lomaliza and Park [23] adapted this approach to run on a smartphone. Unlike a desktop with a static camera, with a smartphone, hand movements can shake the camera. Lomaliza and Park proposed specifying regions of interest (ROI) in the camera frame and tracking background and facial features simultaneously (Figure 2). They used background features to estimate rigid motion between two consecutive frames, thereby negating signal noises caused by the hand-shaking problem on time-series locations of facial features. However, their system was insufficiently reliable for practical use. The rigid motion estimation suffered from ambiguity between rotation and translation motions, and, to extract background features, the system had to be run in landscape mode and the head had to be more than 30 cm away from the camera. However, even in the landscape mode, it was impossible to extract sufficient background features from small ROIs to ensure robust motion estimation. Furthermore, compared to portrait mode, facial features were tracked at lower resolution. In addition, Lomaliza and Park used a previously proposed signal selection method [21] without modification. They attempted to separate out the most periodic principal signal component at a frequency range of 0.75–5 Hz, and periodicity was quantified as the percentage of the total spectral power accounted for by the frequency at maximum power and its first harmonic. However, that method often failed to select the true heart-rate signal because the signal extracted from the smartphone-based system was noisier than the signal extracted from the desktop-based system with a static camera. To improve the power spectrum estimation of the noisy signal, it may be possible to use Welch’s method [30]; however, in preliminary experiments, we found that Welch’s method was not helpful.
In this paper, we propose a touchless, BCG-based heart-rate monitoring system that reliably runs on a smartphone. To improve heart-rate measurement accuracy (in this paper, the system accuracy is represented with errors in measurement), the proposed system uses two cameras (i.e., the front and rear cameras on dual-camera smartphones) and addresses the problems inherent in the previous system [23]. Compared to the previous method, the proposed method realizes the following.
-
Accurate tracking of background features in portrait mode at higher resolution
-
More robust computation of signal periodicity in the spatial domain
-
Isolation of head motion from hand-shaking movements without rotation–translation ambiguity
Note that a dual camera system has been reported [31]. However, that system differs from the proposed system in that only the rear camera was used to measure heart rate, and the front camera was used to measure the breathing rate. In addition, touch-based and PPG-based methods were used to measure the heart rate.

2. Proposed System

The proposed system attempts to improve the existing system [23] by addressing the hand-shaking and signal selection problems.

2.1. Proposed System Process Flow

The process flow of the proposed system is shown in Figure 3. Except for two processes, i.e., hand-shaking handling using dual cameras and the correlation-based signal periodicity computation for signal selection (which will be explained in detail in the subsequent sections), the process flow is the same as that in previous studies [21,23]. The process flow is summarized as follows. First, two camera images are obtained and facial/background features are tracked. Second, the hand-shaking-free head motion signal is extracted from the tracked features. Third, the signal is enhanced by applying a bandpass filter. Fourth, the five most principal components are extracted from the enhanced signal. Fifth, the most periodic component signal is selected. Finally, the heart rate is computed from the selected signal.

2.2. Improved Hand-Shaking Handling

To address the hand-shaking problem that occurs with smartphones, we propose using both the front and rear cameras available in most smartphones to track background and facial features simultaneously (Figure 4). By using the rear camera to track only the background features, more features can be tracked robustly. This differs from the previous method [23] that used restricted ROIs. In addition, by using the entire frame of the front camera to track only facial features in portrait mode, features can be tracked more robustly at closer range (lower than 20 cm from the camera).
Note that three issues must be addressed to use both the front and rear cameras. First, to ensure that pixel sizes are approximately equal, both cameras should be set to equal resolution; otherwise, the magnitude of motions in both cameras should be rescaled with calibration. Second, both cameras must be synchronized. For soft synchronization, both cameras are set to run at the maximum frame rate (approximately 30 Hz), and the data sampling rate is set to a lower frequency (20 Hz) than the frame rate of both cameras. Thus, the data extracted from both cameras will have the same timestamp. Third, using two cameras can reduce operating speed; however, most Android devices support multi-threading, which enables several frames to be processed simultaneously. In addition, the proposed system is implemented with a queue-structured frame flow such that processed frames can be released from memory as soon as the calculations are complete. Thus, the proposed system’s operating speed is maintained and it can run in real time.
In our preliminary experiments, we observed that the previous method [23] to estimate the rigid motion between consecutive frames did not always yield the well-scaled motion parameters required to correct the hand-shaking problem effectively. This appears to be due to ambiguity between rotation and translation [32], which implies that other state-of-the-art methods [33] are ineffective. In addition, computationally-intensive methods on mobile platforms are ineffective. We also noted that, in response to hand-shaking, the average point (mass center in Figure 4) of all background features was stably located; thus, in the proposed system, rather than computing the locations of facial feature points relative to the frame origin, the proposed method computes the locations of facial feature points relative to the average point of the background features. The relative motion between facial features and the average point can isolate the head motion from the hand-shaking movements without ambiguity. Note that the proposed method only measures the vertical displacement of the head to compute heart rates. Therefore, we are only interested in hand-shaking that affects the displacement value; thus, we assume that hand-shaking involves only vertical translational movements.
Figure 5 shows the average magnitude spectrum of 20 different signals that recorded the vertical movement of the average point for 12.8 s. To remove noise, the proposed method employs a bandpass filter [21,23]. As shown in Figure 5, hand-shaking demonstrates many frequencies within the passband [0.75, 5] Hz. Thus, hand-shaking noise can bypass the filtering process and must be removed explicitly by subtracting the movement.

2.3. Improved Signal Selection

We propose a periodicity computation approach for signal selection. First, fast Fourier transform is applied to the first five principal components ( s i ) of the head motion signal. Then, the maximum period ( T i ) is computed from their maximum frequencies ( f i ) as T i = f s / f i , where f s is the data sampling rate. The maximum period is used to compute a lagged version s i for each s i such that:
s i ( t ) = s i ( t + T i ) mod N ,
where N is the number of data samples (the product of data sampling rate and video length). Finally, the periodicity of signal s i is computed by the bivariate correlation with its lagged version s i as follows:
c o r r ( s i ( t ) , s i ( t ) ) = k = 1 N s i ( k T s ) s i ¯ s i ( k T s ) s i ¯ k = 1 N s i ( k T s ) s i ¯ 2 k = 1 N s i ( k T s ) s i ¯ 2 .
Here, T s is the data sampling period, s i ¯ and s i ¯ are the sample means. This approach implies that a periodic signal will tend to lag relative to the length of its maximum period.

3. Experimental Results and Discussion

An LG G5 (LGE LG-F700L) (although the proposed method could also be implemented on iOS devices, it was only implemented and evaluated on an Android device in this study) smartphone was used for the system analysis. The camera resolution was set to 800 × 480 pixels for the rear and front cameras, and the data sampling rate was set to 20 fps, which is the frequency at which the current frames were captured simultaneously by both cameras. The frames were recorded in MPEG-4 video format for 12.5 s. As a reference measurement tool, the Polar H7 heart-rate sensor [10] was used. For feature detection/tracking, the Harris corner detector and the optical flow tracker included in the OpenCV library [34] were used [21,23].
Fifteen healthy participants (22 to 35 years) with different skin tones and genders took part in the experiment. Their heart rates in beats per minute (BPM) were measured several times in a sitting position after performing various activities, such as resting and light/hard exercising with a long interval between measurements. The participants were required to relax but refrain from moving their heads and hands if possible during each measurement. The experiment was conducted under three different illumination conditions, i.e., indoor daytime (artificial lights inside the room and sunlight), outside daytime (sunlight), and indoor nighttime (artificial lights). See Figure 6 for some examples.
In the following tables and figures, M1, M2 and M3 represent a system with the proposed hand-shaking handling method, a system without hand-shaking handling that focuses on tracking facial features at close distance (high resolution) [21], and a system with the previously proposed hand-shaking handling method [23], respectively. P1 is the previously proposed signal periodicity computation method [21] based on the percentage of total spectral power accounted for by the frequency with maximum power and its first harmonic, and P2 is the proposed correlation-based method. Therefore, “M2 and P1” and “M3 and P1” indicate the very previous systems, [21,23], respectively. Note that M1 and M2 work in portrait camera mode, and M3 works in landscape mode. Therefore, in M1 and M2, the face fully occupies the camera frame and can be tracked at a higher resolution than in M3.

3.1. Effect of Hand-Shaking Handling with Proposed Method

To demonstrate the effect of hand-shaking handling, we analyzed the signal spectrums and the errors of the estimated heart rates, for before and after hand-shaking handling. Figure 7 and Figure 8 show an example. As shown in Figure 7a, the hand-shaking noise has frequencies of approximately 0.703, 0.93, and 1.35 Hz. Although the frequencies of approximately 0.703 Hz can be filtered out by the bandpass filter, the others cannot be filtered and appear in the spectrum of the selected principal component signals (Figure 7b–d). As shown in Figure 7b, where the principal component signal was selected using P1, the frequency of 0.93 Hz has the greatest magnitude. Note that, in the peak detection and heart-rate estimation step, the resulting heart rate is almost determined by the frequency with the greatest magnitude. In other words, since the peaks were found one by one in a period of 1/0.93 s (Figure 8a), the heart rate (51 BPM = 0.85 Hz) obtained by averaging the elapsed times between adjacent peaks did not differ significantly from the highest frequency. Consequently, it was evident that the resulting heart rate is largely influenced by hand-shaking noise. Even in Figure 7c, where the principal component signal was selected using P2, which differs from that selected using P1, the hand-shaking noise makes the frequency of 1.09 Hz the greatest; however, the greatest frequency is still distant from the true heart-rate frequency (1.33 Hz). However, as shown in Figure 7d, by suppressing the hand-shaking noise using M1 (i.e., by explicitly subtracting the vertical movement of the background average point), both signal selection methods (using P1 and P2, respectively) selected the same principal component signal with the highest frequency (1.4 Hz), similar to the true heart-rate frequency. Thus, the heart rate was estimated correctly, as shown in Figure 8c.
The hand-shaking noise can be suppressed by M3; however, the performance was unacceptable, which was the motivation of this study, and will be evaluated in the heart-rate computation results.

3.2. Superiority of Proposed Signal Periodicity Computation Method

Differing from Figure 7d, where both signal selection methods (using P1 and P2, respectively) successfully selected the correct principal component signal, the P1 method often failed to select the correct principal component signal despite suppressing the hand-shaking noise. Figure 9 shows an example. Figure 9a–e represent the magnitude spectrum of the first five principal component signals extracted from a head motion signal. The P1 method selected the signal of Figure 9c because its periodicity index was highest (9.3%), while the P2 method selected that of Figure 9d where the correlation-based periodicity index was the highest (26.71%). In the two selected principal component signals, the frequency with the maximum magnitude differed significantly, and the heart rate computed from Figure 9d was much closer to the ground truth. Consequently, only the P2 method successfully selected the correct principal component signal. As can be seen in Figure 9, the periodicity indices computed by P1 have low variance (i.e., the highest periodicity index does not differ significantly from the others). We consider that the low variance caused P1 to be susceptible to noise and frequently fail to select the correct principal component signal. On the other hand, it is evident that the periodicity indices computed by P2 are much more discriminative.

3.3. Heart-Rate Computation Results

Heart rates were measured using different hand-shaking handling and signal periodicity computation methods. Table 1, Table 2 and Table 3 show the results for a subject at rest and after light and strenuous exercise. Table 4 and Table 5 show the results (mean of those obtained under different illumination conditions) of three subjects at rest and after strenuous exercise, respectively. Figure 10 shows the mean of the results for all subjects, activities and illumination conditions. As can be seen, the proposed hand-shaking handling method (M1) demonstrates the most consistent and accurate results across different illumination conditions. Note that this trend was observed among different subjects and activities. Furthermore, the proposed periodicity computation method (P2) proved to better select the signal component relative to the true heart rate than the previously proposed method [21]. Thus, using the proposed periodicity computation method, the mean error was reduced by approximately 5–7 BPM in the proposed system and approximately 3–6 BPM in the existing systems [21,23]. The proposed system (M1 and P2) could measure the heart rate with a mean error less than 1.5 BPM and was sufficiently accurate for use in daily heart-rate monitoring. In contrast, the other systems that used either or neither of the M1 and P2 methods demonstrated much higher errors (5–10 BPM on average). For all systems, the influence of the illumination condition was not recognizable because there was no light intensity variation over the short heart-rate measurement period (12.5 s) and similar feature tracking performance could be maintained.
It is noticeable that the results of M2 were better than those of M3, which indicates that high-resolution feature tracking without hand-shaking handling with the camera placed close to the face can be better than feature tracking at a lower resolution with hand-shaking handling. In other words, obtaining high-resolution face images may be more important than addressing the hand-shaking problem. This was also observable in the previous study [23] and appears to be the primary reason why the previous system suffered from low accuracy and low robustness despite addressing the hand-shaking problem to some extent. In this context, it was evident that the proposed dual camera system which realizes high-resolution tracking of both the facial and background features, was advantageous for head-motion-based heart-rate estimation in mobile scenarios and was required for hand-shaking handling.
For practical use, it would be desirable to compute the heart rate without saving/gathering frames in advance by tracking the facial and background features in real time. Thus, we analyzed the feature tracking time of each system and found a noticeable difference because M1 and M3 allow additional background feature tracking for hand-shaking handling and M1 uses two cameras rather than one. In our experiments, M1, M2, and M3 took 50.636, 19.175, and 23.560 ms per frame, respectively. Therefore, M2 and M3 can effectively work in real time because the feature tracking time was much shorter than the data sampling interval (50 ms). In contrast, the feature tracking time of M1 was not short and was similar to the data sampling interval. Therefore, in M1, incoming frames were saved in a small queue, while features were tracked in the saved frames via multi-threading. With this scheme, features could be tracked in real time using M1. Consequently, the computational overhead caused by using two cameras was negligible.

3.4. Discussion

Through the experiments, we separately evaluated the performance of the proposed hand-shaking handling method (M1) and periodicity computation method (P2). Both methods improved accuracy compared to the previous methods. However, only the proposed system using both methods together was reliable and demonstrated accuracy sufficient for daily heart-rate monitoring (Figure 10). This was consistent (or the difference in performance was not recognizable) across different illumination conditions, subjects, and activities. This is the primary contribution of this study.
On mobile platforms, such as smartphone, it was evident that the hand-shaking problem should be resolved (Figure 10 compares the mean errors of “M1 and P2” and “M2 and P2”). However, in the previous study [23], where only the front camera was used, it was required that the head be tracked at a distance, which made accuracy and robustness less than not addressing the hand-shaking problem. At this point, we consider that the previous study [23] first raised the necessity of the hand-shaking handling but failed to provide an effective solution. In contrast, the proposed hand-shaking handling method allows the head to be tracked at close range and, to accurately measure the hand-shaking noise, attempts to track background features at higher resolution than the previous study [23]. For this purpose, using both the front and rear cameras was advantageous and necessary.
Despite managing to suppress the hand-shaking noise, the head motion signal was still noisier than that acquired from a static camera, as in the previous study [21]. However, this was overlooked, and the conventional periodicity computation method was used for signal selection in the previous study [23]. In our experiments, the conventional periodicity computation method was highly vulnerable to noisy signals (see the mean errors of “M1 and P1” in Figure 10). In contrast, the proposed correlation-based method can robustly compute the periodicity of noisy signals (see the mean errors of “M1 and P2” in Figure 10), worked well for signals where hand-shaking noise was not suppressed, and enabled heart-rate computation with quite high accuracy (the mean errors of “M2 and P2” were lower than 5 BPM (Figure 10)).

4. Conclusions

In this study, to address the limitations of previous heart-rate monitoring systems, we have developed a practical head-motion-based (i.e., BCG-based) heart-rate monitoring system that can run on smartphones. The proposed method employs a dual camera system, where the front and rear cameras track facial features and background features, respectively. Here, the head and hand-shaking movements can be measured more accurately by tracking a greater number of facial and background features at higher resolution. We have also proposed a method to negate hand-shaking movement that involves computing the relative motion between facial features and the average point of the background features. Here, we assume that hand-shaking involves only vertical translational movements. Finally, an autocorrelation-based signal periodicity computation method has been proposed to enable hidden heart-rate-related signals to be separated from noisy head-motion signals accurately. Compared to previous systems, the proposed system demonstrated more accurate (i.e., lower mean errors in heart-rate measurement) and consistent results, and the accuracy was sufficient for practical heart-rate monitoring. To the best of our knowledge, the proposed system is the only BCG-based heart-rate monitoring system that runs reliably on a smartphone.
Note that we forced the front and rear cameras to run at the same resolution and at maximum frame rates in this study. Therefore, in future, we intend to develop an effective calibration method to rescale and synchronize the signals extracted from two different cameras. The proposed system assumes that users attempt to restrict hand and head movements as much as possible. Such movements are a common weakness of head-motion-based systems [29]. To improve the usability of the proposed system, it would be more effective to allow users to move their hands and head to some extent. However, this requires a method to discriminate between voluntary and involuntary movements (such as a previously proposed method used in a desktop system [25]), and this will also be a focus of future work.

Author Contributions

Conceptualization, J.-P.L. and H.P.; funding acquisition, H.P.; methodology, J.-P.L.; software, J.-P.L.; supervision, H.P.; validation, J.-P.L. and H.P.; writing—original draft, J.-P.L.; writing—review and editing, H.P.

Funding

This research was supported by Basic Science Research Program through the National Research Foundation of Korea (NRF) funded by the Ministry of Education (NRF-2018R1D1A1B07045650).

Conflicts of Interest

The authors declare no conflict of interest.

References

  1. Huh, J.-H.; Kim, T.-J. A location-based mobile health care facility search system for senior citizens. J. Supercomput. 2019, 75, 1831–1848. [Google Scholar] [CrossRef]
  2. Choi, J.-H.; Huh, J.-H.; Weon, S. A design of scheduling program for diabetic patients: A software engineering approach. LNEE 2017, 474, 198–203. [Google Scholar]
  3. Home Health Monitoring May Significantly Improve Blood Pressure Control. Available online: https://news.microsoft.com/2010/05/21/ (accessed on 9 May 2019).
  4. The Top 10 Causes of Death. Available online: http://www.who.int/mediacentre/factsheets/fs310/en/ (accessed on 9 May 2019).
  5. Arcelus, A.; Sardar, M.; Mihailidis, A. Design of a capacitive ECG sensor for unobtrusive heart rate measurements. In Proceedings of the IEEE International Instrumentation and Measurement Technology Conference, Minneapolis, MN, USA, 6–9 May 2013. [Google Scholar]
  6. Leonard, P.; Grubb, N.; Addison, P.; Clifton, D.; Watson, J. An algorithm for the detection of individual breaths from the pulse oximeter waveform. J. Clin. Monit. Comput. 2004, 18, 309–312. [Google Scholar] [CrossRef] [PubMed]
  7. Holdsworth, D.W. Characterization of blood-flow waveforms in normal human subjects. Physiol. Meas. 1999, 20, 219–240. [Google Scholar] [CrossRef]
  8. Garbey, M.; Sun, N.; Merla, A.; Pavlidis, I. Contact-free measurement of cardiac pulse based on the analysis of thermal imagery. IEEE Trans. Biomed. Eng. 2007, 54, 1418–1426. [Google Scholar] [CrossRef]
  9. Michachelles, F.; Wicki, R.; Schiele, B. Less contact: Heart-rate detection without even touching the user. In Proceedings of the Eighth International Symposium on Wearable Computers, Arlington, VA, USA, 31 October–3 November 2004; pp. 4–7. [Google Scholar]
  10. Polar Electro. Available online: https://www.polar.com/en (accessed on 9 May 2019).
  11. Zheng, Y.-L.; Ding, X.-R.; Poon, C.C.Y.; Lo, B.P.L.; Zhang, H.; Zhou, X.-L.; Yang, G.-Z.; Zhao, N.; Zhang, Y.-T. Unobtrusive sensing and wearable devices for health informatics. IEEE Trans. Biomed. Eng. 2014, 61, 1538–1554. [Google Scholar] [CrossRef]
  12. Wu, K.-F.; Chan, C.-H.; Zhang, Y.-T. Contactless and cuffless monitoring of blood pressure on a chair using e-textile materials. In Proceedings of the IEEE/EMBS International Summer School on Medical Devices and Biosensors, Cambridge, MA, USA, 4–6 September 2006; pp. 98–100. [Google Scholar]
  13. Baek, H.; Chung, G.; Kim, K.; Park, K. A smart health monitoring chair for nonintrusive measurement of biological signals. IEEE Trans. Inf. Technol. Biomed. 2012, 16, 150–158. [Google Scholar] [CrossRef]
  14. Walter, M.; Eilebrecht, B.; Wartzek, T.; Leonhardt, S. The smart car seat: Personalized monitoring of vital signs in automotive applications. Pers. Ubiquitous Comput. 2011, 15, 707–715. [Google Scholar] [CrossRef]
  15. Muaremi, A.; Armich, B.; Troster, G. Towards measuring stress with smartphones and wearable devices during workday and sleep. BioNanoScience 2013, 3, 172–183. [Google Scholar] [CrossRef]
  16. Lanata, A.; Scilingo, E.P.; De Rossi, D. A multimodal transducer for cardiopulmonary activity monitoring in emergency. IEEE Trans. Inf. Technol. Biomed. 2010, 14, 817–825. [Google Scholar] [CrossRef]
  17. Review: The Sproutling Baby Monitor. Available online: https://spectrum.ieee.org/geek-life/tools-toys/review-the-sproutling-baby-monitor (accessed on 9 May 2019).
  18. Protecting Wearable Electronics from the Human Body. Available online: https://wireless.electronicspecifier.com/companies/avnet-abacus (accessed on 9 May 2018).
  19. Fitbit Says New Wearable Device Can Cause Skin Rash. Available online: https://www.bbc.co.uk/news/technology-31438706 (accessed on 9 May 2019).
  20. Poh, M.-Z.; McDuff, D.J.; Picard, R.W. Non-contact, automated cardiac pulse measurements using video imaging and blind source separation. Opt. Express 2010, 18, 10762–10774. [Google Scholar] [CrossRef] [PubMed]
  21. Balakrishnan, G.; Durand, F.; Guttag, J. Detecting pulse from head motions in video. In Proceedings of the IEEE Conference on Computer Vision and Pattern Recognition (CVPR), Portland, OR, USA, 23–28 June 2013. [Google Scholar]
  22. Yang, C.; Cheung, G.; Stankovic, V. Estimating heart rate and rhythm via 3D motion tracking in depth video. IEEE Trans. Multimed. 2017, 19, 1625–1636. [Google Scholar] [CrossRef]
  23. Lomaliza, J.-P.; Park, H. Detecting pulse from head motions using smartphone camera. LNEE 2016, 415, 243–251. [Google Scholar]
  24. Lin, Y.-C.; Chou, N.-K.; Lin, G.-Y.; Li, M.-H.; Lin, Y.-H. A real-time contactless pulse rate and motion status monitoring system based on complexion tracking. Sensors 2017, 17, 1490. [Google Scholar] [CrossRef]
  25. Haque, M.A.; Irani, R.; Nasrollahi, K.; Moeslund, T.B. Heartbeat rate measurement from facial video. IEEE Intell. Syst. 2016, 31, 40–48. [Google Scholar] [CrossRef]
  26. Lomaliza, J.-P.; Park, H. A highly efficient and reliable heart rate monitoring system using smartphone cameras. Multimed. Tools Appl. 2017, 76, 21051–21071. [Google Scholar] [CrossRef]
  27. Grimaldi, D.; Kurylyak, Y.; Lamonaca, F.; Nastro, A. Photo-plethysmography detection by smart-phone’s video camera. In Proceedings of the IEEE International Conference on Intelligent Data Acquisition and Advanced Computing Systems, Prague, Czech Republic, 15–17 September 2011; pp. 488–491. [Google Scholar]
  28. Sikdar, A.; Behera, S.K.; Dogra, D.P. Computer-vision-guided human pulse rate estimation: A review. IEEE Rev. Biomed. Eng. 2016, 9, 91–105. [Google Scholar] [CrossRef]
  29. Hassan, M.A.; Malik, A.S.; Fofi, D.; Saad, N.; Karasfi, B.; Ali, Y.S.; Meriaudeau, F. Heart rate estimation using facial video: A review. Biomed. Signal Process. Control 2017, 38, 346–360. [Google Scholar] [CrossRef]
  30. Welch, P.D. The use of fast Fourier transform for the estimation of power spectra: A method based on time averaging over short, modified periodograms. IEEE Trans. Audio Electroacoust. 1967, AU-15, 70–73. [Google Scholar] [CrossRef]
  31. Nam, Y.; Kong, Y.; Reyes, B.; Reljin, N.; Chon, K.H. Monitoring of heart and breathing rates using dual cameras on a smartphone. PLoS ONE 2016, 11, e0151013. [Google Scholar] [CrossRef]
  32. Panish, R.M. Vehicle Egomotion Estimation Using Computer Vision. Master’s Thesis, MIT, Cambridge, MA, USA, 2008. [Google Scholar]
  33. Marchand, E.; Uchiyama, H.; Spindler, F. Pose estimation for augmented reality: A hands-on survey. IEEE Trans. Vis. Comp. Graph. 2016, 22, 2633–2651. [Google Scholar] [CrossRef] [PubMed]
  34. Open Source Computer Vision Library. Available online: https://opencv.org/ (accessed on 9 May 2019).
Figure 1. Heart-rate monitoring systems: (left), touch-based; (right), touchless.
Electronics 08 00663 g001
Figure 2. Location of facial and background features used in [23]. Red circles in the upper corner ROIs represent background features, and white circles inside the central ROIs represent facial features.
Electronics 08 00663 g002
Figure 3. Process flow of the proposed system.
Electronics 08 00663 g003
Figure 4. Facial and background features extracted using front and rear cameras, respectively, in portrait mode.
Electronics 08 00663 g004
Figure 5. Average magnitude spectrum of 20 different average point signals (duration: 12.8 s).
Electronics 08 00663 g005
Figure 6. Heart-rate measurement in different illumination conditions. For each condition, the right images represent the main screen of the proposed system.
Electronics 08 00663 g006
Figure 7. Spectrum analysis of background average point signal and selected principal component signals. These signals were brought from a case where the ground-truth heart rate (from the Polar H7) was 80 BPM (≈1.33 Hz). In (b,c), the hand-shaking-related frequencies of (a) mislead the position of the highest frequency. In (d), by suppressing the hand-shaking noise, the highest frequency is much closer to the true heart rate.
Electronics 08 00663 g007
Figure 8. Peak detection and heart-rate computation from the selected principal component signals in Figure 7. In (a), (b), and (c), the peaks were found one by one in periods of 1/0.93 s, 1/1.09 s, and 1/1.4 s, respectively.
Electronics 08 00663 g008
Figure 9. Example showing that the signal selection results of P1 and P2 differ. (ae) Magnitude spectrum of the first five principal component signals. The frequency with the greatest magnitude and its first harmonic is shown with blue arrows and frequency values. These signals were brought from a case where the ground-truth heart rate was 74 beats per minute (BPM) (≈1.23 Hz). With both methods, a greater percentage indicates greater signal periodicity. The periodicity indices computed by P1 have lower variance (1–2%) than those computed by P2, which indicates that those computed by P2 are more discriminative and more robust to noise.
Electronics 08 00663 g009
Figure 10. Relationship between mean errors in BPM of different heart-rate estimation methods and heart-rate magnitude. “M1 and P2” represents the results of the proposed system.
Electronics 08 00663 g010
Table 1. Mean and errors of heart rates in beats per minute (BPM) estimated by different methods when the subject was at rest. “M1 and P2” represents the results of the proposed system. The values to the right of the/represent errors.
SystemDay IndoorDay OutdoorNight IndoorMean Error
Ground truth68.0/68.7/68.8//
M1 and P164.0/5.257.0/11.762.5/8.3/8.35
M1 and P268.2/1.066.7/2.068.5/1.3/1.42
M2 and P160.2/11.061.0/7.762.0/8.8/9.14
M2 and P263.0/6.261.0/7.768.5/2.8/6.54
M3 and P156.6/13.861.4/6.360.5/9.7/9.94
M3 and P260.7/7.365.3/4.161.3/8.3/6.57
Table 2. Mean and errors of heart rates in BPM estimated by different methods when the subject performed warm-up exercise (moving up and down stairs). “M1 and P2” represents the results of the proposed system. The values to the right of the/represent errors.
SystemDay IndoorDay OutdoorNight IndoorMean Error
Ground truth81.5/84.3/82.0//
M1 and P178.4/4.075.2/10.876.8/6.6/7.12
M1 and P280.2/2.384.0/0.984.7/2.5/1.92
M2 and P177.3/8.975.6/9.473.7/9.6/9.31
M2 and P278.0/4.080.1/4.078.7/4.4/4.15
M3 and P172.7/11.575.2/9.673.5/10.3/10.47
M3 and P276.9/5.191.7/7.077.1/6.3/6.10
Table 3. Mean and errors of heart rates in BPM estimated by different methods when the subject performed strenuous exercise (pushups). “M1 and P2” represents the results of the proposed system. The values to the right of the/represent errors.
SystemDay IndoorDay OutdoorNight IndoorMean Error
Ground truth101.7/103.2/102.8//
M1 and P193.2/7.590.3/9.594.5/8.6/8.53
M1 and P299.6/2.8105.5/2.0101.0/1.1/1.97
M2 and P190.9/11.4111.6/9.692.1/10.0/10.33
M2 and P2105.7/5.099.0/4.199.9/3.6/4.23
M3 and P189.7/13.693.5/10.1104.3/10.4/11.38
M3 and P298.4/6.8108.1/7.495.9/8.1/7.42
Table 4. Mean and errors of heart rates in BPM estimated by different methods when subjects were at rest. “M1 and P2” represents the results of the proposed system. The values to the right of the/represent errors.
SystemSubject_1Subject_2Subject_3
Ground truth68.5/75.3/82.9/
M1 and P161.2/8.681.8/8.587.1/7.8
M1 and P267.8/1.475.0/1.583.1/1.3
M2 and P161.1/9.168.3/9.075.8/9.5
M2 and P264.2/6.571.6/4.279.5/4.6
M3 and P159.5/9.968.4/10.073.3/10.8
M3 and P262.4/6.670.5/6.279.2/6.5
Table 5. Mean and errors of heart rates in BPM estimated by different methods when subjects performed strenuous exercise (pushups). “M1 and P2” represents the results of the proposed system. The values to the right of the/represent errors.
SystemSubject_1Subject_2Subject_3
Ground truth102.6/118.7/115.5/
M1 and P192.6/8.594.2/7.0107.3/8.7
M1 and P2102.0/2.0116.7/2.5115.1/1.1
M2 and P198.2/10.3107.6/11.1110.0/10.2
M2 and P2101.5/4.2115.3/3.9110.5/4.9
M3 and P195.8/11.4110.0/10.3110.0/10.9
M3 and P2100.8/7.4112.3/8.3109.8/7.2

