1. Introduction
“Cultural heritage” (CH), also termed “cultural property”, “cultural patrimony” or “cultural resources”, can be defined as the present manifestation of the human past. The significance of CH in Europe is invaluable. Historic buildings compose an important part of such tangible heritage [
1]. Historic buildings have different features from ‘traditional’ ones: They present frailty characteristics and they need a different approach compared to new or existing (but not historic) buildings, especially when they deal with energy efficiency aspects [
2]. One possible road towards the reduction of energy consumption in existing buildings is improving the building envelope, e.g., addressing wall insulation. In heritage buildings, considering the most often unknown wall properties and composition [
3,
4], the main challenge is finding compatible insulation solutions. As the façade elements cannot be changed, the most frequent refurbishment strategy is adding an internal layer of thermal insulation. However, as stated in [
5] (p. 110), adding an internal insulation layer to a wall “[…] creates a barrier between the existing wall and the indoor climate when installed, preventing the wall from warming up. Due to this, the structures’ dew point (the temperature in which the water vapor condensates) shifts inside”. As such, there is a risk of condensation. In Bjarløv et al. [
5] an interesting example of comparative analysis of some insulation solutions from the inside is presented. The research has been involved in dynamic simulation of the thermal and hygrometric behavior of some insulating materials installed on the inner layer of the brick walls (228 mm) of the Borch’s Dormitory, a traditional Copenhagen building from 1825. All configurations show a possible increase of relative humidity behind the insulating layer with values higher than 80% with probable presence of mold. The accumulation of moisture behind the insulation is higher if the wall is supposed to have damages (for example cracks from which rainwater can enter).
Therefore, microclimate and hygrothermal measurements for long periods are important to avoid damaging processes, as well as to document and control quality and results of planning processes. Damage causes the progressive loss of CH artifacts and historic buildings, related to physical properties, significance, economic value, and social-educative role [
6,
7]. Care of heritage needs strict control of light, air temperature, relative humidity, and pollutants for minimizing losses and ensuring long-term control of indoor conditions [
7]. Incorrect indoor conditions and variations of temperature and relative humidity directly affect the physicochemical properties of CH [
8], causing irreversible damage on building materials. Crucial hygrothermal parameters for heritage preservation are: (i) Air temperature (T
a) (K); (ii) Relative humidity of air (RH
a) (%); (iii) surface temperature (T
s) (K); and (iv) surface relative humidity (RH
s) (%) of building layers [
6,
9,
10].
Defining the real hygrothermal behavior of a historical wall is essential to better address the retrofit actions. Methods and procedures normally used for existing or new buildings are not always applicable to historic buildings [
11]. Diagnosis is at the basis of each intervention on historical heritage, as a starting point for understanding its morphological and technological characteristics. Commonly, this “preventive conservation” procedure is used for the indoor environmental assessment, i.e., microclimate monitoring [
12,
13], to consider “[…] all measures and actions aimed at avoiding and minimizing future deterioration or loss […] These measures and actions are indirect – they do not interfere with the materials and structures of the items. They do not modify their appearance” [
6] (p. 37). In parallel, hygrothermal measurements can be used to assess the behavior of the building envelope. Normally, its diagnosis in historic buildings requires the use of non-destructive techniques (NDT), due to CH protection laws. The most frequent on-site NDT used are: (i) Infrared thermography (IRT); (ii) Heat flow meter method (HFM); (iii) environmental monitoring of buildings; and (iv) contact monitoring of surfaces. IRT survey is based on the use of an infrared (IR) imaging camera that operates in short (3–5 μm) and long (7–14 μm) wave IR-bands [
14] for measuring the distribution of the emissive power of surfaces at various temperature range [
14,
15,
16]. It permits the assessment of the thermal anomalies related to structural features, building materials, moisture contents, and hygrothermal behavior of building elements [
17,
18,
19], as well as in high-temperature inspections (i.e., industrial process, HVAC (heating, ventilation, and air-conditioning system), and electrical systems) [
16]. For hygrothermal performance analysis, it is more applied in a qualitative way to reveal thermal patterns and locate thermal anomalies in the building envelope [
14,
15,
16], without quantifying thermal losses or identifying temperature values, moisture and water contents. Nowadays, this technique is applied also to the quantitative survey to infer and estimate the magnitude of the thermal anomalies in the surface of the building envelope [
16,
20,
21], but it is not used in a quantitative way for investigating the surface hygrometric performances or the hygrothermal of building elements. Nonetheless, this technique still presents various drawbacks, e.g.,: (i) Very high price for the equipment; (ii) highly dependency on climatic conditions [
16,
21,
22]; (iii) misreading information taken by the IR camera when temperatures have a very close range [
16].
Another possibility to test the thermal performance of building walls is the Heat Flow Meter method (HFM), an NDT for quantifying directly in situ the thermal resistance (R-value) (m
2K/W) and the thermal transmittance (U-value) (W/m
2K) of a structure. This method monitors the heat flux rate and the indoor and outdoor environmental or surfaces temperatures through a building element [
16]. Moreover, in this case, HFM is used only for measuring the thermal performance of building elements, not for the hygrometric performance [
23]. Furthermore, it presents some disadvantages related to the influence of boundary conditions, as well as to the presence of moisture, damage, surface resistances or errors in the estimation of features and materials used [
16,
21]. Moreover, environmental and contact monitoring is normally used to assess respectively the environmental condition of a room and the hygrothermal performance of a wall. Environmental monitoring aims at assessing the state of CH environments through regular and systematic inspections, in order to check the absence of the fluctuations that may generate CH damage and users’ discomfort [
7]. The consciousness of the importance of the “environmental impact” on heritage led the development of several standards, rules, guidelines and experimentations for hygrothermal monitoring, to ensure the conservation of CH artifacts and buildings [
8,
24,
25,
26,
27,
28,
29,
30,
31,
32]. Particularly, the European standard EN 15757 [
26] and the Italian standard UNI 10969 [
30] determined the target ranges and the variability of microclimate conditions (T
a, RH
a) developing the idea of the “historical climate” [
9]. Contact monitoring is normally used for predicting the potential hygrothermal risks of a building element, as well as for localizing and quantifying problems already occurred [
7]. On the contrary, no standard procedures have been developed for it [
16]. Otherwise, traditional methods cannot be used for historic surfaces that react in different ways compared to new buildings [
11,
33]. Moreover, the use of contact monitoring for listed and historical building could create some risks and damages. Ad hoc procedures should be developed in order to be easily applied and removed without damaging the original surface, and to not bias the measurement [
9,
10]. These problems gave rise to a recently started European project “HELLO! Heritage Energy Living Labs On-site”, at the Architettura>Energia Research Center of the Department of Architecture of the University of Ferrara and Eurac Research [
34].
3. Criteria for a CH Compatible Monitoring System
The definition of the monitoring systems on heritage substrates requires a multidisciplinary work referred to the field of: (i) Building physics; (ii) preventive conservation and damage process and (iii) electric engineering [
7]. These measurements should carry out by specialized people, capable of investigating environmental fluctuations, in order to avoid the bias caused by operational errors or an inappropriate choice of sampling conditions or sensors [
7,
9,
10]. Besides, the standard UNI EN 15758:2010 states that measurement on surfaces should be done only consulting a conservator to reduce their potential risks [
33]. Unfortunately, in many cases, this activity is done by staff without specific knowledge on this specific topic [
11]. Moreover, the standards [
8,
24,
25,
26,
27,
28,
29,
30,
31,
32] defines: (i) Skills and competencies of the personnel; (i) procedures for environmental monitoring. On the contrary, no procedures for contact monitoring are suggested, as well as no characteristics of the monitoring system are described. Similarly, as the specificity of the problems, the compatibility of these instruments with CH object is not introduced. Thus, a detailed study of monitoring systems and procedures for CH objects is needed. Particularly, the study on the requirements of the monitoring systems suitable for heritage objects considers:
Conservation of cultural heritage;
Reliability of the monitoring system;
Economic costs;
Ease of the equipment set up.
The criteria suggested by the restoration theories for preserving the identity of CH are: (i) “Distinguishability”; (ii) “compatibility”; (iii) “reversibility”; and (iv) “minimum intervention” [
35,
36]. Any intervention on a historic building should be distinguishable from the original and reversible in order to not falsify its artistic or historic evidence [
35,
36]. At the same time, the “(…) replacements of missing parts must integrate harmoniously with the whole” [
36], in order to recognize the layering during the time. This concept refers to every type of renovation, i.e.,: Structural improvements, functional integrations or energy retrofit must be designed without introducing new elements [
35].
These principles must be used also in the design of a monitoring system compatible with CH objects. In this case, “distinguishability” refers to the presence of cable, sensors and shading devices that must be recognizable from the wall substrate and the building, in order to preserve their authenticity and aesthetical aspect. Herein, they refer to the use of adequate procedures and non-destructive or non-invasive mounting systems and sensors. Particularly, contact monitoring is generally obtained by exerting pressure against the object surface or using mounting systems [
9].
Mounting systems are necessary to favor the heat exchange and to ensure the thermal equilibrium between surfaces and sensors. Commonly used mounting systems are: (i) Adhesive like glues and bonds; (ii) tapes; (iii) thermal conductivity paste in combination with tapes, bonds, or nails; (iv) screws, nails, or holders also additionally combined with glues, tapes, or thermal conductivity paste [
11]. Unavoidably, conventional mounting procedures and systems can damage valuable historic surfaces and often leave residues of materials with unknown aging behavior [
11]. Thus, contact monitoring in CH needs caution and adequate procedures to not create damage or mechanical stress to the surface. Historic surfaces require the use of low adhesive or non-destructive mounting systems, such as: (i) Thermoplastic resins; (ii) volatile binding media (VBM) and solvents; and (iii) dry mounting systems. The Fraunhofer Instituts für Bauphysik (IBP) verified the applicability of different thermoplastic resins (such as epoxy resin, hot-melt adhesive, volatile binder system, fugitive binder, Japanese Paper and hot-melt adhesive) with a sensible paint layer composed according to a historic recipe [
11]. None of these thermoplastic resins resulted completely free from the risk of damage, but they proved clean looking, simple, and durable only when were used with care [
11]. Otherwise, thermal stress and plasticizer migration occurred for powdery suraces, causing irreversible damages [
9]. Weak and sandy historic surfaces needed an additional fixture with nails to improve the heat transfer contact [
9,
10].
VBM are waxy solids that dissolve or sublimate under normal Ta, passing directly from a solid state into a gaseous or vapor phase during a certain period of time without leaving any trace. These binders, such as cyclododecane or aqueous dispersions of synthetic resins, are commonly used in many fields of conservation and archaeology to consolidate fragile historical materials (e.g., plaster, mortar, and so on). The choice of binders and solvents depends on the application of sensors in an outdoor or indoor environment, as well as on the properties of the surface (e.g., mechanical resistance, chemical-physical proprieties, and so on). Obviously, they should be non-aging and resoluble in solvents, but not on the original surface. Their influence was estimated by this study at 0.1 K compared to the other systems [
11]. Particularly, cyclododecane can be used only for short term monitoring (e.g., three to six months’ time span) [
11]. Additionally, a Japanese tissue lining improves the duration of the test up to one year [
11]. Its application requires clear procedure because it could leave unwanted residues and material reactions, especially in combination with saponified wax or polymer materials, such as polyethylene. Aqueous dispersions of synthetic resins containing a thermoplastic acrylic resin can be used on outside or wet walls because is insensitive to water [
11].
Dry mounting systems are the best option to reduce the impact on the original substrate [
11]. Obviously, they require nails or metallic systems to fix the sensors. These can generate losses of paints, plasters, and masonries. Thus, it is necessary to use small nails and take care of their application without loss of the substrate. Furthermore, the coefficients of thermal emissivity (ε) [-] of mounting systems have an impact on the measurement accuracy, especially in an outdoor environment [
11]. The influence of IR radiation on mounting systems is less important indoors, but general instruction suggested having a ε-value in the same range of the measured object [
11].
“Minimum intervention” refers to the use of: (i) Selection of an appropriate part of the wall to reduce harm, risks and damage; (ii) small sensors and miniaturized devices; (iii) probes with flat surfaces; (iv) non-destructive or non-invasive mounting systems; (v) Wi-Fi connections; and (vi) portable sensor technologies. Generally, the sensors are inserted in already damaged areas or their depth is limited to a surface layer to minimize their harm [
37]. The dimension of the sensors is important for aesthetics, conservative, and mechanical purposes. Small sensors result in less-invasive for CH, permitting to reduce aesthetic impact, losses of original materials, mechanical and physical damages. Recently, these devices have been designed as miniaturized tools to be used for in-situ diagnosis of heritage buildings [
38]. Generally, small probes have a flat surface which favors good thermal contact between sensors and walls. Otherwise, flat surfaces reduce the loss of building materials. These miniaturized sensors allow the collection of big data systems, thanks to Information and Communications Technology (ICT) and Internet of Things (IoT) new generation technologies [
38,
39].
Non-destructive mounting systems are strictly connected to “compatibility” and “reversibility”, as above mentioned. Wi-Fi connection is not always feasible in historic buildings [
39], especially in inhabited buildings. On the one hand, these buildings have very thick walls which might interrupt the Wi-Fi signal, on the other hand, due to their historic value, making holes or installing facilities is often not allowed/possible. In this case, portable devices could be a suitable alternative. They can be used for environmental monitoring of T
a and RH
a, when the accuracy of the measurement is good compared to other systems.
Three types of sensors are normally used for contact monitoring: (i) Platinum resistor; (ii) thermistor; and (iii) thermocouple [
9]. The most common disturbance in environmental monitoring of CH are: (i) IR radiation which supplies external heat to the sensor, increases of T
a and consequently decreases of RH
a [
9,
10] and; (ii) response time of the instruments to reach the thermal equilibrium [
9,
10]. IR radiation influence is related to the presence of direct solar radiation, incandescent lamps, or radiant heaters. Obviously, the sensor should be positioned far from heat sources in order to avoid possible IR influence. Besides, an IRT survey could help to check the absence of thermal influences on sensors, cables, or other elements. Finally, environmental and external contact sensors can be protected with screens. Screens should be made of reflecting materials and should have adequate natural or forced ventilation as described in EN ISO 7726 [
40].
Another important aspect, specifically related to the characteristic of the instrument, is the response time, defined as “[…] the interval of time between the instant when the measure is subjected to a specified abrupt change and the instant when the response of the measuring instrument reaches and remains within specific limits around its final steady value” [
10] (p. 35). The variability of external factors (i.e., windows or door openings, temporary use of HVAC systems or other disturbances) causes peaks or drops in T
a and RH
a that could affect CH preservation. Thus, accurate measurements require sensors with 95% response time, equal to or lower than one third of the shortest expected peak or drop to be monitored [
10].
The most common disturbances in contact monitoring of CH surfaces are: (i) Surface roughness of the wall; (ii) non-coplanar surfaces; (iii) dusty or damaged surfaces; and (iv) wet surfaces. These situations affect measurement accuracy. Surface roughness or non-coplanar layers are critical because they involve the modification of the geometrical properties of the surface, causing thermal instabilities of several technological devices [
41]. Dusty or damage surfaces can have an impact on the adhesion of the sensor to the building component.
4. Experimental Set-up of the Newly Developed Monitoring System
The set-up of the monitoring system considers: (i) Sensor test apparatus; (ii) installation of the monitoring system in the selected case study; (iii) data acquisition system; and (iv) economic evaluation.
4.1. Sensor Test Apparatus
A compromise between accuracy, robustness and easy installation was established. IoT sensing was not selected because ready to use solutions are thought mainly for environmental monitoring where access for maintenance is possible. More accurate sensors require a lot of work to customize and to calibrate. For these reasons, industrial sensors which have high accuracy for the purpose were selected: They are robust to be mounted inside the wall and they need standard devices for the signals acquisition.
To properly measure the hygrothermal parameters of the wall (inside and outside), a mix of various sensors was selected. This approach permits to have a double check on some measurements. To solve potential problems related to a harsh environment, industrial grade sensors with a robust shell were used. These sensors can be used without other protection excepting those for outdoor application where it is better to use a shield against solar radiation to have an accurate temperature measurement. Since the presence of the protective shell might disturb contact temperature measurement, it was also decided to use thermocouples as contact sensors, so that measurements from different sensors could be compared. As such, both T-RH sensors and thermocouples were installed.
Eight T-RH combined sensors were selected to measure T
s and RH
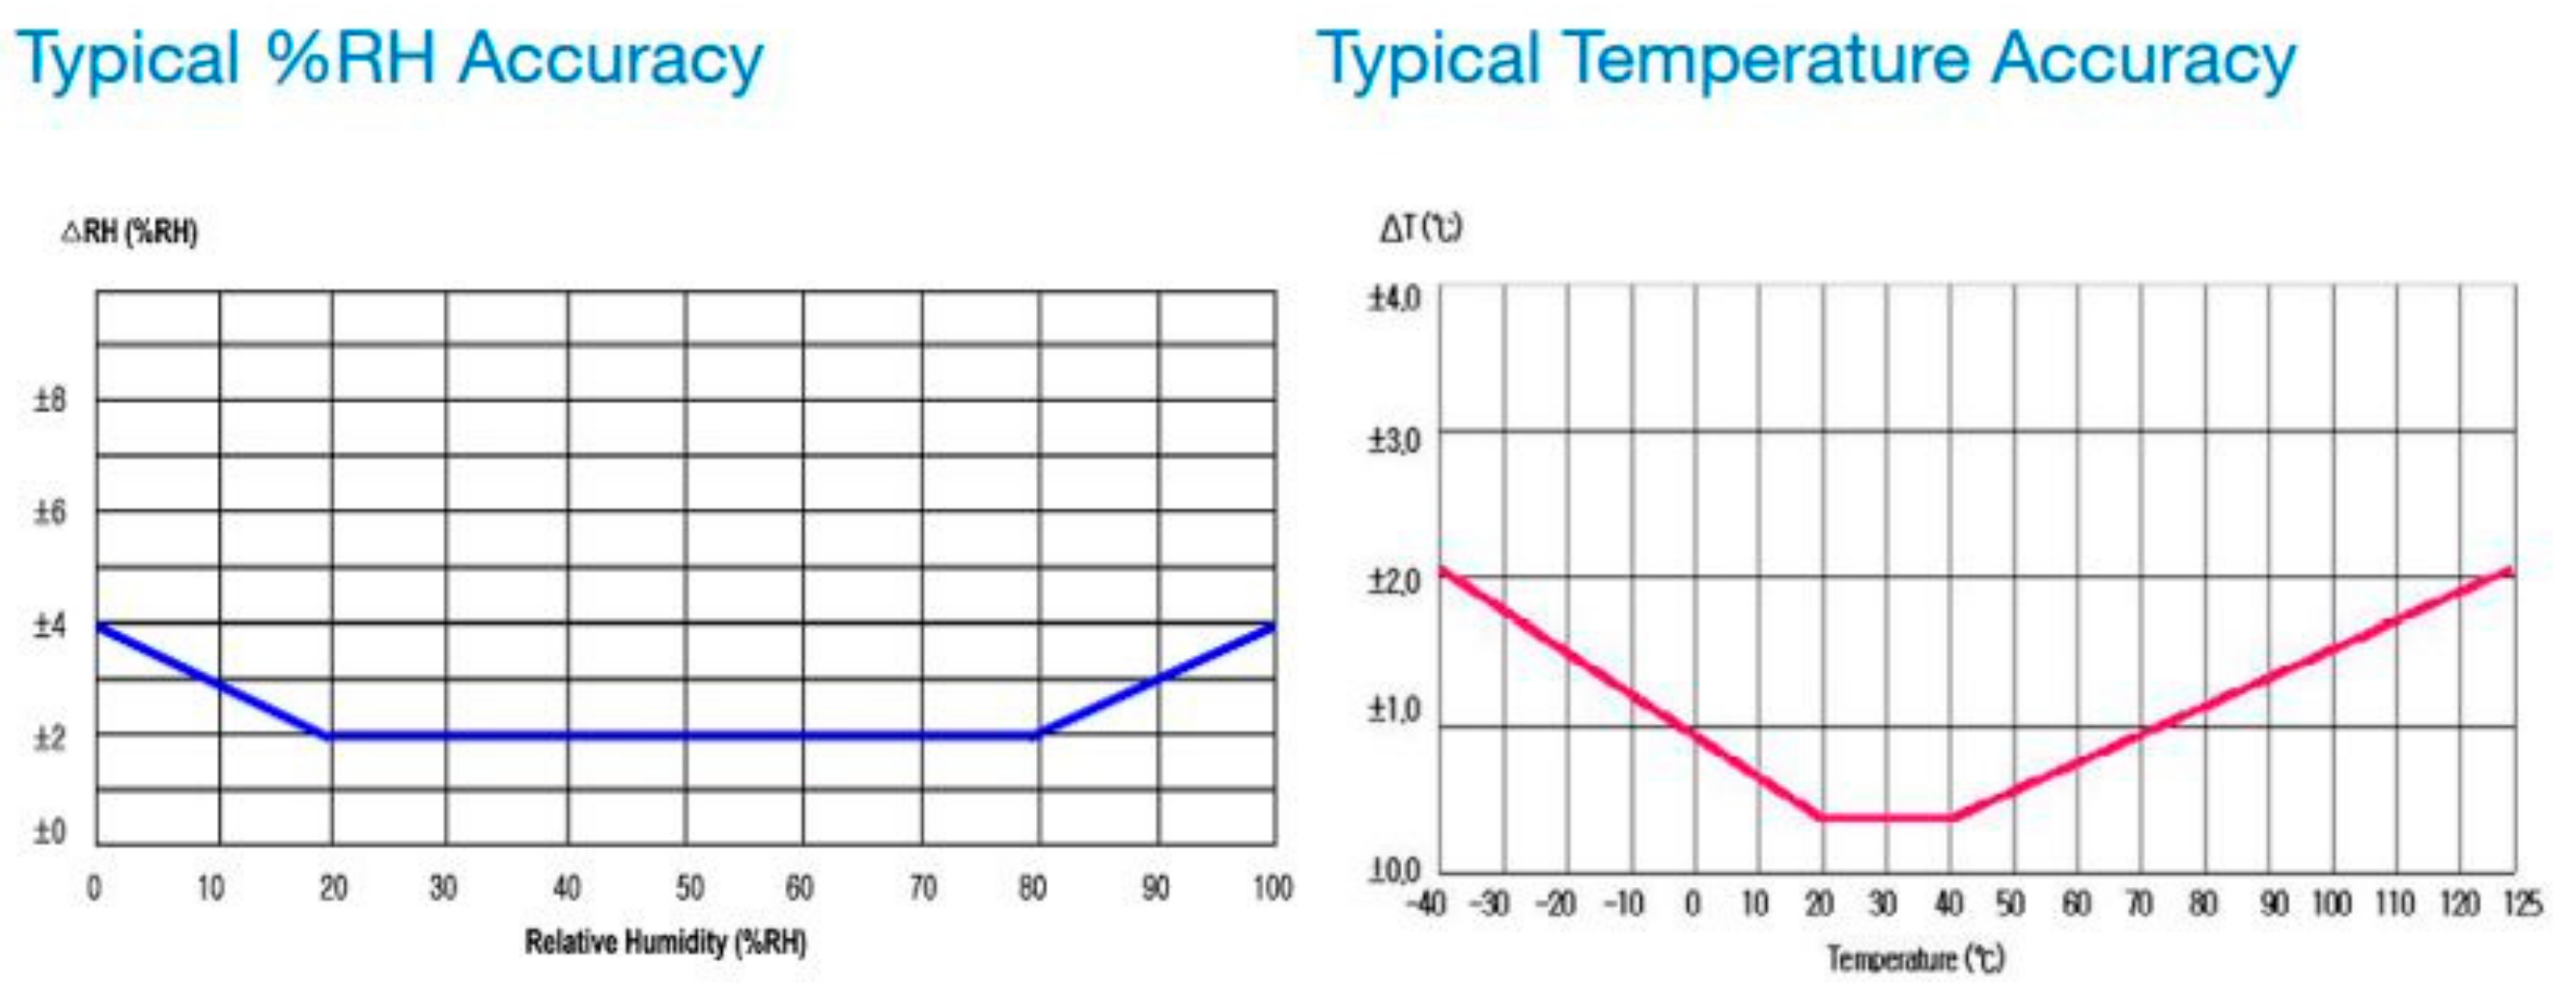
s inside the wall, and were installed in the interface between different materials (for example the insulation layers to be verified). These sensors are based on a capacitive polymer RH sensor and a PTA (Proportional to Absolute) integrated temperature sensor (Telaire T9602; Amphenol). They are IP67 certified to guarantee protection in a harsh environment. These sensors use a PDM output signal a low pass RC filter was needed to have a voltage signal to acquire hygrothermal data. This filter was built using industrial components to be sure about the accuracy of the construction and to have the same quality for every channel. Although low cost sensors were selected, a good accuracy in the measurement range of our monitoring system was guaranteed (
Figure 2).
To have a double check on Ts measurement using different sensors technology, eight thermocouples (TC) were placed in addition to the T-RH sensors. These sensors were placed in a column in the internal layer of the wall, with a distance of 0.5 m. Furthermore, three T-RH were placed to measure indoor and outdoor Ta: One sensor was placed outdoor (in the main court) and two indoor (one in the room and one in the box). All these sensors are sampled using Seneca acquisition card with a 16-bit ADC converter to have the proper resolution.
As the sensors were new, and never used before, they were tested during a laboratory experiment to measure Temperature and Relative Humidity of a multi-functional façade. This activity was needed to test the accuracy of sensors and the performance of the electronic filters to acquire signals. This experiment was done in the EURAC’s guarded hot box facility called INTENT (Integrated Envelope Testing facility), compliant to [
42] and [
43]. In the hot box, these sensors were placed on the internal and external surface of the façade, placing them along the same horizontal axis be in the same position on the external and internal façade, but near the left and right border on every facade. In this configuration, a similar value for the sensor on the same façade was expected. This value is not exactly the same because of the uncertainty of the climatic chamber in terms of temperature and relative humidity uniformity measured by the sensors on the same façade (
Figure 3).
Temperature accuracy of sensors is high considering the sensor uncertainty (±0.5 ℃) and the thermal chamber uncertainty for temperature uniformity (±1 °C). A combined uncertainty of 1.1 °C was obtained, so it can be concluded that sensors measurement is correct considering uncertainty. Relative Humidity accuracy is high for all sensors. Past-experience has evidenced the thermal chamber uncertainty around 5%. Combining sensors uncertainty (±2%) and the thermal chamber uncertainty for relative humidity uniformity (±5%), a combined uncertainty of 5.5% was obtained.
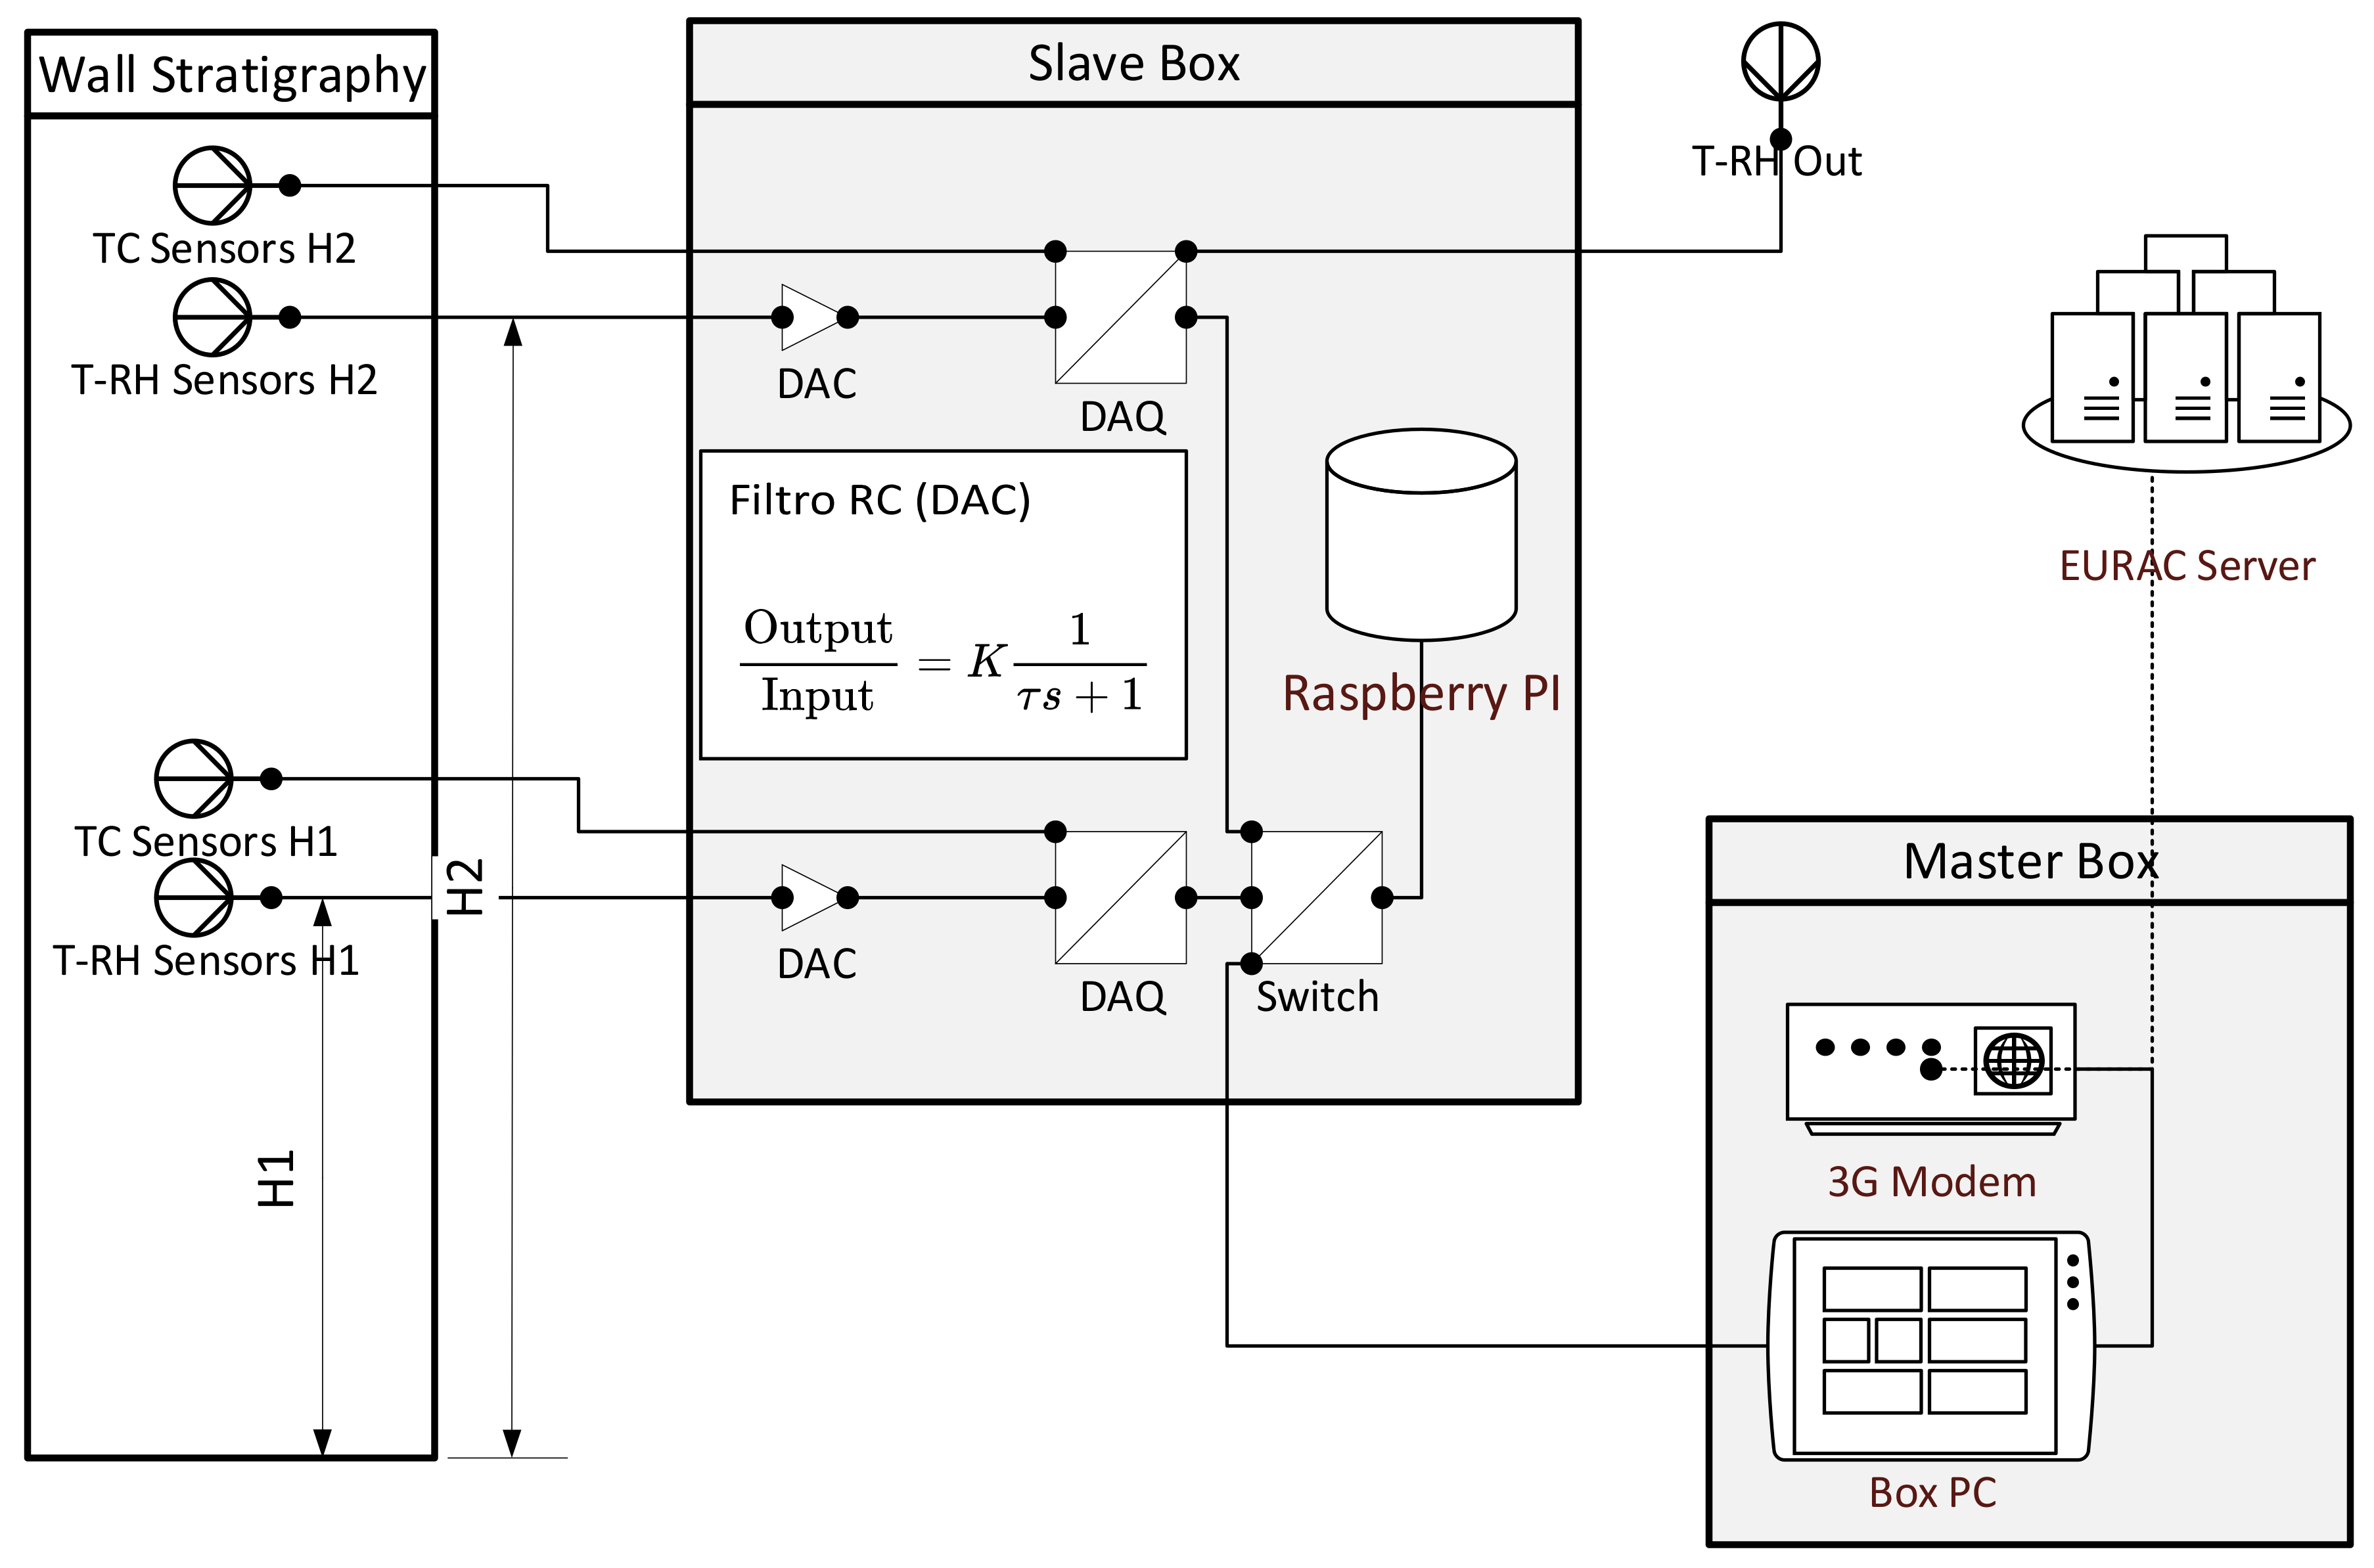
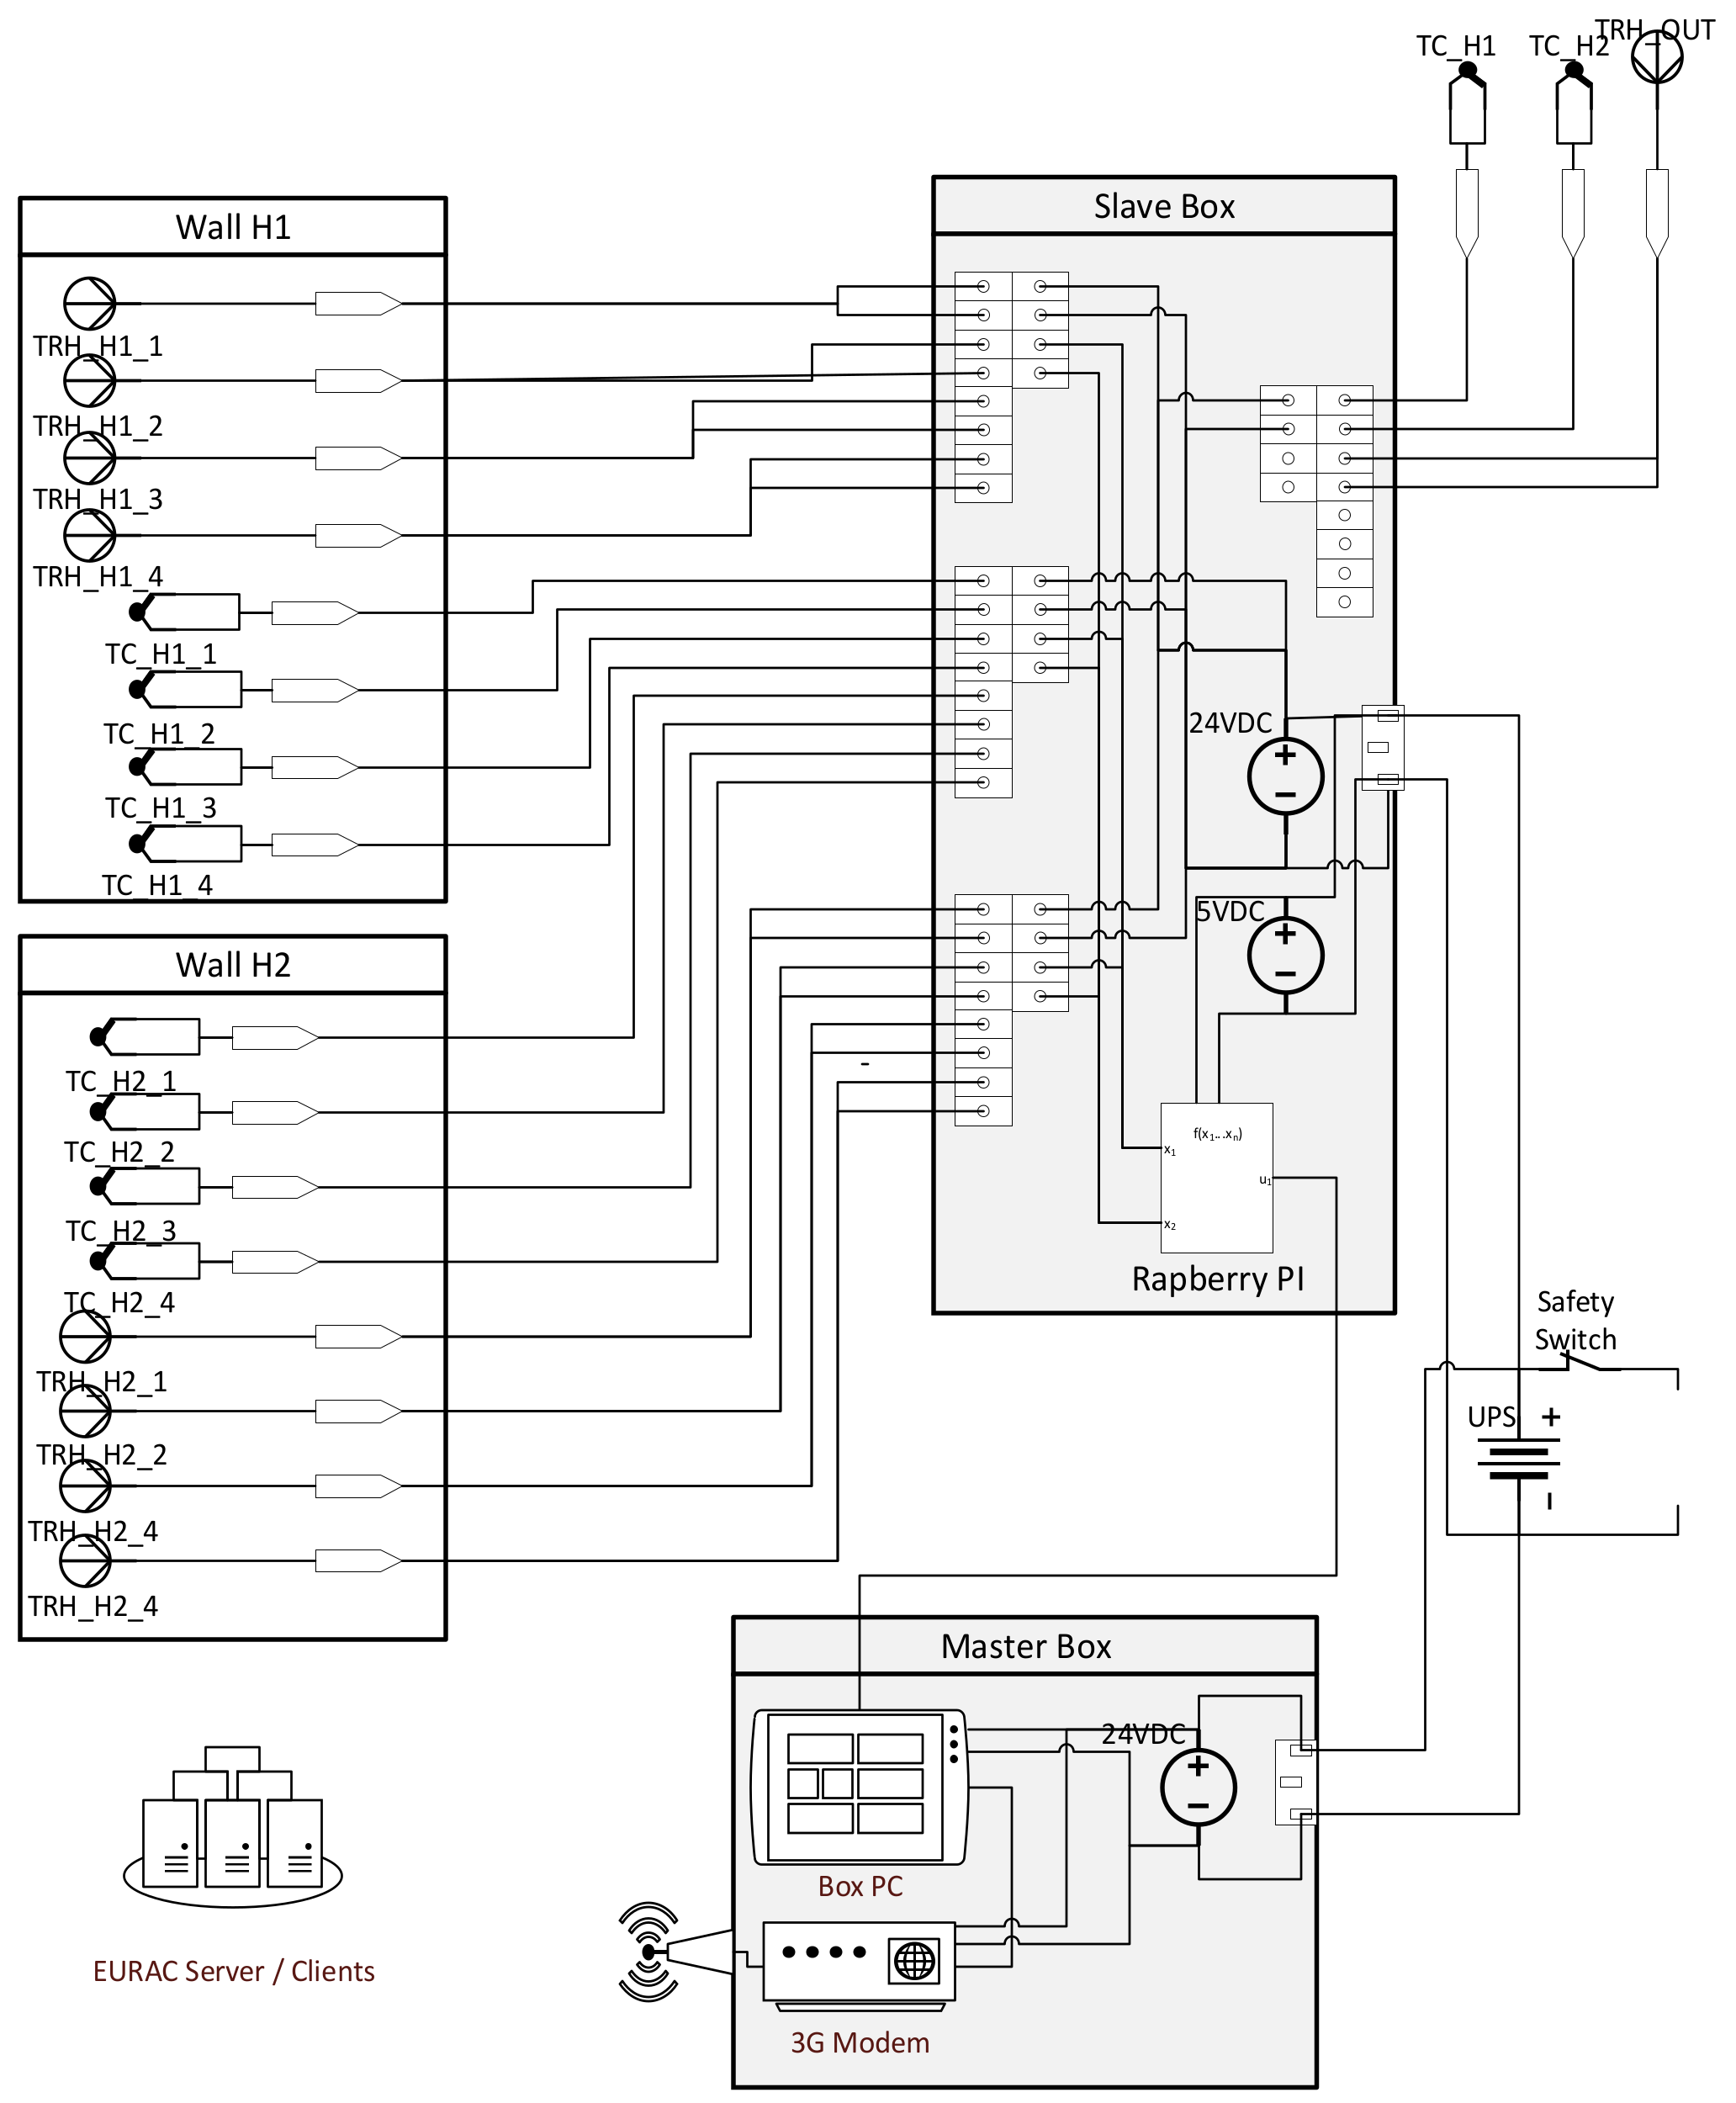
The General Architecture of the acquisition system is based on a Master Slave configuration (
Figure 4). These components are installed in two different boxes and the communication between them uses a Modbus over TCP/IP protocol. Master is dedicated to high level task management, and communicates with Slave to acquire and to visualize measurement data in online mode, as well as to visualize saved data in offline mode. The selected sensors are wired, and therefore, more difficult to be used in historic buildings. Here, this problem was reduced using wireless data communication between sensors and data logger to avoid long wires. To solve the problems of data communication between the data logger and remote clients, a 3G modem was selected to avoid connection using Ethernet cable, with the need of holes and nails along the walls, or Wi-Fi communication with the possibility of signal loss, due to thick walls.
The modem is provided with a 3G sim card to communicate with remote clients. Slave is dedicated to data acquisition from the sensors (see
Section 4.3). This communication is useful for: (i) Developers to check the behavior of the system, to modify what is not performing well, and for (ii) researcher to see real time data and historical data. A specific sw module was developed to avoid data loss and to recover quickly after a system block. This module provides a high frequency check (5 min loop) of the system status and communication with Slave, in order to send an email to the staff in case of problems. It provides also a low frequency loop (2 h) to send an email to the staff to communicate that the system is running properly. This double check permits to be quickly informed about problems, avoiding data loss for long periods of time.
The logical architecture scheme is shown in
Figure 4 and the graphical scheme of the monitoring system in Figure 9.
4.2. Installation of the Monitoring System in the Selected Case Study
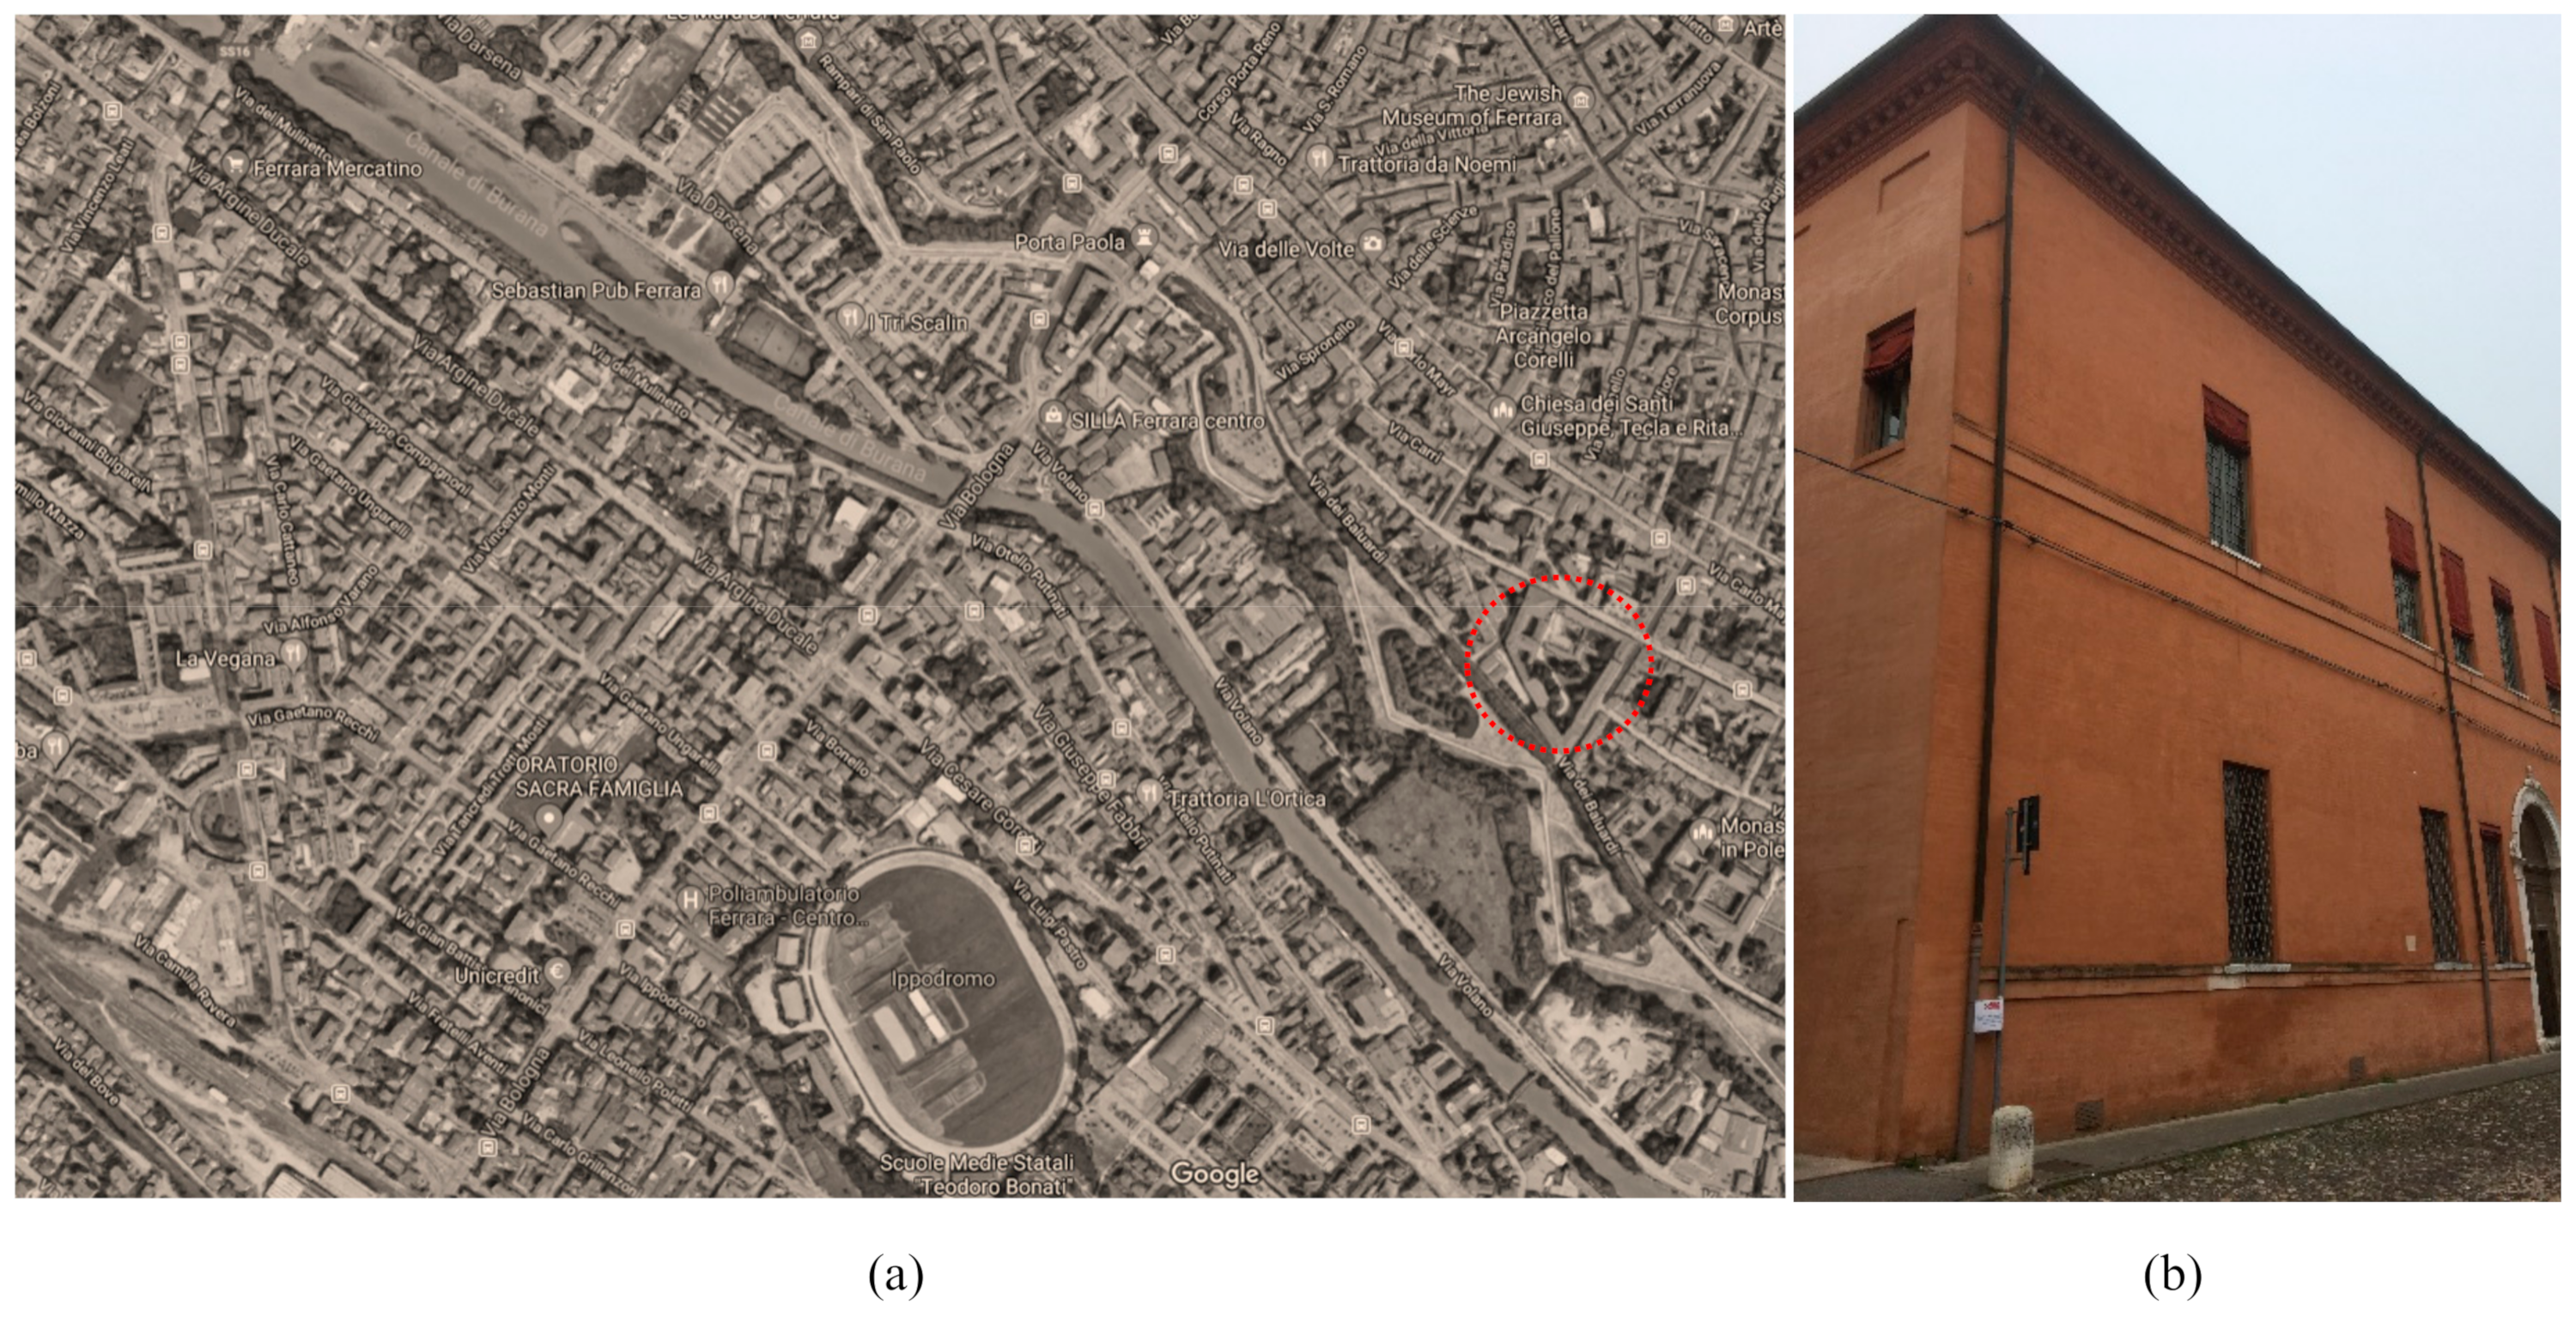
Palazzo Tassoni Estense, a Renaissance building located within Ferrara’s medieval city center, was chosen as the first case study for the sensing technology that has been set up. This building complex is situated in the southern area of Ferrara’s old town (
Figure 5). The palace stands in the proximity of the ancient castrum byzantine, the very first nucleus of the city dated back to the VII Century B.C.
Built in 1482 for the Estense family (the letter signed by the architect Biagio Rossetti in which he stated he followed the renovation of the building is dated 1491), in the following years, it changed many end-uses to further became, in 1991, the location of the School of Architecture of Ferrara.
The Palazzo is a historic, monumental building, fully built in masonry and of considerable architectural interest, currently under the tutelage of the Authority for the protection of Heritage Authority. The main entrance from the street is made of decorated white marble. The perron, in the upper floor, has been restored and it preserves only partially its original features. Instead, the access doors to the main hall are still the original and exquisite renaissance artifacts.
Although it is not possible to make generalizations when dealing with CH, the building selected as a case-study was nominated because it has been considered representative of a traditional building typology, though with some variations regarding, for instance, building intended use; for this reason, results obtained in the future from the implemented monitoring campaign, thanks to the discussed sensing technology, can be considered significant to represent the performance of a very broad sample of similar buildings in Italy. Notwithstanding, it is expected that the system can be replicated and tested in other climate and geographical areas.
For the set-up of the sensing technology, we selected a room located in the south-west wing of the building, which is currently unoccupied by didactic and scientific activities so as it has allowed to set up the whole experimentation. In addition, the fact that it still is under renovation has permitted to install the whole technology with fewer constraints (regarding for instance fastenings of the equipment), even if, in full respect of building’s historical features, that means without damaging existing structures and masonries in an irreversible way. The room is fully exposed on one side (the western one in fact faces the outside) while two sides are shared with other rooms and one is located under the portico, in the main courtyard.
In the interest of choosing the ‘best’ wall to perform the test, deep investigations trough “biopsy” or material extraction were not allowed for conservation reasons. So, a visual inspection, literature study about common envelope stratification and a survey of the existing cracks and wall damages were useful for the characterization and selection of the wall to be tested. The identified wall was the one under the portico, due to its technological characteristic, common to several historic buildings and therefore useful as a pilot case study.
In addition to these previous studies for the selection of the research site (i.e., visual inspection, literature study and survey of the existing cracks and wall damages), another analysis was performed before the installation of sensors using Infrared thermography (IRT) method. Though IRT was not indispensable, it added some useful information as it helped to map the superficial thermal conditions—this type of survey permits to measure the apparent surface temperature (T
as) (K) of large areas [
37]. Therefore, IRT survey was used in a qualitative way to verify the absence of thermal anomalies in the original wall, using a thermal imaging IR-camera Flir T630sc, according to international standards [
44,
45] and guidance [
14,
46]. This survey was carefully planned to avoid the influence of the angle of the visions, environmental conditions (i.e., lighting or heating systems) and wall features (i.e., roughness, different emissivity and colors of the surface) [
14,
44,
45,
46]. The values inserted in the IR-camera were: (i) Average ε-value of bricks of 0.93 according the database Flir Systems; (ii) distance (d) of 3 m between the IR-camera and the wall; (iii) T
a and RH
a during the survey (monitored in situ with a Testo 735-2 data logger); (iv) reflected temperature (T
refl) (K) on the object measured by the “Direct Method” [
37]. The main elements investigated were: (i) Thermal characterization of the wall; (ii) thermal bridging; and (iii) decay, moisture, water detection. The IRT survey permitted the selection of a representative part of the wall, avoiding the presence of thermal bridges, chimneys, different thickness, damage and dampness.
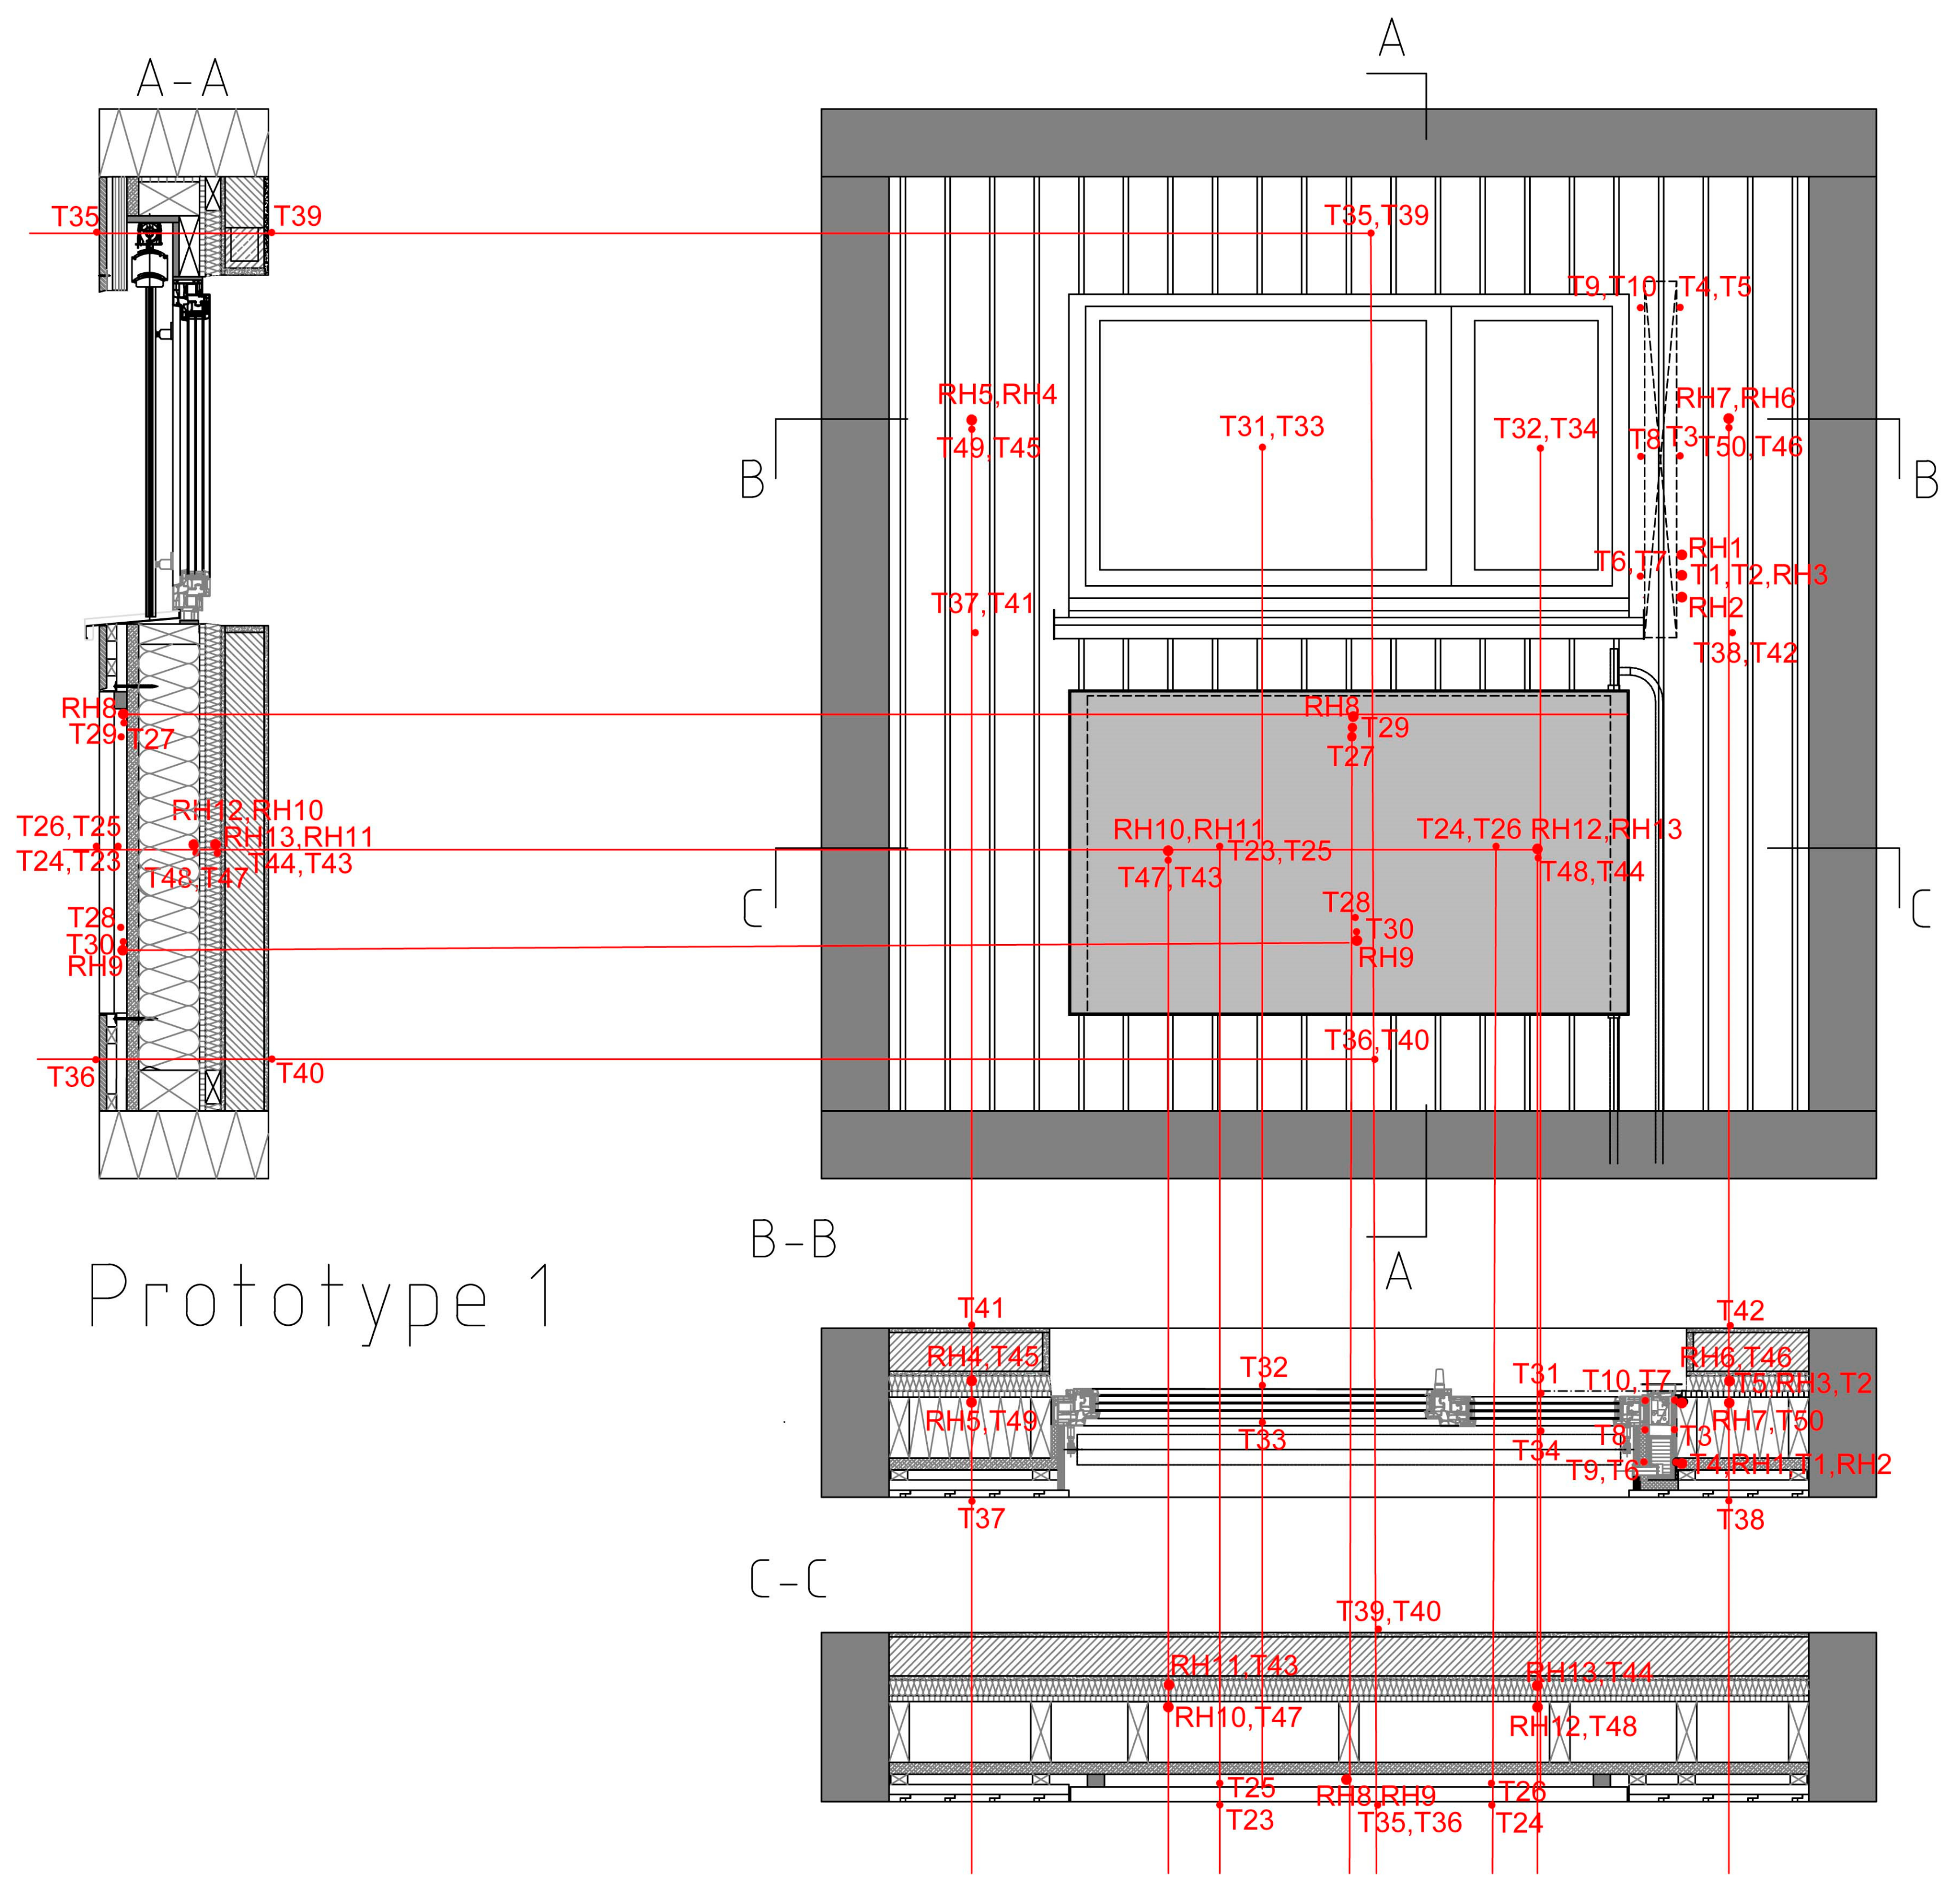
The wall is composed of two layers: (i) Bricks and lime mortar (0.28 m); and (ii) internal lime plaster (0.02 m). The dimension of the bricks is: 0.28 × 0.13 × 0.06 m. The total thickness of the wall is 0.3 m.
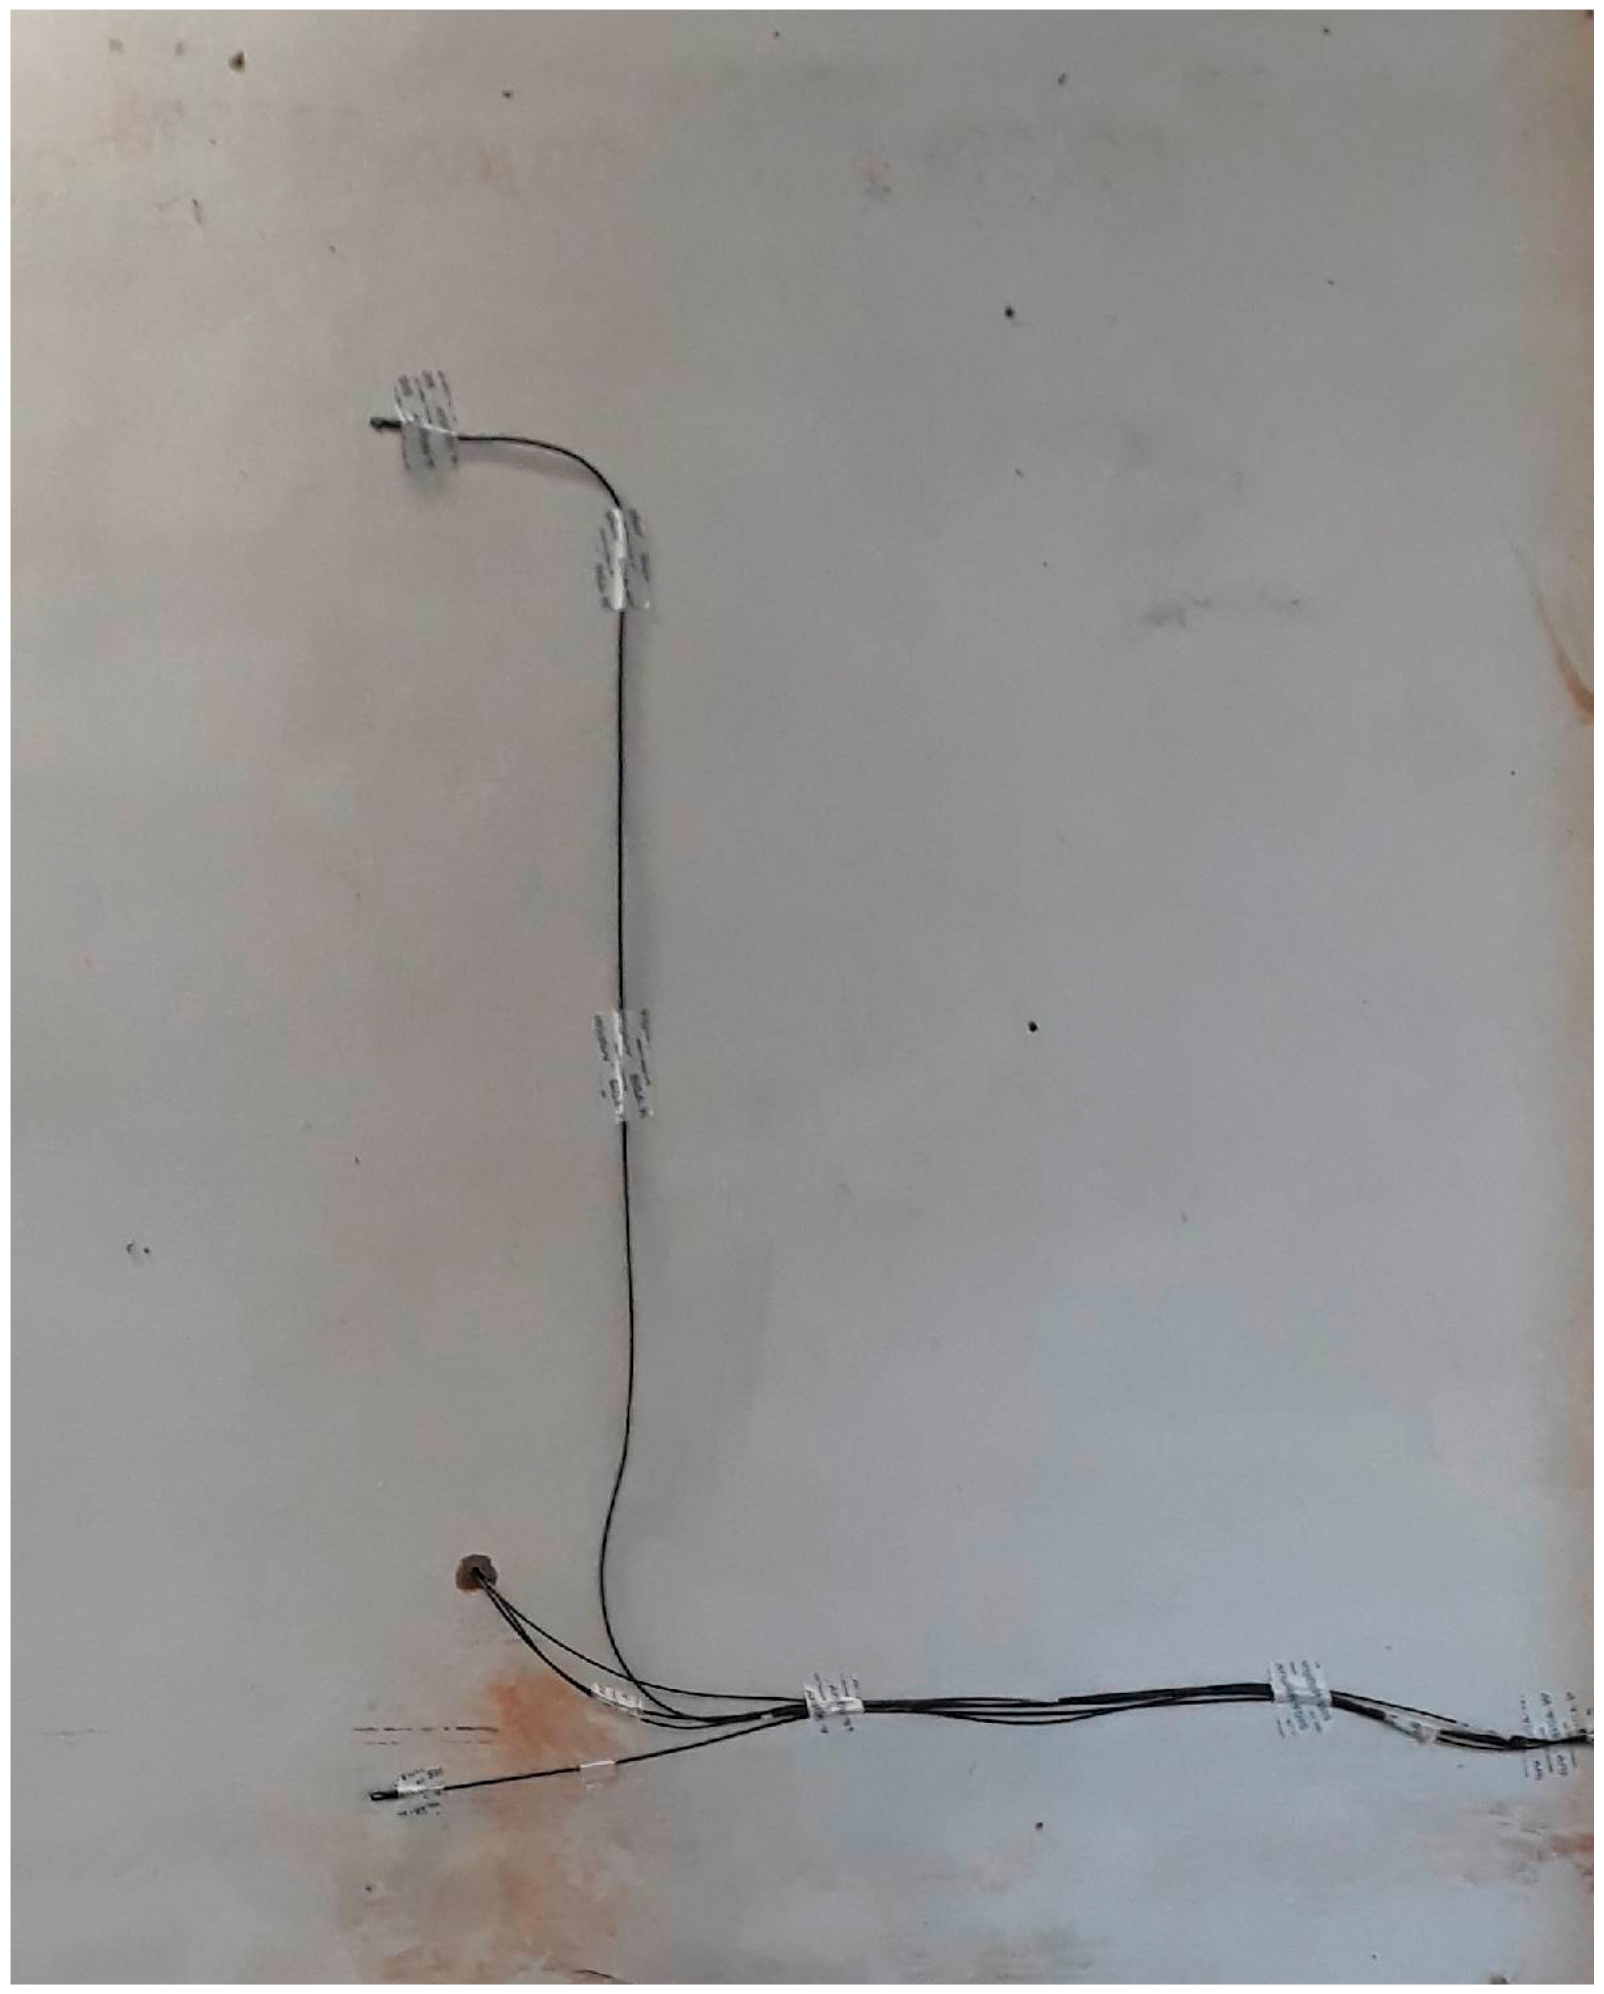
To assess the hygrothermal behavior of the wall in different points, two lines of sensors were placed on a double level, respecting the results of the analysis (
Figure 6).
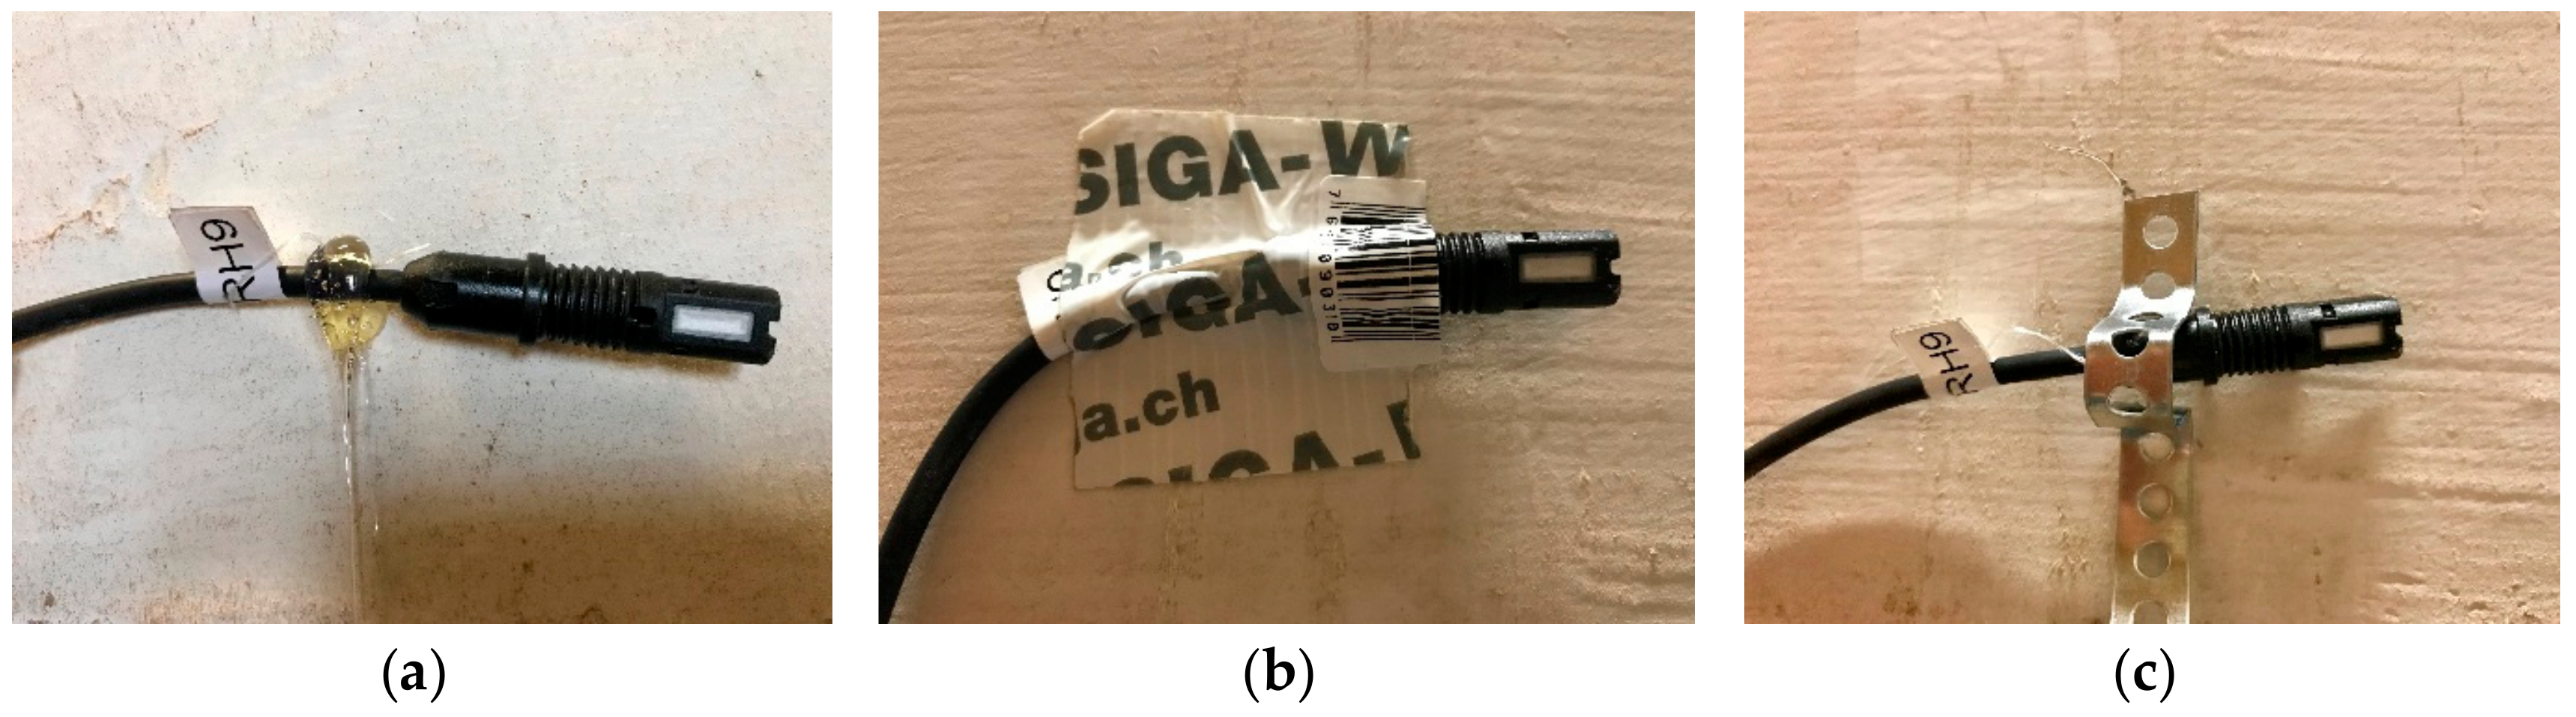
Three different mounting systems for contact monitoring were evaluated: (i) Glues; (ii) tape; and (iii) nail and holder. A thermal conductivity paste in combination with tapes, bonds, or nails was not considered, due to the potential impact of the oil on the wall surface. Nails and holders damage the wall surfaces, losing parts of the historical material. The glue was not strong enough to support the sensors, and the tape was easy to remove without marks and losses of the wall surface; thus, it was considered the best option for conserving the original substrates (
Figure 7).
A metallic screen was designed and executed to protect the external sensors from the environmental conditions (i.e., sun, wind, rain, snow) (
Figure 8).
To have suitable thermal data, a temperature difference of 20 K was guaranteed between the indoor and the outdoor environment. Generally, the hygrothermal parameters shall be monitored continually for 12 months to determine the fluctuations of the natural or historic microclimate in order to identify the possible damage of CH, due to the impact of environmental conditions [
8,
9,
24,
25,
26,
27,
28,
29,
30,
31,
32]. Time step recording of these parameters changes according to each case studies and final objective of the research. Herein, the default acquisition time period was set to 60 s. DAQ (data acquisition) system stores continuously data on local files with a user defined frequency.
4.3. Data Acquisition System
Data acquisition system (DAQ) was based on Raspberry PI 3 B+ single board PCs (RPI) running the official version of linux Raspbian operating system [
47]. For security net reason RPIs were connected on a local ethernet connection with ModbusRTU ethernet bridge for data acquisition from measurement modules and with an industrial panel PC, which can ensure outside connection with a 3G modem. In order to avoid the possibility of data loss two cloned RPI systems run in parallel. To keep the right date-time alignment of data, each RPI is equipped with an I2C Real Time Clock, which uses the I2C GPIO pins of the board.
Moreover, an NTP (Network Time Protocol) client is enabled to retrieve time information from an NTP server running on panel PC. Data acquisition from measurement modules is based on a C/C++ software running as a daemon on each RPIs. DAQ software is interfaced to the measurements modules with ModbusRTU protocol [
48] implemented with modbus library developed for Raspberry system [
49]. The software also detects and stores the heating system status through a simple coupling circuit interfaced to a GPIO RPI input. The DAQ software has no graphical interface and it runs a multi-client TCP/IP server, which allows external connection to interact with the DAQ system. With base TCP/IP commands, users can enable/disable the continuous data store on local files, set the continuous acquisition time period, get the status of DAQ system and get direct data from the measurement modules. In order to allow DAQ system to restart with last user defined settings (enabled/disabled continuous data store and acquisition time period), setup is stored in a local file and the information is retrieved when the daemon starts. For debug operation, other user-expert TCP/IP commands are implemented, which allow to read/write the defined Modbus registers of the measurement modules. DAQ software can also be compiled to interface with a user through command line input, but for the normal running mode, this feature is disabled. By default, DAQ system is configured to store continuously data on local files and a graphical data display runs on the panel PC, which can reach by remote connection.
Doubled RPI-DAQ system reduces the possibilities of data loss and panel PC ensures a completely remote-control check and control of the whole system (
Figure 9).
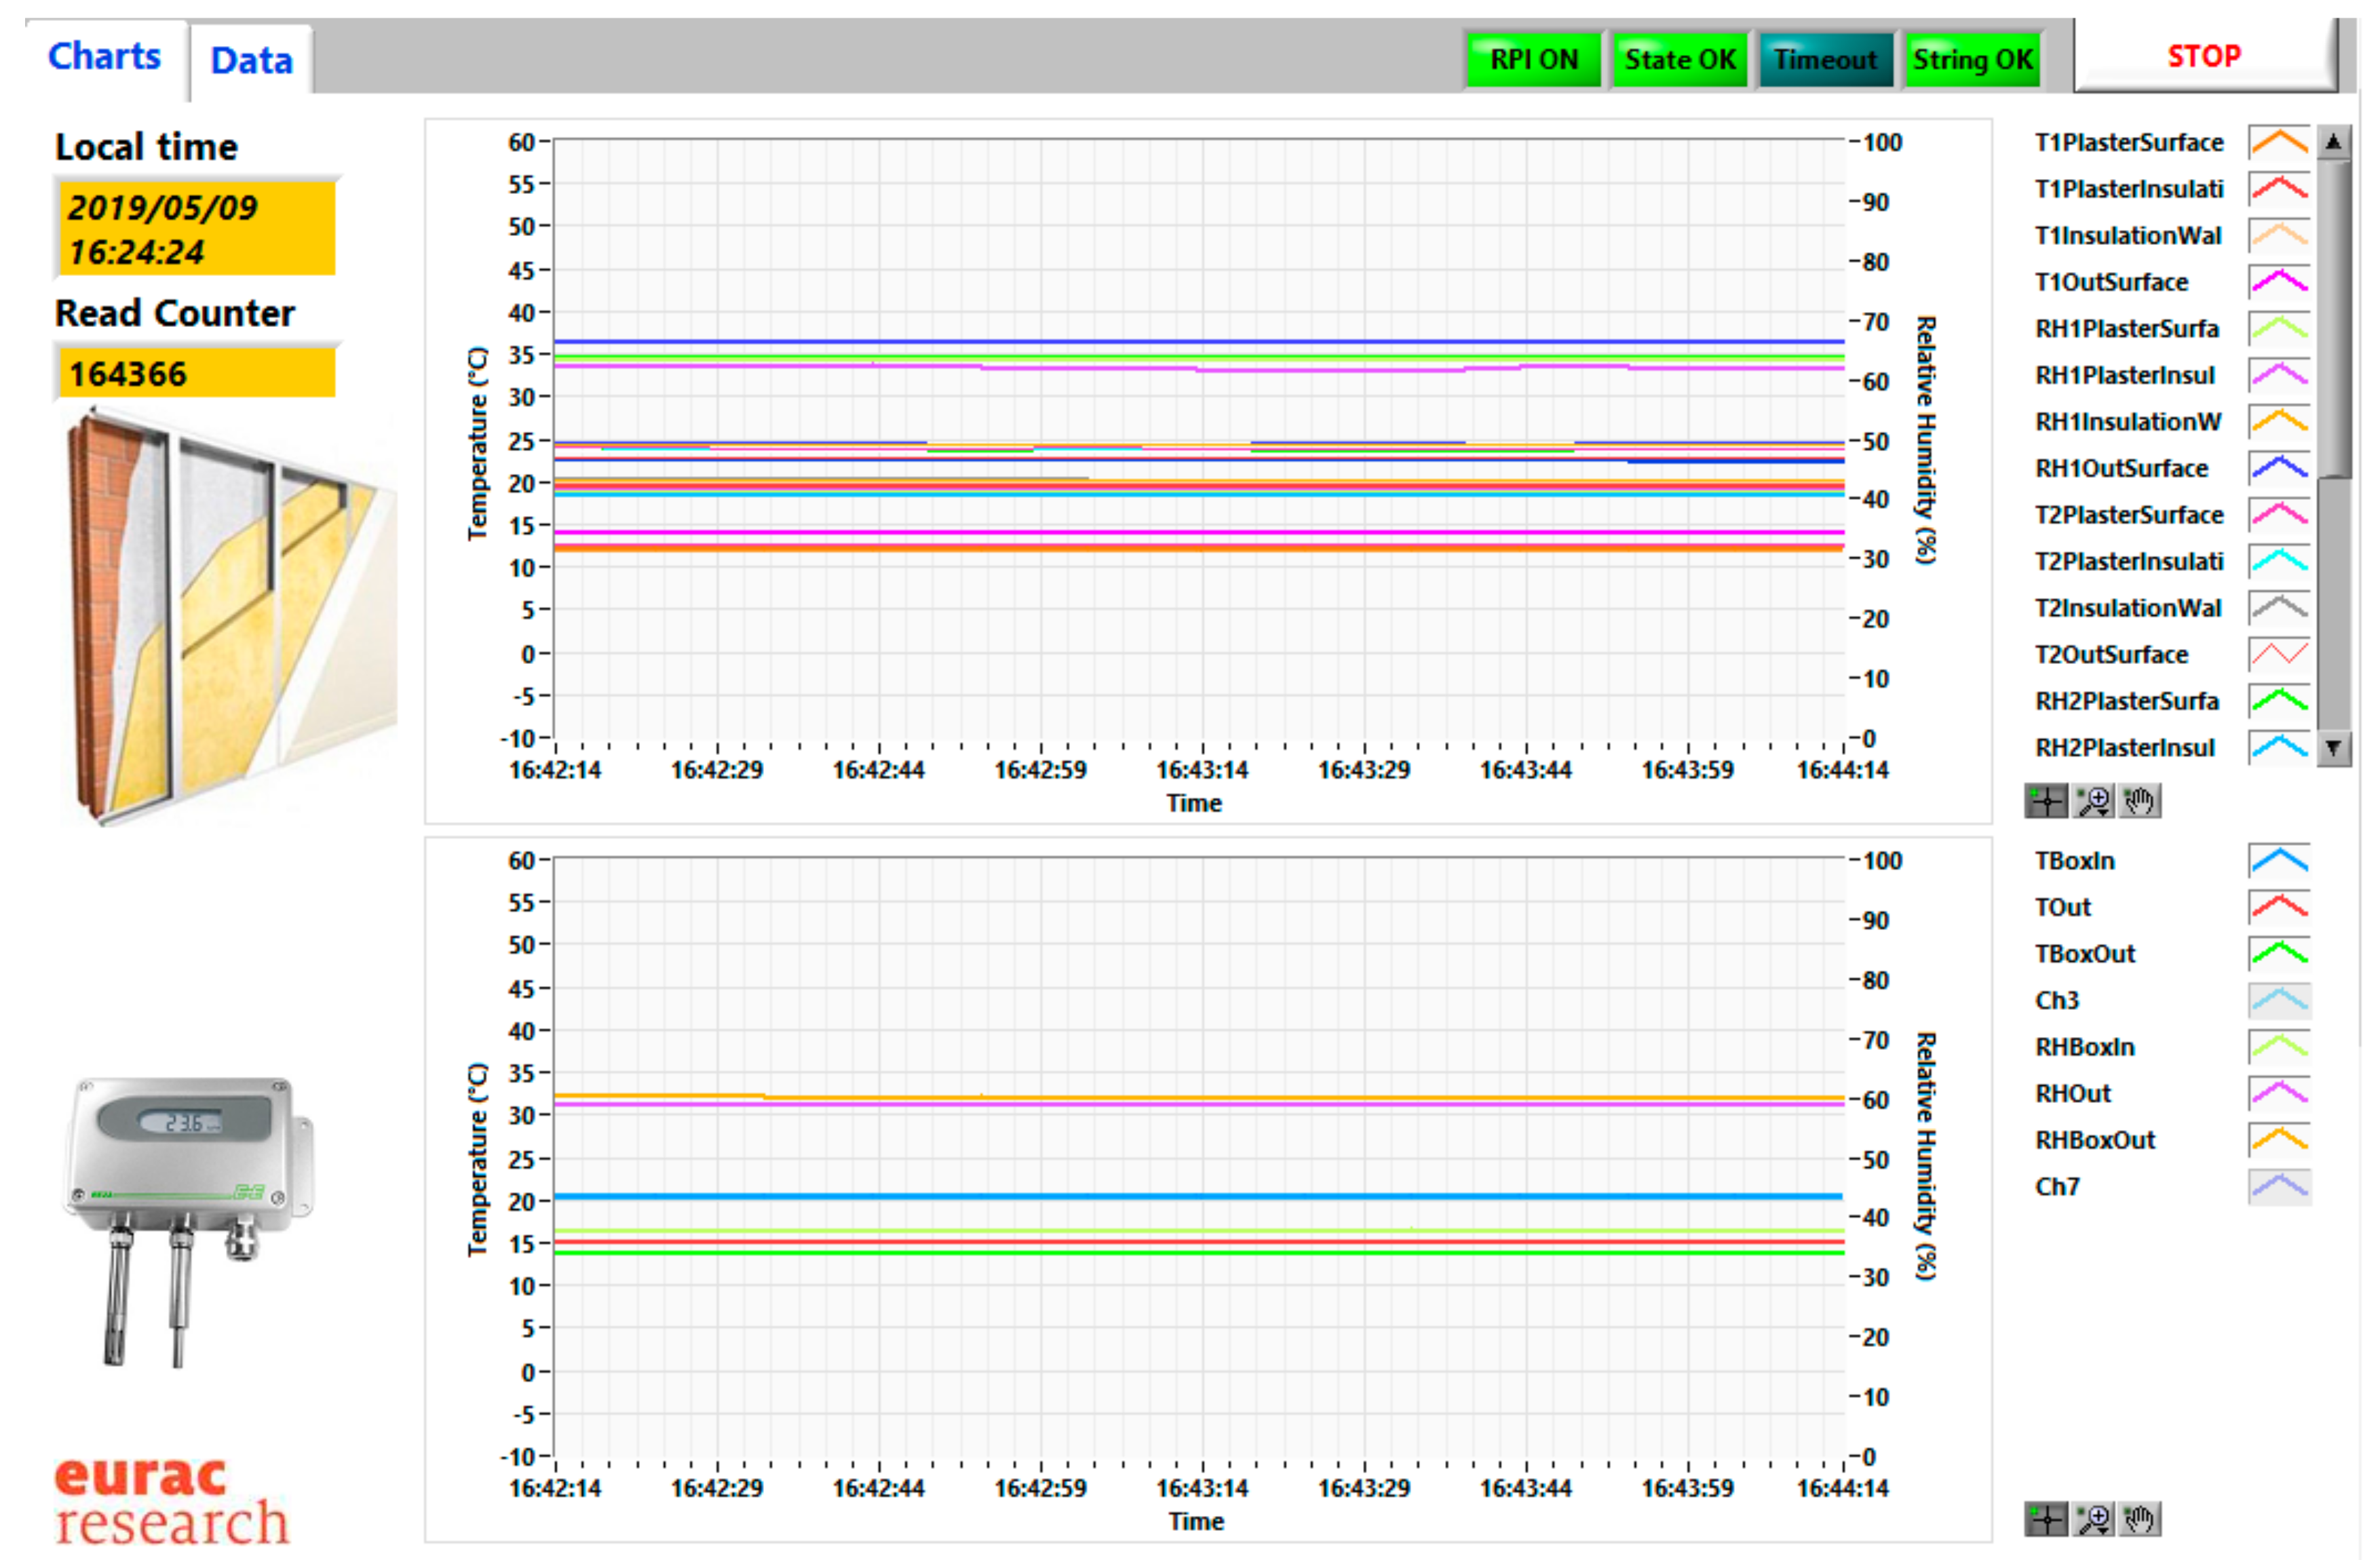
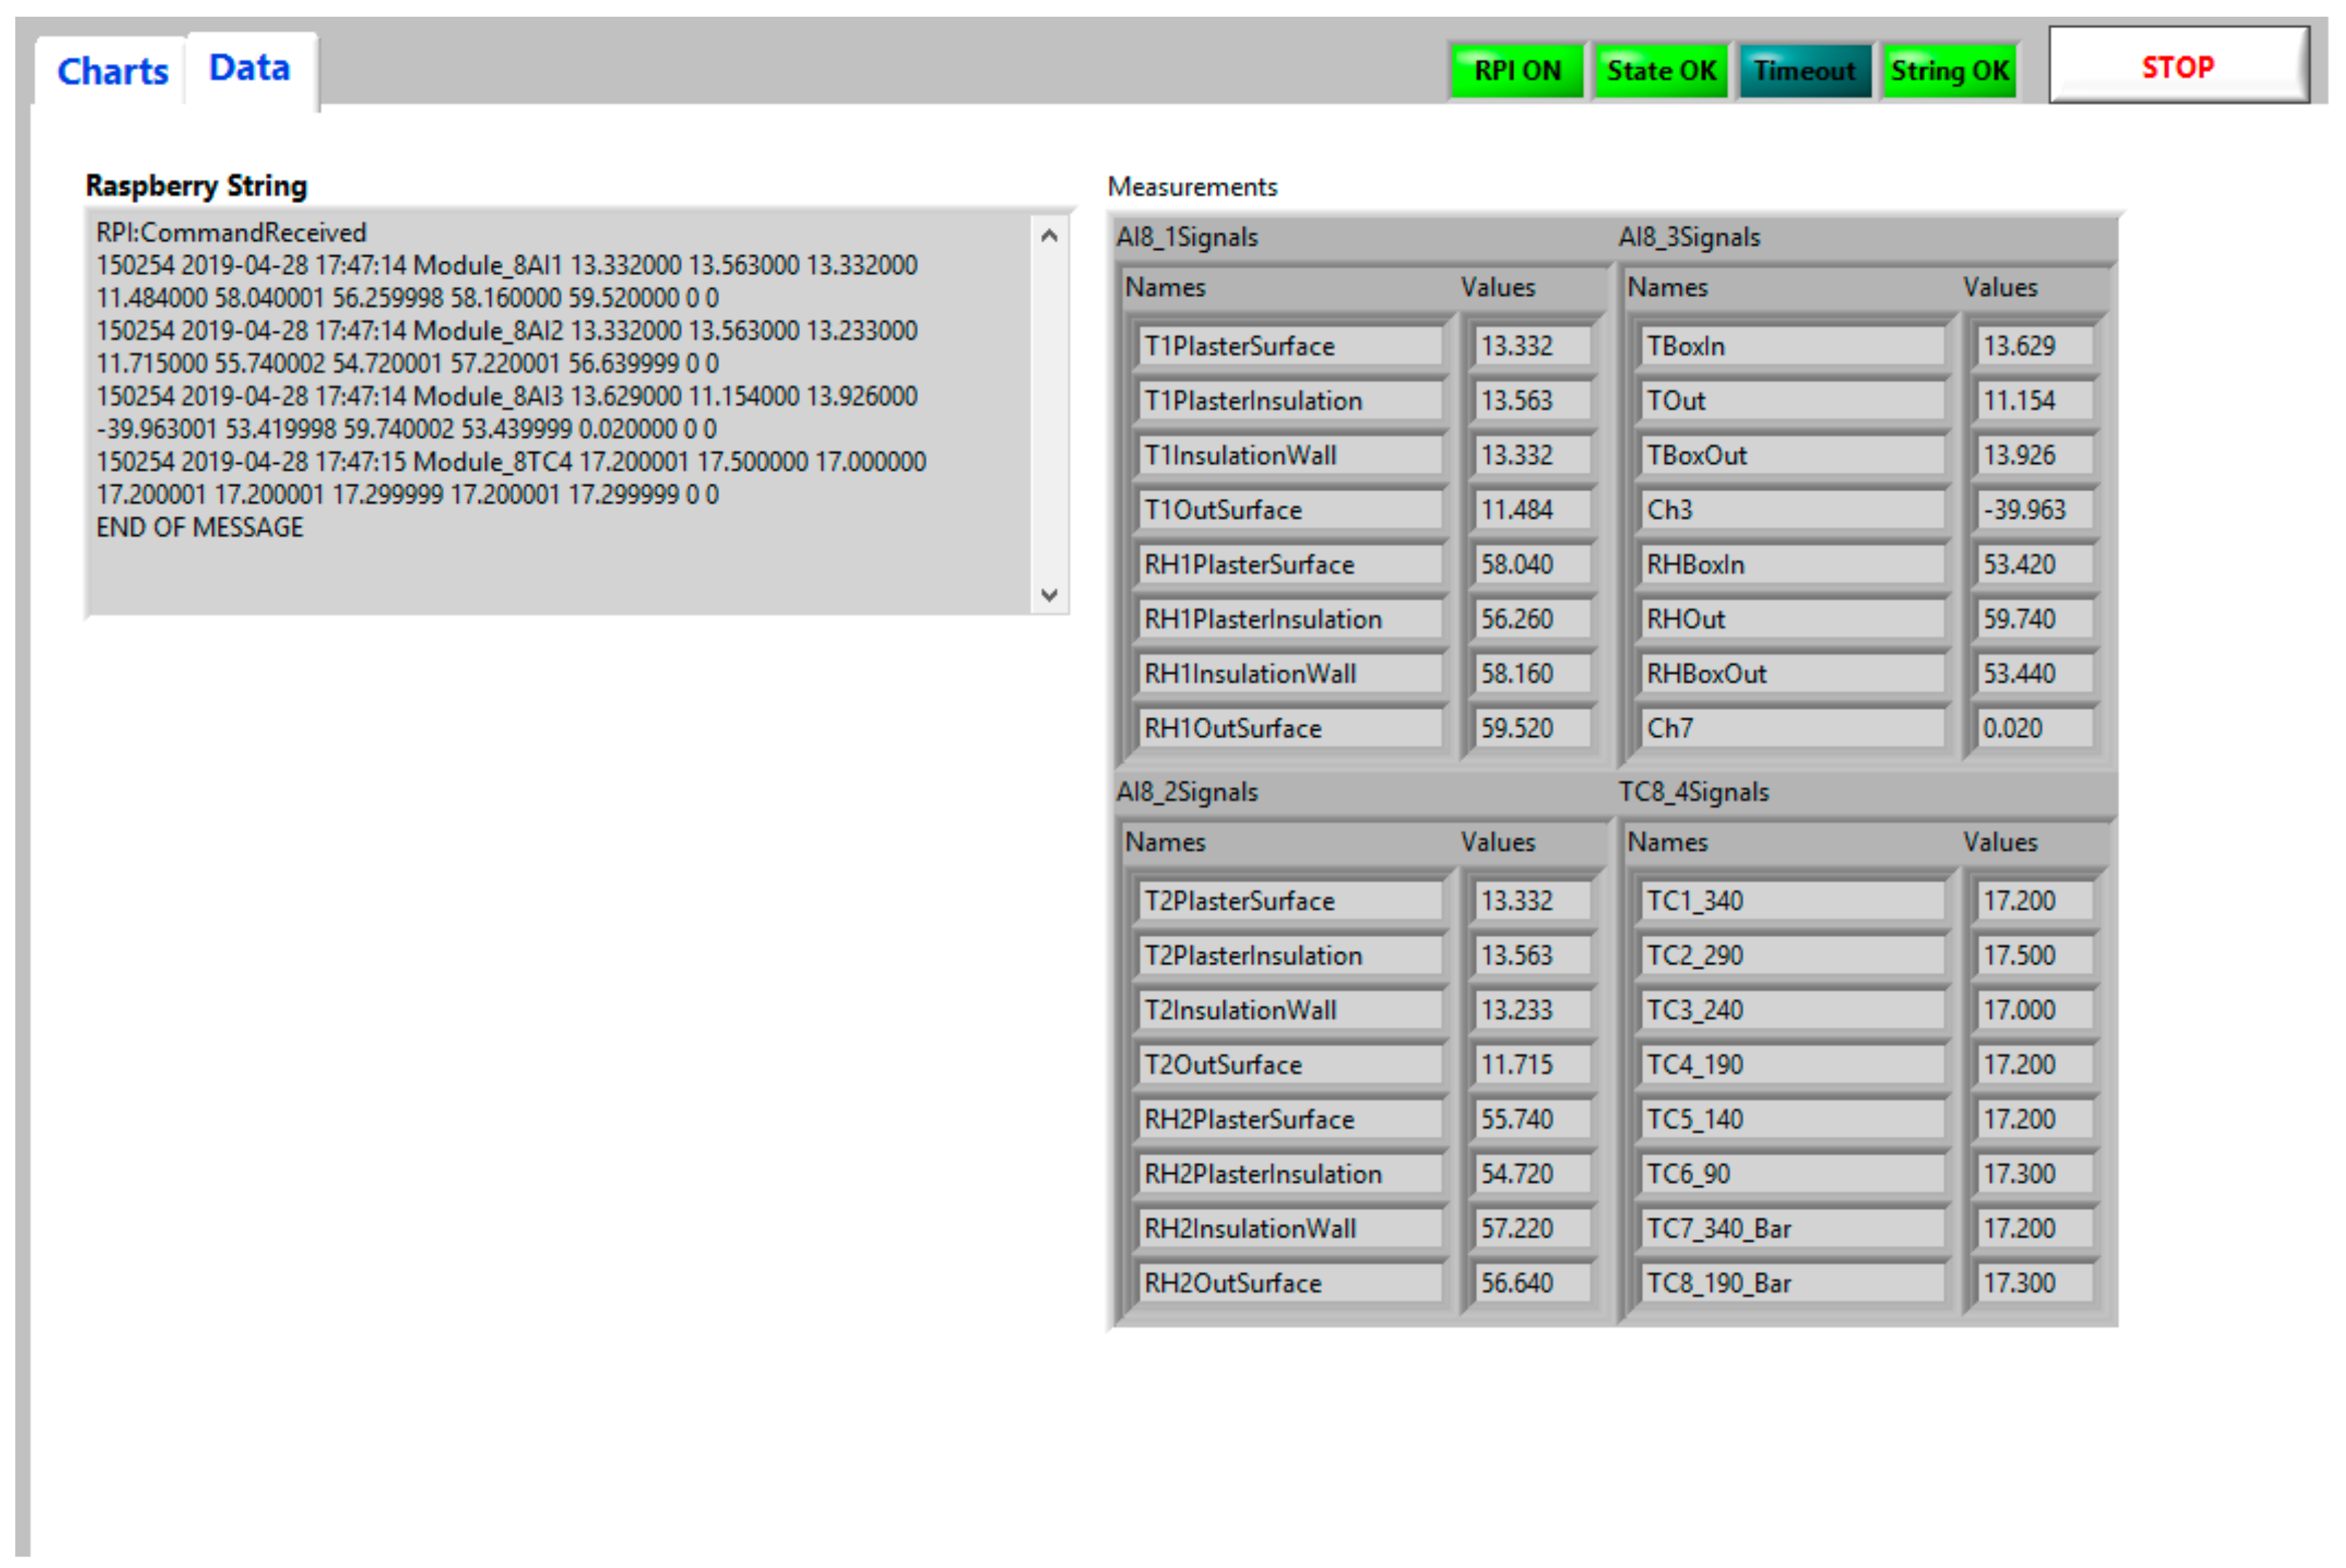
To have a clear real time overview of acquired data a dedicated software was developed. This software communicates with the acquisition system showing connection status to understand problems, show acquired data in a graphical mode and in a table mode and send emails to the staff if the communication fails for 10 min. The software sends an email every 2 h to inform the staff that the system is operating normally (
Figure 10 and
Figure 11).
Another software was developed to analyze data off-line, in order to better understand the result of the experiment during the time (
Figure 12).
To use this instruments file to be analyzed must be in a dedicated directory (DataFilePath). This software starts reading all the files and showing data on the graphs from the older to the newer. Data are grouped as in the overview software, to analyze signals from the stratigraphy and the environment. It is possible to select data to see using the list on the right of the graph. It is possible to save the entire selection of data for future analysis.
4.4. Economic Evaluation
Before deciding the final architecture of the system, some evaluations were made to compare the new system with the usual system architectures. After the analysis of different solutions based both on industrial and on hobby devices, the industrial grade devices were used for their easier integration. Once decided to use industrial grade sensors and data acquisition system, the best price and performance compromise was searched. Amphenol T-RH sensors were selected because of: (i) Their robust construction; (ii) their use of high quality Telaire sensible element (RH: ±2% T: ±0.3 °C); (iii) their cost cheaper than other similar sensors; and (iv) their easy acquisition compared with industrial ADC systems.
Analog to digital conversion was realized using Seneca devices to acquire voltage and thermocouple signals. Seneca devices were selected because: (i) They are well constructed with right resolution, accuracy, and stability to fulfil our needs; (ii) they communicate using a standard Modbus RTU protocol; and (iii) they have a lower price for channel compared with other ADC devices; (iv) they allow the use of wireless connection to communicate data; and (v) they have several economic advantages.
Data acquisition (DAQ) system based on Raspberry PI single board PCs, due to reduced costs of the boards, allows for the installation of two cloned system running in parallel, which will reduce the possibilities of data loss. The rest of the system consists of a standard Box PC to realize master unit with HMI and analysis tools and a GSM modem to guarantee a remote connection.
The cost reduction obtained with this system was guaranteed by:
Sensors: Selected sensors were from 40% to 80% cheaper than similar sensors;
ADC devices: Selected devices are cheaper from 10% to 15% compared with similar low accuracy devices and up than 60% compared with high accuracy systems;
Slave DAQ device: Raspberry was 80% cheaper compared with industrial grade real time devices. It has not the same performance, but it fulfills the needs of the selected Master Slave architecture;
Master HMI device: A standard Box PC with a GSM modem was selected considering the best market price.
Table 1 reports a summary of the main features between two industrial standard acquisition systems and the developed hybrid system that mix industrial grade components with custom devices. The systems use the same Master Slave architecture for the acquisition system and the same communication protocol to send data between Master and Slave and for remote connection. Common devices like PC, power supplies, enclosures, modem and wires are not considered because in common with all systems.
Table 2 reports a summary of the main features of the industrial standard sensors and the selected sensor. It is an industrial grade linked to a custom card to acquire a signal.

 ,
, 


