Multi-Channel Optoelectronic Measurement System for Soil Nutrients Analysis
by
 ,
,
Liuzheng Ma
1,2, 
Zhenfeng Li
1,2,
Zephania Birech
3,
Shixin Li
1,
Yatao Yang
1,2,
Wei Zhang
1 and
Jiandong Hu
1,2,* 1
Department of Electrical Engineering, Henan Agricultural University, Zhengzhou 450002, China
2
State Key Laboratory of Wheat and Maize Crop Science, Zhengzhou 450002, China
3
Department of Physics, University of Nairobi, 30197 Nairobi, Kenya
*
Author to whom correspondence should be addressed.
Electronics 2019, 8(4), 451; https://doi.org/10.3390/electronics8040451
Submission received: 18 March 2019
/
Revised: 17 April 2019
/
Accepted: 18 April 2019
/
Published: 20 April 2019
(This article belongs to the Special Issue Recent Advances in Biometrics and its Applications)
Abstract
:To solve the problems that occur when farmers overuse chemical fertilizers, it is necessary to develop rapid and efficient portable measurement systems for the detection and quantification of nitrogen (N), phosphorus (P), and potassium (K) in soil. Challenges arise from the use of currently available portable instruments which only have a few channels, namely measurement and the reference channels. We report on a home-built, multichannel, optoelectronic measurement system with automatically switching light sources for the detection of N, P, K content in soil samples. This optoelectronic measurement system consists of joint LED light sources with peak emission wavelengths of 405 nm, 660 nm, and 515 nm, a photodiode array, a circuit board with a microcontroller unit (MCU), and a liquid-crystal display (LCD) touch screen. The straightforward principle for rapid detection of the extractable nutrients (N, P, K) was well-established, and characterization of the designed measurement system was done. Using this multi-channel measurement system, available nutrients extracted from six soil samples could be measured simultaneously. The absorbance compensation, concentration calibration, and nutrition measurements were performed automatically to achieve high consistency across six channels. The experimental results showed that the cumulative relative standard deviations of 1.22%, 1.27%, and 1.00% were obtained from six channels with known concentrations of standard solutions, respectively. The coefficients of correlation for the detection of extracted nutrients of N, P, K content in soil samples using both the proposed method and conventional lab-based method were 0.9010, 0.9471, and 0.8923, respectively. Experimental results show that this optoelectronic measurement system can perform the measurement of N, P, K contents of six soil samples simultaneously and may be used as an actual tool in determining nutrients in soil samples with an improvement in detection efficiency.
1. Introduction
There are more than 13 essential nutrients that are supplied by soil for crop growth. However, not all soils are sufficiently fertile to provide balanced nourishment [1]. For this reason, the appropriate fertilizers should be applied to soil when specific nutrients are deficient such that it may result in reduced crop yield. It is known that fertilizer application is one of the most effective ways to increase crop production [2,3,4]. The average amount of urea in China is reported to be 180 kg/ha to obtain a high yield in the majority of crops [5]. Fertilizer applications exceeding crop requirements can pollute groundwater and stream water [6]. Farmers, however, often overuse chemical fertilizers since information on insufficient or deficient nutrients and the necessary respective concentrations needed to be added in the soil is lacking [7]. Experimental statistics indicate that farmers can cut down on the amount of the chemical fertilizer and save money if they choose chemical fertilizers based on scientific information gathered from their farm’s nutritive need [8]. Currently, the challenge that farmers face when deciding on the type and amount of chemical fertilizers is knowing exactly which soil nutrients are deficient in their farms’ soils [9,10]. Therefore, without a doubt, rapid measurement and analysis of soil nutrients can lead to efficient use of fertilizers and resultant improved crop yield [11]. Efficient use of chemical fertilizers also prevents environmental pollution. As analytical technology and methods have progressed, the ability and speed of analysis of soil nutrients have increased, and more options have become available, including nondestructive measurement variants (remote sensing and soil sensor technology) [12,13,14]. The Nash colorimetric method, Olsen sodium bicarbonate method, and ammonium acetate extraction-flame photometry have matured over years to facilitate detection of nitrogen (N), phosphorus (P), and potassium (K) in soil [15]. The above three methods, however, require complicated pretreatment processes and also do not allow for rapid simultaneous multi-sample detection of soil nutrients. Since the early 1990s, there have been many reports on the use of sensor technology to rapidly measure soil nutrients [16,17,18]. For instance, both spectroscopy and electrochemical sensors have become important measurement methods in the detection of soil nutrients in precision agriculture. However, the results of experiments from the sensors technology face reproducibility problems. Electrochemical sensors can assess spatial variability of different soil chemical properties. Tully & Weil reported on a good correlation with R2 values about 0.96 [19]. An automatic flow sampling system with ion electrodes offers opportunities for rapid soil nutrient measurements [20,21]. Vis-NIR advanced spectroscopic measurement of soil nutrition developed using a diode array spectrophotometer with wavelengths ranging from 399 nm to 1697 nm has been proven. However, potassium is not spectrally active in Vis/NIR range when a solid sample of soil is measured using spectral method [22]. Detection and quantification of soil nutrients with diffuse reflectance Fourier transform near infrared spectroscopy (FT-NIRS) together with multivariate analysis have been demonstrated where a concentration of total nitrogen (N) was obtained [23]. A miniaturized optoelectronic colorimetric measurement system with microelectromechanical systems (MEMS) structure has been used in measuring the extractable nutrients [24]. Different extractants were applied to obtain the NPK content in this MEMS system in which the complicated sample preparation was used. A highly precise measurement of soil nutrients was reached from this MEMS structure. However, this MEMS method cannot be obtained by the conventional fabrication due to expensive equipment. For this reason, the development of an inexpensive, robust system capable of repeatable, multi-channel, optoelectronic measurement of soil nutrients plays a crucial role in practical applications. Here, we report on the development of a multi-channel, optoelectronic measurement system that is versatile enough to be used as a portable field instrument for site soil nutrient analysis.
2. Materials and Methods
2.1. Soil Sample Collection and Preparation
To confirm the characteristics of this optoelectronic measurement system, the soil was randomly sampled at a sampling depth of 20 cm from a wheat field in Tianchi town, Sanmenxia city, Henan province. These samples were taken at a sampling position indicated by a differential GPS (34°40′5.59″ N, 111°51′9.73″ E). The soil was the calcareous type that has elevated levels of both magnesium carbonate and calcium. The disintegrated granules were sieved with a mesh of size of 1 mm to remove the undisintegrated granules prior to the experiment. A mass of 5 g of dry soil sample was measured with an accuracy of ±0.01 g and then placed into a 100 mL triangle bottle and thereafter mixed with 50 mL universal extraction solution. These sample solutions were stirred for 30 min with a constant speed of 180 rpm (revolutions per minute). The extraction solution with 0.45 M NaHCO3 and 0.374 M Na2SO4 was provided by Henan Nongda Measurement and Testing Technology Co., Ltd. (Zhengzhou, China). After stirring, any undissolved granules were removed by filtration. The filtrate was then placed into another 100 mL triangle bottle for further experiments. The photodiode 2CR1227 (with sensitive area of 10 × 10 mm) was used to convert the optical signals transmitted in the spectral range of 340–1000 nm with a peak wavelength of 720 nm into electronic signals (Hangzhou Yuxuan Electronics Co., Ltd., Hangzhou, China). Joint LED (light-emitting diodes) light sources (product model 5PRG9VCA-A40-M660-A405-T515) with peak emission wavelengths of 405 nm, 660 nm, and 515 nm were purchased from Shenzhen Guanghui Sheng Electronics Co., Ltd.
2.2. Measurement Principle
The soil extractant solution was provided by Henan Nongda Measurement and Testing Technology Co., Ltd. (Zhengzhou, China) to produce a specific color for measurements. The absorption spectra of the nutrient solution obtained using the optoelectronic measurement system show concentrations of nitrogen (N), potassium (K), and phosphorus (P) in the soil samples. The conventional lab-based methods include Nash colorimetric method for measuring Nitrogen (NH4-N), Olsen method for the determination of available phosphorus in calcareous soil for measuring phosphorus (P), and flame photometer for measuring potassium (K), respectively. The optoelectronic measurement system designed is equipped with joint LED sources, a cuvette holder, Microcontroller chip PIC24FJ64 (Microchip Technology Inc., USA), and photodiode 2CR1227 (Hangzhou Yuxuan Electronics Co., Ltd., Hangzhou, China) (spectral responses from 340 nm to 1000 nm) with a high quantum efficiency of 75%. The cuvette holder is specially designed for square spectrophotometer cells with approximate outside dimensions of 12.5 × 12.5 × 46 mm each with an optical path length of 10 mm. To account for the light attenuation caused by the square spectrophotometer cell, a blank solution without analytes of interest is measured prior commencement of the experiment. The standardized transmission spectra of a measured solution was calculated as the ratio of the flux transmitted by the measured solution to that transmitted by the solution of known concentration under identical illumination conditions.
According to Beer–Lambert law, the absorbance of standard solutions is directly proportional to their concentrations. The absorbance determined from the standard solutions can be used to calculate the concentration of an unknown sample solution. Absorption of a solution is proportional to the effective concentration of sample solution, path length (d), and the extinction coefficient.
where is the initial light intensity; is the concentration of sample solution (in moles); is the path length (mm), and is the extinction coefficient ().
After the power is switched on, the light beam from the LED light source is not stable within a period of time of approximately 20 min. In this experiment, a constant current source circuit with a three-terminal adjustable shunt regulator for driving LED was designed. All the square spectrophotometer cells had a reading error not exceeding 0.50% in absorbance when a blank solution sample was measured after thorough cleaning. The processes that follow thereafter consisted of eight separate operations: soil sample of mass 5 g was weighed after placing it into an aluminum box for the determination of soil water content; choosing an appropriate wavelength for a particular nutrient of interest (based on color of the solution) from the joint LED light sources by using an included switching circuit; inserting a cuvette containing a blank solution into one of the cells; collecting background light intensity in a dark room; inserting a solution of known concentration (in a cuvette) into the cells to calibrate the absorbance; placing solutions (in cuvettes) to be measured into the other cells, and the transmitted intensity measured and used to calculate the concentration value. For example, while a solution with known concentration was used as a standard, the concentration of the measured solution can be calculated from the following expression:
where is the absorbance obtained from the known concentration solution; is the absorbance obtained from the known concentration solution; is a wavelength-dependent absorptivity coefficient; is the path length, and is the concentration of a standard solution. Accordingly, the concentration of a measured solution can be calculated by the absorbance of the measured solution.
2.3. Principle Design
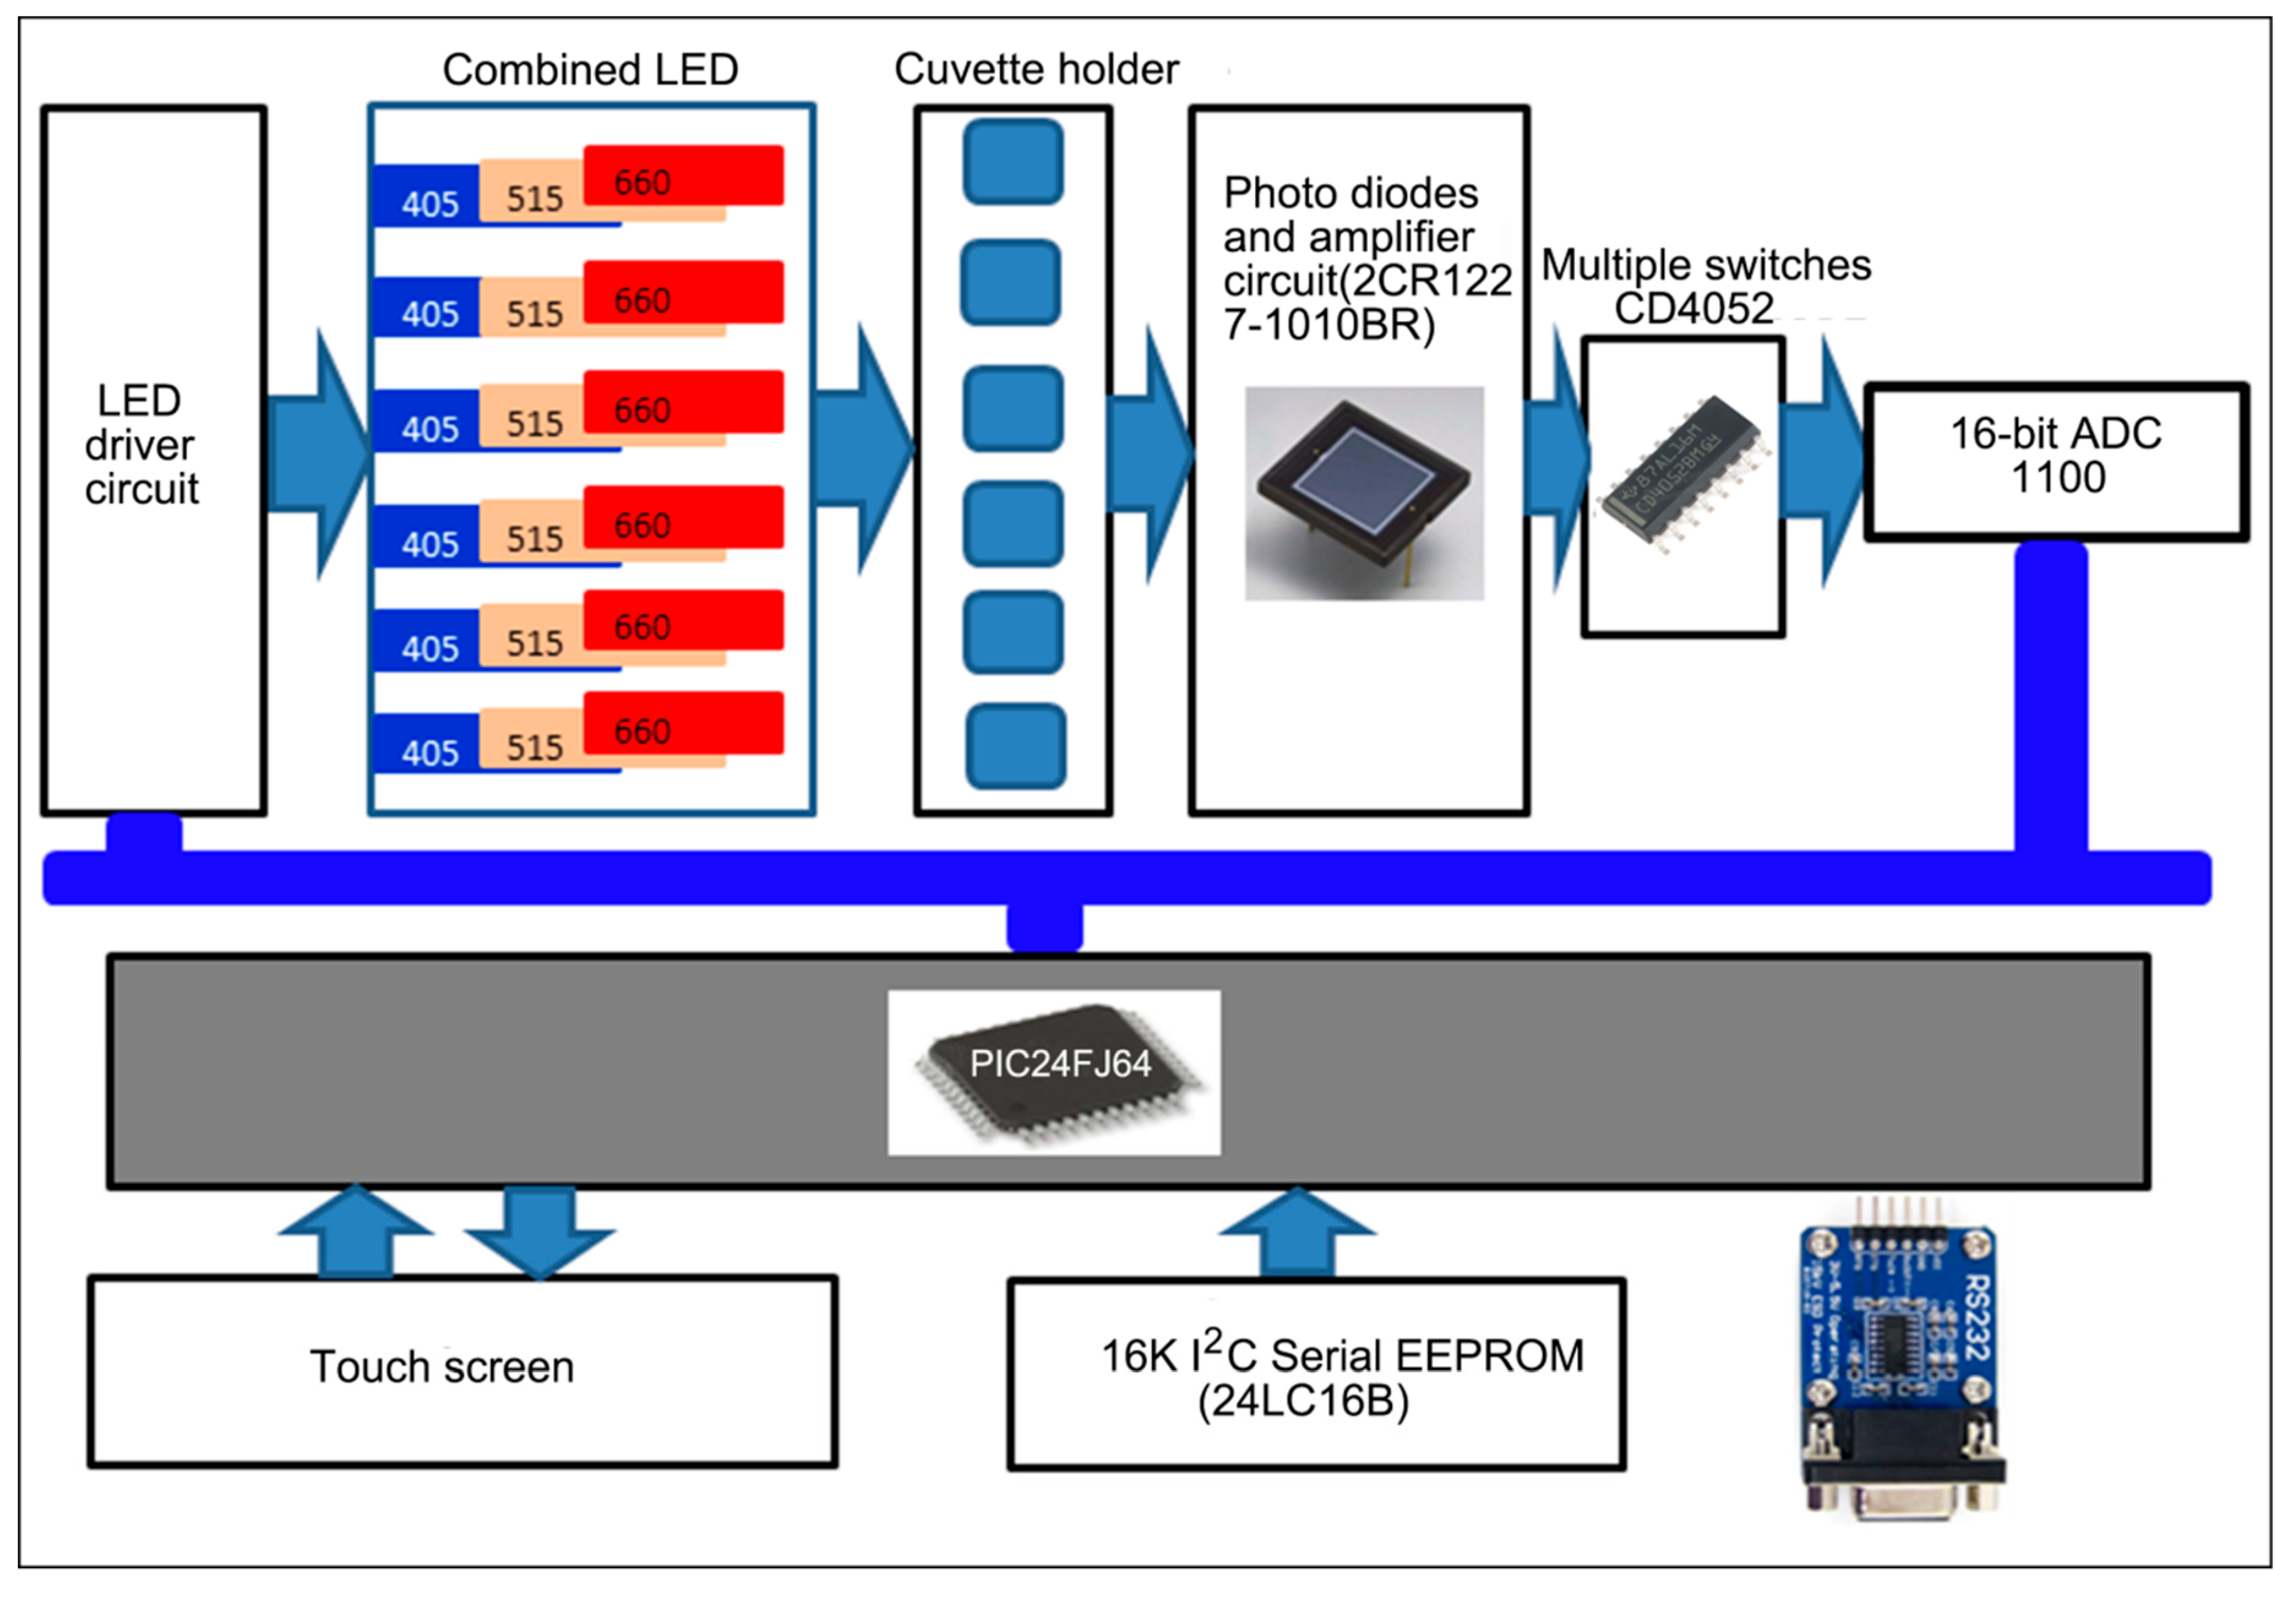
This multichannel optoelectronic system is designed to rapidly detect the concentration of N, P, and K in soil based on the well-known Beer–Lambert law. The scheme was considered in the construction of the measurement system (Figure 1). Figure 1 is mainly composed of joint LED light sources, photodiodes, a cuvette holder for square spectrophotometer cells with approximate outside dimensions of 12.5 × 12.5 × 46 mm and an optical path length of 10 mm, an electronic board including a microcontroller unit (MCU) with amplifiers, a multiple switcher, 16-bit A/D converter ADS1100 (Texas Instruments Incorporated, Dallas, TX, USA), and a touch screen.
The LED driver circuit produces the current pulses for each LED as long as the electric power supply is switched on. Lights go through the square spectrophotometer cells directly and sequentially, and after achieving the desired measurement results of the N, P, K concentrations, the power supply of the LED switches off. The power supply to the LEDs is controlled by the MCU to reach the desired levels automatically. The photodiode 2CR1227 (Hangzhou Yuxuan Electronics Co., Ltd., Hangzhou, China) then measures the transmitted light from the spectrophotometer cells, followed by amplification of these signals by the TLC2654C amplifier (Texas Instruments Incorporated, Dallas, TX, USA). The digital conversions are dependent on the output of the amplifier. The microcontroller unit (PIC24FJ64) offers multiple communication interfaces, including Universal Asynchronous Receiver Transmitter (UART), Serial Peripheral Interface (SPI), and Inter-Integrated Circuit (I2C). An integrated touch-screen controller that drives the relatively high-resolution LCD is also provided by this MCU chip.
2.4. Construction of the Optoelectronic Measurement System
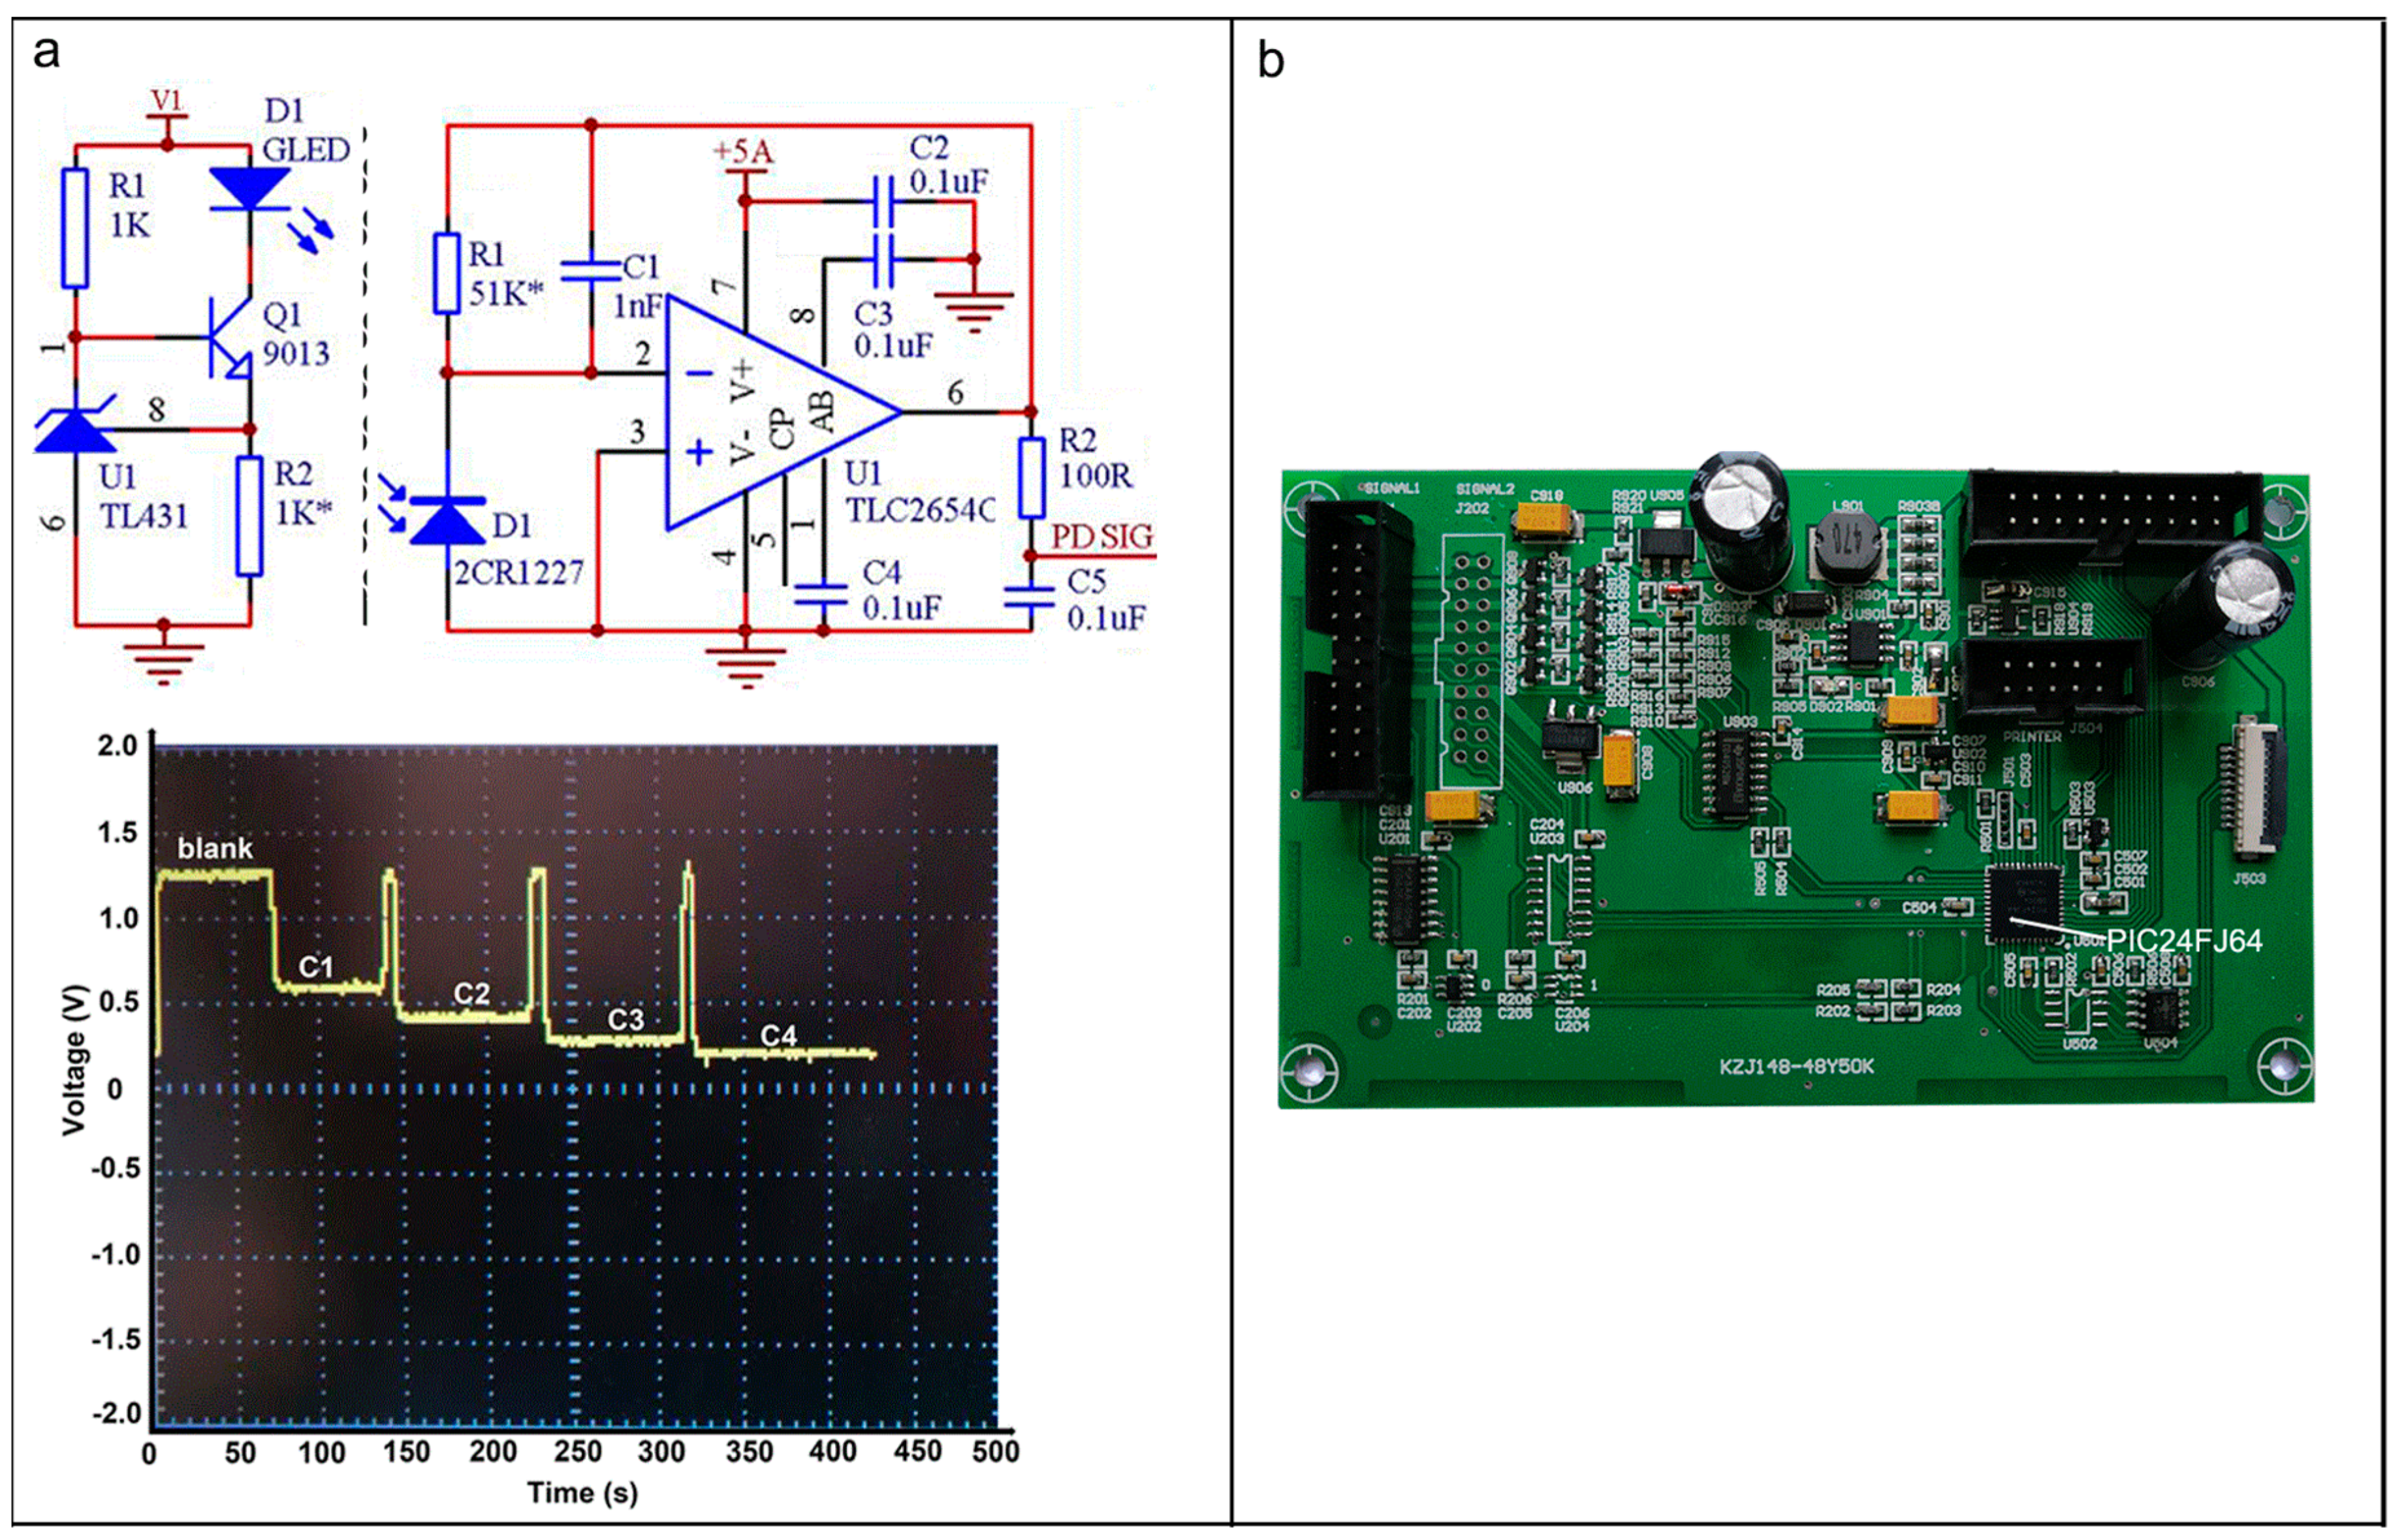
This optoelectronic measurement system requires a photodiode whose 3-dB bandwidth is close to reaching 1 MHz, and we can expect to have a photocurrent of more than 2 mA from the photodiode 2CR1227, whose capacitance is 950 pF. The constant current source circuit with a three-terminal adjustable shunt regulator for driving the LED and the front-end circuit of the photodiode was designed, as shown in Figure 2. The inverting input of amplifier TLC 2654C draws no current. It can always force the voltage there to be close to zero. However, the voltage gain of this amplifier TLC2654C is not infinite, so the swing is not exactly zero. To produce an output voltage , the amplifier TLC2654C requires an input voltage , where is the voltage gain of this amplifier, which rolls off at high frequency. The responding output voltages of the circuit were obtained from the standard phosphorus concentration of 0 (blank), 4000 µg/L (C1), 8000 µg/L (C2), 12,000 µg/L (C3), and 16,000 µg/L (C4) injected into the square spectrophotometer cells, respectively (see the inset in Figure 2a).
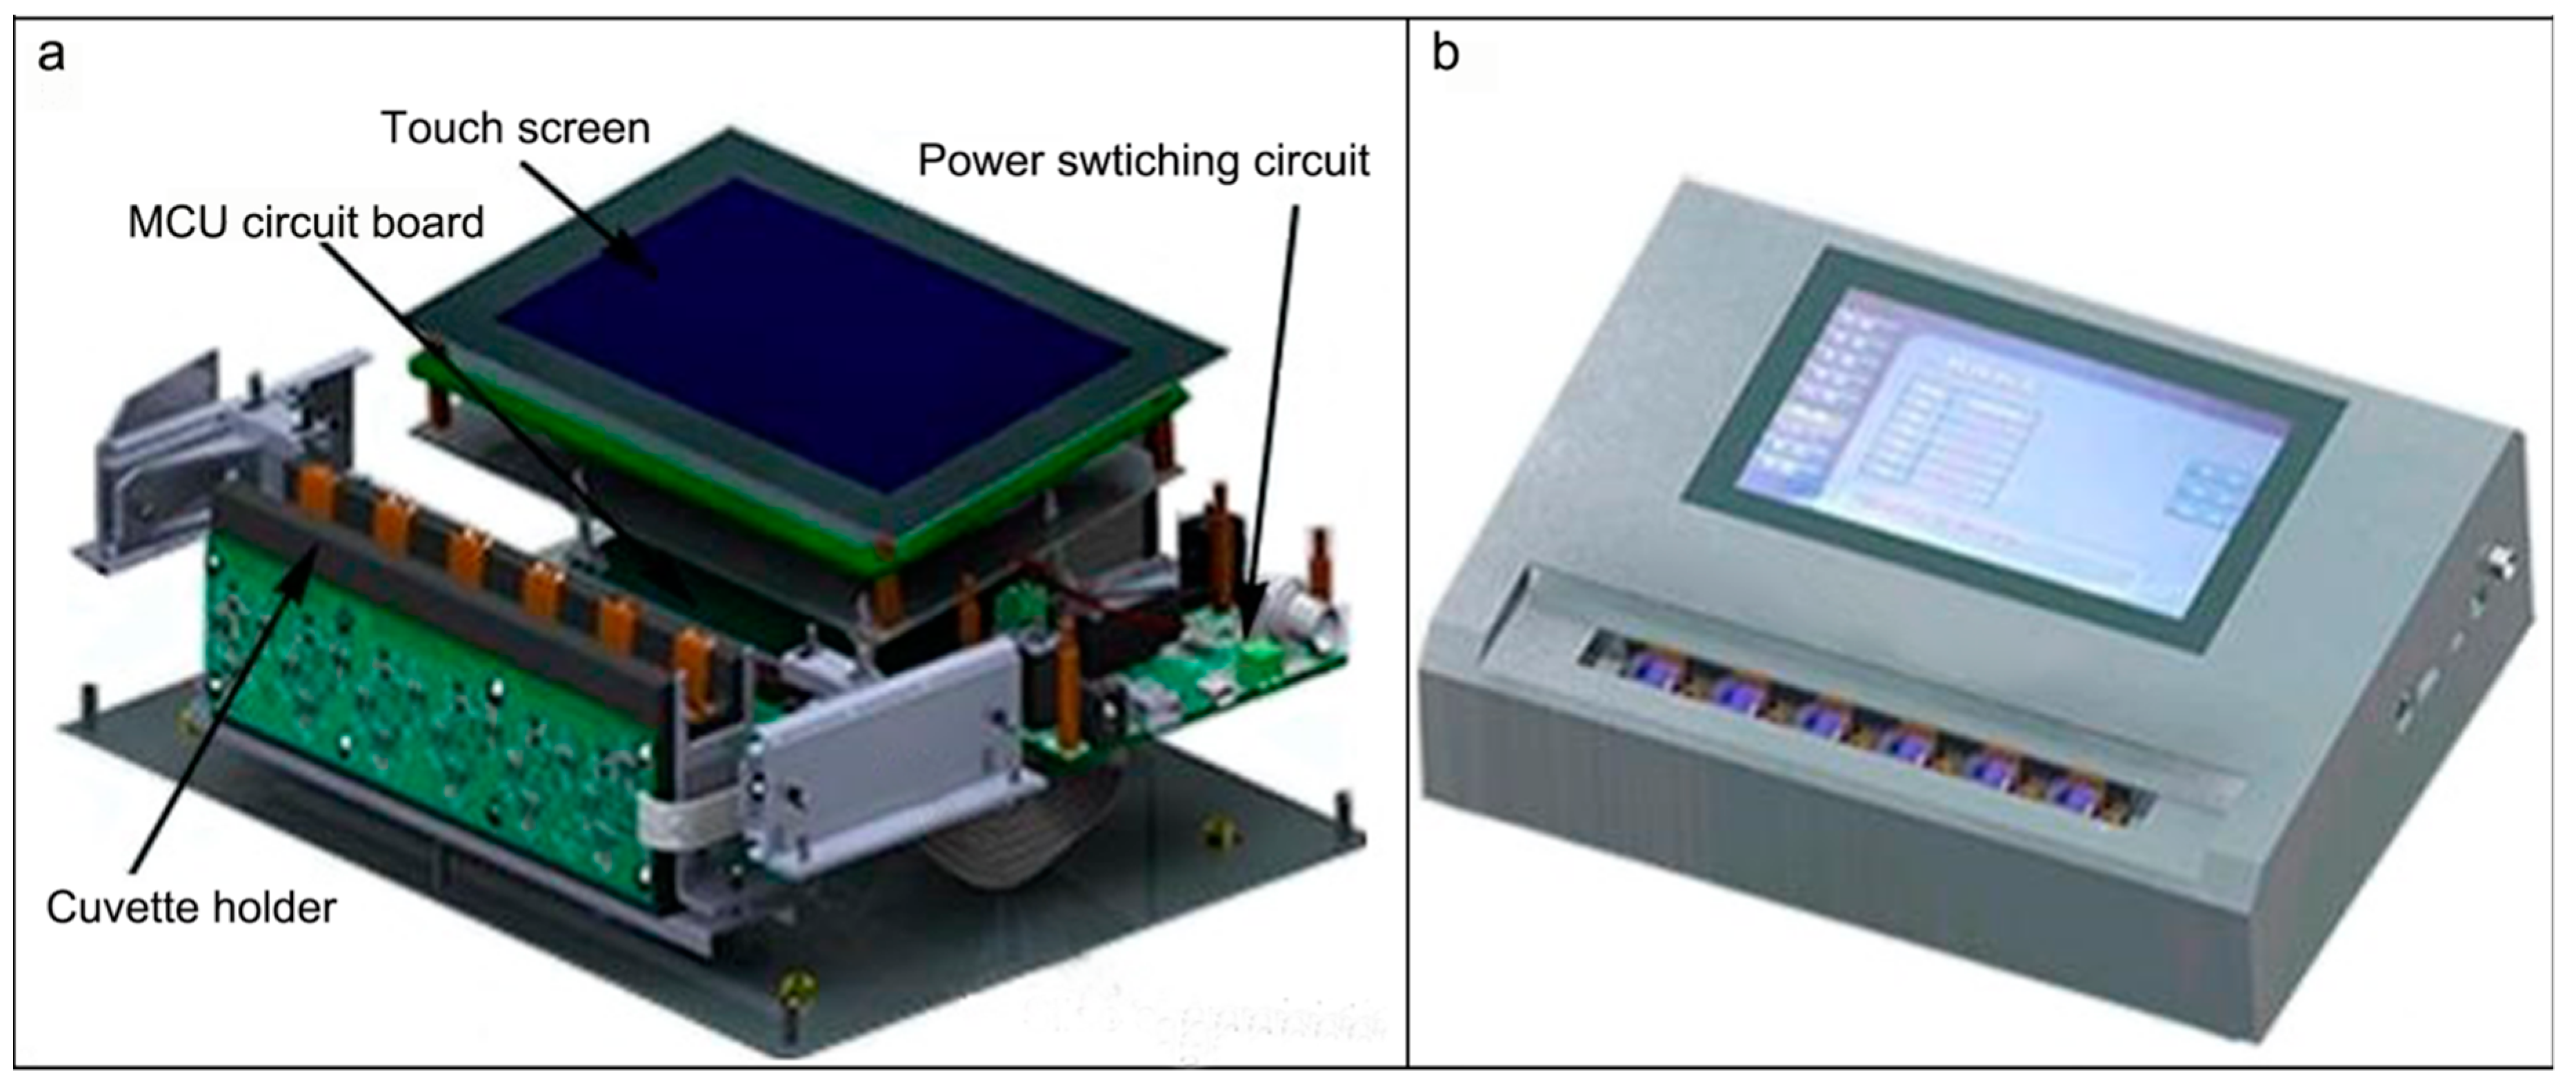
The resulting optoelectronic measurement system after assembling appropriately the 6 joint LEDs, cuvette holder with 6 cells, and 6 photodiodes, an electronic board with a microcontroller (MCU, PIC24FJ64), the amplifier (TLC2654C) and the 16-bit A/D converter ADS1100 is shown diagrammatically in Figure 3a and photographically in Figure 3b. Once the solution with known concentration was placed in position, the multi-channel optoelectronic measurement system was set to obtain the transmitted light intensity. The measured solutions were placed into other positions, and the multi-channel optoelectronic measurement system took the transmitted light intensity again. The concentration of the measured solution can be calculated from Equation 2. The joint LED light sources with peak emission wavelengths of 405 nm, 660 nm, and 515 nm were driven by a constant current to guarantee the stability of the light source. The cuvette holder met the need for precision sampling in absorbance applications. The cuvette holders were crafted firmly to ensure repeatability. A unique positioning system guaranteed that the square spectrophotometer cells stood with the holder centered and upright without tilting. From Figure 3a, cylinder-shaped circular holes for placing joint LED sources were arranged towards photodiodes. Both LED light sources and photodiodes were configured on each side of the cylinder-shaped cuvette holder, and there were 6 square spectrophotometer cells and corresponding photodiodes involved in this measurement system. Extractable nutrients (N, P and K) from 6 samples could then be measured simultaneously. Figure 3a shows the type of the cuvette holder that involves a structure driven manually. The cuvettes were evenly distributed. With this type of a holder, to ensure repeatability of measurement results together with high accuracy, a stable positioning system was designed. The multisample cell was explored in this optoelectronic measurement system and consisted of joint LED light sources having peak emission wavelengths of 405 nm, 660 nm, and 515 nm and photodiodes firmly fixed onto the supporting clamp. However, due to the spatial chromatic nonuniformity in LED lighting sources and photodiodes, the consistency of the measurement results should be calibrated prior to measuring the concentration of the soil nutrients. Figure 3b displays a prototype of this system consisting of 6 cuvette holders, 6 photodiodes, and 6 joint LEDs that were eventually used to design this portable optoelectronic measurement instrument without moving parts with the cost of 700 RMB.
2.5. Absorbance Compensations
For this multichannel optoelectronic measurement system, it is necessary to ensure the consistence of the absorbance from each channel owing to errors existed during absorbance measurement. These errors emanate from the joint LED light source, the cuvettes, and the electronic components in the system. To ensure measurement accuracy of this multichannel optoelectronic measurement system, the light intensity correction was performed prior to the absorbance compensation. Firstly, the transmitted light intensity of the blank solution was recorded. The correction factor of the light intensity of blank solution for each channel was initially calculated by the ratio of the average value of the light intensity to the light intensity from each channel. Then, the absorbance values from soil solutions with known concentrations of the nutrients were obtained from each channel for consistency correction. The average of the transmitted light intensity of the blank solution from 6 channels was calculated. A correction factor was obtained from the average of the transmitted light intensity of the blank solution when the blank solution was placed into the corresponding channel position, divided by the transmitted light intensity from each channel,
where, is the transmitted light intensity of the blank solution from each channel. Consequently, the corrected intensity from each channel was obtained from the measured intensity of light multiplied by the correction factor. Secondly, the consistency of absorbance from different channels was evaluated by placing the soil standard solution into each cuvette in position. The measured absorbance from each channel is expressed as
where, is the transmitted light intensity of the solution of known concentration from each channel and is the transmitted light intensity of the blank solution from each channel. The average value of the absorbance of the standard solution with known concentration was calculated from 6 channels, accordingly. A correction factor was calculated from the absorbance when the solution of known concentration was placed into the corresponding channel position, divided by the measured absorbance,
After that, one cuvette with the blank solution was placed into channel 1 (CH1). The transmitted light intensity of the blank solution from 6 channels was expressed as follows,
Accordingly, one cuvette with the standard solution of known concentration was placed into channel 2. The absorbance of the solution of known concentration from 6 channels is then expressed as follows:
The correction coefficients of the transmitted light intensity of the blank solution and the absorbance of the solution of known concentration from each channel were measured five times. The measurement results of absorbance uncertainty from each channel with different LEDs at the peak emission wavelengths of 405 nm, 660 nm, and 515 nm are shown in Table 1, respectively. From the experimental results, the cumulative relative standard deviations of absorbance from all channels were 1.22%, 1.27%, and 1.00%, respectively. The known concentration of standard solution have the same wavelengths of maximum absorption of N, P, K measurements, respectively.
3. Results and Discussion
3.1. Establishment of the Calibration Curve
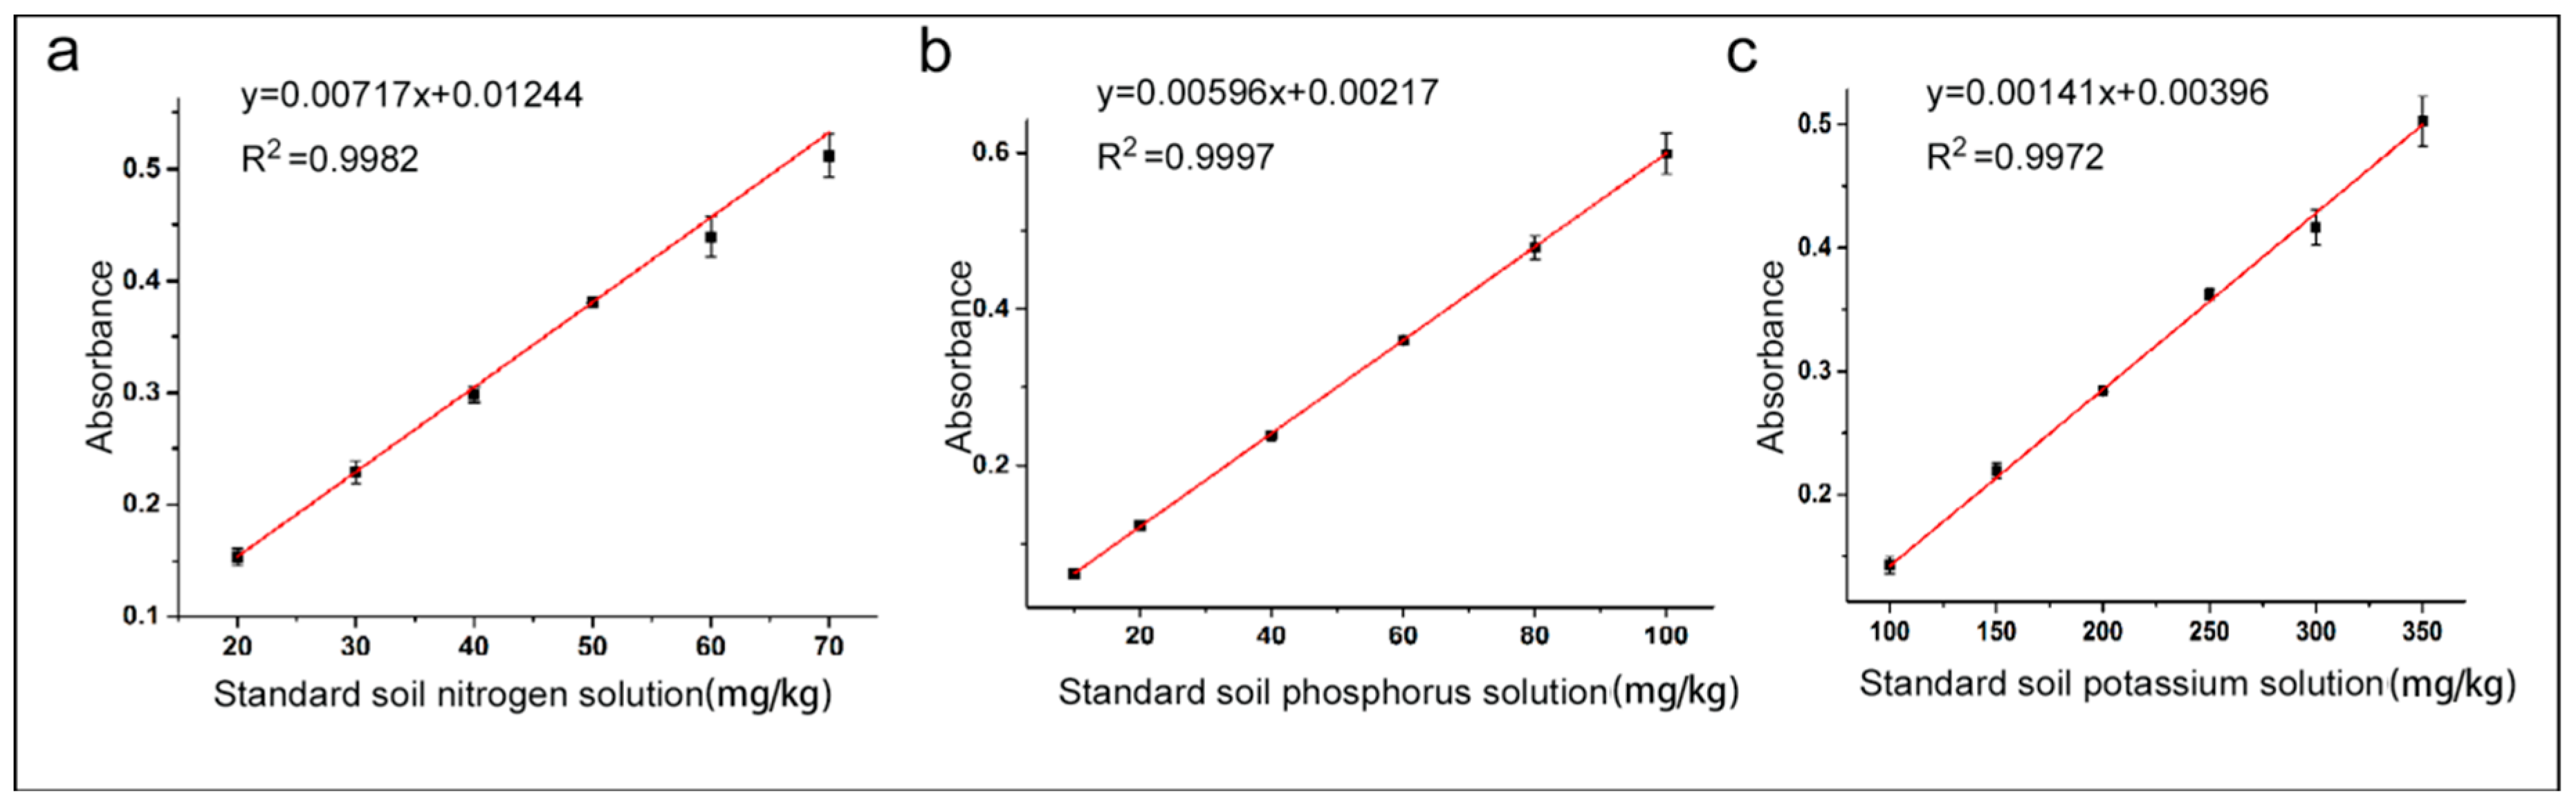
In order to evaluate the performance of this measurement system, firstly, known concentrations of potassium (100, 150, 200, 250, 300, 350 mg/kg), phosphorus (10, 20, 40, 60, 80, 100 mg/kg), and nitrogen (NH4) (20, 30, 40, 50, 60, 70 mg/kg) were arranged to be sequentially measured to establish the measurement model prior to the sample measurement. The maximum relative standard deviations in absorbance were 5.24%, 5.64%, and 4.90% for N, P, K measurements with three repetitions, respectively. The relationship between concentrations of N, P, and K and their corresponding absorbance values is displayed in Figure 4. From these results, it was observed that there exists a linear relationship between absorbance and the concentration of the samples, as expected from Beer–Lambert law. The sensitivity (changes in absorbance per change of analyte concentration) of the optoelectronic device was found to be 7.17, 5.96, and 1.41 µM−1 for N, P, K measurements, respectively.
3.2. Sample Measurements
Sample measurements consisted of three steps: first, putting one of the known concentrations of nitrogen (N), phosphorus (P), and potassium (K) solution into the operation software specially written for this measurement system, adding both blank solution and standard solution into the first and second channels of the cuvette holder and the solutions to be measured placed in other channels. The calibration of absorbance consistency for the channels was then run accordingly. The above calibration process of absorbance consistency was repeated to ensure measurement accuracy before daily sample solution measurements. For validation purposes, the concentrations of the nutrients of interest (NH4-N, P, and K) in the tested soil samples were also determined using conventional lab-based methods that include Nash colorimetric method for measuring nitrogen (NH4-N), the Olsen method for the determination of available phosphorus in calcareous soil for measuring phosphorus (P), and flame photometer for measuring potassium (K), respectively. The measurement results from both methods are shown in Table 2.
The relationship between the concentration results of NH4-N, P, and K as measured using our optoelectronic device and the conventional methods was shown in Figure 5a–c. The R2 values were 0.9010, 0.9471, and 0.8923, respectively.
4. Conclusions
In this paper, we demonstrated that the optoelectronic measurement system based on joint LED light sources with a multichannel cuvette holder can be used to measure the concentration of N, P, K rapidly and conveniently. The concentration of measured solutions conforms to the Beer–Lambert law, which is described together with the absorbance compensation. Prior to the practical measurement of soil samples, the absorbance compensation was initially applied to correct the absorbance across different channels to ensure measurement accuracy of this system. Then, the absorbance was considered to vary linearly to N, P, K concentrations in the measurement range. The cumulative relative standard deviations of absorbance from all channels were 1.22%, 1.27%, and 1.00%, respectively. The soil was randomly sampled at a sampling depth of 20 cm from a wheat field in Tianchi town, Sanmenxia city, Henan province. The experiment results show high correlations (R2 = 0.9010, 0.9471, and 0.8923) between the absorbance at certain peak emission wavelengths (405 nm, 660 nm, and 515 nm) and their respective nutrient concentration in soil samples. Based on these results, this multichannel measurement system was developed in-house to measure soil nutrients, providing a reliable and robust method for portable and rapid measurement of soil nutrients. It provides capabilities for more effective, continuous, and site-specific nutrient measurement for use in identification of the correct fertilizer for use in farms. In addition, this multichannel measurement system and the optoelectronic measurement methods can be further applied for the detection of pesticide residues and heavy metals, as well as other related applications involving biometrics.
Author Contributions
L.M. and Y.Y. conceived and designed the experiments, W.Z. performed the experiments, Z.L. wrote the software, S.L. analyzed the data, J.H. wrote the original draft, and Z.B. reviewed the paper.
Funding
This research was funded by the National Key Research and Development Program of China (2017YFD0801204), National Natural Science Foundation of China (31671581), Natural Science Foundation of Henan Province (162300410143), Henan International Joint Laboratory of Laser Technology in Agriculture Sciences, State Key Laboratory of Wheat and Maize Crop Science Funding (SKL2014ZH-06, 39990026).
Conflicts of Interest
The authors declare no conflict of interest.
References
- Cardoso, I.M.; Kuyper, T.W. Mycorrhizas and tropical soil fertility. Agric. Ecosyst. Environ. 2006, 116, 72–84. [Google Scholar] [CrossRef]
- Zhu, Z.L.; Chen, D.L. Nitrogen fertilizer use in China-contributions to food production, impacts on the environment and best management strategies. Nutr. Cycl. Agroecosyst. 2002, 63, 117–127. [Google Scholar] [CrossRef]
- Liu, Q.; Zhang, J.F.; Xu, M.J.; Zhang, B. The effect of climate changes on maize yield in a long-term fertilization experiment in the Huang-Huai-Hai Plain of China. J. Food Agric. Environ. 2010, 8, 754–758. [Google Scholar]
- Srivastava, P.K.; Gupta, M.; Upadhyay, R.K.; Sharma, S.; Shikha Singh, N.; Tewari, S.K.; Singh, B. Effects of combined application of vermicompost and mineral fertilizer on the growth of Allium cepa L. and soil fertility. J. Plant Nutr. Soil Sci. 2012, 175, 101–107. [Google Scholar] [CrossRef]
- Zhang, H.; Yu, C.; Kong, X.; Hou, D.; Gu, J.; Liu, L.; Wang, Z.; Yang, J. Progressive integrative crop managements increase grain yield, nitrogen use efficiency and irrigation water productivity in rice. Field Crops Res. 2018, 215, 1–11. [Google Scholar] [CrossRef]
- Kim, M.-K.; Kwon, S.-I.; Jung, G.-B.; Kim, M.-Y.; Lee, S.-B.; Lee, D.-B. Phosphorus losses from agricultural soils to surface waters in a small agricultural watershed. Biosyst. Eng. 2011, 109, 10–11. [Google Scholar] [CrossRef]
- Sun, S.; Delgado, M.S.; Sesmero, J.P. Dynamic adjustment in agricultural practices to economic incentives aiming to decrease fertilizer application. J. Environ. Manag. 2016, 177, 192–201. [Google Scholar] [CrossRef] [PubMed]
- Pan, D.; Zhang, N. The role of agricultural training on fertilizer use knowledge: A randomized controlled experiment. Ecol. Econ. 2018, 148, 77–91. [Google Scholar] [CrossRef]
- Smith, L.; Siciliano, G.A. Comprehensive review of constraints to improved management of fertilizers in China and mitigation of diffuse water pollution from agriculture. Agric. Ecosyst. Environ. 2015, 11, 15–25. [Google Scholar] [CrossRef]
- Pan, D.; Kong, F.; Zhang, N.; Ying, R. Knowledge training and the change of fertilizer use intensity: Evidence from wheat farmers in china. J. Environ. Manag. 2017, 197, 130–139. [Google Scholar] [CrossRef]
- Zhang, F.; Cui, Z.; Chen, X.; Ju, X.; Shen, J.; Chen, Q.; Liu, X.; Zhang, W.; Mi, G.; Fan, M.; et al. Integrated nutrient management for food security and environmental quality in China. Adv. Agron. 2012, 116, 1–40. [Google Scholar]
- Sinfield, J.V.; Fagerman, D.; Colic, O. Evaluation of sensing technologies for on-the-go detection of macro-nutrients in cultivated soils. Comput. Electron. Agric. 2010, 70, 1–18. [Google Scholar] [CrossRef]
- Ge, Y.; Thomasson, J.A.; Sui, R. Remote sensing of soil properties in precision agriculture: A review. Front. Earth Sci. 2011, 5, 229–238. [Google Scholar] [CrossRef]
- Mulder, V.L.; Bruin, S.D.; Schaepman, M.E.; Mayr, T.R. The use of remote sensing in soil and terrain mapping-a review. Geoderma 2011, 162, 1–19. [Google Scholar] [CrossRef]
- Baruah, B.K.; Das, B.; Medhi, C.; Chitrani, M.; Abani, K.M. Fertility status of soil in the tea garden belts of Golaghat District, Assam, India. J. Chem. 2013, 1, 11–23. [Google Scholar] [CrossRef]
- Cho, Y.; Sudduth, K.A.; Chung, S.O. Soil physical property estimation from soil strength and apparent electrical conductivity sensor data. Biosyst. Eng. 2016, 152, 68–78. [Google Scholar] [CrossRef]
- Adamchuk, V.I.; Lund, E.D.; Sethuramasamyraja, B.; Morgan, M.T.; Dobermann, A.; Marx, D.B. Direct measurement of soil chemical properties on-the-go using ion-selective electrodes. Comput. Electron. Agric. 2005, 48, 272–294. [Google Scholar] [CrossRef]
- Wang, Y.; Huang, T.; Liu, J.; Lin, Z.; Li, S.; Wang, R.; Ge, Y. Soil pH value, organic matter and macronutrients contents prediction using optical diffuse reflectance spectroscopy. Comput. Electron. Agric. 2015, 111, 69–77. [Google Scholar] [CrossRef]
- Tully, K.L.; Weil, R. Ion-selective electrode offers accurate, inexpensive method for analyzing soil solution nitrate in remote regions. Commun. Soil Sci. Plant Anal. 2014, 45, 1974–1980. [Google Scholar] [CrossRef]
- Zhang, M.; Wang, M.; Chen, L.; Ang, S.S.; Nguyen, C.V.; Zhu, J. An automatic fluidic system for the rapid detection of soil nutrients. Autom. Logist. 2008, 1, 2742–2746. [Google Scholar]
- Ali, M.A.; Jiang, H.; Mahal, N.K.; Weber, R.J.; Kumar, R.; Castellano, M.J.; Dong, L. Microfluidic impedimetric sensor for soil nitrate detection using graphene oxide and conductive nanofibers enabled sensing interface. Sens. Actuators B Chem. 2017, 239, 1289–1299. [Google Scholar] [CrossRef]
- Iznaga, A.C.; Orozco, M.R.; Alcantara, E.A.; Pairol, M.C.; Sicilia, Y.E.D.; Baerdemaeker, J.D.; Saeys, W. Vis/NIR spectroscopic measurement of selected soil fertility parameters of cuban agricultural cambisols. Biosyst. Eng. 2014, 125, 105–121. [Google Scholar] [CrossRef]
- Chang, C.W.; Laird, D.A.; Mausbach, M.J.; Hurburgh, C.R. Near-infrared reflectance spectroscopy-principal components regression analyses of soil properties. Soil Sci. Soc. Am. J. 2001, 65, 480–490. [Google Scholar] [CrossRef]
- Liu, R.T.; Tao, L.Q.; Liu, B.; Tian, X.G.; Mohammad, M.; Yang, Y.; Ren, T.L. A miniaturized on-chip colorimeter for detecting NPK elements. Sensors 2016, 16, 1234. [Google Scholar] [CrossRef] [PubMed]
Figure 1.
Block diagram of the multichannel optoelectronic measurement system. This system is controlled by a microcontroller chip (PIC24FJ64). LED: light-emitting diode.
Figure 1.
Block diagram of the multichannel optoelectronic measurement system. This system is controlled by a microcontroller chip (PIC24FJ64). LED: light-emitting diode.

Figure 2.
The circuits of the multichannel optoelectronic measurement system. (a) The diagram of the constant current source circuit with a three-terminal adjustable shunt regulator for driving LED, the front-end circuit of an impedance amplifier for the photodiode and the responding output voltages of the circuits displayed on the oscilloscope. (b) The prototype of the microcontroller unit (MCU) circuit board, including a chip of PIC24FJ64, a 16-bit A/D converter ADS1100, and a multiple switcher CD4051.

Figure 3.
Multichannel optoelectronic measurement system: (a) components of the multichannel optoelectronic system, (b) prototype of the multichannel optoelectronic measurement system.
Figure 3.
Multichannel optoelectronic measurement system: (a) components of the multichannel optoelectronic system, (b) prototype of the multichannel optoelectronic measurement system.

Figure 4.
Calibration curves of nitrogen, phosphorus and potassium obtained from the multichannel optoelectronic measurement system: (a) the calibration curve obtained from the known concentrations of nitrogen, (b) the calibration curve obtained from the known concentrations of phosphorus, (c) the calibration curve obtained from the known concentrations of potassium.

Figure 5.
Comparison analysis of measurement results obtained from both conventional lab-based method and this multichannel optoelectronic measurement system: (a) the relationship of measured nitrogen established by the Nash colorimetric method, (b) the relationship of measured available phosphorus established by the Olsen method, (c) the relationship of measured potassium established by the Flame photometer method.


Table 1.
Results of absorbance uncertainty obtained from 6 channels.
| Wavelength | Standard Concentration (μg/L) | Absorbance from 6 Channels | Mean | RSD (%) | |||||
|---|---|---|---|---|---|---|---|---|---|
| CH1 | CH2 | CH3 | CH4 | CH5 | CH6 | ||||
| 405 nm | 30 (Nitrogen) | 0.1512 | 0.1563 | 0.1519 | 0.1548 | 0.1541 | 0.1535 | 0.1536 | 1.22 |
| 660 nm | 4000 (Phosphorus) | 0.1254 | 0.1278 | 0.1285 | 0.1276 | 0.1282 | 0.1246 | 0.1270 | 1.27 |
| 515 nm | 2000 (Potassium) | 0.1268 | 0.1289 | 0.1281 | 0.1267 | 0.1287 | 0.1257 | 0.1275 | 1.00 |
Table 2.
Measurement results from both conventional lab-based methods and this optoelectronic measurement system.
Table 2.
Measurement results from both conventional lab-based methods and this optoelectronic measurement system.
| Sample | Conventional Method (mg/kg) | This Method (mg/kg) | ||||
|---|---|---|---|---|---|---|
| P2O5-P | K2O-K | NH4+-N | P2O5-P | K2O-K | NH4+-N | |
| 1 | 29.48 | 120.00 | 54.26 | 20.72 | 163.60 | 79.56 |
| 2 | 45.89 | 129.60 | 51.79 | 37.93 | 164.50 | 68.67 |
| 3 | 23.75 | 165.60 | 61.66 | 22.50 | 181.90 | 93.08 |
| 4 | 40.99 | 159.20 | 44.39 | 39.87 | 187.30 | 77.40 |
| 5 | 39.67 | 104.40 | 38.22 | 28.69 | 123.00 | 53.13 |
| 6 | 25.66 | 117.60 | 46.86 | 24.88 | 145.50 | 69.40 |
| 7 | 22.69 | 169.20 | 15.73 | 23.54 | 183.20 | 23.30 |
| 8 | 14.40 | 92.40 | 17.27 | 17.29 | 118.00 | 20.03 |
| 9 | 11.47 | 85.20 | 13.70 | 12.65 | 101.60 | 18.52 |
| 10 | 99.07 | 104.40 | 33.52 | 69.02 | 123.00 | 31.04 |
| 11 | 56.55 | 88.80 | 6.17 | 49.68 | 95.50 | 22.09 |
| 12 | 15.47 | 120.60 | 8.26 | 19.16 | 137.20 | 20.84 |
© 2019 by the authors. Licensee MDPI, Basel, Switzerland. This article is an open access article distributed under the terms and conditions of the Creative Commons Attribution (CC BY) license (http://creativecommons.org/licenses/by/4.0/).
Share and Cite
MDPI and ACS Style
Ma, L.; Li, Z.; Birech, Z.; Li, S.; Yang, Y.; Zhang, W.; Hu, J. Multi-Channel Optoelectronic Measurement System for Soil Nutrients Analysis. Electronics 2019, 8, 451. https://doi.org/10.3390/electronics8040451
AMA Style
Ma L, Li Z, Birech Z, Li S, Yang Y, Zhang W, Hu J. Multi-Channel Optoelectronic Measurement System for Soil Nutrients Analysis. Electronics. 2019; 8(4):451. https://doi.org/10.3390/electronics8040451
Chicago/Turabian StyleMa, Liuzheng, Zhenfeng Li, Zephania Birech, Shixin Li, Yatao Yang, Wei Zhang, and Jiandong Hu. 2019. "Multi-Channel Optoelectronic Measurement System for Soil Nutrients Analysis" Electronics 8, no. 4: 451. https://doi.org/10.3390/electronics8040451
Note that from the first issue of 2016, this journal uses article numbers instead of page numbers. See further details here.