Article

Stereo Matching in Address-Event-Representation (AER) Bio-Inspired Binocular Systems in a Field-Programmable Gate Array (FPGA)

by
Manuel Domínguez-Morales
*,
Juan P. Domínguez-Morales
,
Ángel Jiménez-Fernández
,
Alejandro Linares-Barranco
and
Gabriel Jiménez-Moreno
Robotics and Computer Technology Lab, University of Seville, 41012 Seville, Spain
*
Author to whom correspondence should be addressed.
Electronics 2019, 8(4), 410; https://doi.org/10.3390/electronics8040410
Submission received: 10 March 2019 / Revised: 1 April 2019 / Accepted: 3 April 2019 / Published: 8 April 2019
(This article belongs to the Special Issue Emerging Applications of Recent FPGA Architectures)

Abstract

:
In stereo-vision processing, the image-matching step is essential for results, although it involves a very high computational cost. Moreover, the more information is processed, the more time is spent by the matching algorithm, and the more inefficient it is. Spike-based processing is a relatively new approach that implements processing methods by manipulating spikes one by one at the time they are transmitted, like a human brain. The mammal nervous system can solve much more complex problems, such as visual recognition by manipulating neuron spikes. The spike-based philosophy for visual information processing based on the neuro-inspired address-event-representation (AER) is currently achieving very high performance. The aim of this work was to study the viability of a matching mechanism in stereo-vision systems, using AER codification and its implementation in a field-programmable gate array (FPGA). Some studies have been done before in an AER system with monitored data using a computer; however, this kind of mechanism has not been implemented directly on hardware. To this end, an epipolar geometry basis applied to AER systems was studied and implemented, with other restrictions, in order to achieve good results in a real-time scenario. The results and conclusions are shown, and the viability of its implementation is proven.

1. Introduction

Image processing in digital computer systems usually consider visual information as a sequence of frames. These frames are taken from cameras that capture reality for a short period of time. They are renewed and transmitted at a rate between 25 and 30 frames per second (in a typical real-time scenario). Digital video processing must process each frame in order to obtain a filter result or detect a feature in the input. Classical machine vision started by using a single camera [1] as a system sensor in order to perform a treatment for each of the frames obtained by that camera. This method provides a controlled environment, but lacks certain aspects of human vision, such as 3D vision, distance calculation, trajectories, etc.
Currently, humankind has experienced a breakthrough in the field of computer vision. This improvement is related to the use of a greater number of cameras in a scene [2]. Trying to mimic human vision, researchers usually work with a two-camera system, called a stereo vision system. In a typical stereo vision processing scenario, implemented algorithms use frames from two digital cameras and process them, trying to obtain certain information by the fusion of both data flows. Video processing in stereo vision covers many stages during its journey: from the calibration of the cameras [3,4] to the final outcome, such as distance measurements or 3D reconstruction [5,6]. Every step works with frames, processing them pixel by pixel, trying to obtain some patterns or characteristics from the pixels’ information, or applying some filters to them. Stereo vision has a wide range of potential application areas, including three-dimensional map building, data visualization, robot pick and place, etc.
From all the steps involved in the stereo vision process, the most computationally expensive one is matching [7] (this phase includes the pre-processing steps, such as feature extraction, searching space reduction, etc.). The aim of this stage is to find the correspondences between the projections of both cameras, in order to estimate the real position of the object in space. In classical machine vision systems (with classical visual sensors), to obtain a real-time matching process, a high-performance computer is needed; this fact usually implies a high-power consumption. There are some commercial solutions that solve the matching problem with relatively low power consumption (~1 Watt), such as the Intel R200 camera.
On the other hand, there is a relatively new research community that aims to mimic the neural information processing and transmission used by neurons: neuromorphic engineering [8,9,10]. Research groups inside this community have developed visual sensors (among others) that receive and transmit the information perceived in the way that retinas do [11,12], using spiking information with pulse frequency modulation (PFM). Other groups process the information using microcontrollers or computers [3,13], and other research labs implement the processing mechanisms into dedicated hardware (field-programmable gate arrays (FPGAs) or Complex Programmable Logic Device (CPLDs)) to reduce power consumption and process the information in a parallel way [14,15,16,17]. For this work, we need a neuro-inspired visual sensor, since the processing will be based on spikes; thus, application-specific integrated circuit (ASIC) solutions, such as Intel R200 commented before, cannot be used. Are these bio-inspired systems able to perform classical stereo vision processing like the stereo matching step?
The content of this work is organized as follows. In Section 2, the modification of the matching process applied to a bio-inspired system and its FPGA implementation are presented. After that, in Section 3, several tests done to the system are presented and the conclusions of this work are discussed.

2. Materials and Methods
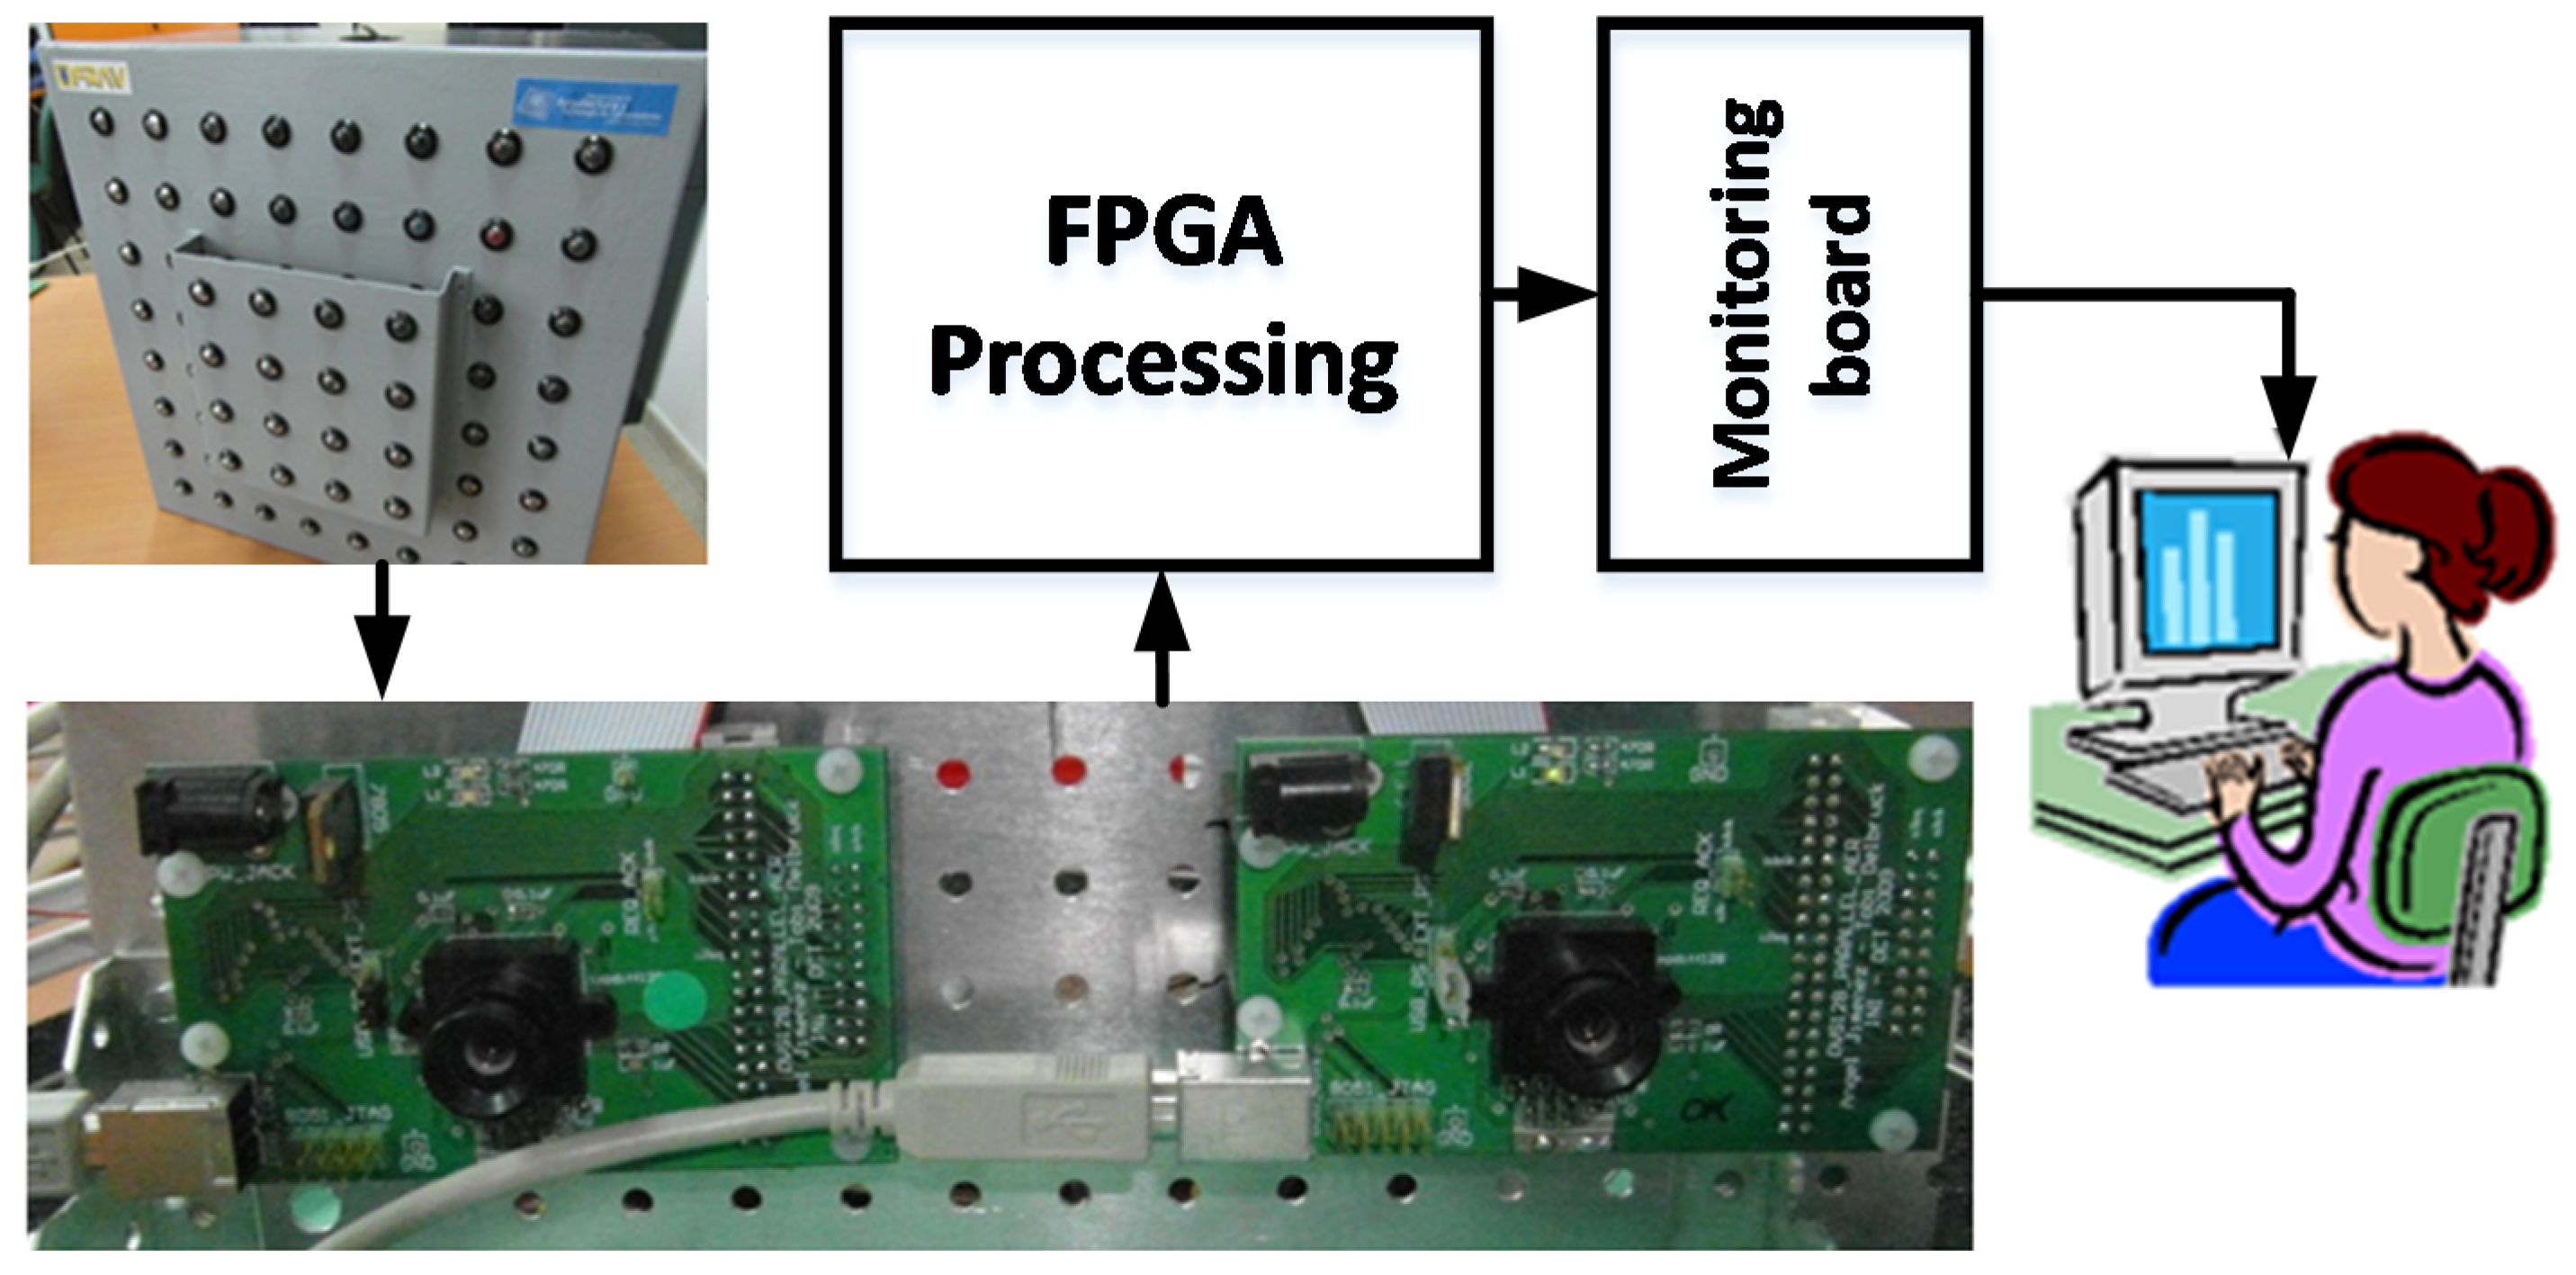
This section is divided into two subsections. In Section 2.1, the hardware items used in this work are presented. Then, the matching process used is described.

2.1. Hardware

There are four hardware components (besides the computer) that are essential to this work. These items are briefly described below.

2.1.1. Address-Event-Representation (AER) Retina

This spiking visual sensor is one of the types used by neuromorphic engineers in their projects. Making a brief summary of the existing neuro-inspired vision sensors, there are three camera models, all built around the same chip that implements the dynamic vision sensor Tmpdiff128: the retina DVS128, the DVS128_PAER, and the eDVS128 [11].
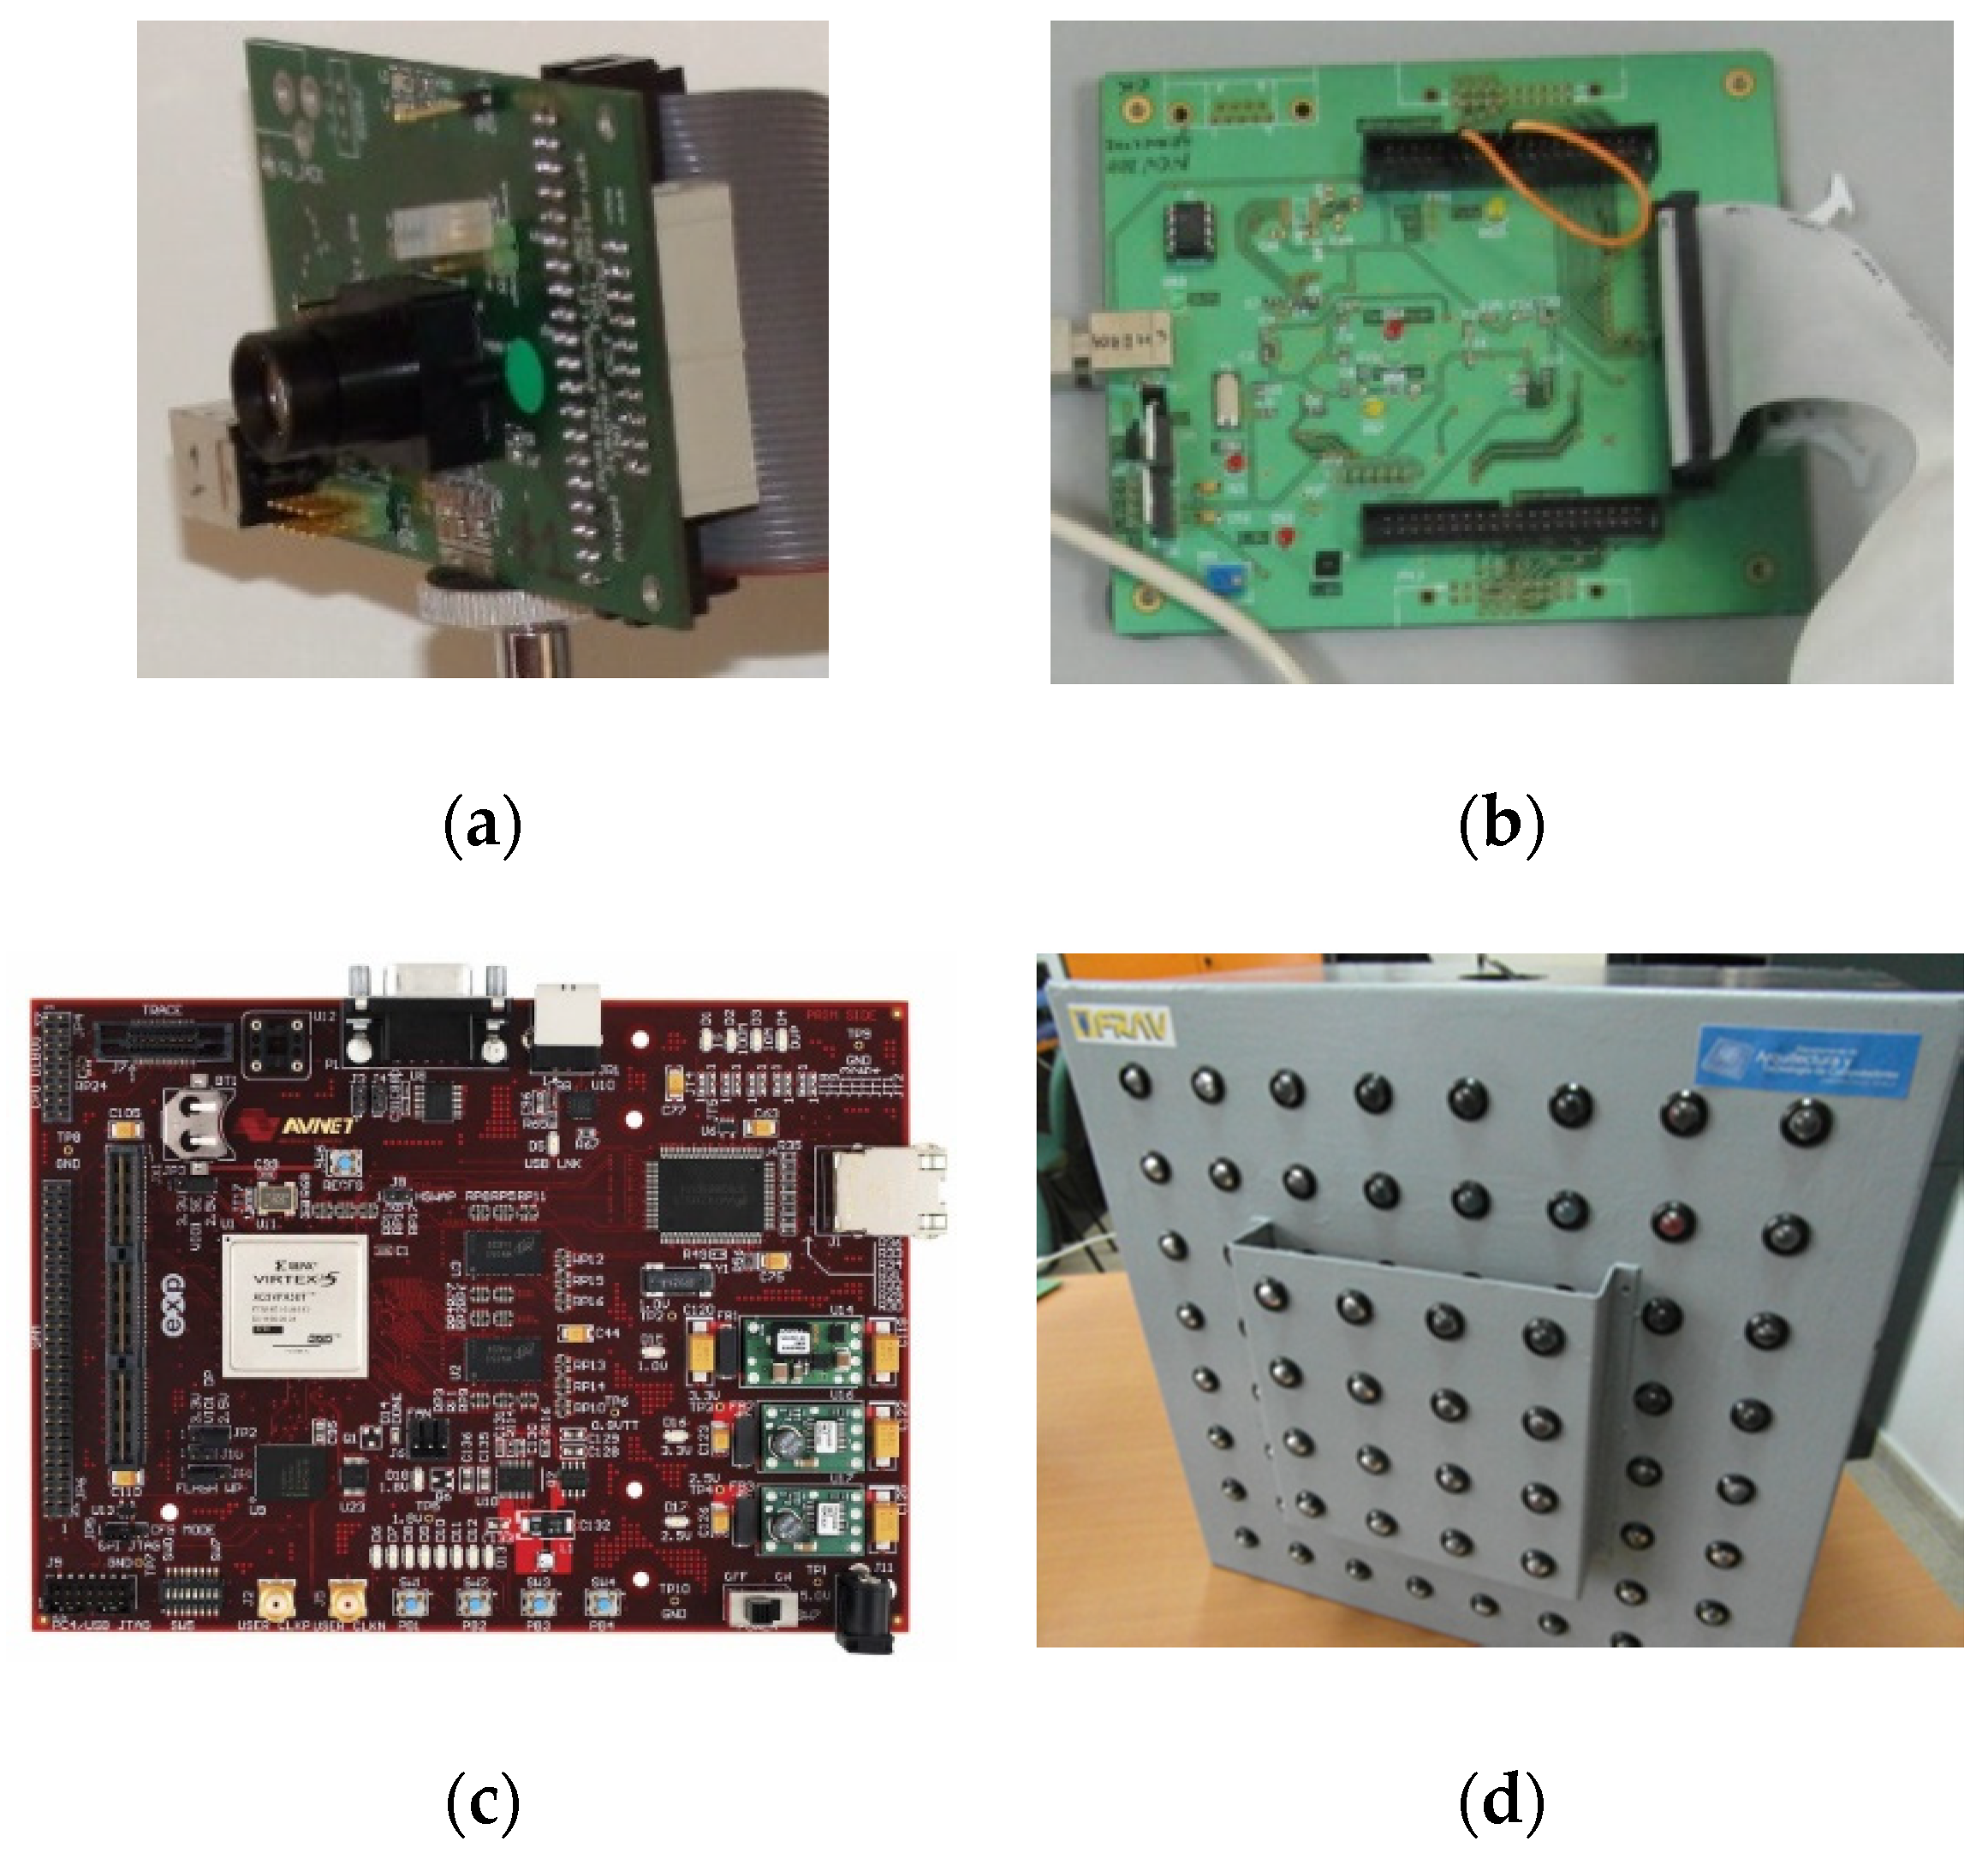
  • DVS128: A camera that has a single high-speed USB 2.0, to send the spiking information, and a plastic case with integrated tripod mount and camera sync connector pins. The DVS128 is intended for jAER software.
  • DVS128_PAER: A bare-board camera that offers parallel AER connectors for direct interfacing of the DVS sensor to other AER systems, supporting two connector standards (Rome and CAVIAR). It has also a USB 2.0 port. Our research group worked on European Project CAVIAR [10] and the sensor board was designed by our group.
  • eDVS128: An embedded camera that integrates the Tmpdiff128 sensor chip with a 32-bit microcontroller.
In this work, the DVS128_PAER was used. This is the only component that sends raw information through a parallel bus; therefore, this is the best option for connecting to other AER hardware systems (see Figure 1a).

2.1.2. AER Monitoring Board

USBAERmini2 board [18] consists of two main components: A USB 2.0 Cypress transceiver and a Xilinx Coolrunner CPLD (see Figure 1b). Its main uses are focused on two aspects: Monitoring the traffic of AER events on a bus (for this it has parallel IDE and Roman connector connections) and reproducing a sequence of AER events stored in the computer (this sequence can be recorded using the software jAER).

2.1.3. Virtex-5 FPGA

Virtex-5 FXT evaluation kit. It consists mainly of a Xilinx Virtex-5 XC5VFX30T-FF665 FPGA and some communication ports, such as RS-232, USB, and Ethernet. In addition, it has an expansion port, which allows to connect a plate with multiple GPIOs (General Purpose Input/Output) accessible by the user (see Figure 1c). This board was the processing core for all the tests. A custom AER expansion board was soldered to connect AER retinas to the FPGA expansion port.

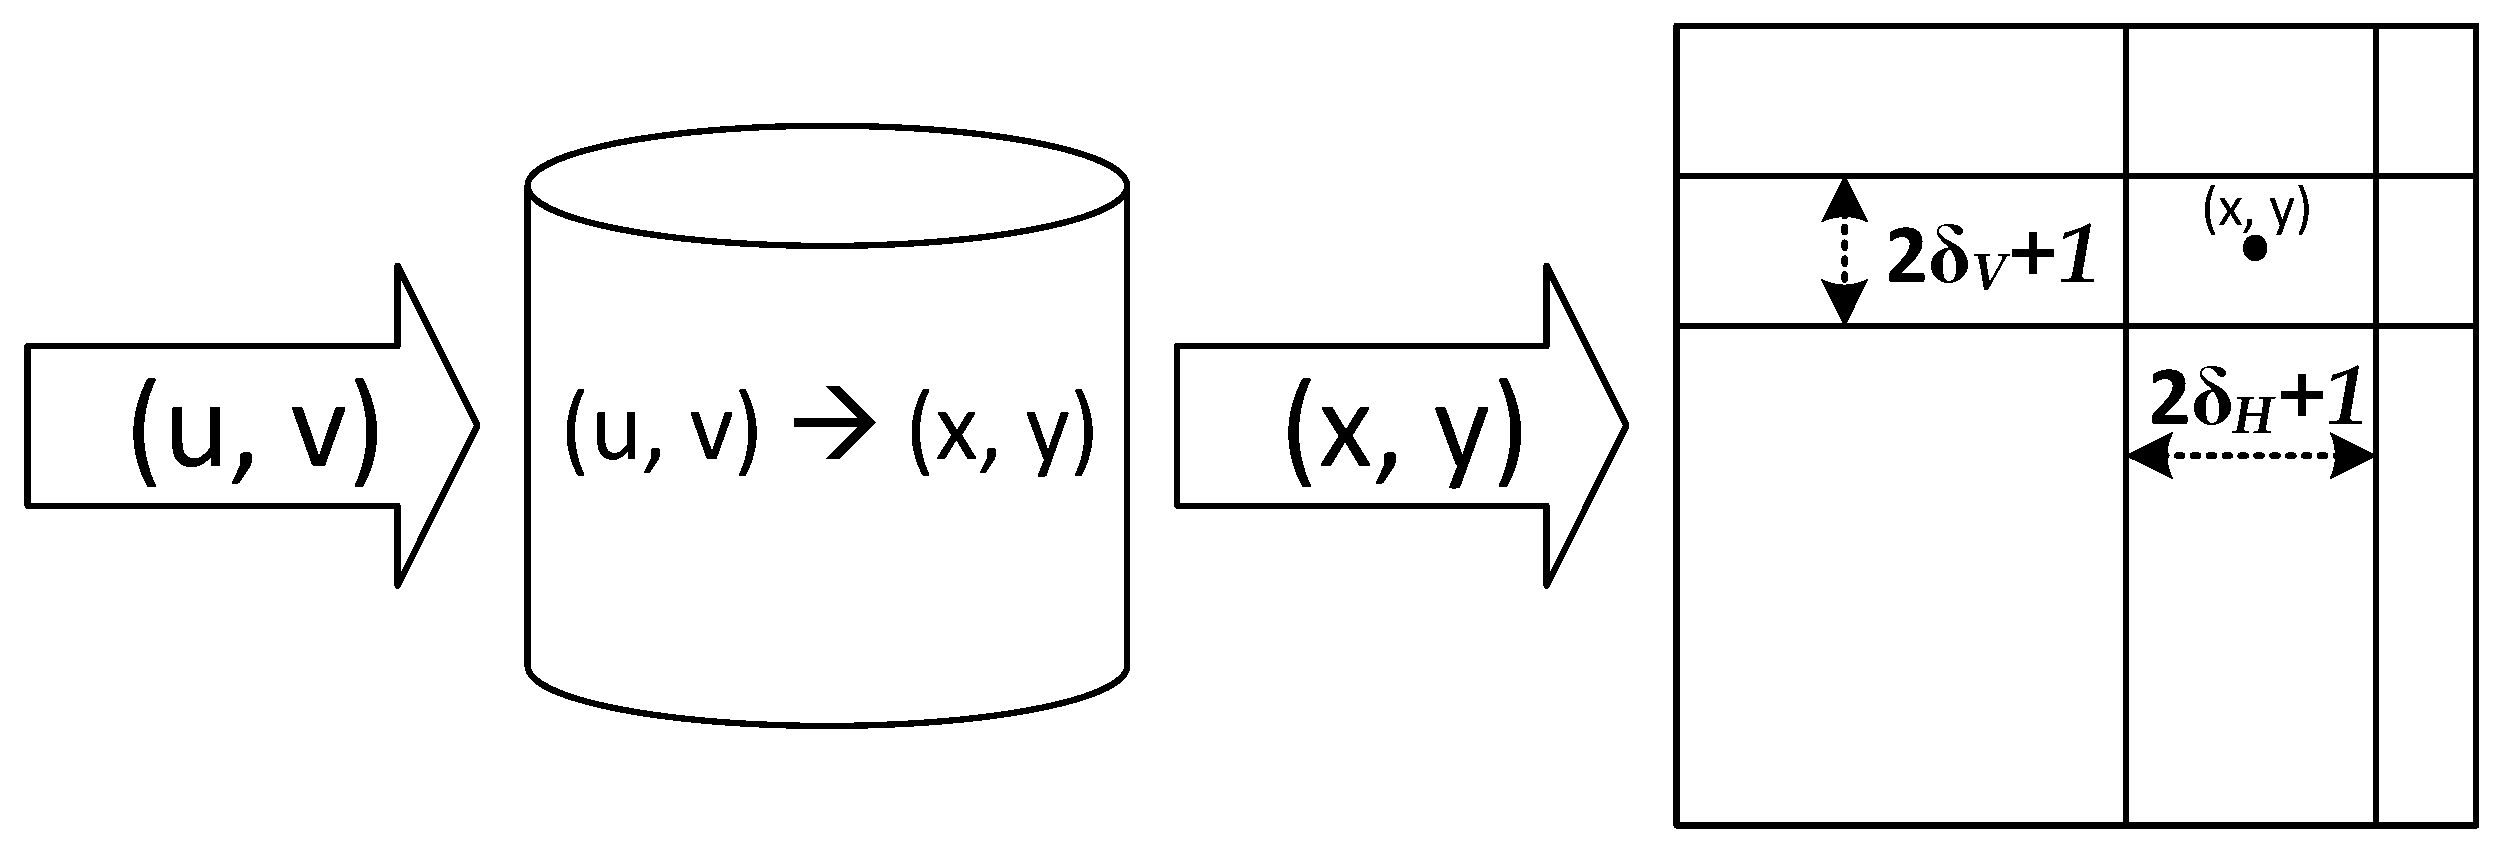
2.1.4. Calibration Matrix

Developed in a collaborative work with the research group face recognition and artificial vision (FRAV) of the Rey Juan Carlos University. It consists of a 64-led mesh distributed in two fully identifiable planes. The resulting mesh can be seen in Figure 1d. Led lights are controlled by a microcontroller integrated in the calibration matrix that switches them on one by one.

2.2. Matching Process

In this subsection, the matching process was applied progressively. Starting with a matching approach based on epipolar restriction (based on the previous work [19]), the process presented was modified, applying some additional restrictions to reduce the complexity of the searching step, in order to be implemented it in an FPGA.

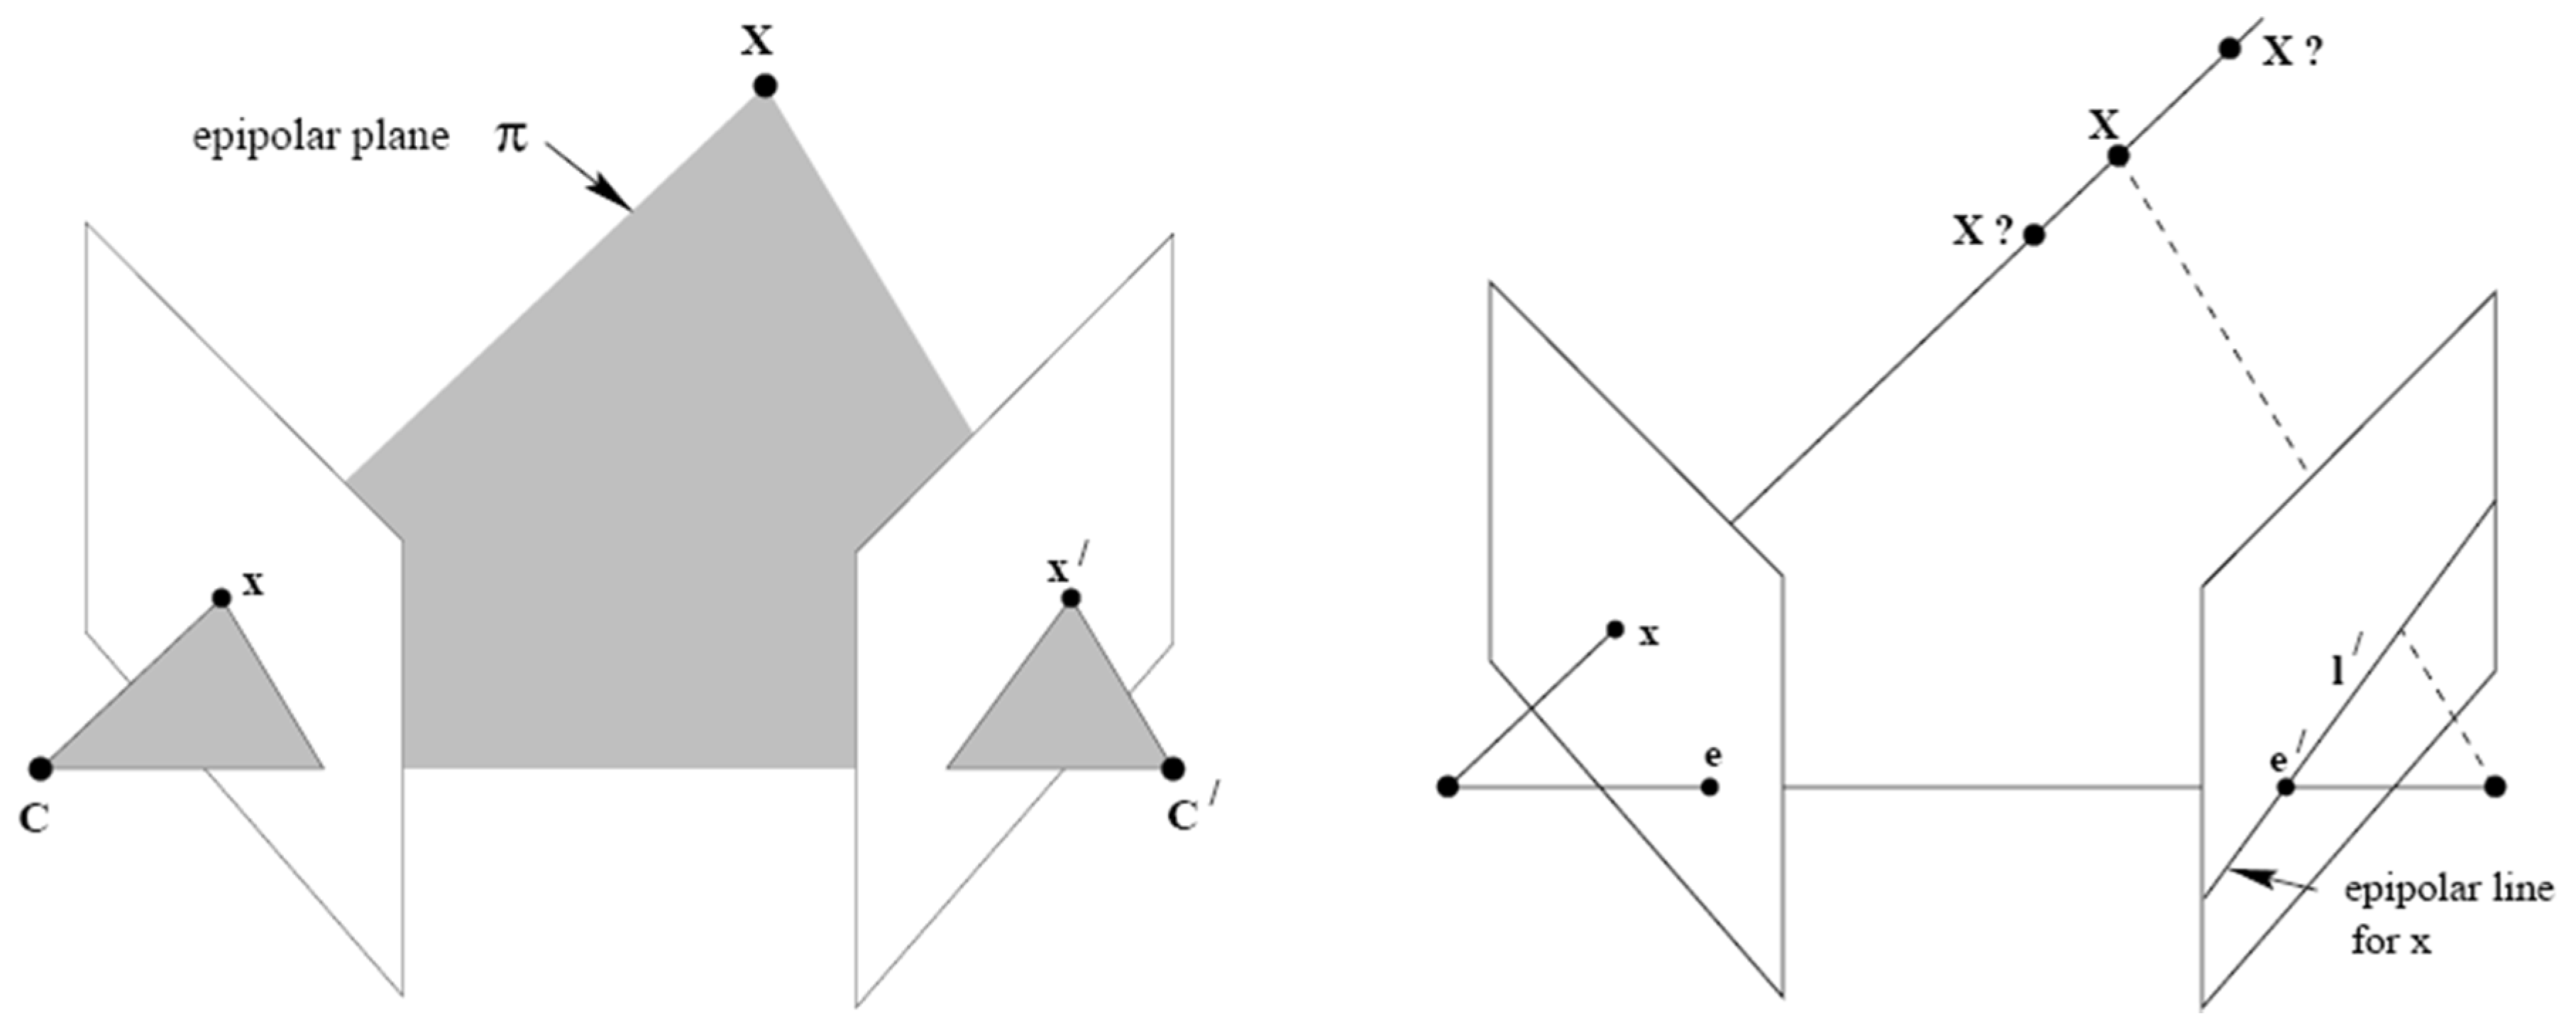
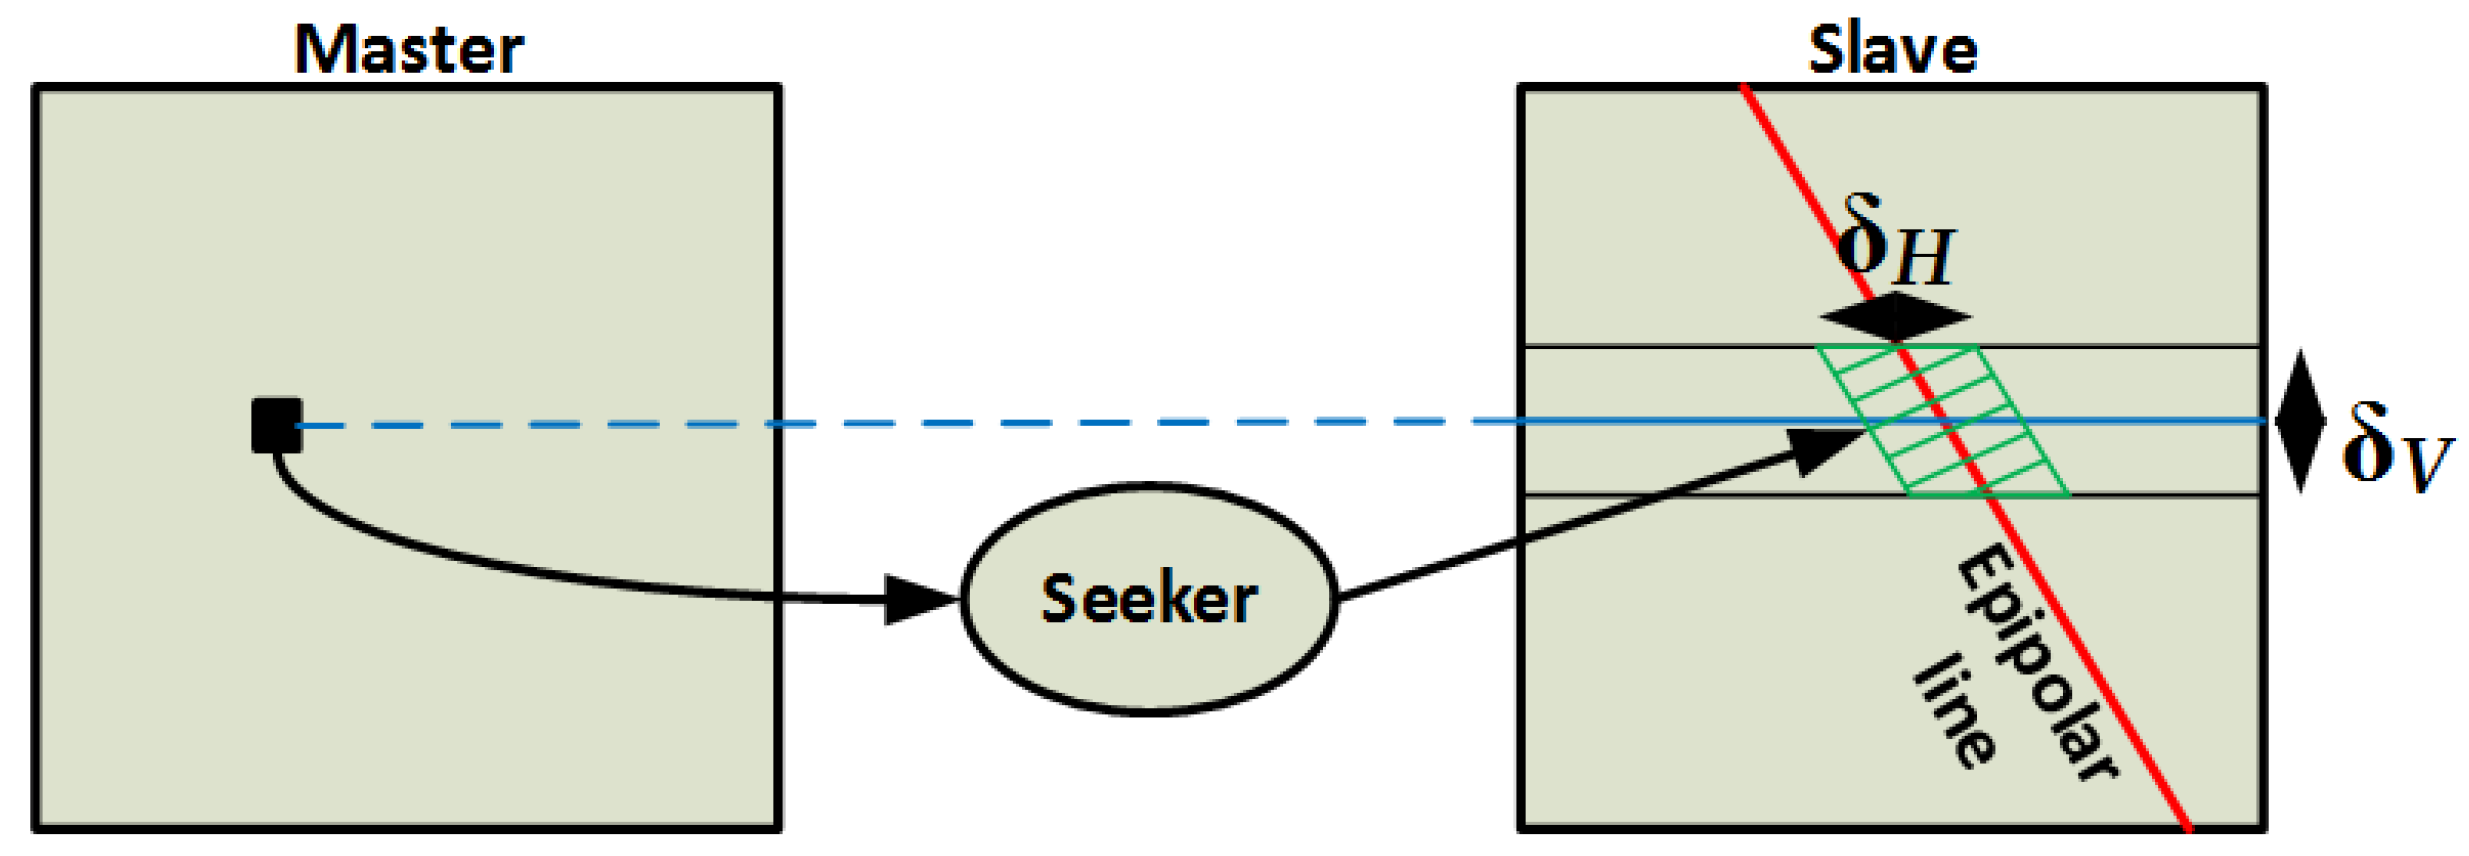
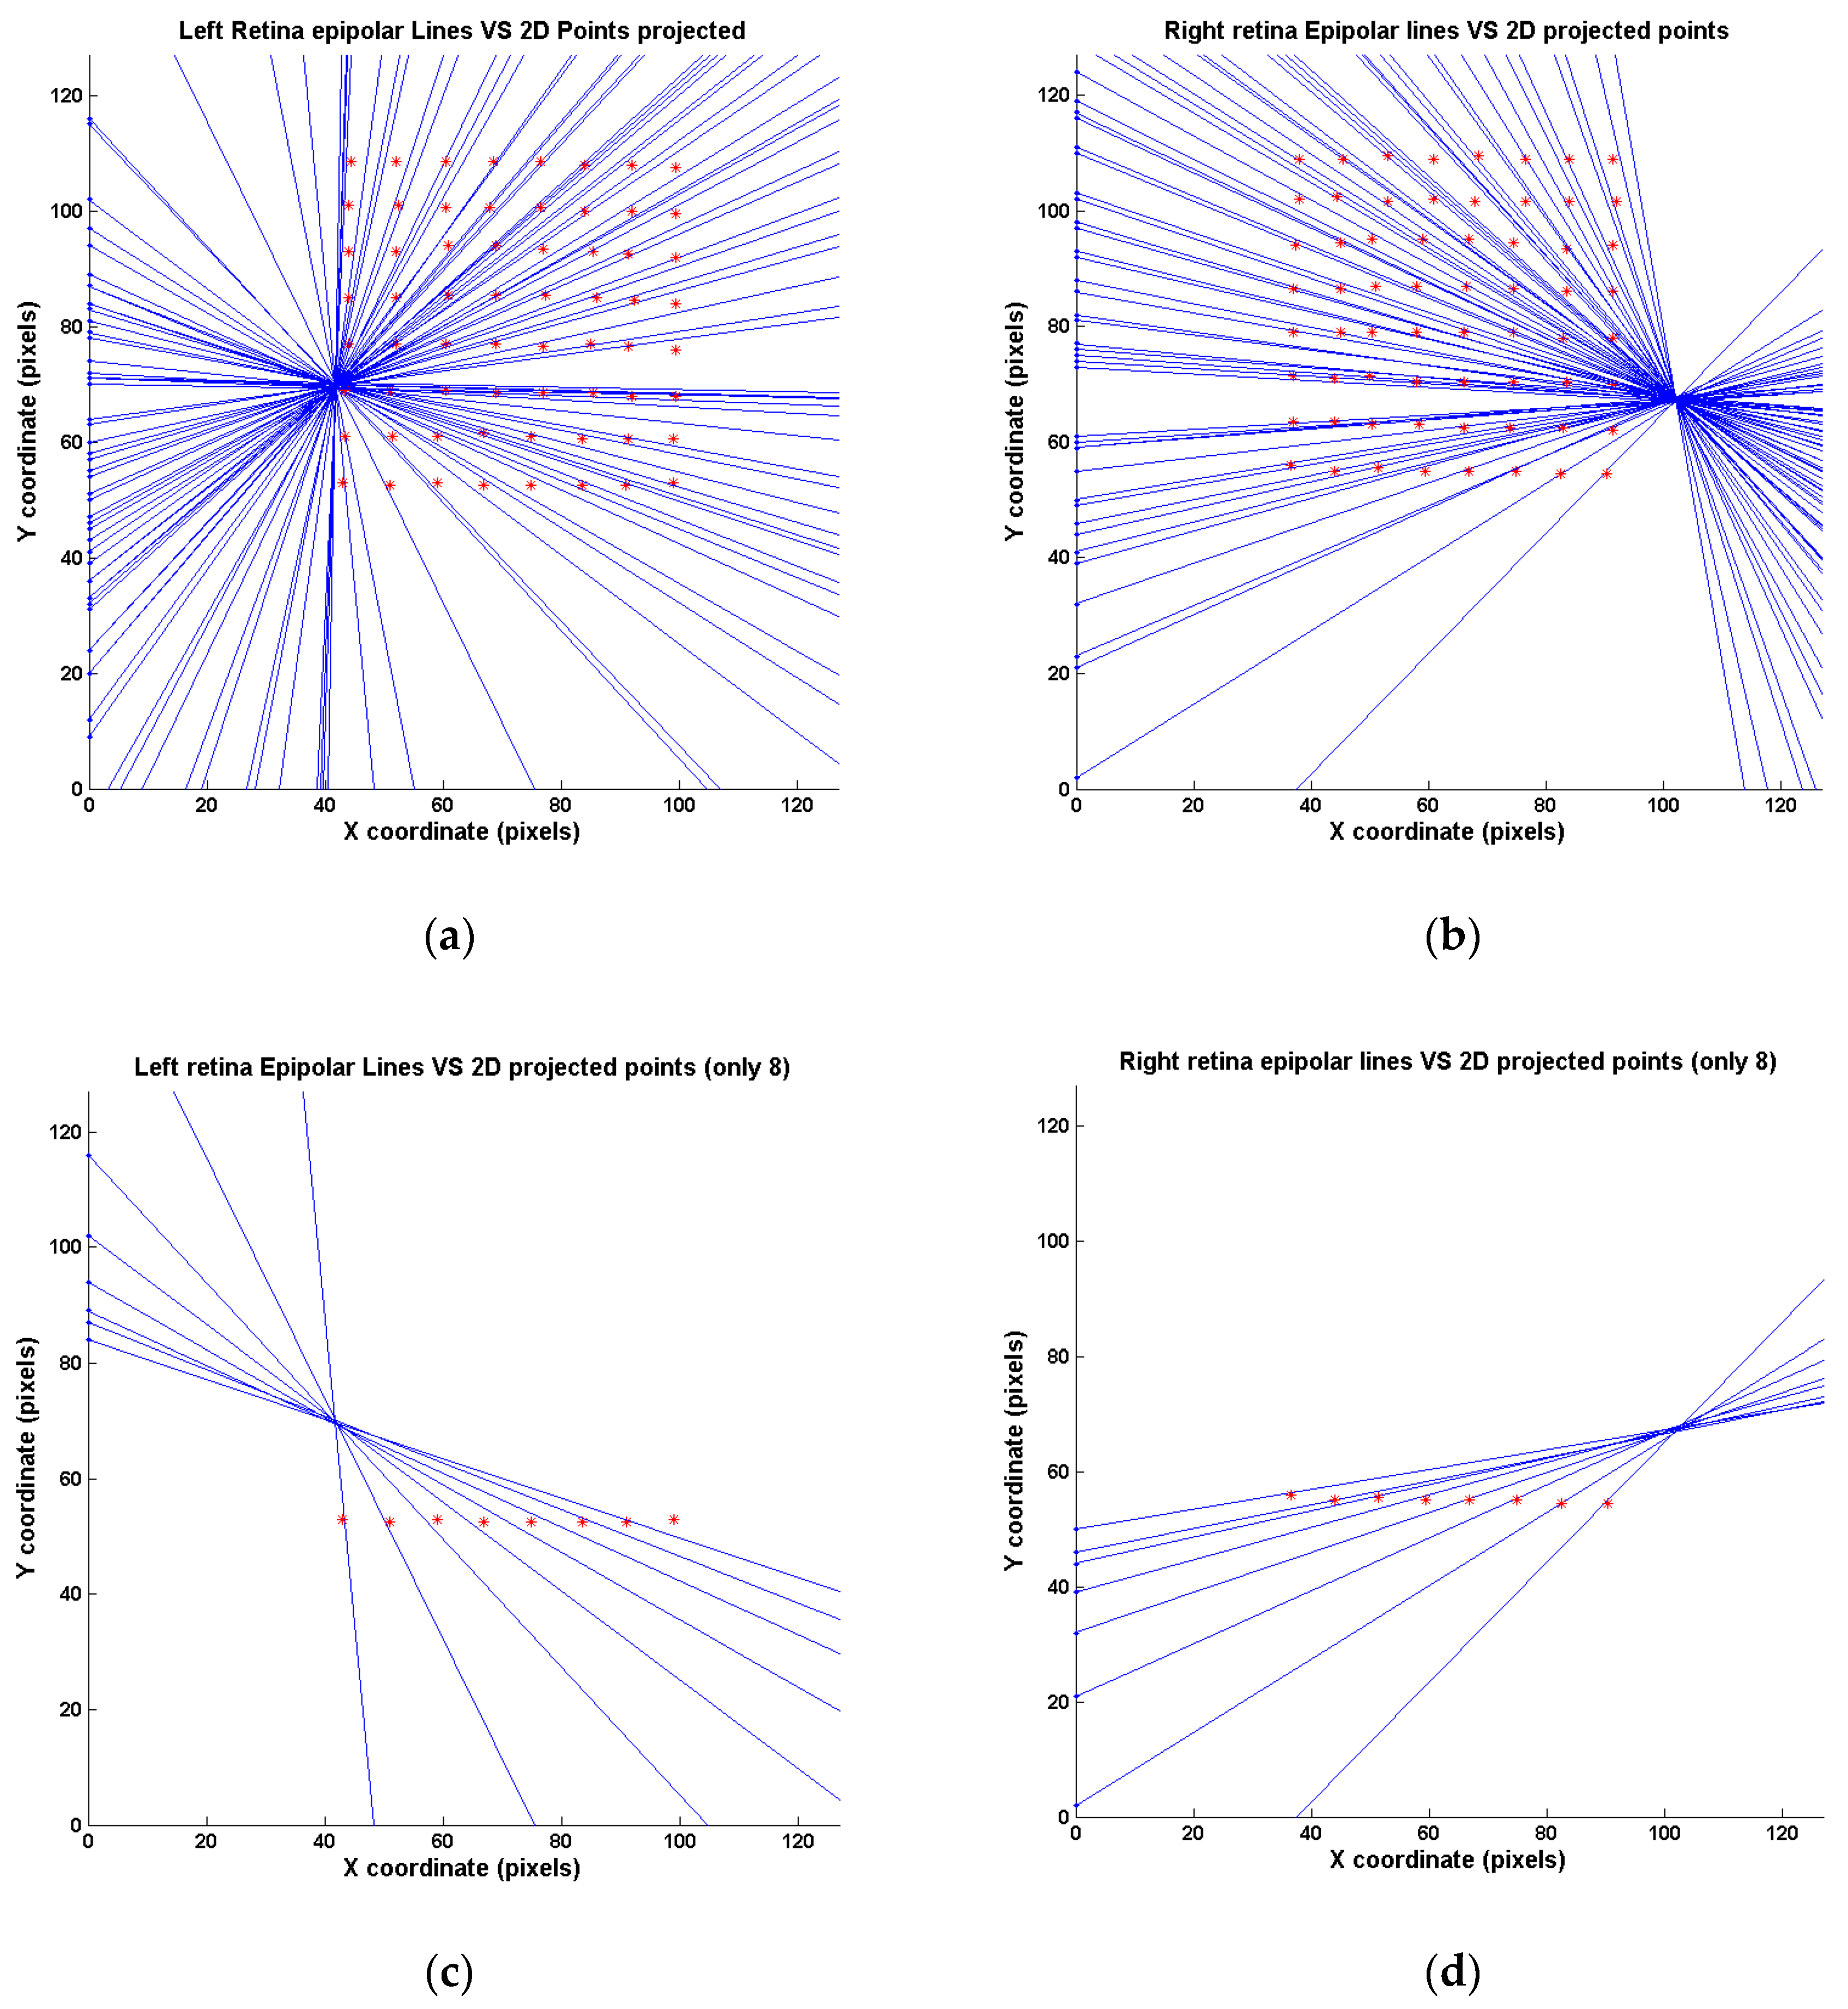
2.2.1. Epipolar Restriction

With a stereovision system calibrated using a linear mechanism with a Faugeras’ optimization [20,21] and a Pin-Hole camera model [22,23]. Figure 2 shows the stereo vision system and the calibration matrix used; the geometrical principles of the scene allow one to obtain a linear transformation between the 3D space and the 2D projection of both retinas. In the same way, by combining the information taken from both retinas, the 3D point can be determined using both projections.
These principles are shown in the next equation system (Equation (1)), where P is the projection matrix of one specific camera, used to indicate the linear relationship between the 3D points of the calibration matrix (used to obtain it) and its projections in the camera itself:
( U V t ) = P ( X Y Z 1 ) ,   P =   ( q 11 q 12 q 13 q 14 q 21 q 22 q 23 q 24 q 31 q 32 q 33 q 34 )   t = s c a l e   f a c t o r
Using the projection matrices from both cameras, the fundamental matrix was obtained by the information combination from both projection matrices and used to estimate the inverse transform of the system; with both projection points (one from each camera), the position of the 3D point in space was determined (X, Y and Z). The Fundamental matrix can be observed in Equation (2):
F · M = 0 ,   w h e r e   M =   ( X i     Y i     Z i     λ ) t     a n d     F =   ( P L 1 , 1 u R i · P L 3 , 1 P L 1 , 2 u R i · P L 3 , 2 P L 1 , 3 u R i · P L 3 , 3 P L 1 , 4 u R i · P L 3 , 4 P L 2 , 1 v R i · P L 3 , 1 P L 2 , 2 v R i · P L 3 , 2 P L 2 , 3 v R i · P L 3 , 3 P L 2 , 4 v R i · P L 3 , 4 P R 1 , 1 u L i · P R 3 , 1 P R 1 , 2 u L i · P R 3 , 2 P R 1 , 3 u L i · P R 3 , 3 P R 1 , 4 u L i · P R 3 , 4 P R 2 , 1 v L i · P R 3 , 1 P R 2 , 2 v L i · P R 3 , 2 P R 2 , 3 v L i · P R 3 , 3 P R 2 , 4 v L i · P R 3 , 4 )
where M is the 3D point, (uRi,vRi) are the coordinates of the projected points in the right retina, (uLi,viLi) are the coordinates of the projected points in the left retina, PL is the left projection matrix, PR is the right projection matrix, and F is the fundamental matrix. However, in the matching problem only one of the projections is known, so it is not possible to use these principles. Therefore, continuing with the Pin-Hole main equation, the values of X and Y can be obtained.
Starting with the projection matrix (Equation (1)), and after solving Equation (2), the equation system obtained is presented in Equation (3):
q 11 X + q 12 Y + q 13 Z + q 14 = u = U t   q 21 X + q 22 Y + q 23 Z + q 24 = v = V t   q 31 X + q 32 Y + q 33 Z + q 34 = t
Substituting t expression in the others, we obtained Equation (4):
q 11 X + q 12 Y + q 13 Z + q 14 = U ( q 31 X + q 32 Y + q 33 Z + q 34 )   q 21 X + q 22 Y + q 23 Z + q 24 = V ( q 31 X + q 32 Y + q 33 Z + q 34 )
Grouping the 3D coordinates’ coefficients, Equation (5) was obtained:
( q 11 U q 31 ) X + ( q 12 U q 32 ) Y + ( q 13 U q 33 ) Z + ( q 14 U q 34 ) = 0   ( q 21 V q 31 ) X + ( q 22 V q 32 ) Y + ( q 23 V q 33 ) Z + ( q 24 V q 34 ) = 0
Changing the name of the parenthesis expressions to a1, b1, c1, d1, a2, b2, c2 and d2, respectively, Equation (6) is presented:
a 1 X + b 1 Y + c 1 Z + d 1 = 0   a 2 X + b 2 Y + c 2 Z + d 2 = 0
Finally, X and Y can be extracted from the previous information (Equation (7)):
X = Z ( b 1 c 2 b 2 c 1 ) + ( b 1 d 2 b 2 d 1 ) ( a 1 b 2 a 2 b 1 ) ,       Y =   Z ( a 2 c 1 a 1 c 2 ) + ( a 2 d 1 a 1 d 2 ) ( a 1 b 2 a 2 b 1 )
Both values depend on Z, which cannot be obtained with only one projection point. However, two random Z values can be used in these equations, and thus two 3D points were obtained. These two points were applied to the projection matrix of the other camera, obtaining two projection points. The line passing through these two projections is the epipolar line and, more importantly, the line within the correspondence must be situated (see Figure 3).
This epipolar mechanism has been tested with AER data obtained from the artificial retinas.

2.2.2. Positional Restriction

The searching space near the epipolar line is not very narrow, so finding the correspondence still has a high computational cost. To simplify the searching step, another restriction was applied to the system: positional restriction. This evaluates the difference in rows and columns between one projection point and its correspondence. This analysis was conducted for the 64 points used in the calibration matrix. However, the importance of this restriction is not the result itself, but the evaluation of these variations (horizontal and vertical) in addition to the epipolar principles.
Starting with the epipolar results, the positional restriction was applied to restrict the searching space near the epipolar line in both ways: vertical and horizontal (see Figure 4). Thus, using the epipolar lines as the origin or center of the searching window (notice that it is not exactly a rectangular space, but a rhomboid), the distance of rows and columns between the correspondences and the epipolar line center was evaluated.

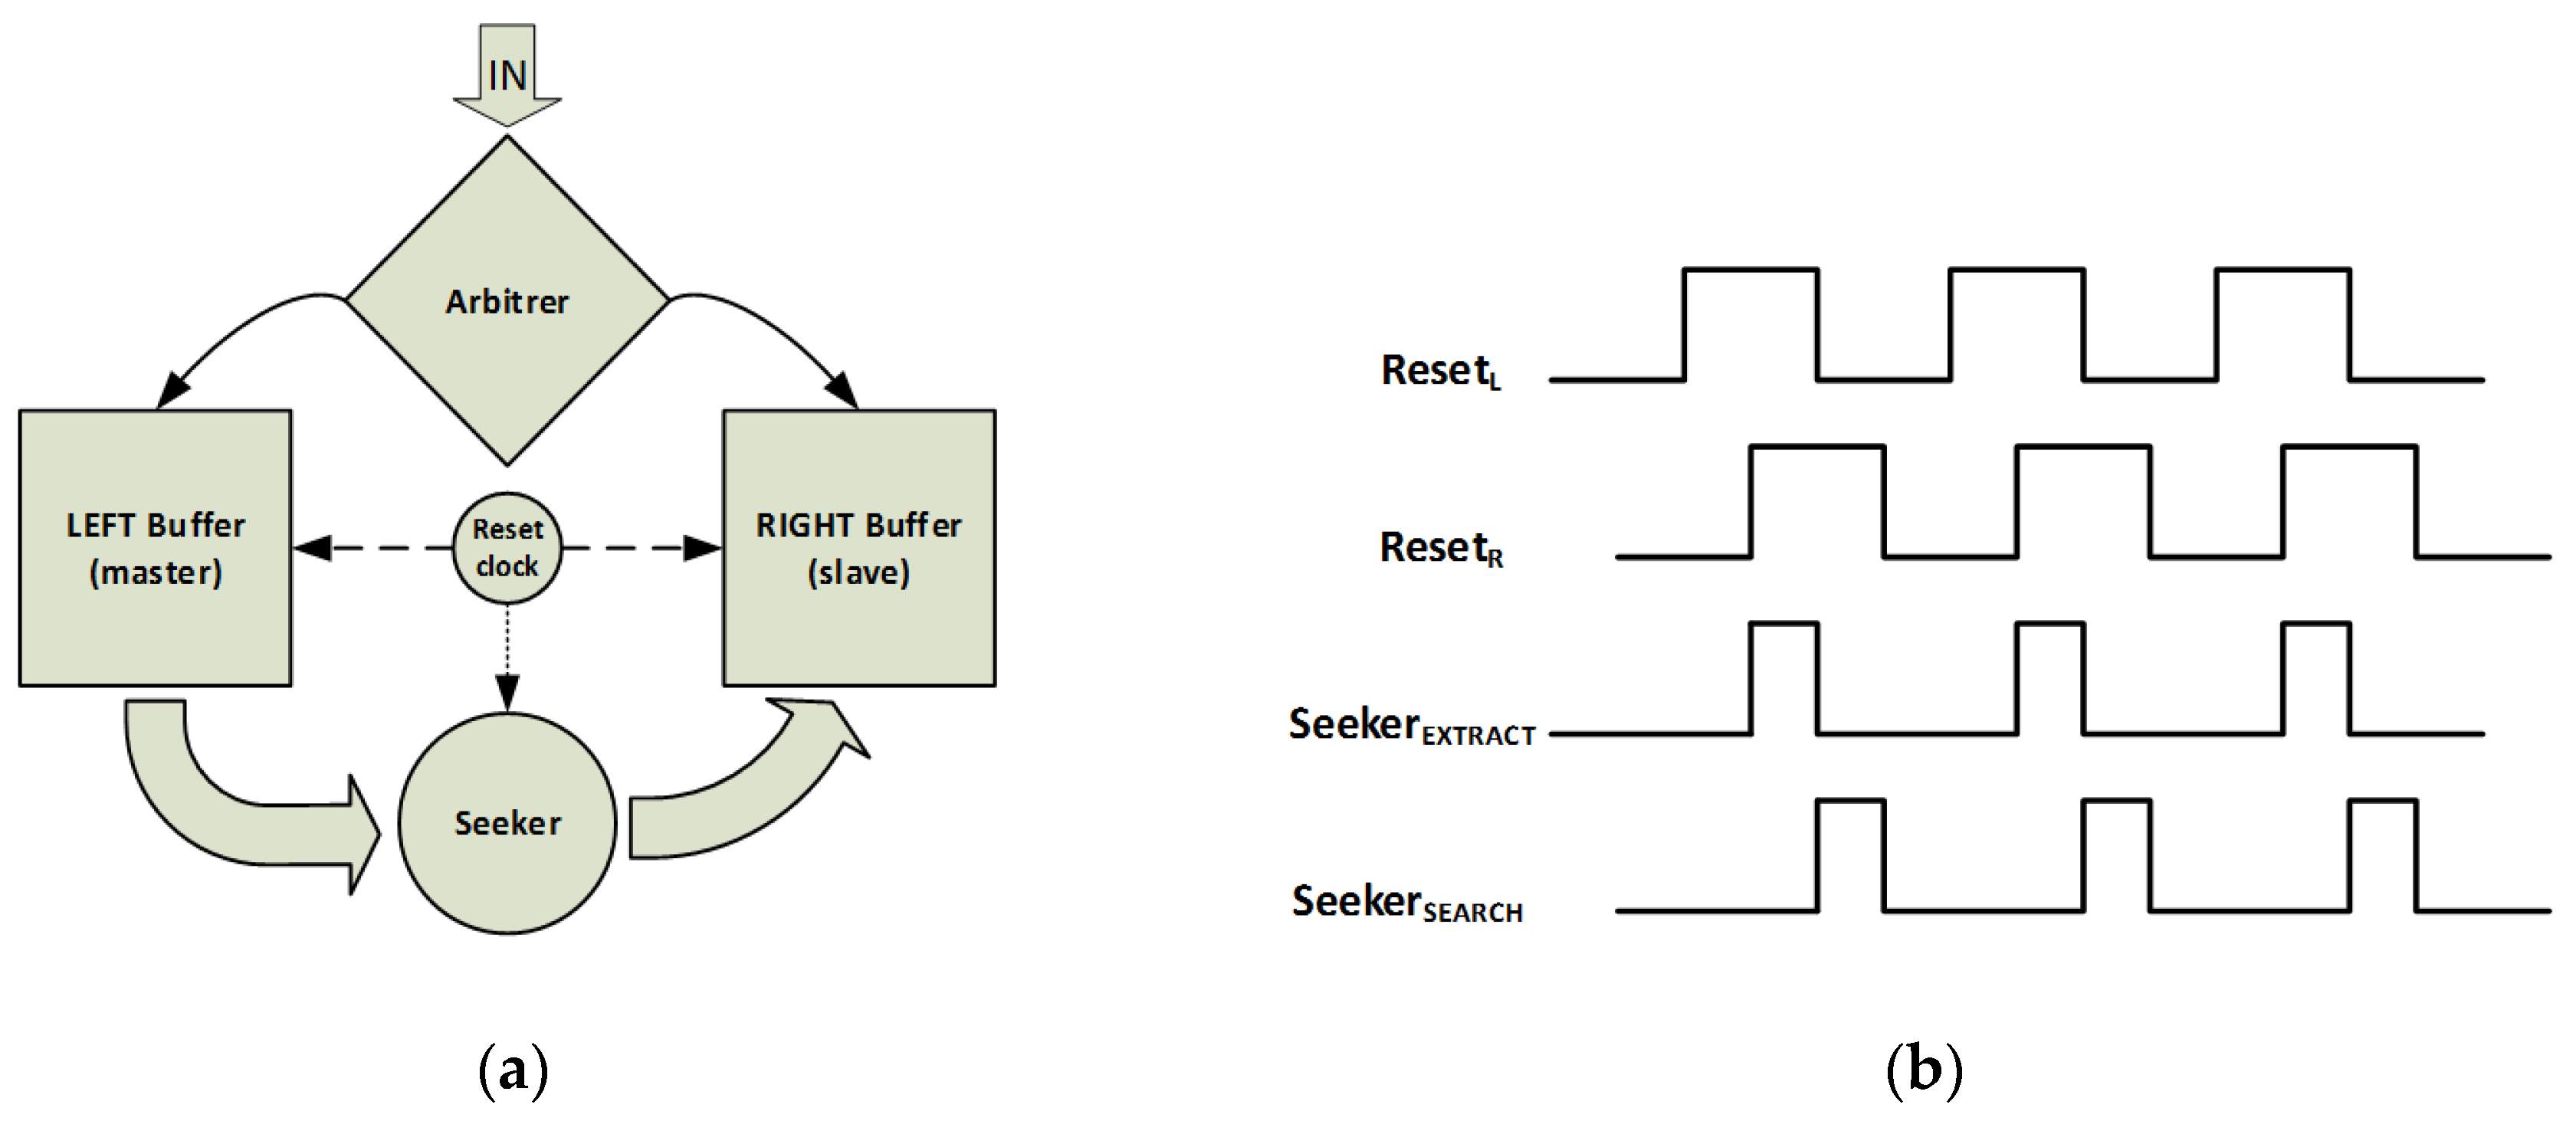
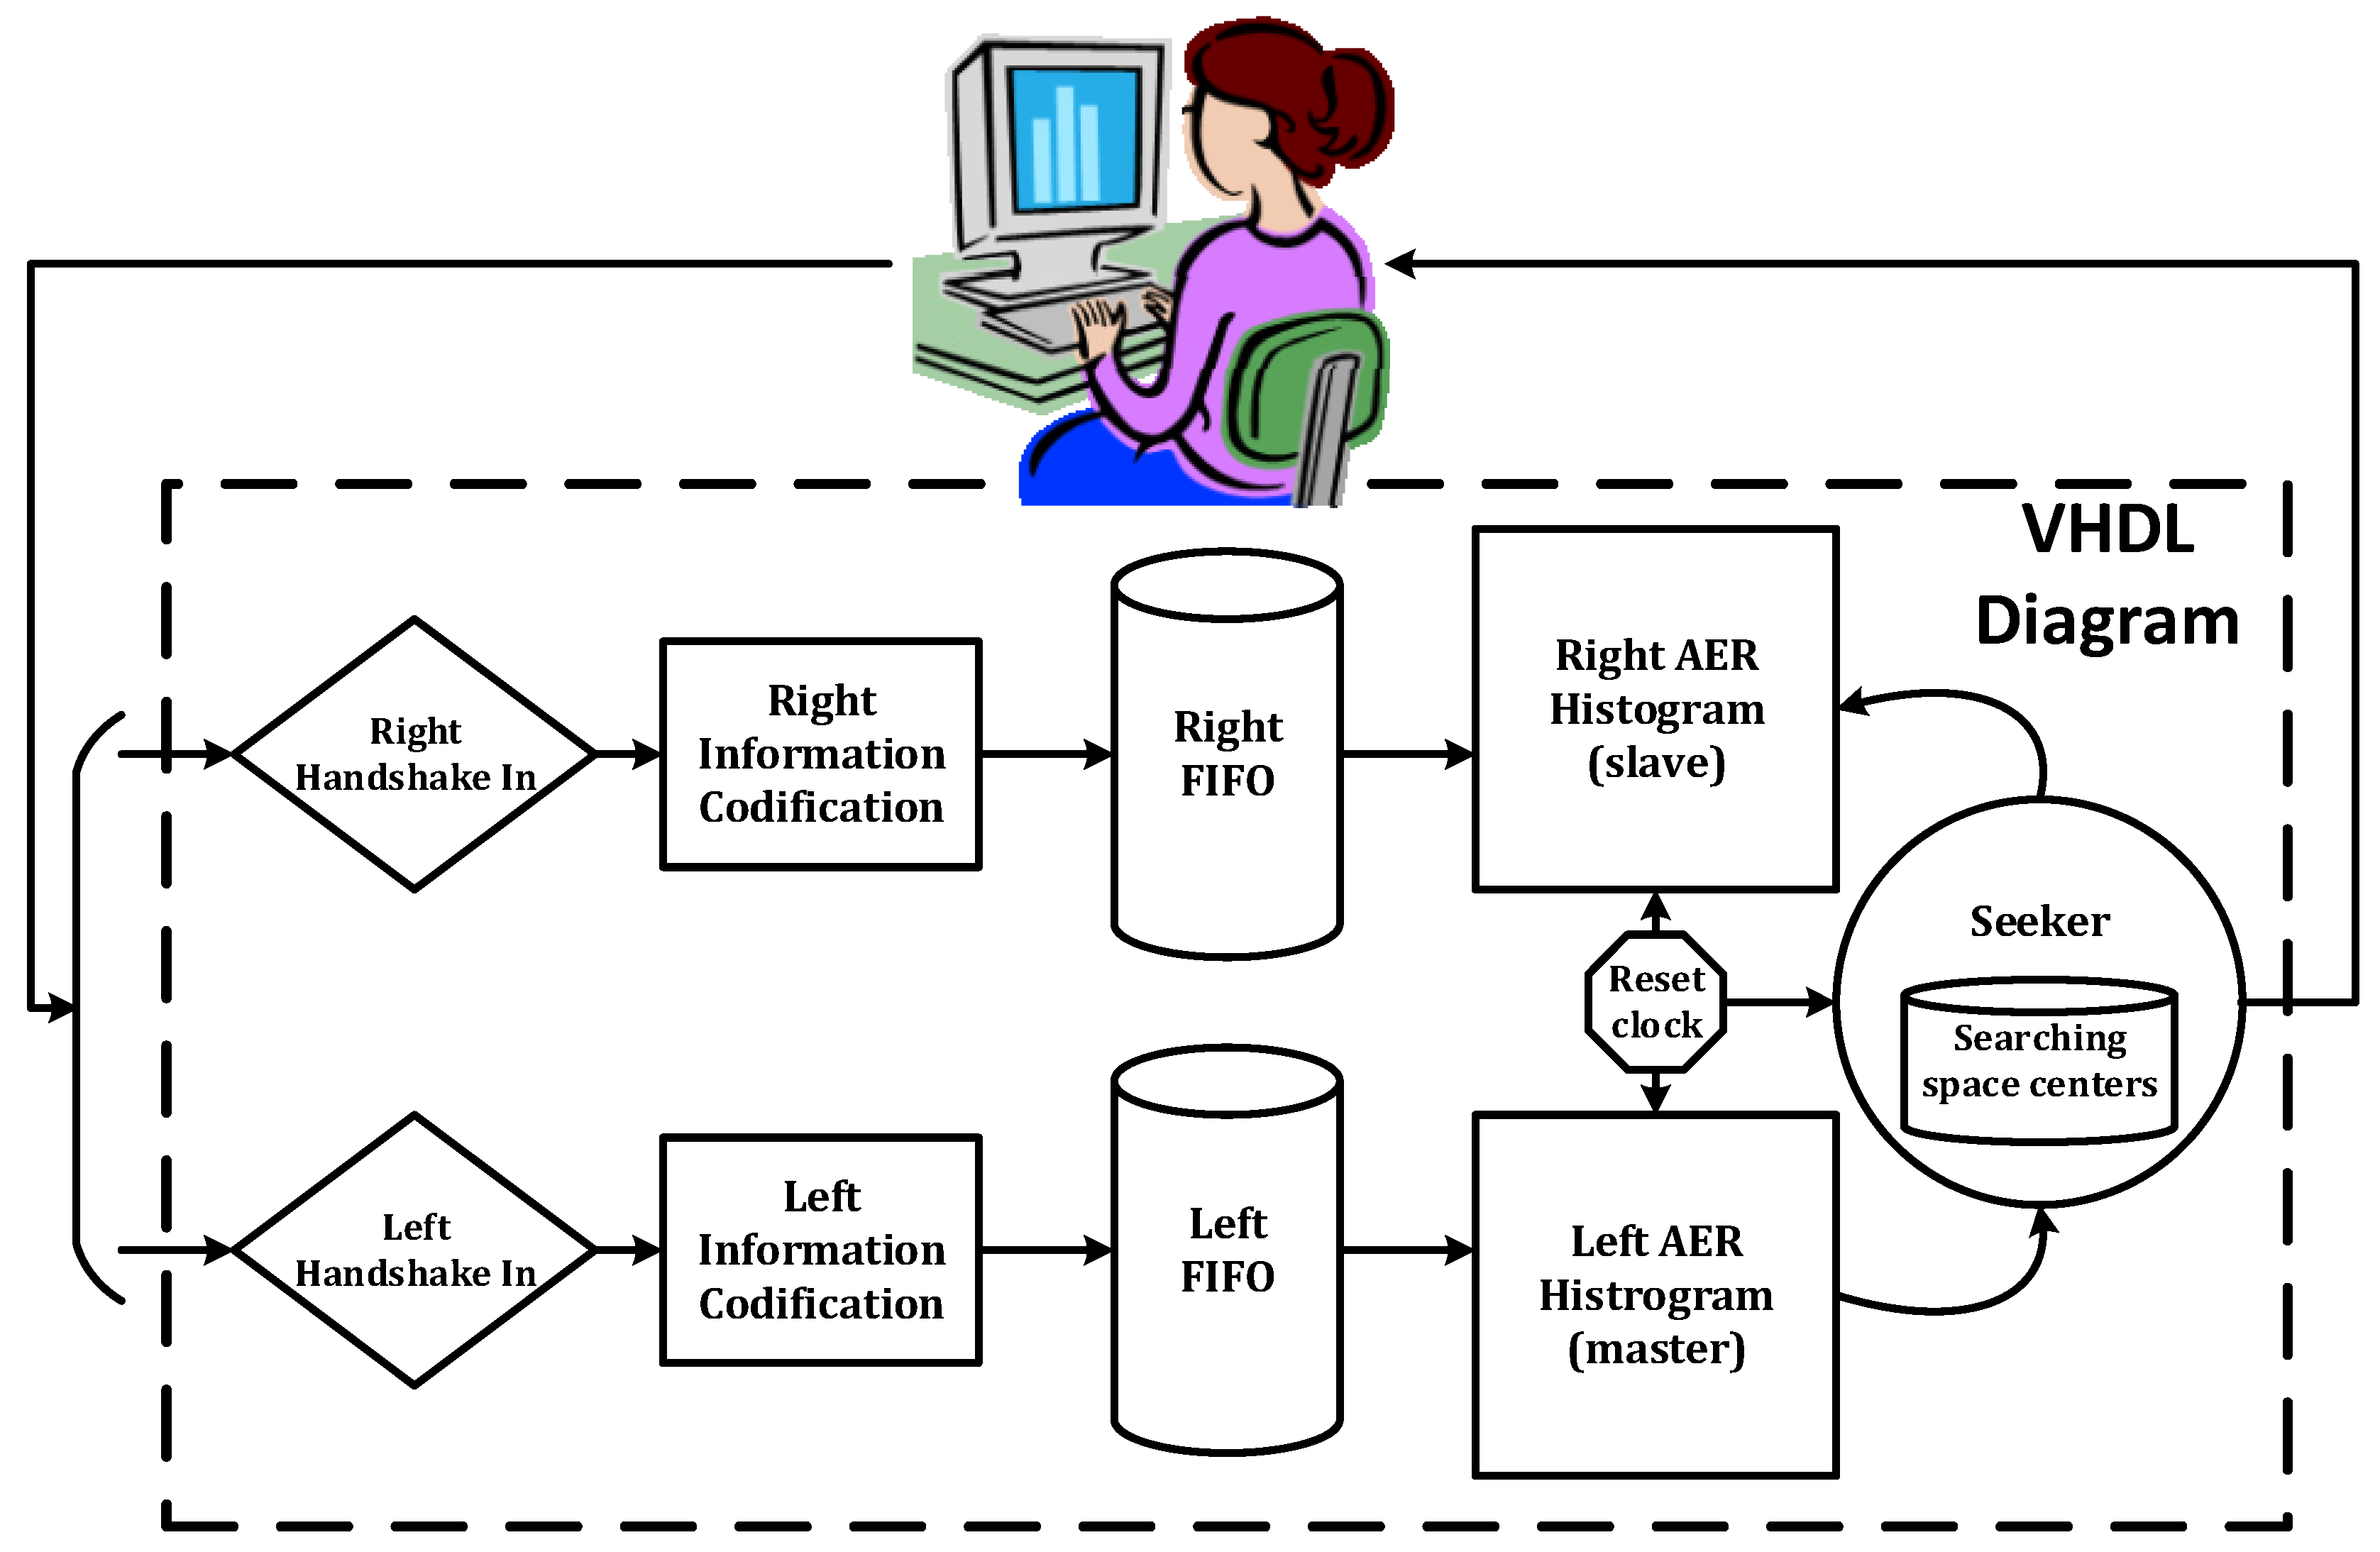
2.2.3. FPGA Implementation

The aim of this work was to simplify the matching process in order to implemented it in an FPGA. Thus, the final step was to design the hardware system implementation.
The information received though the AER bus is codified in frequency; therefore, the system does not have a frame-based timing like that of classical computer vision. To solve this problem, the system implemented in the FPGA integrates the spiking information received into two 128 × 128 buffers (creating something like an AER histogram, which is like a frame), one for each retina. In parallel, a searching process takes the information from the “master” buffer and looks for a match in the second buffer. These two parallel activities can be performed thanks to the FPGA parallelism’s power.
However, in order to maintain the visual information refreshed, these buffers must be reset after a while (creating something like a passage from one frame to another). Thus, a periodic reset process must be included in the system (clock configurated at 20 ms periods to obtain a 50 Hz AER-frame system). This last process acts in both buffers, as well as in the searching process. The block diagram of the implemented system can be observed in Figure 5a.
One of the retinas is denoted as “master”; thus, the observer process attends to the information received in its buffer and demands the seeker process to look for a correspondence in the “slave” buffer. Every time it finds a possible match, it compares the value of both pixels looking for a similar value in both. The seeking space was determined by the restrictions evaluated in previous subsections.
This searching cannot be done from the beginning (reset signal activation), as it needs a setup time until the master buffer has enough information. However, a long waiting time also makes it inefficient, as it can produce a buffer overflow. Therefore, to use an intermediate time, the searching process starts in the middle of the reset signal period (see Figure 5b). The difference between the extracting step and the searching step is used by the system to apply the epipolar and the positional restrictions.
However, as is presented in the results section, the final space for the searching process after applying both restrictions depends directly on the activation point coordinates in the master retina, and this searching space is not modified because the extrinsic parameters of the stereo system are fixed (the distance between both retinas and their physical orientation is always the same). Thus, there is no need to calculate the epipolar lines (which need several complex operations and significant time); thanks to the previous restrictions, we can calculate these values offline and store them in a hash table at the center of the searching space for every master-retina point. Then, thanks to the positional restriction, we can determine the height and width of the searching space (which is the same for every point, as is shown in the Section 3). In addition, and in order to simplify this process, the searching space used is rectangular (not a rhomboid, as indicated in the previous subsection), so the error obtained is greater (this is evaluated in the next section).
Moreover, both retinas have different intrinsic parameters; thus, the value of the correspondences (gray scale) may vary even if there is no error in the output. This problem was not contemplated in the previous subsections and suggest evaluating the variation in the gray values in order to establish a common variation error to be used in the searching process.
Therefore, this searching process is limited in time (the same number of comparisons in every search) and can be done in less than 10 ms. The described process is shown in Figure 6.
After presenting the matching process and its implementation in a dedicated hardware, the obtained results are presented and evaluated in the next section.

3. Results

There are two test scenarios: the simulated one and the on-board test. In the first scenario, the visual AER data is received by the retinas, codified and transmitted across an FPGA, and received in a computer (where these data are evaluated in an offline way applying the previously presented restrictions). In the second scenario, the final optimization of the matching process is codified in VHDL (using the system detailed in the previous subsection) and integrated into the FPGA itself (synthetic visual AER data are used as the system’s input to verify and test the output).

3.1. Simulated Test

For this first test scenario, the system was configured as follows: the calibration matrix was controlled by a microcontroller to switch the led lights on one by one (up to 64). The information was received by the retinas and transmitted separately to the FPGA, where the spiking data were codified, mixed, and transmitted to the computer across the AER monitoring board. Finally, the data were stored and evaluated offline.
Next, we present the results obtained after applying the visual restrictions to the offline data.

3.1.1. Applying the Epipolar Restriction

With the data stored, epipolar lines were calculated using the principles described in the previous section. To evaluate the efficiency of the searching space reduction, the distance between the epipolar lines and the correspondence points were calculated and presented graphically.
Figure 7a shows the 64 projection points of the left retina used, as well as the epipolar lines obtained from the points of the right retina. Figure 7b shows the opposite case: projection points of the right retina with the epipolar lines of the left retina. Figure 6c,d show only the results for the first eight points, so the closeness between the projection points and their epipolar lines can be better appreciated.
Table 1 shows the errors obtained in the process, which correspond to the distance between the matching points and their epipolar lines (obtained from the information of the other retina).

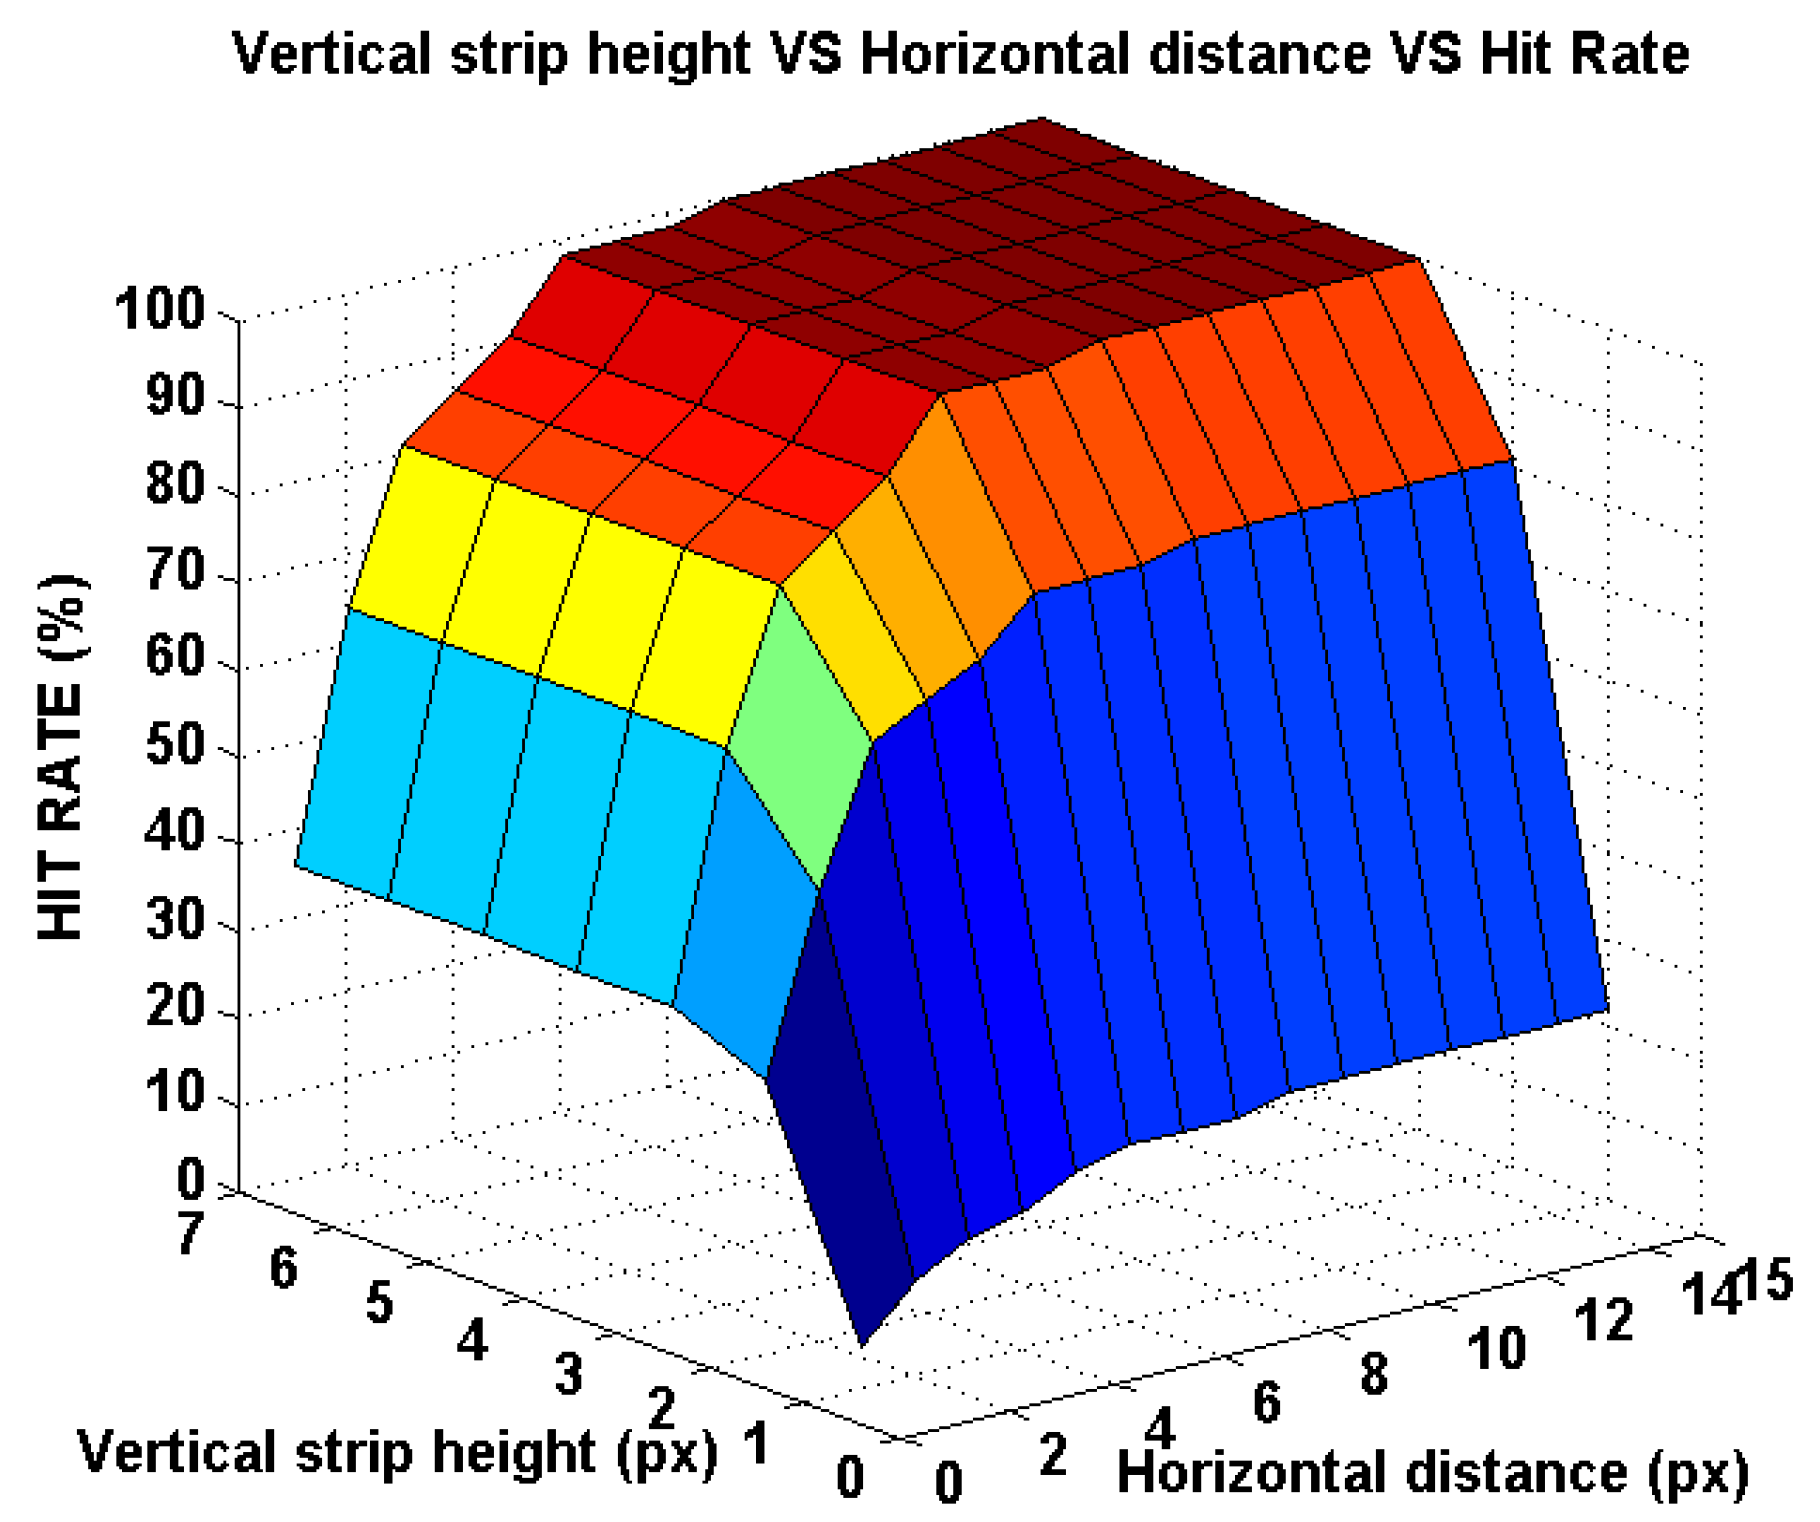
3.1.2. Applying the Positional Restriction

The previous information indicates that there is an error in the process of finding the correspondence in a space near the epipolar line. Thus, the searching process still has a high computational cost. To simplify the searching step, the positional restriction was applied in order to determine the vertical and horizontal size of the searching space. These parameters indicate the height and width values of the rhomboid searching space in the slave retina (see Figure 4), whose center was determined thanks to the epipolar restriction results: the nearest point of the epipolar line to the correspondence point in the slave retina (for every point from the master retina).
Using the 64 calibration points as reference, several horizontal and vertical values were used in order to study the success of the searching step (determined by the percentage of correspondence points located inside the rhomboid with the specific values of ∂H and ∂V). The numerical results can be observed in Table 2 and their graphical representations are shown in Figure 8.
Looking for a good relationship between the searching space size and hit rate, these conclusions can be obtained from the data of Table 2:
  • Vertical variation: For values greater than three pixels (with the same horizontal variation), the hit rate does not vary. This will be the vertical variation selected.
  • Horizontal variation: To obtain a 100% hot rate, a value of 9 needs to be selected. However, the hit rate variation between 6 and 9 is only 1.5%, but the searching space increases 50% using a vertical variation of 3 pixels. The horizontal variation selected is 6 pixels.
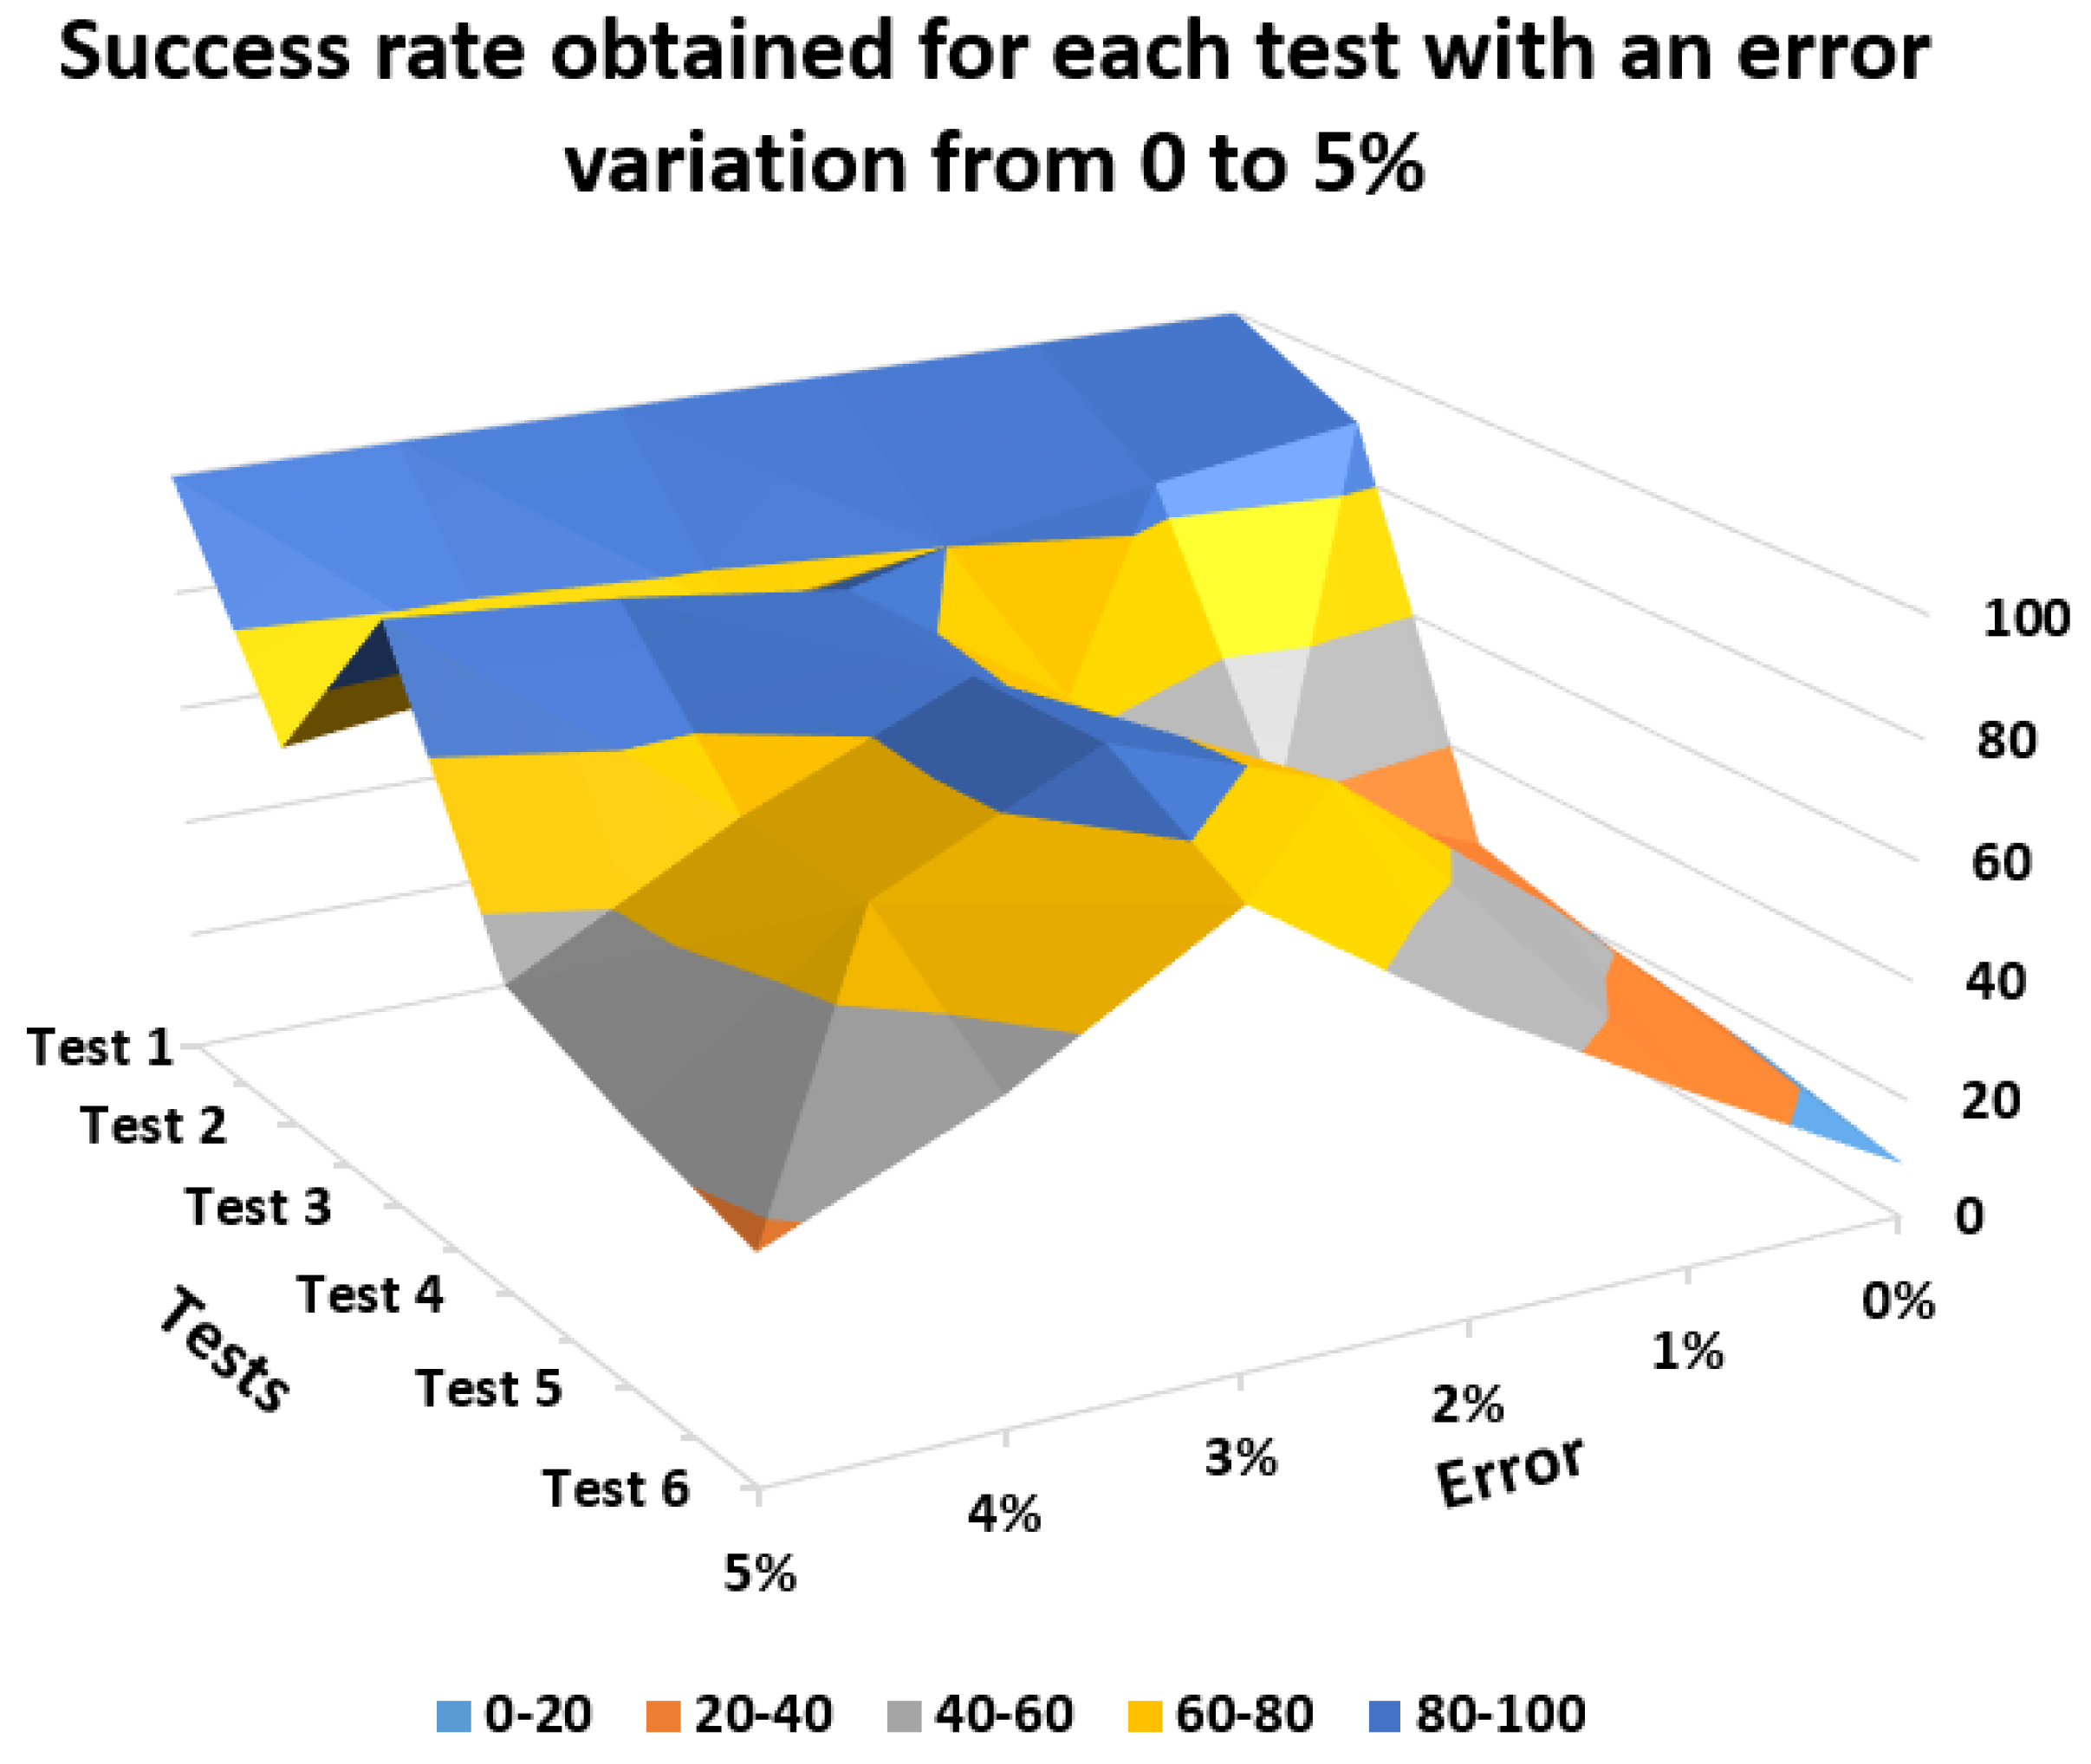
These values were tested in the FPGA implementation using a rectangular searching space (not rhomboid) and are discussed in the next section.

3.2. On-Board Test

For the last test scenario, the system was configured as follows: the matching process described in the previous section was implemented in VHDL over the FPGA. In order to control the input and output data, the calibration matrix and the retinas were not used at this point; the system input was stimulated by visual data generated in the computer, and the output was received in the same computer (this test scenario is shown in Figure 9). It is important to describe both input and output information:
  • Input data: Visual information of both retinas. For the master retina, spikes from only one-pixel activation were fired with a specific firing rate. For the slave retina, spikes from several pixels were fired, and one of these pixels was the correspondence. The aim was to test the searching process implemented in the FPGA. This process takes the pixel from the master retina and searches for its correspondence in the slave retina.
  • Output data: Information about the match found. Once the searching process determined that it has found the correspondence, the pixel coordinates were sent to the computer. Then, we evaluate the success of the matching process and the delay obtained, since the input data are received in the FPGA until the seeker responds. This elapsed time is calculated inside the FPGA and sent to the computer with the correspondence coordinates.
Searching space centers were calculated offline with the calibration matrix information used in the epipolar restriction test, and positional restriction values (horizontal and vertical variation) were determined by the previous test (∂H = 3 and ∂V = 2), using a rectangular space to simplify the searching. As indicated in the previous section, retinas have different intrinsic parameters: their values are similar but not the same. To contemplate this fact, several value variations were tested (0–5% error tested, which means a range up to ± 12 grayscale values, from 255 max).
As shown in Figure 9, there are several VHDL blocks in the final implementation. These blocks are controlled by three processes working together to obtain the results. Next, these processes are explained in detail:
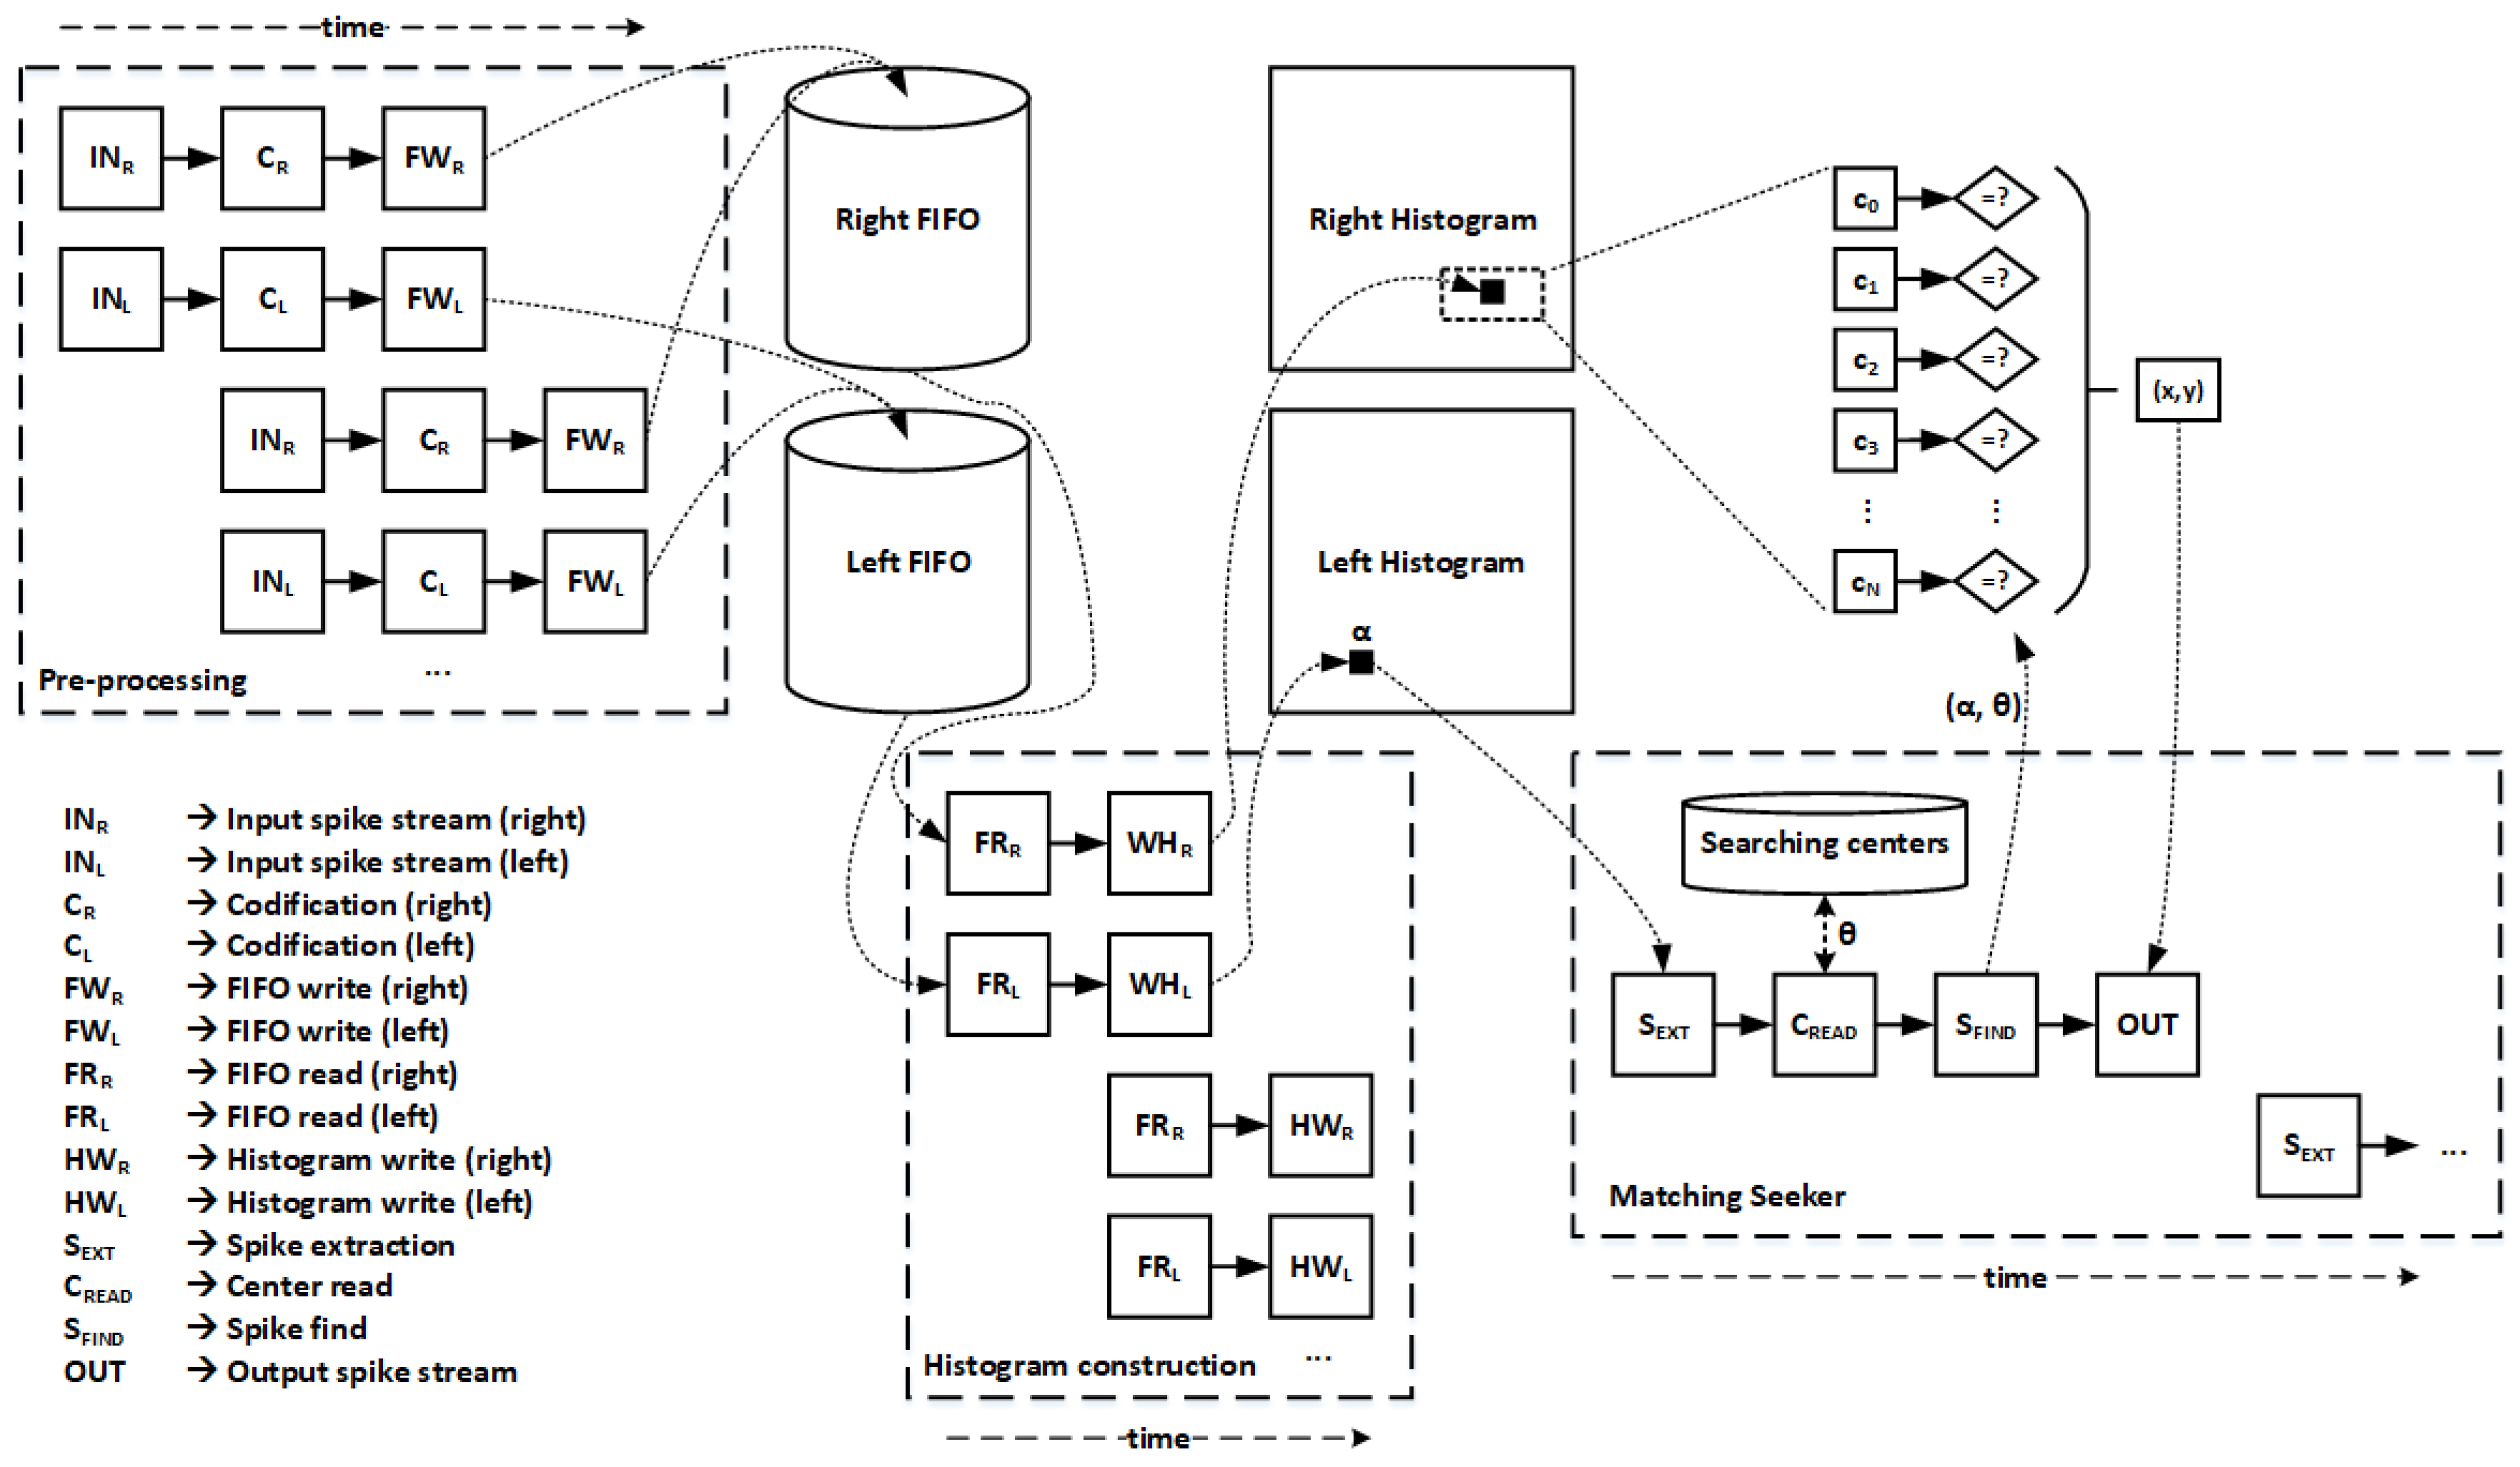
  • Pre-processing process: This process integrates the activities ranging from the data input to the storage in the FIFO (queue) of each retina. It is divided into three independent phases that need the output of the previous one (they work as a pipeline). Moreover, this path is duplicated for each retina, and they work in parallel.
  • Histogram construction: This process waits for any change in the FIFO and, when its content is not empty, it extracts the first spike stored in it and updates the histogram associated with this FIFO. This path is duplicated, and thus they also work in parallel.
  • Matching seeker: This is a unique process that extracts the important information from the left histogram and finds its correspondence point in the right histogram inside the searching space bounded by the pre-calculated square.
In the system’s first implementation, the second process was the last phase of the pre-processing process and no FIFO was used; however, due to the variable rate of input spikes, occasionally some information was lost. That is why the FIFO was included to avoid loss of information, and this process is independent from the first one.
The third process does not need the previous processes to finish before it starts working. This process accesses a dual-port memory, where the histograms information is stored and makes use of it to look for the matches. The interaction between these processes, and their detailed execution, is shown in Figure 10. It is important to emphasize that these processes cannot be executed sequentially among themselves (as a pipeline); they need to be working in parallel, and, in certain circumstances, access shared components simultaneously.
The inputs used for this test contained more than 140 k synthetic AER histograms from both retinas codified as spikes: 128 × 128 pixels (16384 pixels) with 7–9 tests for each pixel. For each one, these cases were contemplated:
  • There is no correspondence point inside the searching space:
    No pixel activated inside (1 test).
    Some activated pixels but with different grayscale value (1 test).
  • There is a correspondence point inside the searching space:
    Only the correspondence point is situated inside the searching space (1 test).
    More points are situated inside the searching space, but with different grayscale values (2–3 tests).
For the second case, every test was duplicated. We added several points near the original rhomboid searching space, which were placed inside the final rectangular searching space.
Thus, we analyzed the hit rate and the time response for all these tests. The results can be observed in Table 3.
As can be observed in Table 3, the best results were 84.1%, which were obtained with a 3% error. The average time elapsed for this case was 8.8 milliseconds, which is less than 10 milliseconds (time estimated in the previous section and used to determine the maximum seeker time to find a match). The success rate separated by the different tests is shown in Figure 11. The sensitivity (true positive rate) obtained was 83.25% and the specificity (true negative rate) was 87.5%.
As has been commented from the very beginning of this manuscript, the final objective of this work was to implement the matching algorithm into dedicated hardware (FPGA). The hit rate of the final implementation has been detailed; however, it is very important to analyze the hardware components used (see Table 4) and the power consumption (see Table 5).
All the tests have been detailed and exposed. Finally, in the discussion section, these results are analyzed.

4. Discussion

The results obtained after several optimizations and simplifications (detailed one by one in this manuscript) prove that a matching process for an AER stereo vision system working in real-time in an FPGA obtains a success rate of 84.1% and spends less than 9 milliseconds to find the match.
The final test scenario does not contemplate multiple matching points in the master retina. Here, we present a solution for a unique pixel cluster and demonstrate that the matching step in spiking visual systems can be integrated into an FPGA. Until now, the matching processes for these systems have been run in a computer with the information received by the monitoring board [13]. With this solution, power consumption is reduced considerably.
To integrate a multiple-pixel matching inside the FPGA without it influencing the time response, we are working on a multiple-seeker matching system, where each seeker observes one specific section in the master AER histogram information.
To sum up, this work presents a novel spiking stereo vision matching approach implemented in an FPGA, which combines restrictions used in classical machine vision processing, and works with silicon bio-inspired retinas used by the Neuromorphic Engineering community. Previous work in this area has been focused on applying timing and epipolar restrictions to monitored data on a computer, using software algorithms.
The matching mechanism was evaluated and implemented in VHDL in an FPGA. To date, there is no matching mechanism used for bio-inspired binocular systems working real-time in an FPGA.
In order to compare our system with others, we have to take into account several factors like the neuromorphic paradigm, implementation, simplification of the matching process, etc. All these factors suggest that there are systems with significant variance in terms of the number of operations, response time, event rate, success rate, consumption, etc. However, there is a study by Hernandez-Juarez et al. [24] that has several factors in common with ours (implementation, matching algorithm and color range) and works in real time. In this work, the authors implemented a matching algorithm in an NVIDIA Tegra X1 (a GPU (graphics processing unit) used in cell phones). They used a 9 × 7 window (very similar to ours) and a 128-colour range (half of ours) and obtained these results: a 94% hit rate at 19 fps with a 35 W power consumption. With our system, we obtained an 84% hit rate in real time (the DVS retinas send the equivalent information to more than a 100 Hz camera, so we process at more than 100 fps) with a power consumption of 92 mW. So, although our hit-rate was worse than theirs, the power consumption and the processing speed were significantly higher. These two pillars are the essence of a neuromorphic system: speed and low consumption.

Author Contributions

Conceptualization, M.D.-M. and Á.J.-F.; methodology, M.D.-M.; software, M.D.-M.; validation, M.D.-M., Á.J.-F. and J.P.D.-M.; formal analysis, M.D.-M.; investigation, M.D.-M.; resources, J.P.D.-M.; data curation, J.P.D.-M.; writing, M.D.-M. and J.P.D.-M.; supervision, A.L.-B. and G.J.-M.; project administration, A.L.-B. and G.J.-M.; funding acquisition, A.L.-B. and G.J.-M.

Funding

This research was funded by the Spanish MICINN project COFNET: “Sistema Cognitivo de Fusión Sensorial de Visión y Audio por Eventos” (TEC2016-77785-P).

Conflicts of Interest

The authors declare no conflict of interest.

References

  1. Rosenfeld, A. Picture Processing by Computer. Comput. Surv. 1969, 1, 147–176. [Google Scholar] [CrossRef]
  2. Dyer, C.R. Volumetric scene reconstruction from multiple views. In Foundations of Image Understanding; Springer: Boston, MA, USA, 2001; pp. 1–20. [Google Scholar]
  3. Weng, J.; Cohen, P.; Herniou, M. Camera calibration with distortion models and accuracy evaluation. IEEE Trans. Pattern Anal. Mach. Intell. 1992, 14, 965–980. [Google Scholar] [CrossRef]
  4. Memon, Q.; Khan, S. Camera calibration and three-dimensional world reconstruction of stereo-vision using neural networks. Int. J. Syst. Sci. 2001, 32, 1155–1159. [Google Scholar] [CrossRef]
  5. Tsai, R. A versatile camera calibration technique for high-accuracy 3D machine vision metrology using off-the-shelf TV cameras and lenses. IEEE J. Robot. Autom. 1987, 3, 323–344. [Google Scholar] [CrossRef]
  6. Douret, J.; Benosman, R. A volumetric multi-cameras method dedicated to road traffic monitoring. In Proceedings of the IEEE Intelligent Vehicles Symposium, Parma, Italy, 14–17 June 2004. [Google Scholar]
  7. Domínguez-Morales, M.; Cerezuela-Escudero, E.; Jiménez-Fernández, A.; Paz-Vicente, R.; Font-Calvo, J.L.; Iñigo-Blasco, P.; Linares-Barranco, A.; Jiménez-Moreno, G. Image matching algorithms in stereo vision using address-event-representation: A theoretical study and evaluation of the different algorithms. In Proceedings of the SIGMAP 2011—International Conference on Signal Processing and Multimedia Applications, Seville, Spain, 18–21 July 2011; pp. 79–84. [Google Scholar]
  8. Linares-Barranco, A.; Jiménez-Moreno, G.; Linares-Barranco, B.; Civit-Balcells, A. On algorithmic rate-coded AER generation. IEEE Trans. Neural Netw. 2006, 17, 771–788. [Google Scholar] [CrossRef] [PubMed]
  9. Serrano-Gotarredona, R.; Serrano-Gotarredona, T.; Acosta-Jiménez, A.J.; Serrano-Gotarredona, C.; Pérez-Carrasco, J.A.; Linares-Barranco, B.; Linares-Barranco, A.; Jiménez-Moreno, G.; Civit-Balcells, A. On real-time AER 2-D convolutions hardware for neuromorphic spike-based cortical processing. IEEE Trans. Neural Netw. 2008, 19, 1196–1219. [Google Scholar] [CrossRef]
  10. Serrano-Gotarredona, R.; Oster, M.; Lichtsteiner, P.; Linares-Barranco, A.; Paz-Vicente, R.; Gómez-Rodríguez, F.; Camunas-Mesa, L.; Berner, R.; Rivas-Perez, M.; Delbrück, T.; et al. CAVIAR: A 45k neuron, 5M synapse, 12G connects/s AER hardware sensory-processing-learning-actuating system for high-speed visual object recognition and tracking. IEEE Trans. Neural Netw. 2009, 20, 1417–1438. [Google Scholar] [CrossRef] [PubMed]
  11. Lichtsteiner, P.; Posch, C.; Delbrück, T. A 128×128 120dB 15μs Latency Asynchronous Temporal Contrast Vision Sensor. IEEE J. Solid-State Circuits 2008, 43, 566–576. [Google Scholar] [CrossRef]
  12. Belbachir, A.N.; Litzenberger, M.; Schraml, S.; Hofstatter, M.; Bauer, D.; Schon, P.; Humenberger, M.; Sulzbachner, C.; Lunden, T.; Merne, M. CARE: A dynamic stereo vision sensor system for fall detection. In Proceedings of the ISCAS 2012—2012 IEEE International Symposium on Circuits and Systems, Seoul, Korea, 20–23 May 2012. [Google Scholar]
  13. Rogister, P.; Benosman, R.; Ieng, S.-H.; Lichtsteiner, P.; Delbruck, T. Asynchronous Event-based Binocular Stereo Matching. IEEE Trans. Neural Netw. 2012, 23, 347–353. [Google Scholar] [CrossRef] [PubMed]
  14. Jimenez-Fernandez, A.; Jimenez-Moreno, G.; Linares-Barranco, A.; Dominguez-Morales, M.J.; Paz-Vicente, R.; Civit-Balcells, A. A neuro-inspired spike-based PID motor controller for multi-motor robots with low cost FPGAs. Sensors 2012, 12, 3831–3856. [Google Scholar] [CrossRef] [PubMed]
  15. Jimenez-Fernandez, A.; Cerezuela-Escudero, E.; Miro-Amarante, L.; Dominguez-Moralse, M.J.; De Asis Gomez-Rodriguez, F.; Linares-Barranco, A.; Jimenez-Moreno, G. A binaural neuromorphic auditory sensor for FPGA: A spike signal processing approach. IEEE Trans. Neural Netw. Learn. Syst. 2017, 28, 804–818. [Google Scholar] [CrossRef]
  16. Firouzi, M.; Conradt, J.; Dikov, G.; Richter, C.; Röhrbein, F. Spiking Cooperative Stereo-Matching at 2 ms Latency with Neuromorphic Hardware. In Conference on Biomimetic and Biohybrid Systems; Springer: Cham, Switzerland, 2017. [Google Scholar]
  17. Eibensteiner, F.; Kogler, J.; Scharinger, J. A high-performance hardware architecture for a frameless stereo vision algorithm implemented on a FPGA platform. In Proceedings of the IEEE Computer Society Conference on Computer Vision and Pattern Recognition Workshops, Columbus, OH, USA, 23–28 June 2014. [Google Scholar]
  18. Berner, R.; Delbrück, T.; Civit-Balcells, A.; Linares-Barranco, A. A 5 Meps $100 USB2.0 Address-Event Monitor-Sequencer Interface. In Proceedings of the 2007 IEEE International Symposium on Circuits and Systems, New Orleans, LA, USA, 27–30 May 2007. [Google Scholar]
  19. Domínguez-Morales, M.; Cerezuela-Escudero, E.; Perez-Peña, F.; Jiménez-Fernández, A.; Linares-Barranco, A.; Jiménez-Moreno, G. On the AER Stereo-Vision Processing: A Spike Approach to Epipolar Matching. Neural Inf. Process. 2013, 8226, 267–275. [Google Scholar]
  20. Faugeras, O.; Luong, Q.; Maybank, S. Camera self-calibration: Theory and experiments. In European Conference on Computer Vision; Springer: Berlin/Heidelberg, Germany, 1992; Volume 588, pp. 321–334. ISBN 978-3-540-55426-4. [Google Scholar]
  21. Faugeras, O. Stratification of three-dimensional vision: Projective, affine, and metric representations: Errata. J. Opt. Soc. Am. A 1995, 12, 1606. [Google Scholar] [CrossRef]
  22. Martins, H.A.; Birk, J.R.; Kelley, R.B. Camera models based on data from two calibration planes. Comput. Graph. Image Process. 1981, 17, 173–180. [Google Scholar] [CrossRef]
  23. Ricolfe-Viala, C.; Sánchez-Salmerón, A.J. Using the camera pin-hole model restrictions to calibrate the lens distortion model. Opt. Laser Technol. 2011, 43, 996–1005. [Google Scholar] [CrossRef]
  24. Hernandez-Juarez, D.; Chacon, A.; Espinosa, A.; Vazquez, D.; Moure, J.C.; Lopez, A.M. Embedded real-time stereo estimation via Semi-Global Matching on the GPU. Procedia Comput. Sci. 2016, 80, 143–153. [Google Scholar] [CrossRef]
Figure 1. Hardware platforms: (a) DVS128_PAER retina; (b) USB-AERmini2 monitoring board; (c) Virtex-5 field-programmable gate array (FPGA); (d) Calibration matrix.
Electronics 08 00410 g001
Figure 2. System configuration used for this work. It shows the calibration matrix, the stereo address-event-representation (AER) system, the processing step and the final monitoring.
Electronics 08 00410 g002
Figure 3. Epipolar restriction visual explanation.
Electronics 08 00410 g003
Figure 4. Correspondence searching process using epipolar and positional restrictions.
Electronics 08 00410 g004
Figure 5. Hardware implementation specifications: (a) Block diagram; (b) Enable signals chronogram.
Electronics 08 00410 g005
Figure 6. Searching process: (u,v) is obtained from the master retina, the hash table is accessed with these coordinates and a point (x,y) is obtained, which is then used in the slave retina as the center of the searching space (δv and δh calculated after an offline analysis of the positional restriction).
Electronics 08 00410 g006
Figure 7. Epipolar lines and their correspondence points: (a) Left correspondence points (64); (b) Right correspondence points (64); (c) Same as (a) with only the first eight points; (d) Same as (b) with only the first eight points.
Electronics 08 00410 g007
Figure 8. Positional restriction results represented by the hit rate, using Table 2 data.
Electronics 08 00410 g008
Figure 9. Test scenario diagram.
Electronics 08 00410 g009
Figure 10. Parallel processing of the final system.
Electronics 08 00410 g010
Figure 11. Success rate for each test: Almost all the best results were obtained with a 3% error.
Electronics 08 00410 g011
Table 1. Epipolar restriction results: difference in pixels between the correspondence points and their epipolar lines (obtained for the 64 points of the calibration matrix).
Retina\ErrorAverage Error (pixels/point)Max Error (pixels)σ (pixels)
Right Retina1.39574.85931.5492
Left Retina2.22995.82271.0354
Table 2. Positional restriction results (in %): The rows represent vertical variations of the searching space; the columns represent horizontal variations. Final value is highlighted in red.
Vertical\Horizontal Strip (px)123456789101112131415
14.6810.9314.0615.6218.7520.3120.3121.8721.8721.8721.8721.8721.8721.8721.87
231.2551.5667.1870.3173.4379.6879.6879.6881.2581.2581.2581.2581.2581.2581.25
335.9364.0681.2585.9390.6298.4398.4398.43100100100100100100100
435.9364.0681.2585.9390.6298.4398.4398.43100100100100100100100
535.9364.0681.2585.9390.6298.4398.4398.43100100100100100100100
635.9364.0681.2585.9390.6298.4398.4398.43100100100100100100100
735.9364.0681.2585.9390.6298.4398.4398.43100100100100100100100
Table 3. On-board test results: Medium time response (in milliseconds) and global success rate (%) using an error of up to 5%.
\Error (%)012345
Time response (ms)7.98.18.58.88.99.2
Success rate (%)30.648.367.884.170.555.4
Table 4. The internal field-programmable gate array (FPGA) hardware components used in the final implementation.
SlicesUsed (number)Max (number)Usage (%)
Slice Registers42820,4802.09%
 - used as Flip-Flops34220,4801.67%
 - used as Latches8620,4800.25%
Slice LookUp Tables (LUTs)706620,4803.5%
 - used as Logic116820,4805.75%
 - used as Memory5898608097%
TOTAL749420,48036.59%
Table 5. Estimated FPGA power consumption with the final implementation with a 2 Mevps input.
On-Chip PowerConsumption (mW)From total (%)
Dynamic11.1
 - Signals0.270.29
 - Logic0.680.74
 - I/O0.050.07
Static9198.9
TOTAL92100

