Article

Electric Field and Dispersion Characteristic Calculations of Glass Tube Waveguides Filled with Biological Substances

by
Darius Plonis
1,*,
Juozas Bučinskas
2,
Raimondas Pomarnacki
1,
Darius Miniotas
1,
Šarūnas Paulikas
3,
Andrius Katkevičius
1,
Romanas Martavičius
1 and
Liudmila Nickelson
1
1
Department of Electronic Systems, Vilnius Gediminas Technical University, Naugarduko str. 41, 03227 Vilnius, Lithuania
2
Chemical Physics Institute, Vilnius University, Sauletekio str. 9, 10222 Vilnius, Lithuania
3
Department of Computer Science and Communications Technologies, Vilnius Gediminas Technical University, Naugarduko str. 41, 03227 Vilnius, Lithuania
*
Author to whom correspondence should be addressed.
Electronics 2019, 8(3), 301; https://doi.org/10.3390/electronics8030301
Submission received: 29 January 2019 / Revised: 23 February 2019 / Accepted: 25 February 2019 / Published: 7 March 2019
(This article belongs to the Section Bioelectronics)

Abstract

:
This study presents calculation of dispersion characteristics in the frequency range 1–100 GHz as well as electric field distributions in an open cylindrical waveguide with a central channel. The waveguide is made of glass material. The channel can be either empty or filled with blood plasma or blood cells. We investigated two kinds of electromagnetic (ЕМ) waves, the “tube” and “core” modes, each having a different structure of their electric fields. In the current study, the analysis focused on the fundamental and the first higher hybrid magnetic and electric “tube” modes. The fundamental “tube” mode that propagates in the waveguide filled with blood plasma is characterized by a very small loss at frequencies above 65 GHz. Meanwhile, the first higher mode suffers from strong attenuation in the same frequency range. This calls for finding ways to improve the waveguide’s broad-bandwidth. Our approach involves determining the dependence of this parameter on the inner radius of the waveguide. Extremes of the waveguide’s broad-bandwidth are observed at certain values of its inner radius. When the waveguide is filled with blood plasma or blood cells, the electric fields of the magnetic “tube” mode concentrate around the channel, and the electric field intensity decreases with the propagation of this mode along the waveguide, i.e., with increase of coordinate z. If the channel is filled with blood cells, the electric field of the hybrid magnetic “core” mode is concentrated in the center of the waveguide. This mode is characterized by a large attenuation h”, which reaches 500 m−1 at 30 GHz.

1. Introduction

Blood is the key biologic fluid of the human organism. Blood tests are very important, since they allow a quick determination of various changes in the organism. Comprehensive blood tests facilitate detection of different inflammations, allergies, diseases of the blood system, and the earliest signs of other illnesses [1,2].
In [3] is presented the influence of α-, β-, δ-, and γ dispersions which characterize the anomalous electrical properties of biomaterials with high water content on the material complex permittivity ε (ω, T). The complex permittivity is expressed through the relaxation time of medium τ, the high-frequency permittivity ε , static permittivity εS, and other parameters at different temperatures and frequencies. It is noted here that the γ-dispersion is only important in the microwave range and is observed at about 20 GHz. In [4] it is shown that there are two processes that strongly influence the value of permittivity of biomaterials. These processes are the relaxation and resonance behavior of molecules. The resonance behavior is based on the intra- and inter-vibrations of the water molecular. These vibrations occur in the frequency range higher than 1 THz. In [4] it is noted that the frequency dependence of the permittivity of water, calculated using the Debye equation, proved to be adequate and the Debye model has been verified by many researchers as the correct description of experimental data up to 100 GHz.
Dependences of the complex permittivity on the temperature at different frequencies are shown in articles [4,5]. In [4], for the real ε’ and imaginary ε” parts of the permittivity of water in the frequency range from 2 GHz to 100 GHz at the room temperature, the value ε’ is approximately constant and the imaginary part ε” varies slightly. The measured dependences of value ε” and loss tangent tanδ ≈ ε’/ε” in the temperature interval 10–97 °C at f = 10 GHz are presented in article [5]. Here, it is shown that the measured values change slightly at a temperature of 22–25 °C. We assumed that the temperature of biomaterials corresponds to the room temperature (22–25 °C) in our calculations.
The dependence of complex permittivity of various biomaterials upon frequency is often expressed in terms of the dielectric model of Debye, and its modifications double Debye, Cole‒Cole, or multiply Cole‒Cole [6,7,8]. There are measurements and simulations using the double Debye method in [6]. Here, the expression for the calculation of the permittivity using the double Debye method is given. The comparisons of the measured complex dielectric constant and simulations using the double Debye model indicate that they correspond to each other.
Debye formulas, Cole‒Cole models, measured dielectric constant, and loss tangent dependencies on frequency in the 2.2–2.7 GHz frequency range for water solutions with different glucose concentrations are presented in [7].
Expressions of complex permittivity as a function of frequency for several models including the Cole‒Cole method are presented in [8]. Experimental data for the permittivity and conductivity of different tissues (blood, brain, lung, muscle, etc.), calculated values until 100 GHz, and comparison with literature are given in article [8].
In [9] measured permittivity and conductivity of biological liquids such as NaCl solutions at the frequency range from 0.1 GHz to 100 GHz are presented. It is shown in [9], that static permittivity, relaxation time, and other parameters, which were used in Debye and Cole‒Cole methods, may have close values at 20 °C.
The absorption coefficient and refractive index for whole blood, blood cells, plasma, and a thrombus are presented in article [10]. Here the complex permittivity using the double Debye model is calculated using the formula:
ε _ ( ω ) = ε + j = 1 n Δ ε / ( 1 + j ω τ j ) ,
where τ is the Debye relaxation time, which is necessary for 1/e of the dipoles to relax to equilibrium, and ε is the real part of the dielectric constant at the high frequency limit, Δε = εj − εj+1; here, εj are intermediate values of the dielectric constant at different times, τj is the relaxation time relating to the j-th relaxation process, and ω is the angular frequency. The double Debye coefficients in formula ε(ω) at n = 1, j =1, 2, i.e., τ1, τ2, ε1 = εS is the low-frequency permittivity, and ε2 and ε for whole blood and blood components such as blood cells and blood plasma are given in Table 1 of article [10]. We have used this formula for calculation of the complex permittivity ε(ω).
The experimental data on the complex permittivity of some biological solutions in the 2–67 GHz range at 24 °C room and 37 °C human body temperatures are presented in [11]. Cole models are developed using the Debye equation with parameters expressed as a Gaussian distribution of relaxation times in [12]. Dielectric losses of blood as a function of applied frequency at different values of the dispersion parameter to determine the biomaterial permittivity for frequencies from 10−2 till 1012 Hz are given in [12]. Abdalla [12] found that complex permittivity of blood is heavily affected by the amount of glucose therein. Such studies can help to develop biosensors for diagnosis of diabetes.
In the last few decades there has been successful use of electromagnetic (EM) waves and waveguides for the development of diagnostic and treatment medical devices. Li et al. [13] described the structure of the waveguide microfluidic device, which was designed for the investigation of dielectric behavior of different materials, detection of variations of the refractive index in liquid, and also for numerical simulations using the finite-difference time domain method. The described devices can also show how the spectrum of the EM signal will be affected by a waveguide with a liquid. Such a device operates in the THz frequency range and can be used for identifying chemical and biological fluids, or detecting cancerous cells in fluids.
The aim of our presented article is to show the results of analyses of the electromagnetic (EM) waves that can propagate in circular tube waveguides, which can be filled with strong lossy biological liquids. We have used a computer-based simulation by writing our own code based on the rigorous electrodynamic solution of the Maxwell’s equations in our investigations. We assume that our numerical calculations of glass tube waveguides filled with human blood components can help in the development of a simple diagnostic method.

2. Materials and Methods

The tube waveguide under investigation had an open (unshielded) layered structure with a central channel (Figure 1). The channel could be filled with liquid blood components. The EM waveguide model consisted of three areas.
Definitions of “tube” and “core” modes are short names that correspond to the glass or biomaterial in which electromagnetic waves are mainly concentrated, propagate, and allow us to distinguish two groups of EM waves (modes). The dispersion characteristics of these groups of EM waves are very different, as most of their energy is concentrated in different materials.
The first area is a channel with the radius r that could be filled with either air, having permittivity ε _ 1 = ε 1 = 1 (empty channel), or with a biological liquid, having the complex permittivity ε _ 1 = ε 1   i ε 1 , where i = 1 is the imaginary number.
Methods used in the investigation:
  • The differential Maxwell’s equations, coupled mode, and partial area methods are used in order to receive a complex dispersion equation of layered structure filled with biological substances;
  • The coherent approaching (iterative) and least square methods are used for the calculation of the complex propagation constant and the parameters of tube waveguide filled with biological substances.
Blood components were either blood plasma or red blood cells described by the complex permittivity ε1. The permittivity of blood components was defined using the double Debye dielectric relaxation model. Double Debye coefficients for blood plasma and blood cells were taken from the experimental results [10].
The second area in the analyzed waveguide is а glass layer with permittivity ε _ 2 = ε 2   i ε 2 , which is equal to ε _ 2 = ε 2 = 4 in our calculations. The thickness of the glass layer is t = R − r, where R is the external radius of the waveguide and r is the inner waveguide radius, which is also the radius of the channel.
The third area is an unlimited media surrounding the waveguide. It starts from R and stretches to infinity. This area has the permittivity ε _ 3 = ε 3   i ε 3 , which is air with ε _ 3 = ε 3 = 1 in our calculations. The solution of this 2D problem was implemented using the partial area method [14]. Our algorithm and calculations were verified by using CST Microwave Studio® (CST MWS). The boundary conditions for the tangential components of the electric Eφ, Ez, and magnetic Hφ, Hz fields were all satisfied for each partition area. The same was satisfied for the condition at infinity. The latter had to be satisfied because the waveguide under investigation had an open structure, and the EM field might extend beyond the tube waveguide.
The longitudinal components of the electric and magnetic fields are described by Bessel, Neumann, and Hankel cylindrical functions with the arguments of these functions being dependent on EM properties of the media in each of the three waveguide areas.
The longitudinal and tangential components of electric and magnetic fields, which satisfy Maxwell’s equations in the channel of the tube waveguide (Figure 1) can be presented as:
E _ z c = [ B _ 1 J m ( k _ c r ) ] e ± i m φ ;
H _ z c = [ A _ 1 J m ( k _ c r ) ] e ± i m φ ;
E _ φ c = i h _ ( k _ c ) 2 E _ z c r φ + i ω μ 0 μ 1 ( k _ c ) 2 H _ z c r ;
H _ φ c = i h _ ( k _ c ) 2 H _ z c r φ + i ω ε 0 ε _ 1 ( k _ c ) 2 E _ z c r ,
where A1 and B2 are unknown amplitude coefficients for the channel of the tube waveguide; J m ( k _ c r ) is the Bessel function of the first kind of the m-th order with the complex argument k _ c r ; m is the first (azimuthal) index of the hybrid mode, which describes the constant component of the longitudinal wave using the azimuthal perimeter coordinate φ; where h = h’ − ih’’ is the complex propagation constant (here, h’ = Re(h) = 2π/λ is the phase constant and λ is the wavelength of the waveguide modes; here, h’’ = Im(h) is the attenuation constant); k = ω/c is the wave number in a vacuum.
The number of transversal waves in the channel of the tube waveguide can be presented as:
k _ c = k 2 μ 1 ε _ 1 h _ 2 .
The longitudinal and tangential components of electric and magnetic fields, which satisfy Maxwell’s equations in the dielectric layer of the tube waveguide (Figure 1), can be presented as:
E _ z d = [ B _ 2 J m ( k _ d r ) + C _ 2 Y m ( k _ d r ) ] e ± i m φ ;
H _ z d = [ A _ 2 J m ( k _ d r ) + D _ 2 Y m ( k _ d r ) ] e ± i m φ ;
E _ φ d = i h _ ( k _ d ) 2 E _ z d r φ + i ω μ 0 μ 2 ( k _ d ) 2 H _ z d r ;
H _ φ d = i h _ ( k _ d ) 2 H _ z d r φ + i ω ε 0 ε _ 2 ( k _ d ) 2 E _ z d r ,
where A2, B2 and C2, D2 are unknown amplitude coefficients for the external dielectric layer; J m ( k _ d r ) is the Bessel function of the first kind of the m-th order with the complex argument k _ d r ; Y m ( k _ d r ) is the Bessel (Neumann) function of the second kind of the m-th order with the complex argument; k _ d r is number of the transversal waves in anisotropic dielectric layer.
The number of transversal waves in the dielectric layer can be presented as:
k _ d = k 2 μ 2 ε _ 2 h _ 2 .
Area 3 of the model (Figure 1) is air and the longitudinal and tangential components of electric and magnetic fields in the air are:
E _ z a = B _ 3 H m ( 2 ) ( k _ a r ) e ± i m φ ;
H _ z a = A _ 3 H m ( 2 ) ( k _ a r ) e ± i m φ ;
E _ φ a = i h _ ( k _ a ) 2 E _ z a r φ + i ω μ 0 μ 3 ( k _ a ) 2 H _ z a r ;
H _ φ a = i h _ ( k _ a ) 2 H _ z a r φ + i ω ε 0 ε _ 3 ( k _ a ) 2 E _ z a r ,
where A3 and B3 are unknown amplitude coefficients; H m ( 2 ) ( k _ a r ) is the Bessel (Hankel function of the second kind) function of the third kind of the m-th order with the complex argument; k _ a r is the number of transversal waves in the air. The number of transversal waves in the air can be presented as:
k _ a = k 2 μ 3 ε _ 3 h _ 2 .
The complex dispersion equation of the tube waveguide is 8-th order complex determinant expression D = det(ajk) = 0 in this investigation case, where j and k are the column and row indexes respectively; ajk are the complex elements of the determinant (Figure 2).
The determinant consists of four parts: the part, which is represented by “c”, includes elements of determinant, which indicate the EM wave propagation in the channel; the part, which is represented by “ad”, includes elements of determinant, which indicate the EM wave propagation in the dielectric layer, and the last part, which is represented by “a”, includes elements of determinant, which indicate the EM wave propagation in the air.
The boundaries between the three areas are represented by “c-ad” and “ad-a”, whereby “c-ad” is the boundary between the channel and the dielectric layer, and “ad-a” is the boundary between the dielectric layer and the air.
This complex determinant is the dispersion equation, the roots of which give the solution of our boundary value problem, i.e., the values of h = h’ − ih” where h = hmn is the complex longitudinal propagation constant of hybrid modes, h’ is the phase constant, and h” is the attenuation coefficient (waveguide loss). The latter characterizes а loss of the certain mode with indexes m and n.
The phase coefficient is inversely proportional to the wavelength λ of the propagating mode, i.e., h′ = 2π/λ. The Poynting vector is directed along the z‒axis. Propagating modes are of hybrid type as their EM fields have all six components Er, Eφ, Ez, Hr, Hφ, and Hz. In turn, these hybrid modes can be of either the magnetic HEmn or electric EHmn type as determined by the ratio of the field components.
The first and second numbers of indexes denote the number of half-wave field variations in the angular and radial directions, respectively. In the present study, the dispersion characteristics and distribution of the electric field are modeled using our computer code based on MATLAB.
In the waveguide considered here, electromagnetic waves can be excited in a standard way. The waveguide is formed by a cylindrical glass ampule filled with body liquids. One end of the ampule should be shaped like a cone (resembling the point of a pencil). The other end of the ampule should be open to allow it to be filled with liquid.
The open end of the glass ampule is closed by a cone-shaped stopper that prevents leaking of the fluid. This glass waveguide with both cone-shaped ends is placed in a microwave measuring tract. The ends of the cone-shaped waveguide are used to connect the waveguide with the microwave tract. The main mode of the metal waveguide is the mode H11, whereas the cylindrical glass waveguide carries the hybrid mode HE11. The modes H11 and HE11 have the same EM field symmetry. Microwave devices usually operate only on the main mode, whilst the higher modes are considered parasitic. The method of excitement for open (without a conductor screen) dielectric waveguides is described in [15].

3. Results

3.1. Analysis of Dispersion Characteristics of Glass Tube Waveguide

Dispersion characteristics of the glass tube waveguide express the phase constant h′ and attenuation constant h′′ as functions of frequency f, channel radius is r = 1 mm, whereas the external radius of the glass tube waveguide is R = 5 mm.
In Figure 3 and 
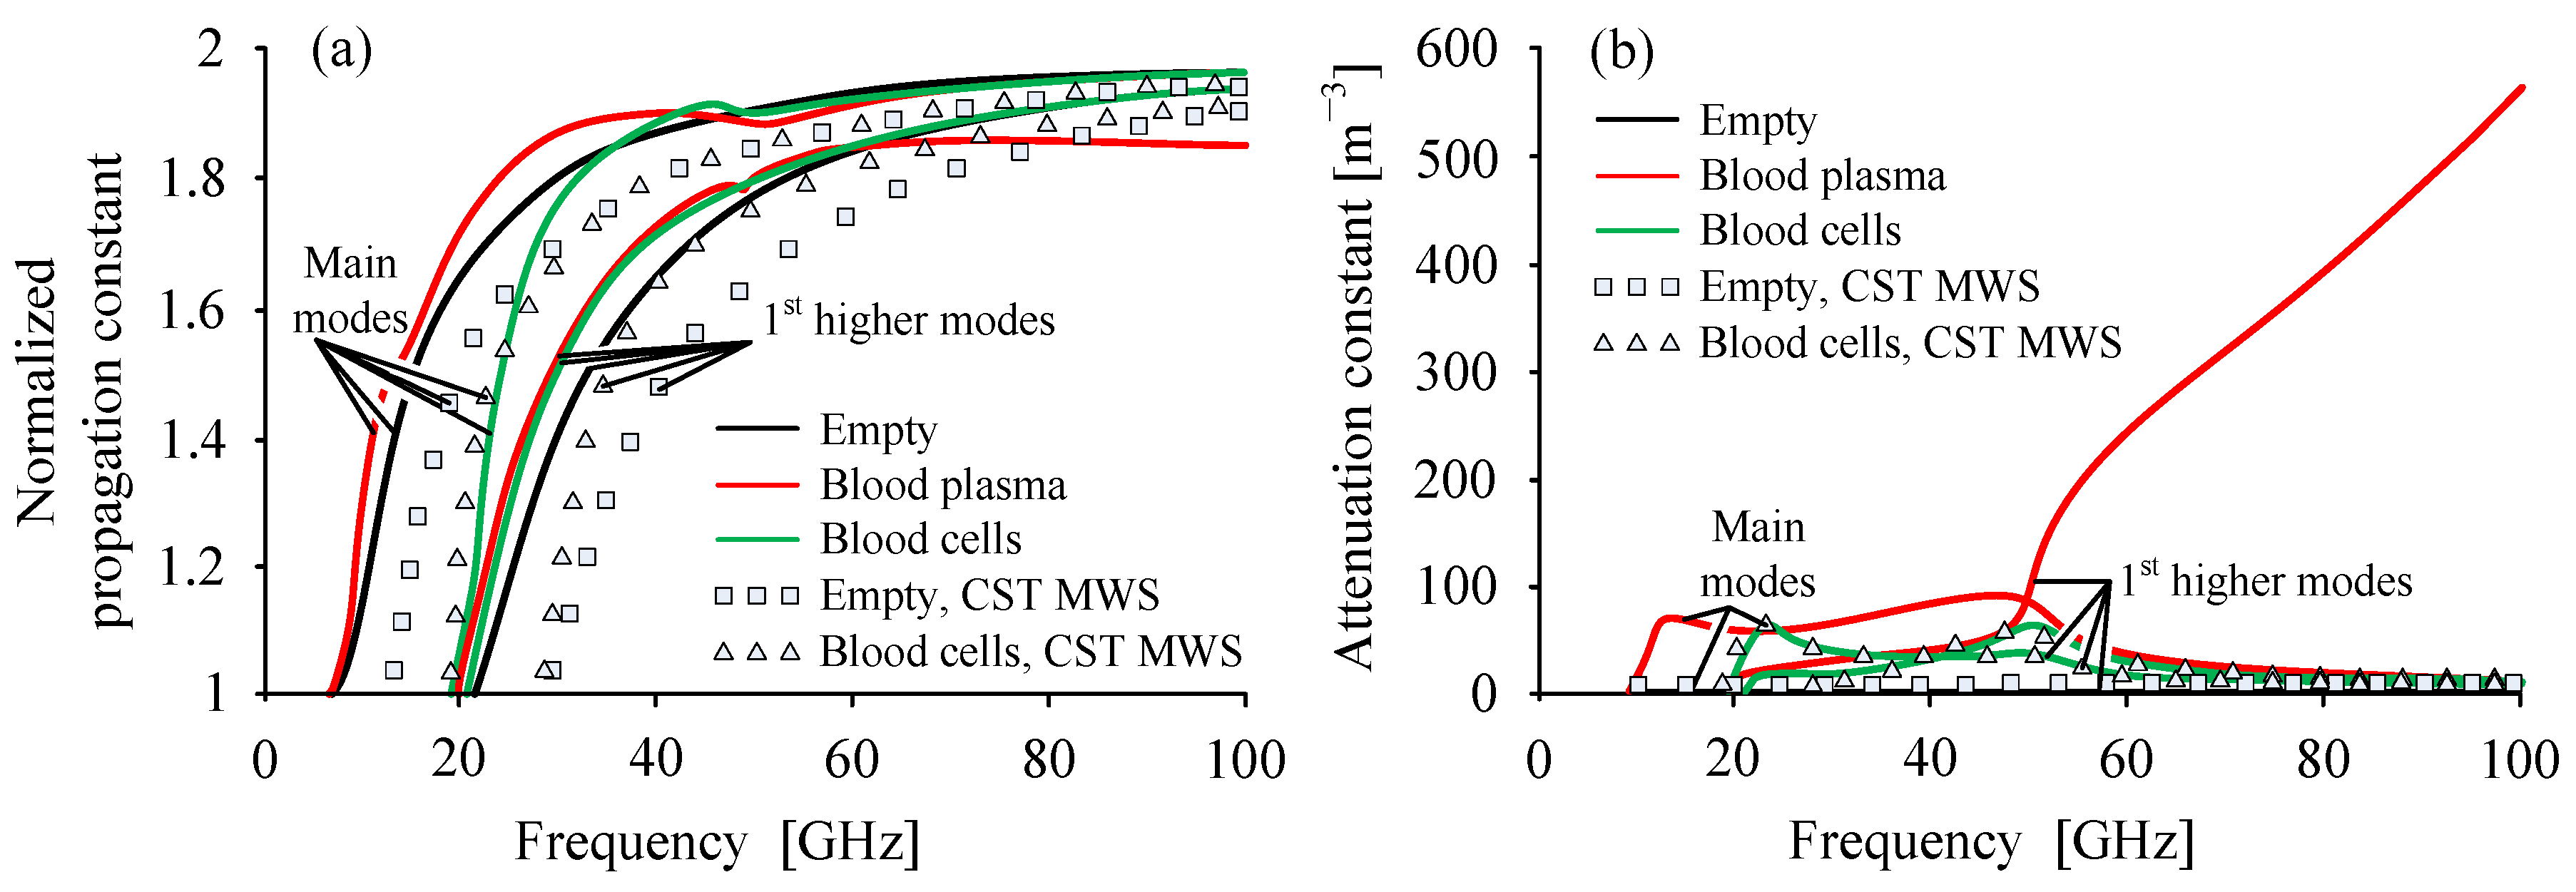
Figure 4 the normalized phase constant h′/k and the attenuation constant h′′ dependences of the waveguides in the frequency range from 1 GHz to 100 GHz are given, where k is the propagation constant in free space. These figures display the frequency characteristics of the fundamental mode for three cases: empty glass tube waveguide (black line), waveguide filled with blood plasma (red line), and waveguide filled with blood cells (green line). In Figure 3, Figure 4, Figure 5, Figure 6, Figure 7, Figure 8 and Figure 9, the inner waveguide radius (corresponding to the channel radius) is r = 1 mm, whereas the external radius of the glass tube waveguide is R = 5 mm.
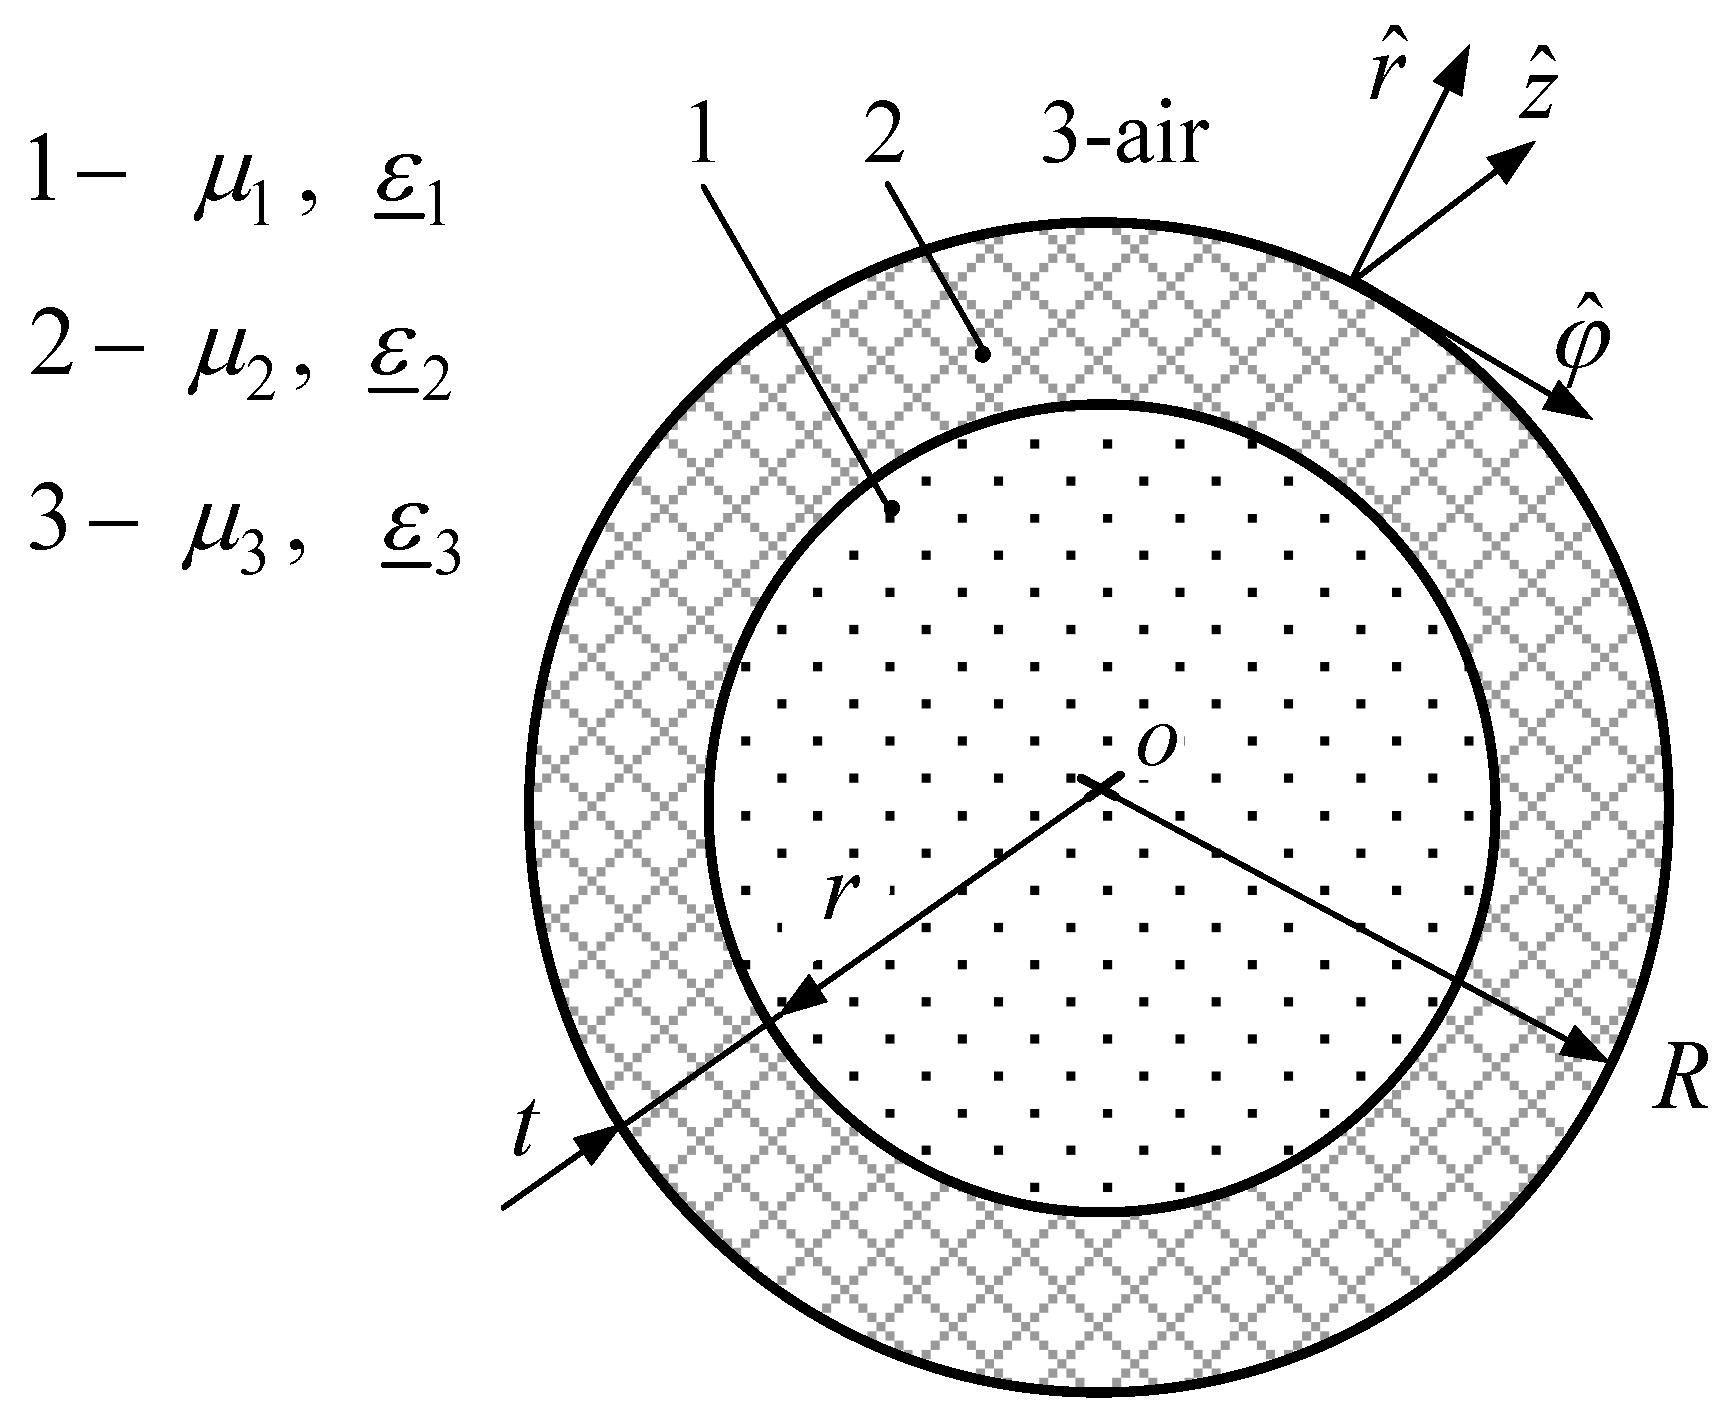
We have discovered two kinds of different modes in the frequency range from 1 GHz to 100 GHz. These modes can propagate in the waveguides, which are filled with blood plasma and blood cells. This phenomenon might be explained as follows. In order to understand the processes taking place in the layered “air-glass-blood” waveguide, we can mentally imagine that the one is dissected into two almost independent waveguides, i.e., a glass tube waveguide and cylindrical core waveguide, which is made of very dissipative liquid blood components. The implied cylindrical core waveguide boundary matches with the central channel boundary of the tube waveguide. The cylindrical core waveguide is surrounded by lossless and low-permittivity materials such as glass and air.
These waveguides as the glass tube and the biomaterial core of the waveguide assume the existence of two independent groups of modes.
This is the reason why modes of several kinds may propagate in the layered waveguide when it is filled with blood components. The two kinds of the propagating hybrid modes investigated in the present study feature remarkably dissimilar dispersion curves as well as quite different distributions of the EM field.
In the case of the first kind of the modes, the EM field energy concentrates mostly in the glass tube. For this reason, the modes of the waveguide filled with blood components have dispersion characteristics similar to those of the empty glass tube waveguide and the modes have relatively low losses. We shall call these the “tube” modes.
The EM field energy of the second kind of the hybrid modes is concentrated in the channel of the waveguide filled with the absorbent substance, such as blood plasma and blood cells. Losses of those modes are higher, and we shall call them the “core” modes.
This paper presents dispersion characteristics of the fundamental and the first higher “tube” modes (Figure 3) and the ЕМ field distributions of the fundamental “tube” mode (Figure 7 and Figure 8). Dispersion characteristics of the fundamental HE11 and the first higher EH11 modes are required for calculating the broad-bandwidth (or the operating frequency range) of the waveguide.
Since the higher mode types (the second, the third, etc.) are seldom used when developing microwave devices, their analysis was not included in the current study. The results of our calculations of dispersion characteristics using the commercial program CST MWS are marked with squares for the empty waveguide and with triangles when filled with blood cells (Figure 3). For the “core” modes, the EM field energy is concentrated in the waveguide’s central channel, which is filled with an absorbent substance. Dispersion characteristics of the “core” modes are shown in Figure 4. The “core” mode is accompanied by higher losses (Figure 4b and Figure 9b).
Let us examine alternately the properties of the EM “tube” and “core” modes. The cutoff frequency of the “tube” mode present in the waveguide filled with air, blood plasma, and blood cells is 7.10, 6.61, and 19.27 GHz, respectively. Meanwhile, for the first higher mode, the cutoff frequency is 21.70, 19.69, and 20.86 GHz, respectively (Figure 3).
As seen in Figure 3a, the phase coefficient of the fundamental mode for the waveguide filled with blood plasma has an anomalous dispersion in the frequency band of 40‒52 GHz. In the frequency band of 47‒49 GHz, such an anomaly is observed for the first higher “tube” mode as well.
The anomalous dispersion is revealed by the abnormal changes of phase coefficient h’, which is equivalent to the wavelength λ that decreases with frequency in a certain frequency range. One can also observe anomalous dispersion at the frequency range of 48‒54 GHz but only for the fundamental “tube” modes present in a waveguide filled with blood cells.
Above 70 GHz, the frequency characteristic of the phase constant for the fundamental mode in a waveguide filled with liquid is virtually identical to that of an empty waveguide (Figure 3a).
This is due to the fundamental mode propagating almost inside the glass layer in the high-frequency part of the considered range where the EM parameters of a biological liquid have almost no effect on the propagation of the modes (see Figure 3a).
At high frequencies, the attenuation coefficient of the fundamental mode approaches zero since the mode’s EM energy is completely drawn into the lossless glass medium with ε’’ = 0. This way the mode propagates along the glass tube with very small attenuation, as seen in Figure 3b. We would like to note that the losses in the glass were not taken into account in order to observe the impact on the waves of absorbent materials.
A completely different situation occurs for the first higher mode present in the waveguide filled with blood plasma. Its phase coefficient starts decreasing slightly at frequencies above 65 GHz (Figure 3a). Meanwhile, the attenuation coefficient (i.e., the waveguide loss) for this mode increases substantially (Figure 3b).
As a consequence, a larger part of the EM energy of the first higher mode propagates in blood plasma when f > 65 GHz. However, the mode spreading along the waveguide disappears fast due to substantial losses.
Note that in the waveguide filled with blood plasma, the fundamental mode propagates with very small loss at frequencies above 65 GHz and the first higher mode is strongly attenuated. Due to this, one can improve the broad-bandwidth of the waveguide.
At frequencies above 65 GHz, the attenuation for the first higher “tube” mode present in the waveguide filled with air and blood cells is relatively low and decreases further with frequency.
In the frequency range of approximately 7 GHz to 60 GHz, the attenuation coefficient curves are quite complex. This is due to redeployment of some of the EM energy between the glass tube and the channel of the waveguide filled with blood components. The attenuation becomes higher when the EM energy of a mode penetrates deeper into the channel, which is filled by blood plasma with the permittivity ε1’’ that can reach 39 and blood cells with ε1’’ that can reach up to about 10 at the 7–60 GHz frequency range (Figure 3b).
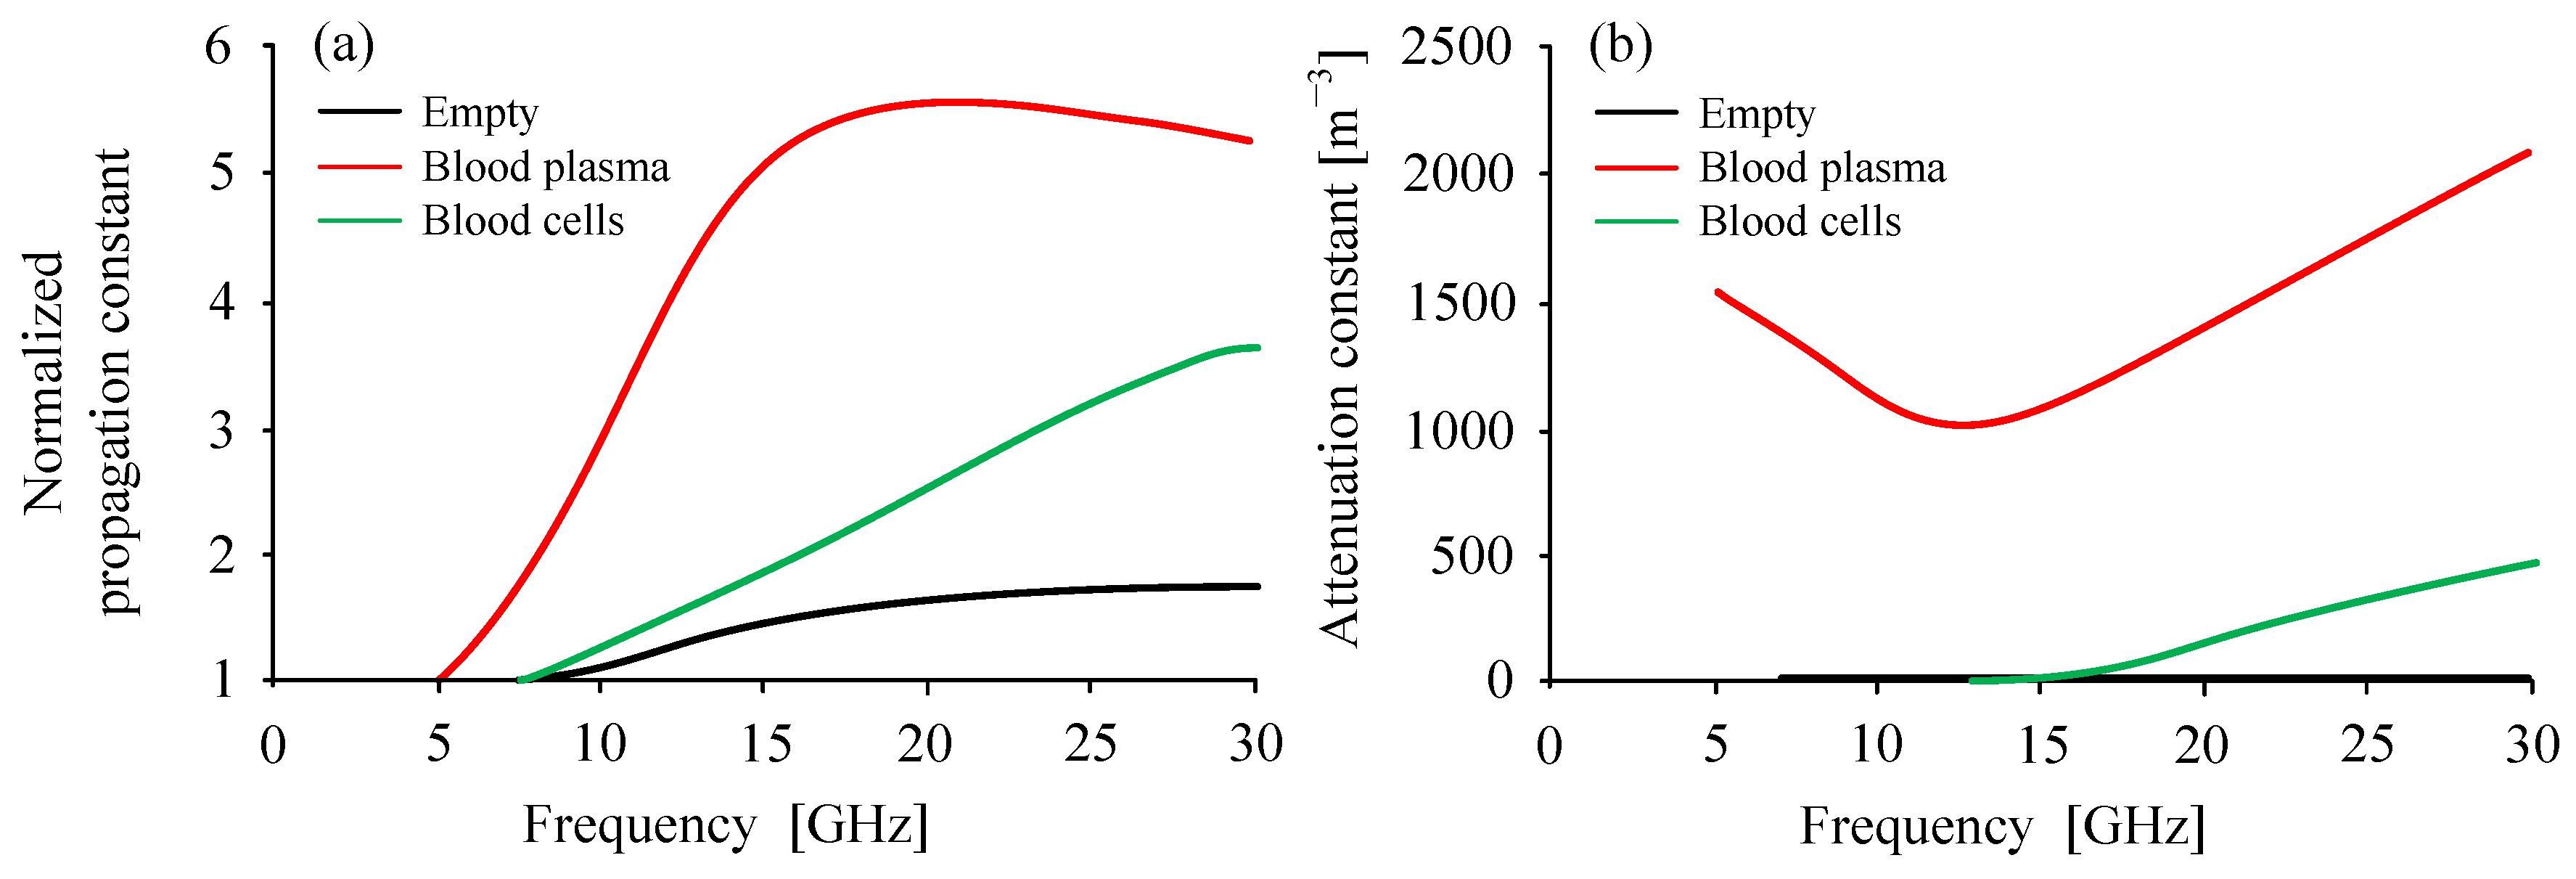
Figure 4a,b show how the phase and attenuation constants depend on frequency for the fundamental “core” mode only. As seen in Figure 4a, with increasing value of ε _ 1 = ε 1   i ε 1 the mode wavelength decreases while the attenuation increases. Therefore, for the waveguide filled with blood plasma, the attenuation coefficient of the fundamental “core” mode is large and can be in the range of 1000–2000 m−1 (Figure 4b).
When the waveguide is empty, the cutoff frequency of the “core” mode is 7.10 GHz. For the waveguide, which is filled with blood plasma and blood cells, it is equal to 4.95 GHz and 6.67 GHz respectively. The fundamental “core” mode is of the hybrid magnetic type HE11. We have implemented this classification by calculating all the EM field components of this mode. It has turned out that longitudinal components relate Hz > Ez. Waveguides with the empty channel as well as those filled with blood cells have low attenuation (h’’ < 20 m−1) in the frequency range of 5–15 GHz.
Figure 5 displays the waveguide’s broad-bandwidth for the “tube” modes (see Figure 3) as a function of the inner radius r of the glass tube when its external radius is R = 5 mm. As the inner radius r varies from 0.1 mm to 4.5 mm, thickness of the glass tube’s wall decreases from 4.9 mm to 0.5 mm.
The broad-bandwidth of the waveguide is calculated using the following expression:
( f c u t 2   f c u t 1 ( f c u t 1 + f c u t 2 ) / 2 ) 100 %    = ( Δ f f c ) 100 % ,
where Δf = fcut2–fcut1, fcut1 is the cutoff frequency of the fundamental mode, fcut2 is the cutoff frequency of the first higher mode, and fc = ( fcut1+fcut2)/2 is the center frequency.
The relationship between the waveguide’s broad-bandwidth and the radius r is presented in Figure 5 for the cases of an empty glass tube waveguide (black line), and for the waveguide filled with blood plasma (red line) or blood cells (green line).
The broad-bandwidth of an empty waveguide gradually decreases with an increase in the channel’s inner radius. However, the broad-bandwidth drops when the radius exceeds 3.5 mm. This is a result of the waveguide walls becoming very thin and part of the EM mode power leaves the boundaries of the waveguide. In turn, this leads to a significant increase of non-linearity in the frequency dependence of the phase constant.
For a waveguide filled with liquid, the mode critical frequencies become very sensitive to changes in the waveguide’s geometry. Figure 5 shows minima and maxima of the broad-bandwidth at certain values of r. They are highly influenced by the frequency-dependent complex relative dielectric permittivity of biologic liquids.
Hence, one can choose a suitable value for the broad-bandwidth of the “tube” modes by selecting the thickness of the wall of the glass tube waveguide.

3.2. Analysis of Electric Field Distributions in the Glass Tube Waveguide

Analysis of the distributions of magnetic and electric field components is an important part of the solution for the EM problem. These distributions allow us to determine the type of hybrid mode as well as its location. A waveguide can support propagation of the modes of magnetic and/or electric types.
Dispersion characteristics for the “tube” (Figure 3) and “core” (Figure 4) modes were used as the basis for calculating the EM field components (Er, Eφ, Ez) in various points of the transverse and longitudinal cross-sections. We performed a simulation of the EM field components in 40,400 points of the transverse waveguide’s cross-section (Figure 6а, Figure 7a, Figure 8a, Figure 9а) and in 29,400 points of the longitudinal waveguide’s cross-section (Figure 6b, Figure 7b, Figure 8b, Figure 9b).
Only the distributions of the electric field for the fundamental “tube” and “core” modes are presented here. Wavelength λ of the modes is given at the top of Figure 6b, Figure 7b, Figure 8b, Figure 9b.
We used a method that allowed exploring the electric and magnetic field distributions of the higher modes as well [15].
Figure 6, Figure 7, Figure 8 and Figure 9 display a snapshot of the waves travelling either across or along the waveguide.
The electric field is represented in two ways, by the electrical field lines and by color intensity. In the first case, the electric field is visualized at every point of both the cross-sections with a collection of arrows each having a certain length and direction. The tip of an arrow indicates direction of the electric field lines at the point considered, whereas the arrow’s length is proportional to the strength of the electric field vector at the point.
For a better display, color coding is also used in Figure 6, Figure 7, Figure 8 and Figure 9 for the electric field densities. A scale placed on the right side of the corresponding picture shows the normalized intensity of the EM field. The greatest intensity of an electric field corresponds to the unit, i.e., to the dark red color.
Figure 6 shows the electric field’s distribution of the fundamental mode for the glass tube waveguide filled with air, i.e., the one with an empty channel. The radii of this waveguide are r = 1 mm and R = 5 mm. Calculations were performed at the frequency of 50 GHz.
The electric field’s vector is E = r ^ E r + φ ^ E φ + z ^ E z , where E r ,    E φ ,    E z are the field projections, and r ^ ,    φ ^ ,    z ^ are the unit vectors (see Figure 1). The electric field’s vector at an arbitrary point of the transverse cross-section was calculated as a sum of two vectors r ^ E r and φ ^ E φ . Meanwhile, the electric field’s vector at an arbitrary point of the longitudinal cross-section was calculated as a sum of two vectors r ^ E r and z ^ E z .
These plots clearly demonstrate the electric field’s structure at each layer and outside of the waveguide. Moreover, they identify the location of the highest concentration of the electric field. For the case of an empty glass waveguide, the electric field concentrates within the glass material (Figure 6).
The “tube” mode is not strongly attenuated along the waveguide, as we chose zero value for the imaginary part of the glass permittivity in our calculations. As can be seen, the electric field extends only about 3–4 mm beyond the waveguide’s external radius. In the inner channel of the waveguide, the electric field is weaker than that within the glass layer by a factor of 2.5. Such a structure of the field’s fundamental mode is typical for dielectric hollow cylindrical waveguides made of other materials as well [15].
The structure of the electric field’s fundamental mode changes substantially when the inner channel of the waveguide is filled with blood plasma (Figure 7) or blood cells (Figure 8). Similar to the case of an empty waveguide, the largest portion of the EM mode’s power does not leave the boundaries of the waveguide. The electric field is most intense within glass at the boundary between the inner r and the outer R of the waveguide. As can be seen from Figure 7 and Figure 8, the structure of the field is very similar in both cases.
We can see that the electric field concentrates around the channel with the (repeating) form of the field maxima.
Figure 7 and Figure 8 also demonstrate a small phase shift between the propagating modes due to the different phase constants (h’ = 2π/λ) of the modes at 50 GHz (Figure 3a). In the inner channel of the waveguide filled with blood cells, the electric field is stronger than that found in the waveguide filled with blood plasma. This is due to the fact that the parameter ε _ 1 = ε 1   i ε 1 of blood cells is lower than that of blood plasma. For the same reason, the losses of the fundamental mode are also lower in the waveguide filled with blood cells (Figure 3b).
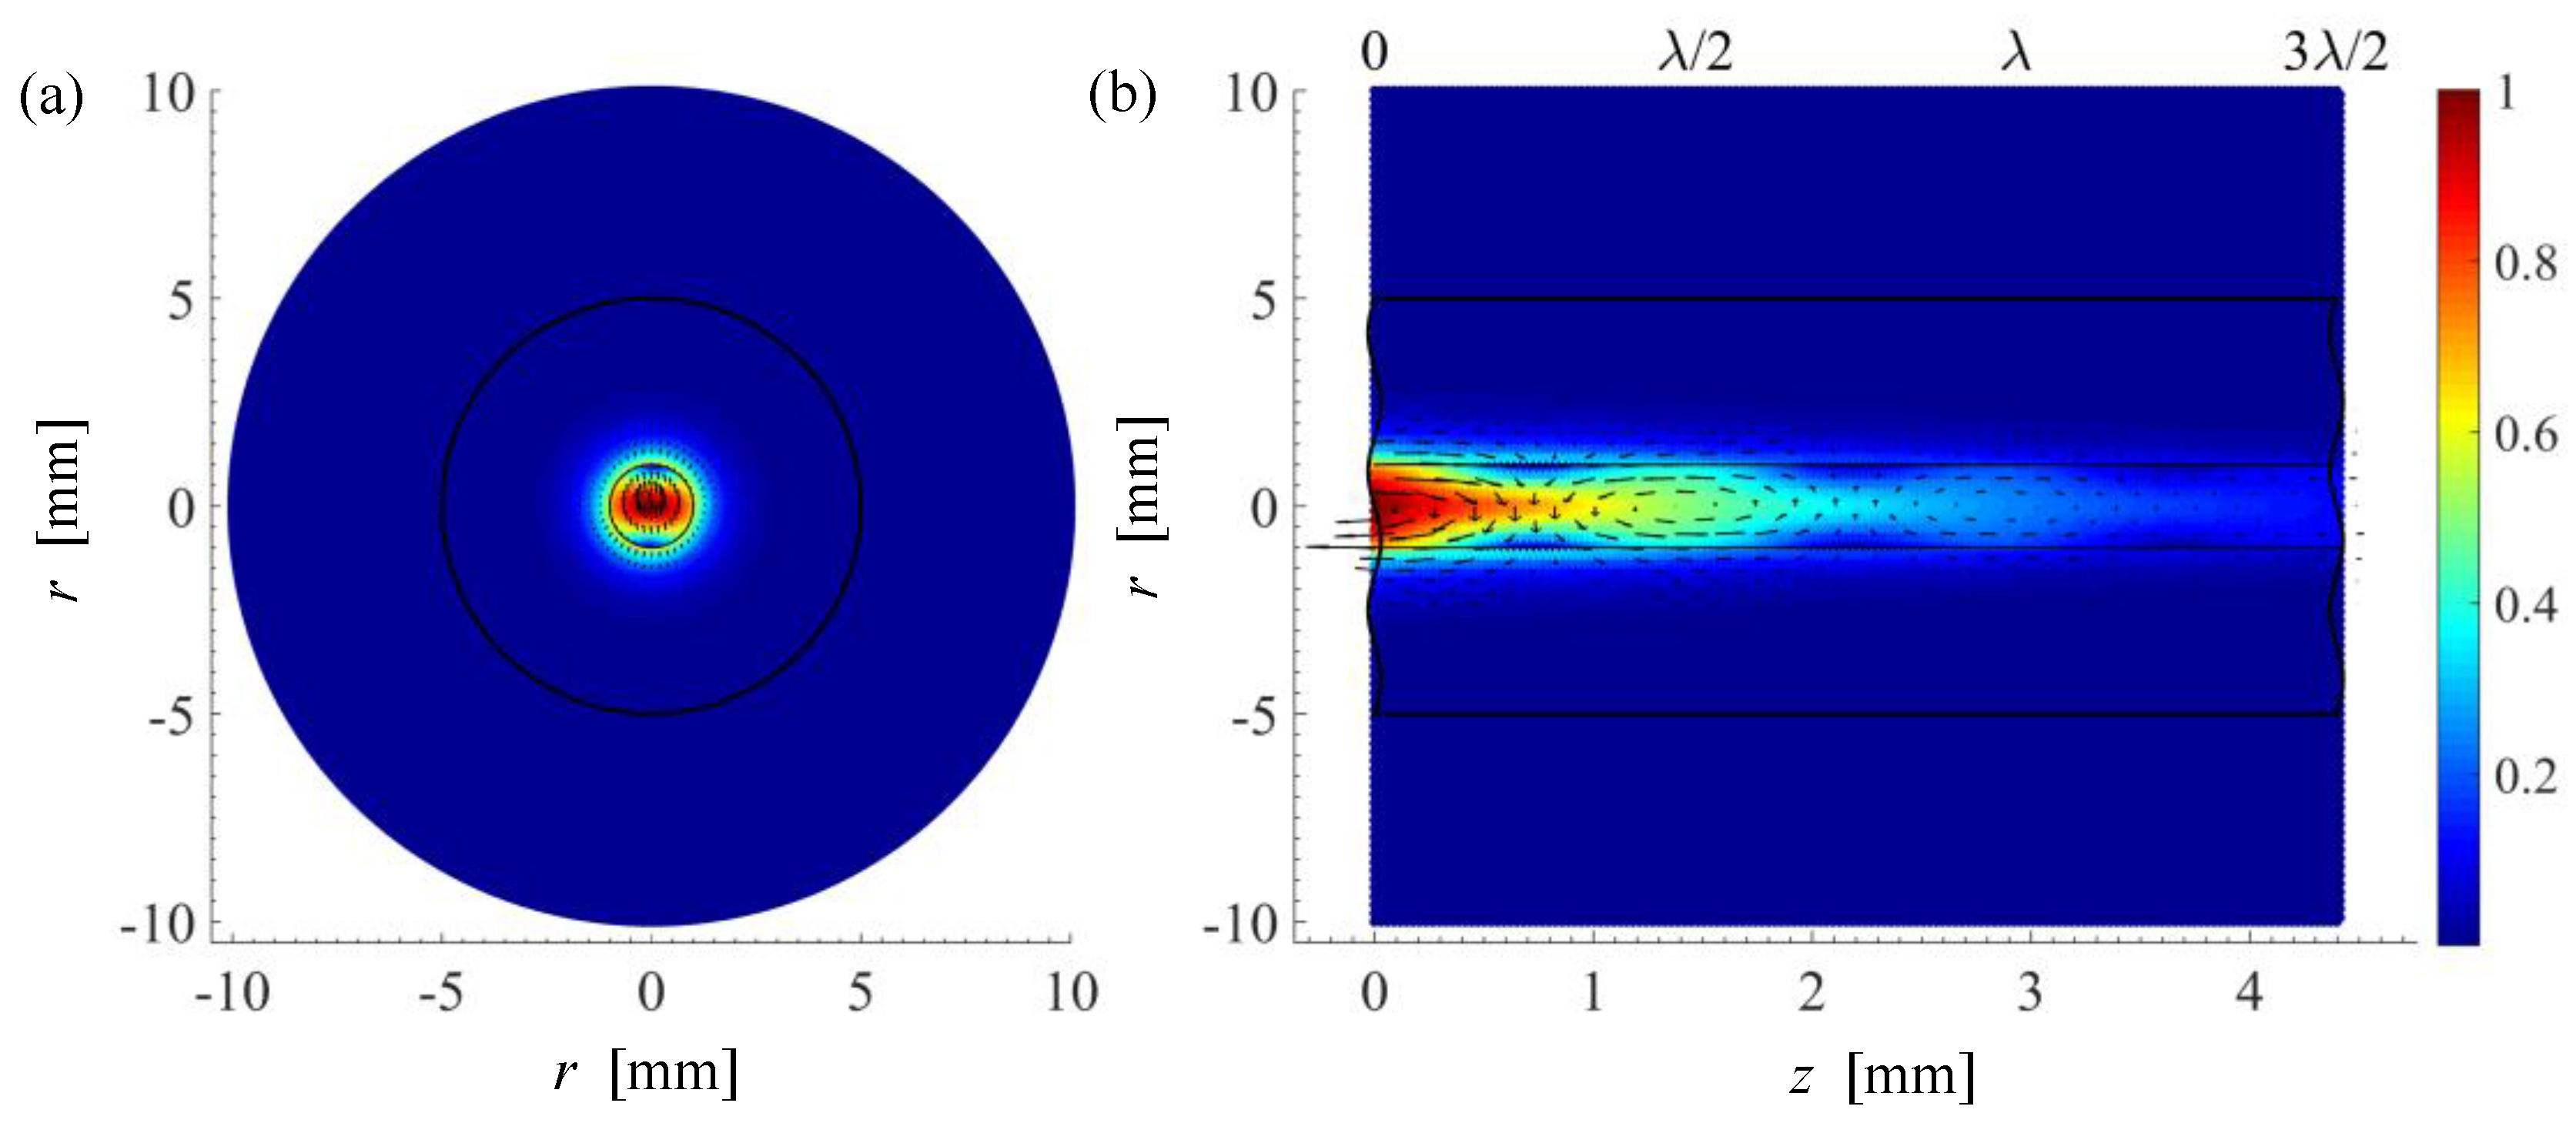
In the waveguide filled with blood cells, the “core” mode can propagate as well, with its power focused in the inner channel (Figure 9). According to the electric field’s structure, this mode also corresponds to the hybrid magnetic HE11 mode. The mode propagates within the inner channel of the waveguide filled with blood cells, as if it were a single-layer waveguide wrapped with a glass layer from the outside. Since blood cells have high absorption of EM modes’ radiation, the strength of the electric field of the mode that propagates in the waveguide diminishes by a factor of four per one wavelength λ (Figure 9b).

4. Conclusions

The present study investigated the structure of an open layered waveguide having the channel filled with liquid blood components. To conduct the study, we applied our algorithm that was based on solving the rigorous solution of Maxwell’s equations by using the partial area method with search of complex-valued roots of the complex dispersion equation of waveguides containing biomaterials. For the glass tube waveguide filled with blood plasma and blood cells, two kinds of modes with highly different structures of their electric fields were discovered. We call them the “tube” and the “core” modes.
The distribution of the electric field in the “tube” mode is similar to the distribution of the electric field in the empty glass tube waveguide. This distribution of the electric field in the “tube” mode is slightly distorted by the blood plasma or blood cells when they alternately fill the glass tube. We have investigated the propagation of the fundamental hybrid magnetic and the first higher hybrid electric “tube” modes. In the waveguide filled with blood plasma, the fundamental mode propagates with very small loss at frequencies above 65 GHz, whereas the first higher mode strongly attenuates in this frequency range. Large absorption of the first higher mode allows the broadband of the waveguide to increase. The dispersion characteristics of the fundamental and higher modes allow us to select the waveguide broad-bandwidth.
For the waveguide filled with blood plasma or blood cells, the electric field of the hybrid magnetic “tube” mode concentrate around the channel and the maxima of their distribution are of specific form.
The electric field of the hybrid magnetic “core” mode is concentrated in the center of the waveguide, i.e., in the channel filled with blood cells. Attenuation for this mode is large. The intensity of the electric field decreases by a factor of four per one wavelength. This type of EM wave can presumably be used to compare the blood of healthy and sick people.
The “core” mode of the glass waveguides could have important applications, because the phase constant increases linearly with frequency. This can be used to control an electronic device located in the channel.
The microwave investigations, which are presented in this paper, can be used in the development of new clinical technique for body liquid (blood component) tests.

Author Contributions

Conceptualization, J.B. and L.N.; methodology, D.P. and L.N.; software, R.P. and J.B.; formal analysis, R.P, A.K., and D.M.; investigation, R.P., D.P., and R.M.; writing—original draft preparation, R.P. and A.K.; writing—review and editing, D.P. and L.N.; visualization, R.P., D.M., and Š.P.; supervision, L.N. and D.P.; and funding acquisition, Š.P.

Funding

This research received no external funding.

Acknowledgments

The authors would like to thank editors and reviewers for many constructive suggestions and comments that helped to improve the quality of the paper.

Conflicts of Interest

The authors declare no conflicts of interest.

References

  1. Lonappan, A.; Thomas, V.; Bindu, G.; Rajasekharan, C.; Mathew, K.T. Disease Detection in Human Blood Using Microwaves. Microw. Opt. Technol. Lett. 2007, 49, 1589–1592. [Google Scholar] [CrossRef]
  2. Gandhi, O.P. Some Basic Properties of Biological Tissues for Potential Biomedical Applications of Millimeter Waves. J. Microw. Power 1983, 18, 295–304. [Google Scholar] [CrossRef] [PubMed]
  3. Wolf, M.; Gulich, R.; Lunkenheimer, P.; Loidl, A. Broadband Dielectric Spectroscopy on Human Blood. Biochim. Biophys. Acta 2011, 1810, 727–740. [Google Scholar] [CrossRef] [PubMed]
  4. Liebe, H.J.; Hufford, G.A.; Manabe, T.A. Model for the Complex Permittivity of Water at Frequencies Below 1 THz. Int. J. Infrared Millim. Waves 1991, 12, 659–675. [Google Scholar] [CrossRef]
  5. Faktorová, D. Complex Permittivity of Biological Materials Measurement at Microwave Frequencies. Meas. Sci. Rev. 2007, 7, 12–15. [Google Scholar]
  6. Roønne, C.; Chem, L.T. Investigation of the Temperature Dependence of Dielectric Relaxation in Liquid Water by THz Reflection Spectroscopy and Molecular Dynamics Simulation. J. Chem. Phys. 1997, 107, 5319. [Google Scholar] [CrossRef]
  7. Costanzo, S. Non-invasive Microwave Sensors for Biomedical Applications: New Design Perspectives. Radioengineering 2017, 26, 406–410. [Google Scholar] [CrossRef]
  8. Gabriel, S.; Lau, R.W.; Gabriel, C. The Dielectric Properties of Biological Tissues: III. Parametric Models for the Dielectric Spectrum of Tissues. Phys. Med. Biol. 1996, 41, 2271–2293. [Google Scholar] [CrossRef] [PubMed]
  9. Peyman, A.; Gabriel, C.; Grant, E.H. Complex Permittivity of Sodium Chloride Solutions at Microwave Frequencies. Bioelectromagnetics 2007, 28, 264–274. [Google Scholar] [CrossRef] [PubMed]
  10. Reid, C.B.; Reese, G.; Gibson, A.P.; Wallace, V.P. Terahertz Time-Domain Spectroscopy of Human Blood. J. Biomed. Health Inform. 2013, 17, 774–778. [Google Scholar] [CrossRef] [PubMed] [Green Version]
  11. Zhadobov, M.; Augustine, R.; Sauleau, R.; Alekseev, S.; Di Paola, A.; Le Quément, C.; Mahamoud, Y.S.; Le Dréan, Y. Complex Permittivity of Representative Biological Solutions in the 2–67 GHz Range. Bioelectromagnetics 2012, 33, 346–355. [Google Scholar] [CrossRef] [PubMed]
  12. Abdalla, S. Gaussian Distribution of Relaxation Through Human Blood. Phys. B 2011, 406, 584–587. [Google Scholar] [CrossRef]
  13. Li, X.; Song, J.; Zhang, J.X.J. Design of Terahertz Metal-Dielectric-Metal Waveguide with Microfluidic Sensing Stub. Opt. Commun. 2016, 361, 130–137. [Google Scholar] [CrossRef]
  14. Nickelson, L.; Asmontas, S.; Gric, T.; Bucinskas, J.; Bubnelis, A. Electrodynamical Analysis of Open Lossy Metamaterial Waveguide and Scattering Structures. Metamaterial 2012, 27–56. [Google Scholar] [CrossRef]
  15. Nickelson, L.; Bubnelis, A.; Navickas, R.; Baskys, A. Electromagnetic Analysis of the Fundamental and Higher Modes on the Onion-like Carbon Tubes. J. Electromagn. Waves Appl. 2016, 30, 1661–1669. [Google Scholar] [CrossRef]
Figure 1. The tube waveguide with a central channel. The tube waveguide consists of: 1—biological substances, 2—external dielectric layer, and 3—air.
Electronics 08 00301 g001
Figure 2. The complex dispersion equation of the tube waveguide with a central channel.
Electronics 08 00301 g002
Figure 3. Normalized propagation constant h′/k (a) and attenuation constant h′′ (b) as functions of frequency for the fundamental and the first higher “tube” modes in an empty waveguide or that filled with blood components; r = 1 mm, R = 5 mm. Calculations using CST MWS for the empty waveguide and the one filled with blood cells are marked by squares and triangles respectively.
Electronics 08 00301 g003
Figure 4. Normalized propagation constant h′/k (a) and attenuation constant h′′ (b) as functions of frequency for the fundamental “core” mode in an empty waveguide or that filled with blood components; r = 1 mm, R = 5 mm.
Electronics 08 00301 g004
Figure 5. Broad-bandwidth as a function of the inner radius r of the glass tube waveguide that is empty or filled with blood components when R = 5 mm.
Electronics 08 00301 g005
Figure 6. Transverse (a) and longitudinal (b) electric field distributions of the fundamental mode in empty glass tube waveguide at frequency of 50 GHz.
Electronics 08 00301 g006
Figure 7. Electric field distributions of the fundamental “tube” mode in the transverse (a) and longitudinal (b) cross-sections of the waveguide filled with blood plasma at a frequency of 50 GHz.
Electronics 08 00301 g007
Figure 8. Electric field distributions of the fundamental “tube” mode in the transverse (a) and longitudinal (b) cross-sections of the waveguide filled with blood cells at a frequency of 50 GHz.
Electronics 08 00301 g008
Figure 9. Electric field distributions of the fundamental “core” mode in the transverse (a) and longitudinal (b) cross-sections of the waveguide filled with blood cells at a frequency of 30 GHz.
Electronics 08 00301 g009

