Cyber-Physical System Framework for Measurement and Analysis of Physical Activities


Multimedia Communications Research Laboratory, School of Electrical Engineering and Computer Science, University of Ottawa, 800 King Edward Ave, Ottawa, ON K1V 6N5, Canada
*
Author to whom correspondence should be addressed.
Electronics 2019, 8(2), 248; https://doi.org/10.3390/electronics8020248
Submission received: 17 January 2019
/
Revised: 16 February 2019
/
Accepted: 20 February 2019
/
Published: 22 February 2019
(This article belongs to the Special Issue Cyber-Physical Systems)
Abstract
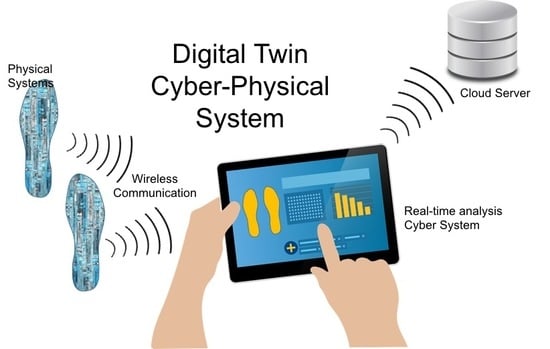
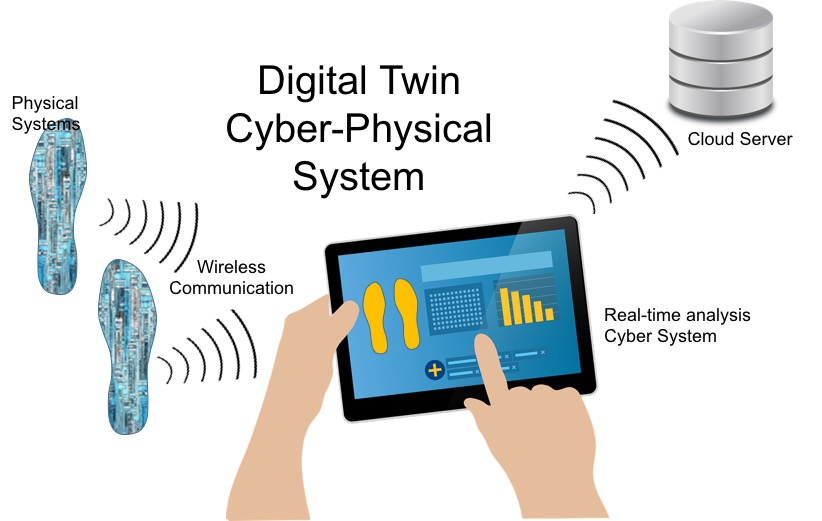
:Several recent studies in Cyber-Physical Systems (CPS) focus on monitoring human movement and capturing data for further processing and analysis. However, there is a lack of studies that address the configurability and modularity of these systems, which is important for designing customized systems with customized devices. We propose a solution to solve this through a modular framework that automatically recognizes and configures new devices and provides real-time data wirelessly. The proposed framework creates a Digital Twin of the physical device and mirrors its attributes and sensory information into the cyber world so they can be used in real-time and post-routine analysis. As a proof of concept, a configurable CPS model for physical activities monitoring is designed and implemented. The designed gait monitoring and analysis system delivers spatiotemporal data from multiple multi-sensory devices to a central data handling and backup cloud server over conventional IEEE802.11 Wi-Fi. An experiment involving a young athlete examined whether or not the CPS components would recognize each other over foreign networks and communicate accurate information.
1. Introduction
Cyber-Physical Systems (CPS) became popular in recent years for the purpose of enhancing overall system performance as opposed to traditional integration of software systems and embedded computing systems or sensor networks. Cyber-Physical Systems are systems engineered to integrate computational components, networking, and physical processes in a well-defined context to serve a specific purpose. A Digital Twin system is a specialized type of CPS where the physical system’s components and attributes are mirrored into the cyber world. A Digital Twin enables real-time monitoring and decision making for various types of applications including medical and wellbeing applications [1,2].
Several studies focus on health and wellbeing applications [3,4,5,6], and a percentage of these studies emphasizes on recording detailed foot kinetics and pressure points using embedded or wearable sensors. The acquired gait information helps in post-routine analysis such as sports-related performance enhancement or medical and rehabilitation diagnostics. A popular area of current related research is working the analysis of such data to provide solutions for fall prediction, detection, and avoidance [7,8] which is especially imperative for people with high risk of serious injuries as a result of falling.
In this work, we introduce a CPS framework for measurement and analysis of physical activities that allows for configurability of system components. The modularity approach in the proposed framework enables seamless integration between physical entities and distributes computation for a smooth operation and communication within the system. We show the design and implementation of the proposed framework as a CPS for a gait activities measurement that runs completely over IEEE802.11 Wi-Fi. An experiment is also introduced to show the ability of the system to provide accurate information and estimations in real-time.
A CPS can be described as an input-output system that contains software and hardware components, collects historical data, and defines clear communication protocols. CPS can be used for a multitude of applications including healthcare and medical [9,10,11], wellbeing, industrial [12], or vehicular [13,14] systems. However, a framework that defines a clear structure to design CPSs is necessary such that it becomes configurable and adaptable to future improvements.
2. Background
Several frameworks have been proposed in recent research to handle Internet of Things (IoT) systems for different purposes and applications. Mukherjee et al. comments on the high number of connected IoT devices, and how they can outnumber the devices connected to the internet very quickly [15]. They propose a connectivity framework so that smart devices can be utilized in IoT data processing. Pirbhulal et al. tackle security of smart home IoT systems by proposing a Triangle Based Security Algorithm (TBSA) that enables energy-efficient data encryption based on an efficient key generation mechanism [16]. Their algorithm can be used with low power Wi-Fi for smart home IoT systems to satisfy security requirements. Several surveys show different proposed frameworks in specific applications such as commercial [17], security [18], and cloud-based [19] IoT systems.
However, several approaches and studies were performed in regards to physical activity monitoring and human gait classification. This includes computer vision [20], body sensor networks (BSN) [21,22], and wearable devices. A great percentage of these studies specifically target gait patterns and gait events detection using wearables and embedded sensors, and some studies focus on digitizing physical activities for sports and athletes [23,24]. A number of studies have used accelerometer sensors for this purpose. Godfrey et al. [25] attached an accelerometer sensor at the lower back of young and older adult subjects for purposes including counting steps and comparing gait characteristics between the two categories. This system was later validated by comparing a Parkinson’s disease patient’s gait and a healthy person’s gait [26]. Mota et al. also used a 3-axis accelerometer in addition to 3-axis gyroscope data to complement each other and send data to a computer over Wi-Fi [27].
Hafidh et al. showcase the SmartInsole©, a gait measurement device that embedded the complete circuit within the insole [28]. The embedded circuitry includes five FSR (Force-Sensitive Resistor) sensors, an accelerometer, a PICAXE microcontroller, a Bluetooth modem, and a 3.3 V cell battery. Test results show clear patterns read by the accelerometer and pressure sensors to identify walking versus biking. Zhuang et al. also designed a shoe insole with an embedded Bluetooth modem and an IMU (Inertial Measurement Unit) with the goal of detecting and counting steps and step to step distance [29]. Their tests show high accuracy when compared to Vicon motion analysis system [30].
Jagos et al. developed the eSHOE which contains a 3-axis accelerometer, and a 3-axis gyroscope, in addition to 4 FSR sensors [31] to measure gait parameters and validated their system with the GAITRite mat, a plantar pressure and gait analysis system. On the other hand, Gerlach et al. developed a plantar pressure measuring system using flexible printed pressure sensors [32]. Their analysis shows the system’s functionality and ability to distinguish between healthy and unhealthy walking patterns using only FSR sensors.
A group of researchers from RMIT University used piezoelectric transducers to measure the impact of kicking a soccer ball [33]. They placed the sensors on the expected impact on the upper surface area of the foot. They also developed an insole with piezoelectric transducers to measure and analyze gait and discussed the need for a low-cost wireless solution for that purpose [34].
Other methods include a fabricated rubber insole developed at Simon Fraser University in Canada [35] which focused on plantar pressure. This insole has embedded pressure sensors in 3 areas of the insole: forefoot, midfoot, and hindfoot. Their studies demonstrate how different postures present different responses from these three pressure areas. Crea et al. also designed an insole that embeds a grid of 64 pressure sensing elements that use Light Emitting Diodes (LED) and light sensor pairs to measure pressure distribution and center of pressure [36]. The insole used in [37] uses 13 capacitive pressure sensors with a 3D accelerometer, while [38] created a more sophisticated body sensor network with 2 IMUs, an accelerometer, and ultrasonic sensors.
Different systems are there to assist in gait measurement and analysis applications. Some lack accurate measurements and can only provide a general idea of the wellbeing of the user’s gait. Other systems use wired devices used to record sensory data, which introduces drawbacks such as limiting the exercise/therapy area, or requiring bulky and expensive setups. Wireless devices record data using Bluetooth or ZigBee, which although consume very low power compared to Wi-Fi, have low range capabilities and, thus, limit the area of the user’s free movement. In addition, these technologies limit the number of connections a system can read from since Bluetooth and ZigBee are typically one-to-one connections. However, attempts have been made to time-share multiple Bluetooth connections while compromising stream bandwidth [39]. The contribution of this proposed framework is that it combines the strengths of the aforementioned studies. It has the ability to read sensory information wirelessly, monitor numerous devices simultaneously, provides information and feedback in real-time, and stores historical data in a cloud server for future analysis. Similarly, the proposed system in this research combines and provides all the feedback features in the surveyed literature.
3. A CPS Framework for Physical Activity Monitoring
The proposed cyber-physical system is an abstract model for monitoring physical activities. It provides modularity and enables configurability of system components. Having separate modules in the framework allows system designers to perform upgrades on specific modules without affecting the overall system as long as inputs and outputs follow the same format. In addition, this framework enables configurability, in theory, by its adaptability to read from an unrestricted number of physical devices. This is especially beneficial for applications that are not bound by a specific number of simultaneous users.
There are three main components in the proposed framework (Figure 1). The first component is the physical system, which is mainly a sensor network or a multi-sensory device that reads data from the environment through physical sensors and convert sensory information into digital signals to be processed by a computer. The physical system can be any type of sensor network that produces valuable data and require action and/or outputs within the CPS. The second component is the Cyber System, and it is where most of the processing happens. The Cyber System is a modular software on a cloud server, and is responsible for controlling sensory and UI inputs, handling data flow, and preparing outputs. The Cyber System is also responsible for defining the set of guidelines to communicate with the data storage server through a Database Management System (DBMS). The third and final component of this CPS framework is the communication protocol. The communication protocol sets guidelines for transmitting and receiving instructions and data between the Cyber and the Physical systems. The proposed framework allows for several physical systems to be connected to one cyber system. Therefore, the communication protocol also facilitates physical system configurations and continuous, uninterrupted data transmission for real-time applications. Further details on the main CPS components are described next.
3.1. Physical System—A Sensor Network as a Single Measurement Device
The physical system represents an independent sensor network, which can be a Wireless Sensor Network (WSN), Body Sensor Network (BSN), or a Personal Area Network (PAN), etc. and it is composed of at least one sensor and one microcontroller with communication capabilities. Most microcontrollers typically offer some mean of physical communication through which the user can program and interact with the attached sensors. Many microcontrollers provide a serial interface for that purpose.
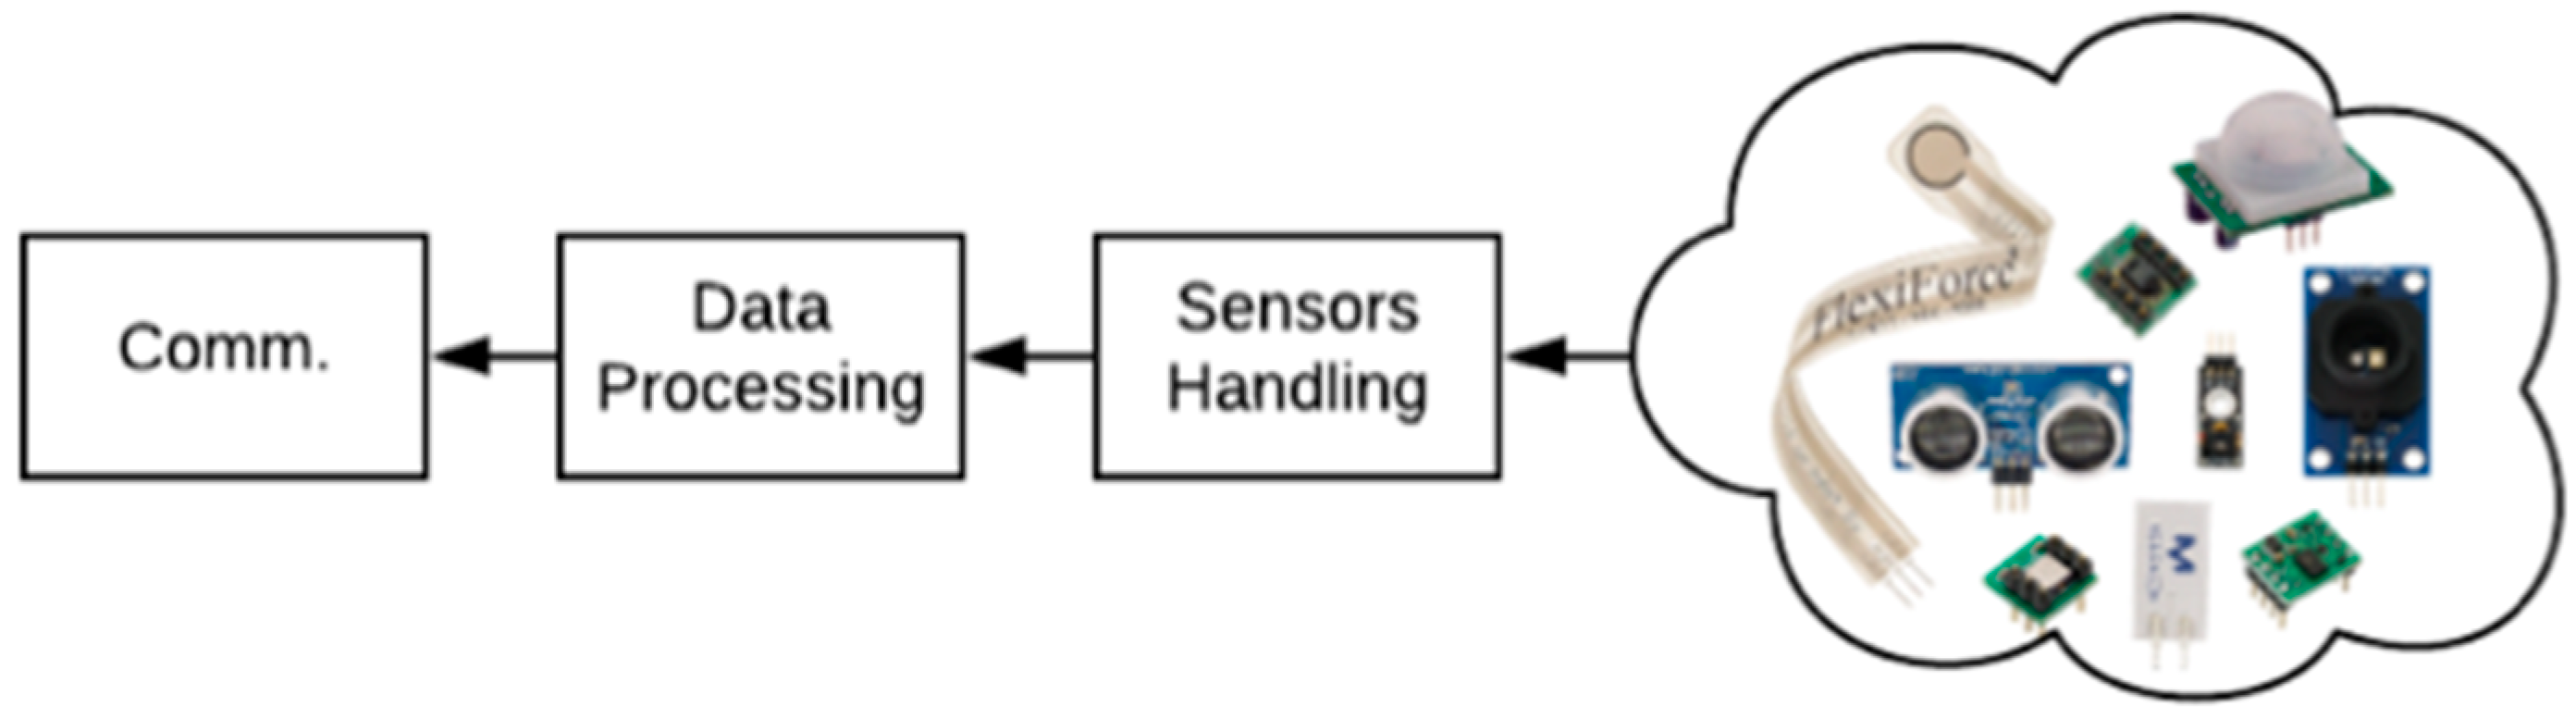
A crucial advantage of this framework is its ability to accept and handle new devices automatically. In order to prepare the physical system for seamless integration to the system, three modules should be part of its main microcontroller: (a) Sensors Handling module, which is in-charge of direct communication with the attached sensors (b) Data Processing module, which converts sensory information into measurable and comprehensive data, and prepares it for transmission via encoding and compression. (c) Physical System Communication module, which takes care of transmitting the processed, compressed, and encoded data to the Cyber System using the communication protocol (see Figure 2).
3.1.1. Sensors Handling Module
Most common sensors produce analog voltages to represent the sensed environment. Analog sensors translate the sensed environment into a voltage range between zero and the maximum applied voltage to that sensor (typically 3.3 V or 5 V). An Analog to Digital Converter (ADC) is used to convert this voltage into a digital signal that can be recognized and processed by the processor, and it can operate at the sensor-level or at the microcontroller-level (ADC input).
In our context of a BSN for physical activity monitoring, each Physical System in the CPS contains a number of physical sensors that collect physiological and/or biological data from the user. These sensors can be of various types, sizes, and communication protocols. The sensors handling module is responsible for communicating and collecting this sensory information from all sensors, and converting them into digital data ready for processing.
3.1.2. Data Processing Module
Reading sensory information and converting them into digital values for storing and processing can take more storage space than required. Memory waste results in more processing power waste, which leads to communication delays that can accumulate and become troublesome, especially in systems with hundreds, or thousands of sensors. Therefore, compression and encoding techniques of sensory data are necessary in large-scale CPSs since handling these delays at an early stage results in a smoother and a more adaptable system performance. Many studies have discussed various techniques for compressing, encoding, and encrypting sensor networks data to enable reliable transmission of sensory information [40,41,42]. The data processing module in the physical system is in charge of compressing, encrypting, and packaging sensory information. These packets are then capsulated and handed over to the PSC module described next.
3.1.3. Physical System Communication (PSC) Module
The PSC module works with the Cyber System’s communication (CSC) module to establish a secure connection, and to transmit encoded data produced by the data processing module. In order for this communication to be handled smoothly, a communication protocol must be defined where the sender and receiver can understand each other [43]. The communication scenario and composition of the overall system is explained in Section 3.3.
3.2. Cyber System
The Cyber System acts as a master in a master-slave architecture that controls all physical systems in the CPS (i.e., the slaves). It handles several data streams coming from each physical system and is responsible for decompressing, decrypting, visualizing, and storing sensory data from all these sensor networks. The Cyber System is composed of five main modules: Communication module, Data Processing module, Physical System Profiler, Visualization Module, and the Database Management System (DBMS). Each of these modules is described below.
3.2.1. Cyber System Communication (CSC) Module
The CSC follows the networking protocol and uses it to communicate with its peer in physical system (PSC). Depending on the type of communication used within the CPS (i.e., Wi-Fi, Bluetooth, Serial), the communication protocol is defined and used by the CSC and the PSC to set-up connections and to transmit and receive data between the system nodes. The CSC module is also designed to identify and assign a unique identifier to the source physical system. Accordingly, each physical system is identified, and the received data can be properly processed in the application.
3.2.2. Data Processing Module
The data processing module in the Cyber System includes two parts: the decoder and the computation units. The decoder unwraps data packets received from the physical system, by decrypting and decompressing sensory information. It then forwards data to the Physical Systems Profiler (Section 3.2.3) which forwards a copy to the DBMS and keeps a temporary copy for real-time outputs. In order to provide real-time data, the computation unit performs calculations required by the CPS right after unwrapping. This helps produce values and perform decision-making faster for real-time applications.
In our context of monitoring users’ physical activities, the data processing module performs several gait spatiotemporal calculations. Some examples of real-time parameter calculations include the following:
- Shoe/foot side detection: The circuit and sensor placement for the designed hardware (SmartInsole) is identical for all sizes (i.e., the same circuit can be used for the right foot and the left foot). However, the data processing module in the Cyber System is able to identify which foot it is getting data from by performing simple verification using the accelerometers’ Z-axis data where negative and positive values at startup indicate which foot this SmartInsole is used on.
- Number of steps: Estimating the number of steps is performed by each foot individually, and adding the right and left foot’s steps result on the overall steps performed by the user. This information is calculated by many fitness trackers and smartphone apps, such as FitBit, using intelligent algorithms and embedded accelerometers. However, step count using the SmartInsole is difficult to cheat since a step is only counted if the user performs an actual step on the insole. In our system, the average pressure is measured and continuously updated to control a threshold. A step is detected each time the real-time average pressure exceeds the dynamic threshold. The threshold value is updated continuously throughout the user activity to account for the user’s changing pace. The step count for each insole is calculated as follows:where S(x) is the number of steps for insole x, A(x) is the real-time average FSR values for insole x, and α is the dynamic threshold.
- Cadence: Cadence is defined as the number of steps performed per minute. It is an important statistic in gait analysis for healthcare and for sports analysis. By extracting the timestamps for heel-strike (HS) and toe-off (TO), we can accurately calculate the number of steps and the duration between each step. Using this information, we calculate cadence as the number of steps occurring per minute.
Several other spatiotemporal characteristics calculations are performed in the data processing module. A detailed results analysis and comparison can be found in a previous work [44].
3.2.3. Physical Systems Profiler
The physical systems profiler is a static memory module that keeps track of the physical systems attached to the CPS, and keeps a record of detailed specifications of each of these physical systems so it can be accessed by other modules in the CPS. Each physical system transmits a physical system profile (PSP) during the configuration stage. A PSP represents a digital twin of that physical system [2] and includes descriptive information about it including details about the microcontroller, its connection details, network status, number of sensors, types of sensors, and any other sensor descriptive information as shown in the example in Figure 3. In addition, each PSP is paired with a dedicated dynamic memory space used to maintain the current state of the attached sensors in that physical system. This physical system data holder (PSDH) acts as a buffer that is tied with the physical system, and is used for live data requirements such as real-time visualization.
3.2.4. Visualization Module
The visualization module is in charge of visualizing sensor data from physical systems. Using the details in the PSP, the visualization module automatically recognizes what types of sensors need to be visualized, and uses pre-coded physical system visualization presets (PSVP) to provide meaningful visuals to the user. Using the real-time sensory data stored in each PSDH and the PSVPs stored in the visualization module, the system is able to visualize the physical system information in real-time.
Visualization of plantar pressure has many important applications in the field of health and well-being, as it can help detect the imbalances and other impairments when monitored properly. In the field of sports, it can help improve athletes’ performance, since it allows coaches and physiologists study athletes’ postures post-game by visualizing and analyzing the pressure heat maps of players with possible gait imbalances or incorrect postures which can lower the athlete’s performance and increase the risk of injury.
One way to visualize pressure data is using a heat map, as it allows conveying massive amounts of data in a few images that carry a lot of meaning and allows instantaneous problem identification. We designed and implemented a visualization tool that builds a plantar pressure heat map from the data collected by the CPS. Our visualization tool reads pressure data from 12 sensors for each foot, and maps this data into visual pressure areas on the foot-shaped heat maps. The heat maps show the pressure using colors of increasing intensity based on the pressure values. Every sensory area of the insole has a corresponding pressure area in the heat map, along with a surrounding interpolation for a more smooth, realistic and gradual transition of the pressure visualization.
3.2.5. DBMS
Storing historical data is necessary for retrieving important information and for enabling the sensory data to be modeled and analyzed to facilitate CPS operation. The DBMS is designed to take care of physical systems’ data after being processed by the data processing module until being stored in the configured storage server. Each received set of sensory values is prepared for storage, and timestamped using the Cyber Systems’ system clock to ensure that all received data are synchronized using one common clock. The DBMS is also responsible for storing database connection information, and maintaining a stable connection to the database during the data storage process.
3.3. Communication and Composition of CPS Components
The relationship between the Cyber System and the Physical System in the proposed framework is a one-to-many relationship, where one Cyber System can communicate with many Physical Systems, while each Physical System can only communicate with one Cyber System.
The proposed framework operates in a mechanism that can be represented in a stacked layers diagram (Figure 4). Sensors in each Physical System collect sensory information, and each Physical System is responsible for its own data collection from these sensors via the sensors handling layer. The acquired sensory data is handed over to the encoding layer where it can be wrapped and compressed to be ready for communication. After that, the communication layer prepares the packets by adding headers to the payload. Each header contains a unique identifier that enables the transmitted packet to be traced back to its source Physical System.
The communication layer in the Cyber System in Figure 4 (which is represented by the CSC module) receives the encoded packet from a Physical System and forwards it to the decoding layer where it can be unwrapped to separate the unique identifier and the payload segments. The Physical System Profiler can then use the unique identifier to recognize the source system and its PSP. After that, it uses this information to assign each sensor value in the payload to its allocated value in the software. The computation layer can then use the software variables to calculate any parameters required by the application by referring to these sensor values. All of this prepared data can then be stored in a buffer for real-time visualization and output, and for preparation for cloud storage.
4. Evaluation Case Study
The objective of this work is to design and implement a complete CPS that aims at addressing the aforementioned drawbacks. The proposed CPS uses conventional Wi-Fi networks to setup, monitor, and record detailed and real-time sensory data for multiple wearable insoles (SmartInsole© [44]) simultaneously. Using Wi-Fi allows us to record sensory data in a relatively large space such as a soccer or a hockey field. The proposed framework also enables seamless adaptability to different types of wearable devices and body sensor networks, configurable visualization, and data storage methods. As the physical part of the CPS, we used gait measurement smart insoles as we first introduced in [45] and validated in [44]. The developed insoles include FSR-402 [46] sensors as well as an IMU breakout board [47], and the circuitries are printed on flexible PCBs (Printed Circuit Boards) for improved durability.
The proof of concept of the proposed framework is an implementation of the proposed CPS for athletic gait measurement and analysis. The implemented CPS contains different components including (A) physical devices represented by smart insoles with different embedded sensors, (B) a sophisticated software, referred to as the Data Handler, which is in-charge of controlling, managing, handling, and storing incoming sensory data, and (C) networking controllers responsible for data traffic between the system’s nodes. These components work together to achieve the task of measuring, visualizing, and storing gait parameters for multiple users. A validation study was performed with 15 subjects to test and validate these features [44].
Each physical device is a gait measurement system by itself that can provide raw data through serial communication. However, the Data Handler was designed and tested to handle data streams in real-time and provide, store, and visualize detailed sensory data from all devices on the Wi-Fi network simultaneously on a single computing device.
The proposed solution adds configurability to the literature by enabling the system to wirelessly configure and monitor new physical systems. In addition, this work shows potential for applications involving multiple users that need their gait to be assessed in a concurrent manner, such as coaching sports teams or group physiotherapy.
4.1. Design
One important aspect that needs attention when designing smart insoles is the different shoe sizes of different subjects. We measured the feet of a number of people in three groups: females of US size 6–7, males of US size 7–8, and males of US size 9–10. Using these measurements, we designed a 2-layer PCB and manufactured them on flexible boards (Figure 5). FSR-402 (short tail) sensors [46] are then connected to a multiplexer that forwards pressure data to an ESP8266 microcontroller with Wi-Fi capabilities. Details on the design and implementation of the physical system, including circuitry and used electronics, can be found in References [45,48].
4.2. Implementation
Howell [49] conducted an experiment to conclude an efficient number of FSR sensors in a shoe insole. Therefore, in order to collect detailed gait information, 12 FSR sensors were carefully placed on the insole in areas where pressure force could be detected. FSR sensors have been reliably used in several studies to measure gait pressure [28,31,50,51,52]. Multiple studies suggested that the force pressure on the medial midfoot (arch) is minimal/negligible [31,49,53], and thus are not measured in our design. The twelve FSR sensors are distributed such that they cover the remaining areas of the foot. An IMU is also placed in the insole’s medial midfoot area to utilize the space with minimal pressure, and to enable capturing of foot kinetics and orientation data. The IMU sensor is capable of capturing real time 3D acceleration, 3D rotation (via gyroscope data), and 3D orientation (via magnetometer data). For this purpose, we used high precision MPU-9250 (InvenSense, San Jose, CA, USA), which is a 9-axis IMU. This IMU is capable of sampling at a frequency of 50Hz and consumes 3.7mA of power.
The aim of our measurements is qualitative and not quantitative. Therefore, high quality FSR sensors were used, which can measure force between 0–100 Newton. ADC outputs from FSR sensors were mapped to values between 0–100 representing the applied force pressure. Florez et al. explains the linear relationship between the real applied force and the calculated force for FSR sensors [54]. The Y-axis in Figure 6 (left) represents this applied force on FSR sensors.
All FSR sensors and the IMU are embedded in the insole, which will be placed inside the user’s shoe to read gait measurements. However, we decided to place the Wi-Fi enabled microcontroller and the rechargeable battery in a separate package outside the shoe (i.e., strapped to the ankle) to reduce the risk of battery overheat or Wi-Fi signal interference.
Figure 5 shows the designed PCB layout of the insole and the actual implementation of the device. This single device provides information that can be used for calculating the different modes of gait, temporal characteristics, center of mass, orientation, and force distribution.
After setting up the insole’s connection to the system, the software allows us to monitor sensor readings from all insoles using a single computer by visualizing sensory data. This is useful for monitoring both feet of a person simultaneously, or for monitoring multiple people’s gait on a single computer.
We used the dynamic NoSQL database MongoDB for collecting sensory information from the insoles, and used this data to analyze different phases of gait and for the preparation of heat maps. MongoDB’s structure allows for dynamic insertion of sensory data into a single table, and avoiding complications by having a separate table for each insole.
4.3. Experiment
In a previous study that included 15 subjects, we validated the designed CPS by comparing its results with the Tekscan Strideway system [55], which is being used by healthcare providers to measure spatiotemporal characteristics [44]. However, in this controlled experiment, we were looking at the ability to detect different gait phases. A young athlete participated in this experiment where one insole was placed inside each shoe, and the subject was asked to perform a total of seven (7) tests. Foot pressure data was recorded for post-routine analysis. The goal of this experiment was to find distinguishable patterns from the collected sensory data, which can be used to identify the different gait phases.
The subject was asked to perform the following tests, which were recorded by a video camera to be used as ground truth. Each of the below tests was repeated three times to verify accuracy:
- 30-m forward walk.
- 30-m backward walk.
- 30-m forward jog.
- 30-m backward jog.
- 50-m sprint.
- 30-s jumping.
- Kicking a soccer ball.
4.4. Results
Some of the studies discussed in the background (Section 2) were able to detect step-to-step duration amongst other spatiotemporal characteristics, which we also achieved here. However, the distribution of sensors in the SmartInsoles used in this work’s implementation enabled us to get more details on the direction the user gait. In addition, designing a system that runs completely over Wi-Fi provided a more comfortable and natural environment to test user’s gait. The performed tests were conducted outdoors without the restrictions of a lab setting or a treadmill, and the subject user was able to move up to 50 m away from the system’s main router during this experiment.
The graphs in Figure 6 (left) show a 5-s sample of the data collected from tests 1–6 mentioned earlier. Each test’s graph is presented in a row, and it combines data from the left (L_) and right (R_) insoles for all 12 FSR sensors (FSR00 to FSR11). Sensor values are shown as vertical bars, while the average of the left and right insoles’ FSR values is plotted as solid blue and orange lines, respectively.
Results show distinguishable patterns amongst different gait phases as can be seen from Figure 6 (left). The graph patterns for walking forward and walking backward show patterns that can be easily distinguished from each other. For walking forward, the peak average force appears to be at the end of the step in the graph. However, a person walking backward normally steps on the front of the foot before the heel, and the graph shows a peak at the beginning of the step. The reason for this is that there are more FSR sensors in the front of the insole than at the heel, which normally increases the average force read by the sensors. Furthermore, for jogging, direction cannot be easily distinguished from the patterns using the average applied force, but an increase in the number of steps performed can be seen in a similar duration. Accordingly, we can identify jogging, and sprinting, patterns from the third, fourth, and fifth graphs. The last graph demonstrates a clear jumping pattern by showing that the average pressure forces imposed by both feet are increasing and decreasing at an approximately parallel pattern.
The visualization of the foot pressure data is a key aspect in analyzing the sensory data collected during performed activities, and has many applications in healthcare and wellbeing. One of the best ways to visualize foot pressure is by using a heat map, as it allows us to see how the pressure is distributed over the foot and where the most pressure is applied depending on the activity performed by the individual.
For this purpose, we developed an application that generates a heat map from the data collected during the experiments. In this application, each of the twelve sensors on the insole is mapped to a corresponding area on the heat map, where a circle holds the same placement and diameter of the sensor. Furthermore, the sensory data is mapped to different colors representing increasing intensities, where the green represents the lowest intensity followed by the yellow and then orange, and the red represents the highest intensity. In the heat map areas where the intensity is high, we show the gradual decreasing of intensity around these areas by surrounding them with circles of decreasing color intensity. This makes the heat map more accurate than just transitioning directly from high intensity (for example the red color) to low or no intensity (shown by the green color).
Figure 6 (right) shows the differences in how the pressure is distributed over the foot insole depending on the performed activity. During normal walking in both forward and backward directions, more pressure is applied on the heel compared to other activities. For stationary jumping, for example, very little pressure can be seen on the heels. Figure 6f shows that during sprinting, more pressure is applied to the forefoot. Results generally show that the activity performed can potentially be inferred from the heat map visualization of the average foot pressure.
In addition to identifying the performed activity, the heat map visualization also gives a good idea about the posture of the user. In the experiment results shown in Figure 6, a preliminary analysis could be performed by examining Figure 6a for example. Sensor number 8, which is at the middle of the foot on the outer edge, shows a higher-pressure intensity for the right foot (red color) than for the left foot (yellow color). This means that the participant applies more pressure on the middle outer side of his right foot than the left foot, even though this is a walking activity and one would expect a similar amount of pressure on both feet. Figure 6b–d,f shows the same pattern for backward walking as well as jogging and sprinting. However, Figure 6e, which is related to jumping, does not show differences in pressure between both feet, since the participant relies mostly on the forefoot for this activity, and the middle of the foot bares very little pressure. Some recommendations can be suggested to help this participant adjust their posture, which is the subject of a working project in our laboratory.
Event Detection—Kicking a Soccer Ball:
A number of studies have used the IMU sensor to collect detailed information related to step detection [25,29] or to measure foot orientation [56], which is calculated in our experiments. Weizman et al. have conducted an analysis on force applied to kicking a soccer ball [33]. However, we tested the use of the embedded IMU in detecting the exact instant the user the soccer ball is kicked. By analyzing the synchronized data produced by the embedded sensors in the insole, we were able to detect the instant the ball was kicked, as well as the foot that was used to kick it. This was achieved by finding a period of strong noise in IMU readings as can be seen in Figure 7, which shows a 1.5-s sample of FSR and IMU data for both feet of a single soccer player. The graphs show a clear disturbance in the right foot’s IMU readings, which when compared with the ground truth video, identifies the exact instant the ball is kicked.
5. Conclusions
In this work, we propose a CPS framework for measurement and analysis of physical activities and wearable sensor networks. We show the design and implementation of the CPS framework that enables real-time visualization of sensory data from multiple devices simultaneously. As a proof of concept, a gait parameters measurement and analysis system was implemented that runs completely over a Wi-Fi network. Multiple tests were performed on the implemented system, and results show that different gait phases produce different sensory patterns. From these results, we can easily distinguish between gait phases and detect events by analyzing the stored FSR and IMU data. The implemented system results show its ability to wirelessly measure physical activities shows potential for gait analysis applications, physiotherapy, sports, fall prediction and prevention, and many others.
The design and deployment of mobile systems should take into consideration the network structures and protocols, access points, communication and presentation standards, privacy, security, and encryption, etc. Operating systems embedded in these end devices are also considered for encoding and presentation of data. Mobile systems must consider the fact that sensitive information can be accessed, and possibly modified, from anywhere in the world. Therefore, secure data communication, presentation, and modification should be taken into account in the design of any CPS [57] as such systems can carry sensitive and private information within its network. Kocabas et al. [58] state that healthcare monitoring is growing rapidly, and recording physiological signals from users can be done for several purposes. More devices are being developed every year and many solutions are being employed for communicating, presenting, and storing this private information. Thus, these solutions must take into account encryption schemes to protect and secure private information. Kocabas mentions that conventional encryption schemes, such as Advanced Encryption Standard (AES) and Elliptic Curve Cryptography (ECC), are widely used in medical systems due to their low resource requirements, which makes them suitable for distributed processing.
For future work, the group is currently performing experimentation using machine learning algorithms to automate the analysis process. The goal is to enable auto-classification of gait phases which can enhance research in fall detection, prediction, and prevention. In addition, based on the requirements of the presented application in this study, the communication aspect is largely one-directional. However, future implementations of a balanced, two-directional, communication is taken into consideration where physical systems can provide feedback to the user. The amount of the transferred data from the cyber system to the configured physical systems can vary depending on the type of feedback such as audial, visual, or haptic feedback.
Author Contributions
Conceptualization, F.A. and A.E.S.; methodology, F.A. and A.E.S.; software, F.A. and F.L.; validation, F.A., F.L. and A.E.S.; formal analysis, F.A., F.L. and A.E.S.; writing—original draft preparation, F.A.; writing—review and editing, F.L. and A.E.S.; supervision, A.E.S.
Funding
This research received no external funding.
Conflicts of Interest
The authors declare no conflict of interest.
References
- El Saddik, A. Digital Twins: The Convergence of Multimedia Technologies. IEEE Multimed. 2018, 25, 87–92. [Google Scholar] [CrossRef]
- Alam, K.M.; El Saddik, A. C2PS: A Digital Twin Architecture Reference Model for the Cloud-Based Cyber-Physical Systems. IEEE Access 2017, 5, 2050–2062. [Google Scholar] [CrossRef]
- Soegijoko, S. A brief review on existing cyber-physical systems for healthcare applications and their prospective national developments. In Proceedings of the 2013 3rd International Conference on Instrumentation, Communications, Information Technology and Biomedical Engineering (ICICI-BME), Bandung, Indonesia, 7–8 November 2013; p. 2. [Google Scholar]
- Avrunin, G.S.; Clarke, L.A.; Osterweil, L.J.; Goldman, J.M.; Rausch, T. Smart checklists for human-intensive medical systems. In Proceedings of the IEEE/IFIP International Conference on Dependable Systems and Networks Workshops (DSN 2012), Boston, MA, USA, 25–28 June 2012. [Google Scholar] [CrossRef]
- Haque, S.A.; Aziz, S.M. False Alarm Detection in Cyber-physical Systems for Healthcare Applications. AASRI Procedia 2013, 5, 54–61. [Google Scholar] [CrossRef]
- Lee, I.; Sokolsky, O.; Chen, S.; Hatcliff, J.; Jee, E.; Kim, B.; King, A.; Mullen-Fortino, M.; Park, S.; Roederer, A.; et al. Challenges and Research Directions in Medical Cyber-Physical Systems. Proc. IEEE 2012, 100, 75–90. [Google Scholar] [CrossRef]
- Postolache, O.A.; Postolache, G.B. Development and selection of balance sensing devices. IEEE Instrum. Meas. Mag. 2017, 20, 38–48. [Google Scholar] [CrossRef]
- De Venuto, D.; Annese, V.F.; Ruta, M.; Di Sciascio, E.; Sangiovanni Vincentelli, A.L. Designing a Cyber-Physical System for Fall Prevention by Cortico–Muscular Coupling Detection. IEEE Des. Test 2016, 33, 66–76. [Google Scholar] [CrossRef]
- Zhang, Y.; Qiu, M.; Tsai, C.; Hassan, M.M.; Alamri, A. Health-CPS: Healthcare Cyber-Physical System Assisted by Cloud and Big Data. IEEE Syst. J. 2017, 11, 88–95. [Google Scholar] [CrossRef]
- Alamri, A.; Cha, J.; El Saddik, A. AR-REHAB: An Augmented Reality Framework for Poststroke-Patient Rehabilitation. IEEE Trans. Instrum. Meas. 2010, 59, 2554–2563. [Google Scholar] [CrossRef]
- Grispos, G.; Glisson, W.B.; Choo, K.-K.R. Medical Cyber-Physical Systems Development: A Forensics-Driven Approach. In Proceedings of the 2017 IEEE/ACM International Conference on Connected Health: Applications, Systems and Engineering Technologies (CHASE), Philadelphia, PA, USA, 17–19 July 2017; pp. 108–113. [Google Scholar] [CrossRef]
- Leitão, P.; Colombo, A.W.; Karnouskos, S. Industrial automation based on cyber-physical systems technologies: Prototype implementations and challenges. Comput. Ind. 2016, 81, 11–25. [Google Scholar] [CrossRef] [Green Version]
- Abid, H.; Phuong, L.T.T.; Wang, J.; Lee, S.; Qaisar, S. V-Cloud: Vehicular Cyber-Physical Systems and Cloud Computing. In Proceedings of the 4th International Symposium on Applied Sciences in Biomedical and Communication Technologies, Barcelona, Spain, 26–29 October 2011. [Google Scholar] [CrossRef]
- Xiang, X.; Lv, N.; Zhai, M.; El Saddik, A. Real-Time Parking Occupancy Detection for Gas Stations Based on Haar-AdaBoosting and CNN. IEEE Sens. J. 2017, 17, 6360–6367. [Google Scholar] [CrossRef]
- Mukherjee, A.; Paul, H.S.; Dey, S.; Banerjee, A. ANGELS for distributed analytics in IoT. In Proceedings of the 2014 IEEE World Forum on Internet of Things (WF-IoT), Seoul, Korea, 6–8 March 2014; pp. 565–570. [Google Scholar]
- Pirbhulal, S.; Zhang, H.; E Alahi, M.; Ghayvat, H.; Mukhopadhyay, S.; Zhang, Y.-T.; Wu, W. A Novel Secure IoT-Based Smart Home Automation System Using a Wireless Sensor Network. Sensors 2016, 17, 69. [Google Scholar] [CrossRef] [PubMed]
- Derhamy, H.; Eliasson, J.; Delsing, J.; Priller, P. A survey of commercial frameworks for the Internet of Things. In Proceedings of the IEEE 20th Conference on Emerging Technologies & Factory Automation (ETFA), Luxembourg, 8–11 September 2015; pp. 1–8. [Google Scholar]
- Ammar, M.; Russello, G.; Crispo, B. Internet of Things: A survey on the security of IoT frameworks. J. Inf. Secur. Appl. 2018, 38, 8–27. [Google Scholar] [CrossRef]
- Li, F.; Vogler, M.; Claessens, M.; Dustdar, S. Towards Automated IoT Application Deployment by a Cloud-Based Approach. In Proceedings of the IEEE 6th International Conference on Service-Oriented Computing and Applications, Koloa, HI, USA, 16–18 January 2014; pp. 61–68. [Google Scholar]
- Yang, B.; Dong, H.; El Saddik, A. Development of a Self-Calibrated Motion Capture System by Nonlinear Trilateration of Multiple Kinects v2. IEEE Sens. J. 2017, 17, 2481–2491. [Google Scholar] [CrossRef]
- Panahandeh, G.; Mohammadiha, N.; Leijon, A.; Handel, P. Continuous Hidden Markov Model for Pedestrian Activity Classification and Gait Analysis. IEEE Trans. Instrum. Meas. 2013, 62, 1073–1083. [Google Scholar] [CrossRef] [Green Version]
- Rahman, M.A.; El Saddik, A.; Gueaieb, W. Building Dynamic Social Network From Sensory Data Feed. IEEE Trans. Instrum. Meas. 2010, 59, 1327–1341. [Google Scholar] [CrossRef]
- Lee, H.; Sullivan, S.J.; Schneiders, A.G. The use of the dual-task paradigm in detecting gait performance deficits following a sports-related concussion: a systematic review and meta-analysis. J. Sci. Med. Sport 2013, 16, 2–7. [Google Scholar] [CrossRef] [PubMed]
- Di Stasi, S.L.; Logerstedt, D.; Gardinier, E.S.; Snyder-Mackler, L. Gait patterns differ between ACL-reconstructed athletes who pass return-to-sport criteria and those who fail. Am. J. Sports Med. 2013, 41, 1310–1318. [Google Scholar] [CrossRef]
- Godfrey, A.; Del Din, S.; Barry, G.; Mathers, J.C.; Rochester, L. Instrumenting gait with an accelerometer: A system and algorithm examination. Med. Eng. Phys. 2015, 37, 400–407. [Google Scholar] [CrossRef]
- Del Din, S.; Godfrey, A.; Rochester, L. Validation of an Accelerometer to Quantify a Comprehensive Battery of Gait Characteristics in Healthy Older Adults and Parkinson’s Disease: Toward Clinical and at Home Use. IEEE J. Biomed. Heal. Inform. 2016, 20, 838–847. [Google Scholar] [CrossRef]
- Mota, F.A.O.; Biajo, V.H.M.; Mota, H.O.; Vasconcelos, F.H. A wireless sensor network for the biomechanical analysis of the gait. In Proceedings of the 2017 IEEE International Instrumentation and Measurement Technology Conference (I2MTC), Turin, Italy, 22–25 May 2017; pp. 1–6. [Google Scholar]
- Hafidh, B.; Al Osman, H.; El Saddik, A. SmartInsole: A foot-based activity and gait measurement device. In Proceedings of the 2013 IEEE International Conference on Multimedia and Expo Workshops (ICMEW), San Jose, CA, USA, 15–19 July 2013; pp. 1–4. [Google Scholar]
- Zhuang, Y.; Gong, J.; Kerrigan, D.C.; Bennett, B.C.; Lach, J.; Russell, S. Gait tracker shoe for accurate step-by-step determination of gait parameters. In Proceedings of the 2016 IEEE 13th International Conference on Wearable and Implantable Body Sensor Networks (BSN), San Francisco, CA, USA, 14–17 June 2016; pp. 13–18. [Google Scholar]
- Mariani, B.; Hoskovec, C.; Rochat, S.; Büla, C.; Penders, J.; Aminian, K. 3D gait assessment in young and elderly subjects using foot-worn inertial sensors. J. Biomech. 2010, 43, 2999–3006. [Google Scholar] [CrossRef] [PubMed]
- Jagos, H.; Pils, K.; Haller, M.; Wassermann, C.; Chhatwal, C.; Rafolt, D.; Rattay, F. Mobile gait analysis via eSHOEs instrumented shoe insoles: A pilot study for validation against the gold standard GAITRite. J. Med. Eng. Technol. 2017, 41, 375–386. [Google Scholar] [CrossRef] [PubMed]
- Gerlach, C.; Krumm, D.; Illing, M.; Lange, J.; Kanoun, O.; Odenwald, S.; Hubler, A. Printed MWCNT-PDMS-Composite Pressure Sensor System for Plantar Pressure Monitoring in Ulcer Prevention. IEEE Sens. J. 2015, 15, 3647–3656. [Google Scholar] [CrossRef]
- Weizman, Y.; Fuss, F.K. Development of Instrumented Soccer Footwear for Kicking Analysis and Training Purposes. Procedia Eng. 2015, 112, 157–162. [Google Scholar] [CrossRef] [Green Version]
- Tan, A.M.; Fuss, F.K.; Weizman, Y.; Troynikov, O. Development of a smart insole for medical and sports purposes. Procedia Eng. 2015, 112, 152–156. [Google Scholar] [CrossRef]
- Motha, L.; Kim, J.; Kim, W.S. Instrumented rubber insole for plantar pressure sensing. Org. Electron. Phys. Mater. Appl. 2015, 23, 82–86. [Google Scholar] [CrossRef]
- Crea, S.; Donati, M.; De Rossi, S.; Oddo, C.; Vitiello, N. A Wireless Flexible Sensorized Insole for Gait Analysis. Sensors 2014, 14, 1073–1093. [Google Scholar] [CrossRef] [PubMed] [Green Version]
- Braun, B.J.; Veith, N.T.; Hell, R.; Döbele, S.; Roland, M.; Rollmann, M.; Holstein, J.; Pohlemann, T. Validation and reliability testing of a new, fully integrated gait analysis insole. J. Foot Ankle Res. 2015, 8, 54. [Google Scholar] [CrossRef] [PubMed]
- Minto, S.; Zanotto, D.; Boggs, E.M.; Rosati, G.; Agrawal, S.K. Validation of a Footwear-Based Gait Analysis System With Action-Related Feedback. IEEE Trans. Neural Syst. Rehabil. Eng. 2016, 24, 971–980. [Google Scholar] [CrossRef] [PubMed]
- Connect Multiple Bluetooth Devices to one Computer. Available online: support.apple.com/HT201171 (accessed on 13 November 2017).
- Srisooksai, T.; Keamarungsi, K.; Lamsrichan, P.; Araki, K. Practical data compression in wireless sensor networks: A survey. J. Netw. Comput. Appl. 2012, 35, 37–59. [Google Scholar] [CrossRef]
- Akyildiz, I.F.; Melodia, T.; Chowdhury, K.R. A survey on wireless multimedia sensor networks. Comput. Netw. 2007, 51, 921–960. [Google Scholar] [CrossRef] [Green Version]
- Misra, S.; Reisslein, M.; Xue, G. A survey of multimedia streaming in wireless sensor networks. IEEE Commun. Surv. Tutor. 2008, 10, 18–39. [Google Scholar] [CrossRef]
- Badawi, H.; Laamarti, F.; Arafsha, F.; El Saddik, A. Standardizing a Shoe Insole Based on ISO/IEEE 11073 Personal Health Device (X73-PHD) Standards. In Information Technology and Systems. ICITS 2019. Advances in Intelligent Systems and Computing; Rocha, Á., Ferrás, C., Paredes, M., Eds.; Springer: Cham, Switzerland, 2019; Volume 918, pp. 764–778. ISBN 978-3-030-11890-7. [Google Scholar]
- Arafsha, F.; Hanna, C.; Aboualmagd, A.; Fraser, S.; El Saddik, A. Instrumented Wireless SmartInsole System for Mobile Gait Analysis: A Validation Pilot Study with Tekscan Strideway. J. Sens. Actuator Netw. 2018, 7, 36. [Google Scholar] [CrossRef]
- Arafsha, F.; Laamarti, F.; Saddik, A. El Development of a wireless CPS for gait parameters measurement and analysis. In Proceedings of the 2018 IEEE International Instrumentation and Measurement Technology Conference (I2MTC), Houston, TX, USA, 14–17 May 2018; pp. 1–5. [Google Scholar]
- Yaniger, S.I. Force Sensing Resistors: An Overview of the Technology. In Proceedings of the Electro International, New York, NY, USA, 16–18 April 1991; pp. 666–668. [Google Scholar]
- SparkFun IMU Breakout-MPU-9250. Available online: https://www.sparkfun.com/products/13762 (accessed on 2 February 2018).
- Arafsha, F. Configurable Medical Cyber-Physical System Framework for Physical Activity Monitoring. Ph.D. Thesis, University of Ottawa, Ottawa, ON, Canada, February 2019. Available online: https://ruor.uottawa.ca/handle/10393/38793 (accessed on 6 February 2019).
- Howell, A.M. Insole-Based Gait Analysis. 2012. Available online: https://search.proquest.com/openview/f3f0e8280a937d295579bdb3fbe5cae4/1?pq-origsite=gscholar&cbl=18750&diss=y (accessed on 2 February 2018).
- Tao, Y.; Wu, X.; Yang, Y.; Qian, H.; Zhang, C.; Xu, Y. An intelligent shoe system: Evaluation of weight load approaches by gait analysis. In Proceedings of the 2012 International Conference on Computerized Healthcare (ICCH), Hong Kong, China, 17–18 December 2012; pp. 145–151. [Google Scholar]
- Edgar, S.R.; Swyka, T.; Fulk, G.; Sazonov, E.S. Wearable shoe-based device for rehabilitation of stroke patients. In Proceedings of the 2010 Annual International Conference of the IEEE Engineering in Medicine and Biology, Buenos Aires, Argentina, 31 August–4 September 2010; pp. 3772–3775. [Google Scholar] [CrossRef]
- Howell, A.M.; Kobayashi, T.; Hayes, H.A.; Foreman, K.B.; Bamberg, S.J.M. Kinetic gait analysis using a low-cost insole. IEEE Trans. Biomed. Eng. 2013, 60, 3284–3290. [Google Scholar] [CrossRef] [PubMed]
- Periyasamy, R.; Mishra, A.; Anand, S.; Ammini, A.C. Preliminary investigation of foot pressure distribution variation in men and women adults while standing. Foot 2011, 21, 142–148. [Google Scholar] [CrossRef] [PubMed]
- Florez, J.A.; Velasquez, A. Calibration of force sensing resistors (fsr) for static and dynamic applications. In Proceedings of the 2010 IEEE ANDESCON, Bogota, Colombia, 15–17 September 2010; pp. 1–6. [Google Scholar]
- Strideway System. Available online: https://www.tekscan.com/products-solutions/systems/strideway-system (accessed on 12 February 2018).
- Rouhani, H.; Favre, J.; Crevoisier, X.; Aminian, K. A wearable system for multi-segment foot kinetics measurement. J. Biomech. 2014, 47, 1704–1711. [Google Scholar] [CrossRef] [PubMed]
- Kolodner, E.K.; Tal, S.; Kyriazis, D.; Naor, D.; Allalouf, M.; Bonelli, L.; Brand, P.; Eckert, A.; Elmroth, E.; Gogouvitis, S.V.; et al. A Cloud Environment for Data-intensive Storage Services. In Proceedings of the 2011 IEEE Third International Conference on Cloud Computing Technology and Science, Athens, Greece, 29 November–1 December 2011; pp. 357–366. [Google Scholar]
- Kocabas, O.; Soyata, T.; Aktas, M.K. Emerging Security Mechanisms for Medical Cyber Physical Systems. IEEE/ACM Trans. Comput. Biol. Bioinform. 2016, 13, 401–416. [Google Scholar] [CrossRef]
Figure 1.
Proposed Cyber-Physical Systems (CPS) framework main components include one or more physical systems, a cyber system, and a well-defined communication protocol. DMBS: Database Management System; DB: Database; PSVPs: pre-coded physical system visualization presets.
Figure 1.
Proposed Cyber-Physical Systems (CPS) framework main components include one or more physical systems, a cyber system, and a well-defined communication protocol. DMBS: Database Management System; DB: Database; PSVPs: pre-coded physical system visualization presets.

Figure 2.
General block diagram of a physical system architecture.

Figure 3.
An example of a physical system profile (PSP) configuration showing the type of information it holds.
Figure 3.
An example of a physical system profile (PSP) configuration showing the type of information it holds.

Figure 4.
Stacked operation layers showing the one-to-many relationship between the Cyber and the Physical systems.
Figure 4.
Stacked operation layers showing the one-to-many relationship between the Cyber and the Physical systems.

Figure 5.
Left: Printed Circuit Board (PCB) design showing sensor layout, Right: actual photo of implemented device on flexible PCB.
Figure 5.
Left: Printed Circuit Board (PCB) design showing sensor layout, Right: actual photo of implemented device on flexible PCB.

Figure 6.
(left) A 5-s sample of FSR (Force-Sensitive Resistor) pressure values and the average pressure from all sensors in the left and right feet. Detectable patterns amongst different gait phases are shown. (right) Visualization of the average foot pressure data collected during the same performed activities: (a) Walk forward; (b) Walk backward; (c) Jog forward; (d) Jog backward; (e) Sprint; (f) Jump.

Figure 7.
A graph showing FSR values and accelerometer values at the event of kicking a soccer ball. Highlighted area shows high disturbance in the right accelerometer which accurately estimates the time the ball was kicked using the right foot.
Figure 7.
A graph showing FSR values and accelerometer values at the event of kicking a soccer ball. Highlighted area shows high disturbance in the right accelerometer which accurately estimates the time the ball was kicked using the right foot.

© 2019 by the authors. Licensee MDPI, Basel, Switzerland. This article is an open access article distributed under the terms and conditions of the Creative Commons Attribution (CC BY) license (http://creativecommons.org/licenses/by/4.0/).
Share and Cite
MDPI and ACS Style
Arafsha, F.; Laamarti, F.; El Saddik, A. Cyber-Physical System Framework for Measurement and Analysis of Physical Activities. Electronics 2019, 8, 248. https://doi.org/10.3390/electronics8020248
AMA Style
Arafsha F, Laamarti F, El Saddik A. Cyber-Physical System Framework for Measurement and Analysis of Physical Activities. Electronics. 2019; 8(2):248. https://doi.org/10.3390/electronics8020248
Chicago/Turabian StyleArafsha, Faisal, Fedwa Laamarti, and Abdulmotaleb El Saddik. 2019. "Cyber-Physical System Framework for Measurement and Analysis of Physical Activities" Electronics 8, no. 2: 248. https://doi.org/10.3390/electronics8020248
Note that from the first issue of 2016, this journal uses article numbers instead of page numbers. See further details here.