Article

Ultra-Short Pulsed Laser Annealing Effects on MoS2 Transistors with Asymmetric and Symmetric Contacts

1
Department of Information and Communication Engineering, DGIST, Daegu 42988, Korea
2
School of Electronics Engineering, Kyungpook National University, Daegu 41566, Korea
3
School of Advanced Materials Science & Engineering, Sungkyunkwan University, Suwon 16419, Korea
4
Department of Mechanical Engineering, University of California, Berkeley, CA 94720, USA
*
Authors to whom correspondence should be addressed.
These authors contributed equally to this work.
Electronics 2019, 8(2), 222; https://doi.org/10.3390/electronics8020222
Submission received: 7 January 2019 / Revised: 1 February 2019 / Accepted: 14 February 2019 / Published: 17 February 2019
(This article belongs to the Special Issue Flexible/Stretchable Electronics)

Abstract

:
The ultra-short pulsed laser annealing process enhances the performance of MoS2 thin film transistors (TFTs) without thermal damage on plastic substrates. However, there has been insufficient investigation into how much improvement can be brought about by the laser process. In this paper, we observed how the parameters of TFTs, i.e., mobility, subthreshold swing, Ion/Ioff ratio, and Vth, changed as the TFTs’ contacts were (1) not annealed, (2) annealed on one side, or (3) annealed on both sides. The results showed that the linear effective mobility (μeff_lin) increased from 13.14 [cm2/Vs] (not annealed) to 18.84 (one side annealed) to 24.91 (both sides annealed). Also, Ion/Ioff ratio increased from 2.27 × 10 5 (not annealed) to 3.14 × 10 5 (one side annealed) to 4.81 × 10 5   (both sides annealed), with Vth shifting to negative direction. Analyzing the main reason for the improvement through the Y function method (YFM), we found that both the contact resistance (Rc) and the channel interface resistance (Rch) improves after the pulsed laser annealings under different conditions. Moreover, the Rc enhances more dramatically than the Rch does. In conclusion, our picosecond laser annealing improves the performance of TFTs (especially, the Rc) in direct proportion to the number of annealings applied. The results will contribute to the investigation about correlations between the laser annealing process and the performance of devices.

1. Introduction

Flexible electronics have the potential to be applied in various fields due to advantages such as better durability, lighter weight, higher space efficiency, and improved comfort that conventional form factor cannot have [1]. In particular, wearable and flexible smart systems (e.g., smart watches, smart glasses, smart tablets, smartphones, and e-tattoos) have continued to advance and have made a significant impact on people’s lives [2,3]. In spite of the potential, there are some obstacles to applying conventional thin-film transistors (TFTs) to a flexible device: process temperature, electrical properties in stress and strain, and deformation. Therefore, new approaches in terms of the material and process are required to overcome previous drawbacks.
Two-dimensional (2D) layered semiconductor materials (vertically stacked structure in layers consisted of MX2 (transition metal dichalcogenides (TMDs)) by weak van der Waals force) can be a good candidate for solving these problems due to their properties. For example, single/multilayer molybdenum disulfide (MoS2) has the interesting features: high surface to volume ratio, relatively large bandgap (1.2–1.9 eV), high mobility at room temperature (~100 cm2/Vs), low subthreshold swing (SS, ~70 mV/decade), an absence of dangling bond, and high mechanical strength (a higher Young’s modulus than that of steel) [4,5,6,7,8]. Furthermore, it can be deformed by up to 11% without fracture [9,10] and can be bent to a bending radius of 0.75 nm without losing its electrical properties [11,12]. However, when metal‒MoS2 junctions form, electrical contacts can disrupt the seamless flow of charge carriers to obtain the expected maximum performance [13]; to achieve high performance of electronic devices with MoS2, the contact resistance (Rc) should be considered. Some methods have been suggested to reduce the Rc: a highly-doped interface [14], scandium electrode [15], and thermal annealing [7]. However, there are some obstacles to using them. Highly-doped interfaces have trouble maintaining a constant high doping rate and doping effect. Scandium electrode is inappropriate to use commercially because of its scarcity. Conventional thermal annealing to heat the entire wafer at a high temperature can damage flexible substrates with a low thermal budget (< 200 °C).
In this regard, a pulsed laser has the advantage of being able to focus the energy at a point and inducing a relatively high temperature at a very locally confined area, imparting a smaller heat-affected zone (HAZ) [16]. In earlier research, we mainly focused on showing the possibility of obtaining highly improved performance through a laser annealing process, and revealed that selective and localized laser annealing can lower the effective contact barrier of the metal‒MoS2 junction [17]. In these previous experiments, we annealed both source- and drain-channel contact regions. However, neither of these annealings can provide detailed information about the degree and the trend of the effect made by each, and both, at the source and drain contact regions. Therefore, in this paper, we examine the degree of improvement in one-side annealing where only one of the source or the drain is annealed and the contacts thereby becoming asymmetric (“asymmetric contacts”) and in both-side annealing where both of the source and the drain are annealed and hence contacts becoming symmetric (“symmetric contacts”). Then, we probe into the primary reason for the differences in the degree of the improvement under asymmetric- and symmetric-contact conditions.

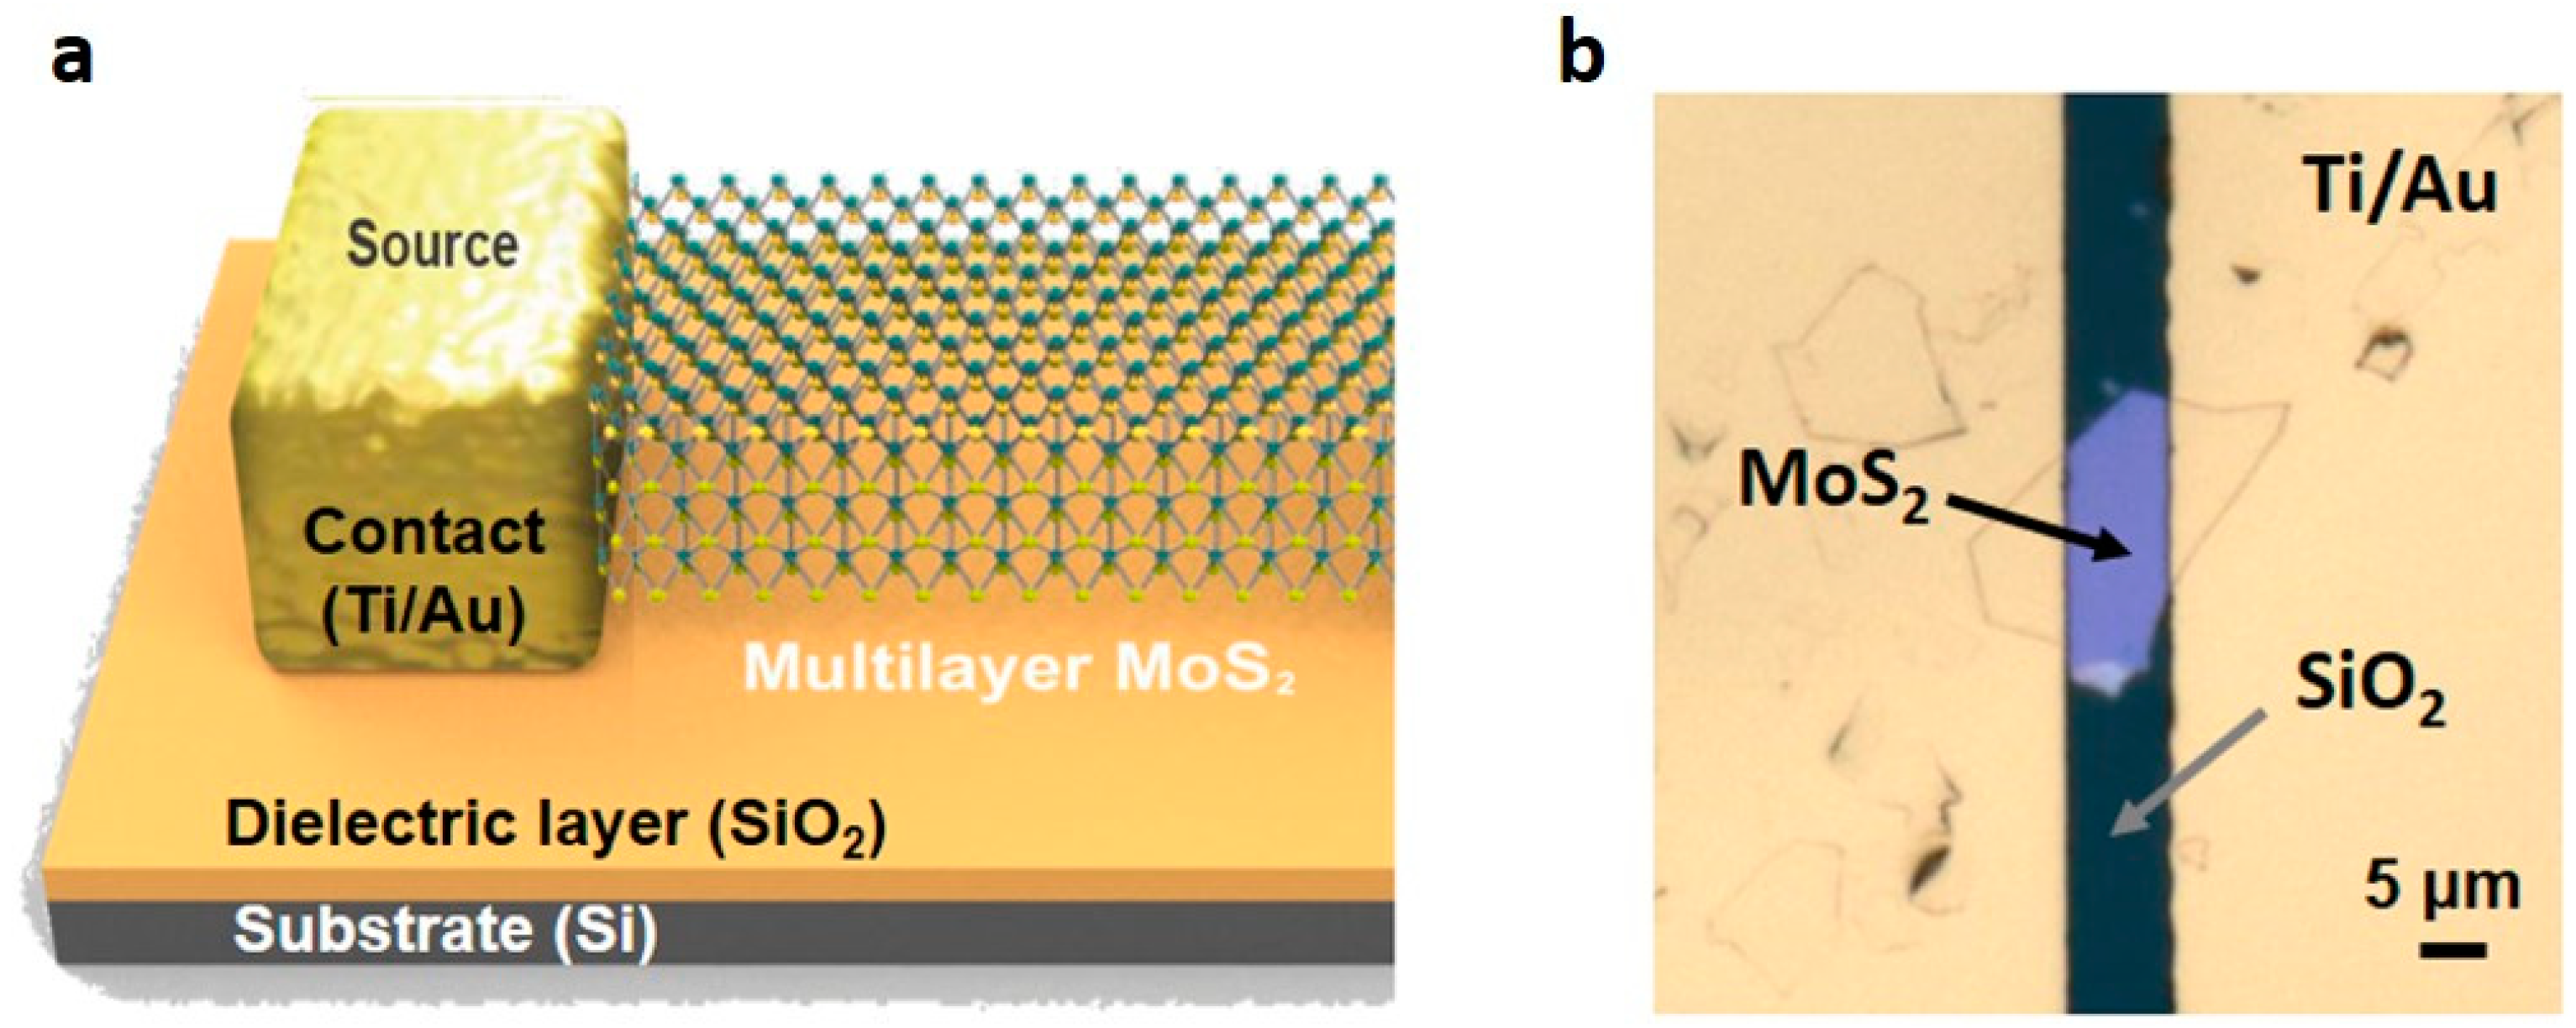
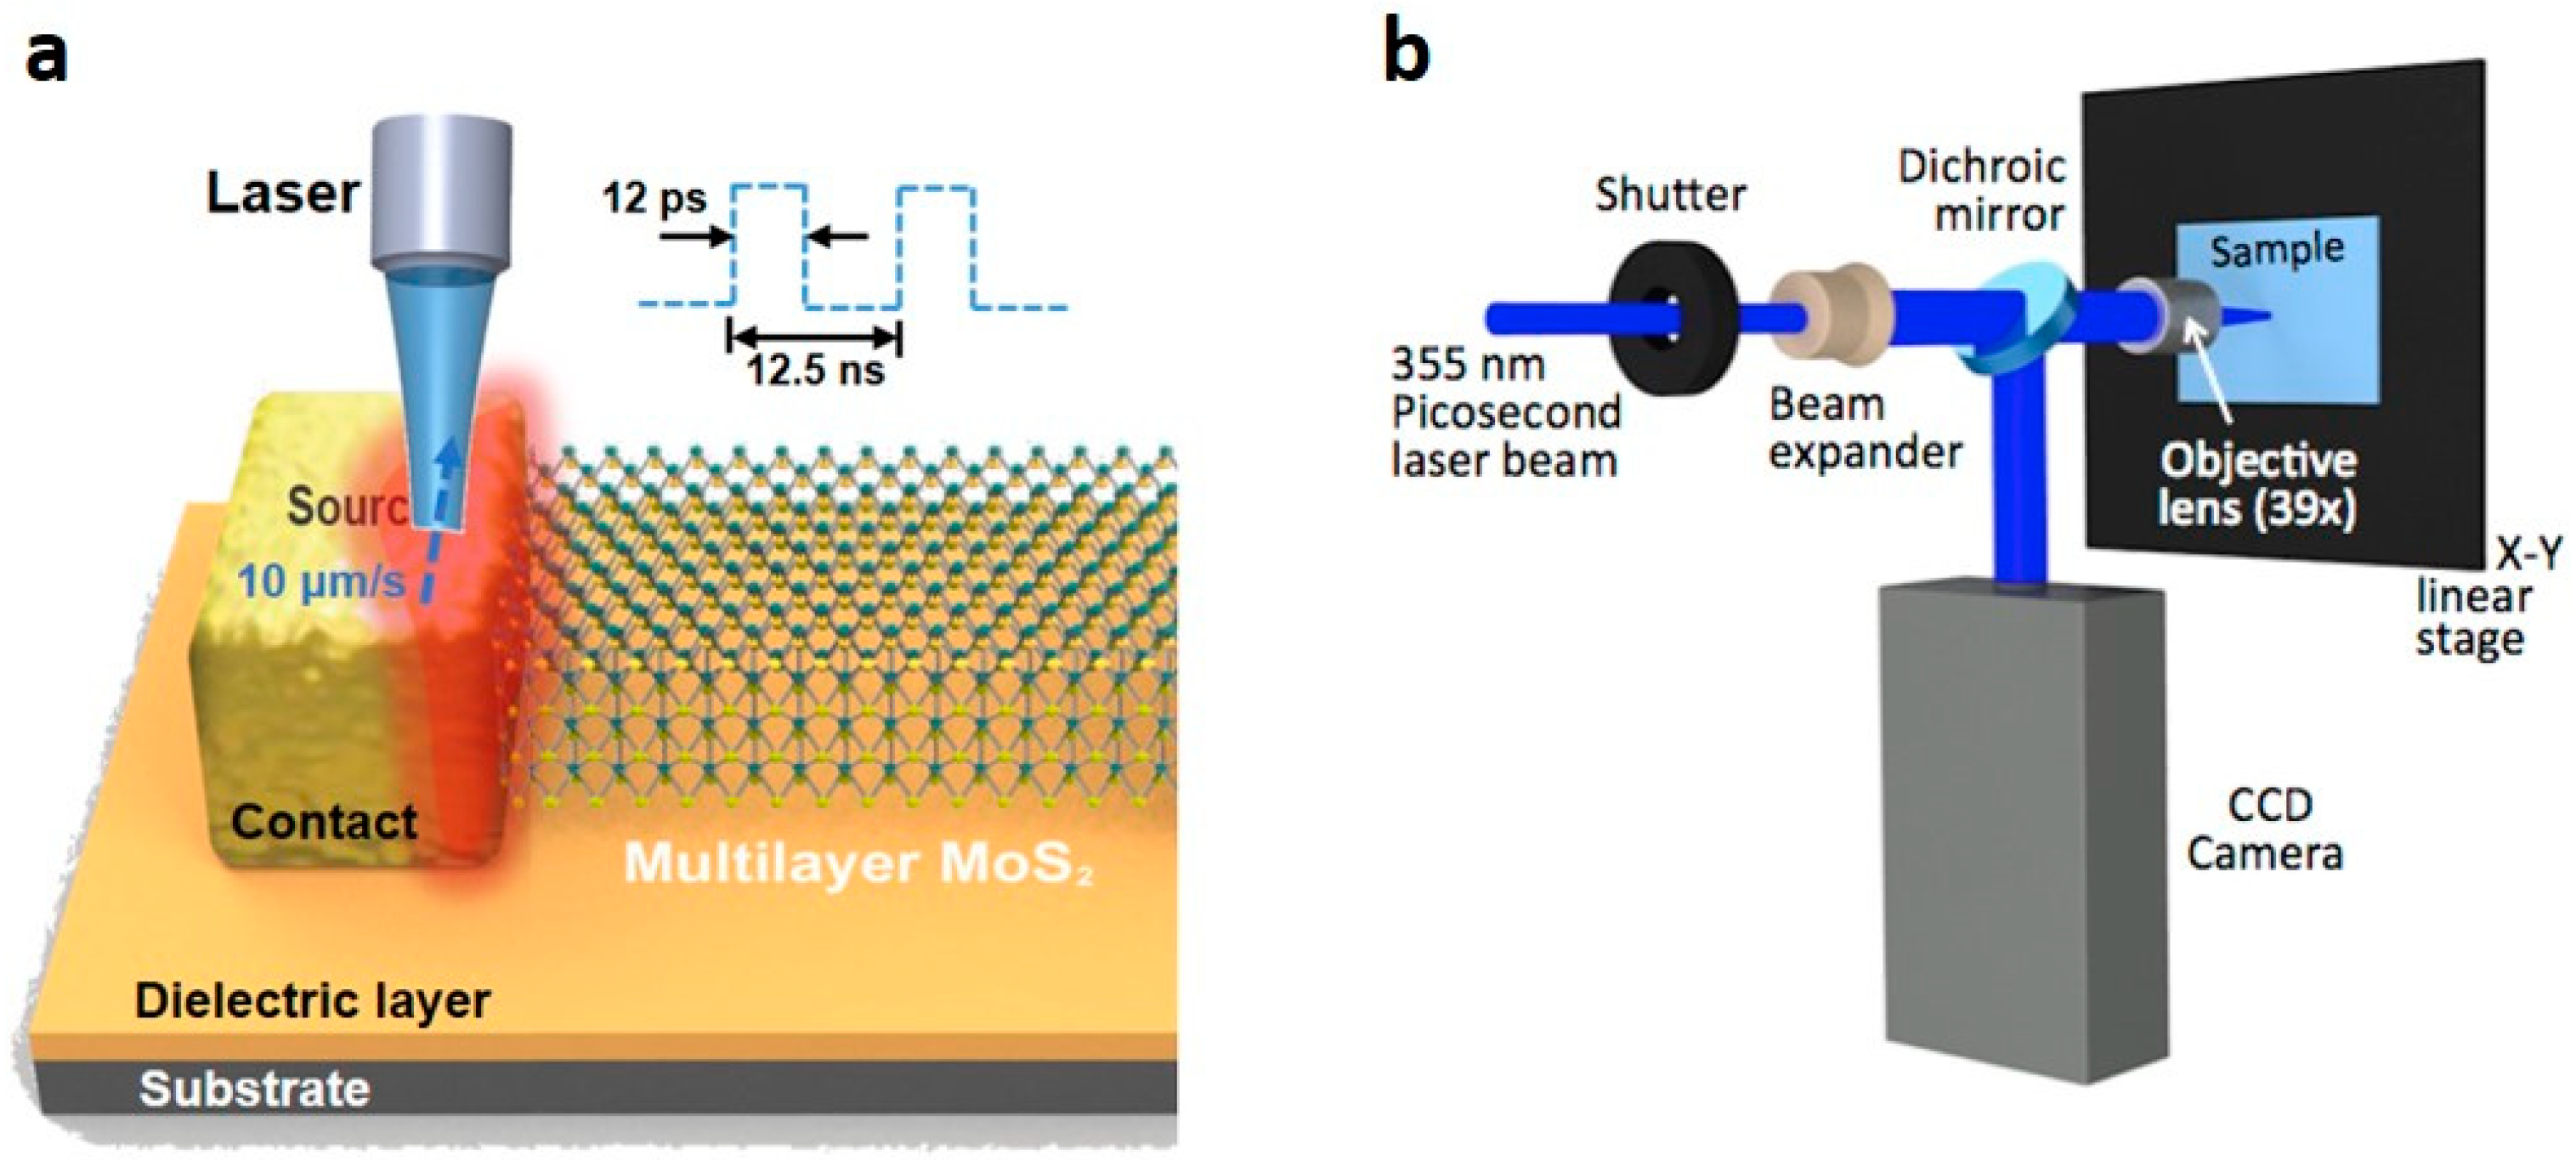
2. Experiments and Setup

Figure 1a shows the conceptual diagram of multilayer MoS2 TFT. The devices were fabricated by the following process: (1) a 250-nm-thick SiO2 dielectric layer was deposited by sputtering on the heavily doped Si substrate, (2) a multilayer MoS2 flake (~50 nm) was transferred from bulk MoS2 crystal (SPI Supplies, West Chester, PA, USA), and (3) Ti of 10 nm and Au of 300 nm as source and drain electrodes were formed by conventional photolithography, lift-off techniques, and e-beam evaporation. Here, we note that the lowest layer would be a flexible substrate, but this laser annealing process did not affect the substrate in our previous results [17,18] or the convenience of fabrication, so we used the rigid Si substrate instead of flexible films in the experiment. Also, the MoS2 flakes were obtained from mechanical exfoliation because they had a larger electrical mobility value than MoS2 grown by chemical vapor deposition (CVD). Note that the studies on the reason why artificially obtained MoS2 has low mobility are still ongoing; here are some possible reasons: (1) the twisted stacked structure causing a change in the bandgap by interlayer electronic coupling, (2) a change in the unit cell structure of MoS2 from trigonal prismatic (2H) to octahedral (1T), and (3) a lot of fabrication defects [19,20,21]. Moreover, the Ti/Au electrodes we use can make up for the drawbacks of Au without a Ti layer, which has a relatively high work function and bad adhesion to the substrate [6]. Figure 1b shows the representative top-view image (filmed with an optical microscope) of the fabricated MoS2 transistor of 11.2 μm (channel width) by 7 μm (channel length). For an accurate comparison of the improvement between asymmetric and symmetric contacts, we tried to select and use MoS2 transistors having almost the same width on both sides of the electrodes.
The laser process progressed at the surface of the contact region between electrode and channel with a fixed scan speed of 10 μm/s, as shown in Figure 2a. We used a neodymium-doped yttrium vanadate (Nd:YVO4) picosecond (ps) pulsed laser (Spectra-Physics, Santa Clara, CA, USA) with a wavelength of 355 nm, a pulse width based on full width at half maximum (FWHM) of 12 ps, and a pulse repetition of 80 MHz. For effective annealing, the laser beam was mainly focused on the edge of the metal‒MoS2 contacts because a large part of the electron is injected through them [22]. Also, the selected wavelength (355 nm) matched well the absorption coefficient of Au‒MoS2; the absorption spectrum of MoS2‒Au has a peak near 355 nm [23]. A beam of light with Gaussian profile from ps laser went to the target point of a sample on a high-resolution X-Y linear stage (Aerotech, Pittsburgh, PA, USA) after passing the dichroic mirror and the objective lens (39x) that modulated the beam spot size as 1.5 μm diameter at a 1/e2 peak irradiance (Figure 2b). A small amount of the light beam toward the CCD camera allowed us to adjust the focus of the laser at the accurate target point by confirming the position of the spot.

3. Results and Discussion

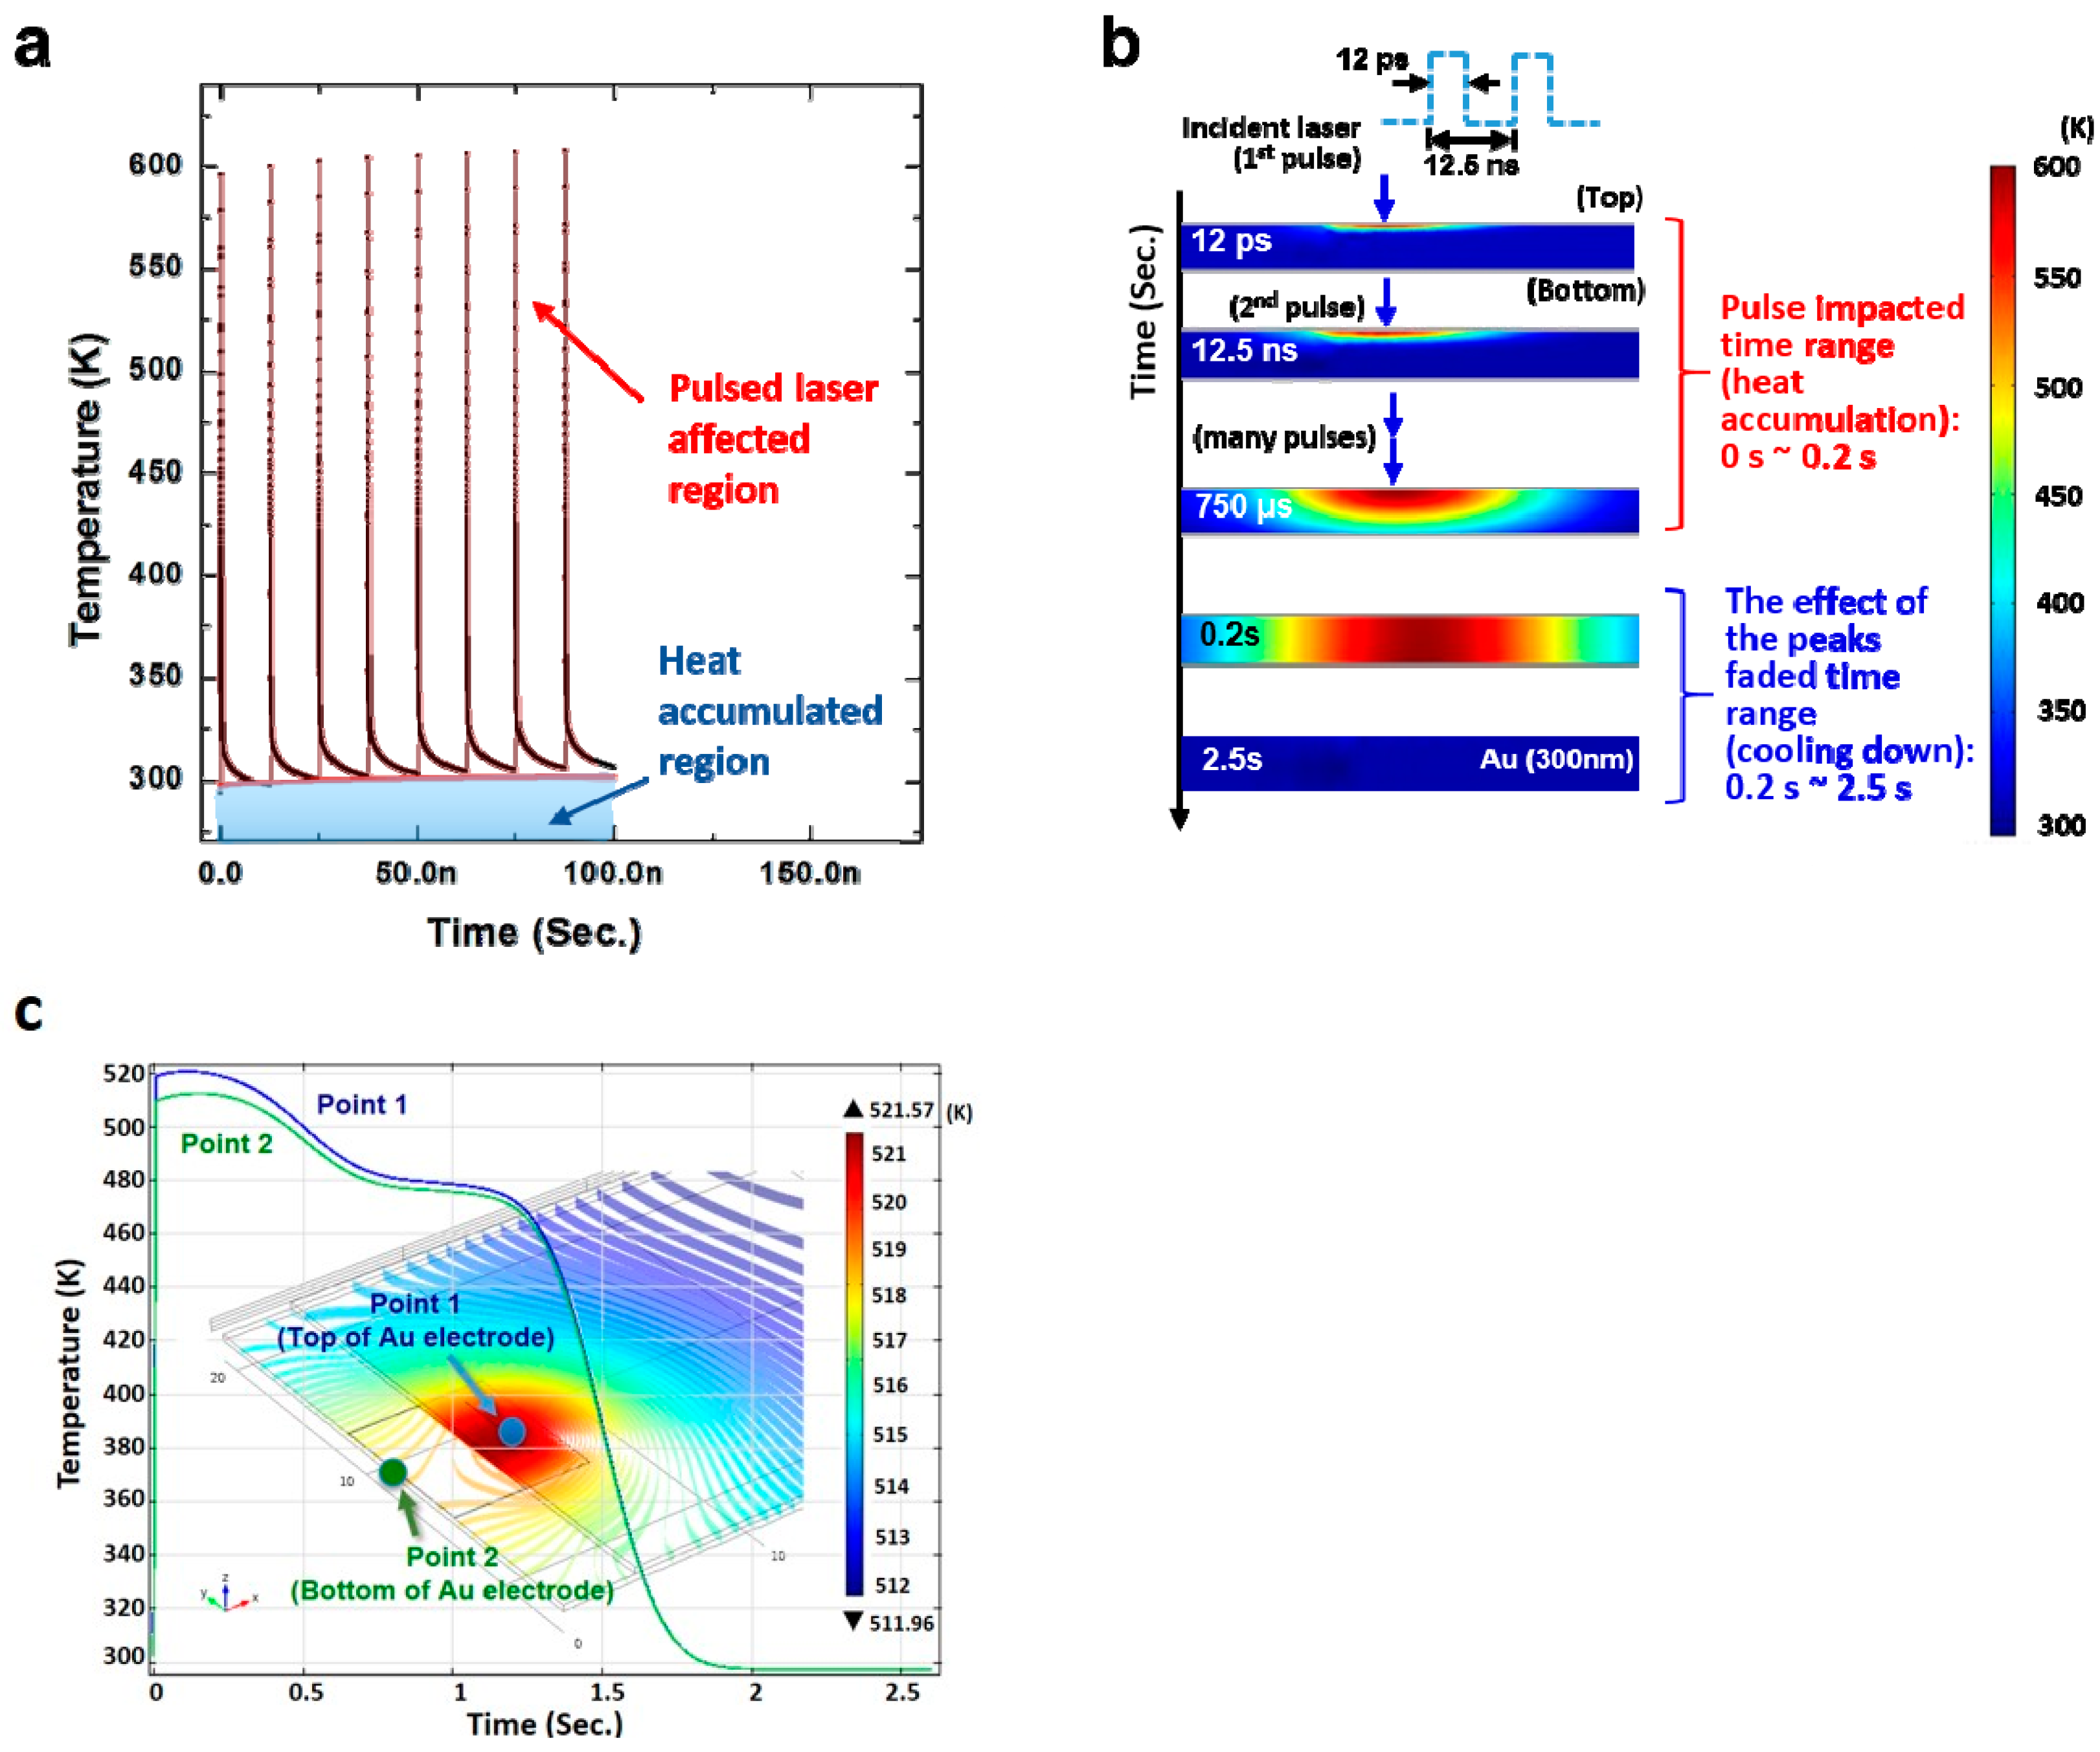
3.1. Thermal Analysis

During the laser process, free electrons in the metal electrodes initially absorb a photon energy of a laser, and the temperature rises by an interaction between thermalized electrons and lattices (within 10−10~10−12 s). Then, the generated heat moves to the direction of the higher thermal conductivity. Unfortunately, there is as of yet no way of directly measuring the temperature produced by the ultra-short pulsed laser. However, we can predict the transient temperature distribution at a specific position where a ps pulsed laser is irradiated through a three-dimensional (3D) Finite-Element Method (FEM) using COMSOL Multiphysics®. In more detail, we can estimate the generated heat profiles and flows when the pulsed laser beam irradiates the top of the Au electrode. The thermal analysis generally has many variables and it is very difficult to enter information to accurately mirror the real-world environment. To resolve these difficulties, we made a rough estimate of the results through the equilibrium temperature approximation. The estimation applies to the classical Fourier conduction model:
ρ C p T t ( k T ) = Q ( x , y , z ) ,
where ρ is the density, Cp is the specific heat, k is the thermal conductivity, and Q is the Gaussian heat source term, expressed as
Q ( x , y , z ) = Q 0 ( 1 R ) A c 2 π σ x σ y e [ ( x x 0 ) 2 2 σ x 2 + ( y y 0 ) 2 2 σ y 2 + A c z ] ,
where Q0, R, Ac, and σ x , y means the total input power, the reflectivity, the absorption coefficient, and the x, y widths of the spatial irradiation distribution, respectively. Also, for the accuracy of the analysis, we performed an actual experiment for finding the laser-induced damage threshold and extracted the parameters from the results of the real test. Figure 3a shows the computed temperature distribution while the eight laser pulses (the selected laser power of 20 mW, see Appendix A for the results of the parametric study in detail) irradiate at the surface of the Au electrode. The first pulse was absorbed to the top of the surface and a sharp heat spike occurred. Due to the high repetition rate (80 MHz), the generated spike heat was not able to cool down to the initial temperature before the next pulse (i.e., the heat accumulates) [24]. Therefore, we can observe two parts in Figure 3a: a pulsed laser-affected region (red) and a heat-accumulated region (blue). Moreover, the heat was confined to the shallow surface due to the ultra-short pulse duration (12 ps), as shown in Figure 3b. The aforementioned heat accumulation effect lasted up to 0.2 s until the moving laser beam (with a spot size of 1.5 μm diameter and a scan speed of 10 μm/s) was completely out of a specific point. As more and more pulses were absorbed, the bottom temperature of the electrode became the same as the surface temperature (Figure 3b). After the effect of the spike peaks disappeared, the heat dissipated entirely at 2.5 s. In a continuous time, we can restructure the graph for the overall accumulated temperature profile of point 1 (the top of the Au electrode) and point 2 (the bottom of the Au electrode) as shown in Figure 3c. From the simulated results, we were able to have enough heat (around 520 K) for the generally performed annealing process through the ultra-short pulsed laser at a power of 20 mW. Furthermore, this heat conducted to the bottom electrode (point 2) with minor energy loss due to the relatively high thermal conductivity of the electrode; this conducted heat mainly created thermal annealing consequences at the contact interface (between MoS2 and electrode). Changes in electrical characteristics suggest that the effect of temperature contributes to performance improvement.

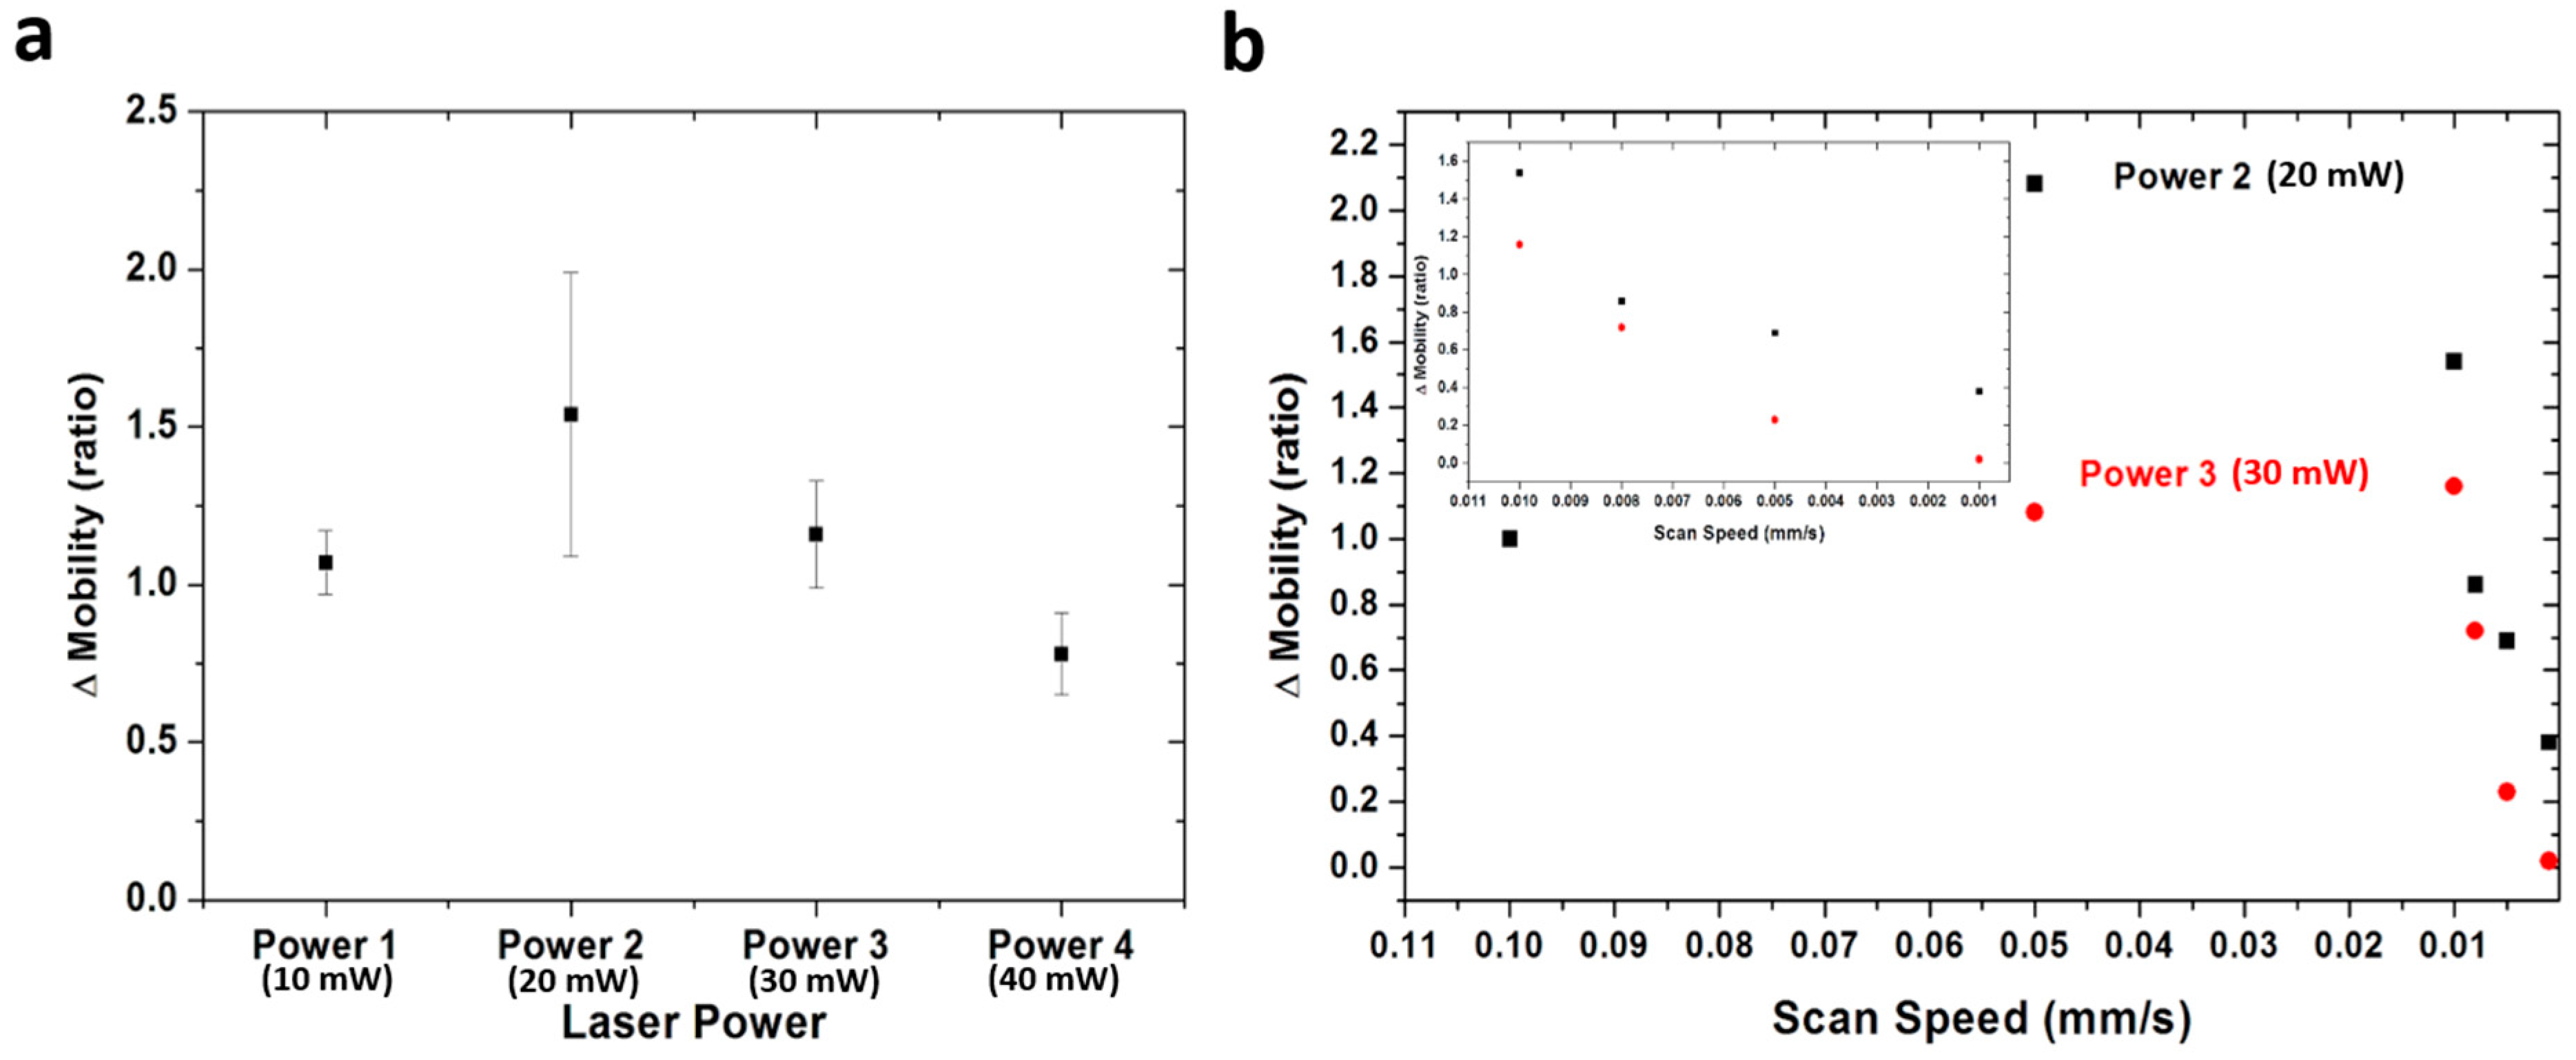
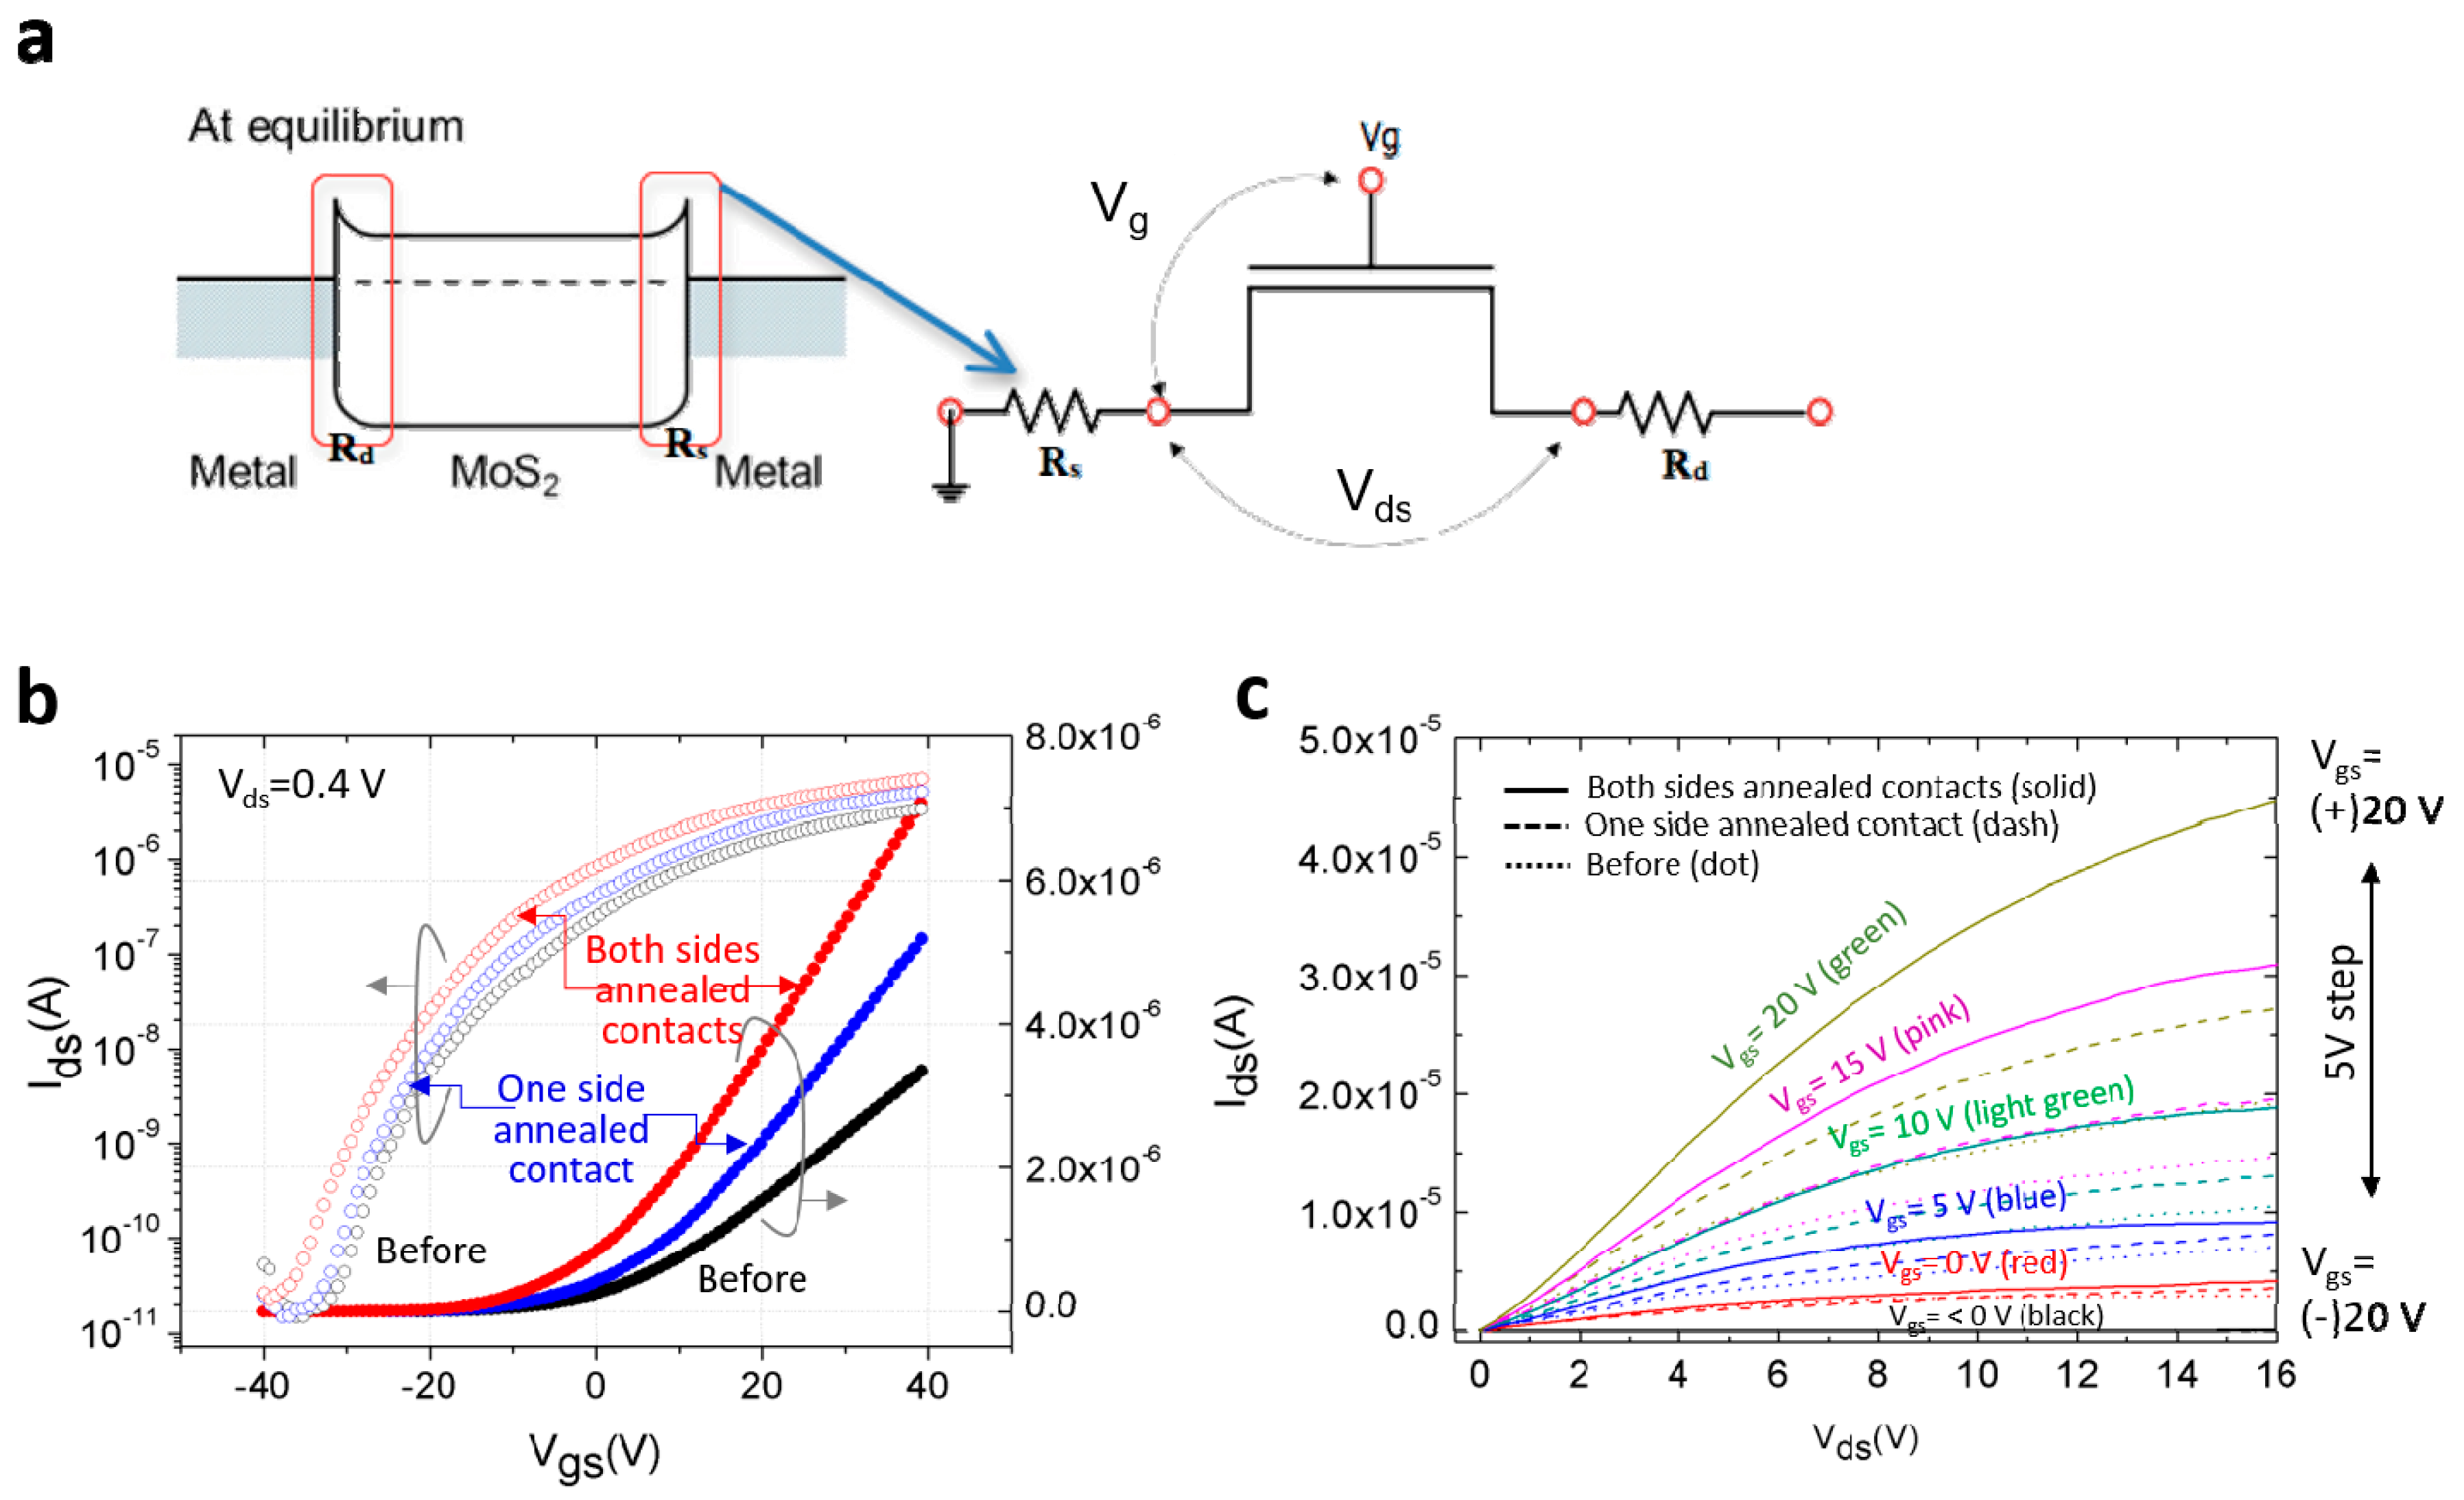
3.2. Electrical Characteristics

Figure 4a shows the energy band diagram of the metal‒MoS2‒metal junction at thermal equilibrium and the equivalent circuit of them. At the MoS2 and metal junction, a Schottky barrier can exist because of the difference of the metal‒vacuum work function and the semiconductor‒vacuum electron affinity and can make the Rc at the metal‒MoS2 junction, which is expressed as Rd and Rs [25]. Then, the total resistance of the equivalent circuit will be Rs + Rd + 1/gm: The sum of Rc and channel interface resistance (Rch). To investigate the difference in the degree of the improvement under asymmetric and symmetric contacts, we firstly measured the transfer curve (the source-drain current (Ids) and the gate-source voltage (Vgs)) and the output curve (Ids-Vds) of not annealed (Before, reference), one side annealed (Asymmetric), and both sides annealed (Symmetric) devices on the log (left) and linear-scale (right) in Figure 4b,c. The Ids-Vgs in Figure 4b was measured at low V ds (0.4 V) to guarantee that the shape of the conductive channel can be uniformly formed (linear regime) and for applying the Y function method (YFM) with the assumption that it be used for extracting the contact parameters later [26,27,28]. Also, we used the devices with a relatively large contact barrier as a sample for observing considerable changes; the Ids-Vds showed a non-linear output curve in a low Vds regime (Figure 4c). From the curves, the field-effective mobilities in linear regime (μeff_lin) were extracted: 13.17 cm2/Vs (Before), 18.84 cm2/Vs (Asymmetric contact), and 24.91 cm2/Vs (Symmetric contacts). In a qualitative sense, an increase in μeff_lin ( = μ 0 1 + θ ( V g V th ) , where θ is the mobility attenuation factor caused by the sum of the scattering factor, θ0 and the contact resistance factor, θ* ( = W L C ox μ 0 R c ) and μ0 is the intrinsic mobility) can be based on the decrease of θ value and/or on the decrease of Vth value. In a quantitative sense, the linear increment of the μeff_lin could mean that a dominant factor of the variation could be also changed linearly. Due to the enhancement of the μeff_lin, the ON current level appears to have a similar tendency. Therefore, Ion/Ioff ratio has increased: 2.27 × 10 5 (Before), 3.14 × 10 5 (Asymmetric contact), and 4.81 × 10 5 (Symmetric contact). As we expected, we observed a negative shift of Vth ( ϕ MS Q f C ox + 2 φ B + qN a 2 ϵ s 2 φ B C ox , where ϕ MS is the work function difference between the gate and the channel material and φ B is the Fermi level offset. This indicates that the surface and interface charges (Qf) could be decreased by the decline of the coulomb scattering through the lower interface traps. This fact also agreed with the changes of the subthreshold swings (SS): 3.80 V/decade (Before), 3.53 V/decade (Asymmetric contact), and 3.21 V/decade (Symmetric contact). We know that this result comes from the diminishing of the Cit from the relational formula of SS, ( ln 10 ) ( kT q ) ( C ox + C p + C it C ox ) [V/decade] (Cp: Depletion layer capacitance, Cit: Channel interface–trap capacitance). The degree of the decline of SS was proportionate to the number of annealings; the laser process could have a positive effect on the reduction of traps of the channel interface. By all accounts, the laser process can improve the performance of the MoS2 TFTs by reducing the Rc as well as making a better channel interface. However, it is still hard to decide what accounts for the changes; we just know that improving contact and interface quality can contribute to enhanced electrical characteristics after the laser annealing.
To estimate the degree of the laser annealing effect on the Rc and MoS2 channel interface, we compared the μeff_lin and the μ0 through the Y function method (YFM). Generally, a transfer-line method (TLM) with various channel lengths and uniform contact on the same channel body is engaged to extract the contact parameters. However, TLM is difficult to apply in our case, in which the devices are arbitrarily obtained and have an irregular shape and small size. On the other hand, YFM does not need any additional geometry except the low Vds condition (linear regime). In a linear regime, Ids is defined by, I ds = g ds × V ds = W L Q ch μ eff _ lin × V ds (gds: the channel conductance, Qch: the channel charge per unit area). Ids can be rewritten as
I ds = W L C o x ( V g s V t h ) μ 0 1 + θ ( V g s V t h ) × V d s .
According to the definition of the transconductance ( g m = I ds V gs   where   V ds = const . ) , θ can be eliminated by defining the Y function as
Y = I ds g m = W L C ox μ 0 V ds × ( V gs V th ) .
From the slope of the Y function, we can extract the value of the μ0 because the other parameters are known. As shown in Figure 5a, the slopes ( 4.28 × 10 4 (Before), 4.57 × 10 4 (Asymmetric contact), and 4.75 × 10 4 (Symmetric contact)) were obtained and the values of extracted μ0 are shown in Figure 5b (black filled rectangular points). Furthermore, we can calculate the μeff_lin from the square-law model (see black unfilled rectangular points in Figure 5b). Here, we note that the μeff_lin includes the contact and interface effects, but μ0 contains only the interface factor. Therefore, the root cause of the discrepancy between μ0 and μeff_lin can be the Rc, and the difference decreased through the consecutive laser annealing process from 47.04% to 33.55% to 18.67% (Figure 5b). Also, the μ0 has risen; the value of μ0 in the case of both annealed contacts went up 18.8% from the initial case (no annealing) and 7.44% from the case of one side annealed contact. Since μ0 only exhibits the effect of Rch, this can come down to the improvement of the interface quality after the laser treatment. The degree of the enhancement for the Rc and Rch was linearly varied along the process, and the parameters made an impact on the linear advancement of the electrical performance. However, the improvement of the Rc is more dominant than that of the Rch; the difference in proportions (the size of the area of each dominated region) and in the increase rates between μ0 and μeff_lin can be seen in Figure 5b.

4. Summary and Outlook

In summary, a picosecond pulsed laser annealing process enhanced the performance of MoS2 TFTs and the simulated temperature distribution showed that the process was compatible with a fabrication for flexible/wearable devices with a low thermal budget. The μeff_lin, μ0, Ion/Ioff ratio, SS, and Vth in the direction of high performance changed whenever the number of laser processes increased. (μeff_lin: 13.14 [cm2/Vs] (Before), 18.84 (asymmetric contact), and 24.91 (symmetric contact), μ0: 24.87 [cm2/Vs] (Before), 28.35 (asymmetric contact), and 30.63 (symmetric contact), Ion/Ioff ratio: 2.27 × 10 5 (Before), 3.14 × 10 5 (asymmetric contact), and 4.81 × 10 5 (symmetric contact), SS: 3.80 [V/decade] (Before), 3.53 (asymmetric contact), and 3.21 (symmetric contact), and Vth: shifted to negative direction.) Furthermore, we traced the main reason for the improvement through the YFM. The laser annealing process can improve the Rc as well as the Rch, and the two factors were linearly proportional to the contact conditions, such as the number of laser processes. Also, reducing the Rc had a more major effect than promoting the channel interface. These results can be expected to help us develop an in-depth understanding of the interaction between the laser irradiation and materials. Furthermore, we expect that the irradiation of a pulsed laser with high energy density and short wavelength onto metal as an electrode can lead to a thermal annealing effect at a locally confined small area that needs high temperature without severe thermal damage to the entire plastic substrate; this process can be compatible with the soft materials often used in applications for flexible/wearable electronics.

Author Contributions

Conceptualization, H.-J.K. and C.P.G.; Experiments and data analysis, H.K. and S.B.; Investigation, H.-J.K., J.E.J., J.J., S.K., and C.P.G.; Writing—original draft preparation, H.K. and S.B.; Writing—Review & Editing, J.E.J., J.J., S.K., H.-J.K., and C.P.G.

Funding

This work was supported by the DGIST Start-up Fund Program of the Ministry of Science, ICT and Future Planning (2018010064). This work was also performed under the DGIST-Samsung Electronics collaboration program.

Conflicts of Interest

The authors declare no conflict of interest.

Appendix A

Figure A1. Plot of the relative mobility value with respect to (a) laser power and (b) scan speed.
Electronics 08 00222 g0a1

References

  1. MacDonald, W.A.; Looney, M.; MacKerron, D.; Eveson, R.; Adam, R.; Hashimoto, K.; Rakos, K. Latest advances in substrates for flexible electronics. J. Soc. Inf. Disp. 2007, 15, 1075–1083. [Google Scholar] [CrossRef]
  2. Kim, D.-H.; Lu, N.; Ma, R.; Kim, Y.-S.; Kim, R.-H.; Wang, S.; Wu, J.; Won, S.M.; Tao, H.; Islam, A. Epidermal electronics. Science 2011, 333, 838–843. [Google Scholar] [CrossRef] [PubMed]
  3. Akinwande, D.; Petrone, N.; Hone, J. Two-dimensional flexible nanoelectronics. Nat. Commun. 2014, 5, 5678. [Google Scholar] [CrossRef] [PubMed] [Green Version]
  4. Wang, Q.H.; Kalantar-Zadeh, K.; Kis, A.; Coleman, J.N.; Strano, M.S. Electronics and optoelectronics of two-dimensional transition metal dichalcogenides. Nat. Nanotech. 2012, 7, 699. [Google Scholar] [CrossRef] [PubMed]
  5. Splendiani, A.; Sun, L.; Zhang, Y.; Li, T.; Kim, J.; Chim, C.-Y.; Galli, G.; Wang, F. Emerging photoluminescence in monolayer MoS2. Nano. Lett. 2010, 10, 1271–1275. [Google Scholar] [CrossRef] [PubMed]
  6. Mak, K.F.; Lee, C.; Hone, J.; Shan, J.; Heinz, T.F. Atomically thin MoS2: A new direct-gap semiconductor. Phys. Rev. Lett. 2010, 105, 136805. [Google Scholar] [CrossRef] [PubMed]
  7. Radisavljevic, B.; Radenovic, A.; Brivio, J.; Giacometti, I.V.; Kis, A. Single-layer MoS2 transistors. Nat. Nanotech. 2011, 6, 147. [Google Scholar] [CrossRef]
  8. Ganatra, R.; Zhang, Q. Few-layer MoS2: A promising layered semiconductor. ACS Nano. 2014, 8, 4074–4099. [Google Scholar] [CrossRef]
  9. Castellanos-Gomez, A.; Poot, M.; Steele, G.A.; van der Zant, H.S.; Agraït, N.; Rubio-Bollinger, G. Elastic properties of freely suspended MoS2 nanosheets. Adv. Mater. 2012, 24, 772–775. [Google Scholar] [CrossRef]
  10. Bertolazzi, S.; Brivio, J.; Kis, A. Stretching and breaking of ultrathin MoS2. ACS Nano. 2011, 5, 9703–9709. [Google Scholar] [CrossRef]
  11. Pu, J.; Yomogida, Y.; Liu, K.-K.; Li, L.-J.; Iwasa, Y.; Takenobu, T. Highly flexible MoS2 thin-film transistors with ion gel dielectrics. Nano. Lett. 2012, 12, 4013–4017. [Google Scholar] [CrossRef] [PubMed]
  12. Duerloo, K.-A.N.; Ong, M.T.; Reed, E.J. Intrinsic piezoelectricity in two-dimensional materials. J. Phys. Chem. Lett. 2012, 3, 2871–2876. [Google Scholar] [CrossRef]
  13. Popov, I.; Seifert, G.; Tománek, D. Designing electrical contacts to MoS2 monolayers: a computational study. Phys. Rev. Lwtt. 2012, 108, 156802. [Google Scholar]
  14. Fang, H.; Chuang, S.; Chang, T.C.; Takei, K.; Takahashi, T.; Javey, A. High-performance single layered WSe2 p-FETs with chemically doped contacts. Nano Lett. 2012, 12, 3788–3792. [Google Scholar] [CrossRef] [PubMed]
  15. Das, S.; Chen, H.-Y.; Penumatcha, A.V.; Appenzeller, J. High performance multilayer MoS2 transistors with scandium contacts. Nano Lett. 2012, 13, 100–105. [Google Scholar] [CrossRef] [PubMed]
  16. Yang, Y.; Ding, S.; Araki, T.; Jiu, J.; Sugahara, T.; Wang, J.; Vanfleteren, J.; Sekitani, T.; Suganuma, K. Facile fabrication of stretchable Ag nanowire/polyurethane electrodes using high intensity pulsed light. Nano. Res. 2016, 9, 401–414. [Google Scholar] [CrossRef] [Green Version]
  17. Kwon, H.; Choi, W.; Lee, D.; Lee, Y.; Kwon, J.; Yoo, B.; Grigoropoulos, C.P.; Kim, S. Selective and localized laser annealing effect for high-performance flexible multilayer MoS2 thin-film transistors. Nano Res. 2014, 7, 1137–1145. [Google Scholar] [CrossRef]
  18. Kwon, H.-J.; Jang, J.; Kim, S.; Subramanian, V.; Grigoropoulos, C.P. Electrical characteristics of multilayer MoS2 transistors at real operating temperatures with different ambient conditions. Appl. Phys. Lett. 2014, 105, 152105. [Google Scholar] [CrossRef]
  19. Yeh, P.-C.; Jin, W.; Zaki, N.; Kunstmann, J.; Chenet, D.; Arefe, G.; Sadowski, J.T.; Dadap, J.I.; Sutter, P.; Hone, J. Direct measurement of the tunable electronic structure of bilayer MoS2 by interlayer twist. Nano. Lett. 2016, 16, 953–959. [Google Scholar] [CrossRef]
  20. Py, M.; Haering, R. Structural destabilization induced by lithium intercalation in MoS2 and related compounds. Can. J. Phys. 1983, 61, 76–84. [Google Scholar] [CrossRef]
  21. Di Bartolomeo, A.; Genovese, L.; Giubileo, F.; Iemmo, L.; Luongo, G.; Foller, T.; Schleberger, M. Hysteresis in the transfer characteristics of MoS2 transistors. 2D Mater. 2017, 5, 015014. [Google Scholar] [CrossRef]
  22. Léonard, F.; Talin, A.A. Electrical contacts to one-and two-dimensional nanomaterials. Nat. Nanotech. 2011, 6, 773. [Google Scholar] [CrossRef] [PubMed]
  23. Zhang, J.; Wang, T.; Liu, L.; Du, K.; Liu, W.; Zhu, Z.; Li, M. Molybdenum disulfide and Au ultrasmall nanohybrids as highly active electrocatalysts for hydrogen evolution reaction. J. Mater. Chem. A 2017, 5, 4122–4128. [Google Scholar] [CrossRef]
  24. Eaton, S.M.; Zhang, H.; Herman, P.R.; Yoshino, F.; Shah, L.; Bovatsek, J.; Arai, A.Y. Heat accumulation effects in femtosecond laser-written waveguides with variable repetition rate. Opt. Express 2005, 13, 4708–4716. [Google Scholar] [CrossRef] [PubMed]
  25. Di Bartolomeo, A.; Grillo, A.; Urban, F.; Iemmo, L.; Giubileo, F.; Luongo, G.; Amato, G.; Croin, L.; Sun, L.; Liang, S.J. Asymmetric Schottky Contacts in Bilayer MoS2 Field Effect Transistors. Adv. Funct. Mater. 2018, 1800657. [Google Scholar] [CrossRef]
  26. Xu, Y.; Minari, T.; Tsukagoshi, K.; Chroboczek, J.; Ghibaudo, G. Direct evaluation of low-field mobility and access resistance in pentacene field-effect transistors. J. Appl. Phys. 2010, 107, 114507. [Google Scholar] [CrossRef]
  27. Ghibaudo, G. New method for the extraction of MOSFET parameters. Electron. Lett. 1988, 24, 543–545. [Google Scholar] [CrossRef]
  28. Chang, H.-Y.; Zhu, W.; Akinwande, D. On the mobility and contact resistance evaluation for transistors based on MoS2 or two-dimensional semiconducting atomic crystals. Appl. Phys. Lett. 2014, 104, 113504. [Google Scholar] [CrossRef]
Figure 1. Bottom-gated multilayer MoS2 thin-film transistors (TFTs): (a) conceptual schematic of the structure of MoS2 TFTs; (b) top-view image of the optical microscope image for the finished MoS2 TFTs fabricated by a mechanical exfoliation.
Electronics 08 00222 g001
Figure 2. The ultra-short pulsed laser annealing system: (a) the visualized diagram of the laser annealing process; (b) configuration of optical setup for the picosecond laser system.
Electronics 08 00222 g002
Figure 3. Thermal analysis of transistors during picosecond laser annealing process: (a) temperature distribution by laser annealed heat at sample; (b) the timeline view of all laser annealing process; (c) the overall temperature profile of point 1,2 (point 1 is the top of Au electrode and point 2 is the bottom of Au electrode) as a function of time.
Electronics 08 00222 g003
Figure 4. Electrical properties of MoS2 TFTs by laser annealing process: (a) the energy band diagram of the metal-MoS2 junction at thermal equilibrium condition and the equivalent circuit of them; (b) Ids-Vgs characteristics for a MoS2 transistors on low Vds ( = 0.4 V) in linear scale (solid) and log scale (dot); (c) Ids-Vds characteristics of both sides annealed contacts (solid), one side annealed contact (dash), and before annealing (dot) for MoS2 transistors in linear scale.
Electronics 08 00222 g004
Figure 5. Extracted mobility values from Y function method: (a) Y function values of both sides annealed contacts (red), one side annealed contact (blue), and before annealing (black) with respect to Vgs; (b) comparison of the intrinsic mobility (μ0) and the linear effect mobility (μeff) during each laser process.
Electronics 08 00222 g005

