Article

A Weighted-Sum PSO Algorithm for HEMS: A New Approach for the Design and Diversified Performance Analysis

1
Department of Electrical and Computer Engineering, COMSATS University Islamabad, Islamabad 44000, Pakistan
2
Department of Computer Science, COMSATS University Islamabad, Islamabad 44000, Pakistan
3
Faculty of Information Technology, University of Central Punjab, Lahore 54000, Pakistan
*
Author to whom correspondence should be addressed.
Electronics 2019, 8(2), 180; https://doi.org/10.3390/electronics8020180
Submission received: 2 December 2018 / Revised: 5 January 2019 / Accepted: 21 January 2019 / Published: 4 February 2019
(This article belongs to the Special Issue Renewable Electric Energy Systems)

Abstract

:
This research focuses on a decomposed-weighted-sum particle swarm optimization (DWS-PSO) approach that is proposed for optimal operations of price-driven demand response (PDDR) and PDDR-synergized with the renewable and energy storage dispatch (PDDR-RED) based home energy management systems (HEMSs). The algorithm for PDDR-RED-based HEMS is developed by combining a DWS-PSO-based PDDR scheme for load shifting with the dispatch strategy for the photovoltaic (PV), storage battery (SB), and power grid systems. Shiftable home appliances (SHAs) are modeled for mixed scheduling (MS). The MS includes advanced as well as delayed scheduling (AS/DS) of SHAs to maximize the reduction in the net cost of energy ( C E ). A set of weighting vectors is deployed while implementing algorithms and a multi-objective-optimization (MOO) problem is decomposed into single-objective sub-problems that are optimized simultaneously in a single run. Furthermore, an innovative method to carry out the diversified performance analysis (DPA) of the proposed algorithms is also proposed. The method comprises the construction of a diversified set of test problems (TPs), defining of performance metrics, and computation of the metrics. The TPs are constructed for a set of standardized dynamic pricing signal and for scheduling models for MS and DS. The simulation results show the gradient of the tradeoff line for the reduction in C E and related discomfort for DPA.

1. Introduction

Demand-side management (DSM) has emerged as an efficient method for energy management focusing on the consumer side. A home energy management system (HEMS) is used to implement DSM in a home. The DSM utilizes demand response (DR) programs which are classified as price-driven and incentive-driven. Price-driven DR (PDDR) is the most important DR category that makes use of a control signal for energy management. Utilities offer dynamic pricing signal (DPS) in order to encourage consumers to shift their load towards off-peak hours. The DPSs offered by the renowned utilities in the past few years include time of use pricing (ToUP), real-time pricing (RTP), critical peak pricing (CPP) and inclined block rate ( I B R ) [1,2].
Shifted operations of home appliances (HAs) for dynamic pricing result in a reduced cost of generation for the utility, whereas the consumer benefits from the reduced net cost of energy ( C E ). Numerous algorithms have been developed to solve the problem for PDDR-based HEMS while making use of the aforementioned DPSs [3,4,5,6,7,8,9,10,11,12,13,14]. These algorithms are mainly based on optimization techniques, such as linear programming (LP), mixed integer LP (MILP), and advanced meta-heuristics which have been used to solve HEMS problems for reducing C E , time-based discomfort ( T B D ), and the peak load. Multi-objective optimization (MOO) approaches like weighted sum method (WSM), E-constraint method and Pareto optimization (PO) have been used to handle the HEMS problems. Anees et al. presented an algorithm based on LP for PDDR-based HEMS. The problem for single objective optimization (SOO) has been solved to reduce C E based on delayed scheduling (DS) of shiftable HAs (SHAs). The algorithm has been validated for day-ahead (DA) RTP with I B R [3]. LP-based methods can be used to solve small-scale problems only. The large-scale problems, due to high computational cost, are solved using advanced meta-heuristics. Hussain et al. proposed a non-dominated-sorted genetic algorithm (NSGA) to reduce the values of C E and T B D for 2S-ToUP with I B R . The problem was solved as MOO using PO to provide a diversified set of trade-offs (TOs) for the C E and T B D [5]. Zhao et al. solved a similar problem for DS of SHAs using genetic algorithm (GA) for DA-RTP. The authors applied WSM to handle the MOO problem [6]. Particle swarm optimization (PSO) is a meta-heuristic based on swarm intelligence which has the capability to solve even the most complex and diversified problems. Danish et al. presented a binary PSO algorithm for HEMS for 2S-ToUP. The MOO problem for C E and T B D was solved using WSM as priori [7]. Hussain et al. proposed a PSO algorithm for DS of SHAs in order to minimize the CE. The performance of the algorithm was validated for DA-RTP, 2S-ToUP, and 3S-ToUP combined with I B R [8]. Research on hybrid meta-heuristics has recently been expedited to solve PDDR- based HEMS [9,10,11,12]. The author in [11] modeled the problem for HEMS as MOO and solved it for the C E and a peak-to-average ratio (PAR) using WSM as priori. All of the DPSs except I B R have been used for a diversified performance analysis (DPA).The abbreviations and nomenclature used in paper are given in Table 1 and Table 2, respectively.
Presently, researchers are expediting meta-heuristics like PSO, ant colony optimization (ACO), bacterial foraging optimization (BFO), bat algorithm (BA), gray wolf optimization (GWO) and enhanced differential evolution (EDE) and hybrid meta-heuristic techniques like bat-genetic algorithm (BGA), hybrid gray wolf differential evolution (HGWDE), and bacterial foraging and genetic algorithm (HBG) to solve problems for HEMS. Danish et al. presented a BPSO based algorithm for PDDR- based HEMS for 2S-ToUP. In order to decrease T B D , HAs are bounded for their operations in already assigned windows. To handle MO, OFs for reducing C E and delayed operation of SHAs are combined through WSM [7]. Hussain et al. proposed a PSO algorithm to solve HEMS problem for DS of SHAs. The problem was formulated as SOO to minimize C E . The algorithm was evaluated for DA-RTP, 2S-ToUP and 3S-ToUP schemes combined with I B R [8]. Latif et al. presented HEMS algorithms for GA, BA and a hybrid to solve HEMS problem to reduce C E for 2S-ToUP. SHAs are modeled for DS and are classified as interruptible and non-interruptible [9]. Naz et al. proposed a hybrid meta-heuristic while merging EDE and GWO schemes. The problem for HEMS was formulated for load shifting to reduce C E . The algorithm was evaluated for RTP and CPP [10]. Khalid et al. proposed a hybrid of BFO and GA to solve the HEMS problem for DS of SHAs. To handle MO, OFs for C E and PAR were combined through WSM. The algorithms were evaluated for DA-RTP, ToUP and CPP [11]. Javaid et al. proposed EDE, teacher learning-based optimization (TLBO) and a hybrid of the two techniques. OFs were defined to reduce C E , PAR, and T B D . The algorithms for TLBO, EDE, and the hybrid were evaluated for DA-RTP and CPP [12]. Khan et al. presented a GA-based model for HEMS scheduling. HAs were assigned with time varied priorities for time-based and device-based domains. The HEMS problem is solved for absolute comfort within the user’s allocated budget [13]. In [14], the authors used GA, EDE, BPSO, and optimal stopping rule strategies to reduce the C E and also mitigate rebound peaks created in the off-peak hours.
Furthermore, a rapid increase in the installations of renewable energy sources (RESs) and energy storage systems (ESSs) has motivated the researchers to focus on methods to combine PDDR- based HEMS operations with dispatch schemes and the power grid. In this regard, various algorithms have been proposed for optimal operations of PDDR-RED-based HEMSs [15,16,17,18,19,20,21]. Lujano et al. presented a GA-based scheme for the management of SHAs, electric vehicles (EVs) and the local generation including the photovoltaic (PV) system for a RES- based HEMS. The electricity bill was reduced nearest to the consumer budget. The model was formulated as a constrained problem for the C E [15]. Rasheed et al. presented a GA-based algorithm for an optimal operation of RES-based HEMS for DA-RTP. The HAs are modeled for shifted operations and for thermostatic control, whereas non-SHAs (NSHAs) are dispatched to a dispatchable generator (DG) [16]. Rahim et al. developed heuristic HEMS controllers based on GA, PSO and ACO techniques for a RES- based HEMS. The authors combined the objectives for C E and the T B D using WSM as priori [17]. The power supply from the RES is intermittent by nature; ESSs are integrated with RESs in order to introduce dispatch-ability to the system. Elised et al. proposed a GA- based optimal dispatch scheme for PV system, wind-turbine (WT), ESS, and the grid. The problem for MOO was formulated for the system operating cost constrained for emission [18]. Shakeri et al. proposed an algorithm for optimal operation of HAs using storage battery (SB) and the grid. The RESs are only used to charge the SBs. The problem is formulated to minimize the overall C E . The T B D has been reduced by shifting HAs preferably towards the SB [20]. A few authors have handled the MO making use of Pareto optimality concepts as posteriori. Wang et al. proposed an evolutionary algorithm for Pareto tribe evolution (PTE) with Nash equilibrium-based decision-making. Three objectives, including satisfaction, C E , and PAR are optimized by PTE [21]. Hussain et al. presented an NSGA- based algorithm for an optimal operation of PDDR-RED-based HEMS for 2S-ToUP. A model based on MS of HAs was introduced in order to maximize the usage of the PV energy and shifting of the peak load to increase economy. The PO method was used to generate the optimal TOs for C E and T B D [5].
The handling of MO is a major issue in the present research. Most of the researchers have used WSM as priori to handle the issue. The method solves the problem combining all of the objectives into a single compound function (SCF) while assigning fractional weights as priorities to the constituent objective functions (OFs). Such methods do not provide any feedback to the consumers that may enable to improve their selection of choices. The MO issue can be resolved by achieving a diversified set of TO solutions. A few authors achieved such TO solutions by using PO method combined with the evolutionary algorithms like GA for non-dominated solutions [5]. The techniques like WSM combined with advanced meta-heuristics, however, have rarely been used to achieve such TO solutions as posteriori. Furthermore, most of the algorithms proposed in the recent research have not been tested for their performance for a diversified set of TPs. Moreover, still not much work has been done on the development of the standardized performance metrics that might be used for DPA for algorithms. This research proposes a DWSM-PSO algorithm for MOO for PDDR- and PDDR-RED-based HEMSs. The obtained TO solution helps the consumer in making decisions as per his needs. A method to carry out the DPA for a HEMS algorithm based on the construction of the TPs and the formulation of the performance metrics is also proposed.

Limitations of the Recent Research and Proposed Resolutions

The following limitations were identified while reviewing the recent state-of-the-art work on PDDR- and PDDR-RED-based HEMSs:
(a) A large number of HEMS algorithms in recent research are based on SOO [3,8,9,10,12,15], whereas the real life problems for HEMS are mostly based on MOO with conflicting objectives. In order to handle MO, such problems are desired to be solved for a diverse set of TOs between the objectives. A few authors have introduced a PO method to meta-heuristics algorithms for HEMS to achieve the desired TO solutions [5,21].
(b) MO in the recent research on HEMS has mainly been managed through WSM, which transforms an MOO problem for HEMS into an SOO for an SCF as priori [4,6,7,11,17,19]. This approach does not provide a diversified set of TOs.
(c) Most of the algorithms for HEMS have not been evaluated for a diversified performance for an adequate number of TPs. The algorithms have mostly been tested for a single TP based on a DPS [3,4,5,6,7,8,9,13,14,15,16,17,20,21]. The optimal performance of an algorithm, however, does vary if evaluated for a diversified set of TPs [22]. Some of the algorithms, however, might be competitive for a diversified set of TPs [23]. Furthermore, the recent research does not provide much information regarding the selection of TPs for DPA for HEMS algorithms. Typical realistic TPs for HEMS need to be formalized and used to evaluate the algorithms for DPA.
(d) The recent research does not persuade serious efforts for defining the performance metrics for DPA for HEMS algorithms.
In order to address the limitations at (a) and (b), a decomposed weighted-sum (DWS) method is proposed as an alternative to PO in order to solve MOO problems for HEMS for the TO solutions. In this approach, all of the OFs are aggregated into a SCF while assigning a weighted coefficient to each of the OF, known as the weight vector. By deploying a set of such vectors, MOO is decomposed into a number of SO sub-problems that can be optimized simultaneously in a single run [23].
In order to address the limitation at (c), a method for developing a diverse set of TPs for HEMS algorithms is proposed. The method takes the formulation of C E and a vital metric to evaluate HEMS performance. The OF for the C E is a linear function made up of the product of a two-row vector, each of dimensions 1 × N, comprising: (i) DEP, for the price of energy and (ii) Psch, having the sum of the energy consumed by HAs in the respective slots. The value for C E thus depends on the coefficient vector DEP and the scheduling vector Psch. TPs with varied values of the constituent vectors of C E (DEP and Psch) have been determined as a rationale for the selection of a diversified set of TPs as follows:
  • Selection of a diversified set of pricing schemes for DEP is hereby proposed as the first feature for developing TPs for a HEMS algorithm.
  • The vector Psch can be varied by changing the bounds ( S T s l t and E N s l t ) laid down for the operating limits of SHAs. Such a variation in the bounds can be achieved by changing the scheduling mode of SHAs from DS to MS and vice versa and is proposed as the second feature for the construction of TPs for HEMS.
  • Moreover, the value of the C E decreases with increasing number of slots in a scheduling horizon. TPs with varying numbers of slots in a scheduling horizon can be another feature to construct the TPs for HEMS.
In order to address the issue raised in (d), a set of metrics to quantify the performance of HEMS algorithms for MOO has also been proposed. C E and T B D are the two most important objectives for HEMS in a consumer’s perspective that are mutually conflicting. The following performance metrics are thus proposed for the evaluation of an algorithm for MOO-based HEMS for its quality for TO solutions: (i) the maximum reduction in the C E / C E n e t and (ii) the gradient of the trend line for the curve between the C E / C E n e t and T B D .
This research introduces DWS-PSO algorithms for optimal operations of PDDR- and PDDR- RED-based HEMSs. The algorithms have been developed to handle MO and are based on TO solutions for posteriori. The proposed algorithm for PDDR-RED-based HEMS is developed by combining a DWS-PSO-based PDDR scheme for load shifting with a dispatch strategy for the photovoltaic system, the SB and the grid. A diversified set of TPs for DPSs for 2S-ToU, 3S-ToU, RTP, CPP and I B R and HEMS models for MS and DS are also proposed. Simulations for HEMSs have been carried out to compute the TO solutions for the proposed TPs and to generate the performance metrics. The DPA is performed based on the results of the simulations.
The work presented in the remaining sections is arranged as follows. The system model is presented in Section 2. Section 3 deals with the formulations for PDDR- and PDDR-RED-based problems for HEMS and the advanced techniques to solve such problems. The algorithms, proposed for PDDR- and PDDR-RED-based HEMSs are elaborated in Section 4. Simulations to validate the algorithms for the PDDR- and PDDR-RED-based HEMS are presented in Section 5. This section also includes a DPA of the algorithms for a diversified set of TPs. The conclusions of the present research and future plans are discussed in Section 6.

2. System Model

The components of HEMS are shown in Figure 1, including HAs, RESs, an ESS, a HEMS controller, a local communication network, a smart meter for the exchange of information between the consumer and the utility for energy pricing, and the consumer’s electricity profile. In PDDR-based HEMS, the operations of HAs are shifted in time for a specified DPS in order to minimize the peak demand for the utility and the cost of energy for the consumer, whereas, in PDDR-RED-based HEMS, the shifted operations of SHAs are integrated with the dispatch scheme for renewable energy sources, ESSs, and the grid in order to reduce peak as well as overall demand and C E n e t for the utility and the consumer, respectively. While minimizing the C E / C E n e t for the consumers, T B D should remain within acceptable limits. HEMS operation has been modeled for a time horizon of 24 h length. HAs are supposed to be operated for specified lengths of operational time (LOOT) vector within the proposed time intervals (as per the vectors S T s l t and E N s l t ) as given in Section 3. The dispatch model for the power sources is based on the operation of the PV unit, the SB system, and the power grid in parallel based on the availability of the PV energy, and vector of states of charge (SOCG) and the limiting values of charge/discharge rates for the SB. The PV units are modeled as the preferred source of energy to supply the scheduled loads. The un-used PV energy is preferably stored in the SB that is used to supply the load during high pricing time to reduce C E n e t . The excess energy, in case of a fully charged storage unit, is transmitted for monetary benefits. The strategy for scheduling of HAs and the dispatch protocols for the local resources is taken from [5] where a MOGA-based algorithm was used to implement the strategy. This research makes use of DWS-PSO-based algorithms to implement the strategies for optimal operations of PDDR- and PDDR-RED-based HEMS. The proposed algorithms, as detailed in Section 5, are designed to handle MO and are based on the TO solutions. A procedure for DPA based on the construction of a diversified set of TPs and the performance metrics has also been proposed and the developed algorithms have been validated for DPA accordingly.

2.1. HAs

The HAs are classified into NSHAs and SHAs [5,10]. The NSHAs comprised of electric lamps, fans, etc., are assumed to work when required and they cannot opt for scheduling. The forecasted load for NSHAs used in the simulation section is presented in Figure 2. The SHAs are supposed to be scheduled towards the off-peak hours and the PV energy harnessing hours for optimized HEMS operation. In order to maximize the reduction in the cost of energy, SHAs are modeled as AS and DS. MS (a combination of AS and DS)- based model for SHAs enables more reduction in the cost of energy making use of an enhanced flexibility in the price-driven shifting of HAs and an increased direct usage of the PV energy from the PV unit. Technical specifications along with the consumer’s defined settings for the accomplishment of the required operations of AS and DS type SHAs used in the simulation section are described in Table 3 [5]. The T B D to be borne by the consumer due to the AS, DS and MS of SHAs has been discussed in Section 3 in detail.

2.2. DPSs

Dynamic prices are the key to implementing PDDR as well as PDDR-RED-based HEMSs. They are introduced to motivate consumers to modify their energy consumption profiles. Such modifications in the consumption profiles enable reducing the peak demand, the overall demand as well as the greenhouse gas (GHG)-emissions for the utility. The types of DPSs include DA-RTP, ToUP, and CPP that are discussed next.

2.2.1. ToUP

The ToUP schemes are based on predefined price values. The price pattern is maintained typically for a period of 3 to 6 months. New prices are proposed on the yearly based operational cost and long-term investments of the utilities.
ToUP schemes are offered for a specified period of time and are based on different electricity rates for peak, mid-peak and off-peak times. The 2S-ToUP and 3S-ToUP schemes are adopted from the national transmission and distribution company in Lahore, Pakistan and a Baltimore gas and electric company, MD, USA has been shown in Figure 3 and Figure 4 [8]. The algorithms for HEMS are designed for shifting of SHAs from the on-peak hours to the off-peak hours based price signal received from the utility.

2.2.2. DA-RTP

In the DA-RTP scheme, the electricity price varies on an hourly basis. In such schemes, the price signal is typically communicated on a 24 h ahead basis. This helps and motivates the consumer to participate in the PDDR programme. RTP enables utility companies to better distribute the price of electricity reflecting the demand-supply elastics. The nature of the scheme characterized by a diversified price elasticity ought to motivate the consumer to adjust their demand more precisely [1]. The DA-RTP scheme adopted from the Ameren Illinois Power Company (AIPC), IL, USA, is shown in Figure 5 [6].

2.2.3. CPP

The CPP is an event-based scheme. To manage the energy in an event, a control signal for extra high electricity prices is communicated to affect electricity demand during critical peak hours. The scheme can also be imposed if the system is expected to be severely constrained due to the extremely cold/warm period for a limited number of hours. The consumers can participate in CPP based PDDR programme for very high incentives for reducing the C E n e t by either reducing their peak demands or shifting energy consumption towards off-peak times. CPP-based PDDR program is event based and not a daily based DR program.
Furthermore, CPP values are always higher than the corresponding ToUP values. A CPP scheme based on the proposed scheme for 2S-ToUP with the critical peak price double that of the daily peak time price has been shown in Figure 6 [1]. The aforementioned scheme for CPP, based on the criteria adopted by the San Diego gas and electric company, CA, USA, which has been used in the simulation section.

2.2.4. I B R

At high levels of demands, the aforementioned standardized DPSs are introduced with higher rates of electricity, called I B R . Such schemes are introduced in order to discourage the consumers from over-shifting of the loads towards the off-peak hours. The scheme enables avoiding the re-emergence of peaks that may appear as a result of PDDR- based scheduling. A DPS with the related I B R vector is computed as follows:
D E P = [ ( D E P 1 , P T 1 , I B R 1 ) , , ( D E P n , P T n , I B R n ) ] ,
where D E P 1 , D E P 2 to D E P n are the normal energy prices during the nth time slots. Further D E P n × I B R n pricing schemes are applied with the power threshold levels of P T 1 , P T 2 to P T n in the respective time slots.
An I B R value of 1.4 as opted by British Columbia Hydro has been adopted in the proposed models for DPSs. I B R factor beyond a power threshold of 2.4 kW (0.4 kWh/slot) has been applied while simulating the model for various DPSs [5].

2.3. RESs

Solar PV units are one of the most widely used types of RESs at homes. The proposed model for HEMS operation is included with the PV unit based on the forecasted value of solar irradiations. The power obtained from the PV unit is formulated as follows [24]:
P p v = A p l a t e × P i r r a d × ξ p v × ξ c o n v ,
where
  • P p v = PV power in kWh,
  • A p l a t e = PV plate area in m2,
  • P i r r a d = PV irradiation in kWh/m2,
  • ξ p v = PV electrical efficiency,
  • ξ c o n v = Converter efficiency.
The data for solar irradiations measured by the Pakistan Engineering Council in Islamabad is applied for the simulated operations of PDDR-RED-based HEMS.The parameter details are provided in Table 4. The profile of electrical power harnessed from the PV unit is displayed in Figure 7. The cost of electricity generation from the local PV unit has not been included in the model.

2.4. SBs

SBs are introduced into the PV-based HEMSs in order to introduce flexibility in the dispatch of the PV energy. The surplus PV energy is stored in the SB that can be used to supply the load during peak hours to minimize the C E . Technical specifications of the PV unit, the SB and the inverter that were used in the simulations are given in Table 4.

3. Formulating the HEMS Optimization Problem

The energy management problem is formulated for specified objective under a set of constraints. The problem is solved for a set of input variables that can provide the optimal values of the desired objectives. The formulation is founded on the scheduled load profile based on the following control parameters:
  • B = [ b 1 , b 2 , , b k ] ,
  • T = [ 1 , 2 , 3 , , N ] ,
  • P a p p = [ P 1 , P 2 , , P k ] ,
  • L O O T = [ L O O T 1 , L O O T 2 , , L O O T k ] ,
  • S T s l t = [ S T s l t 1 , S T s l t 2 , , S T s l t k ] ,
  • E N s l t = [ E N s l t 1 , E N s l t 2 , , E N s l t k ] ,
  • D E P = [ D E P 1 , D E P 2 , , D E P N ] ,
  • I B R = [ I B R 1 , I B R 2 , , I B R N ] ,
  • T s t = [ T s t 1 , T s t 2 , , T s t k ] .
The formulation for the scheduled load is based on the input vector for T s t . In the proposed algorithms, the specified vector is generated through PSO. A decision vector P a (dim: 1 × N ), based on the generated T s t , is derived for the scheduled power profile of the bth shiftable home appliance, as follows:
P b ( i ) = P a p p ( b ) : f o r T s t ( b ) + L O O T ( b ) > i T s t ( b ) , 0 : f o r T s t ( b ) > i T s t ( b ) + L O O T ( b ) .
Similarly, vectors P 1 , , P k are developed for each of the SHA, based on the respective value of T s t ( b ) for the SHA, numbered as B = 1 , 2 , , k .
The decision vectors P 1 , , P k are joined into a matrix called as P o w e r _ m a t r i x as given below:
P o w e r _ m a t r i x = [ P 1 , P 2 , , P k ] t .
P o w e r _ m a t r i x is summed up column-wise to develop a scheduling vector P s c h _ s h . The developed vector specifies the power requirement for each of the slot in the scheduling horizon. The power scheduling vector for the HEMS problem is thus formulated as follows:
P s c h _ s h = n = 1 N b = 1 k P ( b , n ) ,
where P ( b , n ) is a generalized element of the derived P o w e r _ m a t r i x . The final scheduled load vector, P s c h is then developed by adding the load vector for NSHAs, P l o a d _ n s h , to the vector P s c h _ s h as follows:
P s c h = P s c h _ s h + P l o a d _ n s h .

3.1. Objectives for Optimal HEMS Operation

The major objectives for HEMS include minimizing the C E to be supplied from the grid, minimizing the discomfort borne by the consumer, and reducing the peak load. These objectives are discussed next.

3.1.1. Minimization of C E

The OF for minimizing the C E for a PDDR- based HEMS is formulated as follows:
M i n i m i z e n = 1 N ( P s c h × D E P ) ,
where D E P and P s c h are the pricing vector and the load scheduling computed through Equations (1) and (5), respectively. For DR-RED-based HEMSs Pgd is computed using Algorithm 2 as follows:
P g d = P s c h P p v + P s o l d + P c h P d s .
In this case, the OF for minimizing the C E n e t is formulated as follows:
M i n i m i z e n = 1 N ( P g d × D E P P s o l d × D E P f ) ,
where P g d and P s o l d are the vectors denoting the purchased/sold energies from/to the utility, and D E P and D E P f are the respective vectors for the pricing. We have assumed a value of D E P f equal to 0.7 × D E P in the simulations section.

3.1.2. Minimization of T B D

For DS-type SHAs, the average T B D due to the delayed starting of SHAs, denoted by T B D ( D ) , is formulated as follows:
T B D ( D ) = b = 1 k 1 ( ( T s t S T s l t ) / ( E N s l t L O O T S T s l t + 1 ) ) / k 1 ,
where k 1 is the number of SHAs chosen for DS.
Furthermore, T B D ( D ) assumed a minimum value of 0 when the SHAs started their operations at S T s l t . The parameter achieved a maximum value of 1 when the SHAs started their operations at E N s l t ( b ) L O O T ( b ) + 1 . These limits must be followed while computing the vector T s t and are formulated below:
L b = S T s l t a n d U b = E N s l t L O O T + 1 .
For AS-type SHAs, the average T B D due to the advanced completion of the jobs, designated as T B D ( A ) , is computed as follows:
T B D ( A ) = b = 1 k 2 ( ( E N s l t T s t L O O T + 1 ) / ( E N s l t L O O T S T s l t + 1 ) ) / k 2 ,
where k 2 is the number of SHAs chosen for AS. The T B D ( A ) assumes a minimum value of 0 when all of the SHAs complete their jobs at their proposed job ending time in E N s l t ( b ) , and will achieve a maximum value of 1 when T s t ( b ) equals S T s l t ( b ) . In MS, some of the SHAs are selected for AS, whereas the others for DS. In this mode, the average value of T B D for a total number of k SHAs, designated as T B D ( M ) , is expressed as follows [5]:
T B D ( M ) = T B D ( D ) + T B D ( A ) .

3.1.3. Minimization of Peak

The objective to minimize the peak load fed from the grid is computed as follows:
M i n i m i z e P e a k ( P g d ) .

3.2. Constraints

The constraints were applied for HAs, pricing schemes, SB, and the energy balance as per our previous research designed for MOGA [5].

3.3. Meta-Heuristic Techniques to Solve Energy Management Problems

Over the past few years, meta-heuristics tools have been used very successfully for obtaining robust solutions to complex HEMS optimization problems. The renowned meta-heuristics include GA, PSO, ACO, and evolutionary programming [5]. In this study, we have introduced PSO to reach the optimal solutions to PDDR- and PDDR-RED-based HEMSs. The technique uses swarm behavior of the birds known as swarm intelligence. PSO is simple, faster in convergence and has an ability to quickly search in extra large search spaces. The technique is capable of solving a diversified set of complex optimization problems very quickly. At the start, the algorithm generates a population of solutions called as particles that move towards the best position in the search space with random velocities. Each particle remembers his own best and global (swarm’s) best positions (Pbest and Gbest) and moves with jth particle velocity (in ith iteration) formulated as follows:
V j ( i ) = V j ( i 1 ) + c l r × r a n 1 × [ P b e s t X j ( i 1 ) ] + s l r × r a n 2 × [ G b e s t X j ( i 1 ) ] ,
where
  • j = 1 , 2 , , N ,
  • c l r = cognitive learning rate,
  • s l r = social learning rate,
  • r a n 1 and r a n 2 are uniformly distributed random numbers.
A new position of jth particle is found as:
X j ( i ) = X j ( i 1 ) + V j ( i ) ,
where
  • j = 1 , 2 , , N .
Each of the particles correspond to the values of decision variables that are related to the values of OFs as F 1 ( X 1 ( i ) ) , F 2 ( X 2 ( i ) ) , , F N ( X N ( i ) ) . The method is said to be converged if positions of all particles converge to the same set of values, otherwise more iterations are carried out [25,26].

3.4. Handling of Multi-Objectivity in Energy Managment Problems

Most of the problems for HEMS in real life are MOO with mutually conflicting objectives. The main objective in the recent research is minimizing the C E [3,4,5,6,7,8,9,10,11,12,16,17,18,19,20,21], whereas, minimizing T B D is the second most important objective [5,6,7,16,17,19,20] from the consumer’s perspective. A TO exists between the reduction in C E and the T B D that makes home energy management problems interesting to the issue of MO. The following methods, in recent research, have been used to handle MO: PO [5,21], E-constraint [13,14,15], and WSM [4,6,7,11,17,19]. Algorithms for MOO based on PO, like NSGA, have been used to compute a Pareto-optimal set (POS) containing non-dominated TO solutions for the specified objectives. The method provides a diverse set of TOs between the objectives for C E and T B D that helps consumers making decisions as per their needs. In recent research, PO has been the one and only method used for TO solutions as posteriori. An e-constraint method was introduced by Haimes et. al. in 1971. In this method, just one OF is kept while the rest of the OFs are transformed into constraints within the user-specified values. The vector for the constrained values has to be chosen very carefully so that it remains within minimum/maximum limits of the constrained OFs. The method was used by Khan et al. to compute the value of the discomfort using the value of the consumer budget as constraint [13]. Algorithms based on WSM solve MOO problems while transforming all of the OFs into a SCF using respective weights for individual OFs. The SCF mentioned for WSM is formulated as follows [27]:
M i n i m i z e S C F ( X ) = m = 1 M W m F m ( X ) ,
where m = 1 k W m = 1 .
The method is characterized by the assigning of fractional weights to the constituent OFs in order to reflect their priorities while computing the SCF. The method has mostly been used as priori. Use of WSM with a posteriori approach, as an alternate to PO, has been focused on in this research for its application to HEMS. Moreover, WSM can be combined with population-based meta-heuristic like PSO for posteriori in order to achieve the TO solutions. In a decomposition approach for WS-PSO, a set of weighting vectors is deployed, and an MOO is decomposed into a number of SO sub-problems that are optimized simultaneously in a single run. The solution obtained through decomposition WS-PSO based algorithm provides a set of TOs that helps consumers to make decisions after evaluating a diverse set of choices.

4. Algorithms for a PDDR- and PDDR-RED-Based HEMSs Using DWS-PSO

The following algorithms have been proposed:
  • —Algorithm 1 for a PDDR-based HEMS using DWS-PSO
  • —Algorithm 2 for a PDDR-RED-based HEMS using DWS-PSO
The algorithms are presented in the following subsections.
Algorithm 1 Algorithm for a PDDR-based HEMS using DWS-PSO.
Electronics 08 00180 i001

4.1. Algorithm 1 for a PDDR-Based HEMS Using DWS-PSO

The algorithm computes a set of solution that provides optimal TOs for C E and T B D for PDDR- based scheduling of SHAs using PSO. For optimal scheduling, T s t is heuristically generated based on the specified bounds using PSO. The computations for Psch, C E , and, T B D mentioned on line numbers 10–34 are taken from [5]. The value of S C F is then computed for the OFs for C E and T B D and the relative weights to be allocated to each of the OF. This important computation is presented on line 35. The TO solutions for C E n e t and T B D achieved using DWS-PSO are mentioned on line 38.
Algorithm 2 Algorithm for a PDDR-RED-based HEMS using DWS-PSO.
Electronics 08 00180 i002

4.2. Algorithm 2 for a PDDR-RED-Based HEMS Using DWS-PSO

This algorithm provides a set of solutions for optimal TOs between C E n e t and T B D for PDDR-RED-based HEMS operations using DWS-PSO. The algorithm combines the scheduling of SHAs with the dispatch scheme of the PV system, the storage unit, and the power grid. For optimal scheduling, T s t is generated using PSO based on the specified bounds. The computations for Psch; dispatch scheme for PV units, SB, and the power grid; DEP combined with I B R ; CE, and T B D as given on line numbers 10–44 are taken from [5]. The S C F is computed while making use of the values of OFs for C E , T B D , and the relative weights allocated to each of the OF. This important computation is presented on line 45. The TO solutions for C E n e t and T B D achieved using DWS-PSO is mentioned on line 48.

5. Simulations for PDDR- and PDDR-RED-Based HEMS Using DWS-PSO

The simulations reported in this section were carried out to validate the performance of DWS-PSO based algorithm for optimal operations of PDDR- and PDDR-RED-based HEMSs. In order to achieve the TO solutions, WSM was combined with the PSO. The S C F for DWS-PSO-based algorithm has been computed using Equation (16). The S C F combines the OFs for the C E ( C E n e t ) and the T B D through relative weights that impart priorities to the respective objectives. The simulation was carried out for a set of a critical pair of weights for C E and the T B D as follows:
W T V = [ ( 1 , 0 ) , ( 0 , 1 ) ] ,
where W T V is a vector comprising pairs of weights to compute the required S C F to implement DWS-PSO. The first pair of weights provides the solution with the minimal value of C E n e t based on optimal scheduling of SHAs, whereas the second pair provides the solution with the minimal value of T B D . To evaluate the algorithm’s performance, a set comprising eight number of TPs is designated. Four TPs are based on the diversified DPS implemented in various parts of the world. DPS including 2S-ToUP, 3S-ToUP, DA-RTP, and CPP are selected for implementation. In order to avoid the re-emergence of the peak load, each of the DPS has been combined with I B R . A factor of 1.4 has been applied as I B R for an energy consumption of above 0.4 kW/slot. The remaining four TPs in the set are based on the modeling of SHAs for DS or MS. Problems based on any one of these approaches differ from their counterparts in the bounds laid down for the operation of SHAs. Taking the aforementioned bases into the account, the following set of TPs was proposed for the DPA of DWS-PSO-based algorithms for PDDR- as well as PDDR-RED-based HEMS:
  • —A 2S-ToUP scheme (with DS),
  • —A 2S-ToUP scheme (with MS),
  • —A 3S-ToUP scheme (with DS),
  • —A 3S-ToUP scheme (with MS),
  • —A DA-RTP scheme (with DS),
  • —A DA-RTP scheme (with MS),
  • —A CPP scheme (with DS),
  • —A CPP scheme (with MS).
Detailed specifications for the SHAs, PV system, SB and inverter used to implement the algorithms for simulated operations of PDDR- and PDDR-RED-based HEMSs are given in Table 3 and Table 4.
The hardware and software used for the simulations include the following:
  • Machine: Core i7-4790 CPU @3.6 GHz with 16 GB of RAM,
  • Platform: MATLAB 2015a software tool,
  • Optimization tool: Particle swarm optimization,
  • Swarm size: 140,
  • Maximum iterations: 2800,
  • Inertia range: 0.1–1.1.

5.1. Simulations for PDDR-Based HEMS Using DWS-PSO

The performance of the algorithm is analyzed for the TO solutions for C E and the T B D based on DWS-PSO. The S C F for WSM is achieved by combining the OFs of C E and T B D through the relative weights. In order to minimize the parameter for the C E a pair of weights of value (1, 0) was adopted reflecting a maximum priority on the reduction in C E , whereas, in order to minimize the value of T B D , a pair of weights of value (0, 1) was adopted that reflects a maximum priority to the reduction in T B D .
Simulations were carried out for DPA of DWS-PSO algorithm for PDDR-based HEMS. The algorithm was tested for a set of TPs for HEMS based on 2S-ToUP (DS/MS), CPP (DS/MS), 3S-ToUP (DS/MS) and DA-RTP (DS/MS) for the TOs for C E and T B D .
The percentage reduction in C E based on the optimal HEMS operations is computed as follows:
% R C E H E M S = ( C E b a s e C E ) / ( C E b a s e ) ,
where C E b a s e is the base value of the C E for the unscheduled load scenario. A formulation similar to Equation (
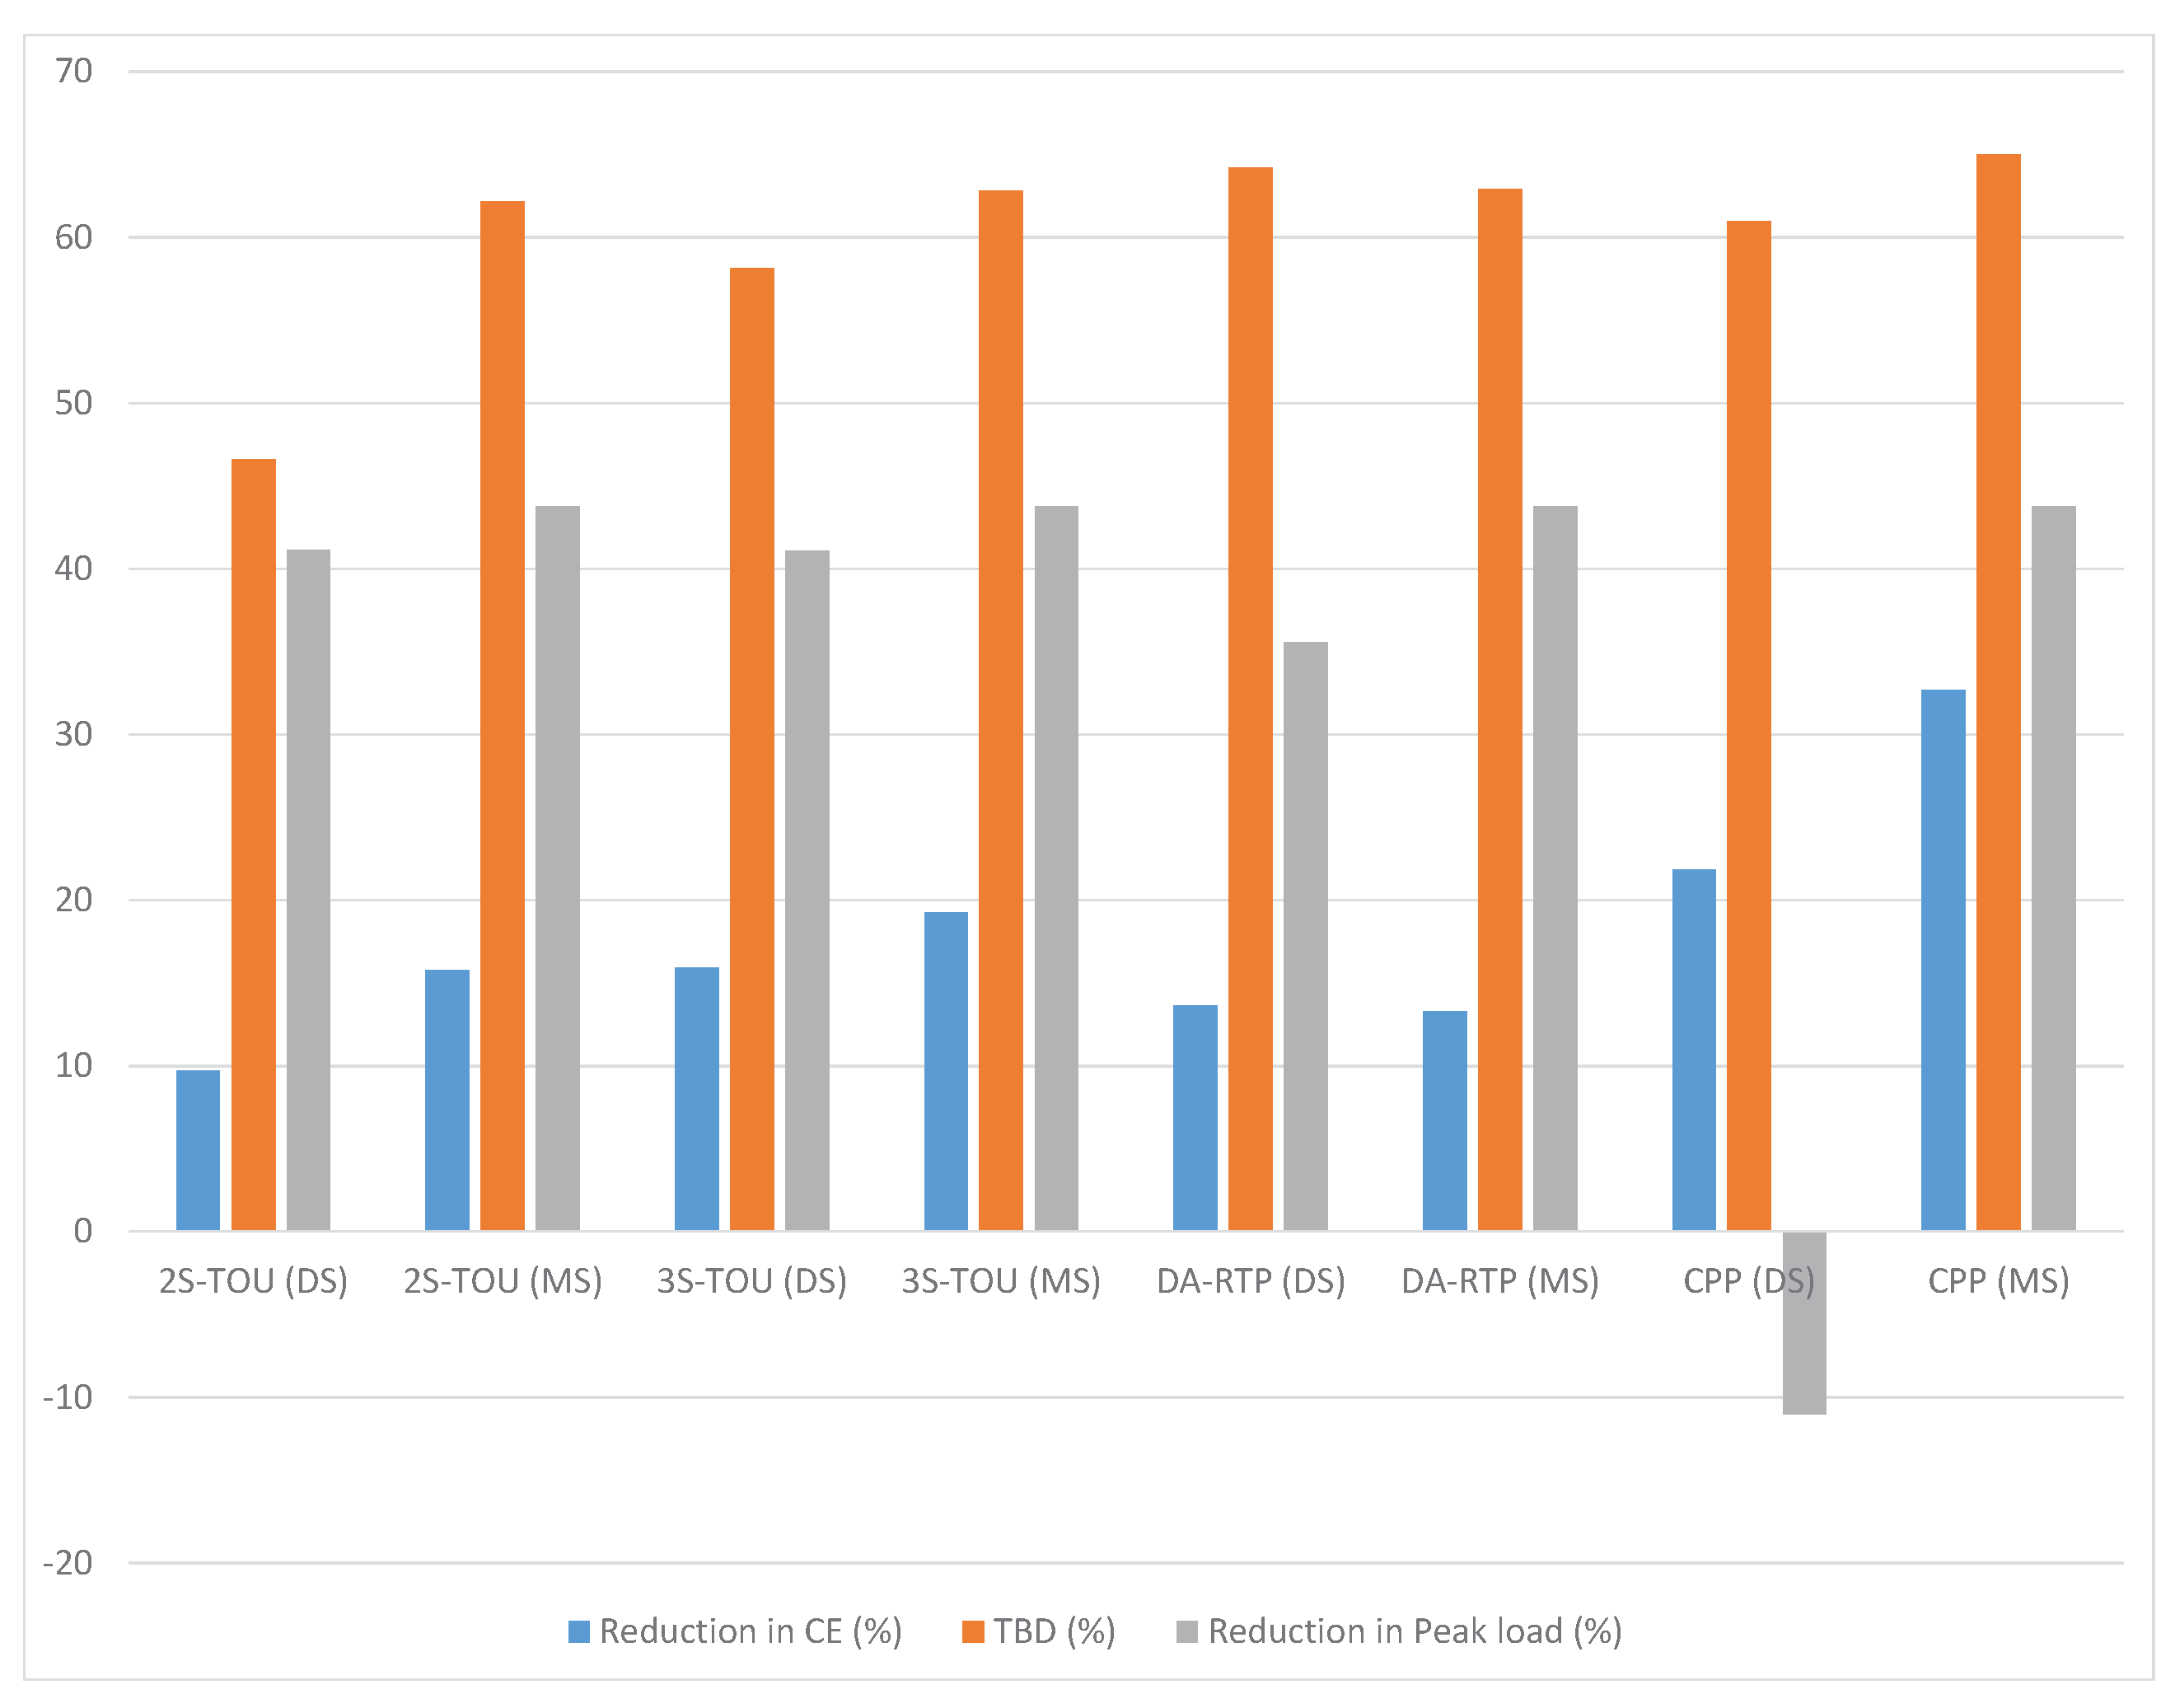
18) has also been adopted to compute percentage reduction in Peak as well. The mentioned values for each of the DPSs are presented in Table 5. The maximum reductions in C E along with the related T B D for PDDR-based HEMS using DWS-PSO with values of weights as (1, 0) are shown in Figure 8. The simulation results of the proposed algorithm for the designated set of TPs are summarized in Table 5. The table furnishes the achieved performance parameters for the maximal reductions in the C E , the related values of T B D , and the peak load for the complete set of TPs.
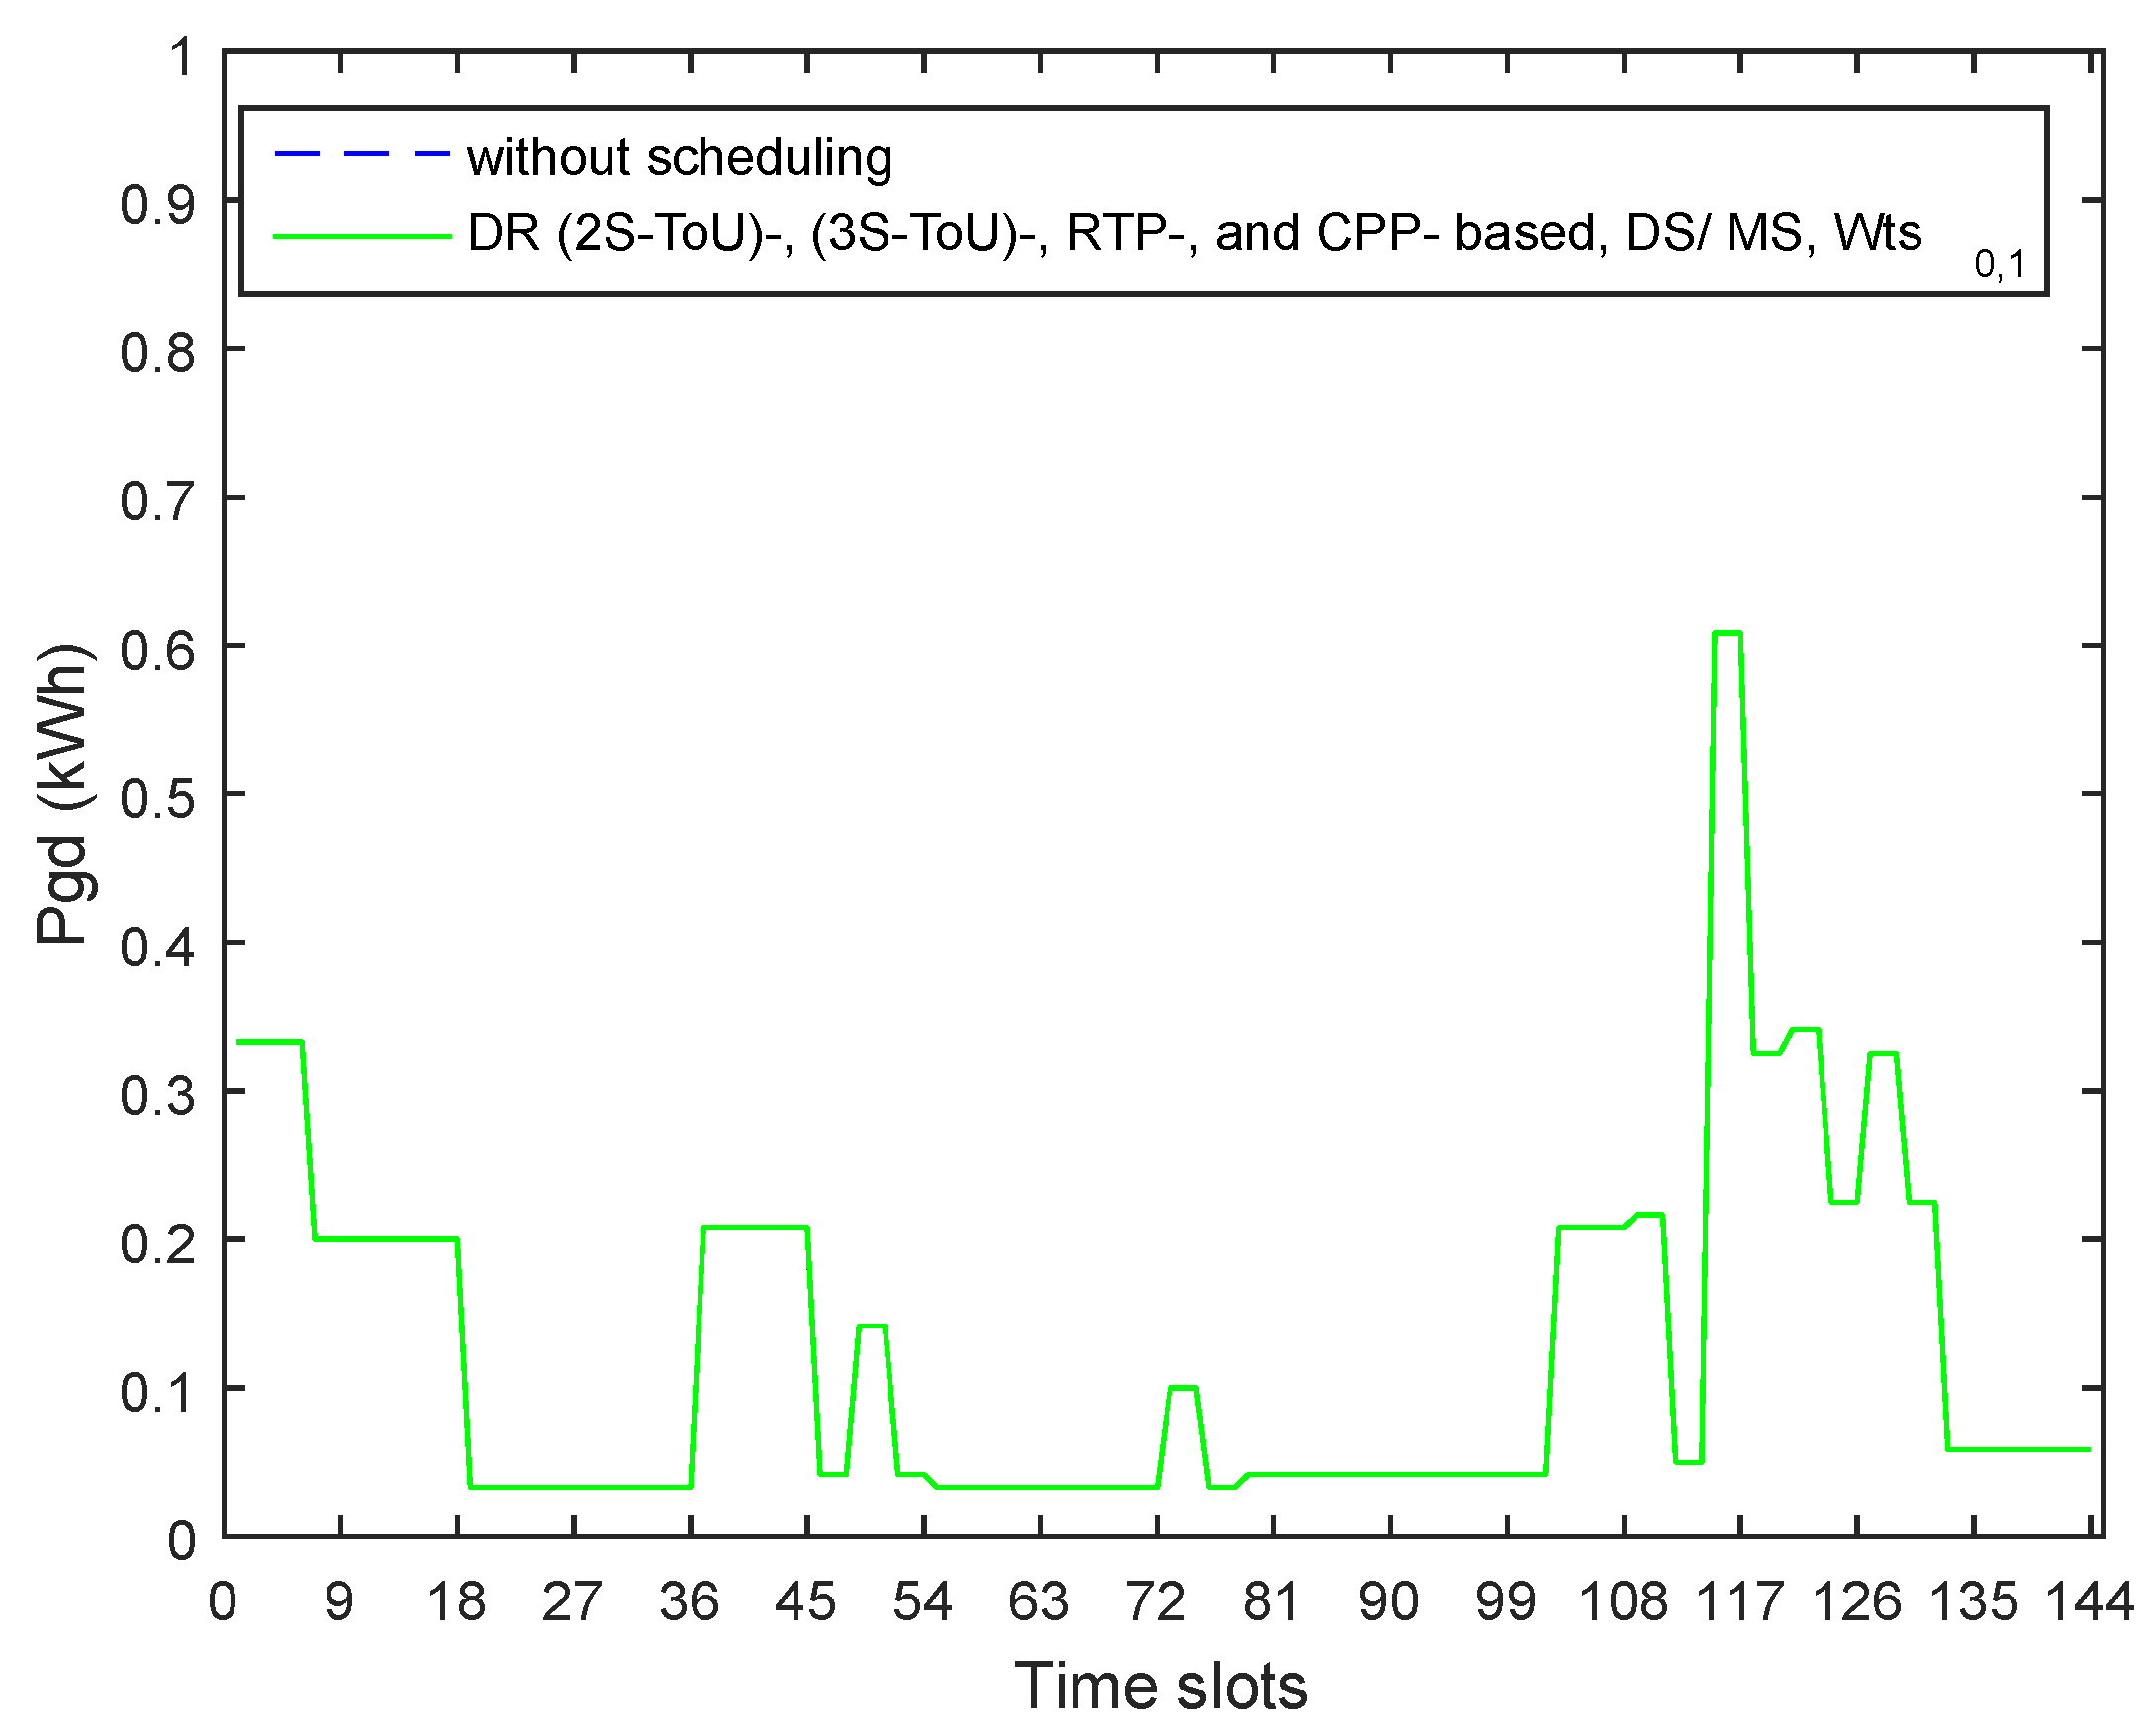
The minimal values of T B D were achieved while selecting the value of weight (0, 1) for DWS-PSO. The algorithm minimized the value of T B D to zero and accordingly all of the loads were operated as per the preferred starting times ( S T s l t ) and ending times ( E N s l t ) of HAs for DS and AS based models, respectively. Under this scenario, percentage reductions in C E , peak load, and T B D remained zero.

5.2. Simulation Results Discussion for PDDR-Based HEMS

The performance of the algorithm for reductions in C E , the related values of T B D , and Peak achieved for different TPS were analyzed while comparing the profile of the load before scheduling with the optimally scheduled profile achieved after the application of the algorithm. The performance of the algorithm for achieving the maximum reductions in C E through optimal scheduling was based on shifting of the load from the peak time (with higher electricity price ( E P ) towards the off-peak (with lower EP).
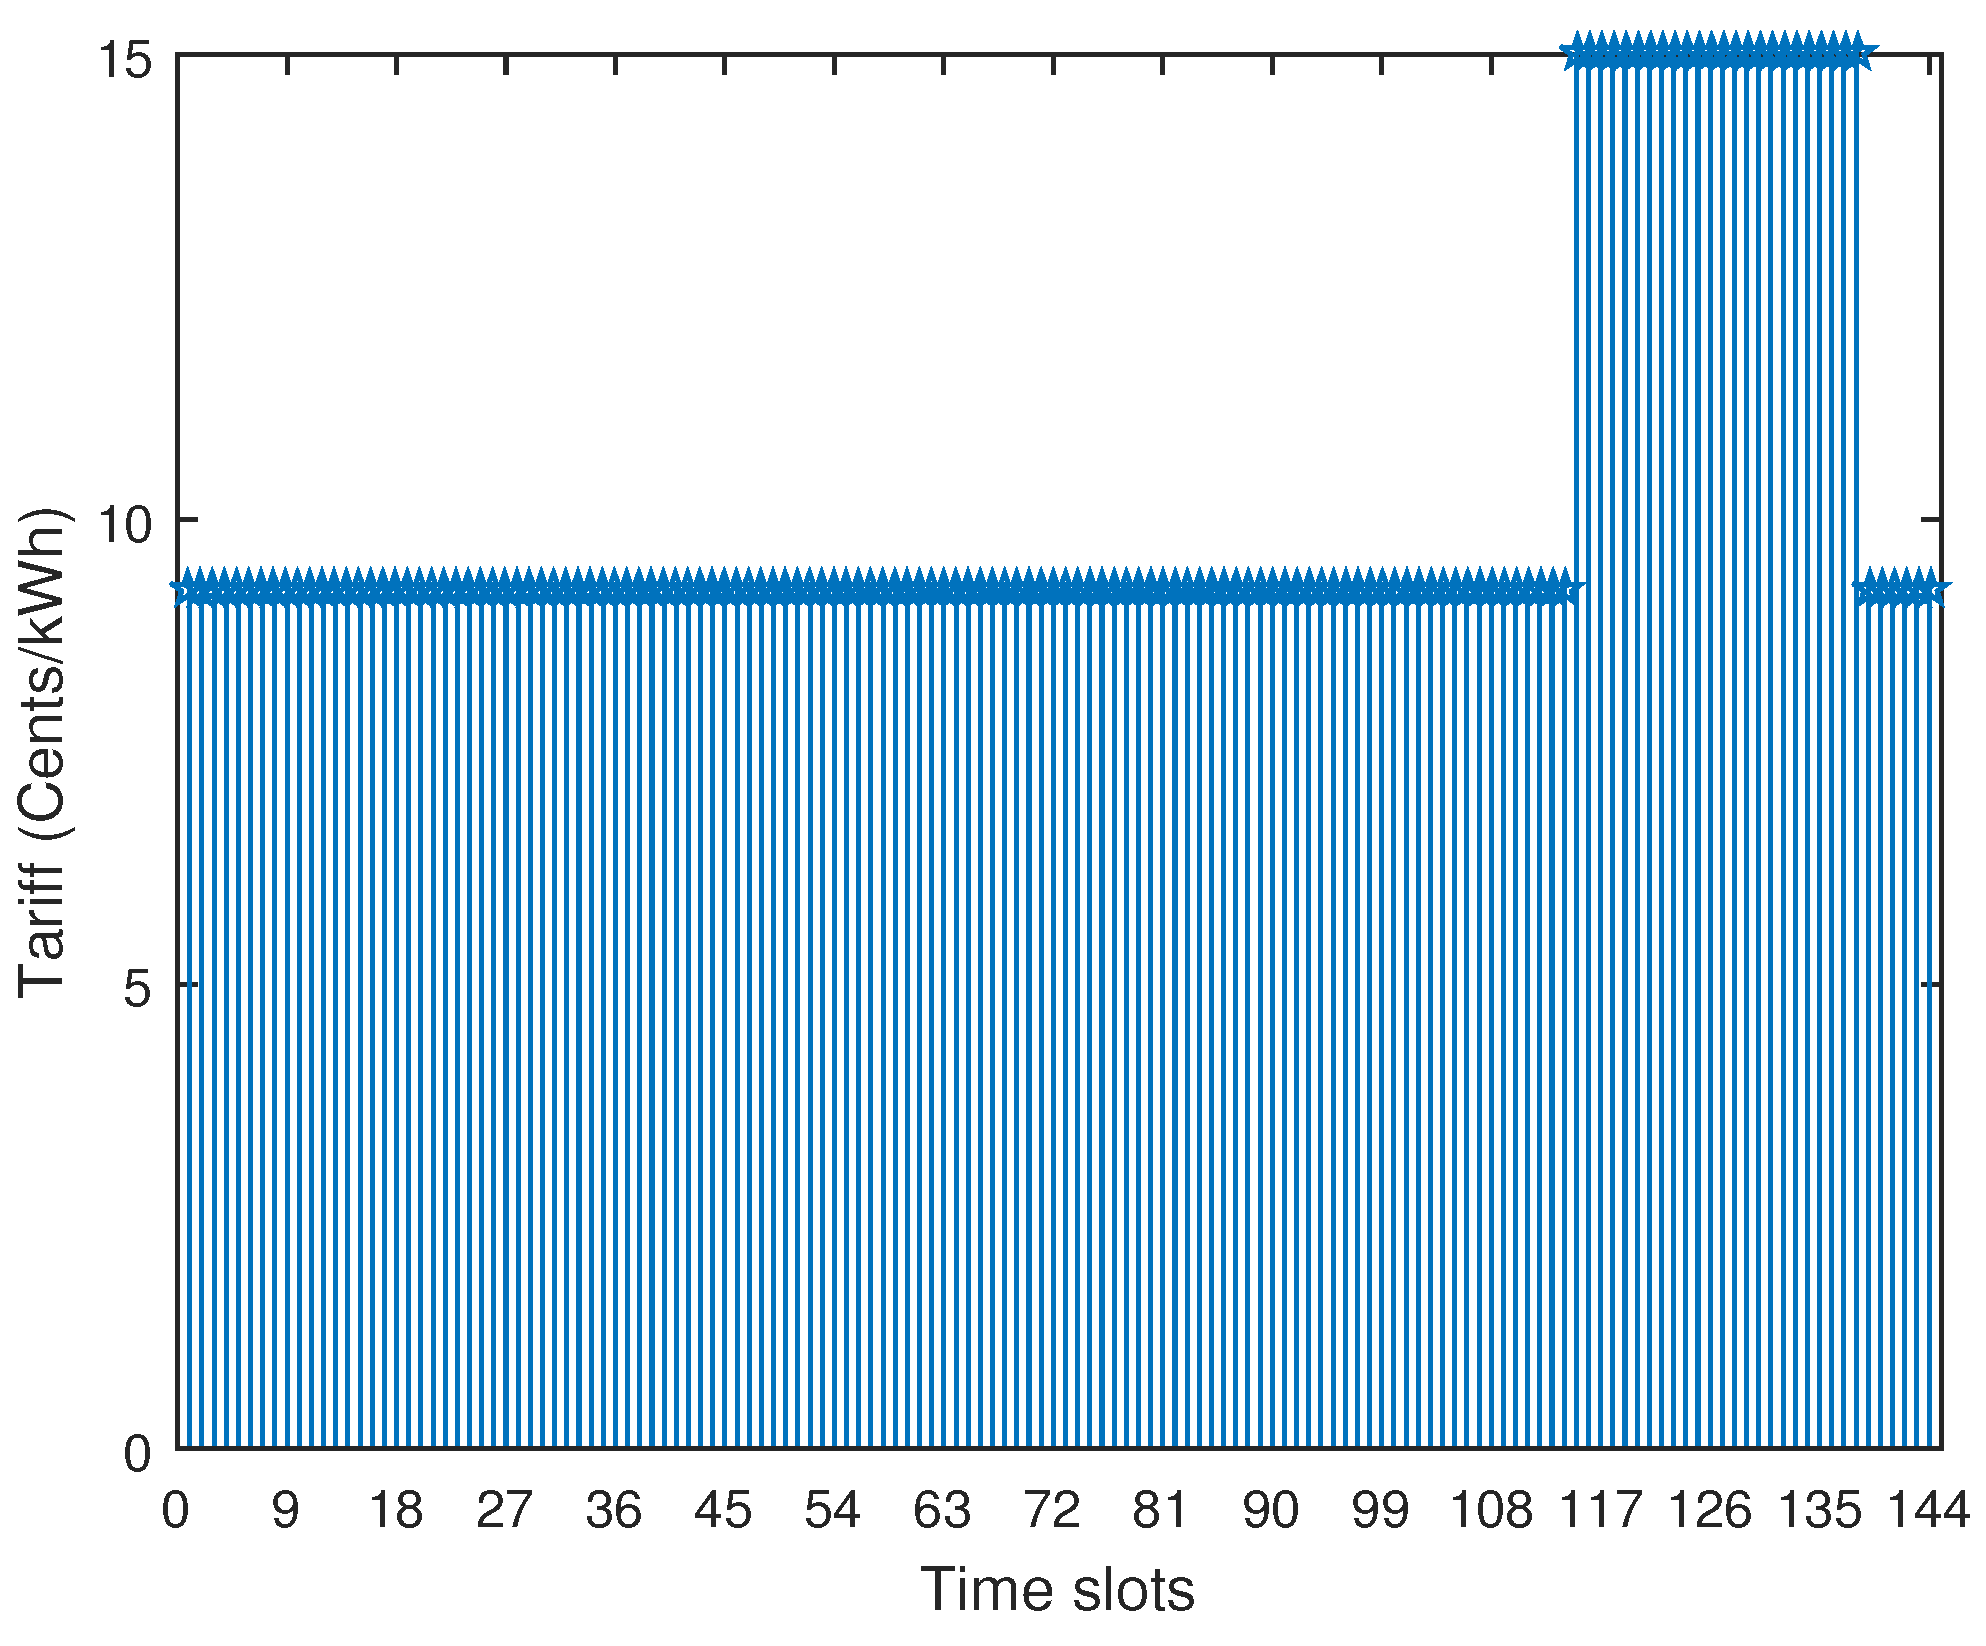
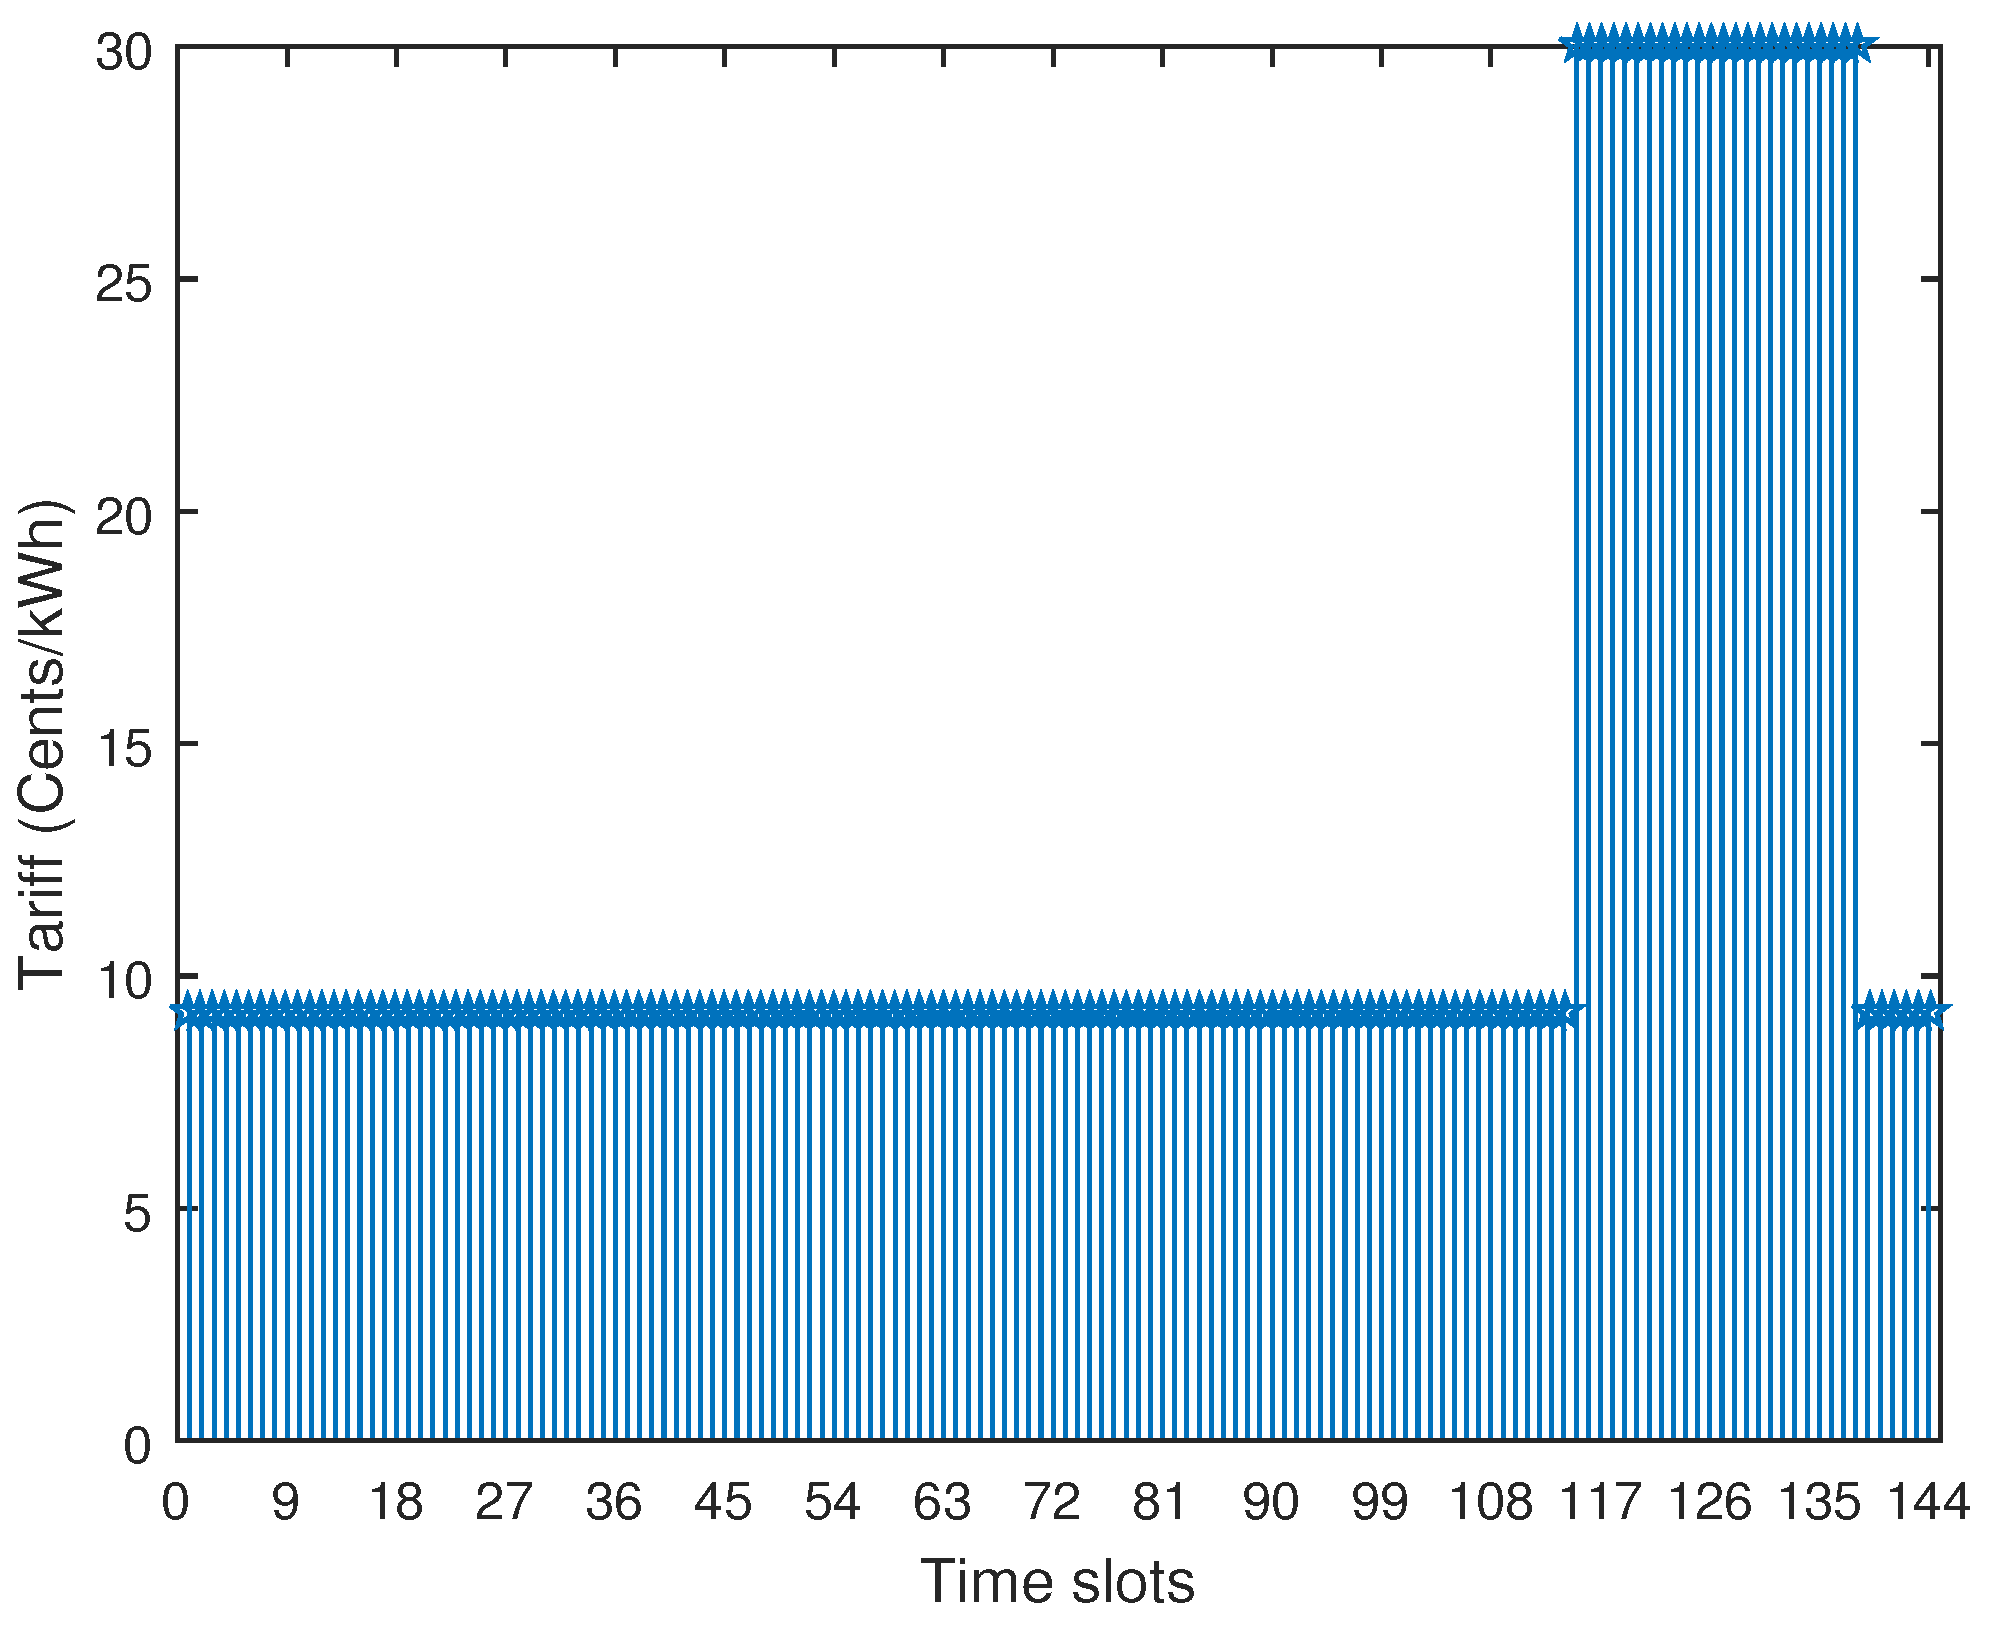
The problem based on a 2-stage ToUP scheme was considered as a benchmark for analyzing the performance of the other TPs. The scheme consists of a price of 15 cents/kWh during the peak time from 7:00 p.m. to 11:00 p.m. (slots numbered 115–138) and 9 cents/kWh during the rest of the day as shown in Figure 3. While moving from peak towards off-peak times, the price coefficient reduces by 0.62 times. The algorithms use this price elasticity as a pressure for shifting of the peak load towards off-peak times. While pressurizing, the algorithm has to take into account the limiting bounds ( S T s l t and E N s l t ) and the L O O T of each of the SHAs. For the DS scenario, the algorithm can shift the load from peak hours slots numbered 115–138 towards the off-peak hour’s slots numbered 139–144 in the forward direction. Referring to Table 3, such shifting is applicable to HAs like AC-4, DW-2, CP, WM, WP, and IR. Furthermore, some of the HAs are bounded to operate during the peak hours like EG-2 and RC-2, due to the specified values S T s l t and E N s l t , and cannot be shifted on a timeline, known as non-pressurized (NP) HAs. Similarly, the AS-type HAs can be pressurized for advanced shifting. The algorithm generates combinations of starting times of SHAs as vector Tst based on the constraint for each of the aforementioned types of HAs. The load profile corresponding to Tst vector is computed as per Equation (5), and the same profile has been used to discuss the algorithm performance for a specified set of TPs.
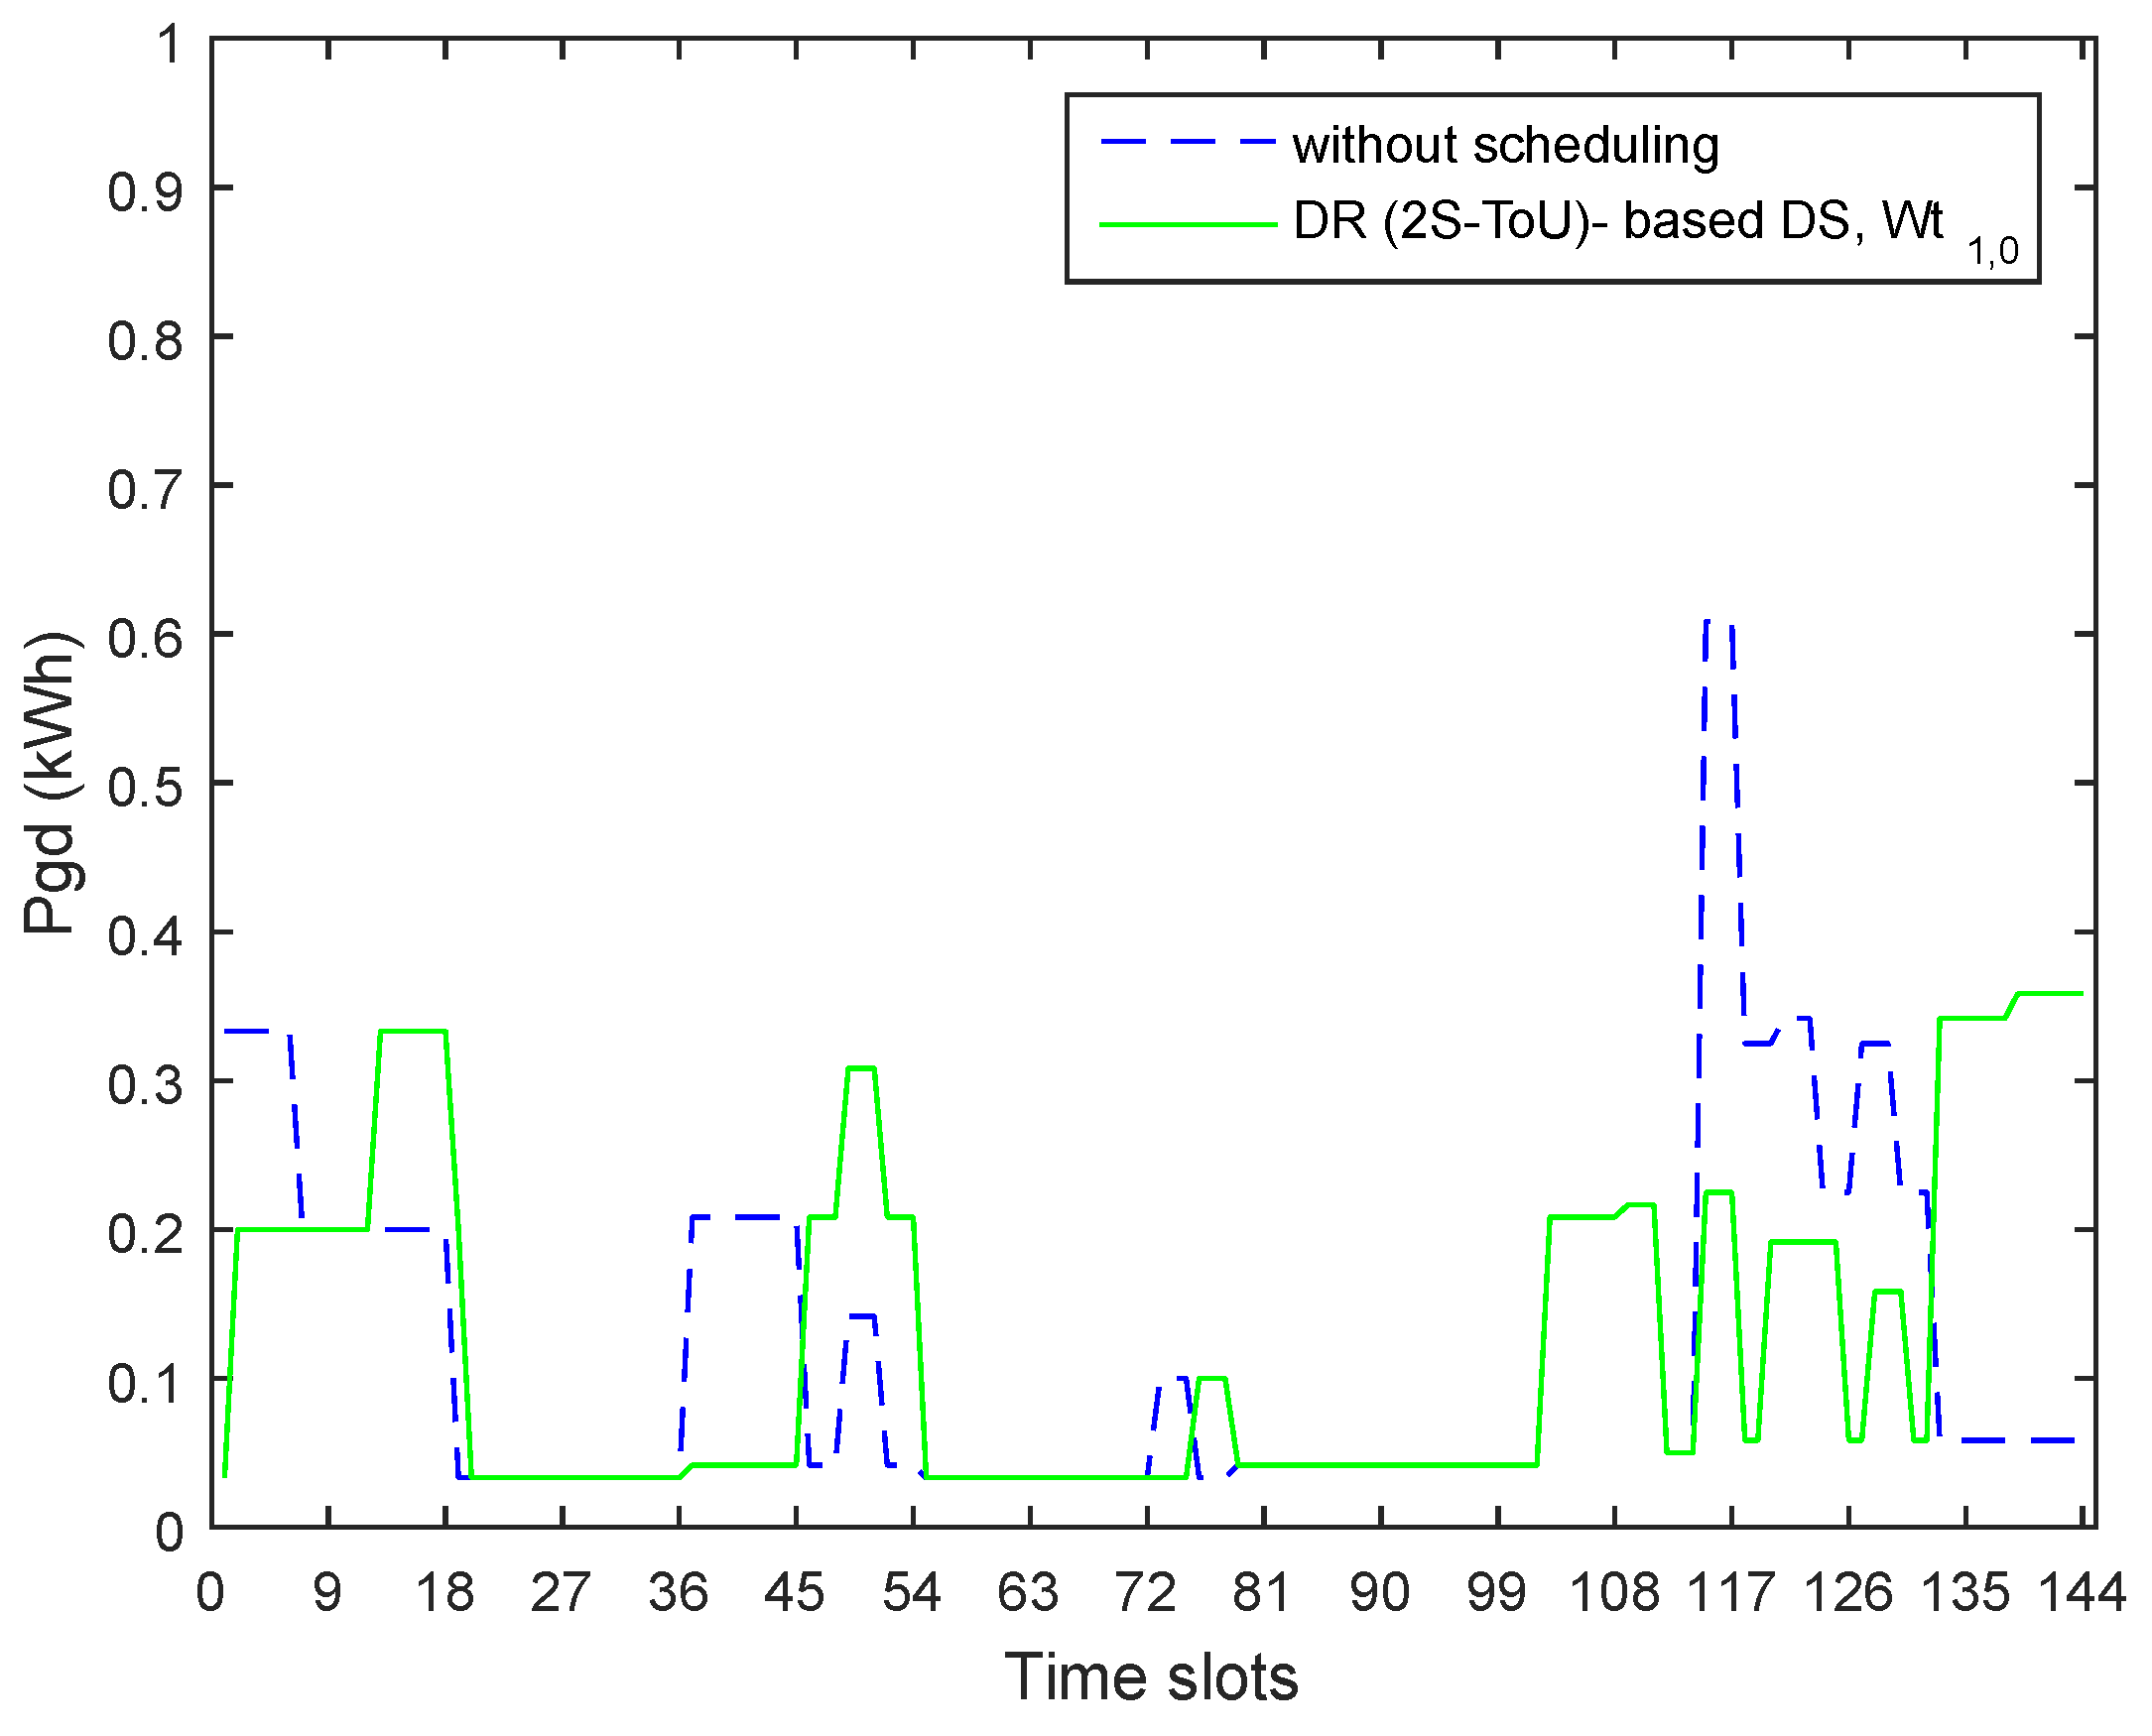
The scenario for the 2S-ToUP scheme (with DS) showed that the algorithm attempted the DS- type HAs for their shifted operations in the forward direction in order to achieve an optimal load profile that might result in a minimum C E . The simulated load profile for this scenario is shown in Figure 9. The algorithm curtailed the peak time load ranging from 0.35 to 0.6 kWh to a value of 0.15–0.35 kWh. A load of 0.31 kWh was shifted from the peak time towards the off-peak time slots numbered 139–144. That shifting of the load resulted in a 9.7% reduction in the C E under this scenario.
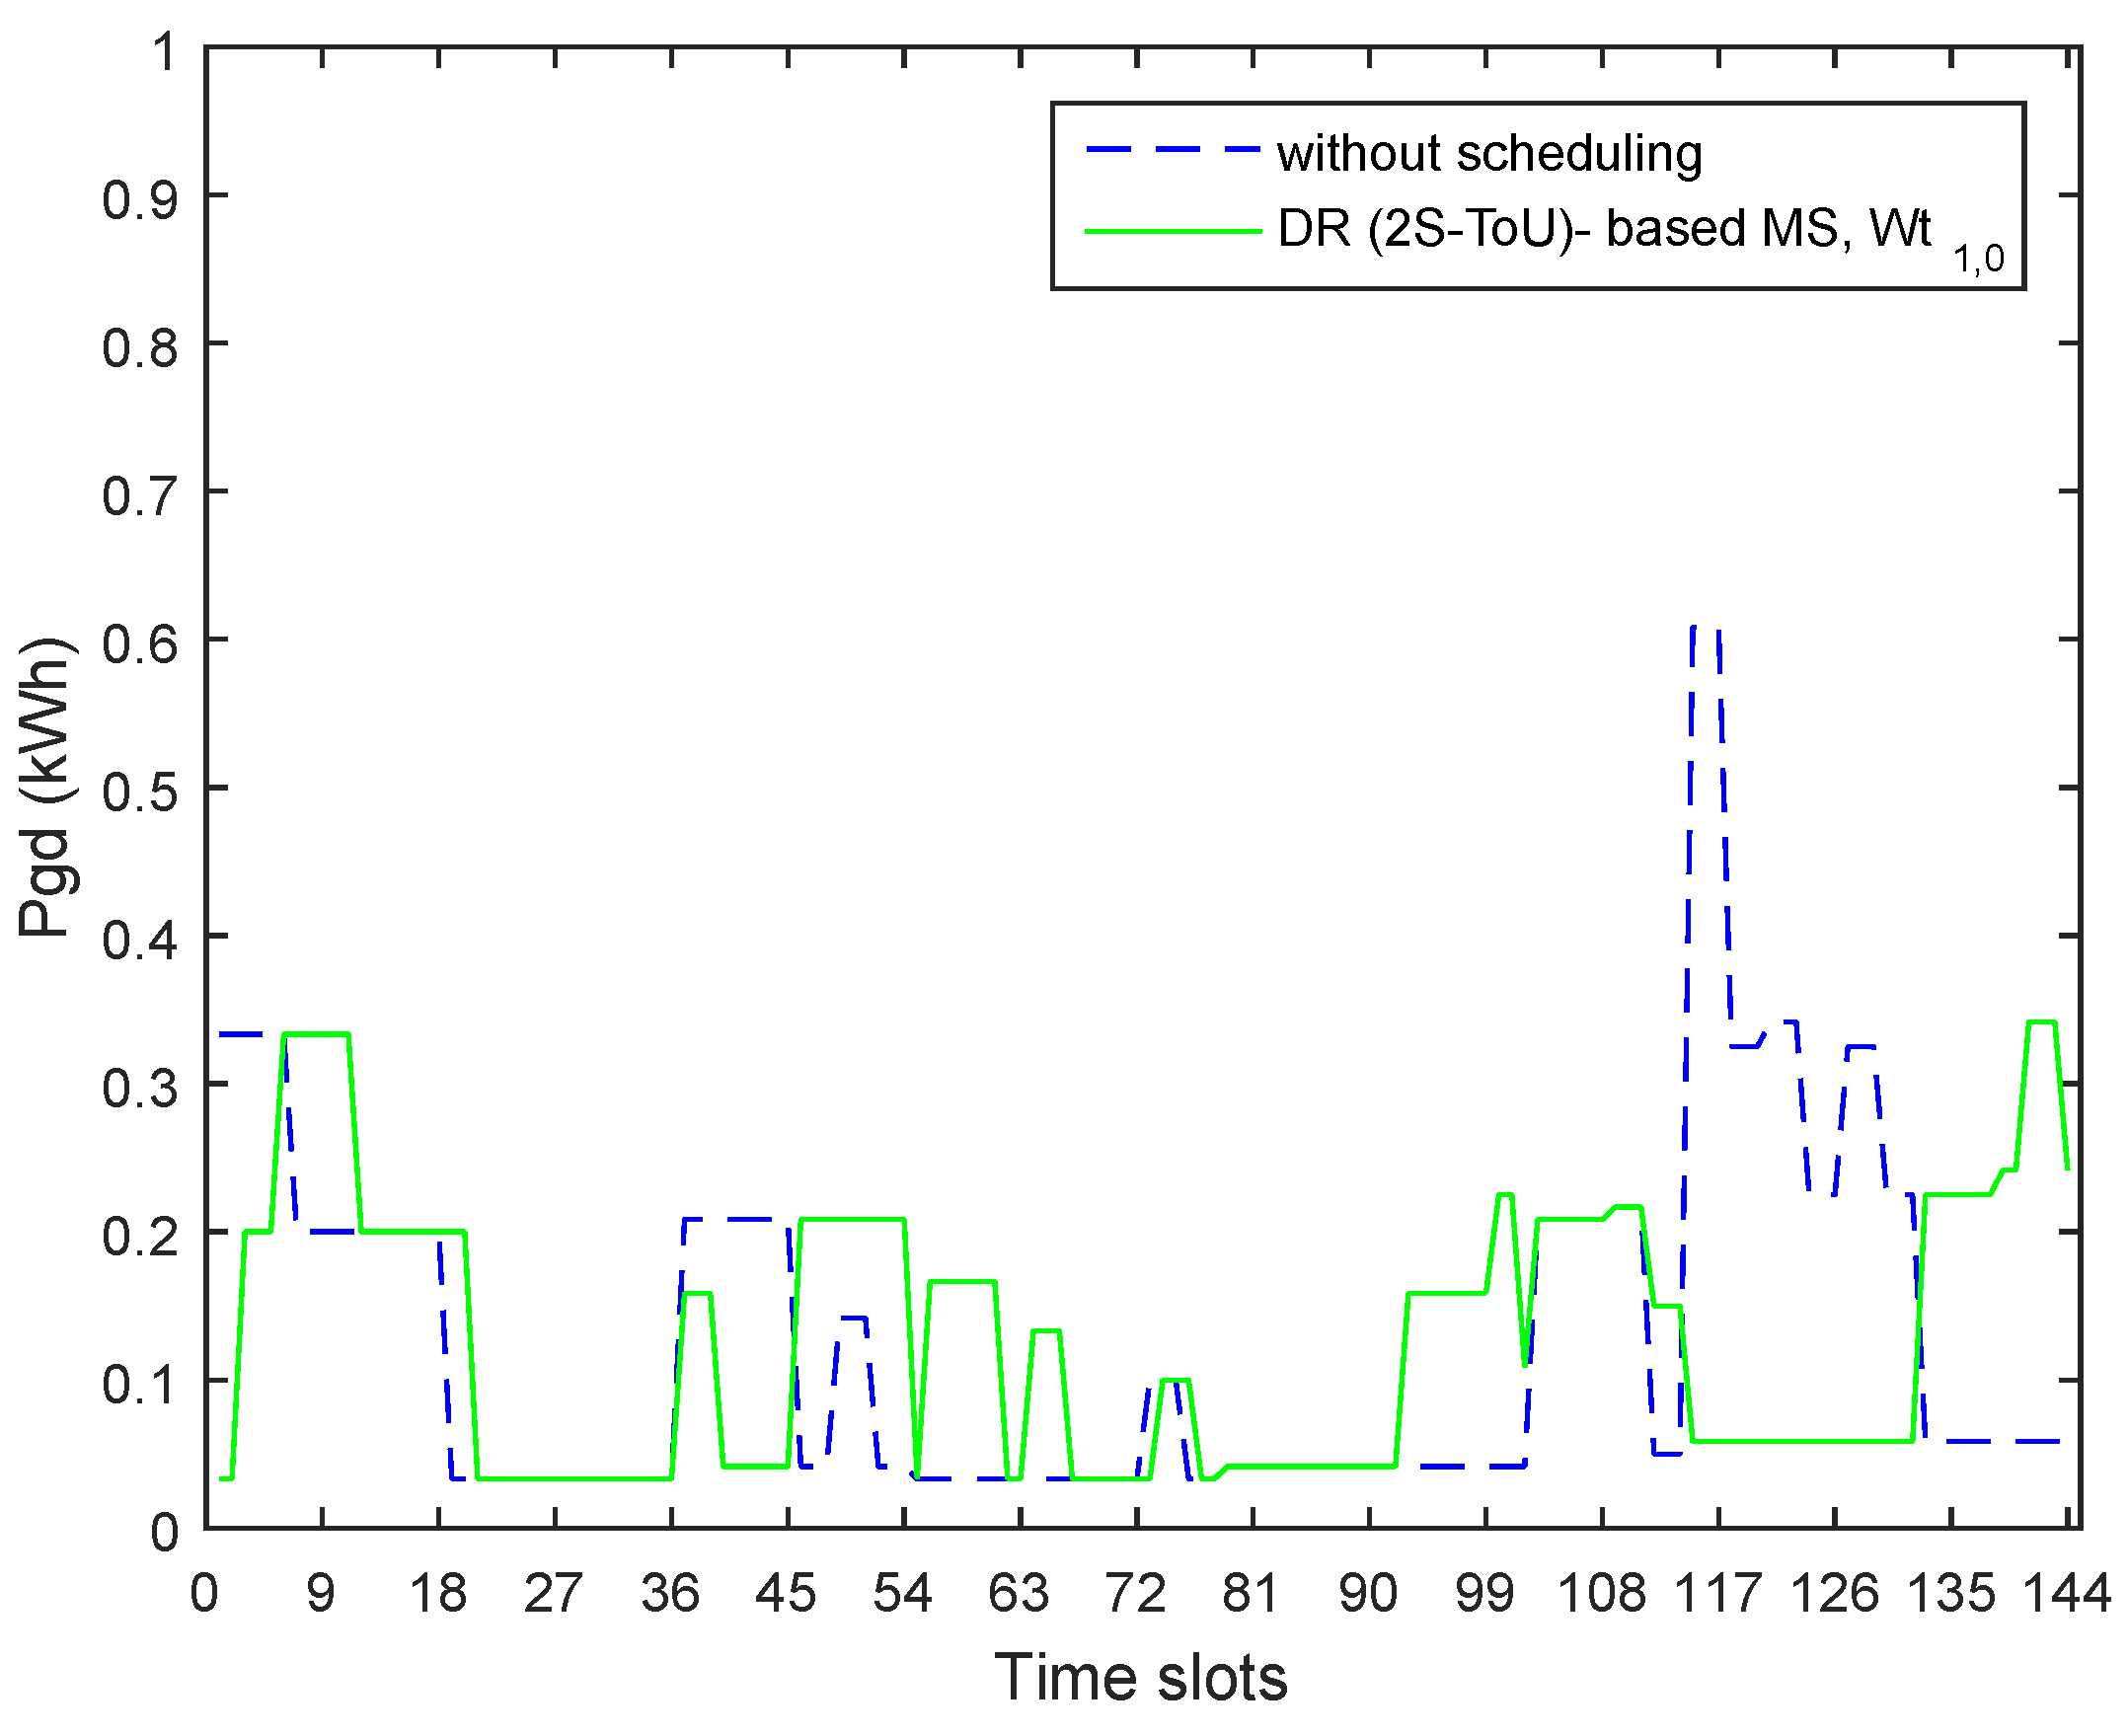
Refer to the scenario for the 2S-ToUP scheme (with MS), some of the SHAs were modeled as AS while the others as DS. The algorithm attempted the DS-type HAs like AC-3, AC-4, DW-2, and CP for their shifted operations towards the off-peak slots in the forward direction, whereas the AS- type HAs like WM, WP, EG-2, RC-2, and IR were pressurized for their shifted operations towards the off-peak slots in the advanced direction.
The simulated load profile after MS of HAs is shown in Figure 10. The algorithm curtailed the peak time load ranging from 0.35 to 0.6 kWh, to a value of 0.25 kWh supplied during slots numbered 133–138. The peak hour load was reduced because loads of 0.31 and 0.15 kWh were shifted towards off-peak time slots numbered 139–144 (forward direction) and numbered 92–102 (advanced direction), respectively. This bi-directional shifting of the load out of the peak hours resulted in 15.8% reduction in the C E for this scenario.
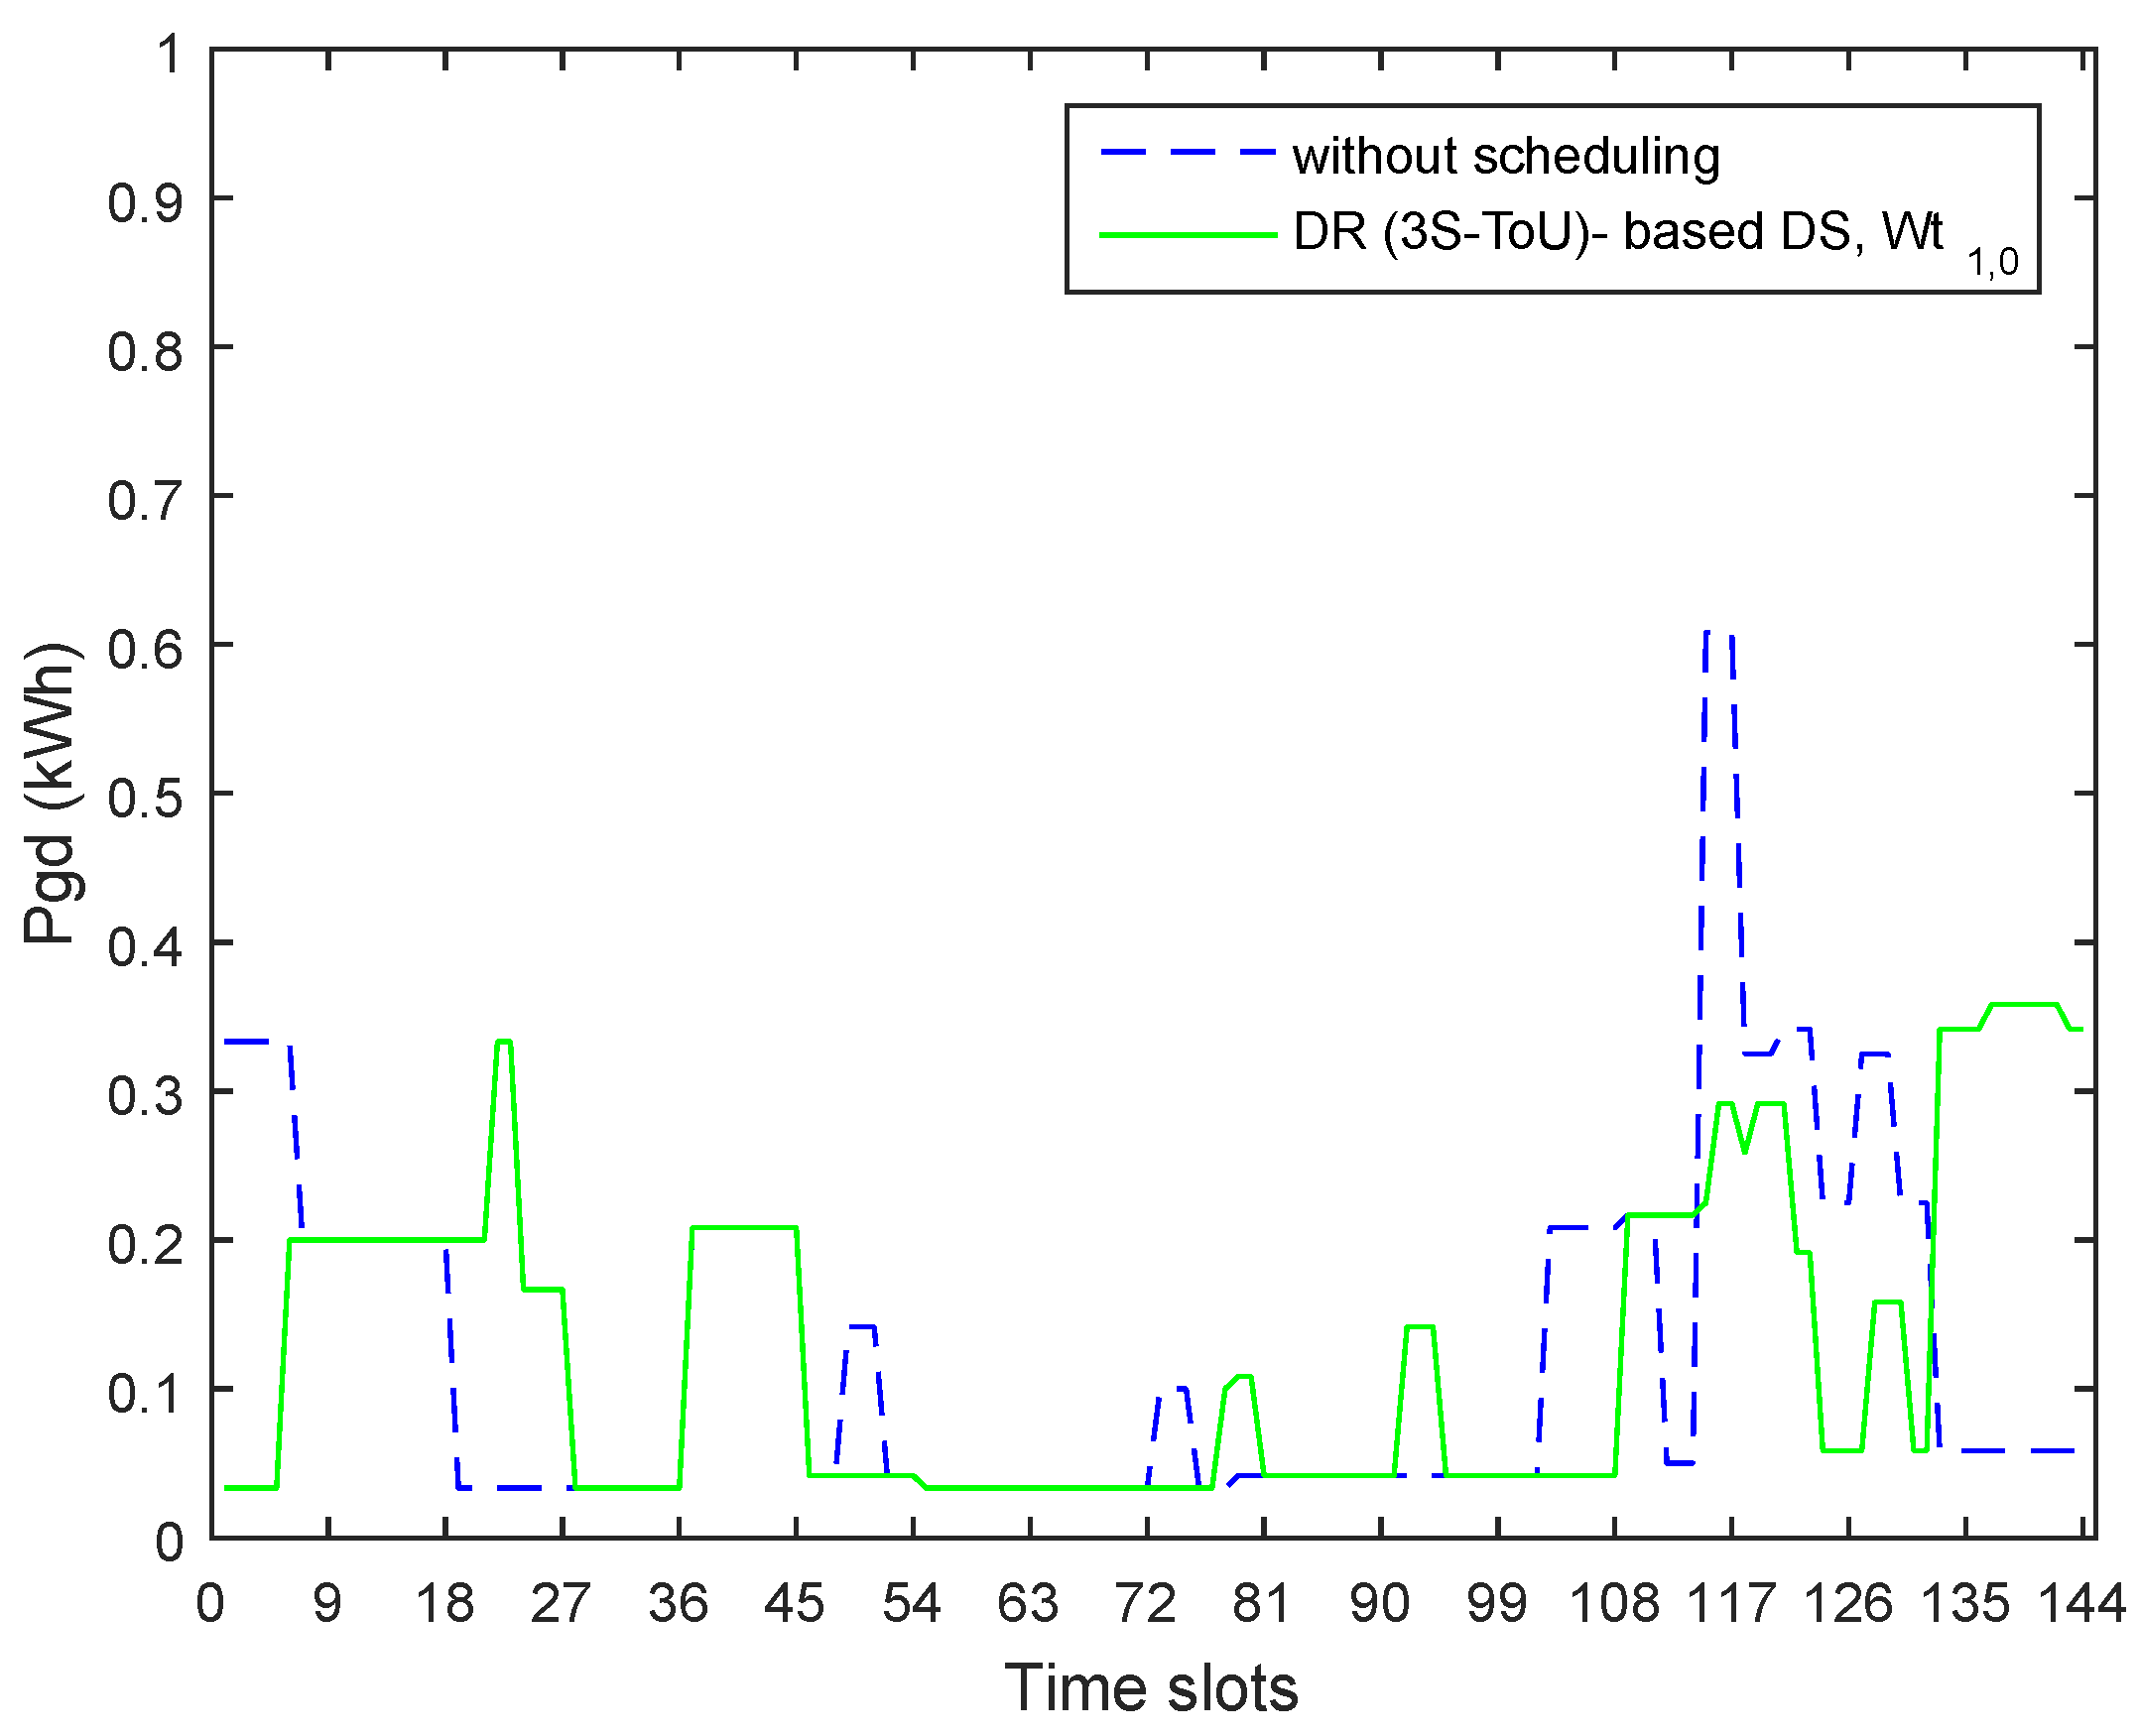
The scenario for the 3S-ToUP scheme (with DS) revealed that the algorithm attempted for the shifted operation of the SHAs from peak time slots numbered 103–102 towards the off-peak time slots numbered 133–144 in the forward direction. The simulated scheduled load profile for this scenario is shown in Figure 11. The algorithm curtailed the peak time load ranging from 0.35 to 0.6 kWh to a lower range of 0.15–0.3 kWh. A load of 0.33 kWh was shifted from the peak time towards the off-peak time. The shifting mentioned under this scenario resulted in 15.9% reduction in C E .
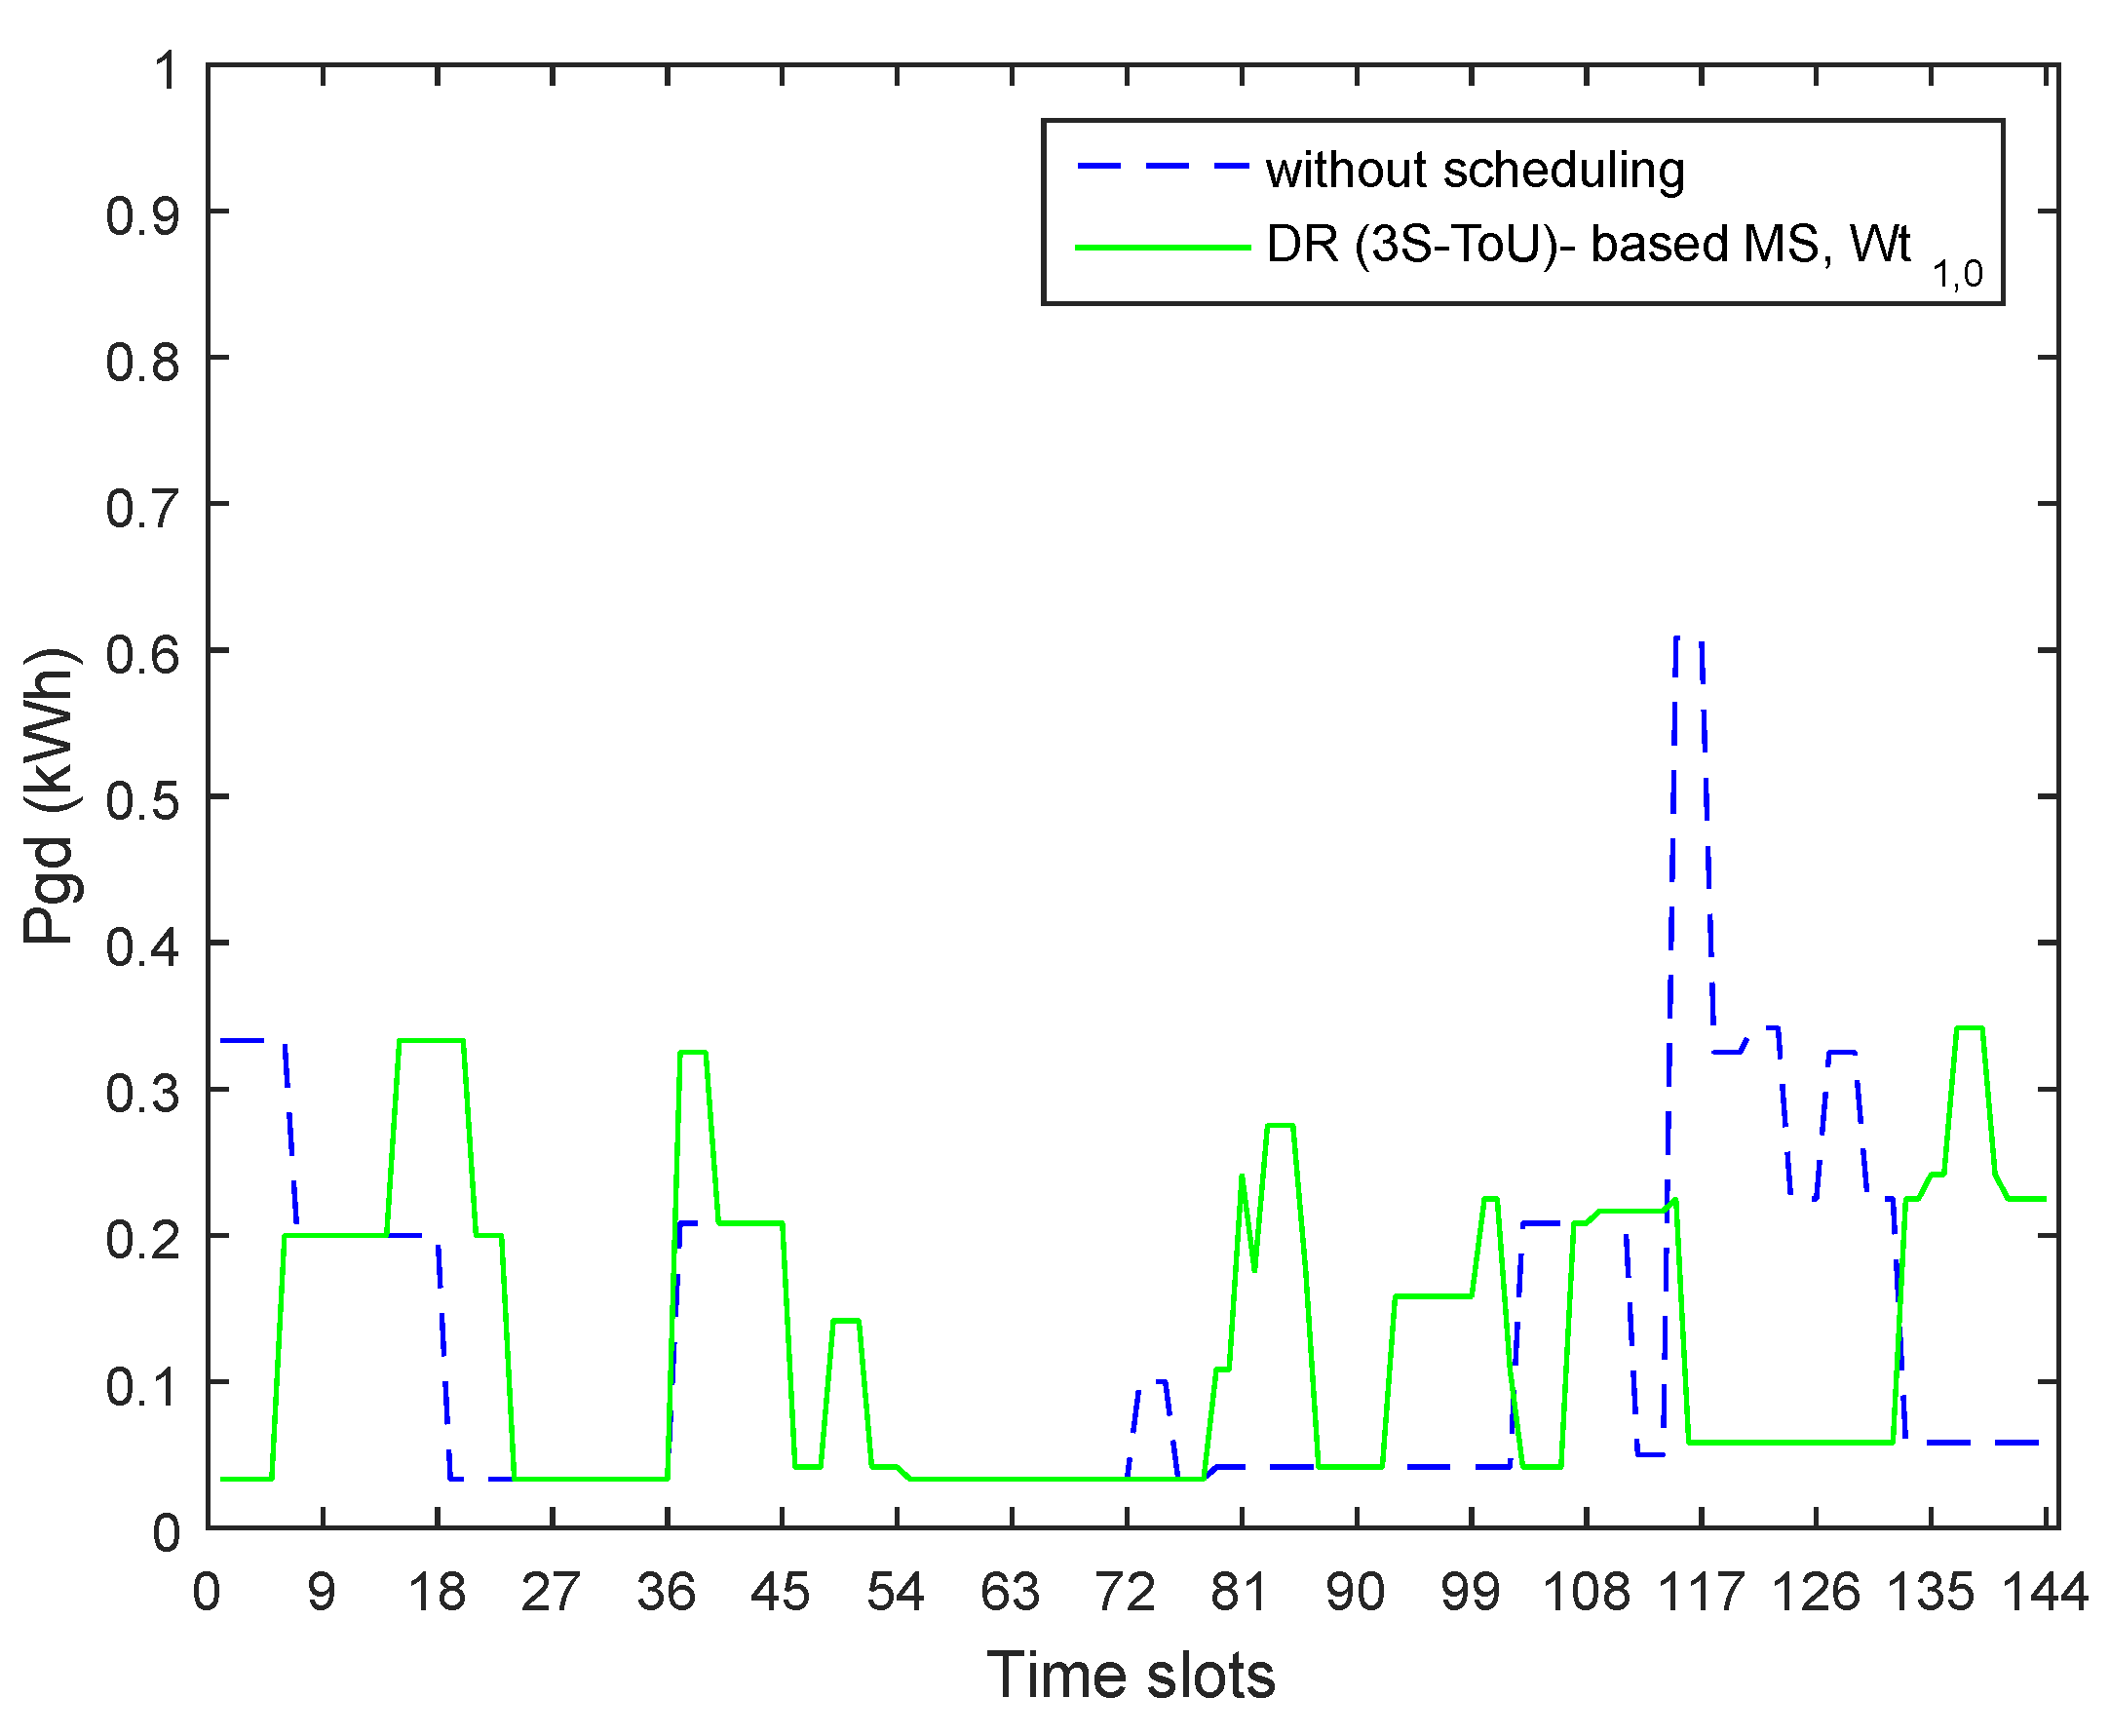
Referring to the scenario for the 3S-ToUP scheme (with MS), the increased number of the pricing stages and multiple options for shifting of the load in the forward and in the advanced directions enabled the algorithm for a larger load shifting towards the slots with cheaper EP. Accordingly, the algorithm successfully shifted the peak time load, initially supplied during slots numbered 103–132, towards the off-peak time slots numbered 133–144 in the forward and the mid-peak/off-peak time slots numbered 1–102 in the advanced direction. Furthermore, the algorithm could move the mid-peak time load towards the off-peak time as well.
The simulated load profile after MS of HAs for 3S-ToUP is shown in Figure 12. The algorithm curtailed the peak time load ranging from 0.35-0.6 kWh to a lower range of 0.05–0.2 kWh; only the fixed and NP loads were fed during the peak hours. Loads of 0.31 and 0.2–0.3kWh supplied during peak hours were shifted towards off-peak slots numbered 133–144 in the forward and towards the mid-peak/off-peak slots numbered 1–102 in the advanced directions, respectively. This bi-directional shifting of the load out of the relatively higher energy pricing slots resulted in 19.3% reduction in C E for the scenario of 3S-ToUP (MS).
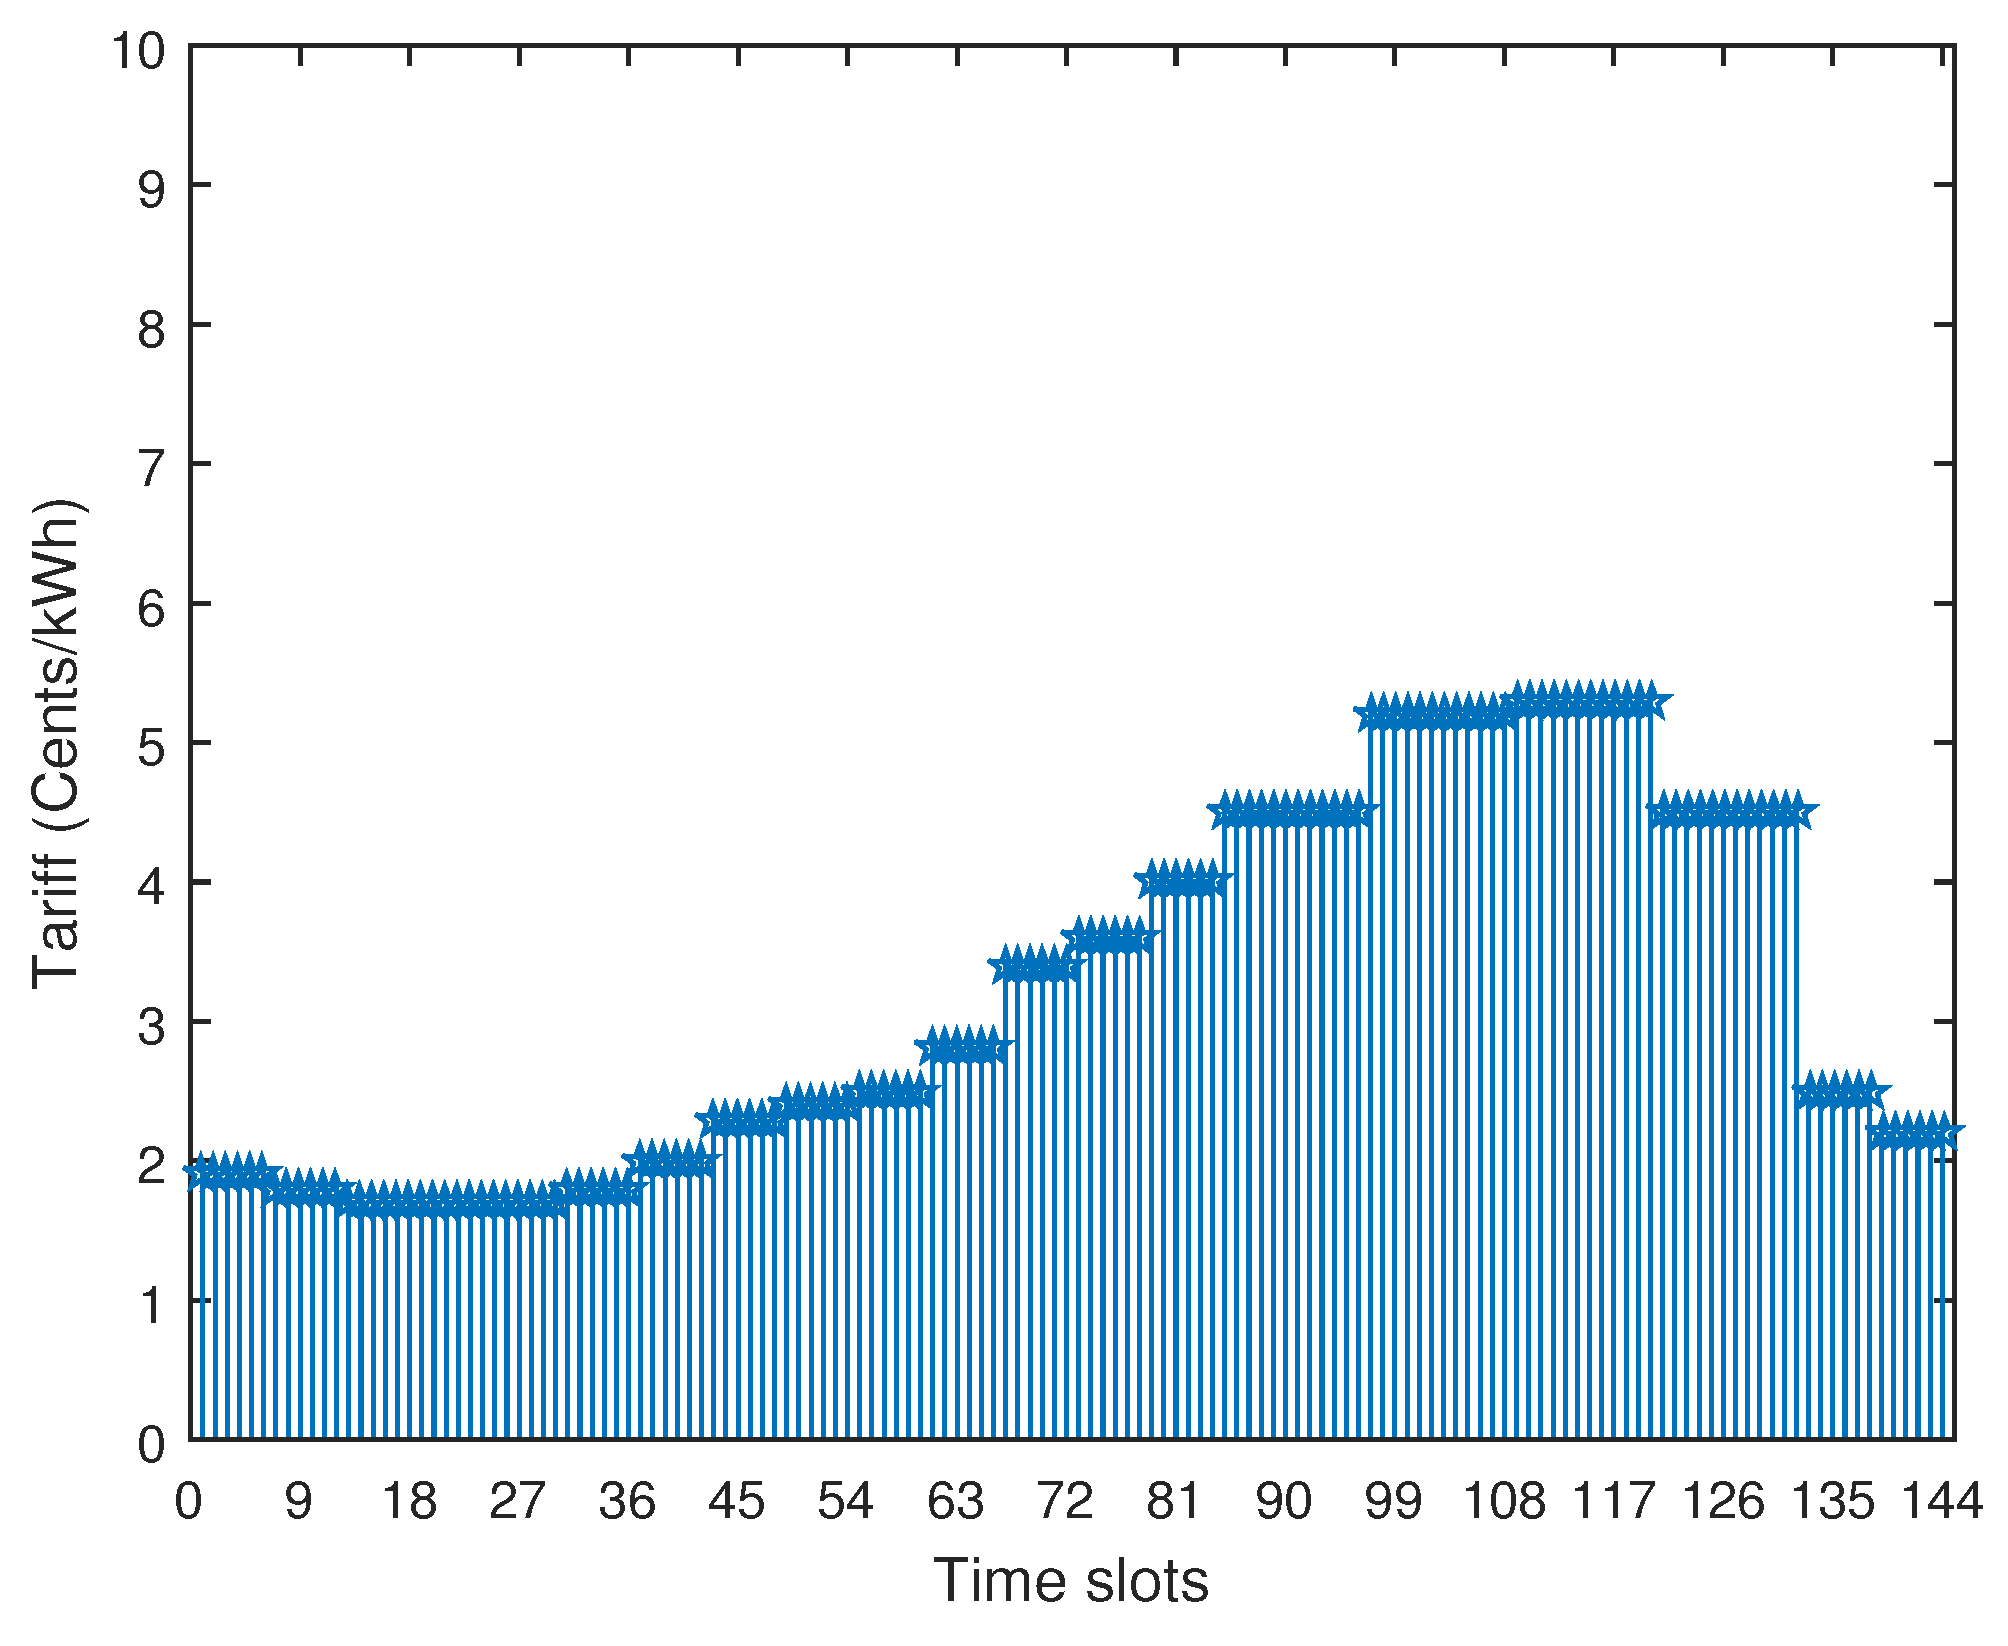
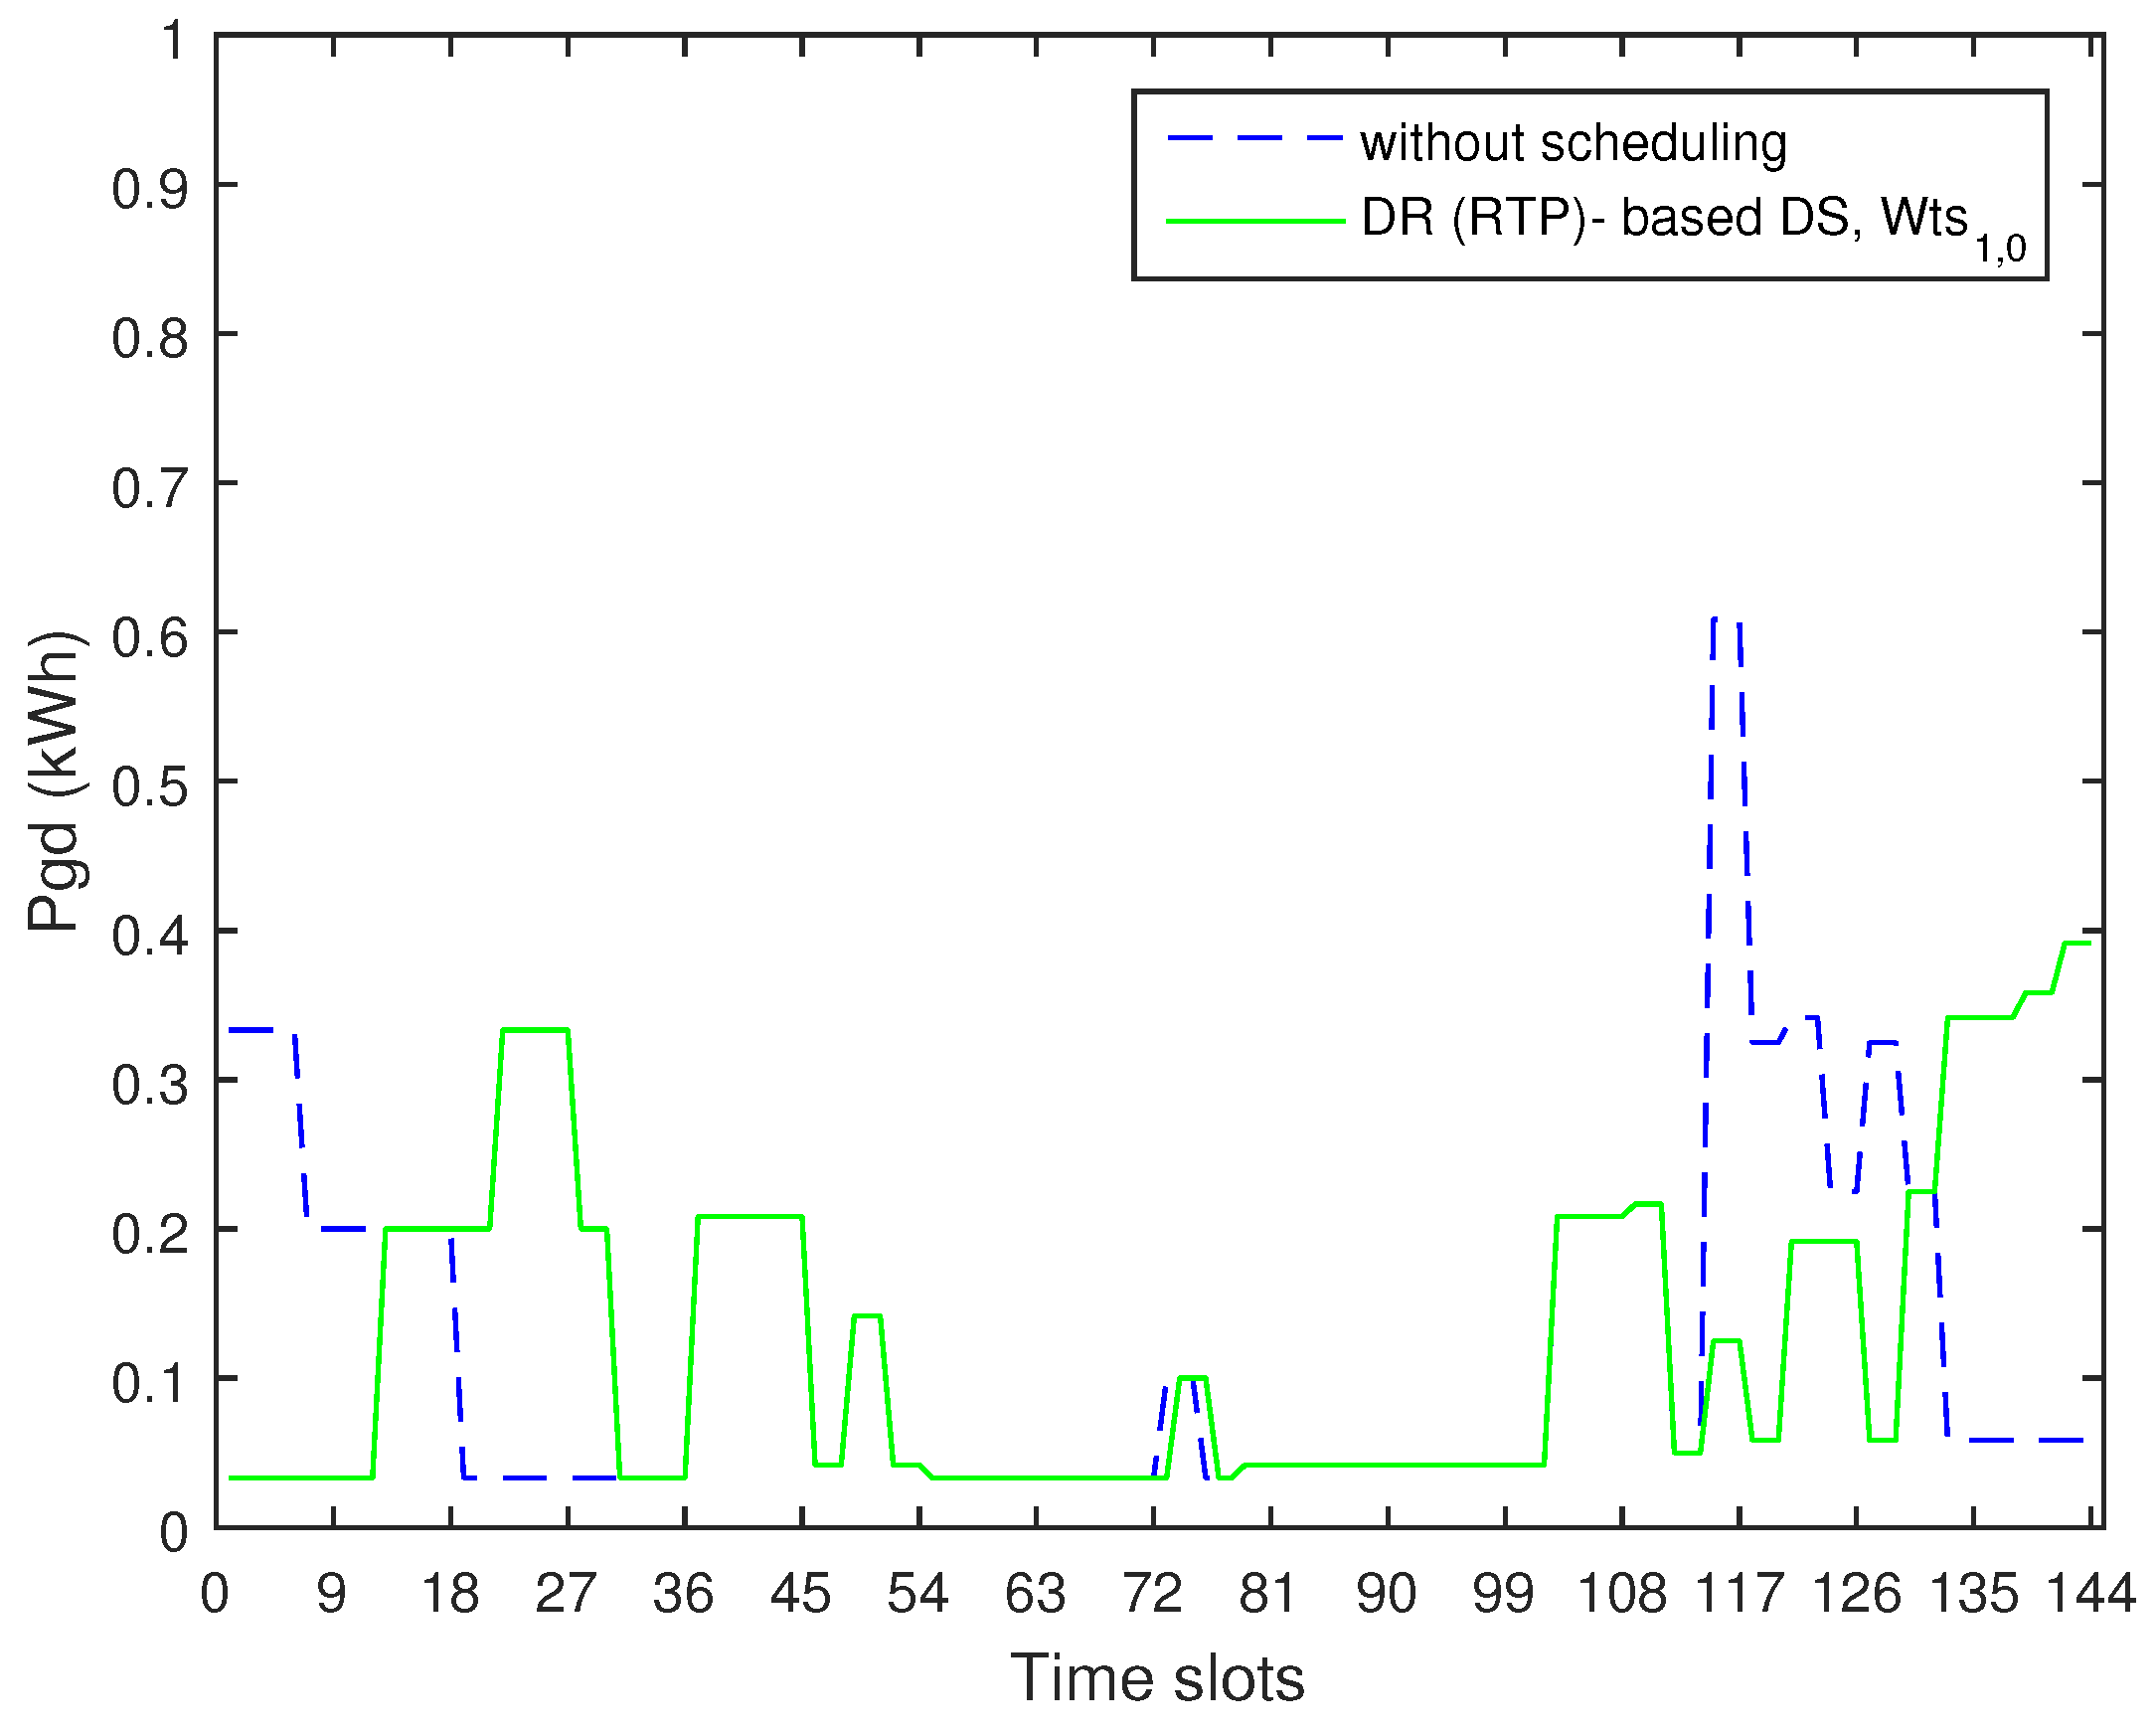
The scenario for DA-RTP scheme (with DS) depicted that a larger number of pricing stages are provided to implement PDDR. The peak times E P ranges from 4.5–5.3 Cents/kWh during slots numbered 85–132. To achieve an optimal value of C E , the algorithm shifted the peak time load towards the slots with relatively lower EP. As the model is based on DS, the peak load could only be shifted in the forward direction to reduce the C E . The simulated load profile for this scenario is shown in Figure 13. The algorithm curtailed the peak hour load ranging from 0.35 to 0.6 kWh to a lower range of 0.1–0.2 kWh. The load pertaining to NP type HAs like AC-3, WM and RC remained for supplying during the peak hours. A load of 0.3–0.35 kWh was shifted from the peak towards the off-peak hours in the forward direction. The DS-based shifting under RTP resulted in 20.3% reduction in C E .
In a scenario DA-RTP scheme (with MS), the E P changes on an hourly basis. Such a model for D E P provides a larger number of pricing stages to implement PDDR. The multi-stage scheme combined with MS for HAs introduces diversified and larger number of options for shifting of the load in the forward as well as in the advanced directions. The simulated load profile after MS of HAs for DA-RTP is shown in Figure 14. The algorithm curtailed the peak hours load ranging from 0.35–0.6 kWh to a lower range of 0.2–0.3 kWh; only the fixed and NP-type loads like AC-3, WM and RC were fed during the peak hours. The algorithm shifted most of the load from the peak time slots numbered 85–132 towards the slots with lesser E P in the forward direction (slots numbered 133–144) and in the advanced direction (slots numbered 11–60). The shifting mentioned towards the time slots with diversified and more reduced E P s resulted in 20.5% reduction in C E under this scenario.
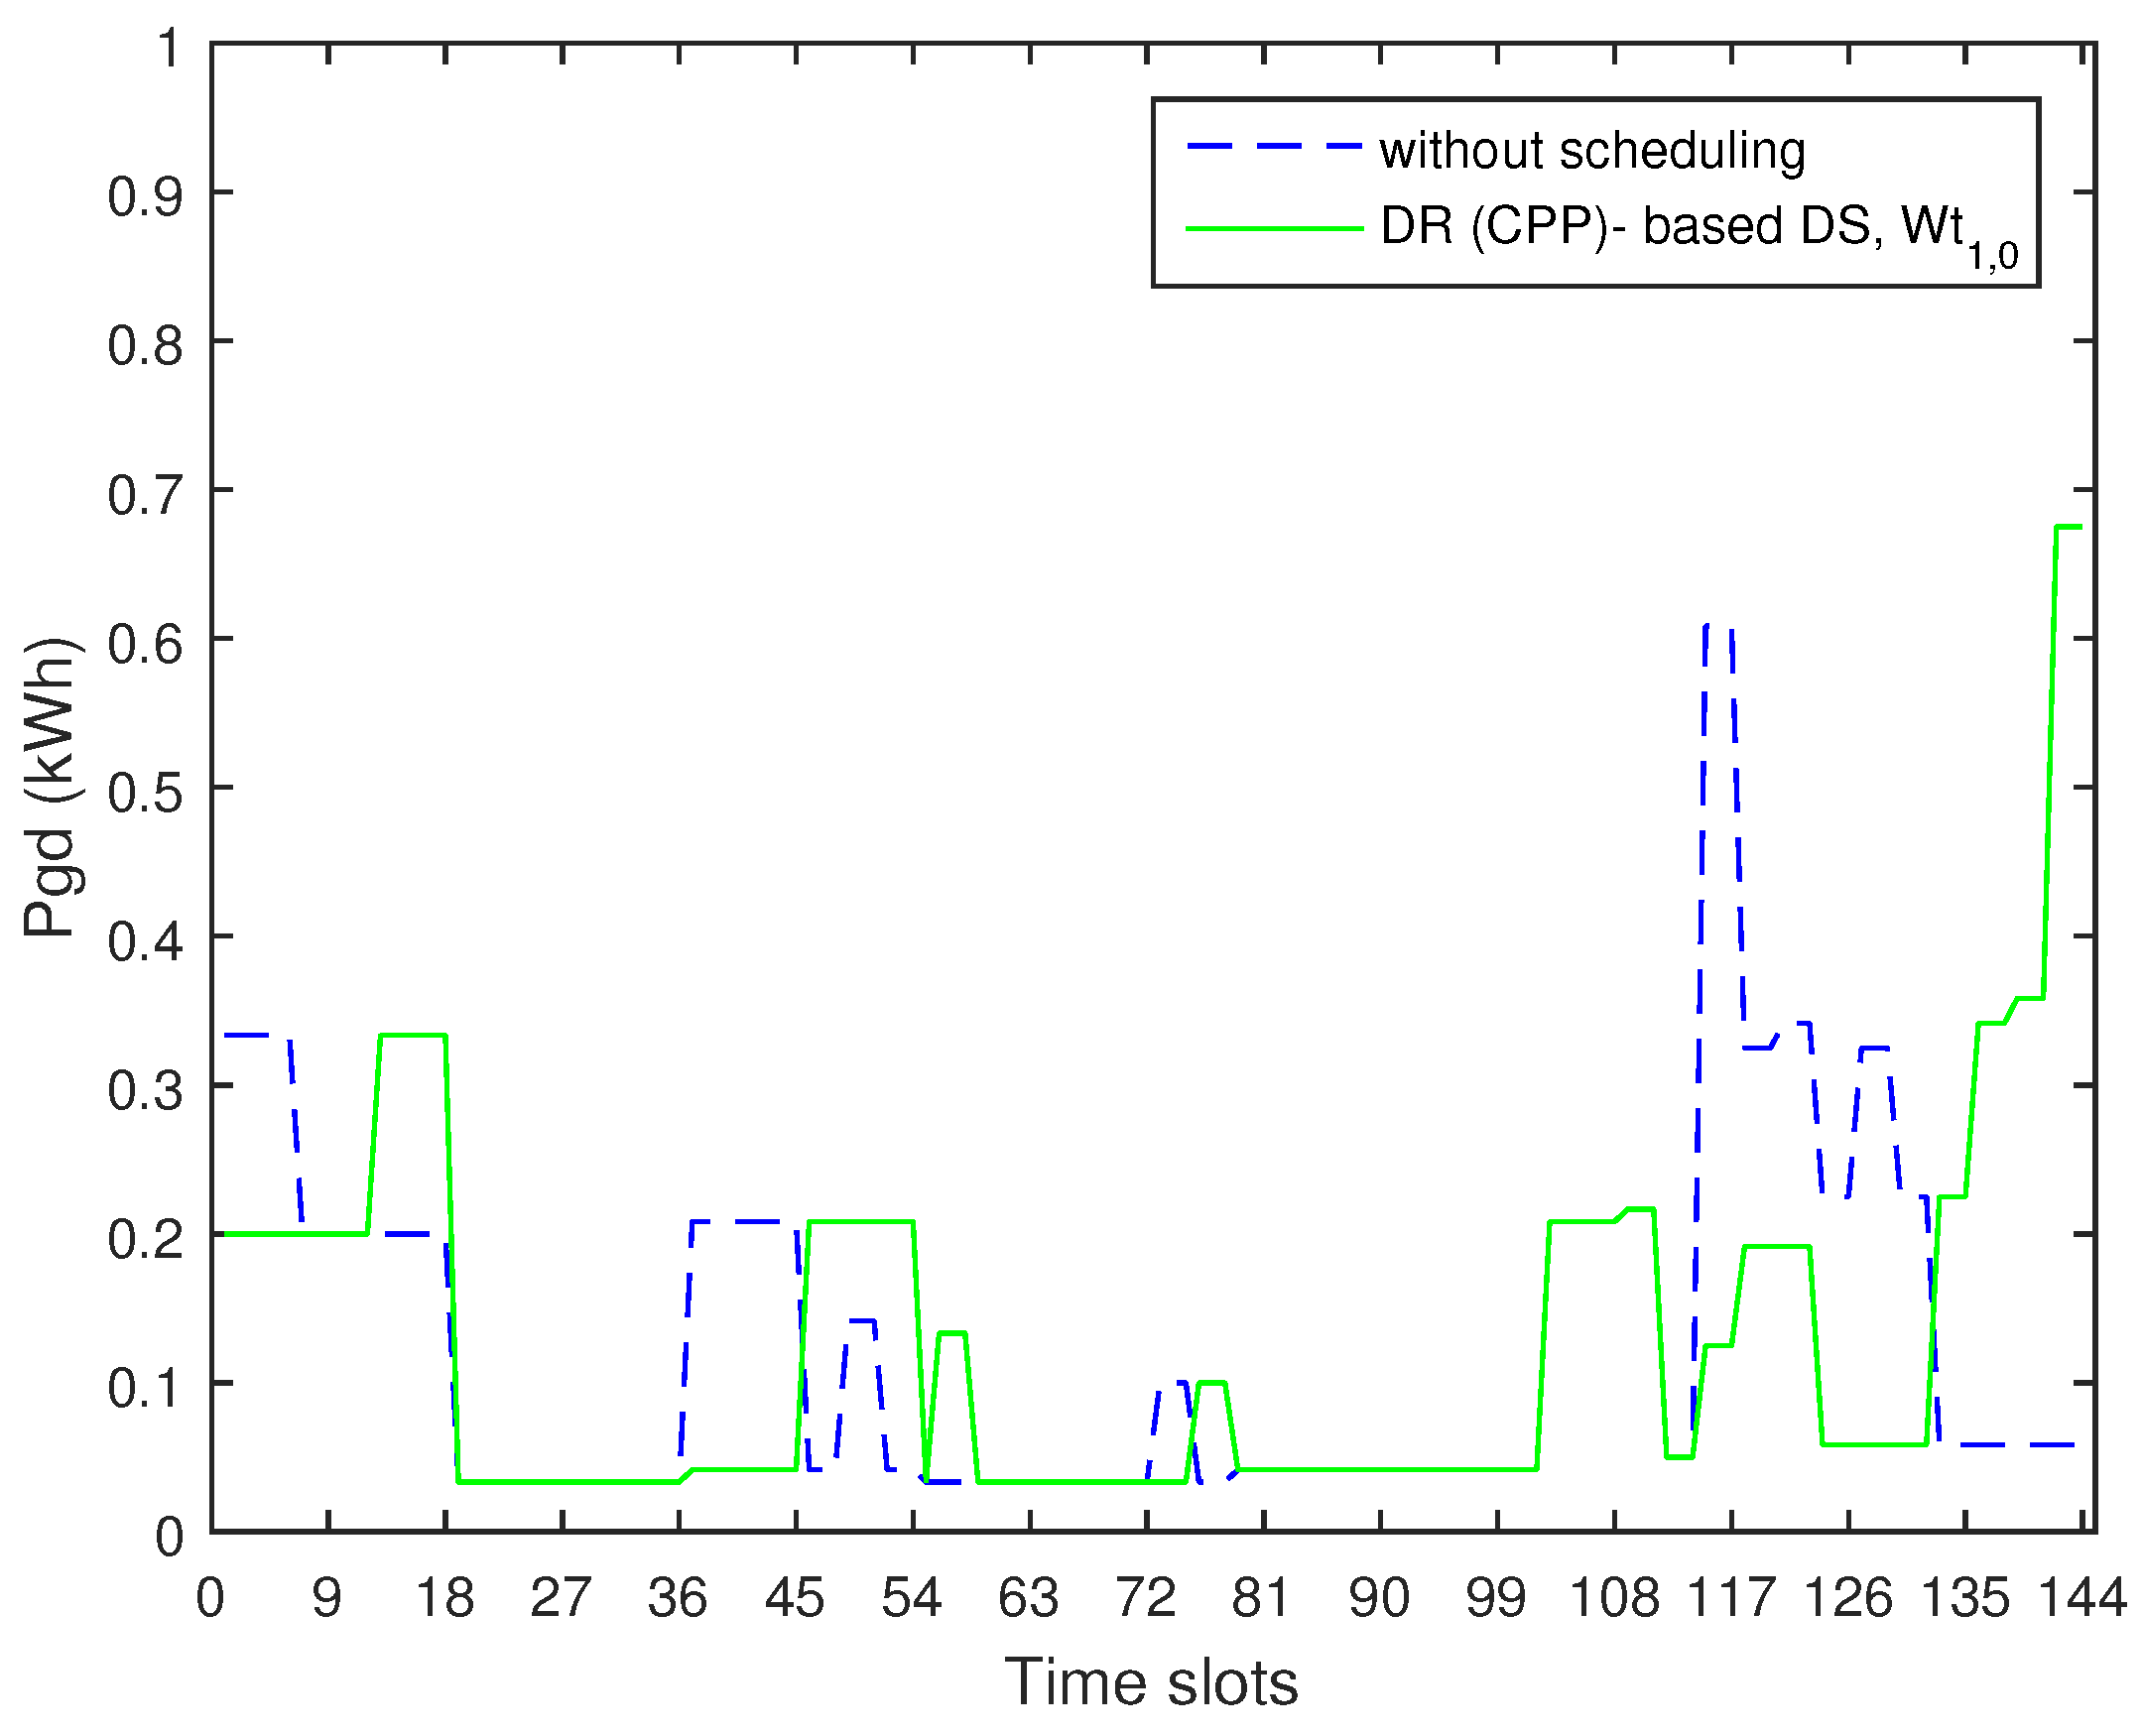
The CPP is an event-based scheme that is used to manage extra critical power demands. The scheme for CPP is based on extra high electricity prices during the highly critical peak hours. Such prices motivate the consumers to shift their load from the extra critical peak times towards the off-peak times. The scenario for the CPP scheme (with DS) showed that the algorithm attempted the HAs supplied during the critical peak times for their shifted operations towards the off-peak time in the forward direction. The simulated load profile for this scenario is shown in Figure 15. The algorithm curtailed the peak time load ranging from 0.35 to 0.6 kWh to a lower range of 0.05–0.18 kWh. The curtailed peak time load was shifted towards the off-peak slots numbered 139–144 in the forward direction. A load shift in the forward direction combined with a very large reduction in the pricing co-efficient (0.32 times) while moving from critical-peak towards off-peak time resulted in 21.8% reduction in C E . However, the peak load was increased due to larger shifting of the demand towards the limited one hour off-peak period in the forward direction. The proposed value of 1.4 times of the normal E P for I B R was not sufficient in that case to avoid the re-emergence of the peak load.
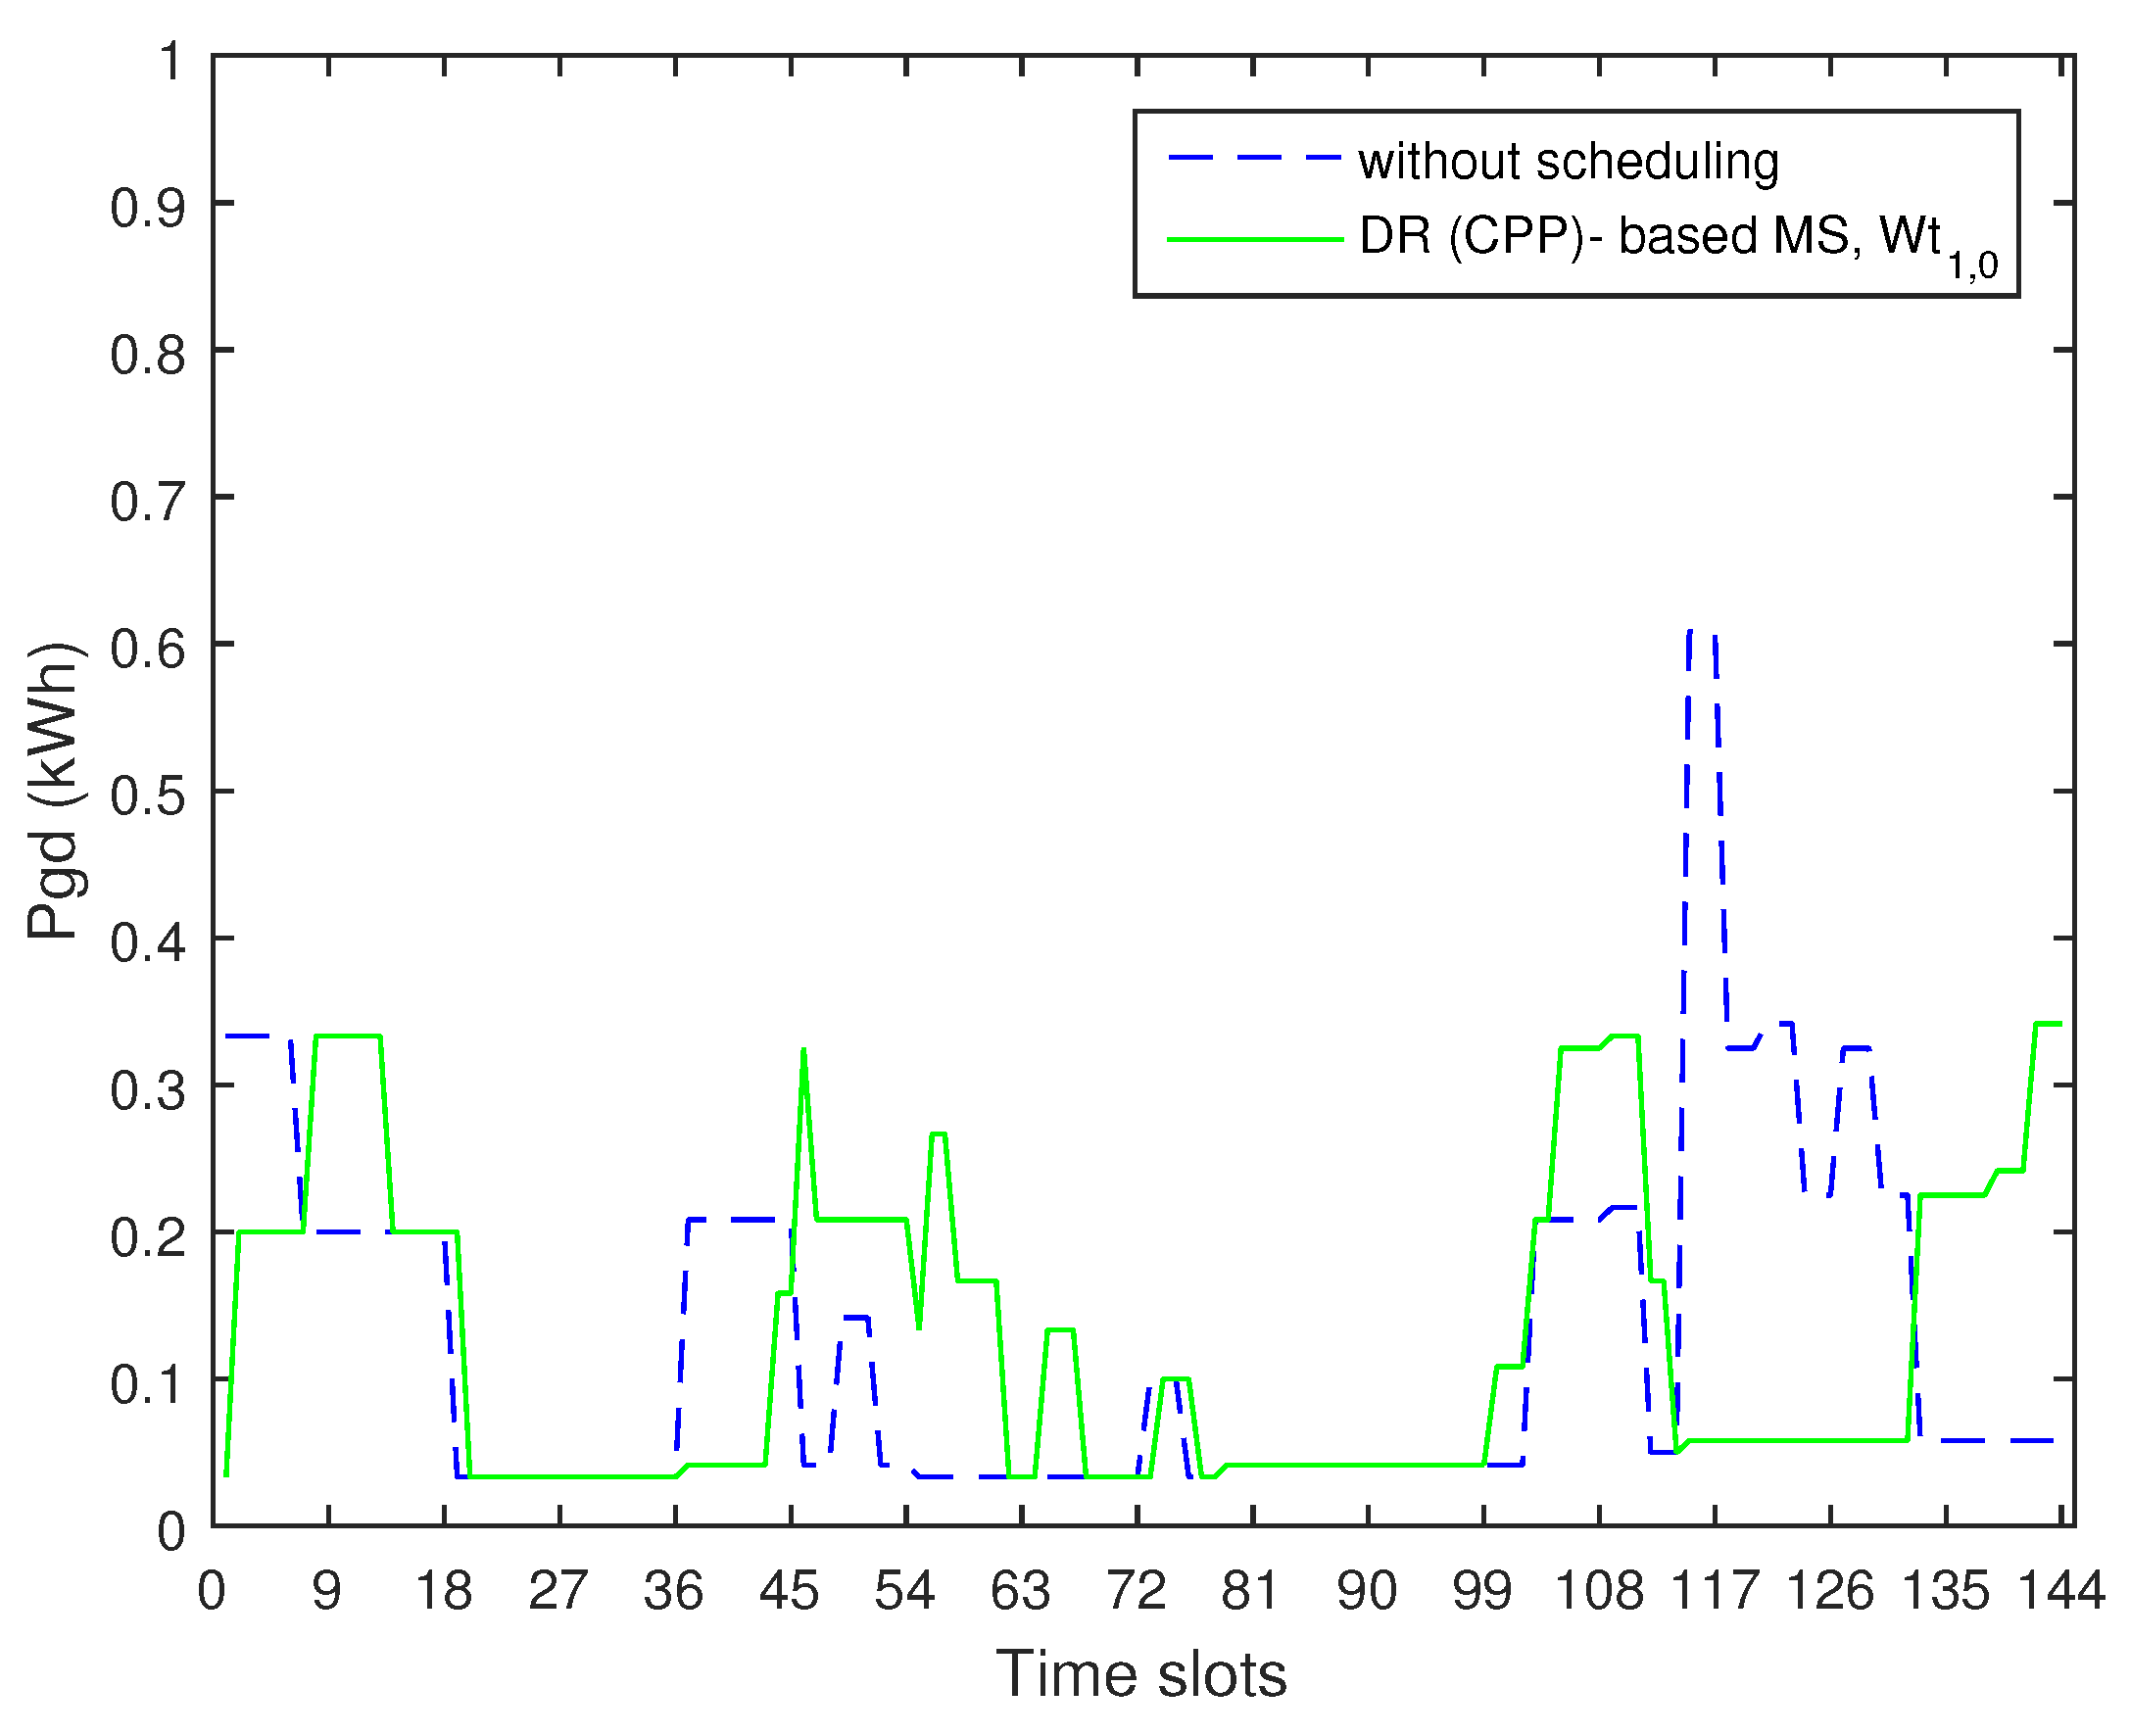
Referring to the scenario for CPP (with MS), some of the SHAs are modeled as AS while the others as DS. The algorithm can shift the operations of peak time loads like AC-3, AC-4, DW-2, and CP towards the off-peak slots numbered 139–144 in the forward direction, whereas the operations of loads like WM, WP, EG-2, RC-2, and IR can be shifted towards the off-peak slots numbered 1–114 in the advanced direction.
The simulated load profile after MS of HAs is shown in Figure 16. The algorithm curtailed the peak hours load range of 0.35–0.6 kWh to a lower value of 0.22 kWh supplied during slots numbered 133–138. The load curtailed out of the peak time load was shifted towards off-peak time slots numbered 139–144 in the forward and slots numbered 92–102 in the advanced directions. This bi-directional shifting of the load out of the peak time and the related very large reduction in the pricing co-efficient resulted in 32.7% reduction in C E for this scenario. Furthermore, MS-based load shifting successfully avoided the emergence of the peak load as well.

5.3. A DPA of the DWS-PSO Algorithm for PDDR-Based HEMS

Two metrics were established for DPA of DWS-PSO for PDDR- based HEMS. The first metric pertains to the maximum reduction in the C E . The metric mentioned for the diversified set of TPs have been furnished in Table 5. The second metric, the gradient of the TO line between percentage reduction in C E and T B D , is defined for the responsiveness of the algorithm for the reduction in the C E while increasing the value of T B D . The second metric was computed while drawing the TO solutions for the two parameters as follows:
(i)
The solution for the maximal reduction in the C E was computed by selecting weights of (1, 0) for the C E and T B D , respectively, while minimizing the SCF given in Equation (16).
(ii)
The solution for a minimal T B D was achieved while selecting values of weights as (0, 1) for the respective objectives of C E and T B D . These values of weights allocated a maximum priority to the minimization of the value of T B D while computing the SCF. Under this scenario, T B D is minimized to zero and, accordingly, all of the loads are operated as per the preferred starting times ( S T s l t ) and ending times ( E N s l t ) of HAs for DS and AS, respectively, as shown in Figure 17. The percentage reductions in C E , peak load, and T B D remained zero.
The aforementioned two scenarios for maximal and minimal reductions in C E and the corresponding T B D s are reflected in Figure 18.
The information revealed by Figure 18 are summarized in Table 6. The tabulated data were used for DPA of the DWS-PSO algorithm for PDDR- based HEMS. In this regard, the following conclusions were made:
(i)
When tested for the diversification in the modeling of SHAs, the algorithm showed better performance for MS-based HEMS as compared to the ones based on DS. The MS-based HEMSs outperformed for metrics 1 and 2.
(ii)
When tested for diversification for DPSs, the algorithm exhibited the best performance for TP based on CPP. Metric 1 stood at a value of 32.67% for a reduction in the C E , whereas metric 2 showed a value of 0.5026 kWh that was 2.41 times greater than the corresponding benchmark value of 0.2087 kWh for the TP for 2S-ToUP (DS). This highest value of metric 2 for CPP-based TPs seems sufficient to motivate the consumers to participate in PDDR for critical peak reduction. The scheme, however, has event-based application and is not available on a daily basis for PDDR.
(iii)
The algorithm could not avoid the peak rebounds due to the lesser value of I B R ratio for CPP (DS)- based TPs. The algorithm is proposed to be used with a CPP (MS)-based scheme for achieving the highest performance for metrics 1 and 2 and avoidance of the peak rebounds simultaneously.
(iv)
When tested for the diversification for DPSs used on a daily basis, the performance of the algorithm was ranked 1–6 for DA-RTP (MS), DA-RTP (DS), 3S-ToUP (MS), 3S-ToUP (DS), 2S-ToUP (MS), 2S-ToUP (DS)-based TPs, respectively. This indexing of the algorithm for DPA is based on the proposed metrics 1 and 2.
(v)
The algorithm showed the best performance for CPP (MS) and DA-RTP (MS) for the event-based and daily based pricing schemes, respectively.

5.4. Simulations for PDDR-RED-Based HEMS Using DWS-PSO

Simulations were also carried out for DPA of DWS-PSO algorithm for PDDR-RED-based HEMS. The algorithm was tested on a set of TPs for HEMS for 2S-ToUP (DS/MS), CPP (DS/MS), 3S-ToUP (DS/MS), and DA-RTP (DS/MS). The capability of DWS-PSO for maximum reductions in C E n e t along with the related T B D 
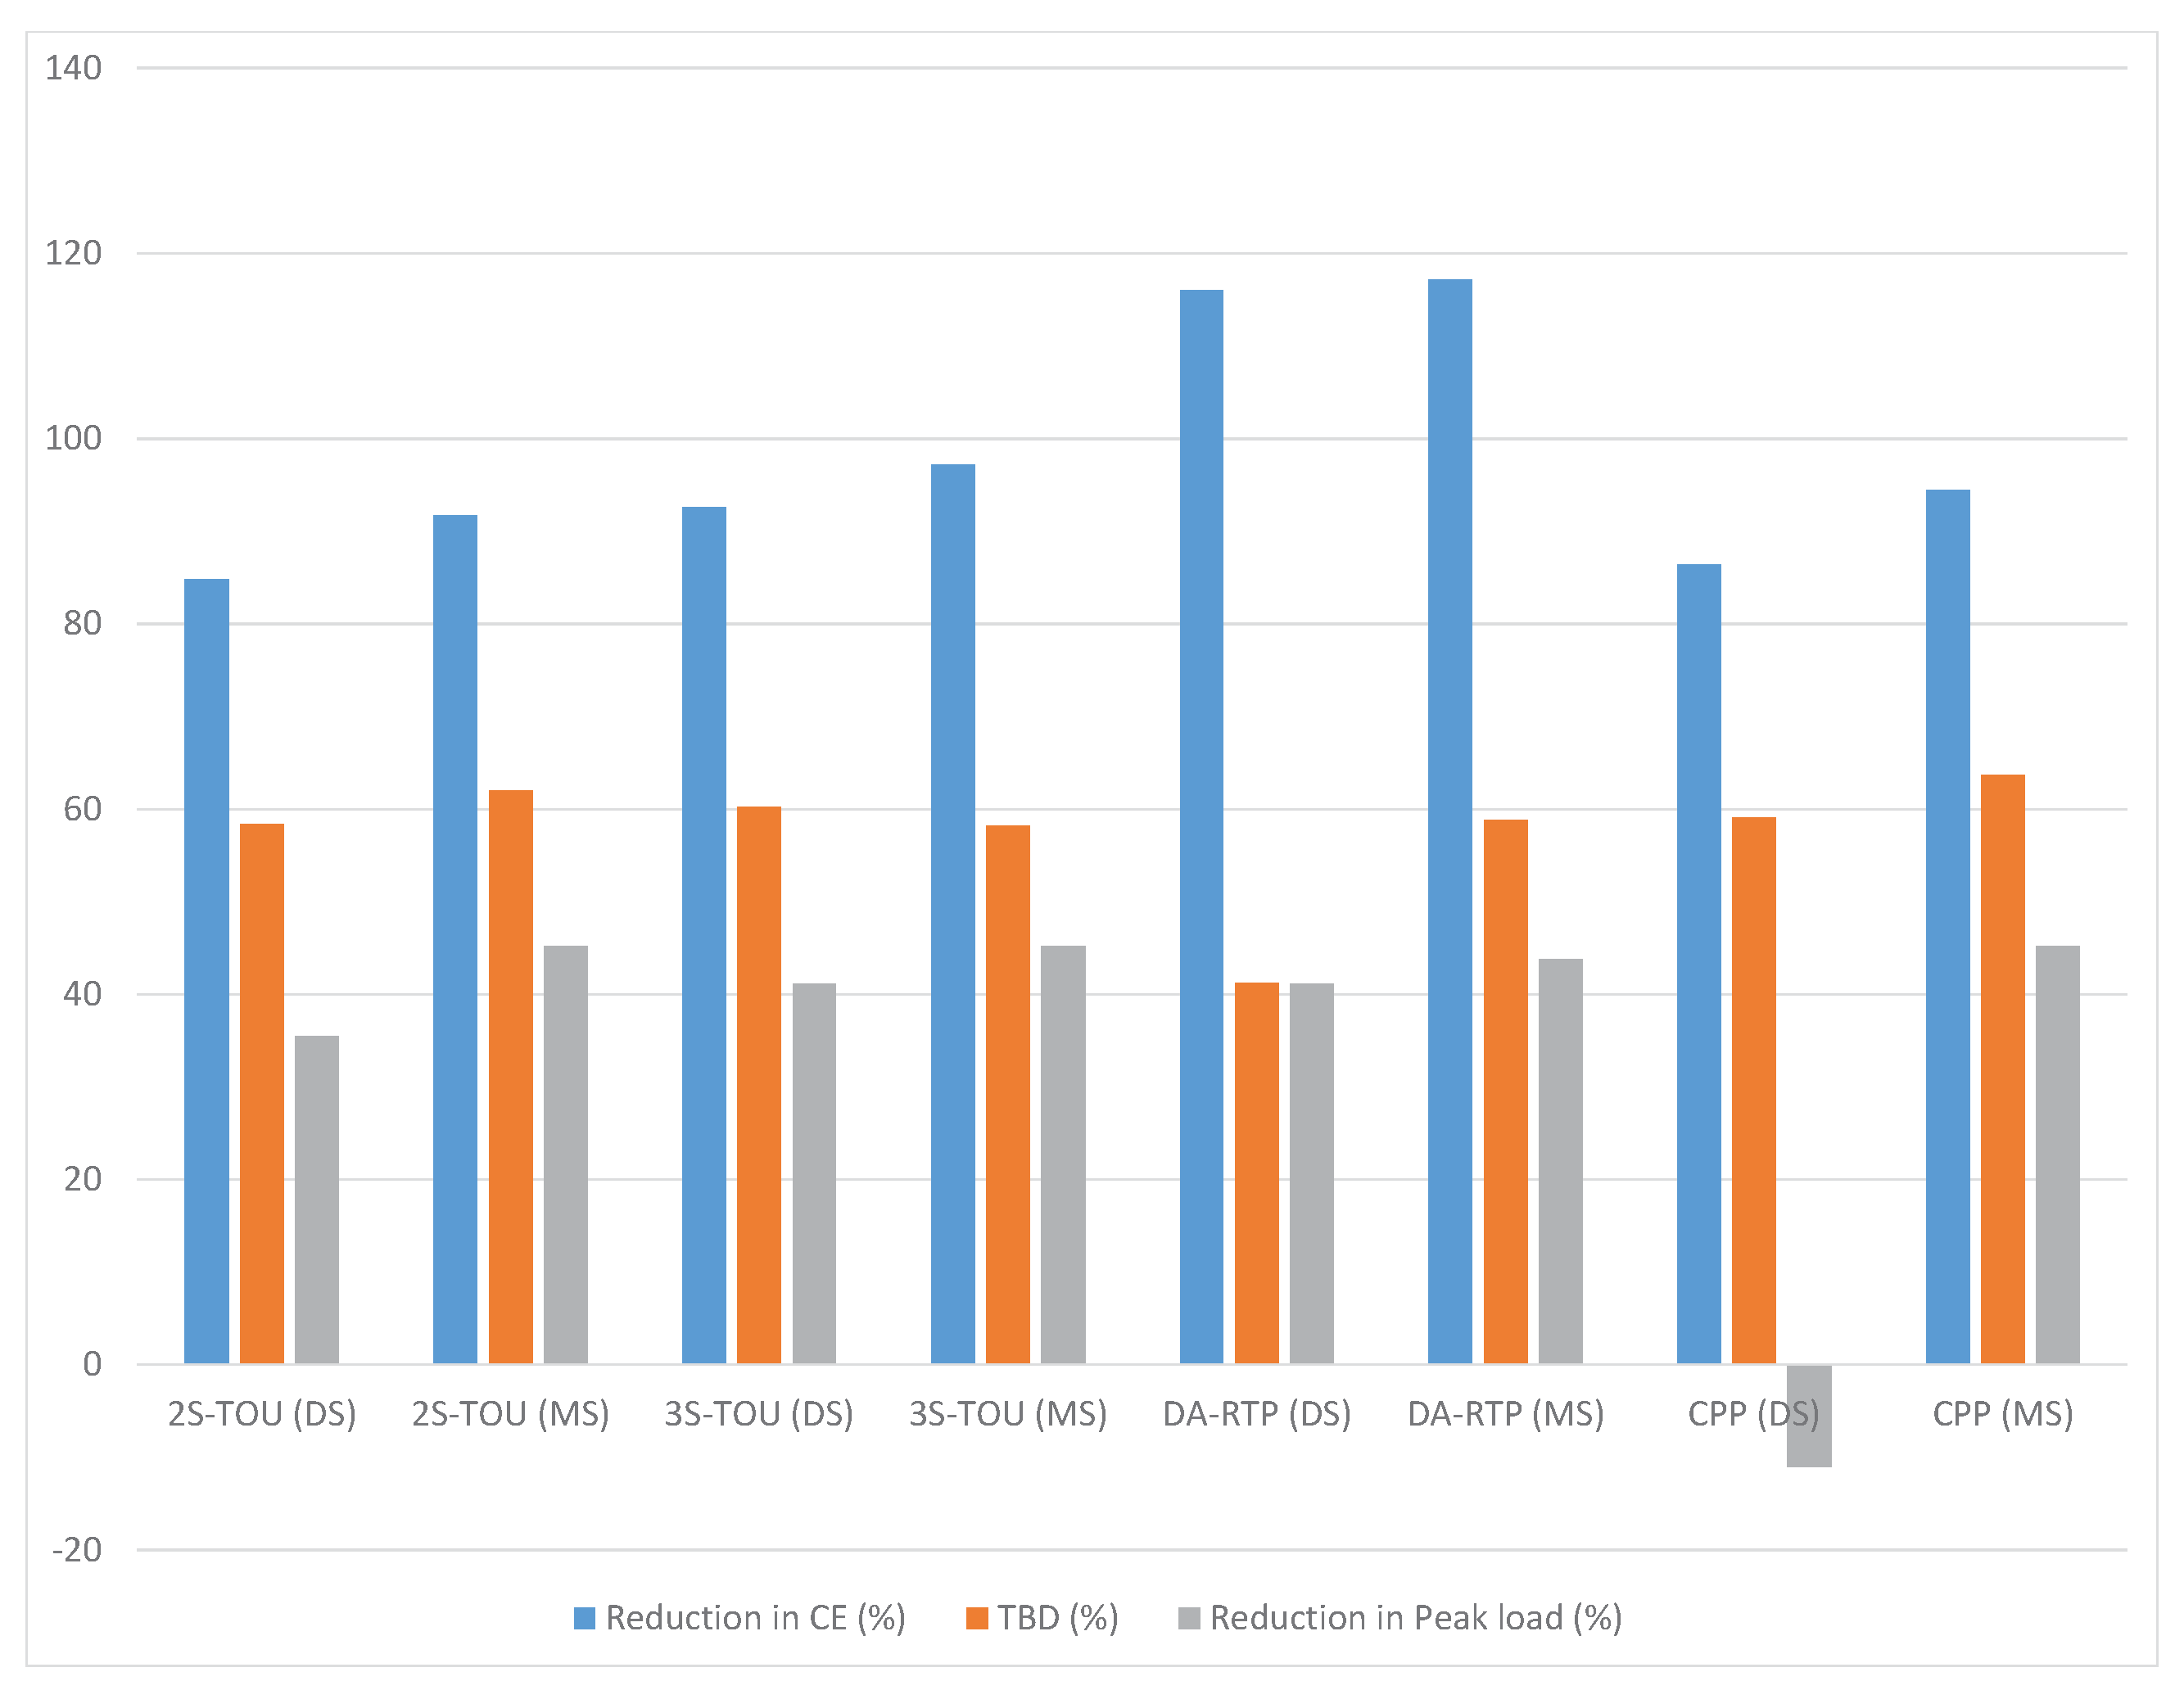
for PDDR-RED-based HEMS, while using weights of values (1, 0), is reflected in Figure 19. Table 7 furnishes the achieved performance parameters for the maximal reductions in the C E n e t , and the corresponding values of T B D and peak load for the complete set of TPs.
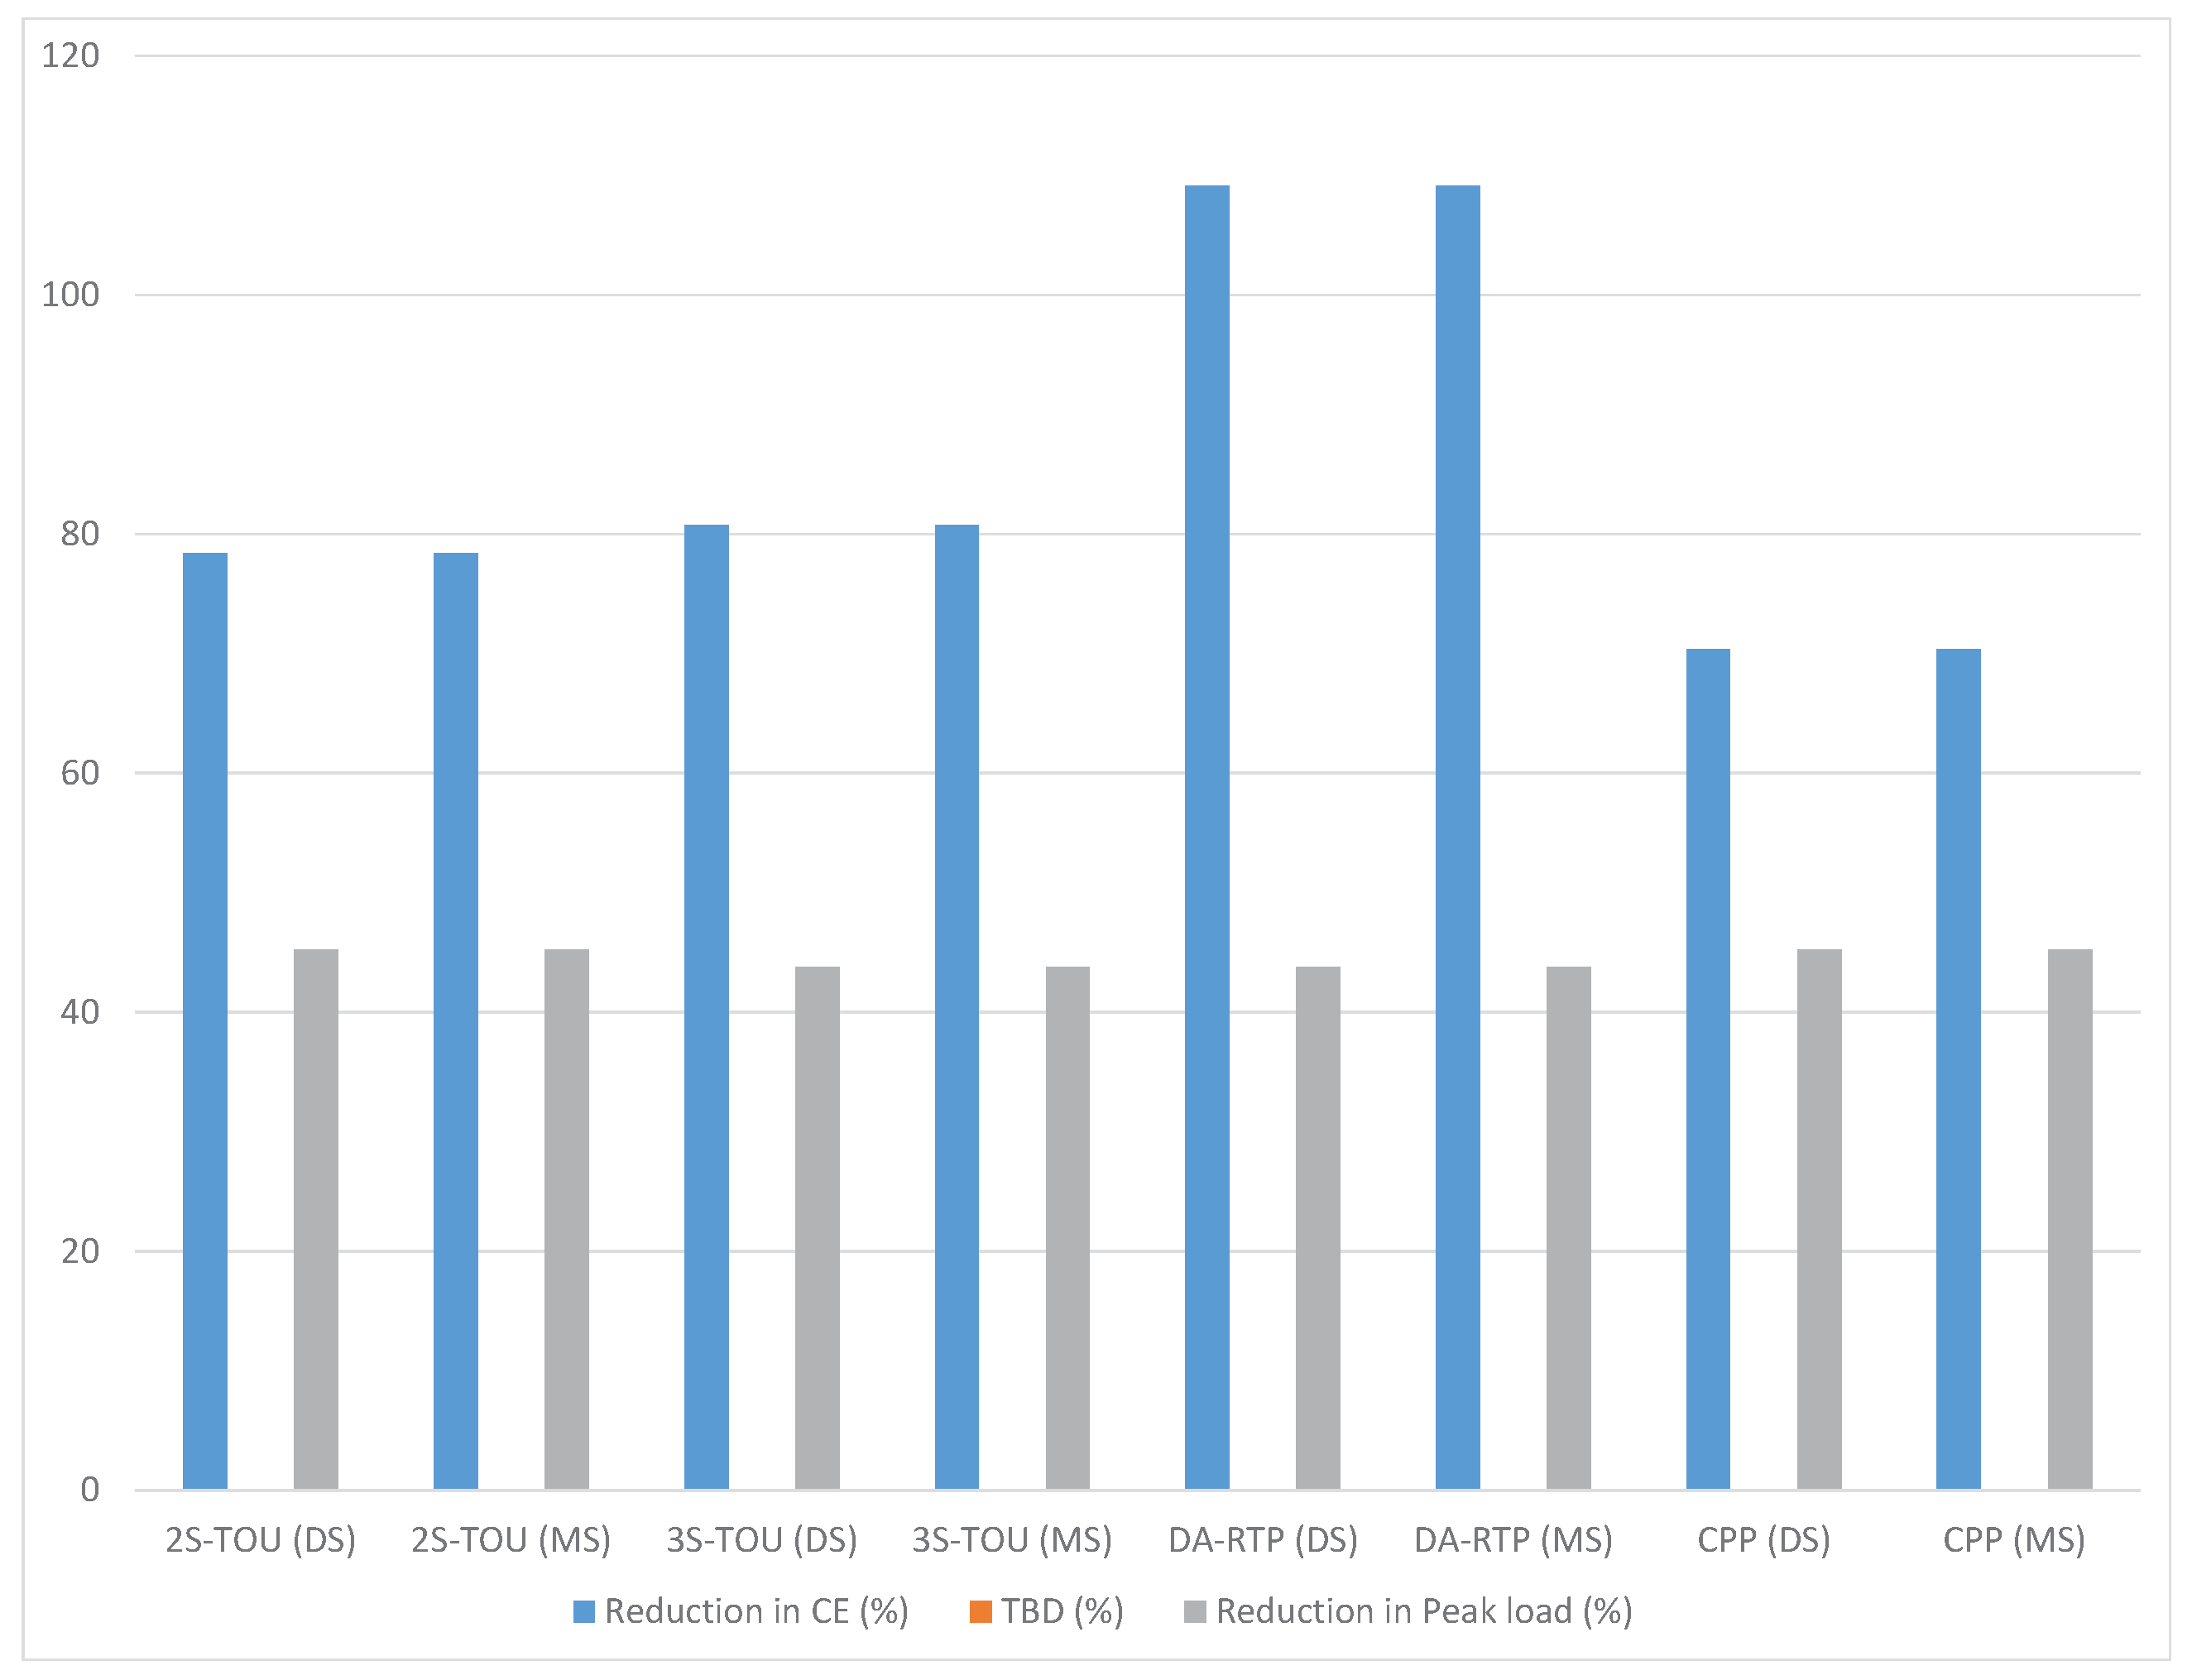
The capability of DWS-PSO for achieving a minimal value of T B D with weights of values (0, 1) for PDDR-RED-based HEMS was also analyzed. In this scenario, the algorithm minimized the value of T B D to zero and accordingly all of the loads were operated as per the preferred starting times ( S T s l t ) and ending times ( E N s l t ) of HAs for DS and AS, respectively. However, contrarily to the same scenario for PDDR- based HEMS, a reduction of C E n e t was achieved as shown in Figure 20. This reduction was based on the optimal dispatch of the existing power sources at home, including PV and SB system for supplying a non-scheduled (fixed) load corresponding to a zero value of T B D . The strategy for optimal dispatch had already been embedded in algorithm 2. The RED-based strategy, as a part of algorithm 2, was primarily based on (a) preferred direct usage of the energy from the PV system; (b) storage of the excess energy from the PV into the SB during off-peak hours; (c) discharge of the SB during peak hours to supply the load; (d) parallel operation of the SB with the power grid under the limiting conditions for S O C G and the discharge rates; and (e) selling of the excess energy to the grid. The proposed scheme was designed for the optimal dispatch of the PV, SB, and the power grid for supplying of the consumer load and selling back the extra PV energy to the utility in order to minimize the C E n e t .
The simulation results for RED-based HEMS using weight values (0, 1) for a minimum value of T B D are summarized in Table 8. The algorithm achieved the maximum reductions of 96.6% in the C E n e t for the TP based on DA-RTP when applied merely for the optimal dispatch of the sources without opting any PDDR based shifting of HAs.

5.5. Simulation Results Discussion for PDDR-RED-Based HEMS

In this section, the performance of the algorithm is discussed for solving PDDR-RED-based HEMS problems for the proposed set of TPs. Furthermore, the algorithm is used to solve HEMS problems with respective weights of (1, 0) and (0, 1) for the TO solutions with a maximal reduction in the C E n e t and a minimal 0 value of T B D , respectively.
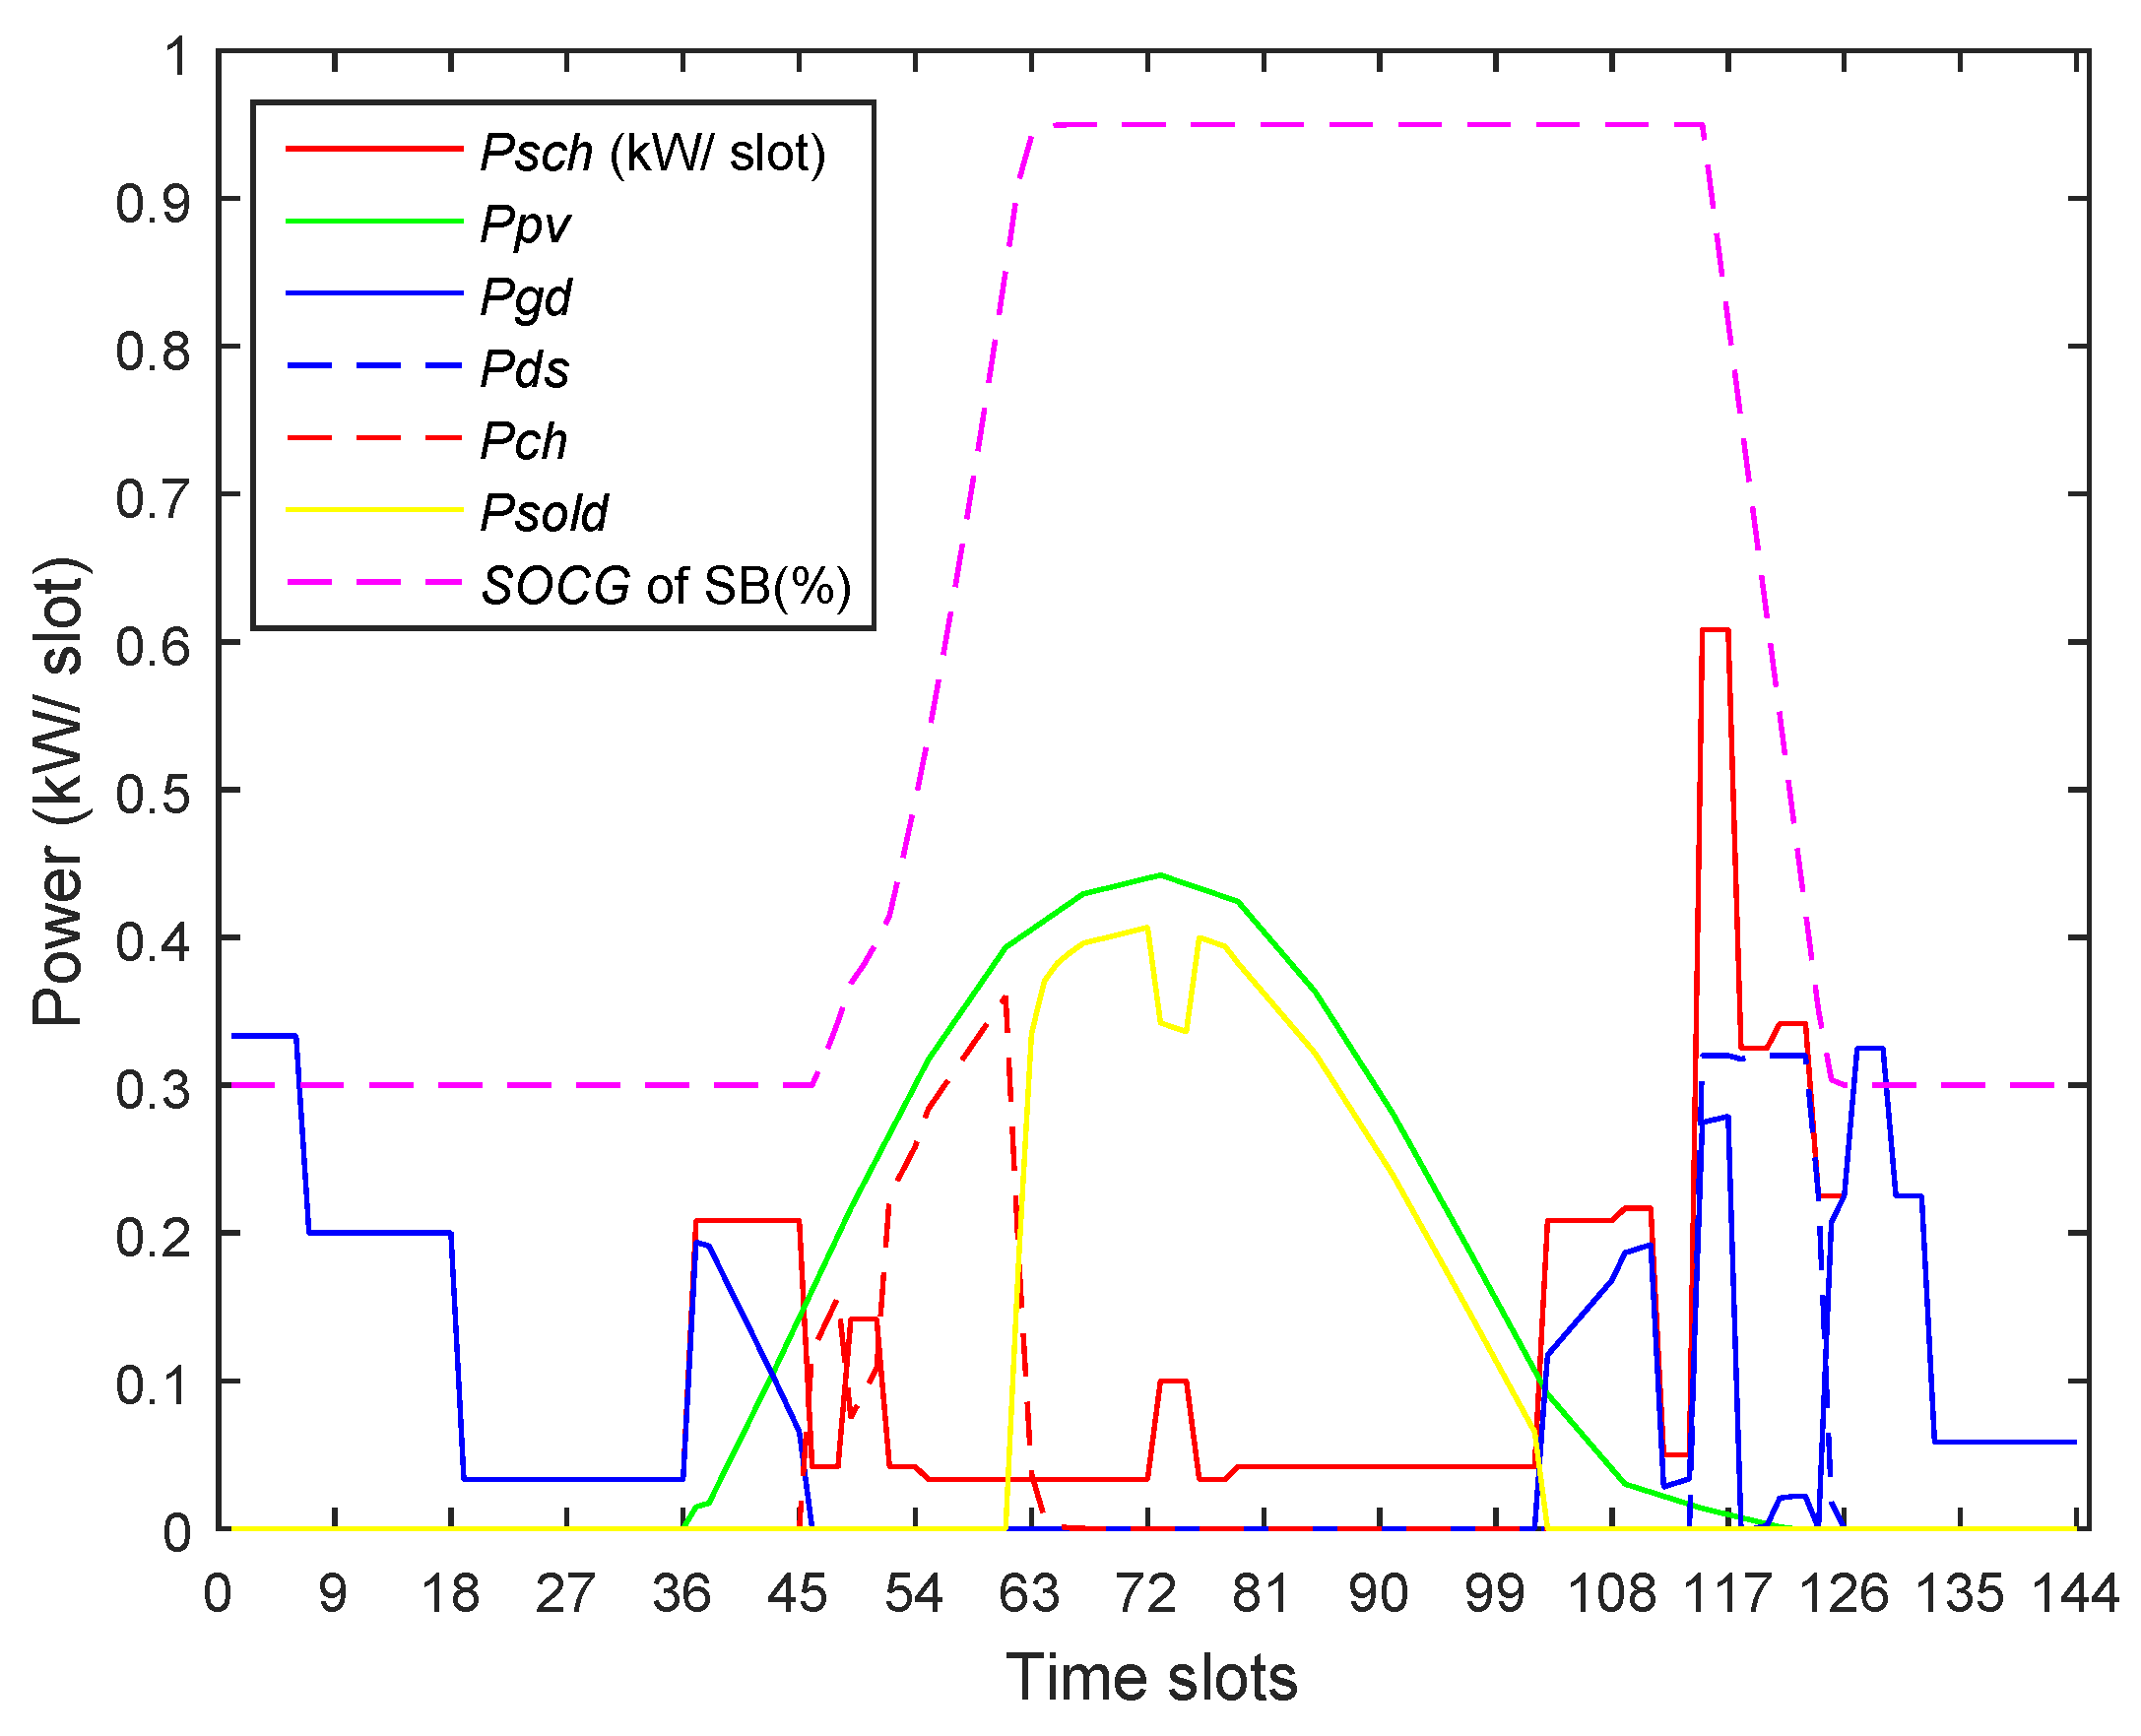
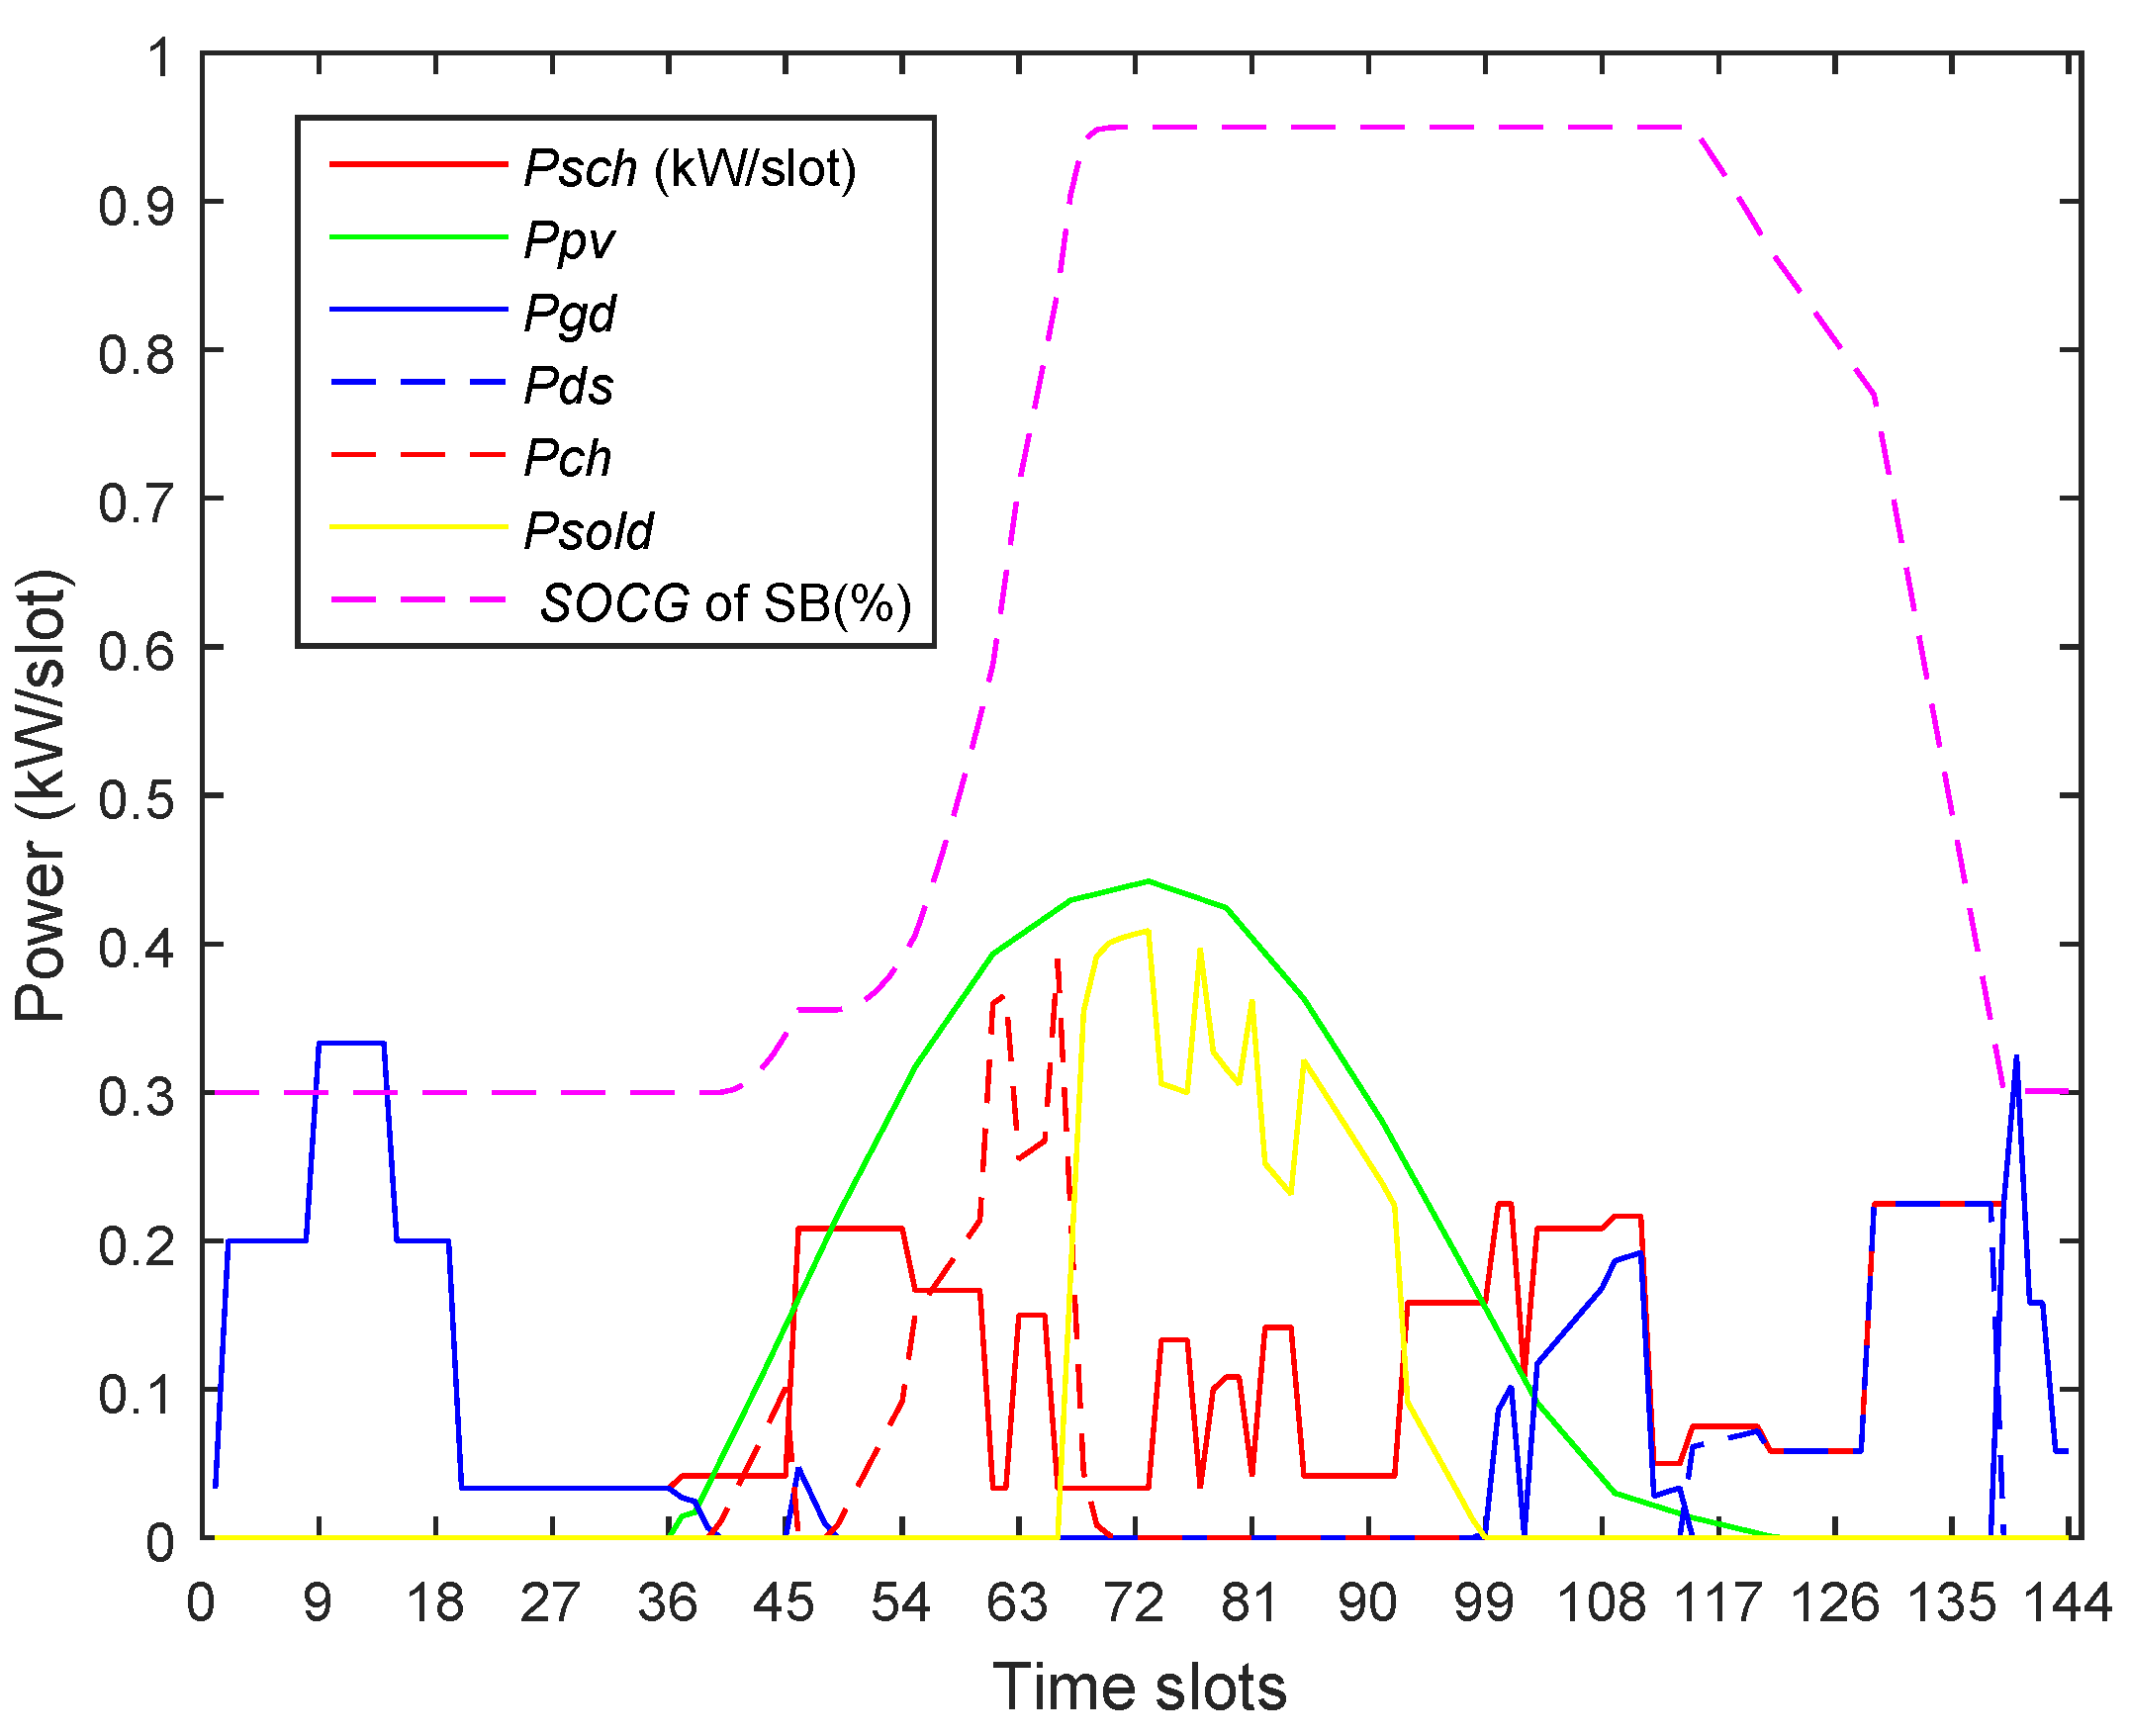
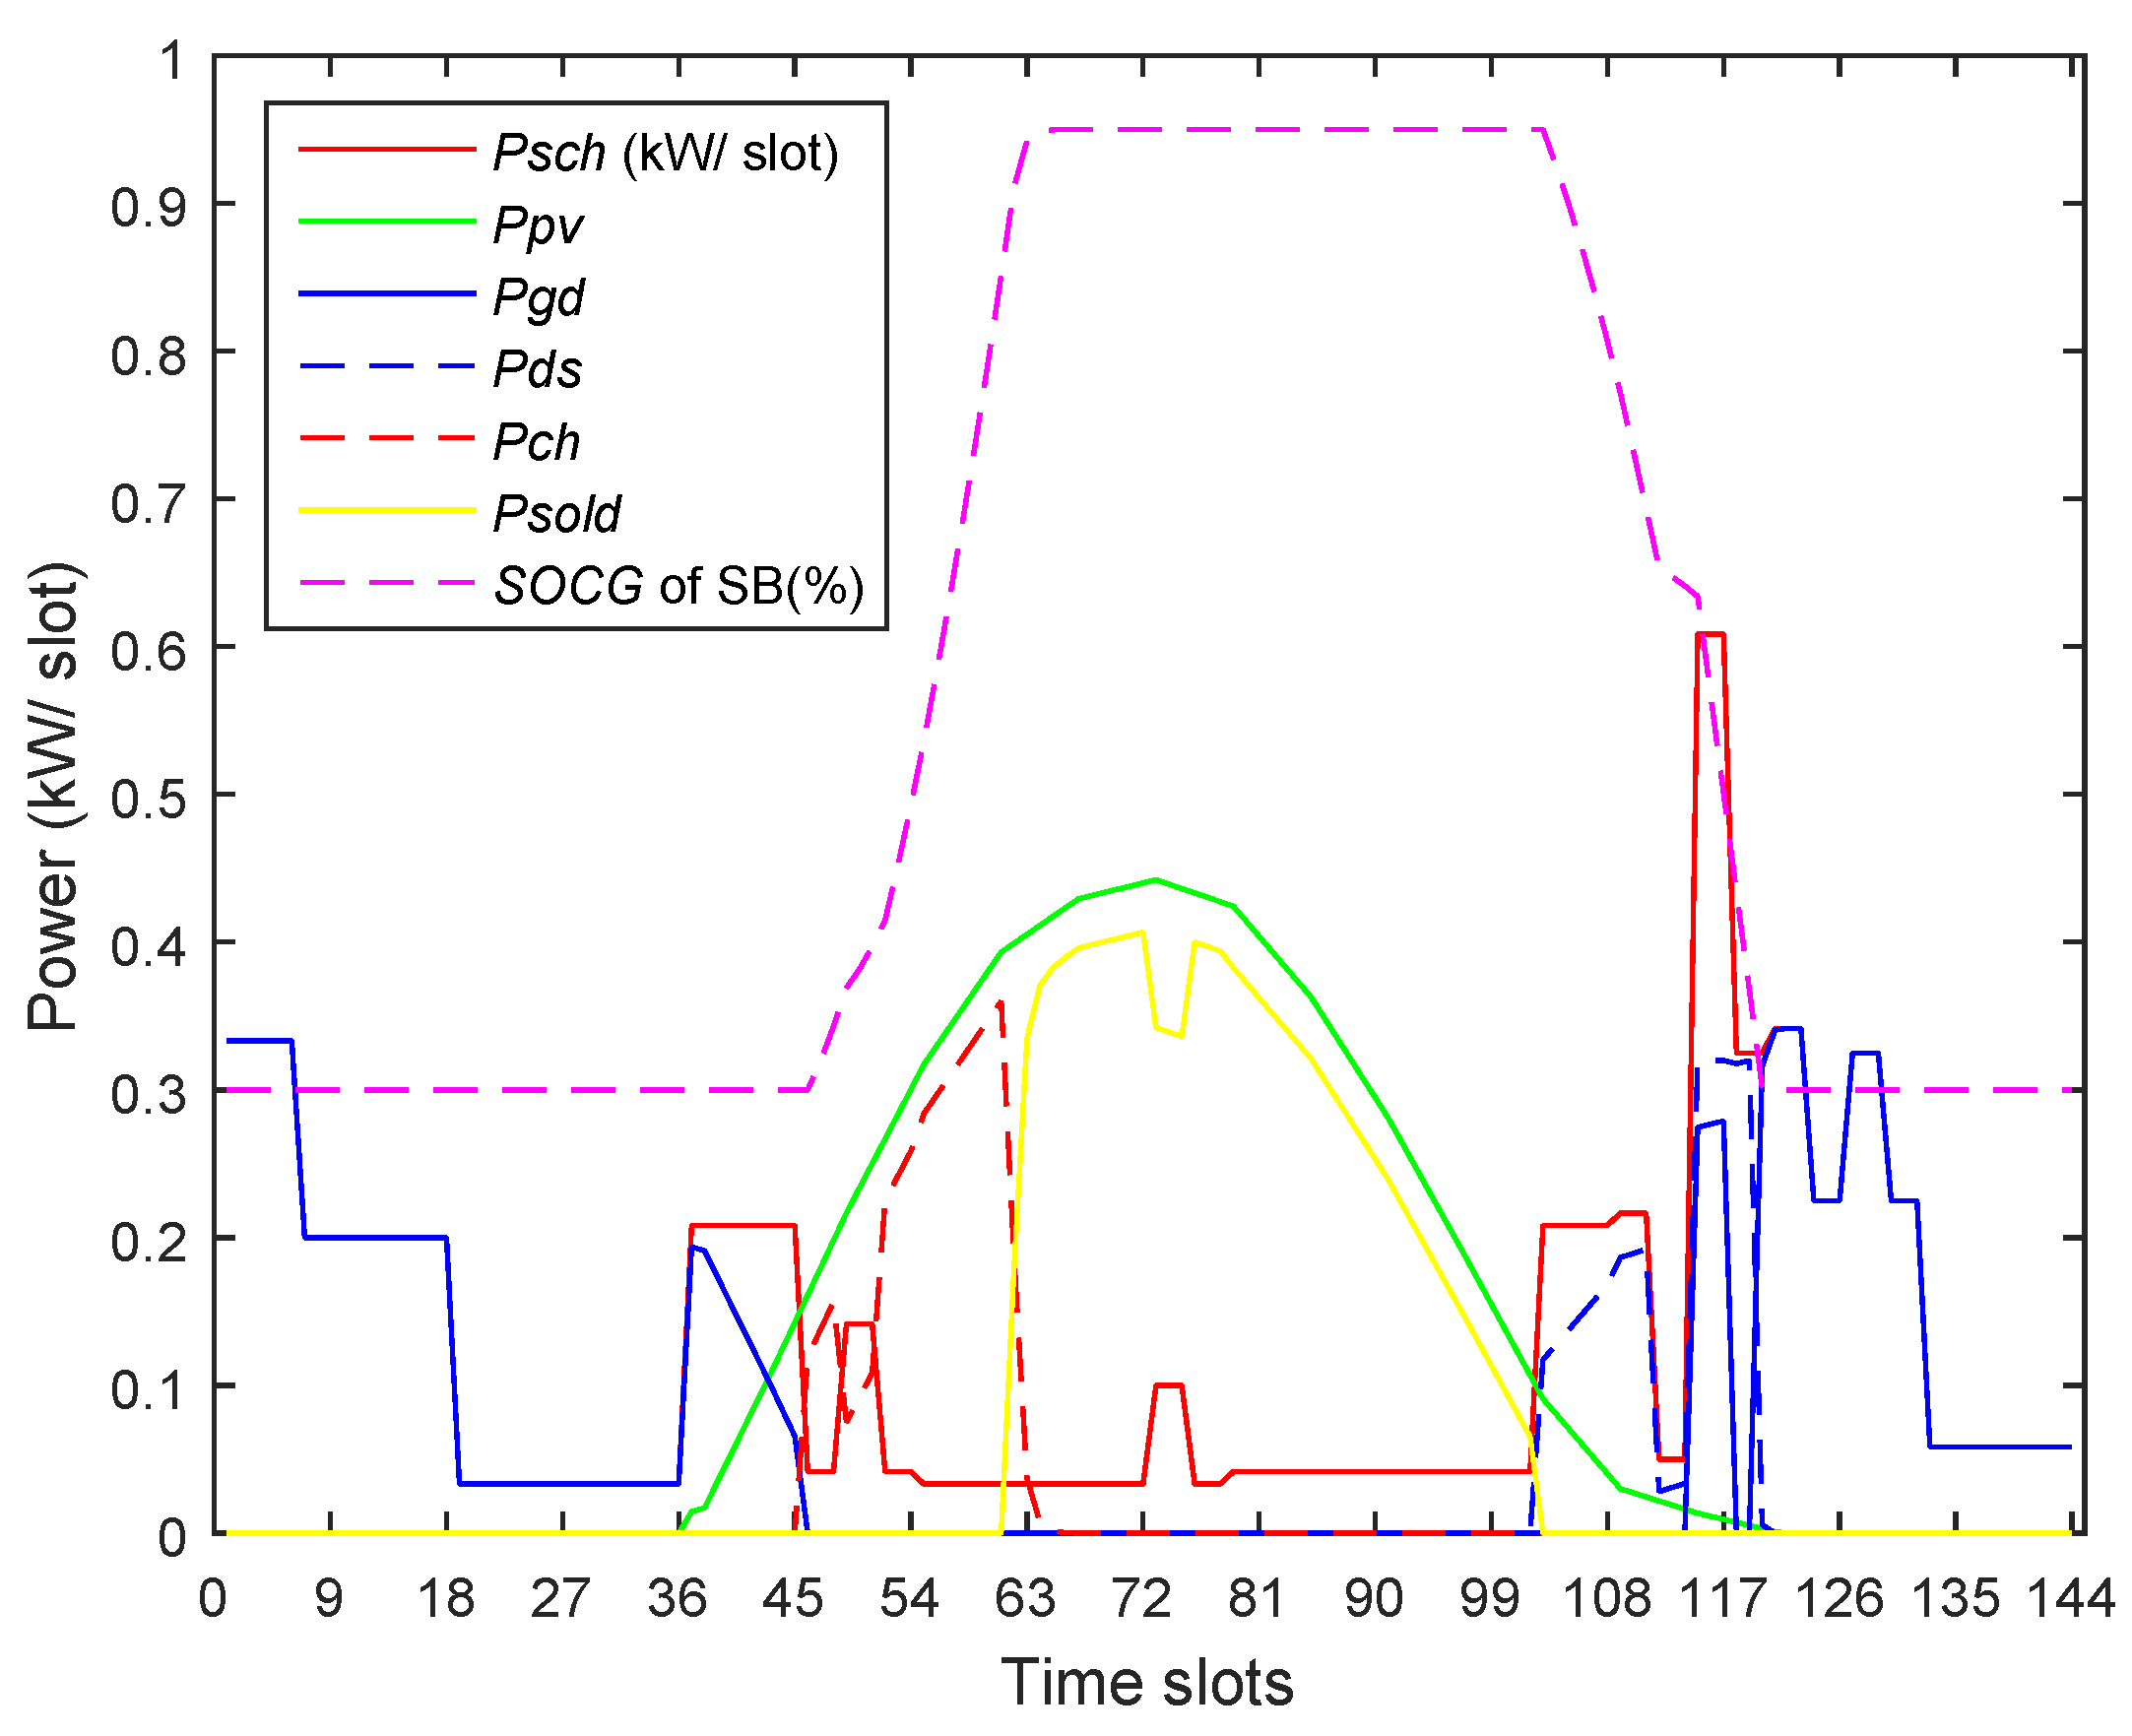
The TP for 2S-ToUP (non-shifted) was solved with weights of (0, 1) for a minimal T B D . The resulting energy profiles are shown in Figure 21. Under this scenario, the SB was charged through the PV energy available during off-peak slots numbered 45–63. The SB transported that energy towards the peak hours and supplied some of the peak time load during slots numbered 115–126. However, due to the limited discharge rates and the capacity of the SB, the load during peak time slots numbered 113–118 and 126–138 had to be supplied through the grid at higher prices. The RED-based operation resulted in 78.42% reductions in the C E n e t based on the 218 Cents per day for the 2S-ToUP scheme in PDDR- based HEMS. The load shifting was not taken into accounts under this scenario and the reduction in the C E n e t is based on the optimal dispatch strategy implemented for the PV/SB system (installed at a home) and the power grid.
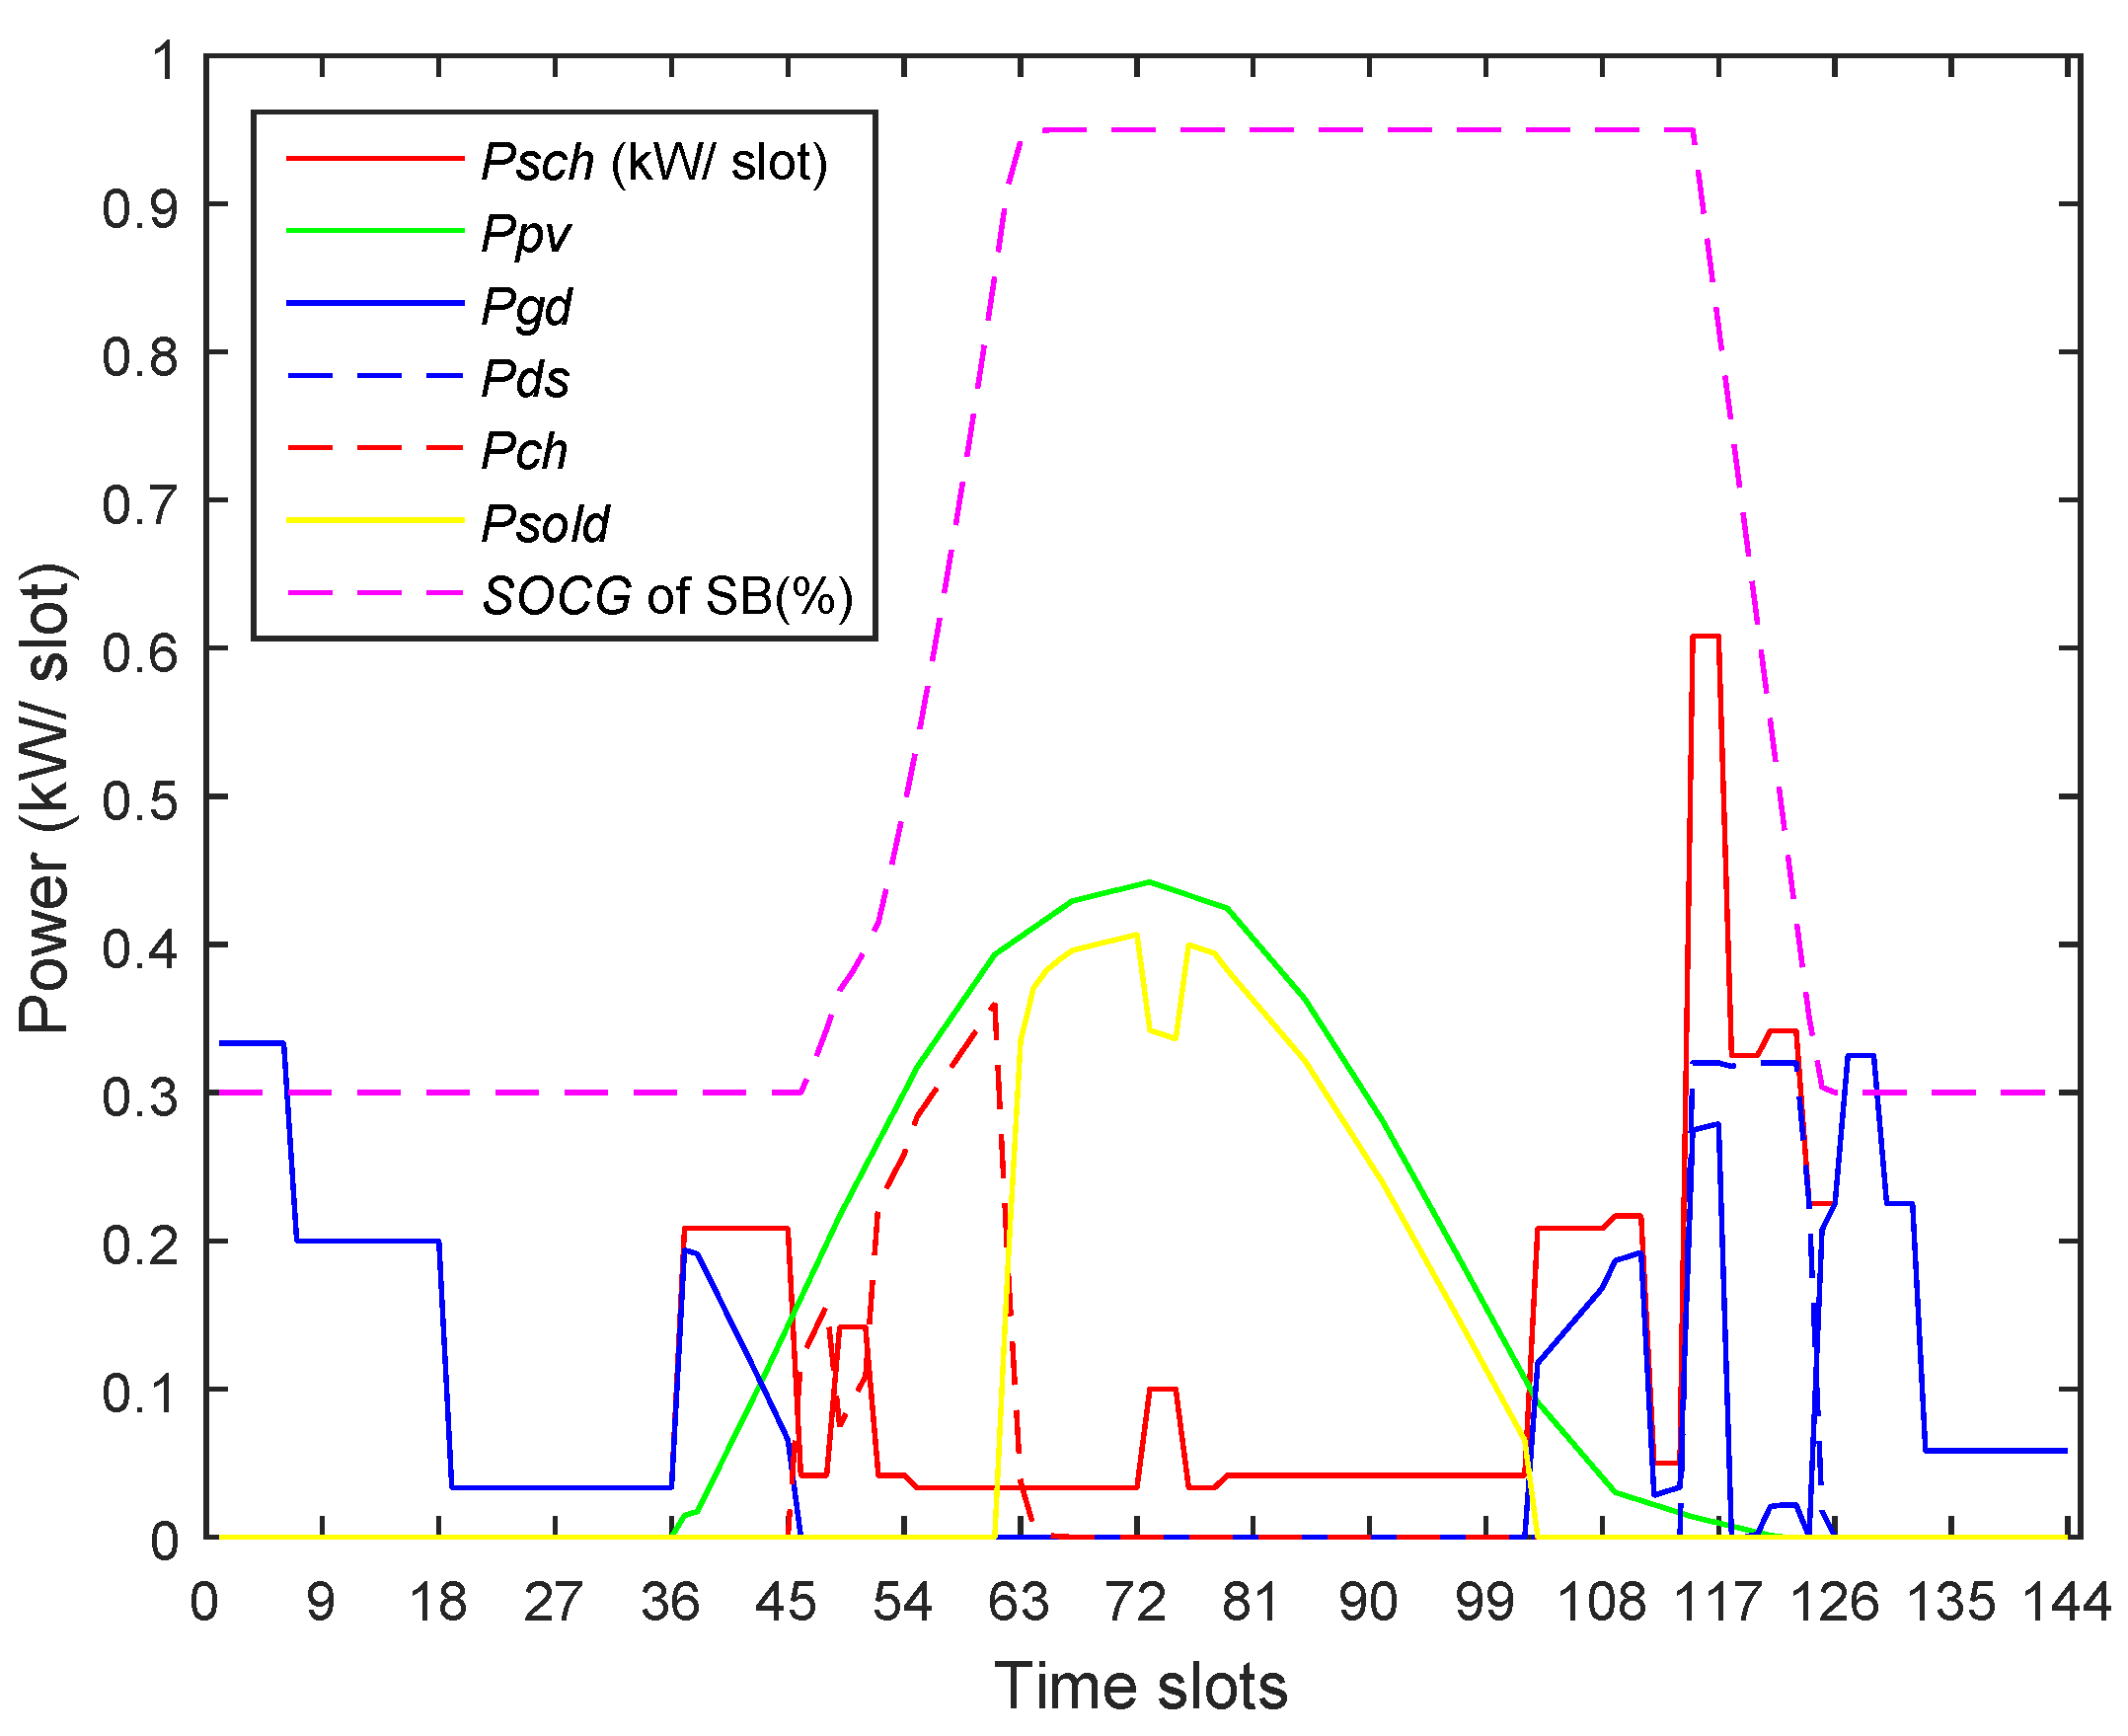
Referring to TP for 2S-ToUP (DS), which was solved with weights of (1, 0) for a maximal reduction in C E n e t . The resulting energy profiles are depicted in Figure 22. The SB was charged with the PV energy during off-peak slots numbered 45–63. Based on DS, the peak time load is shifted forward towards slots numbered 138–144. The remaining un-shifted load lying within the peak-hours was supplied through the SB. However, due to the limited capacity of the SB, 0.37 kWh of the load was supplied through the grid during peak time slots numbered 136–138. The algorithm, while combining the effect of PDDR-based DS with the optimal dispatch of the PV system, the SB, and the grid has achieved a reduction of 84.78% in C E n e t for 2S-ToUP with DS.
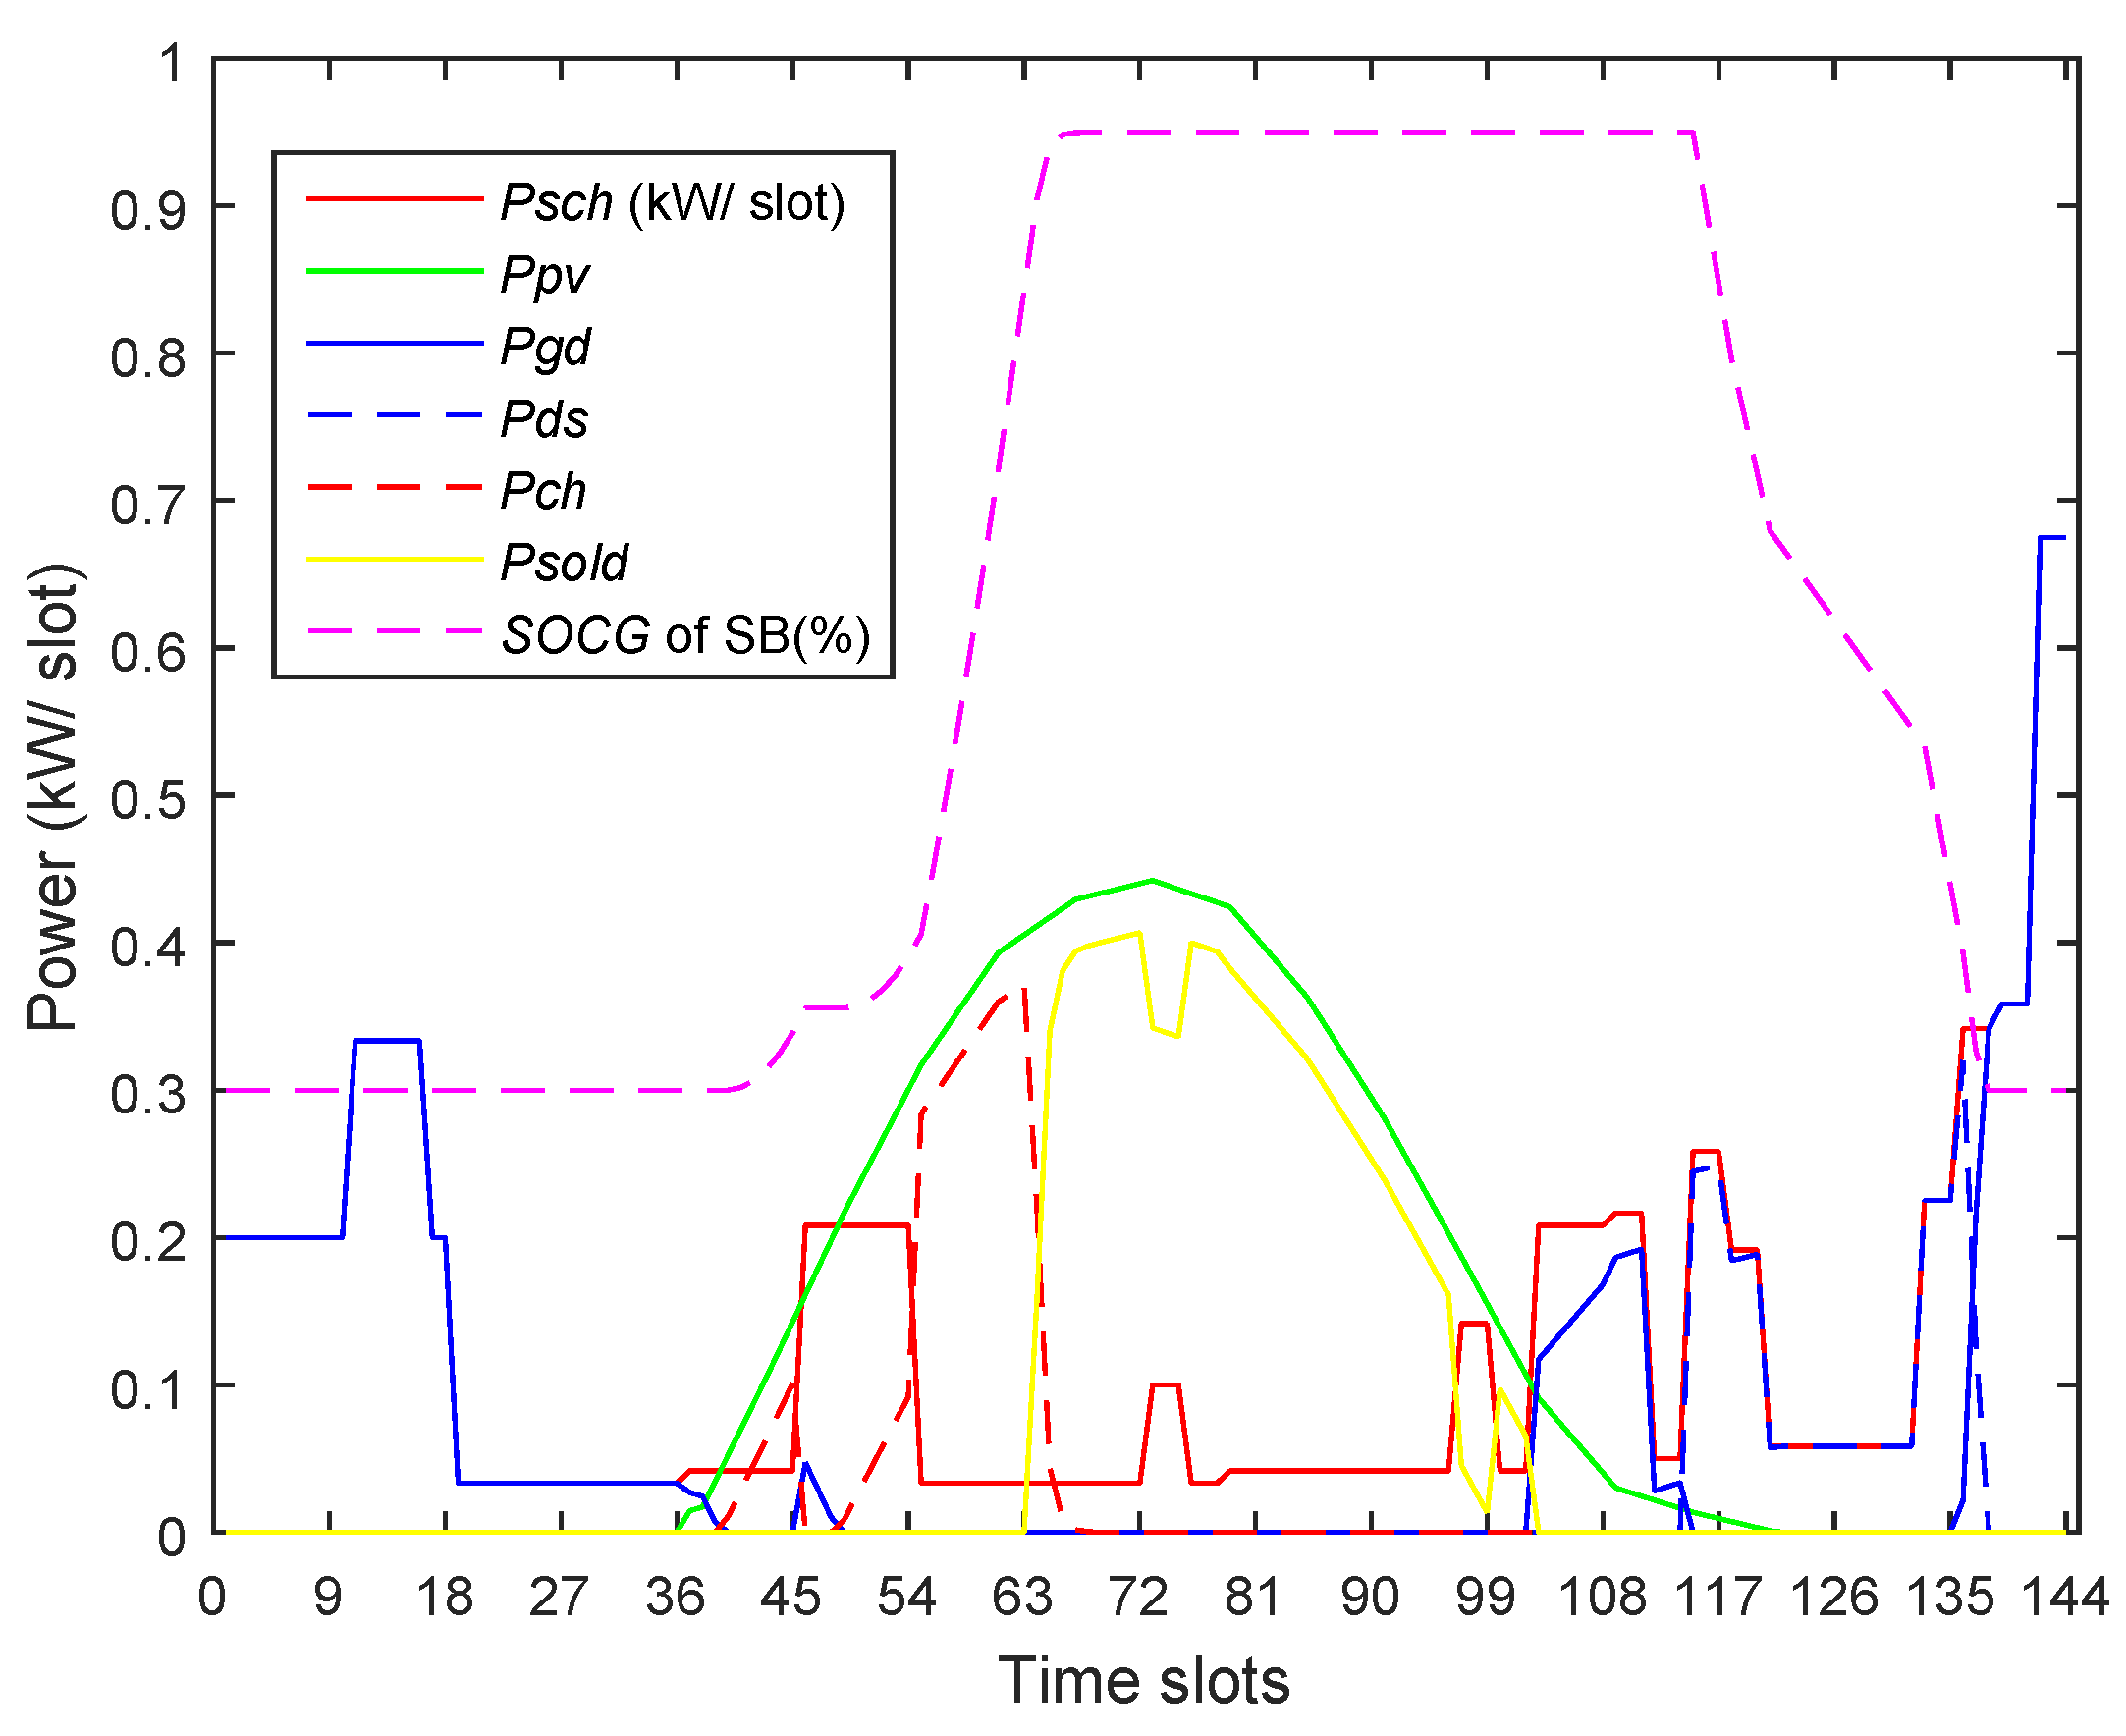
The results for TP for 2S-ToUP (MS) with weights of (1, 0) is shown in Figure 23 for a maximal reduction in C E n e t . The SB was charged with the PV energy available during off-peak slots numbered 45–70. Based on MS, some of the peak time load was shifted forward towards the off-peak time slots numbered 138–144, whereas the rest of the load was shifted in the advanced direction towards the off-peak slots numbered 45–115. The AS load was supplied through the PV system directly in order to achieve a higher reduction in the C E n e t . The remaining un-shifted peak hours load was completely supplied through the SB that was charged through the PV units ahead in time. The algorithm achieved a 91.69% reduction in the C E n e t for TP based on 2S-ToUP (MS).
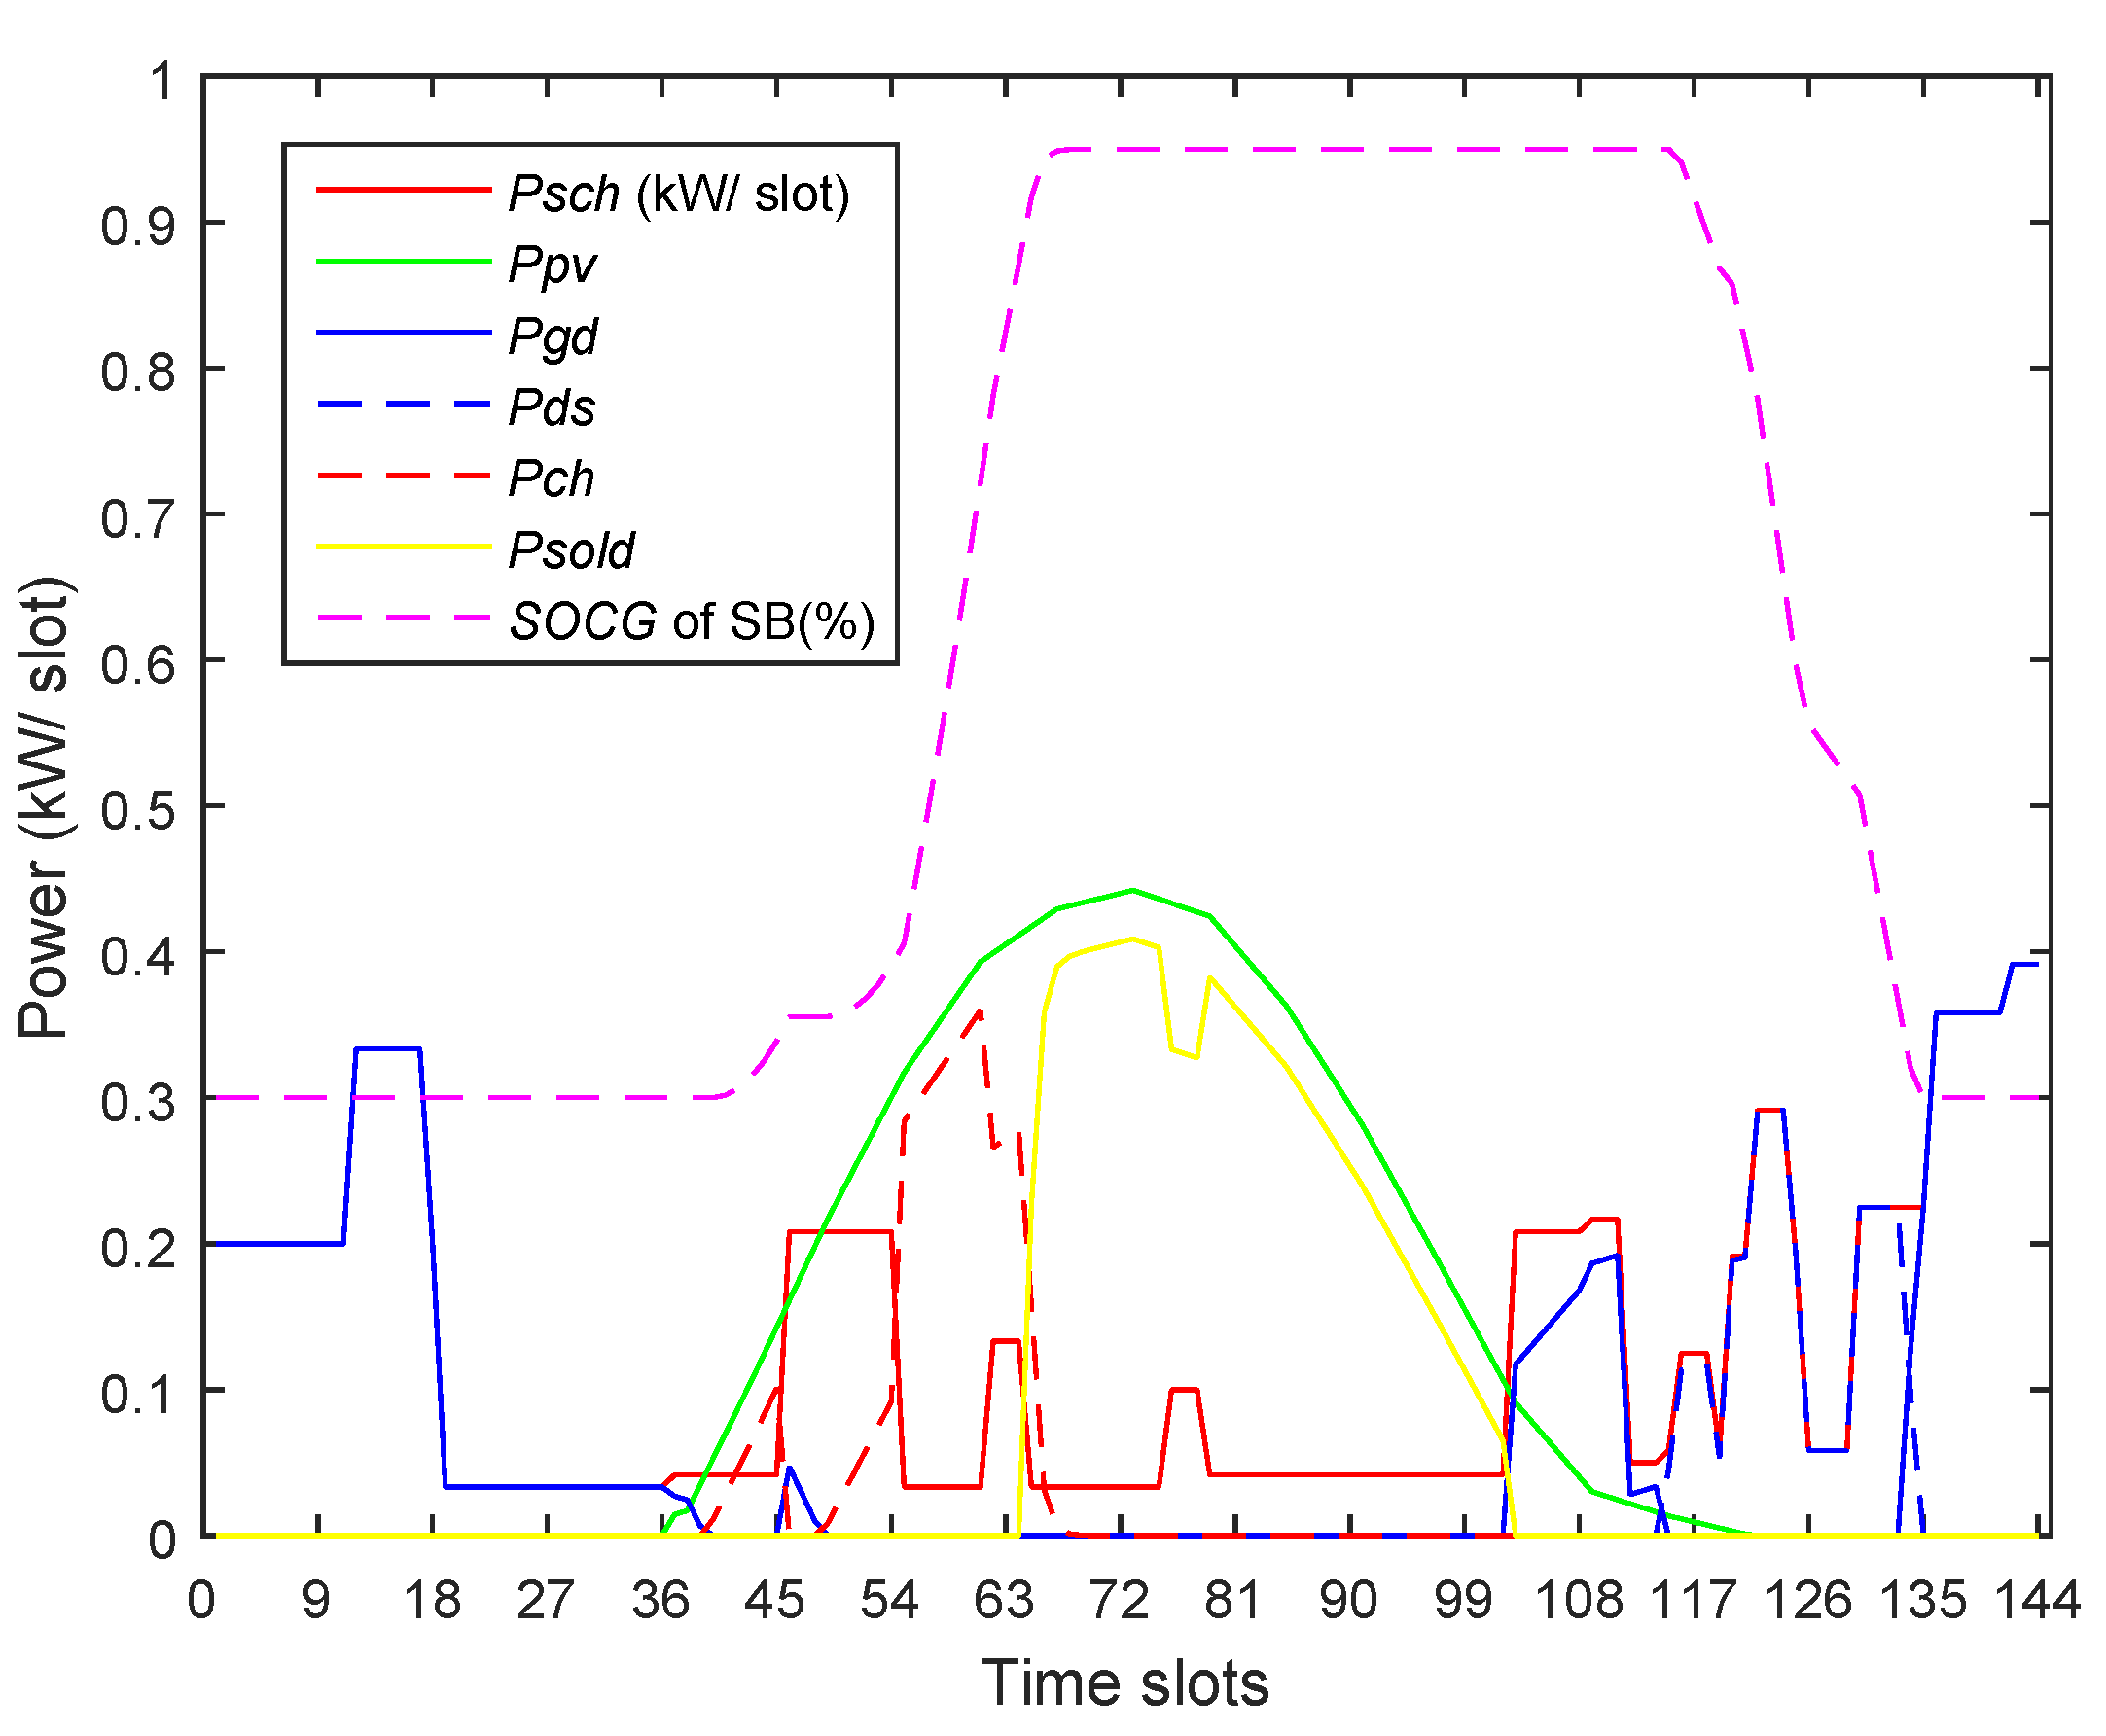
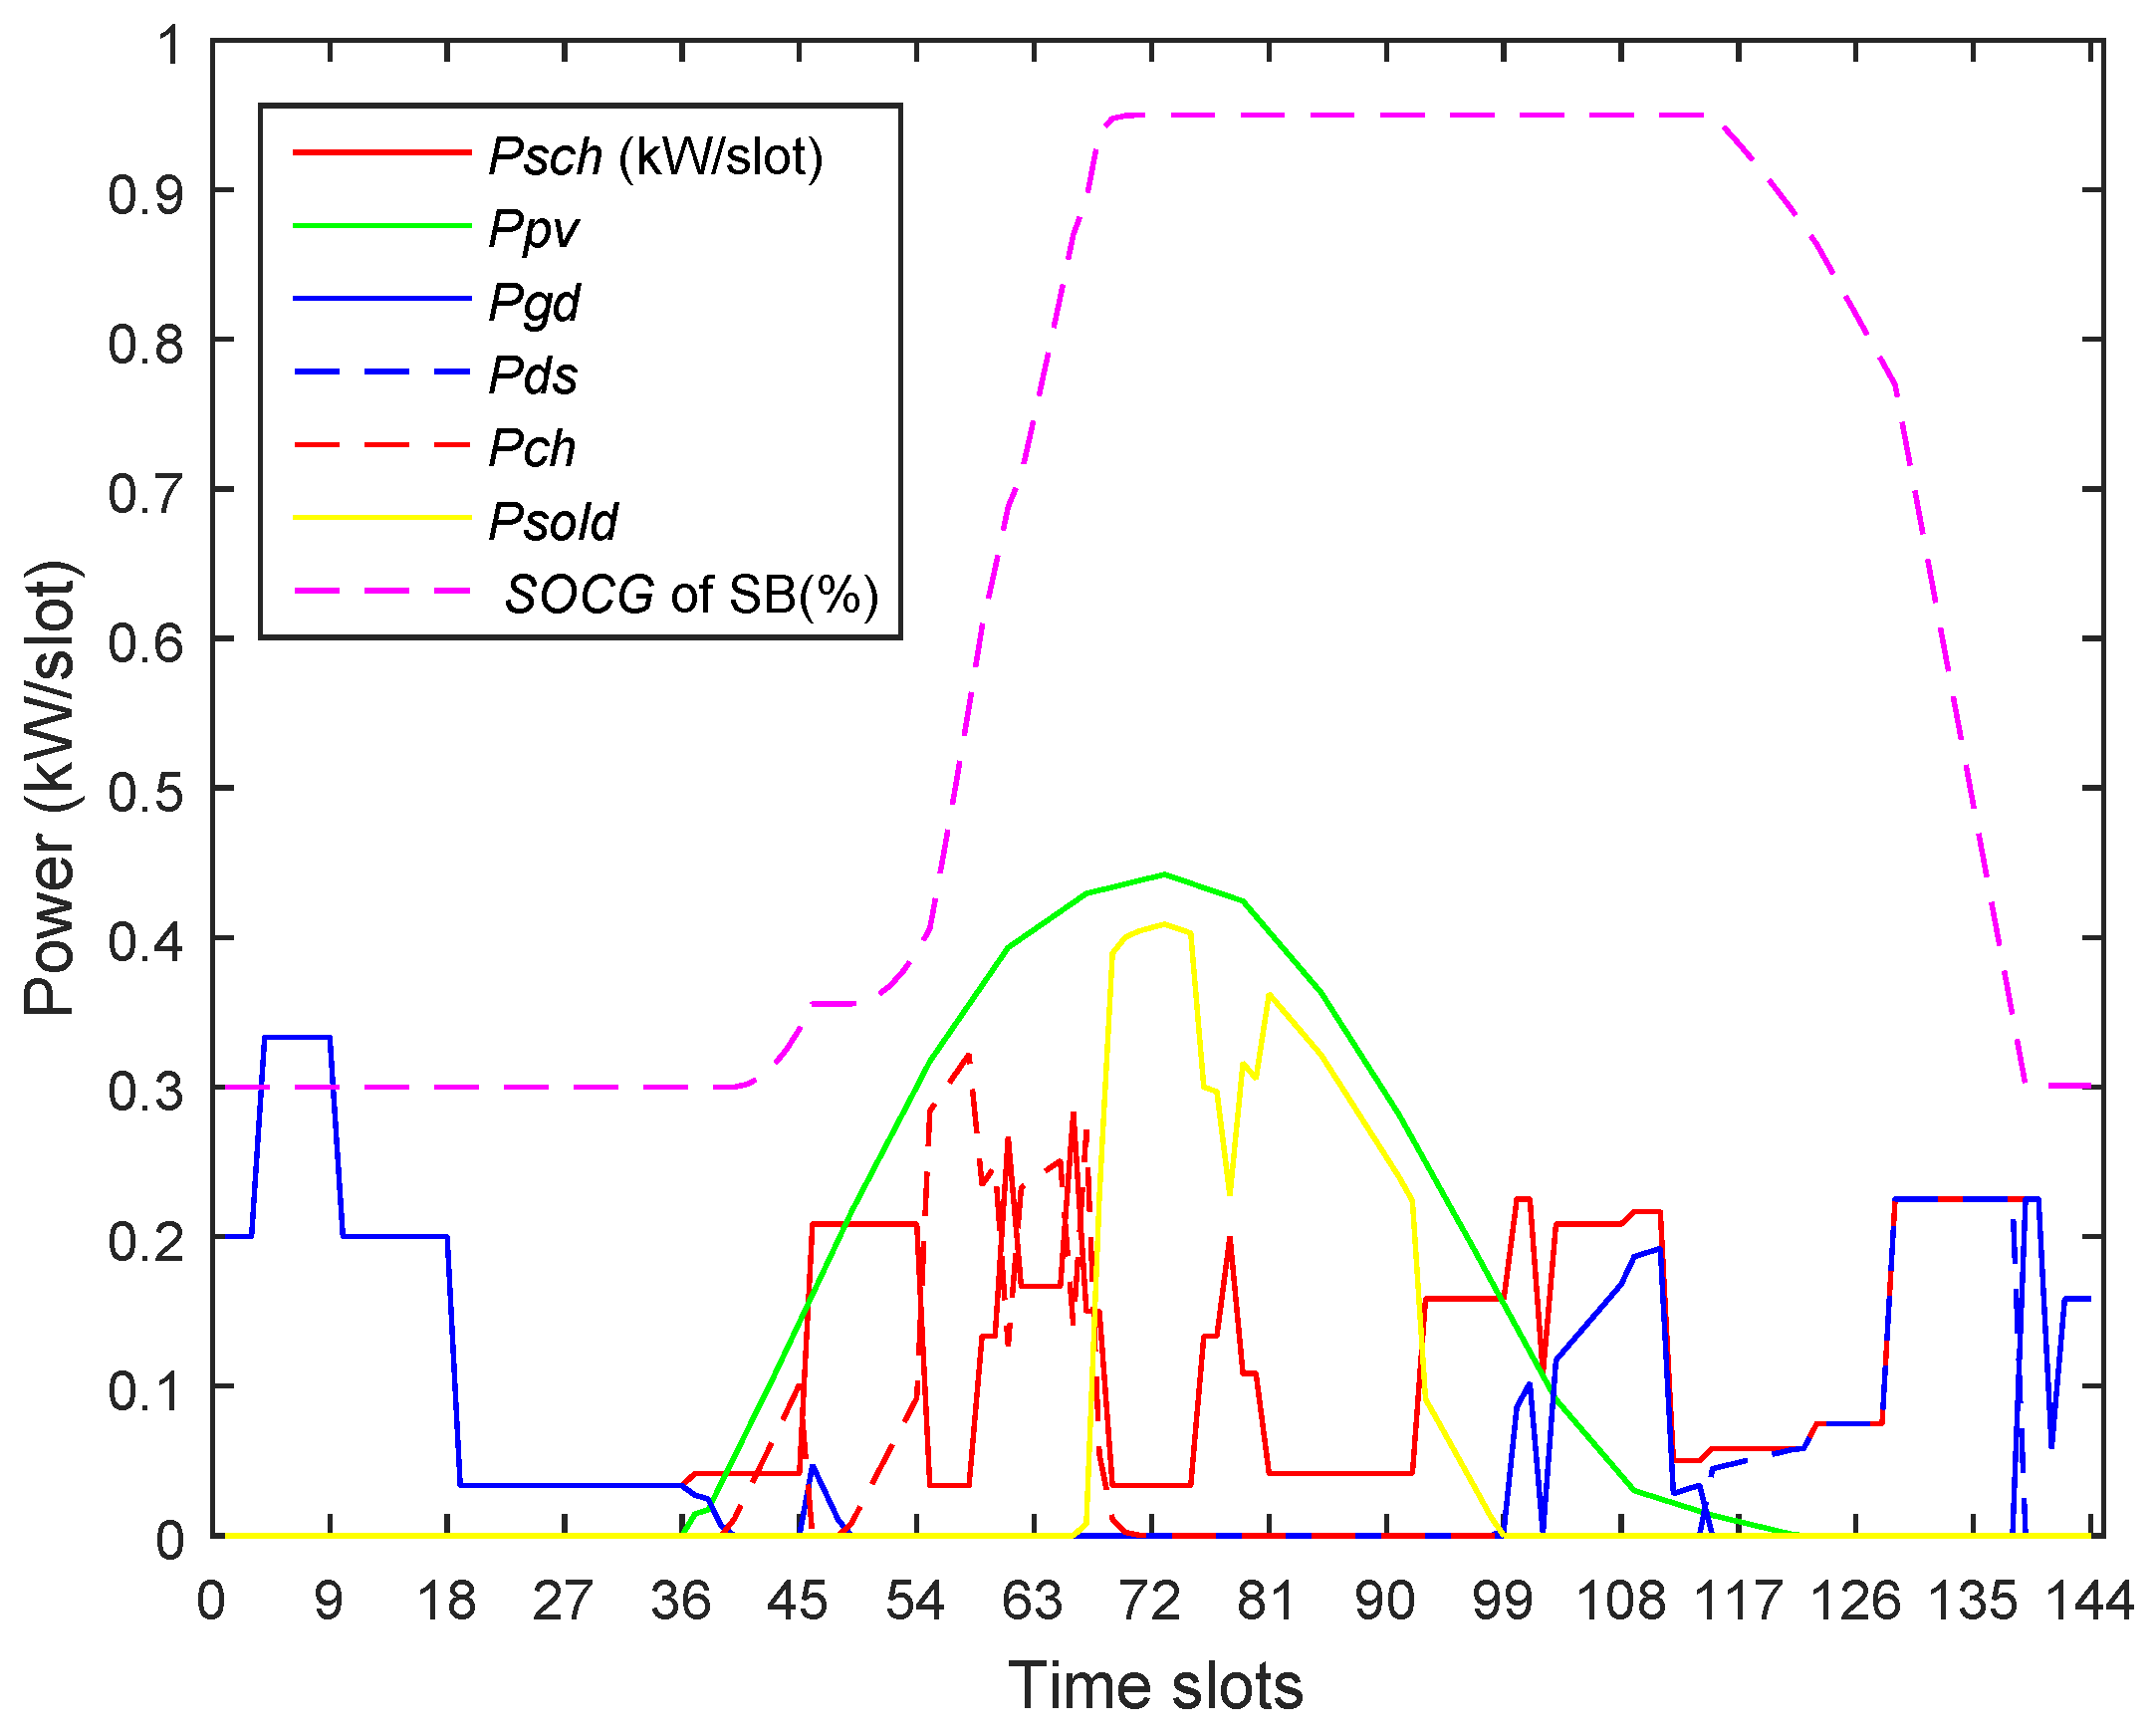
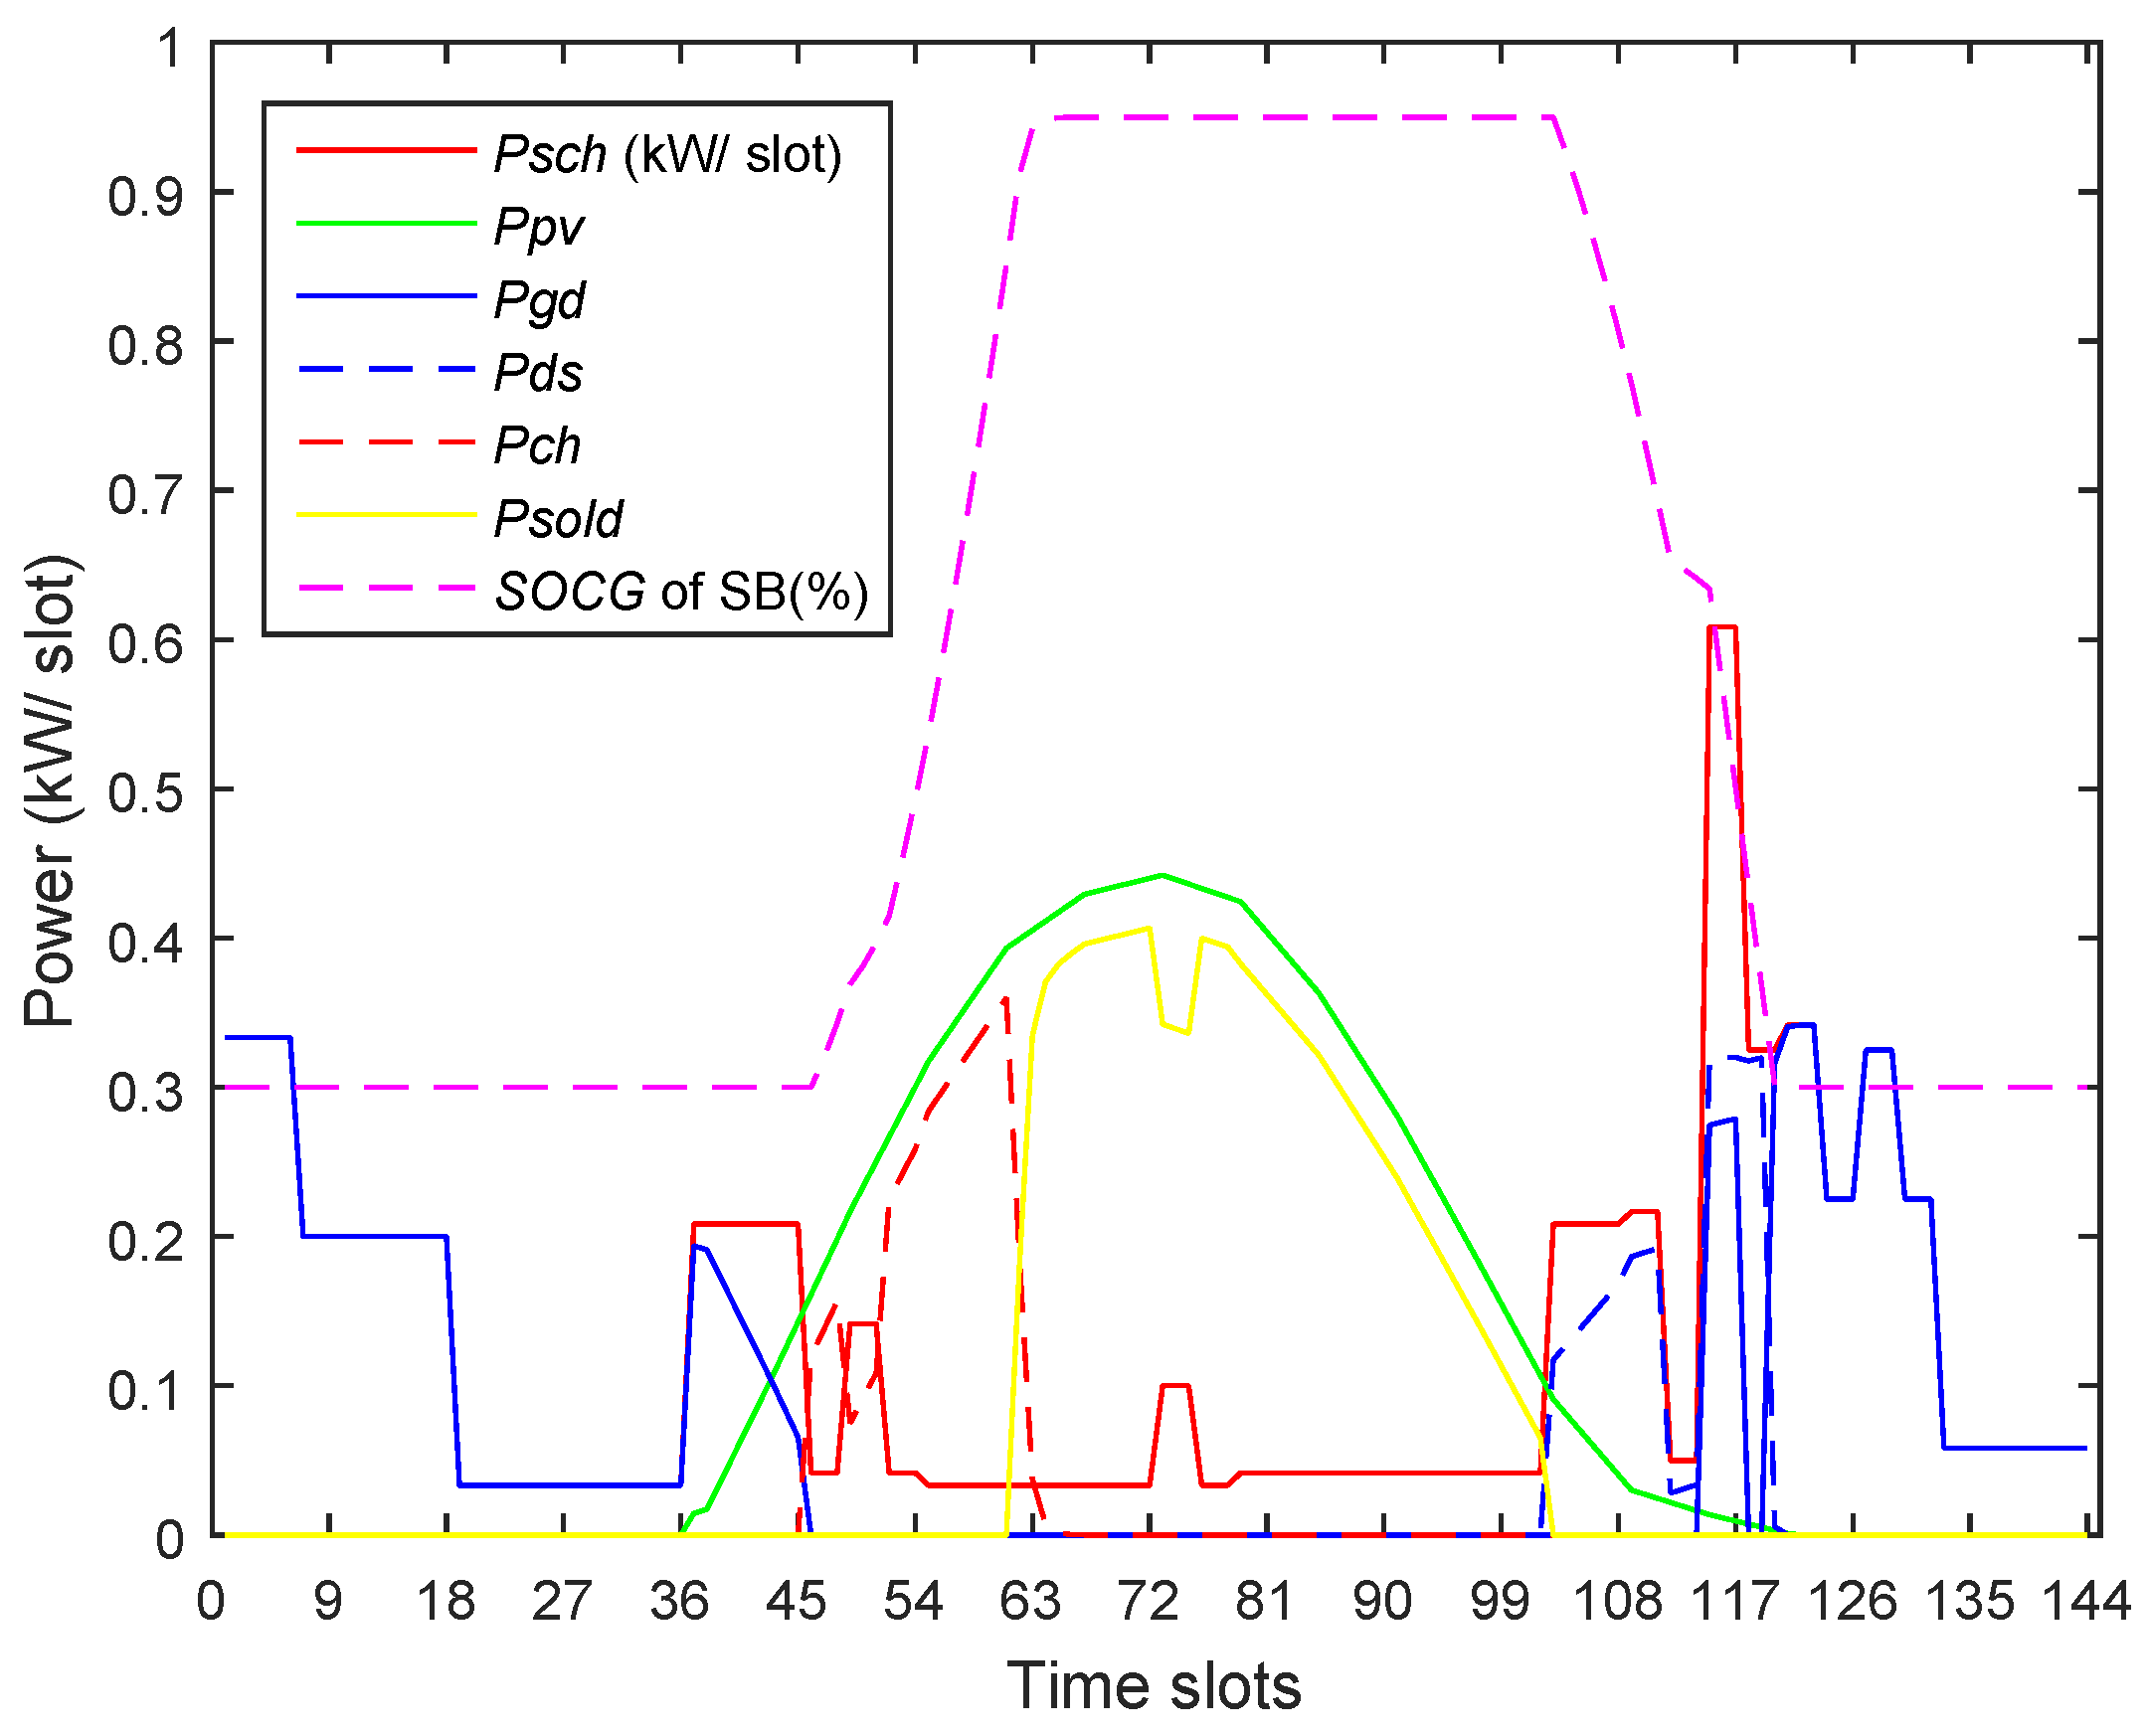
The TP for CPP solved with weights of (0, 1) for minimal T B D are shown in Figure 24. Under the proposed CPP scenario, the SB was charged through the extra PV energy during slots numbered 45–63. The energy stored in the SB was used to supply the peak time load during slots numbered 115–126. However, due to the limited discharge rate and the capacity of the SB, the battery could not supply all of the peak time load completely. Consequently, a large amount of the load was supplied through the grid at higher prices during peak times slots numbered 113–118 and 126–138. The RED-based operation resulted in 70.32% reductions in the C E n e t . A bit lesser reduction in C E n e t in this scenario as compared to the 2S-ToUP is due to the supply of a large amount of the load at double the price during peak hours in this scenario. The reduction in C E n e t in this scenario is due to the optimal dispatch strategy implemented for the PV, SB and the grid without combining the PDDR-based shifting of the load.
The energy profiles for CPP (DS)-based HEMS are shown in Figure 25 for a maximal reduction in C E n e t having weights of value (1, 0). The SB was charged with the PV energy during off-peak slots numbered 38–64. Based on DS, the peak time load was shifted forward towards slots numbered 138–144. The peak time load that remained un-shifted was supplied through the SB. However, due to the limited capacity of the SB, a load of 0.37 kWh was supplied through the grid during peak time slots numbered 136–138. The rest of the peak time load was shifted towards the off-peak slots numbered 139–144 in the forward direction. Due to the limited number of off-peak slots in the forward direction and for the large peak to off-peak prices ratio, the load shifted in the forward direction exceeded the limiting value of 0.4 kWh in spite of the implementation of I B R ratio. Thus, a large peak load was observed during off-peak slots numbered 139–144 in this scenario. That high peak load can be managed by opting MS-based scheduling or by increasing the values of I B R for these specific slots. The algorithm, while combining the effect of PDDR- based DS with the optimal dispatch of the PV system, the SB, and the grid, achieved a reduction of 86.38% in C E n e t for CPP (DS)-based TPs.
Referring to TP for CPP (MS) solved with weights of (1, 0) for a maximal reduction in C E n e t , the resulting energy profiles are shown in Figure 26. The SB was charged through the extra PV energy during slot numbered 45–70. Based on MS, some of the peak time load was shifted forward towards the off-peak slots numbered 138–144, whereas the rest of the load was shifted in the advanced direction towards the off-peak slots numbered 45–115. The advanced shifted load was supplied through the PV system directly to reduce the C E n e t . The remaining un-shifted peak time load was completely supplied through the SB. The algorithm achieved a 94.44% reduction in the C E n e t for TP based on CPP (MS).
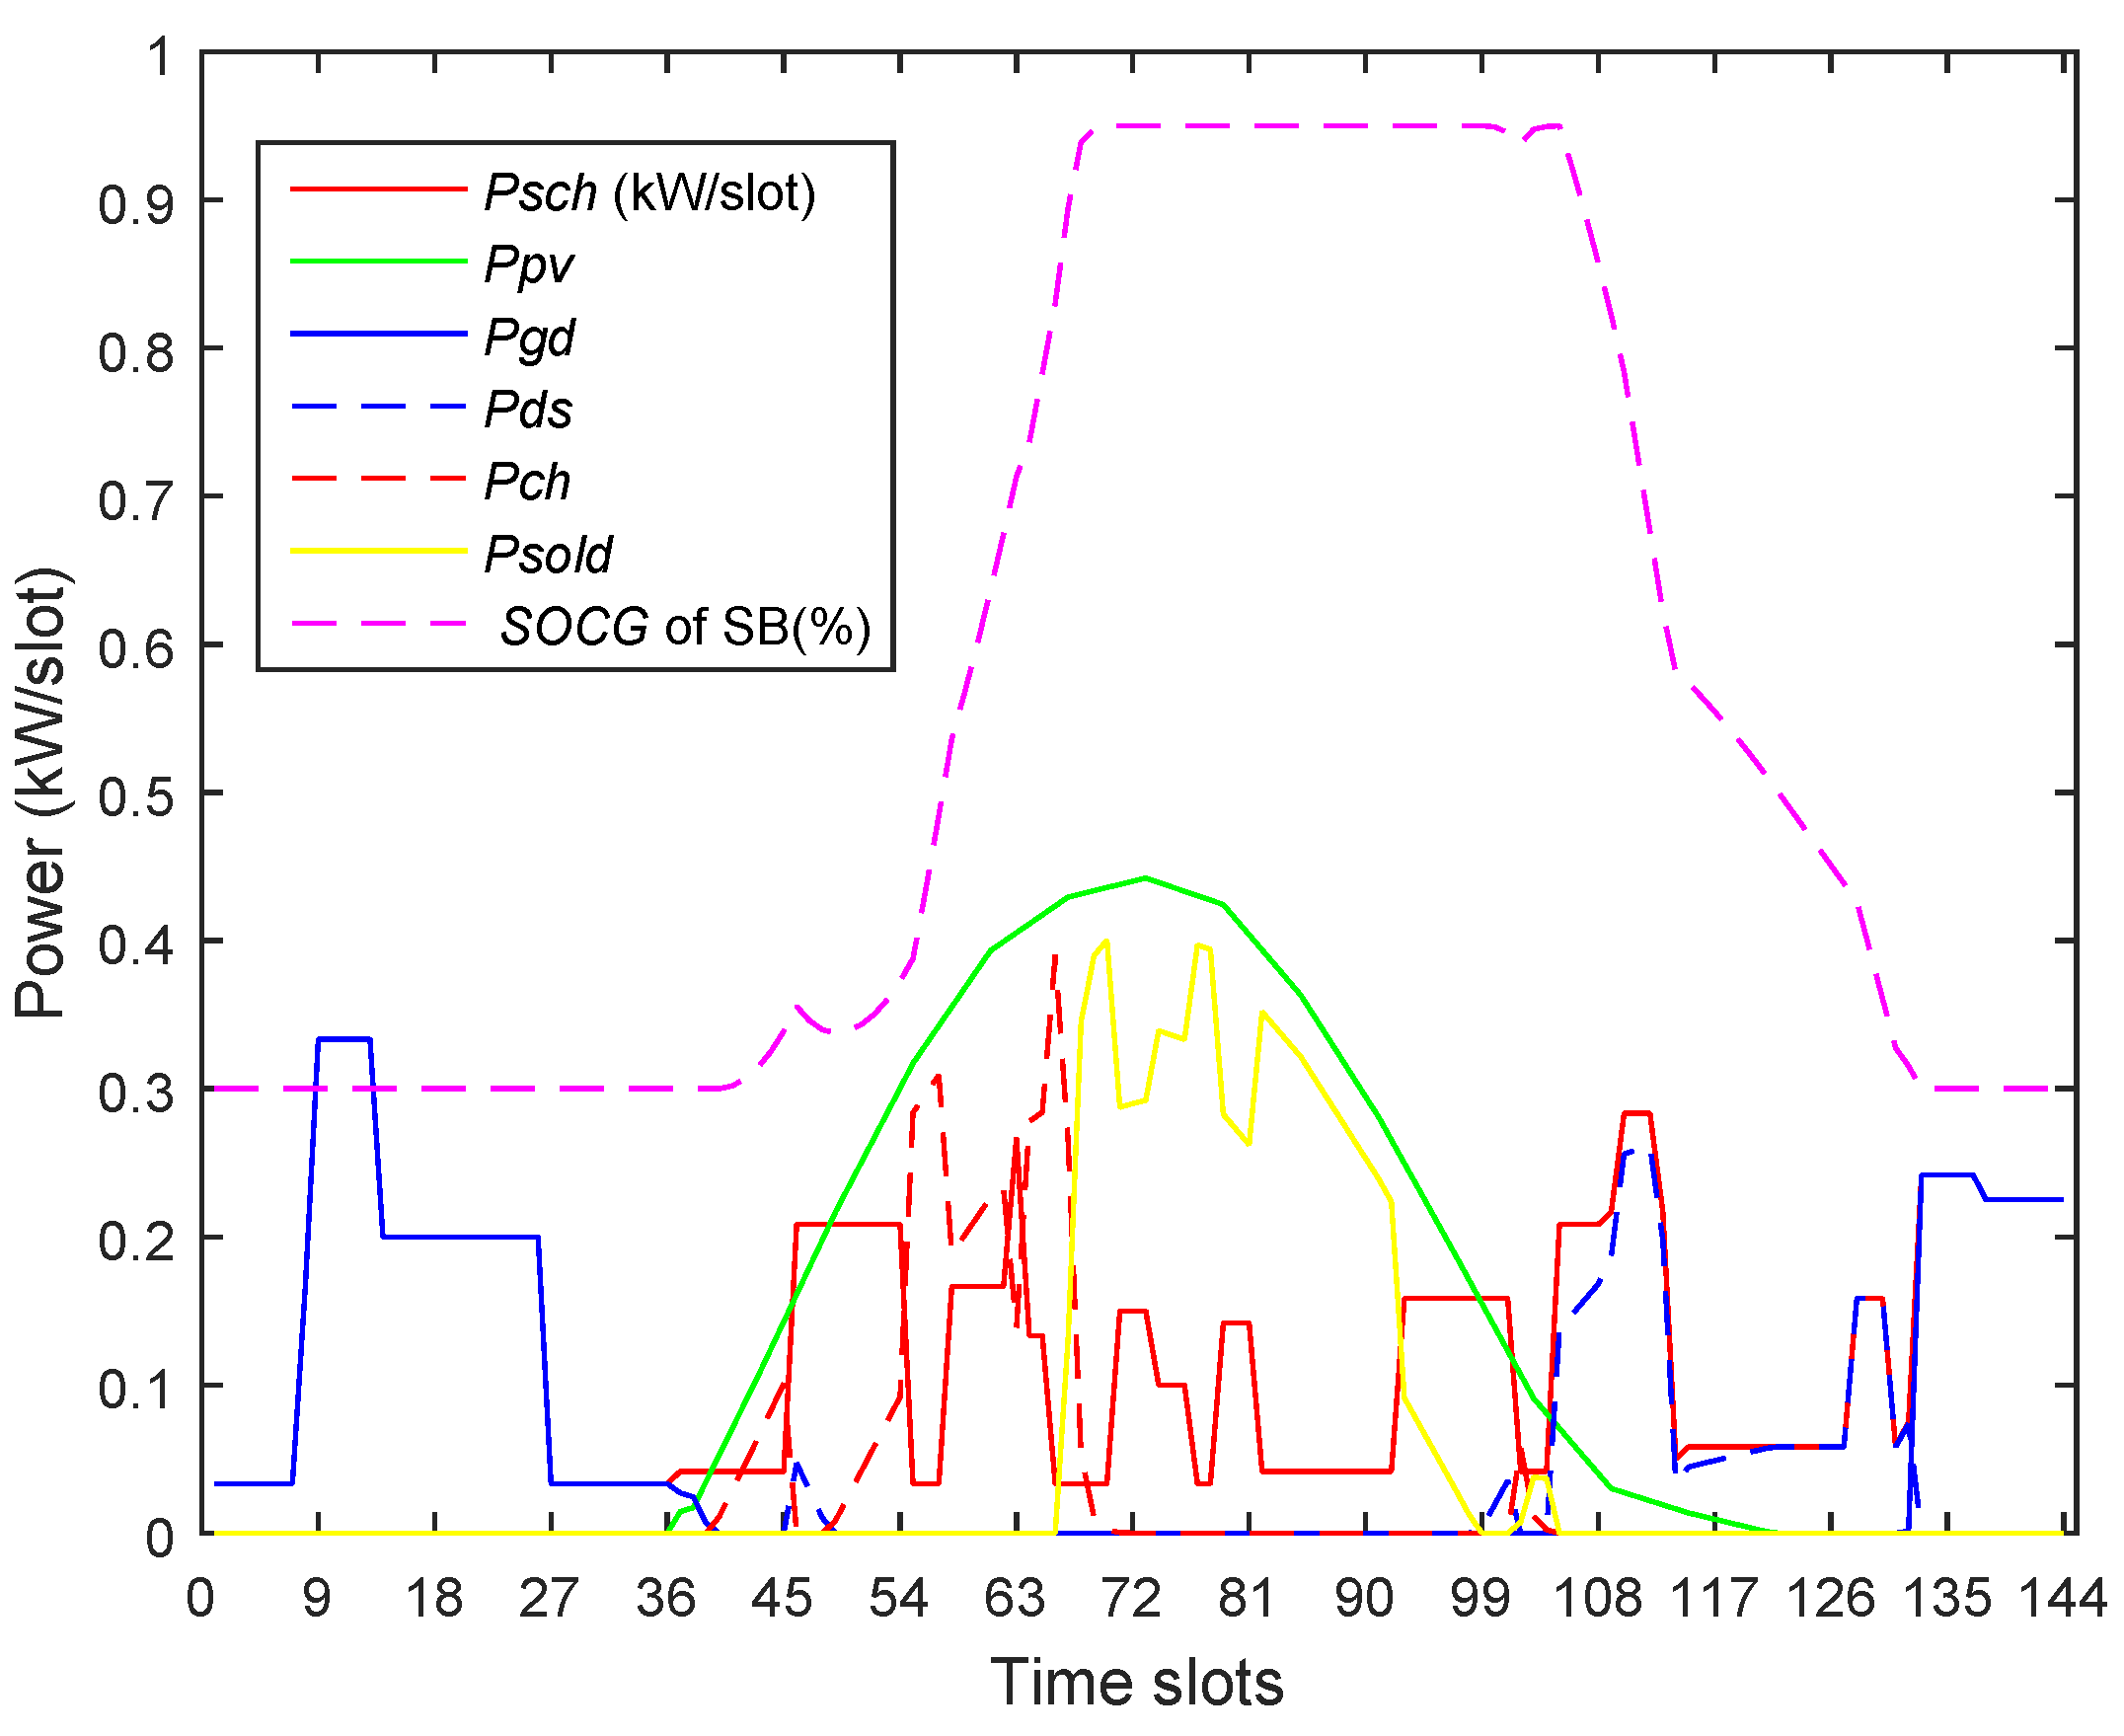
The TP for 3S-ToUP (non-shifted) solved with weights of (0, 1) for minimal T B D showed that the SB was charged with the PV energy available during off-peak time slots numbered 45–63, as shown in Figure 27. The energy stored in the SB during off-peak hours was used to supply the peak time loads during slots numbered 103–117. However, due to the limited discharge rate and the capacity of the SB, the load during peak time slots numbered 117–132 was supplied through the grid at higher prices. The RED-based operations resulted in 80.75% reduction in the C E n e t based on the optimal dispatch strategy implemented for the PV/SB system and the power grid. The scenario did not take the shifting of the load into consideration.
Referring to TP for 3S-ToUP (DS) solved with weights of (1, 0) for a maximal reduction in C E n e t , the resulting energy profiles are shown in Figure 28. The SB was charged with the extra PV energy available during off-peak slot numbers 42–66. Based on DS, the peak time load is shifted forward towards slots numbered 138–144. The remaining un-shifted load lying within the peak-hours was supplied through the SB. However, due to the limited capacity of the SB, loads of values 0.18 and 0.37 kWh were supplied through the grid during peak time slots numbered 126–132 and 133–138 respectively. The algorithm, while combining the effect of DS with the optimal dispatch of the PV/SB system and the grid, achieved a reduction of 92.54%.in C E n e t .
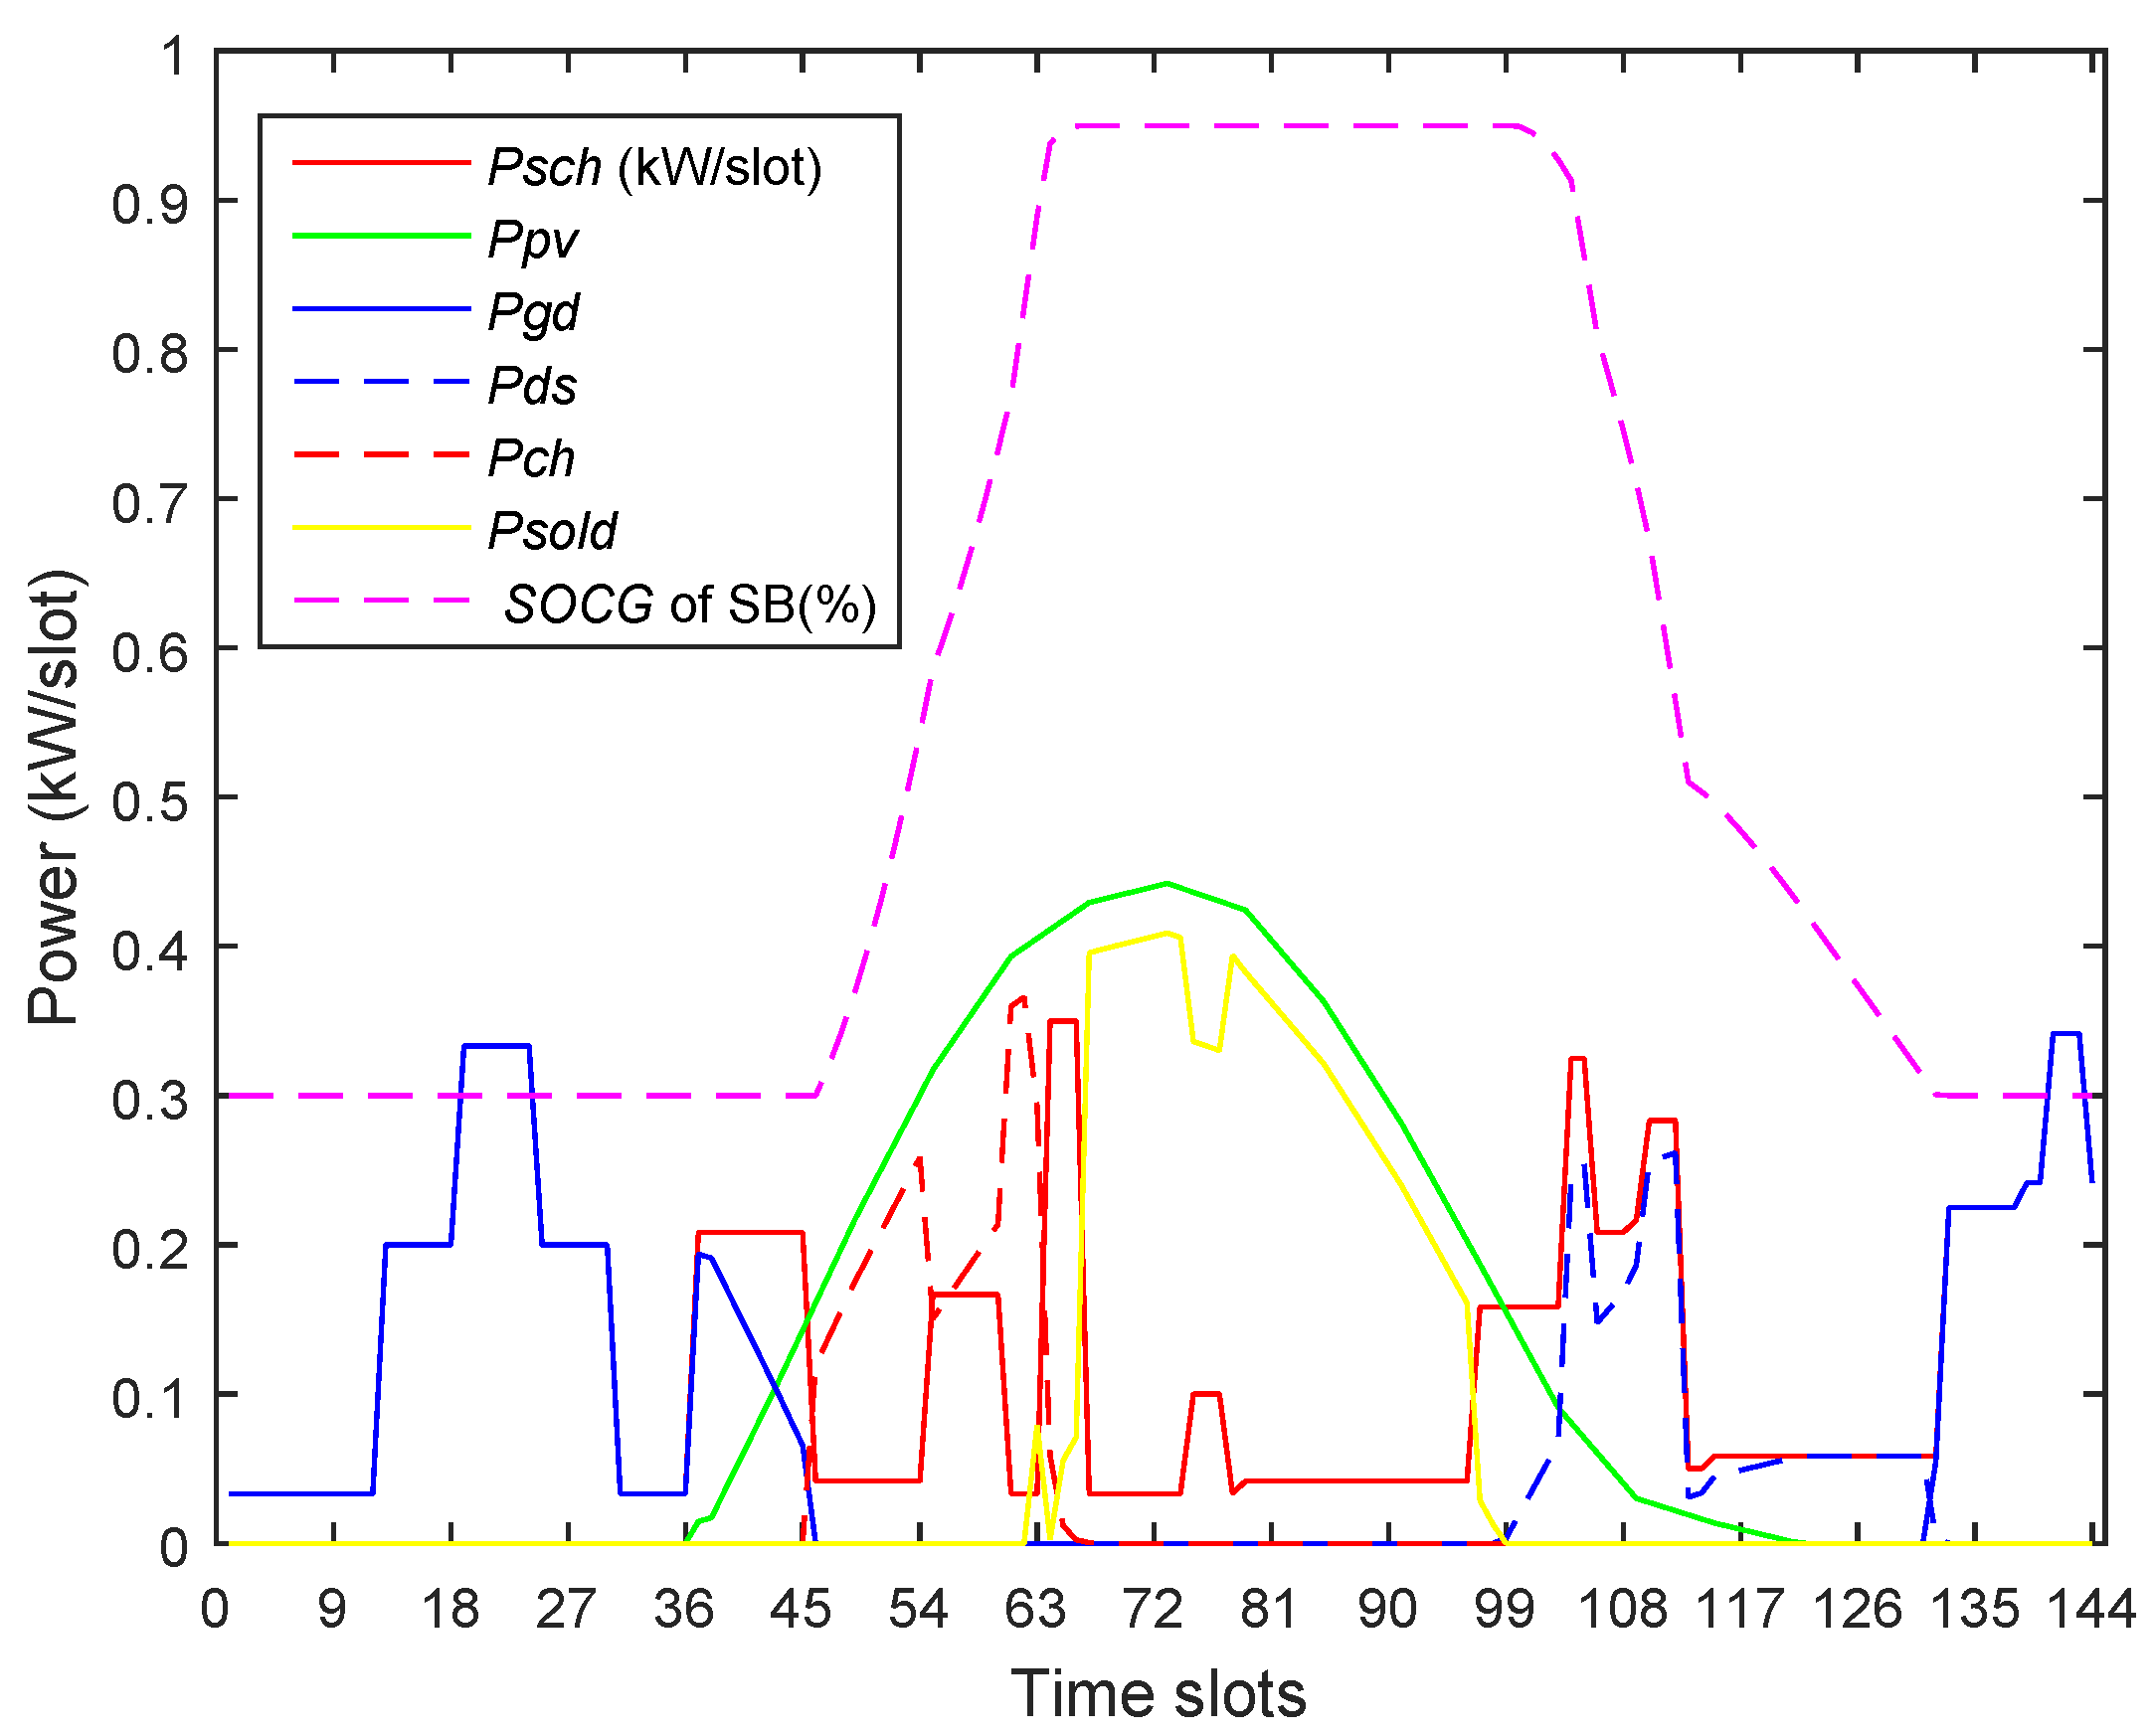
The TP for 3S-ToUP (MS) is solved with weights of (1, 0) for a maximal reduction in C E n e t is revealed in Figure 29. The SB was charged with the PV energy available during off-peak slots numbered 45–70. Based on MS, some of the peak time load was shifted forward towards the off-peak slots numbered 138–144. The rest of the load was shifted in the advanced direction towards the mid peak slots numbered 45–102 where it was supplied through the PV system directly to reduce the C E n e t . The remaining un-shifted peak time load was completely supplied through the already charged SB. The algorithm achieved a 97.15% reduction in the C E n e t for the designated TP.
The energy profiles are shown in 
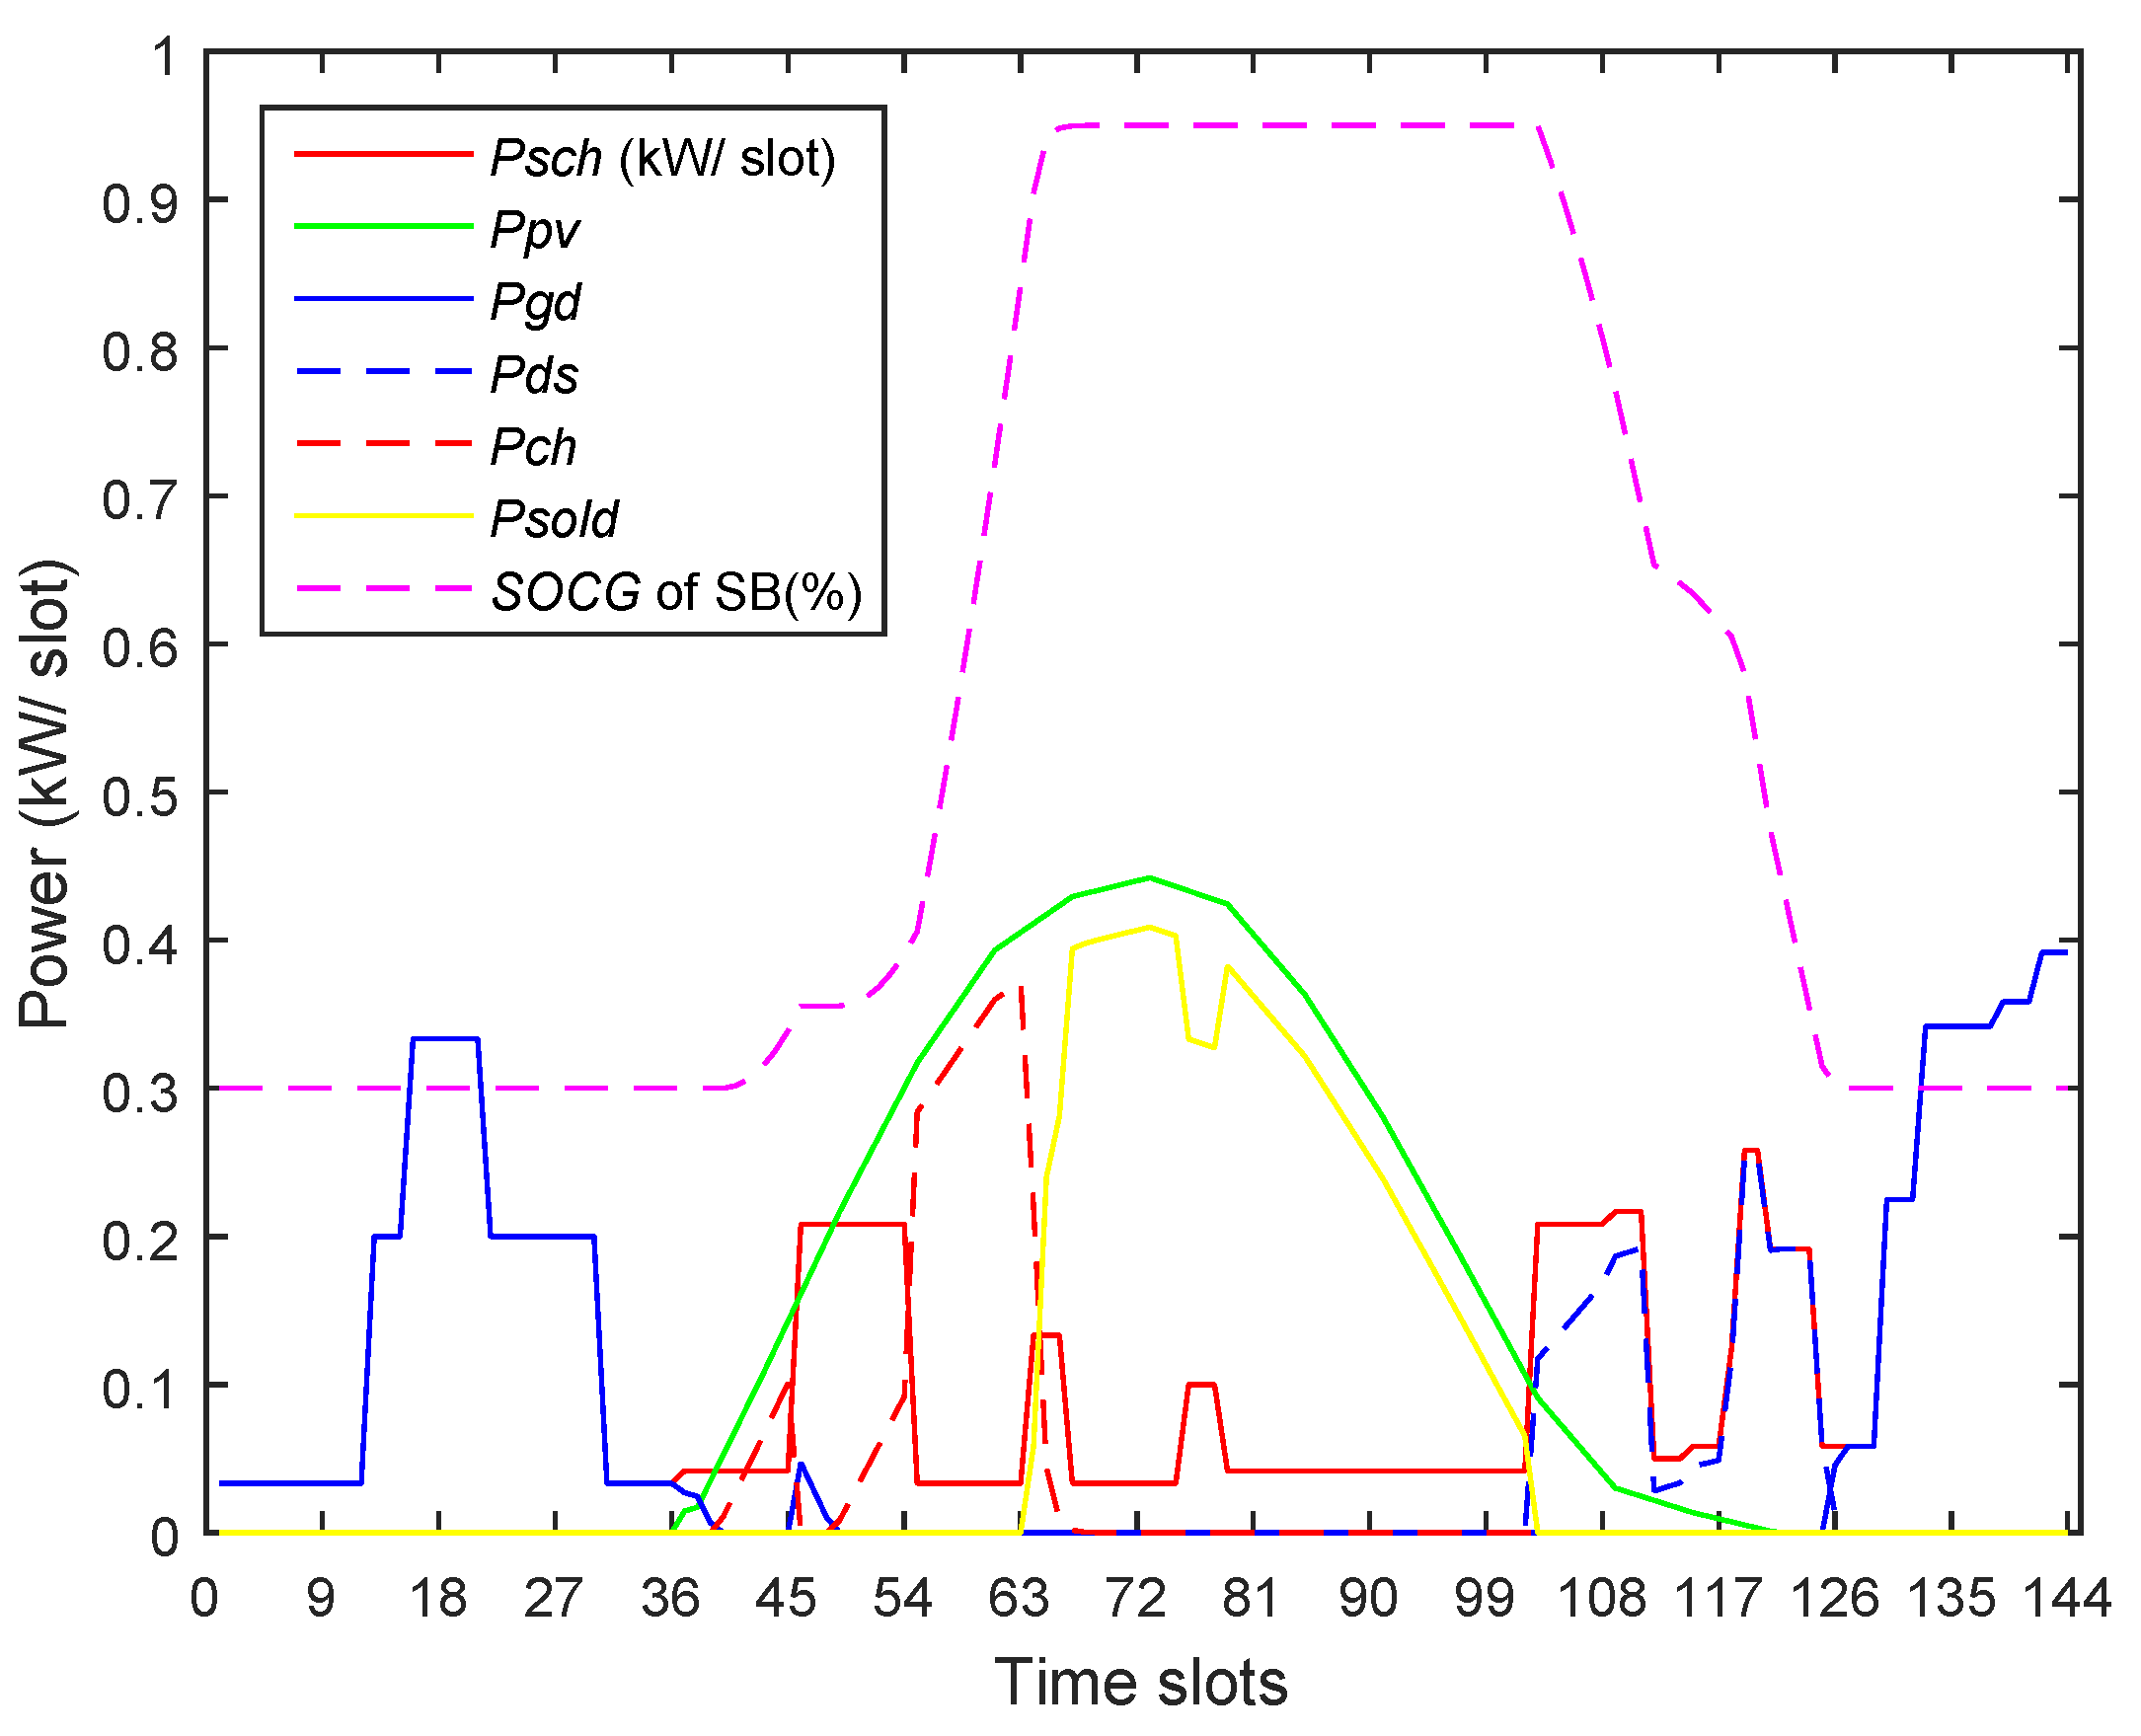
Figure 30 for RTP (non-shifted) solved with weights of (0, 1). Under this scenario, the SB was charged with the PV energy during slot numbers 45–63. The stored energy of the SB was used to supply the load when the price of energy was above its average value (more than 2.5 cents per kWh) during slots numbered 102–120. However, due to the limited discharge rate and the capacity of the SB, the load during the slots numbered 121–132 was to be supplied through the grid at peak times pricing of 4.5 Cents/kWh. The RED-based operation resulted in 96.64% reduction in the C E n e t based on the optimal dispatch strategy implemented for the PV, SB and the grid for a fixed load.
Referring to TP for DA-RTP (DS) solved with weights of (1, 0) for a maximal reduction in C E n e t , the resulting energy profiles are shown in Figure 31. The SB was charged through the extra PV energy available during off-peak slot numbers 42–66. Based on DS, the peak time load was shifted forward towards lower pricing slots numbered 138–144. The un-shifted load that remained within the peak-hours was supplied through the SB. However, due to the limited capacity of the SB, loads of values 0.18 and 0.37 kWh were supplied through the grid during peak time slots numbered 126–132 and 133–138, respectively. The algorithm, while combining the effect of DS with the optimal dispatch of the power sources, achieved a reduction of 92.54% in C E n e t .
The TP for DA-RTP (MS) solved with weights of (1, 0) for a maximal reduction in C E n e t are shown in Figure 32. The SB was charged during slots numbered 43–64. Based on MS, some of the peak time load was shifted forward towards the slots numbered 138–144 with below averaged electricity prices, whereas most of the load was shifted in the advanced direction towards the lower pricing slots numbered 1–96. The load shifted in the advanced direction was supplied through the PV system directly. The NP-type load that could not be shifted out of the peak time was completely supplied by the SB during slots numbered 99–118. The algorithm achieved a maximal value of 112.40% for the reduction in C E n e t . The algorithm showed the best performance for DA-RTP (MS)-based HEMS for a maximal reduction in the C E n e t .

5.6. A DPA of DWS-PSO Algorithm for PDDR-RED-Based HEMS

Two metrics were established for DPA of DWS-PSO for PDDR-RED-based HEMS. Metric 1 is composed of the maximum reduction in the C E n e t achieved by the algorithm, whereas metric 2 comprised the gradient of the TO line for the percentage reduction in C E n e t and T B D . The later one signifies the responsiveness of the model for the reduction in C E while increasing the value of T B D .
The maximal reduction in the C E n e t was achieved using the values of the weights as (1, 0) for C E n e t and T B D , respectively, while solving the TP. These maximal reductions in the C E n e t , representing metric 1, achieved for the diversified of TPs are presented in Table 7. Furthermore, the minimal reduction in C E n e t was also achieved using the values of weights as (0, 1). These weights assign maximum priority to the minimization of the T B D . Under this scenario, the algorithm minimized the T B D to zero and the corresponding (minimal) reduction in C E n e t was achieved. This reduction of C E n e t , as furnished in Table 8, is based on the RES, the ESS and the grid optimal dispatch (RED) while supplying a non-shifted (fixed) load. The maximum and minimum values of the C E n e t and the related values of T B D achieved for the diversified set of TPs are furnished in Table 7 and 
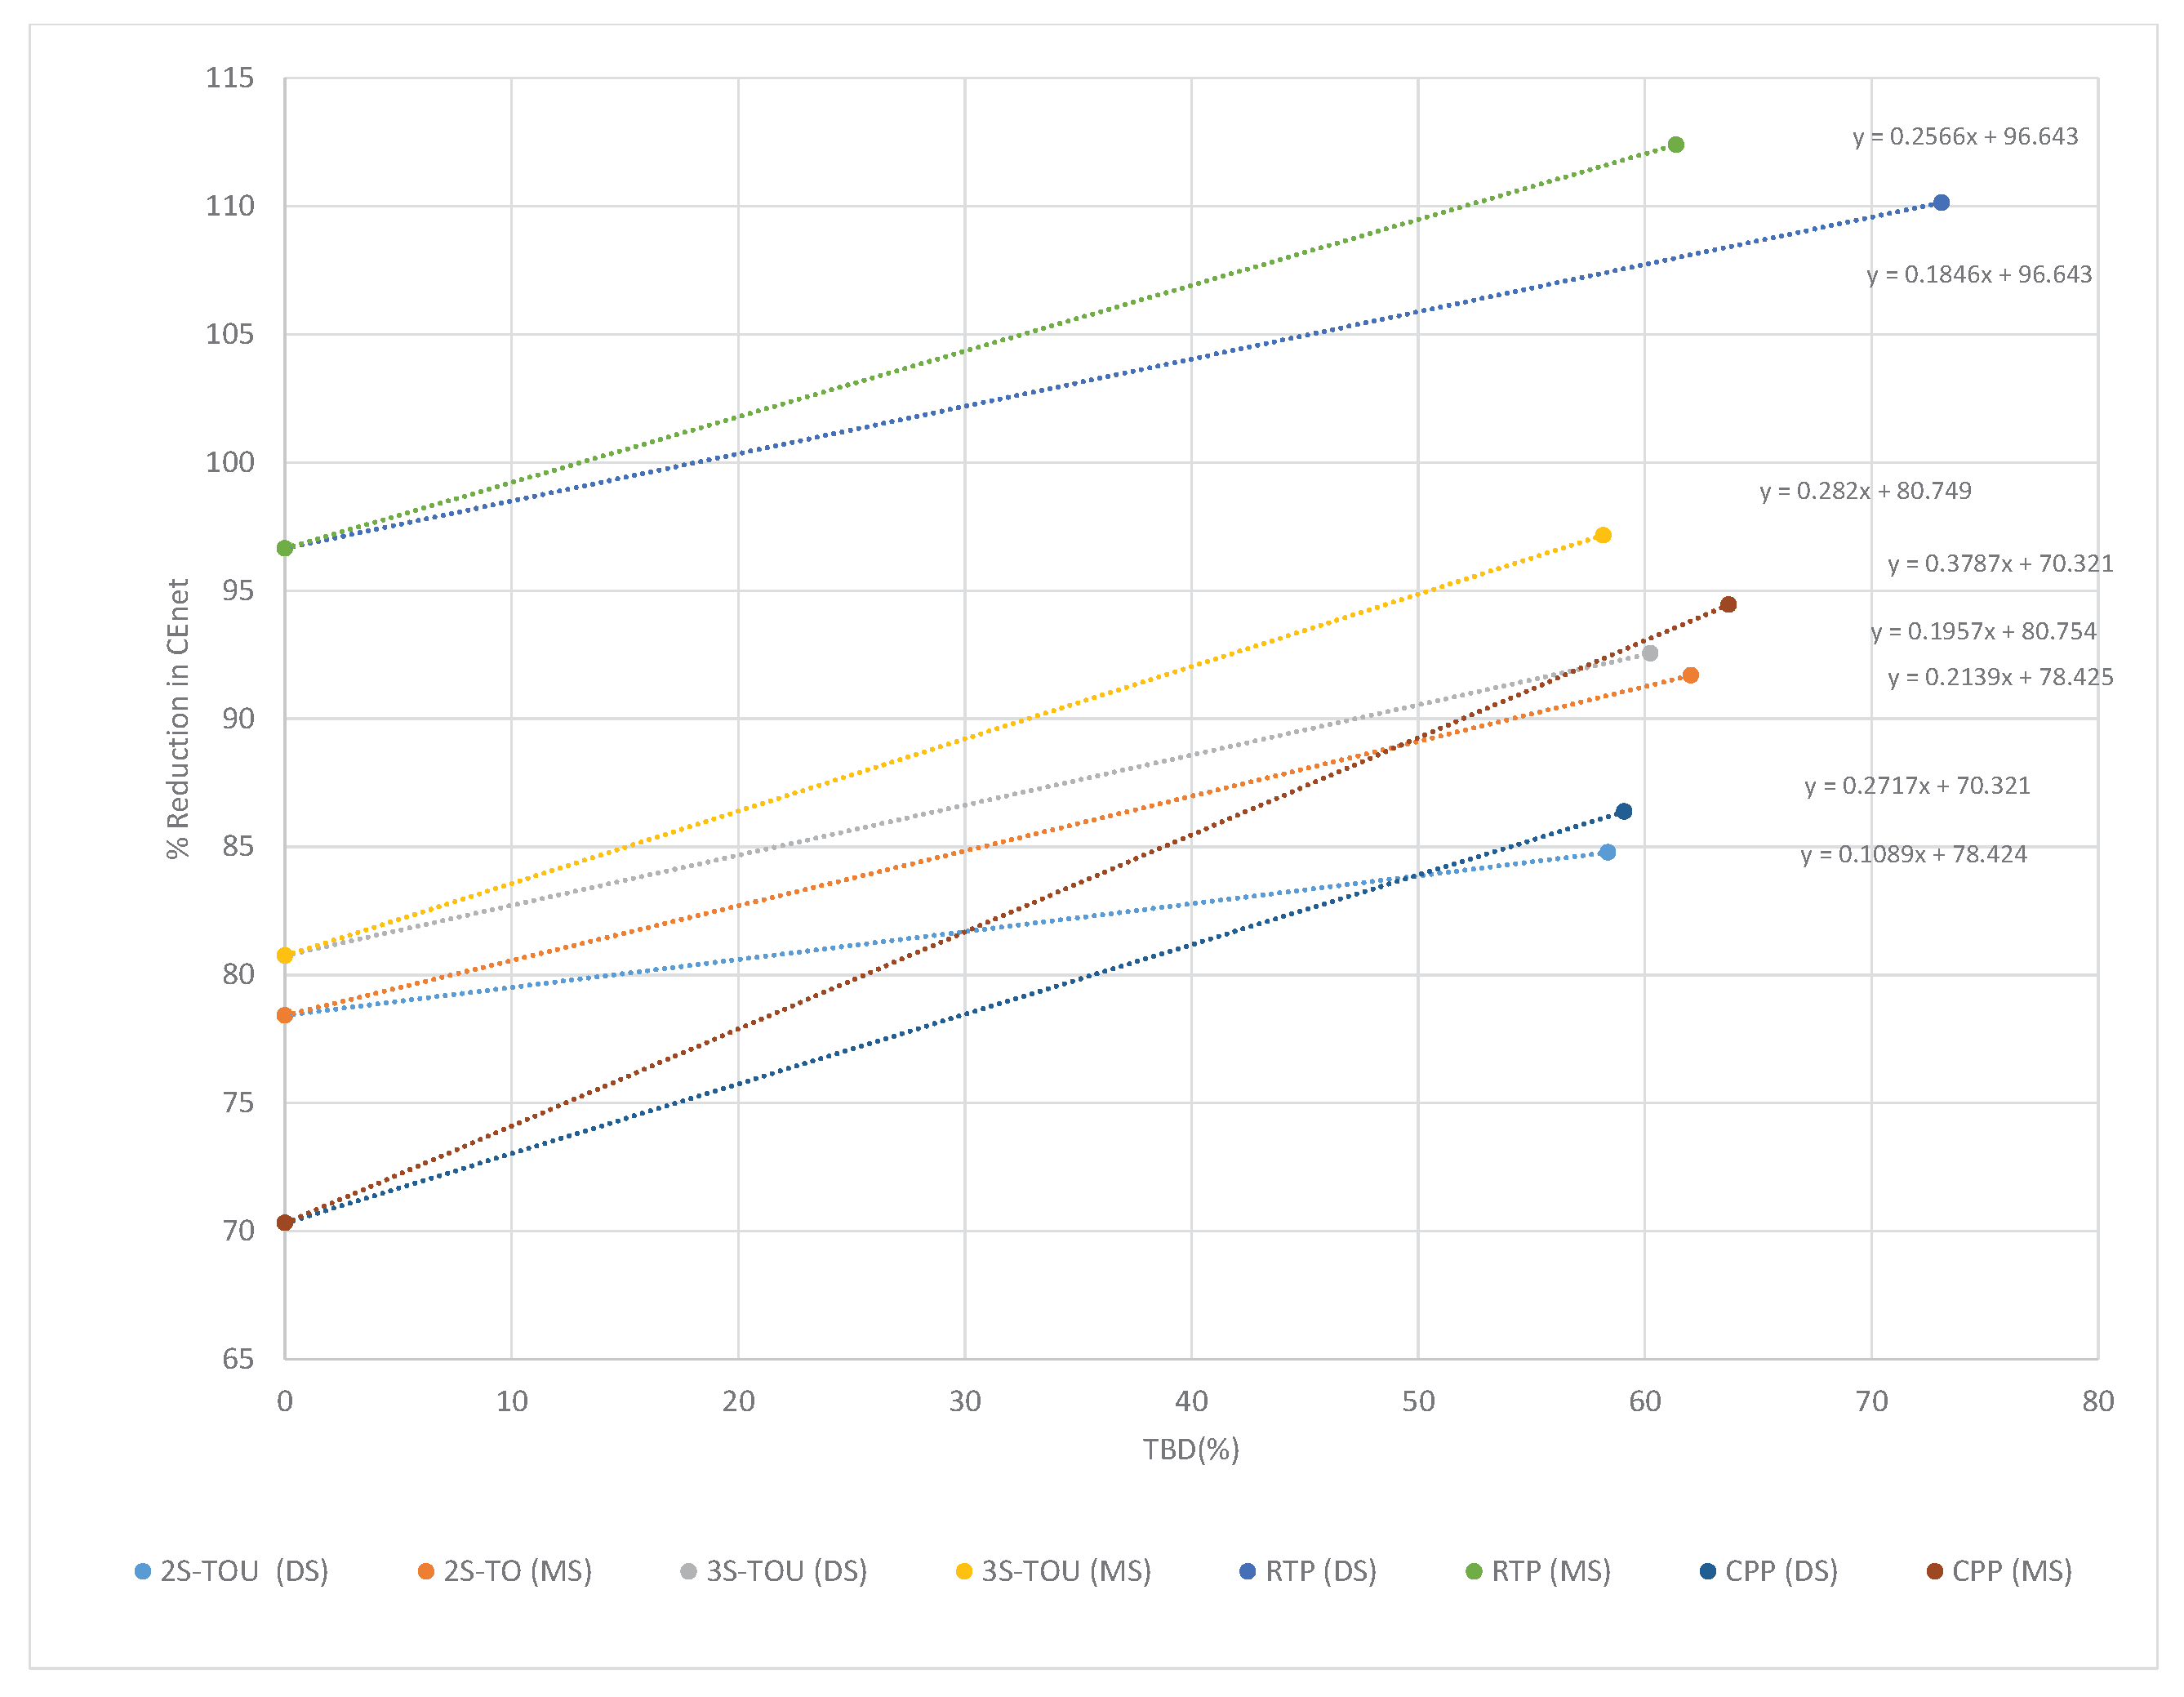
Table 8 and drawn for averaged TO lines as shown in Figure 33. The gradient of the TO line for the percentage reduction in C E n e t and the corresponding T B D represents metric 2. This metric has special significance in respect to the responsiveness of the model for PDDR.
The information gathered from Figure 33 are summarized in Table 9.
Table 9 was used for DPA of the DWS-PSO algorithm for PDDR-RED-based HEMS. The results furnished in the table are analyzed as follows:
(i)
RED-based HEMS operation using (0, 1) weights: In this approach, the consumer can avail a substantial reduction in C E n e t even without shifting his load as per the results furnished in Table 8. The reduction in C E n e t is achieved by simply implementing the optimal strategy for the dispatch of the photovoltaic system, the storage unit, and the power grid for a fixed load. For RED-based HEMS operation, the algorithm showed the best result for DA-RTP based TP while achieving a value of 96.64% for the reduction in the C E n e t . This higher value indicates that a larger amount of the unscheduled load lying within the peak/relatively higher pricing slots was supplied by the PV/SB system. Referring to Figure 32, the y-intercept in the graph indicates the initial contribution for the reduction in C E n e t from the RED that can be achieved without facing any T B D .
(ii)
PDDR-RED-based HEMS operation using (1, 0) weights: Referring to Table 9, column 4, the algorithm successfully reduced the C E n e t for all of the TPs.
(iii)
The algorithm showed better performance for MS-based as compared to the DS-based HEMSs for minimizing the C E n e t (metric 1). Furthermore, referring to column 7, MS-based outperformed their counterparts for DS- based HEMSs for the increase in the reduction of C E n e t per unit of the T B D (metric 2).
(iv)
Performance of the algorithm for a diversified set of TPs: The algorithm exhibited the best performance for the HEMS problem based on DA-RTP while achieving maximum reductions in the C E n e t of value 110.13% for DS- and 112.40% for MS-based models. Although the second metric for the reductions in C E n e t per unit of T B D is a bit lower in this approach, a very high value of the initial contribution in the reduction of C E n e t (96.64%) from the RED makes this scheme the best for its application for HEMS. The algorithm while solving HEMS problems for RTP simultaneously reduced the values of Peak as well by 35.58 and 43.80% for DS and MS-based models, respectively.
(v)
The DWS-PSO-based algorithm was ranked 1–8 for its performance for metric 1 for the proposed TPs as: DA-RTP (MS), DA-RTP (DS), 3S-ToUP (MS), CPP (MS), 3S-ToUP (DS), 2S-ToUP (MS), CPP (DS), and 2S-ToUP (DS). The proposed indexing is based on metric 1, whereas the respective values of metric 2 for the individual TPs signifies the responsiveness of the model for PDDR.
(vi)
The algorithm achieved a much higher value of metric 1 for CPP-based HEMS as compared to its fundamental model for 2S-ToUP. A reduction in C E n e t of value 94.44% was achieved for CPP (MS)-based as compared to the respective value of 91.69% for the 2S-ToUP (MS)-based HEMS. Furthermore, CPP-based HEMS, with the maximum relative value of 3.48 for metric 2, validated their maximal responsiveness for a reduction in C E n e t with the increase in T B D . This demonstrates the ability of the CPP (MS)-based models for motivating the consumers to participate in PDDR for reducing the event based critical peaks.

5.7. Summary of Results

The summary of the results of DPA for DWS-PSO-based algorithm when tested for a designated set of TPs for PDDR-based HEMS is as follows:
(i)
The respective performance metrics for the algorithm in percentages when tested for the HEMS problems for 2S-ToU (DS); 2S-ToU (MS); 3S-ToU (DS); 3S-ToU (MS); DA-RTP (DS); DA-RTP (MS);CPP (DS); and CPP (MS) are 9.7; 15.8; 15.9; 19.3; 20.3; 20.5; 21.8; and 32.7 for metric 1 and 0.2087; 0.2536; 0.2741; 0.3067; 0.3419; 0.32; 0.3578; and 0.5026 for metric 2. The relative values of metric 2, taking 2S-ToU (DS) based HEMS as bench-mark problem with value equal to one, are: 1; 1.22; 1.31; 1.47; 1.64; 1.53; 1.71; and 2.41.
(ii)
When tested for diversified problems for HEMS based on modeling of SHAs, the algorithm for MS-based outperformed DS-based HEMS when evaluated for metrics 1 and 2.
(iii)
The algorithm for CPP (MS)-based HEMS outperformed all the models for other DPSs when evaluated for metrics 1 and 2. Especially, the highest value of metric 2 for this model, indicating the fastest reduction in C E while increasing the value of T B D , shows the capability of this model to motivate the consumers for an active participation for reducing event- based critical peaks. However, the CPP-based scheme is not meant for application on a daily basis.
(iv)
When tested for the diversified problems for HEMS for DPSs used on a daily basis, DA-RTP-based HEMS outperformed the models for other DPSs with respective values of 20.5% and 0.32 for metrics 1 and 2.
The operation of the algorithm for PDDR-RED-based HEMS using weights of (1, 0) resulted in a maximal reduction in C E n e t ; that reflected the value of the metric 1. While using weights of values (0, 1) for the minimal value of T B D , the algorithm achieved a substantial reduction in C E n e t for the RED-based operations for the optimal dispatch of the photovoltaic system, the storage unit, and the power grid without shifting of the loads. The algorithm operations using weights of (1, 0) and (0, 1) for C E n e t and T B D enabled the computations of the proposed metrics 1 and 2 for the algorithm. The summary of the results of DPA for the proposed algorithm when tested for a designated set of TPs for PDDR-RED-based HEMS is as follows:
(i)
The respective performance metrics in percent for the TP of 2S-ToU (DS); 2S-ToU (MS); 3S-ToU (DS); 3S-ToU (MS); DA-RTP (DS); DA-RTP (MS);CPP (DS); and CPP (MS) are 84.78; 91.69; 92.54; 97.15; 110.13; 112.40; 86.38; and 94.44 for metric 1 and 0.109; 0.214; 0.196; 0.282; 0.185; 0.257; 0.272; and 0.379 for metric 2. The relative values of metric 2, taking 2S-ToU (DS) based HEMS as bench-mark problem with value equal to one, are: 1.00; 1.96; 1.80; 2.59; 1.70; 2.36; 2.50; and 3.48.
(ii)
When tested for diversified problems for HEMS based on modeling of SHAs, the algorithm for the MS-based outperformed DS- based HEMS for metrics 1 and 2.
(iii)
The algorithm was ranked 1–8 for the designated TPs for DA-RTP (MS), DA-RTP (DS), 3S-ToUP (MS), CPP (MS), 3S-ToUP (DS), 2S-ToUP (MS), CPP (DS), and 2S-ToUP (DS) based on metric 1.
(iv)
When tested for the diversified problems for HEMS for DPSs used on a daily basis, the algorithm exhibited the best performance for DA-RTP (MS)-based HEMS while achieving a maximum value of 112.40% for metric 1 for such HEMSs. Interestingly, a very high value of the reduction in C E n e t for the RED-based operation for such HEMSs (96.64%) indicates large benefits to the consumer due to the high responsiveness of the scheme for optimal dispatch of the local sources. However, a smaller value of metric 2 indicates lesser responsiveness of such HEMSs for reductions in C E n e t while increasing T B D .
(v)
The algorithm performed the best for the DA-RTP (MS)- and 3S-ToUP (MS)-based HEMSs for the TO for metrics 1 and 2. These schemes achieved respective values of 112.40% and 97.15% for metrics 1 and 2.36 and 2.59 for metric 2.
(vi)
The performance of the algorithm for CPP-based schemes was acknowledged through the highest value of 3.48 for metric 2 for CPP (MS)-based HEMSs. This highest value of metric 2 reflecting the maximum reduction in C E n e t with increasing value of the T B D shows the potential of CPP-based models for motivating the consumers participating in this event-based PDDR to reduce the critical peaks.
(vii)
The algorithm can also be used for RED-based optimal HEMS operations without shifting of the load. Under this scenario, DA-RTP-based HEMS showed the best results while achieving a value of 96.64% for the reduction in C E n e t . That highest reduction in C E n e t for RED-based HEMSs was due to the supplying of the peak/relatively higher priced load through the PV/SB system.
(viii)
An outstanding performance for a set of diversified TPs demonstrates the robustness of the proposed DWS-PSO algorithm for HEMS applications.

6. Conclusions and Future Work

DWS-PSO based algorithms are presented for PDDR-and PDDR-RED-based HEMSs. The performance of the algorithms was analyzed for the TO solutions using respective weights of (1, 0) and (0, 1) for C E n e t and T B D . The first set of weights allocated the maximal priority to the reductions in C E while the second set of weights was used for minimizing the value of T B D . The proposed algorithms were tested for a diversified set of TPs based on DPSs comprising 2S-ToUP, 3S-ToUP, DA-RTP, DA-RTP and I B R combined with HEMS models for DS and MS. Performance metrics were proposed to evaluate the performance of the algorithms. Metric 1 dealt with the capability to maximize the reduction in the value of C E and metric 2 with the maximization in the average reduction in C E per unit of T B D . Metric 2 was based on the gradient of the TO line for the percentage reduction in the C E and T B D and that represented the responsiveness of the model for reduction in C E n e t with an increasing value of T B D . The detailed numerical results are summarized as in Section 5.7.
Future work includes comparative studies for PO based GA with the decomposition weighted sum PSO for posteriori applications.

Author Contributions

All authors equally contributed.

Conflicts of Interest

The authors declare no conflict of interest.

References

  1. Yan, X.; Ozturk, Y.; Hu, Z.; Song, Y. A review on price-driven residential demand response. Renew. Sustain. Energy Rev. 2018, 96, 411–419. [Google Scholar] [CrossRef]
  2. Yang, C.; Meng, C.; Zhou, K. Residential electricity pricing in China: The context of price-based demand response. Renew. Sustain. Energy Rev. 2018, 81, 2870–2878. [Google Scholar] [CrossRef]
  3. Anees, A.; Hussain, I.; AlKhaldi, A.H.; Aslam, M. Linear triangular optimization technique and pricing scheme in residential energy management systems. Results Phys. 2018, 9, 858–865. [Google Scholar] [CrossRef]
  4. Rastegar, M.; Fotuhi-Firuzabad, M.; Moeini—Aghtaie, M. Developing a two-level framework for residential energy management. IEEE Trans. Smart Grid 2018, 9, 1707–1717. [Google Scholar] [CrossRef]
  5. Hussain, B.; Hasan, Q.U.; Javaid, N.; Guizani, M.; Almogren, A.; Alamri, A. An Innovative Heuristic Algorithm for IoT-Enabled Smart Homes for Developing Countries. IEEE Access 2018, 6, 15550–15575. [Google Scholar] [CrossRef]
  6. Zhao, Z.; Lee, W.C.; Shin, Y.; Song, K.B. An optimal power scheduling method for demand response in home energy management system. IEEE Trans. Smart Grid 2013, 4, 1391–1400. [Google Scholar] [CrossRef]
  7. Mahmood, D.; Javaid, N.; Alrajeh, N.; Khan, Z.A.; Qasim, U.; Ahmed, I.; Ilahi, M. Realistic scheduling mechanism for smart homes. Energies 2016, 9, 202. [Google Scholar] [CrossRef]
  8. Hussain, B.; Hasan, Q.U. Demand side management for smart homes in Pakistan. In Proceedings of the 2016 International Conference on Emerging Technologies (ICET), Islamabad, Pakistan, 18–19 October 2016; pp. 1–6. [Google Scholar]
  9. Latif, U.; Javaid, N.; Zarin, S.S.; Naz, M.; Jamal, A.; Mateen, A. Cost Optimization in Home Energy Management System using Genetic Algorithm, Bat Algorithm and Hybrid Bat Genetic Algorithm. In Proceedings of the 2018 IEEE 32nd International Conference on Advanced Information Networking and Applications (AINA), Krakow, Poland, 16–18 May 2018. [Google Scholar]
  10. Naz, M.; Iqbal, Z.; Javaid, N.; Khan, Z.A.; Abdul, W.; Almogren, A.; Alamri, A. Efficient Power Scheduling in Smart Homes Using Hybrid Grey Wolf Differential Evolution Optimization Technique with Real Time and Critical Peak Pricing Schemes. Energies 2018, 11, 384. [Google Scholar] [CrossRef]
  11. Khalid, A.; Javaid, N.; Guizani, M.; Alhussein, M.; Aurangzeb, K.; Ilahi, M. Towards dynamic coordination among home appliances using multi-objective energy optimization for demand side management in smart buildings. IEEE Access 2018, 6, 19509–19529. [Google Scholar] [CrossRef]
  12. Javaid, N.; Ahmed, A.; Iqbal, S.; Ashraf, M. Day Ahead Real Time Pricing and Critical Peak Pricing Based Power Scheduling for Smart Homes with Different Duty Cycles. Energies 2018, 11, 1464. [Google Scholar] [CrossRef]
  13. Khan, A.; Javaid, N.; Khan, M.I. Time and device based priority induced comfort management in smart home within the consumer budget limitation. Sustain. Cities Soc. 2018, 41, 538–555. [Google Scholar] [CrossRef]
  14. Khan, A.; Javaid, N.; Ahmad, A.; Akbar, M.; Khan, Z.A.; Ilahi, M. A priority-induced demand side management system to mitigate rebound peaks using multiple knapsack. J. Ambient Intell. Human. Comput. 2018, 1–24. [Google Scholar] [CrossRef]
  15. Lujano-Rojas, J.M.; Monteiro, C.; Dufo-López, R.; Bernal—Agustín, J.L. Optimum residential load management strategy for real time pricing (RTP) demand response programs. Energy Policy 2012, 45, 671–679. [Google Scholar] [CrossRef]
  16. Rasheed, M.B.; Javaid, N.; Awais, M.; Khan, Z.A.; Qasim, U.; Alrajeh, N.; Iqbal, Z.; Javaid, Q. Real time information based energy management using customer preferences and dynamic pricing in smart homes. Energies 2016, 9, 542. [Google Scholar] [CrossRef]
  17. Rahim, S.; Javaid, N.; Ahmad, A.; Khan, S.A.; Khan, Z.A.; Alrajeh, N.; Qasim, U. Exploiting heuristic algorithms to efficiently utilize energy management controllers with renewable energy sources. Energy Build. 2016, 129, 452–470. [Google Scholar] [CrossRef]
  18. Elsied, M.; Oukaour, A.; Gualous, H.; Hassan, R.; Amin, A. An advanced energy management of microgrid system based on genetic algorithm. In Proceedings of the 2014 IEEE 23rd International Symposium on Industrial Electronics (ISIE), Istanbul, Turkey, 1–4 June 2014; pp. 2541–2547. [Google Scholar]
  19. Anvari-Moghaddam, A.; Monsef, H.; Rahimi-Kian, A. Cost-effective and comfort-aware residential energy management under different pricing schemes and weather conditions. Energy Build. 2015, 86, 782–793. [Google Scholar] [CrossRef]
  20. Shakeri, M.; Shayestegan, M.; Reza, S.S.; Yahya, I.; Bais, B.; Akhtaruzzaman, M.; Sopian, K.; Amin, N. Implementation of a novel home energy management system (HEMS) architecture with solar photovoltaic system as supplementary source. Renew. Energy 2018, 125, 108–120. [Google Scholar] [CrossRef]
  21. Wang, D.; Zhang, X.; Qu, K.; Yu, T.; Pan, Z.; Liu, Q. Pareto tribe evolution with equilibrium-based decision for multi-objective optimization of multiple home energy management systems. Renew. Energy 2018, 159, 11–23. [Google Scholar] [CrossRef]
  22. Meng, X.B.; Gao, X.Z.; Lu, L.; Liu, Y.; Zhang, H. A new bio-inspired optimisation algorithm: Bird Swarm Algorithm. J. Exp. Theor. Artif. Intell. 2016, 28, 673–687. [Google Scholar] [CrossRef]
  23. Li, K.; Wang, R.; Zhang, T.; Ishibuchi, H. Evolutionary many-objective optimization: A comparative study of the state-of-the-art. IEEE Access 2018, 6, 26194–26214. [Google Scholar] [CrossRef]
  24. Hussain, B.; Javaid, N.; Hasan, Q.; Javaid, S.; Khan, A.; Malik, S. An Inventive Method for Eco-Efficient Operation of Home Energy Management Systems. Energies 2018, 11, 3091. [Google Scholar] [CrossRef]
  25. Chinneck, J.W. Practicle Optimizations: A Gentle Introduction. Available online: http://www.sce.carleton.ca/faculty/chinneck/po.html (accessed on 07 October 2018).
  26. Lee, K.Y.; El-Sharkawi, M.A. Modern Heuristic Optimization Techniques Theory and Applications to Power Systems; Wiley: Hoboken, NJ, USA, 2008; Available online: http://www.sce.carleton.ca/faculty/chinneck/po.html (accessed on 7 October 2018).
  27. Jakob, W.; Blume, C. Pareto Optimization or Cascaded Weighted Sum: A Comparison of Concepts. Algorithms 2014, 7, 166–185. [Google Scholar] [CrossRef]
Figure 1. HEMS architecture for a smart home [5].
Electronics 08 00180 g001
Figure 2. Fixed load profile for a smart home.
Electronics 08 00180 g002
Figure 3. 2S-ToUP scheme.
Electronics 08 00180 g003
Figure 4. 3S-ToUP scheme.
Electronics 08 00180 g004
Figure 5. DA-RTP scheme.
Electronics 08 00180 g005
Figure 6. CPP scheme (2-stage).
Electronics 08 00180 g006
Figure 7. PV power profile.
Electronics 08 00180 g007
Figure 8. DWS-PSO for PDDR-based HEMS: A comparative performance for maximal reduction in C E using weights of (1,0)
Electronics 08 00180 g008
Figure 9. Load profile with maximal reduction in C E for 2S-ToUP (DS).
Electronics 08 00180 g009
Figure 10. Load profile with maximal reduction in C E for 2S-ToUP (MS).
Electronics 08 00180 g010
Figure 11. Load profile with maximal reduction in C E for 3S-ToUP (DS).
Electronics 08 00180 g011
Figure 12. Load profile with maximal reduction in C E for 3S-ToUP (MS).
Electronics 08 00180 g012
Figure 13. Load profile with maximal reduction in C E for DA-RTP (DS).
Electronics 08 00180 g013
Figure 14. Load profile with maximal reduction in C E for DA-RTP (MS).
Electronics 08 00180 g014
Figure 15. Load profile with maximal reduction in CE for CPP (DS).
Electronics 08 00180 g015
Figure 16. Load profile with maximal reduction in C E for CPP (MS).
Electronics 08 00180 g016
Figure 17. Load profile with minimal value of T B D with weights = (0, 1).
Electronics 08 00180 g017
Figure 18. Trade-offs between C E and T B D for PDDR-based HEMS.
Electronics 08 00180 g018
Figure 19. DWS-PSO for PDDR-RED-based HEMS: A comparative performance for maximal reduction in C E n e t using weights of (1,0).
Electronics 08 00180 g019
Figure 20. DWS-PSO for RED-based HEMS: A comparative performance at minimal T B D using weights of (0, 1).
Electronics 08 00180 g020
Figure 21. Load profile for minimal T B D using 2S-ToUP (Non-shifted) for PDDR-RED-based HEMS.
Electronics 08 00180 g021
Figure 22. Load profile for maximal reduction in C E using 2S-ToUP (DS) for PDDR-RED-based HEMS.
Electronics 08 00180 g022
Figure 23. Load profile for maximal reduction in C E using 2S-ToUP (MS) for PDDR-RED-based HEMS.
Electronics 08 00180 g023
Figure 24. Load profile for minimal T B D using CPP (Non-shifted) for PDDR-RED-based HEMS.
Electronics 08 00180 g024
Figure 25. Load profile for maximal reduction in C E using CPP(DS) for PDDR-RED-based HEMS.
Electronics 08 00180 g025
Figure 26. Load profile for maximal reduction in C E using CPP(MS) for PDDR-RED-based HEMS.
Electronics 08 00180 g026
Figure 27. Load profile for minimal T B D using 3S-ToUP (Non-shifted) for PDDR-RED-based HEMS.
Electronics 08 00180 g027
Figure 28. Load profile for maximal reduction in C E using 3S-ToUP (DS) for PDDR-RED-based HEMS.
Electronics 08 00180 g028
Figure 29. Load profile for maximal reduction in C E using 3S-ToUP (MS) for PDDR-RED-based HEMS.
Electronics 08 00180 g029
Figure 30. Load profile for minimal T B D using DA-RTP (Non-shifted) for PDDR-RED-based HEMS.
Electronics 08 00180 g030
Figure 31. Load profile for maximal reduction in C E using DA-RTP (DS) for PDDR-RED-based HEMS.
Electronics 08 00180 g031
Figure 32. Load profile for maximal reduction in C E using DA-RTP (MS) for PDDR-RED-based HEMS.
Electronics 08 00180 g032
Figure 33. Tradeoffs between C E n e t and T B D for PDDR-RED-based HEMS.
Electronics 08 00180 g033
Table 1. Abbreviations.
ACAir conditionerAIPCAmeron Illinois Power Company
ASAdvanced scheduling/advanced scheduledACOAnt colony optimization
BFOBacterial foraging optimizationBABat algorithm
BPSOBinary particle swarm optimizationBGABat-genetic algorithm
CPPCritical peak pricing C E Cost of energy
DPADiversified performance analysisDPSDynamic pricing scheme/signal
DSMDemand side managementDRDemand response
DSDelayed scheduling/delayed scheduledDGDispatchable generator
DWS-PSODecomposed-weighted-sum PSODA-RTPDay-ahead real time pricing
ESSEnergy storage systemEDEEnhanced differential evolution
EVsElectric vehiclesGWOGray wolf optimization
GAGenetic algorithmHAHome appliance
HGWDEHybrid gray wolf differential evolutionHBGHybrid bacterial foraging and genetic algorithm
HEMSHome energy management system I B R Inclined block rate
LPLinear programmingLOOTLength of operational time
MSMixed scheduling/mixed scheduled (scheduling includes both AS and DS SHAs)MOMulti-objective/Multi-objectivity
MOGAMulti-objective GAMILPMixed integer linear programming
MOOMulti-objective optimizationNSHANon-shiftable home appliance
NSGANon-dominated-sorted genetic algorithmOFObjective function
PDDRPrice-driven demand responsePDDR-REDPDDR synergized with RESs and ESS optimal dispatch
POPareto optimizationPARPeak-to-average ratio
PTEPareto tribe evolutionPSOParticle swarm optimization
PVPhotovoltaicRTPReal-time pricing
RESRenewable energy sourceSHAShiftable home appliance
SCFSingle compound functionSOOSingle objective optimization
SBStorage battery2S-ToUP2-stage time-of-use pricing
3S-ToUP3-stage time-of-use pricingTOTradeoff
TLBOTeacher learning-based optimization T B D Time based discomfort
TPTest problemToUPTime-of-Use Pricing
WTWind turbineWSMWeighted sum method
Table 2. Nomenclature.
BVector for numbering SHAs
S T s l t Vector of the starting slots of the SHAs’ operating time intervals
E N s l t Vector of the ending slots of the SHAs’ operating time intervals
C E Cost of energy purchased from the grid
C E n e t Net cost of energy
C E s o l d Cost of energy sold to the grid
D E P Vector of dynamic electricity pricing from the grid
D E P f Vector of feed-in pricing
E P Electricity price
I B R Inclining block rate
I t t e r Number of iterations
NNumber of slots in the scheduling horizon
kNumber of SHAs
L O O T Vector of the lengths of the SHA operating times
N g _ m x Maximum number of generations for the GA
P a p p Vector of per-slot power values for the SHAs
P c h Vector of SB charging power values
P c h _ m x Maximum SB charge rate
P d s Vector of SB discharging power values
P d s _ m x Maximum SB discharge rate
P g d Vector of values representing power from the grid
P p v Vector of PV power values
P s c h Vector of scheduled loads
P s o l d Vector of values representing energy sold to the grid
P T Power threshold for I B R application
S O C G Vector of states of charge
S O C G _ m x Maximum SOCG limit
S O C G _ m n Minimum SOCG limit
S O C G ( i n i t ) Initial SOCG at the start of the scheduling horizon
S H t y p e Vector of the scheduling types for the SHAs
TVector of number of scheduling slots
T B D Time-based discomfort due to scheduling
T B D ( A ) Average time-based discomfort due to AS
T B D ( D ) Average time-based discomfort due to DS
T B D ( M ) Average time-based discomfort due to MS
T s t Decision vector for the start times of the SHAs
P b Power vector based on T s t for the bth SHA
P e a k Peak demand from the grid
W T V Vector of weights for constituent OFs to compute value of SCF
Table 3. SHAs and scheduling specifications for the DS and MS scenarios.
SHAPower (kWh)LOOT (slots)MS (Start/End Limits)DS (Start/End Limits)
AC-1 (Reversible)11801-36 (DS)01-36 (DS)
AC-2 (Reversible)1937-54 (DS)37-54 (DS)
AC-3 (Reversible)19103-120 (DS)103-120 (DS)
AC-4 (Reversible)112121-144 (DS)121-144 (DS)
Dishwasher DW-10.6349-102 (DS)49-102 (DS)
Dishwasher DW-20.63127-144 (DS)127-144 (DS)
Electric Geyser EG-10.8601-36 (DS)01-36 (DS)
Rice Cooker RC-1 (Manual)0.4373-81 (DS)73-81 (DS)
Computer (CP) (Manual)0.16114-144 (DS)114-144 (DS)
Washing Machine (WM)0.7993-123 (AS)114-144 (DS)
Water Pump (WP)0.7337-117 (AS)114-144 (DS)
Electric Geyser EG-20.8655-121 (AS)115-126 (DS)
Rice Cooker RC-2 (Manual)0.43100-117 (AS)114-120 (DS)
Iron (IR) (Manual)0.6355-117 (AS)114-144 (DS)
Table 4. PV unit, SB and inverter specifications [5].
ParameterValue
Total capacity of the PV unit5 kW
Rating of each panel250 W
Number of panels and panel area20, 32 m2
Efficiency of PV panels15%
Inverter rating5 kW
Inverter efficiency70%
SB Ah600 Ah
SB voltage48 V
SB capacity4.8 kWh/slot
SB charge rate0.48 kWh/slot
SB discharge rate0.32 kWh/slot
Minimum SOCG30%
Maximum SOCG95%
SB efficiency80%
Table 5. DWS-PSO for PDDR-based HEMS: reductions in C E , peak load and T B D for a diversified set of TPs.
Tariff SchemePDDR HEMS ApproachBase Values of CE (Cents), Peak (kW) and TBD After PDDR-Based HEMS SchedulingPerformance Achieved through PDDR-Based HEMS
CE (Cents)Peak (kW)Reduction in CE (%) (Performance Metric 1) TBD (%)Reduction in Peak (%)
2S-ToUDS218.99; 0.608 and 1197.690.369.746.641.12
MS184.460.3415.862.1843.80
3S-ToUDS206.85; 0.608 and 1173.880.3615.958.1641.07
MS1670.3419.362.843.80
RTPDS68.48; 0.608 and 154.580.3920.359.3735.58
MS54.450.3420.564.0743.80
CPPDS327.44; 0.608 and 1255.970.6821.861−11.02
MS220.460.3432.76543.80
Table 6. Performance metrics of DWS-PSO-based algorithm for PDDR-based HEMS.
Tariff SchemeHEMS ApproachPerformance Metrics for PDDR-Based HEMS
Reduction in CE (%)Range of TBD (%)Average Reduction in CE per Unit of TBD (Performance Metric 2)Relative Value of Performance Metric 2
2S-ToUDS0∼09.730∼46.600.20871
MS0∼15.770∼62.180.25361.22
3S-ToUDS0∼15.940∼58.160.27411.31
MS0∼19.260∼62.800.30671.47
RTPDS0∼20.300∼59.370.34191.64
MS0∼20.500∼64.070.321.53
CPPDS0∼21.830∼61.000.35781.71
MS0∼32.670∼65.000.50262.41
Table 7. DWS-PSO for PDDR-RED-based HEMS: maximum reductions in C E , peak load and T B D for diversified TPs using weights ( C E , T B D ) = 1,0.
Dynamic Pricing SchemeHEMS ApproachWithout PDDR-RED-Based OperationWith PDDR-RED-Based HEMS OperationPerformance Achieved with PDDR-RED-Based HEMS Operation
CEnet (Cents), Peak (kW) and TBD CEgrid CEsold CEnet (Cents)Peak (kW)Reduction in CEnet (%) (Per. metric 1) TBD (%)Reduction in Peak (%)
2S-ToUDS218.99; 0.608 and 0103.8670.5433.330.3984.858.3735.53
MS72.4954.3018.190.3391.762.0445.23
3S-ToUDS206.85; 0.608 and 083.3867.9515.430.3692.560.2541.12
MS58.8352.935.890.3397.258.1745.23
RTPDS68.48; 0.608 and 023.0029.94−6.940.39110.173.135.58
MS18.5827.07−8.490.34112.461.3943.80
CPPDS327.44; 0.608 and 0115.1570.5444.610.6886.459.1−11.02
MS72.4954.3018.190.3394.463.745.23
Table 8. DWS-PSO for RED-based HEMS: reductions in C E and PEAK load for diversified TPs using weights ( C E , T B D ) = (0, 1) for minimal T B D .
Tariff SchemeHEMS ApproachWithout PDDR-RED-Based HEMS OperationWith PDDR-RED-Based HEMS OperationPerformance Achieved with PDDR-RED-Based HEMS Operation
CEnet (Cents), Peak (kW) and TBD CEgrid (Cents) CEsold (Cents) CEnet (Cents)Peak (kW)Reduction in CEnet (%) (Per. metric 1) TBD Reduction in Peak (%)
2S-ToUDS218.99; 0.608 and 0124.7877.5347.250.3378.4045.23
MS124.7877.5347.250.3378.4045.23
3S-ToUDS206.85; 0.608 and 0115.2575.4439.820.3480.7043.80
MS115.2575.4439.820.3480.7043.80
RTPDS68.48; 0.608 and 034.3632.062.300.3496.6043.80
MS34.3632.062.300.3496.6043.80
CPPDS327.44; 0.608 and 0174.7177.5397.180.3370.3045.23
MS174.7177.5397.180.3370.3045.23
Table 9. Performance metrics of DWS-PSO for PDDR-RED-based HEMS.
Tariff SchemeHEMS ApproachReduction in CEnet with RED only (%)Performance Metrics for PDDR-RED- Based HEMS
Reduction in CEnet (%)Range of TBD (%)Average Reduction in CEnet per Unit of TBD (Performance Metric 2)Relative Value of Performance Metric 2
2S-ToUDS78.4278.42∼84.780∼58.370.1091.00
MS78.4278.42∼91.690∼62.040.2141.96
3S-ToUDS80.7580.75∼92.540∼60.250.1961.80
MS80.7580.75∼97.150∼58.170.2822.59
RTPDS96.6496.64∼110.130∼73.100.1851.70
MS96.6496.64∼112.400∼61.390.2572.36
CPPDS70.3270.32∼86.380∼59.100.2722.50
MS70.3270.32∼94.440∼63.700.3793.48

