A Plug and Play IoT Wi-Fi Smart Home System for Human Monitoring


Department of Engineering and Architecture, University of Parma, Parco Area delle Scienze, 181/A, 43124 Parma, Italy
*
Author to whom correspondence should be addressed.
Electronics 2018, 7(9), 200; https://doi.org/10.3390/electronics7090200
Submission received: 27 August 2018
/
Revised: 13 September 2018
/
Accepted: 14 September 2018
/
Published: 16 September 2018
(This article belongs to the Special Issue Sensing and Signal Processing in Smart Healthcare)
Abstract
:The trend toward technology ubiquity in human life is constantly increasing and the same tendency is clear in all technologies aimed at human monitoring. In this framework, several smart home system architectures have been presented in literature, realized by combining sensors, home servers, and online platforms. In this paper, a new system architecture suitable for human monitoring based on Wi-Fi connectivity is introduced. The proposed solution lowers costs and implementation burden by using the Internet connection that leans on standard home modem-routers, already present normally in the homes, and reducing the need for range extenders thanks to the long range of the Wi-Fi signal. Since the main drawback of the Wi-Fi implementation is the high energy drain, low power design strategies have been considered to provide each battery-powered sensor with a lifetime suitable for a consumer application. Moreover, in order to consider the higher consumption arising in the case of the Wi-Fi/Internet connectivity loss, dedicated operating cycles have been introduced obtaining an energy savings of up to 91%. Performance was evaluated: in order to validate the use of the system as a hardware platform for behavioral services, an activity profile of a user for two months in a real context has been extracted.
1. Introduction
The concept of a Smart Home has evolved remarkably over the past few decades. Initially, the Smart Home coincided with Home Automation intended as technological solutions applied to the home environment to automatically manage some situations (e.g., open doors/curtains, control thermostat) and detect dangerous events (e.g., fire, flood), freeing the user from manual control [1]. Now, the evolution of ICT (Information and Communication Technologies) has allowed for the addition of many advanced features to smart homes over time, extending the possible applications. Among the advancements, the monitoring of human activity in the home environment has particular importance. Modern systems exploit human monitoring mainly to improve the energy management of the building [2,3,4,5,6,7]. However, data related to the users and how they live in their own home environment can find straightforward applications in health management, allowing for early detection of behavioral trends and anomalies possibly relevant to one’s wellbeing [8,9,10,11,12,13,14].
To accomplish this task, some new devices have to be developed [15] aimed at considering the interaction of the user with the home environment (e.g., armchair sensors to monitor inactivity periods, toilet sensors, etc.). These devices must be able to send data over the Internet so that, once processed, they can be accessed by the various professionals involved, for example, medical doctors, caregivers, relatives, and the users themselves.
Applications based on such a system have been presented in past works. For example, an infrastructure based on a Passive InfraRed (PIR), bed and temperature sensors was reported in [16]. In this case, data transmission was based on the X10 wireless protocol, and a home server was exploited to process data and to send analyses and alerts to a third person (i.e., the clinician) through emails. Another monitoring system based on temperature, pressure, PIR sensors, and actuators was described in [17]. Sensors communicated with a local computer by means of a wireless ZigBee protocol. Data were processed to monitor the activities of elders, and the results determined which actions were taken. The system proposed in [18] leans on a mix of ZigBee and Power Line Communication (PLC) transmission protocols. The architecture was conceived with distinct ZigBee Wireless Sensor Networks (WSNs) in each room, which communicate with a central management station through a PLC. An infrastructure exploiting a custom wireless protocol, the so called Wellness protocol, was presented in [19]. The implementation was based on temperature, pressure sensors, PIR sensors, a manual alert button, and actuators. Another example of such a system was CARDEA (Computer-Aided, Rule-based Domestic Environment Assistant), developed at the University of Parma and specifically aimed at behavioral analysis. Originally based on the Ethernet protocol [20,21], the system’s strength is flexibility. It is conceived to integrate different kinds of sensors and to support smart interfaces [22,23], in order to tailor the system’s functions to the specific users’ needs. By supporting a wireless protocol (i.e., IEEE 802.15.4/ZigBee) as well, further kinds of devices were introduced; the most remarkable is the wearable sensor MuSA (MUltiSensor Assistant) [24,25,26,27], designed for user motion analysis (e.g., fall monitoring) and for localization and identification purposes [28,29].
Most of the systems presented in the literature based their connectivity on wireless protocols, typically ZigBee [30,31,32], due to the low cost and power consumption. Coupling the low power required by a ZigBee transmission with recent developments in the field of energy harvesting, it is now possible to develop battery-less Internet of Things (IoT) nodes [33,34]. However, powering the ZigBee protocol tasks for prolonged periods of time (i.e., >10 s) with energy harvesters is not recommended [35]. Some advanced functions (e.g., localization or identification [36]), useful in smart home systems conceived for the continuous monitoring of the individual and for behavioral analysis, can be prevented. Moreover, the disadvantage of the ZigBee approach is mainly the necessity of a completely new and dedicated infrastructure in each home in which the system is going to be deployed, since, typically, a network compliant with these standards is not already present. Furthermore, a gateway device has to be considered as an interface between the home protocol and the Ethernet, in addition to a number of range extenders due to the low range featured by ZigBee [37].
In this paper, we present a new home monitoring system entirely based on Wi-Fi connectivity, in a fashion strictly compliant with the Internet of Thing (IoT) paradigm. Sensors connect to the Internet through a standard Wi-Fi home router, which is quite often already present in the homes. Some manufacturers are already producing chips for routers which are able to support Wi-Fi, Bluetooth, and ZigBee protocols in parallel (e.g., Qualcomm QCA4020 and QCA4024 [38]). These solutions could simplify the adoption of multiple protocols in the near future, but do not eliminate the need for building a complete infrastructure for the ZigBee sensors and in particular for deploying range extenders in the environment. On the contrary, Wi-Fi features a much wider range than ZigBee, so that no (or fewer) network extenders are needed, simplifying the overall approach, lowering the costs, and making the whole system more scalable. These characteristics open the market to the system making it particularly attractive to consumers. This, of course, comes at the expense of increasing power consumption, which may harm battery lifetime. Therefore, we carefully designed sensor platforms for low-power operation. An extensive account for the exploited design methodologies is given in [39], where it is shown that the obtained battery lifetimes are suitable for practical exploitation.
Based on such preliminary studies, we developed a complete set of specific sensor prototypes, providing expressive information relevant to behavioral inference. In [16,40,41,42] some examples on how the sensor data can be processed and elaborated to extract patterns in the behaviors of home occupants are given. The present work is an extension of a published conference paper [43] where a brief description of the sensors is given. Here, more details about the developed hardware are given, and the proposed system hardware infrastructure is validated. The sensors have been tested both in a laboratory and in a real home environment. Some measurements about the power consumption are presented.
Moreover, during the tests, the sensors’ data were logged to carry out a possible activity profile of the users in order to test the system performance. It is worth stressing that the aim of this work is not to develop and demonstrate a new behavioral analysis method, but to present a new hardware architecture conceived to collect data usable by behavioral analysis models developed elsewhere [16,40,41,42]. These tests show the usability and convenience of data collected and demonstrate that it is possible to take advantage of the flexibility of the Wi-Fi platform while eliminating costs given by the need of additional hardware (i.e., home servers and routers, adopted in [13,14,15,16]).
2. Materials and Methods: The Wi-Fi System
2.1. System Architecture
The general system architecture is sketched in Figure 1. It includes a set of sensing devices, a Wi-Fi router, and services installed on a cloud environment. We currently exploit the IBM Bluemix Watson IoT platform (IBM, Armonk, NY, USA). The system is open to third-party and new device addition. We plan to integrate both custom-designed and commercial Wi-Fi devices in a seamless fashion.
Here, we discuss the custom design of a subset of sensors specifically aimed at behavioral analysis. Based on outcomes of previous European projects in which the ZigBee version was exploited [44], we defined the following device list:
- Armchair (or Bed) occupancy sensor, to monitor inactivity periods or sleep disorders;
- Passive InfraRed (PIR), to monitor the movements inside the house;
- Toilet sensor, to monitor the toilet accesses;
- Magnetic contact, to detect door and windows opening/closing. The same device can be used to monitor interaction with other meaningful objects (e.g., a cupboard door, to monitor feeding habits, or the medicine cabinet, for monitoring compliance with therapy prescriptions).
All sensors are directly and individually connected to the Internet through the Wi-Fi home router. The commissioning procedure is very simple and relies on the Wi-Fi Protected Setup (WPS) standard. No technical skill is required, so that consumers themselves could manage the installation procedure. Data are sent to the Watson IoT platform, inside the IBM Bluemix cloud services, via MQTT (Message Queue Telemetry Transport) protocol with a Quality of Service (QoS) equal to 2. This ensures the necessary reliability of the transmission process, since the protocol itself ensures that the message is received by the broker once and once only. The payload of the message is a string in a JSON (JavaScript Object Notation) format, reporting the sensor status. The device firmware, nevertheless, is suitable for connecting to other platforms as well (e.g., Amazon AWS (Amazon Web Services) (Amazon, Seattle, WA, USA), Microsoft Azure (Microsoft, Redmond, WA, USA), Thingspeak (MathWorks, Natick, MA, USA), etc.).
2.2. Sensors Prototypes
A Wi-Fi certified system-on-chip (SoC) (CC3200, Texas Instruments, Dallas, TX, USA [45]) was chosen as the core of all sensors. It integrates an 80 MHz clock MCU (MicroController Unit) with a 32-bit architecture and a network processor (compliant with the IEEE 802.11b/g/n network radio protocol).
For prototyping purposes, commercial development boards were exploited as the motherboard for all the devices. By connecting the same motherboard to different sensing devices, different sensors were built, sharing the architecture, thus reducing development costs. The sensors are shown in Figure 2.
All the devices can be powered from an AC (Alternating Current) outlet (through a standard USB port). This possibility eliminates the need to control and replace the batteries. However, the sensors’ position is very important to efficiently monitor the users’ activities. This position has to be independent of where the outlets have been set up in the house, but, at the same time, it is necessary to avoid wires in the room or to modify the existing home electrical system. For this reason, the devices are also conceived for battery-powered operation. In order to preserve battery lifetime, careful management of the energy budget was implemented. In particular, simple sensors do not need to fully exploit the Wi-Fi data transmission rate, since a limited quantity of data have to be exchanged over time. So, taking advantage of such an overabundant data rate, sleep phases are introduced in the operating cycle. The devices alternate active (data processing and transmission) and sleep intervals. Among available low power modes of the MCU, the Low-Power Deep Sleep (LPDS) and the HIBERNATE modes were exploited. In LPDS mode, the MCU stops its main clock while the radio module is active and maintains the connection with the network. The device is more reactive to external interrupts and features low wake up times. In HIBERNATE mode, the radio section is also turned off. Hence, HIBERNATE is the most effective in power saving, but, when awakening from hibernation, the device needs to re-connect to the network. Wake up times are in the order of tens of seconds, so hibernation is convenient when the sleep time is long enough. In our previous study [39], it was shown that the overall power performance of LPDS mode is better than HIBERNATE whenever a large enough frequency of messages (higher than 150 message/day) is to be managed. Considering the fact that all the sensors need to send a keep-alive message (every 15 minutes, in the application at hand), hibernation turns out to be practical whenever only a few tens of actual “events” per day are expected to occur. Among the sensors presented in this first implementation of the Wi-Fi system, this characteristic may fit with Armchair/Bed sensors, Toilet sensors and the several uses of the Magnetic contact. On the other hand, LPDS mode may be a better fit for higher frequency events, as happens for the PIR sensor. Based on such general assumptions, in the following specific implementation, details are given for each device.
- Armchair/Bed sensor: In [46], a characterization of three different chair sensor elements is presented: a strain gauge, a mechanical switch, and a vibration sensor. Highest detection accuracy is reported for the mechanical switch, but this kind of sensor is more difficult to integrate in an ordinary home chair/bed since it is not straightforward to cover the whole sitting area. For our application, the strain gauge seems the most indicated choice. Indeed, resistive pressure pads are being commercialized which can be placed under the bed mattress or over the chair seat. These pads have been selected as sensing elements. Resistance change is assessed through a simple voltage divider, which drives a binary threshold comparator. This, in turn, generates an interrupt to wake up the MCU. As mentioned, given the relatively low expected number of events, the HIBERNATE sleep mode is exploited during idle phases.
- Magnetic Contact: The sensing element is a reed switch, coupled to a magnet. When the two components are close to each other, the switch opens. This configuration is particularly convenient when drawers/doors are supposed to stay closed most of the time. Since the reed switch is open when they are closed, the sensor drains no current while in this state. Interrupts are generated to signal both transitions (close to open, open to close). In this case, selection of sleep mode depends on the actual device function. If, for instance, applied to the home main door, the HIBERNATE mode seems to be more effective again.
- Toilet sensor: The sensing element is a distance/proximity sensor. The sensor purpose is to allow for counting toilet visits (which may be relevant to many medical conditions), distinguishing them from generic bathroom presence (due to washing, for instance), which could be assessed though a PIR sensor. A short-enough, personalized reading range is therefore needed to cope with the actual placement of the sensor itself. The device has a reading range from 10 cm to 150 cm. The analog reading is fed to a comparator, which generates an interrupt signal to the system core. In our experiments, we found that calibrating the sensor threshold at 65 cm distance was effective in discriminating toilet actual usage from generic bathroom presence. The nature of this sensor should make it suitable to exploit the benefits of the HIBERNATE mode. However, due to the high current consumption of the sensing element during its on state, the system core needs to power it on only when a distance reading is needed, keeping it in the off state otherwise. In our tests, we found that a period of 3 seconds for power off followed by 0.5 s of power on gives the optimal system reactivity. Since the sensing element duty cycle is driven by the MCU, LPDS mode had to be adopted.
- PIR sensor: the sensing device is a standard passive-infrared motion sensor. It requires a supply voltage in the range of 3.3–5 V. In order to allow the system to be powered by AA batteries (as a common feature of all devices), a boost DC-DC regulator (direct current to direct current power converter that steps up voltage) has been added. The device already has embedded converters and provides a digital output signal, which is used to wake up the system core whenever a movement is detected. To avoid communication overload, PIR data are filtered on board; only status changes are transmitted, besides keep-alive messages. In the envisaged scenario, however, this results in a number of daily messages exceeding the above-mentioned threshold, which makes the adoption of hibernation not suitable and makes the adoption of LPDS mode preferable.
3. Results and Discussion
To evaluate the system, field tests were performed for two months.
For standby battery-lifetime evaluation, a full set of sensors was installed in a laboratory environment. The power consumption depended on the frequency of the occurring interactions with the sensor events. To determine a figure that allows for the comparison between sensors, only power consumption caused by the keep-alive events sent every 15 minutes were considered.
In order to estimate the battery lifetime in a working condition similar to the real one, another full set of sensors was installed in a real home environment inhabited by a family.
The sensors were deployed accordingly to their purpose:
- Armchair sensor: Sensor pad placed on a lunchroom chair.
- Magnetic contact: On the bedroom door.
- Toilet sensor: Inside the bathroom to sense toilet interactions.
- PIR sensor: Inside the bedroom.
The performance of the whole system was investigated, manually registering the user-sensor interactions and comparing them with the events reported by the sensors themselves.
Test details and results are given in the following subsections.
3.1. Power Consumption Analysis
In a previous work [39], preliminary laboratory tests about the sensors’ power consumption were carried out. In this paper, we report an actual characterization of the system.
In the tests shown in [39], we assumed that the connection to the Wi-Fi network and to the Internet were reasonably stable. In real operation, this is not always true, and in order to consider possible disruptions that a consumer may experience, two main issues were evaluated:
- Sensor unable to connect to the Wi-Fi network: The system, after power on, is configured to search for the previously known network (through the WPS procedure) until connection succeeds; if the network connection is broken (e.g., because of a blackout), the device performs a reboot. The system always experiences an energy-expensive boot-loop until the network is restored;
- Sensor connected to the Wi-Fi network but without an active Internet access (e.g., because of Internet provider issues): This situation arises only after the previous condition is met. After power on, the device searches and connects to the known network; it tries to establish a connection with the online cloud. If the procedure fails (e.g., because the Internet connection is lost), a reboot is performed. The result is the same, with the system always in an energy-expensive boot-loop until the internet connection is restored.
To better understand the consequences of this behavior on the actual current consumption, each scenario was reproduced and current measurements were carried out using a digital oscilloscope with a bandwidth of 350 MHz, an ADC (Analog to Digital Converter) resolution of 12 bit, and a maximum sample rate of 1.25 GS/s. To measure the sensors current, a probe with a bandwidth of 50 MHz and a minimum sensitivity of 10 mA/div was exploited.
Results are shown in Figure 3. In Figure 3a, the device settles at an almost constant current absorption of 14.2 mA while waiting for the network connection, with an averaged 71.4 mA current while searching for a Wi-Fi connection. In Figure 3b, phases in which the system is not using the radio module (during reboot) with a 101 mA peak current absorption can be identified, as well as a 74.3 mA peak current when the Wi-Fi connection succeeded and tried to establish connection to the cloud.
By the analysis of those data, a total mean current of 17.3 mA can be extracted for the first scenario, and a total mean current of 34.5 mA for the second one. This behavior can significantly degrade sensors’ energy performance. To overcome this problem, and hence to extend battery lifetime, the device is forced to follow a duty-cycled sequence of searching and sleeping phases, as shown in Figure 4.
The device is allowed to check for the presence of the Wi-Fi network or the Internet connectivity for a maximum period of 10 s. After this time, if the task fails, the system enters in a HIBERNATE sleep mode for 60 s to save energy and preserve battery charge. After the sleeping phase, a new search phase begins. This behavior has been tested and compared with the standard one for the same scenarios. The new current measurements are shown in Figure 5.
After a larger initial current peak needed by the device to boot up, some current peaks are experienced during the Wi-Fi/Internet check phase and they reach the minimum in the sleep phase. In this case, the total mean currents over the period are 7.3 mA in the first scenario and 3.1 mA in the second one. Due to the unpredictability of these situations, the advantage in terms of battery lifetime is not quantifiable; however, with this method, the system is able to reduce the energy consumption by 42% in the case of Wi-Fi network absence and by 91% in the case of Internet connectivity absence. Hence, this behavior has been adopted for all sensors, and the actual battery lifetime during real operation has been evaluated.
As stated before, the sensors’ energy performance was evaluated in both laboratory and home environments. All sensors were powered with parallel-series of four AA LR6 alkaline batteries. In the laboratory test, due to the different activity profile expected in a public environment, we tested only the stand-by power consumption. The only signals sent were periodic (15 min) keep-alive messages. In the real home environment, instead, the sensors were stressed during the day by three different members of a family.
After two months of testing, only the toilet sensor ran out of battery: For the other sensors, the laboratory set shows a residual charge of about 46%, while in the home environment this value is lower at 34%. It is worth considering that the battery lifetime in a real home environment strongly depends on the actual interaction with the sensors (e.g., the Magnetic contact can be stressed by more than one user, affecting the expected daily events and the sensor energetic performance). Moreover, as expected, the toilet sensor has a higher energy consumption because of the usage of LPDS mode and due to the higher power consumption of the sensible element. For this reason, the toilet battery lifetime was 30 days.
3.2. Behavioral Tests and Results
To evaluate the system accuracy, sensitivity, and specificity, one user manually took note of his interactions with the sensors for two months. These data were compared with the events generated by the sensors and automatically collected into the cloud platform. This analysis could effectively be done, in our scenario, only with the chair sensor, in fact, data for the Magnetic contact, Toilet and PIR sensors cannot be univocally assigned to a specific person, in an environment populated by more than one end-user. To resolve this situation a user identification mechanism should be considered [36,47].
In the case of the chair sensor, a total of 218 events were detected as follows: 99 True Positives (TP), 109 True Negatives (TN), 0 False Positives (FP), and 10 False Negatives (FN). Then, the accuracy, sensitivity, and specificity were carried out [48]:
where TP, TN, FP, and FN are defined as reported in Table 1.
The results presented show that our sensor is definitely capable of providing occupancy information in a real context. In [46], the reported averaged accuracy for a resistive strain gauge was 94%. This value is compatible with our results. We can conclude that the performance of our sensors are attributable to the resistive pressure pad. Nowadays, the pressure pad is the best choice due to its commercial availability and because it does not require specialized installation. Better performance could be obtained by replacing the sensing element, without affecting the system architecture.
Some elaborations on the data acquired from all the sensors has been performed to demonstrate the possibility of identifying patterns in the user’s activity. For each sensor, two different cases have been considered:
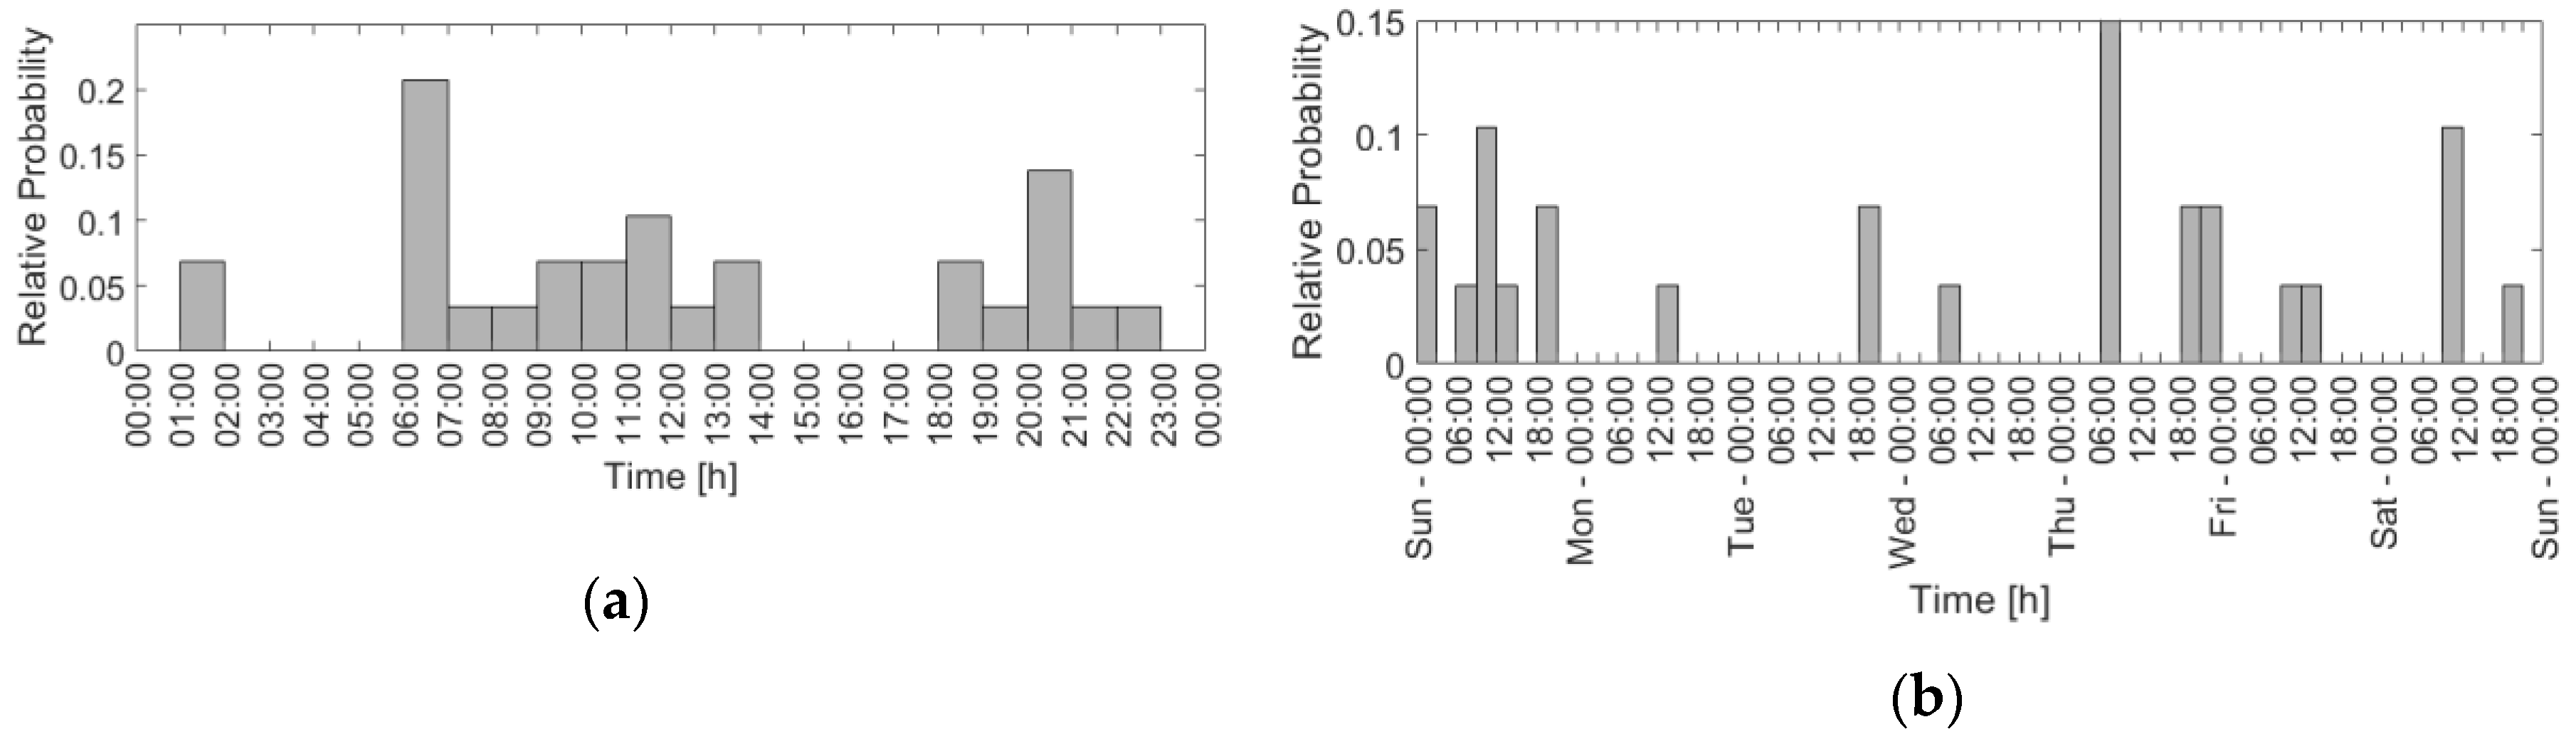
- Daily activity: the distribution of the user-sensor interactions during a 24 h period was analyzed. In Figure 6a, Figure 7a, Figure 8a and Figure 9a the probability of an event in a certain hour of the day is plotted. Values were obtained through the analysis of the activity per hour of every test day. The relative probability was calculated with the equationwhere is the number of events that occurred in the hour, \ and is the total number of events observed during the test.
Although the aim of this paper was not to present a complete behavioral analysis module, simple trend information might be extracted from the results, demonstrating data convenience. For instance, a high lunchroom chair interaction can be seen during meals; the door openings are concentrated during the weekend, when the user is usually not at work. This fact can be confirmed by the PIR weekly graphs, in which the activity distribution shows a higher presence starting from Friday. Looking at the Toilet sensor activity, a periodic usage can be seen around meal times and in the early morning after waking up. Moreover, as expected, no sensors recorded activities during nighttime, when the user is supposed to be sleep.
4. Conclusions
In this paper, a new Smart Home system architecture conceived for behavioral analysis and based on Wi-Fi connectivity has been presented. The aim is to present an alternative architecture compared to the more traditional ones based on protocols such as ZigBee. The ZigBee solutions are not typically already present in the home environment, and this causes some problems in the practical deployment, mainly due to the necessity of the set-up fo a new and complete network infrastructure for every system installation.
In the proposed architecture, the sensors are connected to the Internet through a standard Wi-Fi router, in an IoT compliant fashion, without the need to add a dedicated home gateway to ensure connectivity or the range extenders often needed when using other standard protocols. A complete set of new devices conceived to acquire data related to users’ behaviors has been designed and developed.
Since the principal drawback of the Wi-Fi connectivity is the higher power consumption, low power design strategies have been considered and applied to demonstrate the possibility of using this architecture in the context of smart homes for behavioral monitoring. The whole system has been tested in a real environment to evaluate the feasibility of adopting it in a real situation.
For this study, two sets of sensors. composed of an Armchair sensor, a Magnetic contact, a Toilet sensor, and a PIR sensor, were run for two months. The first set was used to evaluate stand-by battery lifetime while the second one was placed in a real home environment, inhabited by a family, to evaluate real battery lifetime. After the two months of testing, only the Toilet sensor ran out of battery. For the other sensors, the laboratory set shows a residual charge of about 46%, while in the home environment this value was 34%. Furthermore, in some cases, the network could undergo connectivity issues; in these situations, dedicated operating cycles were introduced, instead of the standard ones, to reduce the impact on the battery lifetime. This lead to a reduction in the current absorption of 42% in the case of Wi-Fi network absence and of 91% in the case of a lack of Internet connectivity.
Moreover, in order to validate the possibility of using this system as a hardware platform for behavioral services, we have extracted, from the set of sensors installed in the home environment, a possible activity profile of an occupant. A user was assigned to take note of each interaction with the sensors for two months to test the system performance. The accuracy, sensitivity, and specificity were evaluated for the chair sensor (whose interaction, in our environment, can definitely be attributable to a single person) resulting in 95%, 91%, and 100%, respectively. These results show that our sensor is definitely capable of providing occupancy information in a real context.
In conclusion, exploiting Wi-Fi as an infrastructure for smart home systems conceived for human monitoring is a possible alternative to other systems based on protocols such as ZigBee, due to the low cost and ease of installation and use. The power consumption does not affect the usability, and the performance is not influenced by the system architecture.
Author Contributions
Conceptualization, V.B., I.D.M.; Methodology, V.B., I.D.M; Software, M.B.; Validation, V.B.; Formal Analysis, V.B., M.B.; Investigation, V.B., M.B.; Data Curation, V.B., M.B.; Writing-Original Draft Preparation, V.B., M.B.; Writing-Review and Editing, V.B., M.B., I.D.M.; Visualization, V.B., M.B, I.D.M.; Supervision, I.D.M; Project Administration, I.D.M.; Funding Acquisition, I.D.M.
Funding
This research received no external funding.
Acknowledgments
The authors would like to acknowledge Federico Mendogni for the help with the experiments and prof. Paolo Ciampolini for his scientific guidance and advice.
Conflicts of Interest
The authors declare no conflict of interest.
References
- Yerrapragada, C.; Fisher, P.S. Voice controlled smart house. In Proceedings of the IEEE 1993 International Conference on Consumer Electronics Digest of Technical, Rosemont, IL, USA, 8–10 June 1993. [Google Scholar] [CrossRef]
- Shih, H.C. Automatic building monitoring and commissioning via human behavior recognition. In Proceedings of the 2016 IEEE 5th Global Conference on Consumer Electronics, Kyoto, Japan, 11–14 October 2016. [Google Scholar]
- Hwang, I.K.; Lee, D.S.; Baek, J.W. Home network configuring scheme for all electric appliances using ZigBee-based integrated remote controller. IEEE Trans. Consum. Electron. 2009, 55, 1300–1307. [Google Scholar] [CrossRef]
- Chen, C.-Y.; Liu, C.-Y.; Kuo, C.-C.; Yang, C.-F.; Chen, C.-Y.; Liu, C.-Y.; Kuo, C.-C.; Yang, C.-F. Web-Based Remote Control of a Building’s Electrical Power, Green Power Generation and Environmental System Using a Distributive Microcontroller. Micromachines 2017, 8, 241. [Google Scholar] [CrossRef]
- Lobaccaro, G.; Carlucci, S.; Löfström, E. A review of systems and technologies for smart homes and smart grids. Energies 2016, 9. [Google Scholar] [CrossRef]
- Brusco, G.; Burgio, A.; Menniti, D.; Pinnarelli, A.; Sorrentino, N.; Scarcello, L.; Brusco, G.; Burgio, A.; Menniti, D.; Pinnarelli, A.; et al. An Energy Box in a Cloud-Based Architecture for Autonomous Demand Response of Prosumers and Prosumages. Electronics 2017, 6, 98. [Google Scholar] [CrossRef]
- Froiz-Míguez, I.; Fernández-Caramés, T.; Fraga-Lamas, P.; Castedo, L.; Froiz-Míguez, I.; Fernández-Caramés, T.M.; Fraga-Lamas, P.; Castedo, L. Design, Implementation and Practical Evaluation of an IoT Home Automation System for Fog Computing Applications Based on MQTT and ZigBee-WiFi Sensor Nodes. Sensors 2018, 18, 2660. [Google Scholar] [CrossRef] [PubMed]
- Ceccacci, S.; Generosi, A.; Giraldi, L.; Mengoni, M. An user-centered approach to design smart systems for people with dementia. In Proceedings of the 2017 IEEE 7th International Conference on Consumer Electronics-Berlin (ICCE-Berlin), Berlin, Germany, 3–6 September 2017. [Google Scholar]
- Pal, D.; Funilkul, S.; Charoenkitkarn, N.; Kanthamanon, P. Internet-of-Things and Smart Homes for Elderly Healthcare: An End User Perspective. IEEE Access 2018, 6, 10483–10496. [Google Scholar] [CrossRef]
- Vechet, S.; Hrbacek, J.; Krejsa, J. Environmental data analysis for learning behavioral patterns in smart homes. In Proceedings of the 2016 17th International Conference on Mechatronics-Mechatronika (ME), Prague, Czech Republic, 7–9 December 2016. [Google Scholar]
- Thapliyal, H.; Nath, R.K.; Mohanty, S.P. Smart Home Environment for Mild Cognitive Impairment Population: Solutions to Improve Care and Quality of Life. IEEE Consum. Electron. Mag. 2018, 7, 68–76. [Google Scholar] [CrossRef]
- Grossi, F.; Matrella, G.; De Munari, I.; Ciampolini, P. A flexible home automation system applied to elderly care. In Proceedings of the 2007 Digest of Technical Papers IEEE International Conference on Consumer Electronics, Las Vegas, NV, USA, 10–14 January 2007. [Google Scholar]
- Saponara, S.; Donati, M.; Fanucci, L.; Celli, A.; Saponara, S.; Donati, M.; Fanucci, L.; Celli, A. An Embedded Sensing and Communication Platform, and a Healthcare Model for Remote Monitoring of Chronic Diseases. Electronics 2016, 5, 47. [Google Scholar] [CrossRef]
- Sasakawa, D.; Honma, N.; Nakayama, T.; Iizuka, S.; Sasakawa, D.; Honma, N.; Nakayama, T.; Iizuka, S. Human Posture Identification Using a MIMO Array. Electronics 2018, 7, 37. [Google Scholar] [CrossRef]
- Losardo, A.; Grossi, F.; Matrella, G.; De Munari, I.; Ciampolini, P. Exploiting AAL environment for behavioral analysis. Assist. Technol. Res. Ser. 2013, 33, 1121–1125. [Google Scholar] [CrossRef]
- Skubic, M.; Guevara, R.D.; Rantz, M. Automated health alerts using in-home sensor data for embedded health assessment. IEEE J. Transl. Eng. Heal. Med. 2015, 3. [Google Scholar] [CrossRef] [PubMed]
- Nag, A.; Mukhopadhyay, S.C. Occupancy Detection at Smart Home Using Real-Time Dynamic Thresholding of Flexiforce Sensor. IEEE Sens. J. 2015, 15, 4457–4463. [Google Scholar] [CrossRef]
- Li, M.; Lin, H.-J. Design and Implementation of Smart Home Control Systems Based on Wireless Sensor Networks and Power Line Communications. IEEE Trans. Ind. Electron. 2015, 62, 4430–4442. [Google Scholar] [CrossRef]
- Ghayvat, H.; Liu, J.; Mukhopadhyay, S.C.; Gui, X. Wellness Sensor Networks: A Proposal and Implementation for Smart Home for Assisted Living. IEEE Sens. J. 2015, 15, 7341–7348. [Google Scholar] [CrossRef]
- Grossi, F.; Bianchi, V.; Matrella, G.; De Munari, I.; Ciampolini, P. Internet-Based Home Monitoring and Control. In Assisted Technology: From Adapted Equipment to Inclusive Environment; Assistive Technology Research Series; IOS Press: Amsterdam, The Netherlands, 2009; ISBN 9781607500421. [Google Scholar]
- Losardo, A.; Bianchi, V.; Grossi, F.; Matrella, G.; De Munari, I.; Ciampolini, P. Web-Enabled Home Assistive Tools. In Everyday Technology for Independence and Care; Assistive Technology Research Series; IOS Press: Amsterdam, The Netherlands, 2011; Volume 29, pp. 448–455. [Google Scholar] [CrossRef]
- Bianchi, V.; Grossi, F.; De Munari, I.; Ciampolini, P. Multi-Modal Interaction in AAL Systems; Assistive Technology Research Series; IOS Press: Amsterdam, The Netherlands, 2011; ISBN 9781607508137. [Google Scholar]
- Mora, N.; Bianchi, V.; De Munari, I.; Ciampolini, P. Simple and efficient methods for steady state visual evoked potential detection in BCI embedded system. In Proceedings of the 2014 IEEE International Conference on Acoustics, Speech and Signal Processing (ICASSP), Florence, Italy, 4–9 May 2014. [Google Scholar]
- Bianchi, V.; Grossi, F.; Matrella, G.; De Munari, I.; Ciampolini, P. A wireless sensor platform for assistive technology applications. In Proceedings of the 11th EUROMICRO Conference on Digital System Design Architectures, Methods and Tools, Parma, Italy, 3–5 September 2008. [Google Scholar]
- Bianchi, V.; Guerra, C.; De Munari, I.; Ciampolini, P. A wearable sensor for AAL-based continuous monitoring. In International Conference on Smart Homes and Health Telematics; Springer: Cham, Switzerland, 2016; Volume 9677, pp. 383–394. [Google Scholar] [CrossRef]
- Bianchi, V.; Grossi, F.; De Munari, I.; Ciampolini, P. MuSA: A multisensor wearable device for AAL. In Proceedings of the 2011 Federated Conference on Computer Science and Information Systems (FedCSIS), Szczecin, Poland, 18–21 September 2011; pp. 375–380. [Google Scholar]
- Bianchi, V.; Grossi, F.; De Munari, I.; Ciampolini, P. Multi sensor assistant: A multisensor wearable device for ambient assisted living. J. Med. Imaging Heal. Inform. 2012, 2, 70–75. [Google Scholar] [CrossRef]
- Montalto, F.; Guerra, C.; Bianchi, V.; De Munari, I.; Ciampolini, P. MuSA: Wearable multi sensor assistant for human activity recognition and indoor localization. Biosyst. Biorobotics 2015, 11, 81–92. [Google Scholar] [CrossRef]
- Guerra, C.; Bianchi, V.; De Munari, I.; Ciampolini, P. CARDEAGate: Low-cost, ZigBee-based localization and identification for AAL purposes. In Proceedings of the 2015 IEEE International Instrumentation and Measurement Technology Conference (I2MTC) Proceedings, Pisa, Italy, 11–14 May 2015. [Google Scholar]
- Gill, K.; Yang, S.H.; Yao, F.; Lu, X. A ZigBee-based home automation system. IEEE Trans. Consum. Electron. 2009, 55, 422–430. [Google Scholar] [CrossRef] [Green Version]
- Hwang, K.; Choi, B.J.; Kang, S.H. Enhanced self-configuration scheme for a robust zigbee-based home automation. IEEE Trans. Consum. Electron. 2010, 56, 583–590. [Google Scholar] [CrossRef]
- Zualkernan, I.A.; Al-Ali, A.R.; Jabbar, M.A.; Zabalawi, I.; Wasfy, A. InfoPods: Zigbee-based remote information monitoring devices for smart-homes. IEEE Trans. Consum. Electron. 2009, 55, 1221–1226. [Google Scholar] [CrossRef]
- Cho, J.Y.; Kim, K.-B.; Jabbar, H.; Sin Woo, J.; Ahn, J.H.; Hwang, W.S.; Jeong, S.Y.; Cheong, H.; Yoo, H.H.; Sung, T.H. Design of optimized cantilever form of a piezoelectric energy harvesting system for a wireless remote switch. Sens. Actuators A 2018, 280, 340–349. [Google Scholar] [CrossRef]
- Mallick, S.; Bin Habib, A.-Z.S.; Ahmed, A.S.; Alam, S.S. Performance appraisal of Wireless Energy Harvesting in IoT. In Proceedings of the 2017 3rd International Conference on Electrical Information and Communication Technology (EICT), Khulna, Bangladesh, 7–9 December 2017. [Google Scholar]
- Amaro, J.P.; Cortesão, R.; Ferreira, F.J.T.E.; Landeck, J. Device and operation mechanism for non-beacon IEEE802.15.4/Zigbee nodes running on harvested energy. Ad Hoc Networks 2015, 26, 50–68. [Google Scholar] [CrossRef]
- Bianchi, V.; Ciampolini, P.; De Munari, I. RSSI-Based Indoor Localization and Identification for ZigBee Wireless Sensor Networks in Smart Homes. IEEE Trans. Instrum. Meas. 2018, 1–10. [Google Scholar] [CrossRef]
- Al-Sarawi, S.; Anbar, M.; Alieyan, K.; Alzubaidi, M. Internet of Things (IoT) communication protocols: Review. In Proceedings of the 2017 8th International Conference on Information Technology (ICIT), Amman, Jordan, 17–18 May 2017. [Google Scholar]
- QCA4020|Qualcomm. Available online: https://www.qualcomm.com/products/qca4020 (accessed on 12 September 2018).
- Bassoli, M.; Bianchi, V.; De Munari, I.; Ciampolini, P. An IoT approach for an AAL Wi-Fi-based monitoring system. IEEE Trans. Instrum. Meas. 2017, 66, 3200–3209. [Google Scholar] [CrossRef]
- Moraru, S.; Perniu, L.; Kristaly, D.M.; Ungureanu, D.A.; Sandu, F.; Mo, A.A. Proceedings of the 2017 25th Mediterranean Conference on Control and Automation (MED), Valletta, Malta, 3–6 July 2017.
- Kristaly, D.M.; Moraru, S.-A.; Stefan Petre, V.; Parvan, C.A.; Ungureanu, D.E.; Mosoi, A.A. A Solution for Mobile Computing in a Cloud Environment for Ambient Assisted Living. In Proceedings of the 2018 26th Mediterranean Conference on Control and Automation (MED), Zadar, Croatia, 19–22 June 2018. [Google Scholar]
- Lago, P.; Roncancio, C.; Jiménez-Guarín, C. Learning and managing context enriched behavior patterns in smart homes. Futur. Gener. Comput. Syst. 2019, 91, 191–205. [Google Scholar] [CrossRef]
- Bassoli, M.; Bianchi, V.; De Munari, I.; Ciampolini, P. An unobtrusive Wi-Fi system for human monitoring. In Proceedings of the IEEE International Conference on Consumer Electronics, Berlin, Germany, 3–6 September 2017. [Google Scholar]
- Grossi, F.; Bianchi, V.; Matrella, G.; De Munari, I.; Ciampolini, P. Senior-friendly kitchen activity: The FOOD Project. Gerontechnology 2014, 13, 200. [Google Scholar] [CrossRef]
- CC3200 SimpleLink Wi-Fi® and Internet-of-Things solution, a Single-Chip Wireless MCU|TI.com. Available online: http://www.ti.com/product/CC3200# (accessed on 12 September 2018).
- Labeodan, T.; Aduda, K.; Zeiler, W.; Hoving, F. Experimental evaluation of the performance of chair sensors in an office space for occupancy detection and occupancy-driven control. Energy Build. 2016, 111, 195–206. [Google Scholar] [CrossRef]
- Bianchi, V.; Guerra, C.; Bassoli, M.; De Munari, I.; Ciampolini, P. The HELICOPTER project: Wireless sensor network for multi-user behavioral monitoring. In Proceedings of the 2017 International Conference on Engineering, Technology and Innovation: Engineering, Technology and Innovation Management Beyond 2020: New Challenges, New Approaches, Funchal, Portugal, 27–29 June 2017. [Google Scholar]
- Fawcett, T. An introduction to ROC analysis. Pattern Recognit. Lett. 2006, 27, 861–874. [Google Scholar] [CrossRef]
Figure 1.
CARDEA (Computer-Aided, Rule-based Domestic Environment Assistant) Wi-Fi system architecture. IoT = Internet of Things.
Figure 1.
CARDEA (Computer-Aided, Rule-based Domestic Environment Assistant) Wi-Fi system architecture. IoT = Internet of Things.
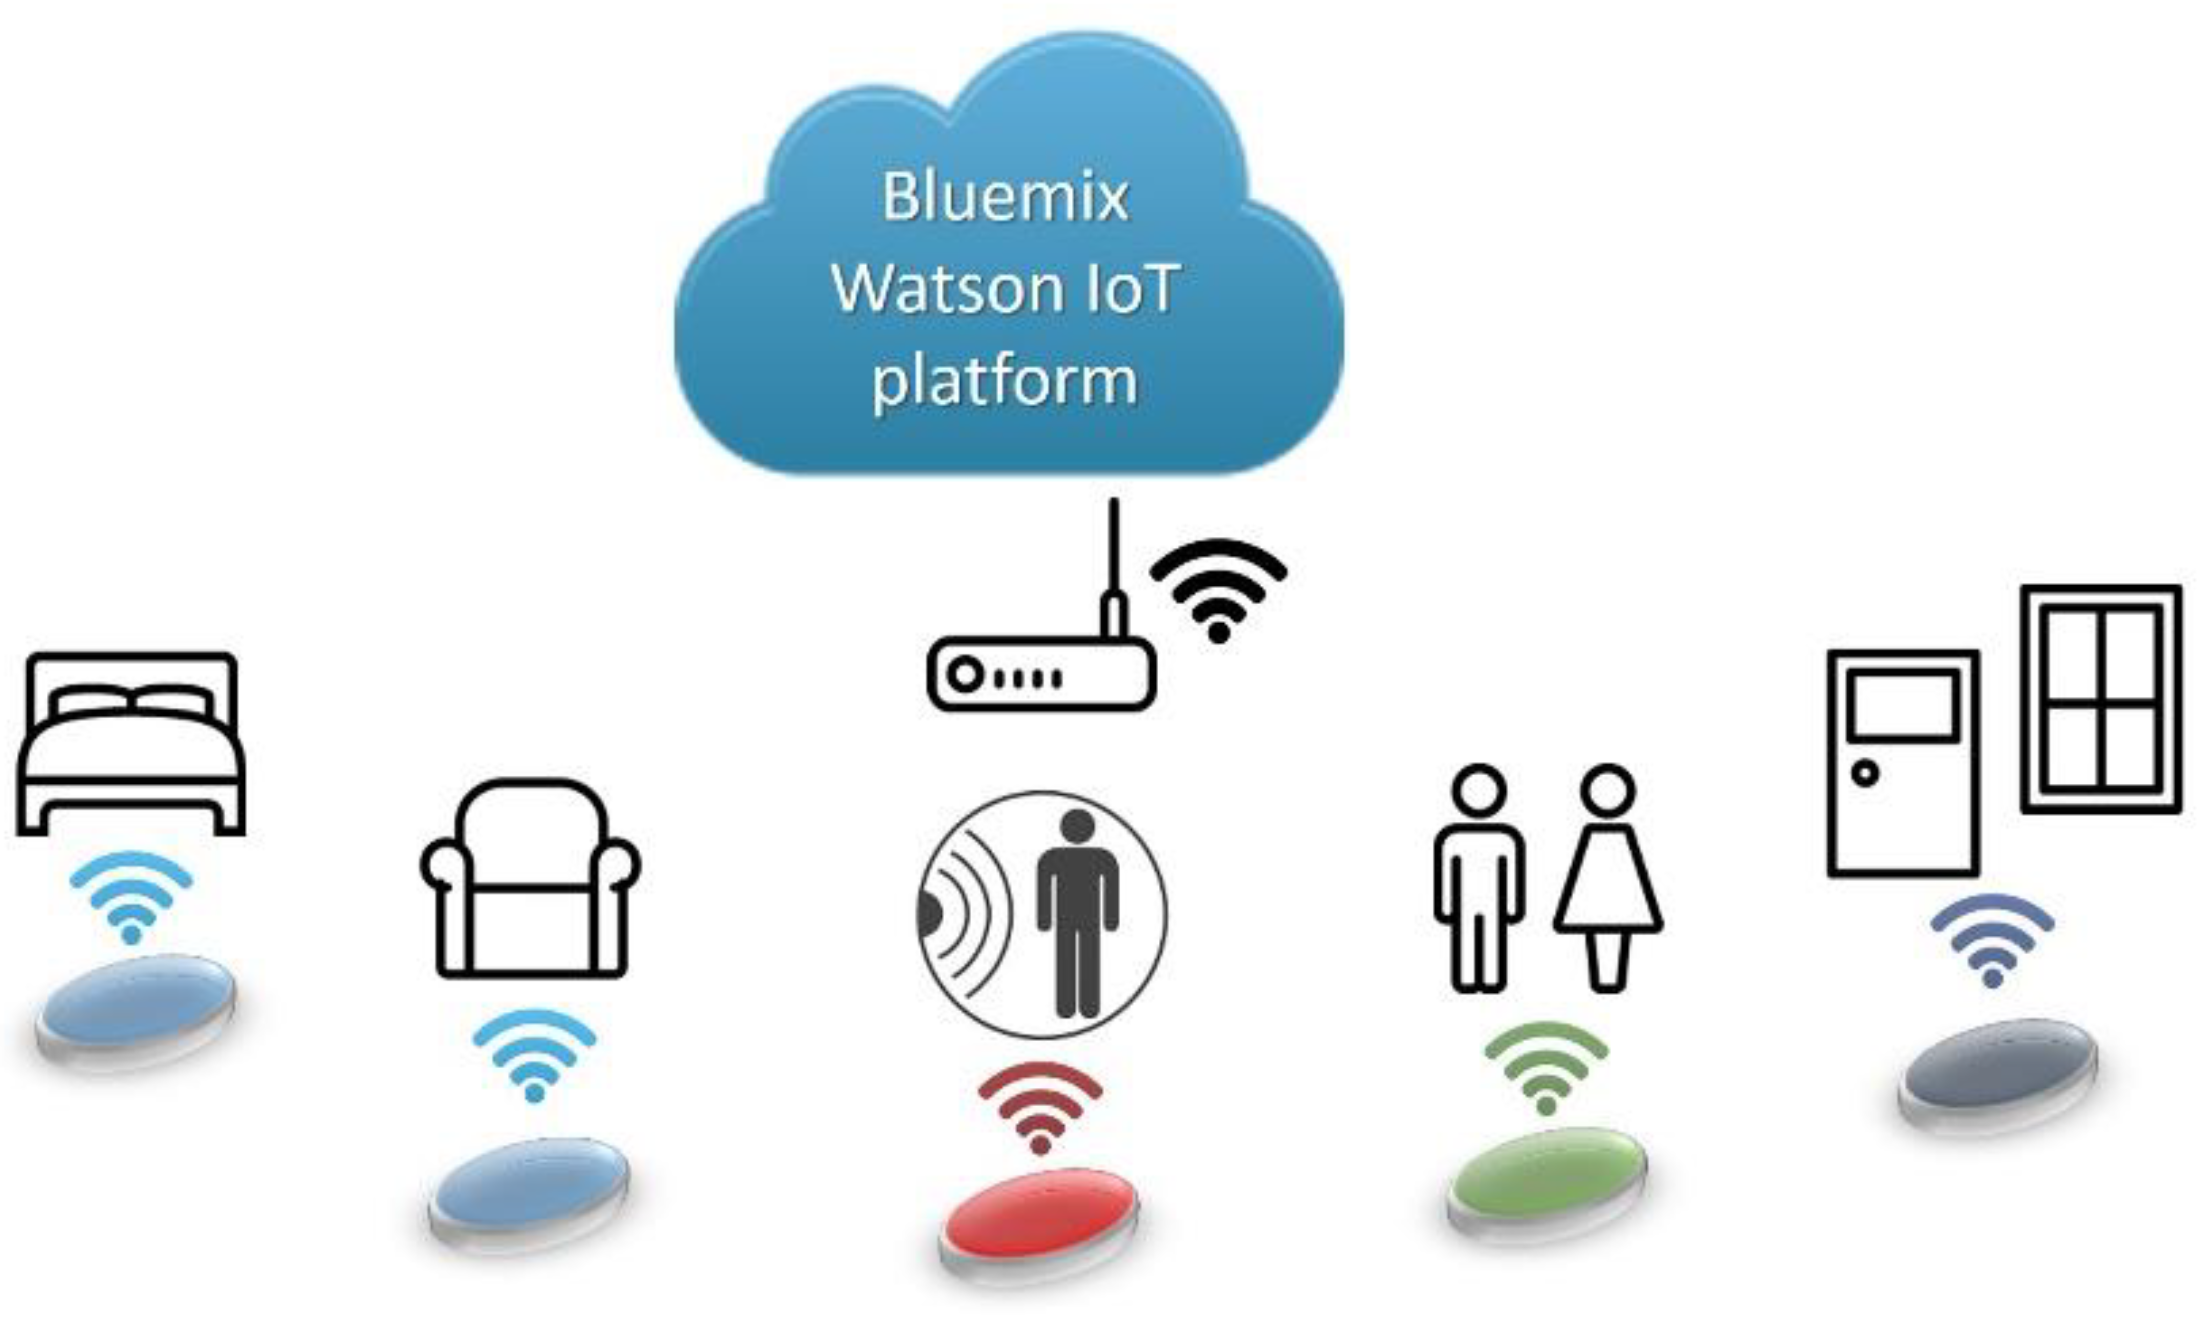
Figure 2.
The sensors prototypes. PIR = Passive InfraRed.
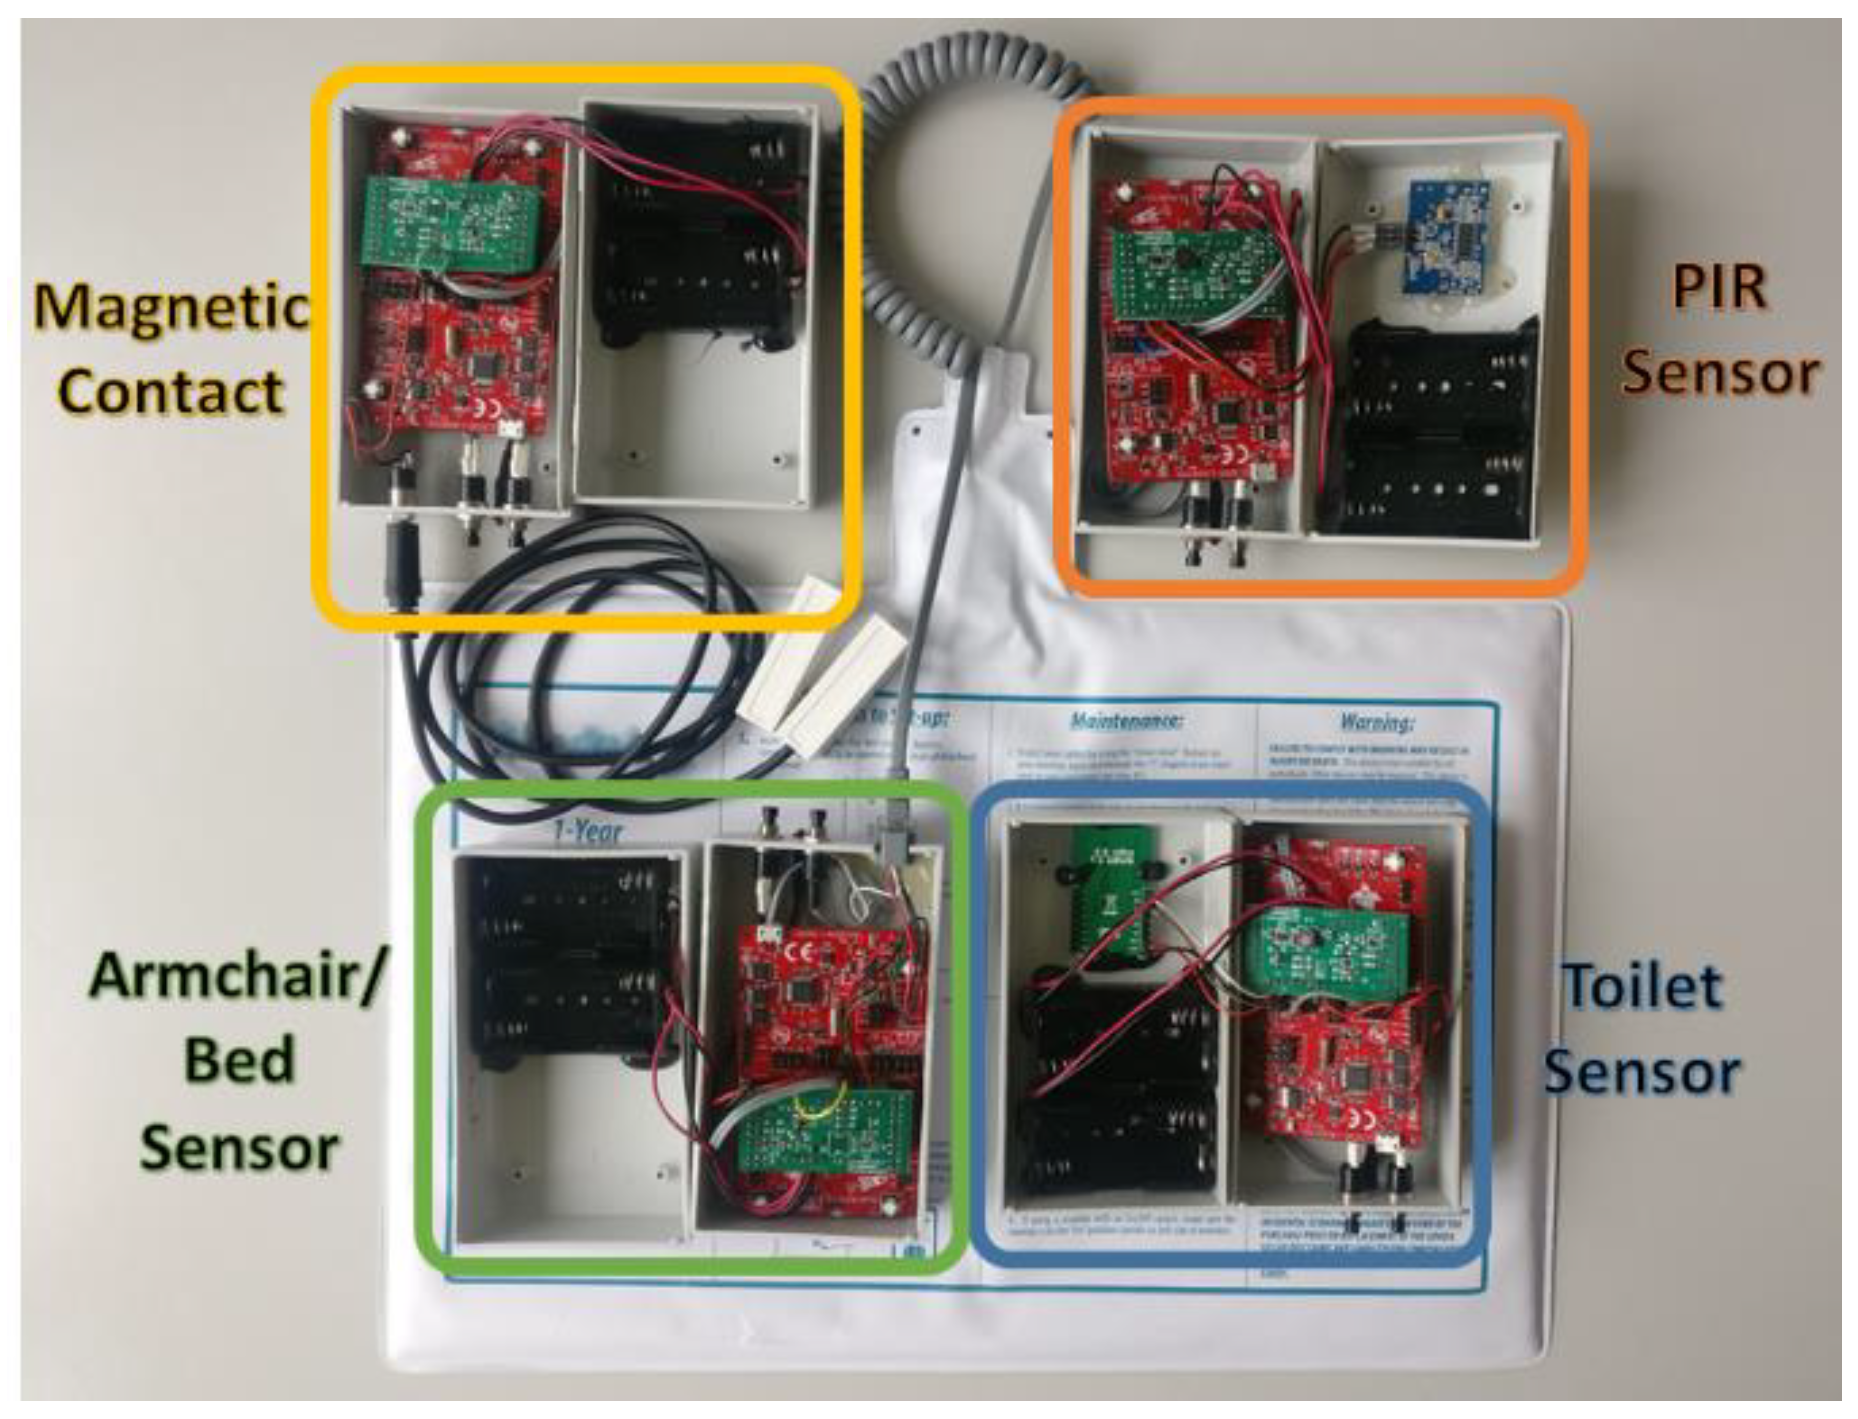
Figure 3.
Current absorption measurements: (a) scenario with missing Wi-Fi network connection; (b) scenario with sensor connected to Wi-Fi but without internet access.
Figure 3.
Current absorption measurements: (a) scenario with missing Wi-Fi network connection; (b) scenario with sensor connected to Wi-Fi but without internet access.
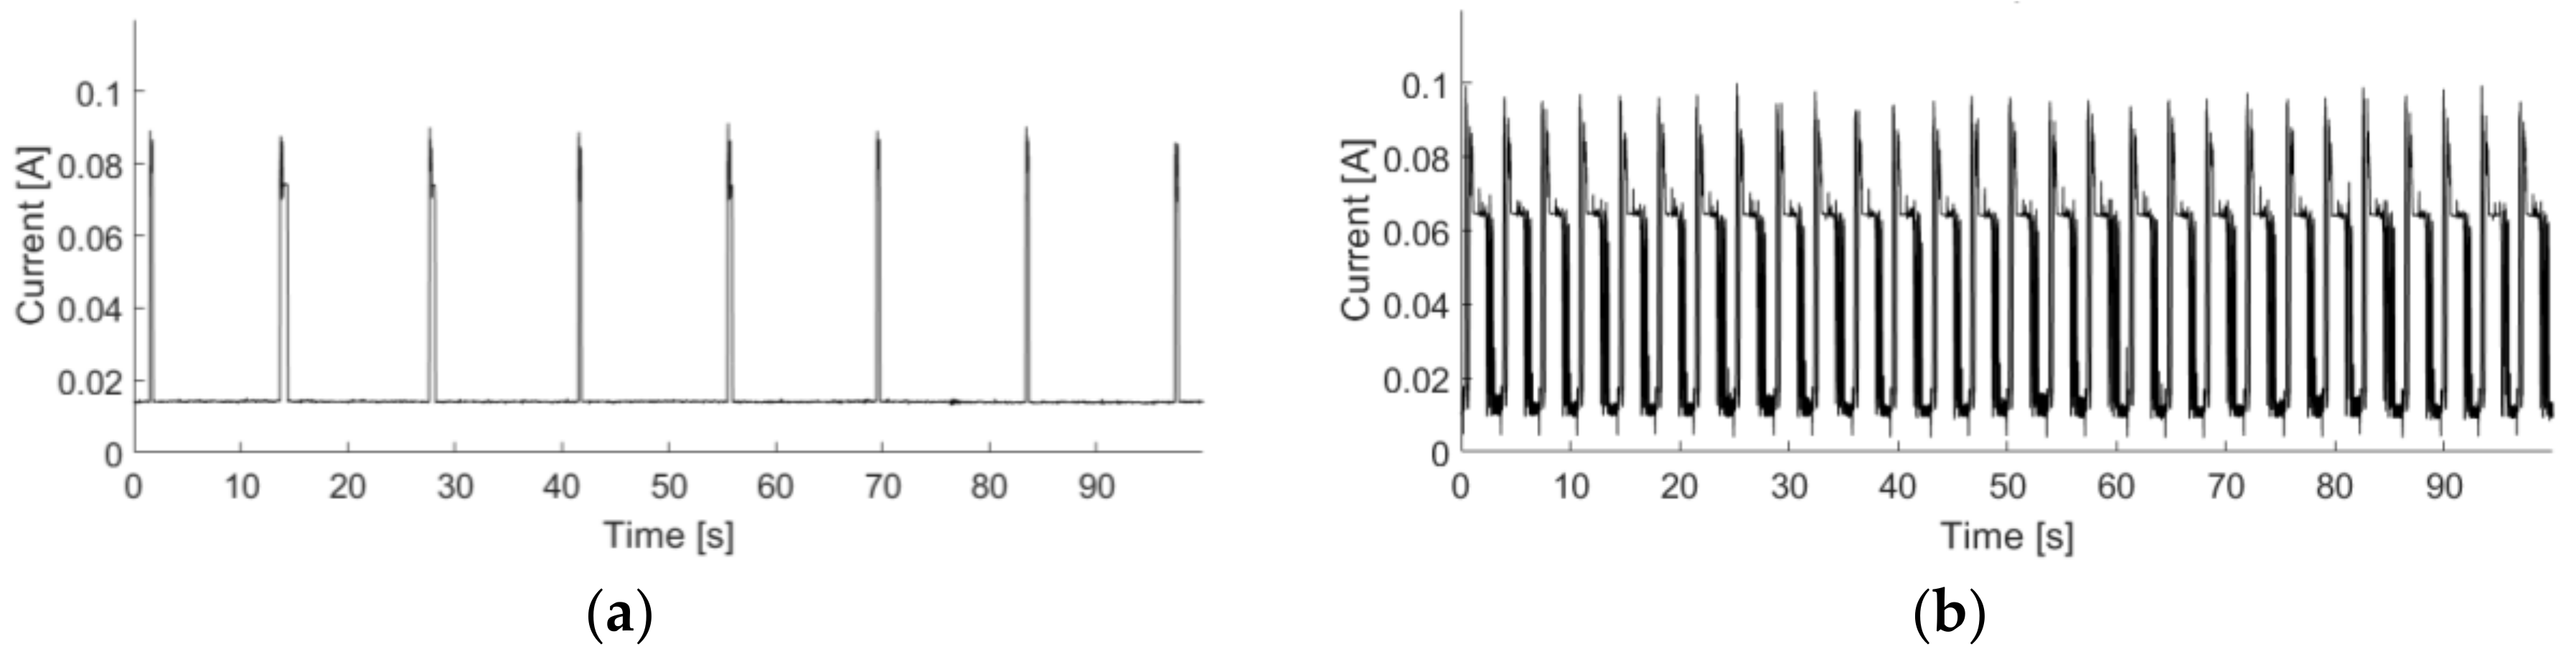
Figure 4.
Working phases for both Wi-Fi and Internet absence scenarios.

Figure 5.
Current absorption measurements of sensors running with the introduced sleep periods: (a) scenario with missing Wi-Fi network connection; (b) scenario with sensor connected to Wi-Fi but without internet access.
Figure 5.
Current absorption measurements of sensors running with the introduced sleep periods: (a) scenario with missing Wi-Fi network connection; (b) scenario with sensor connected to Wi-Fi but without internet access.
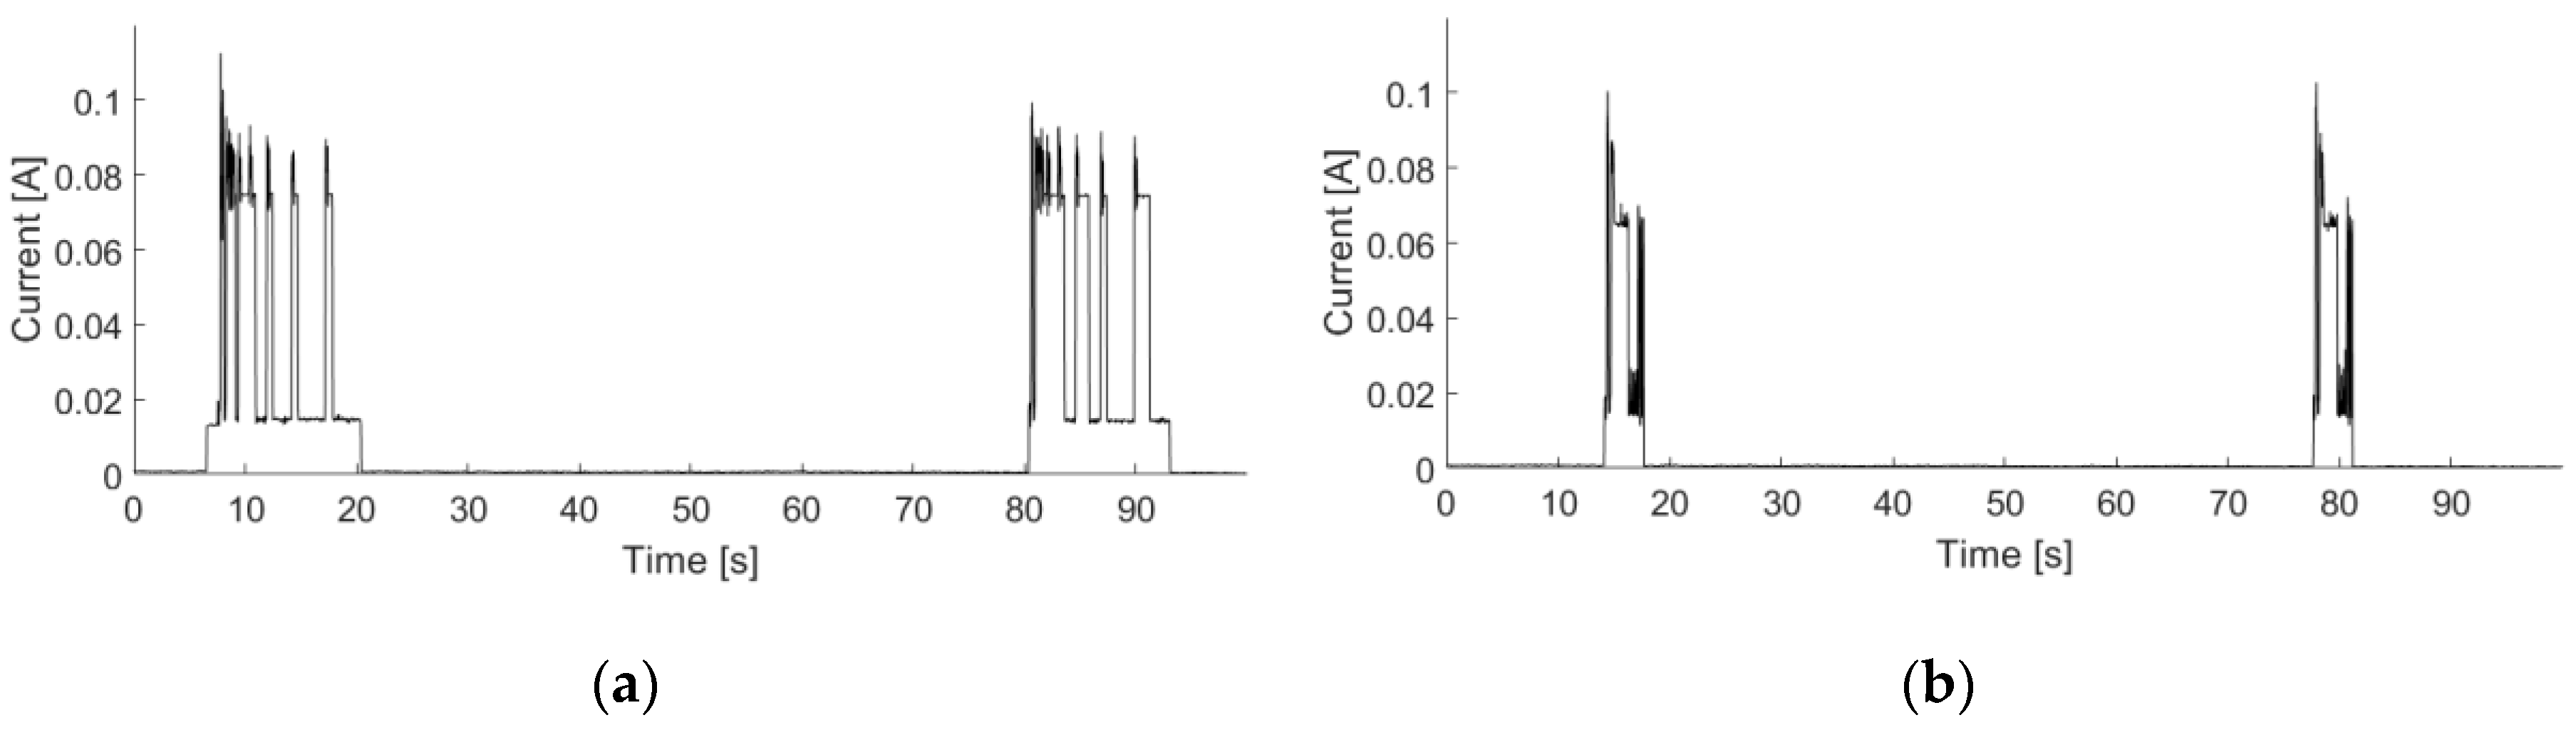
Figure 6.
Armchair sensor activity during the day (a) and during the week (b).
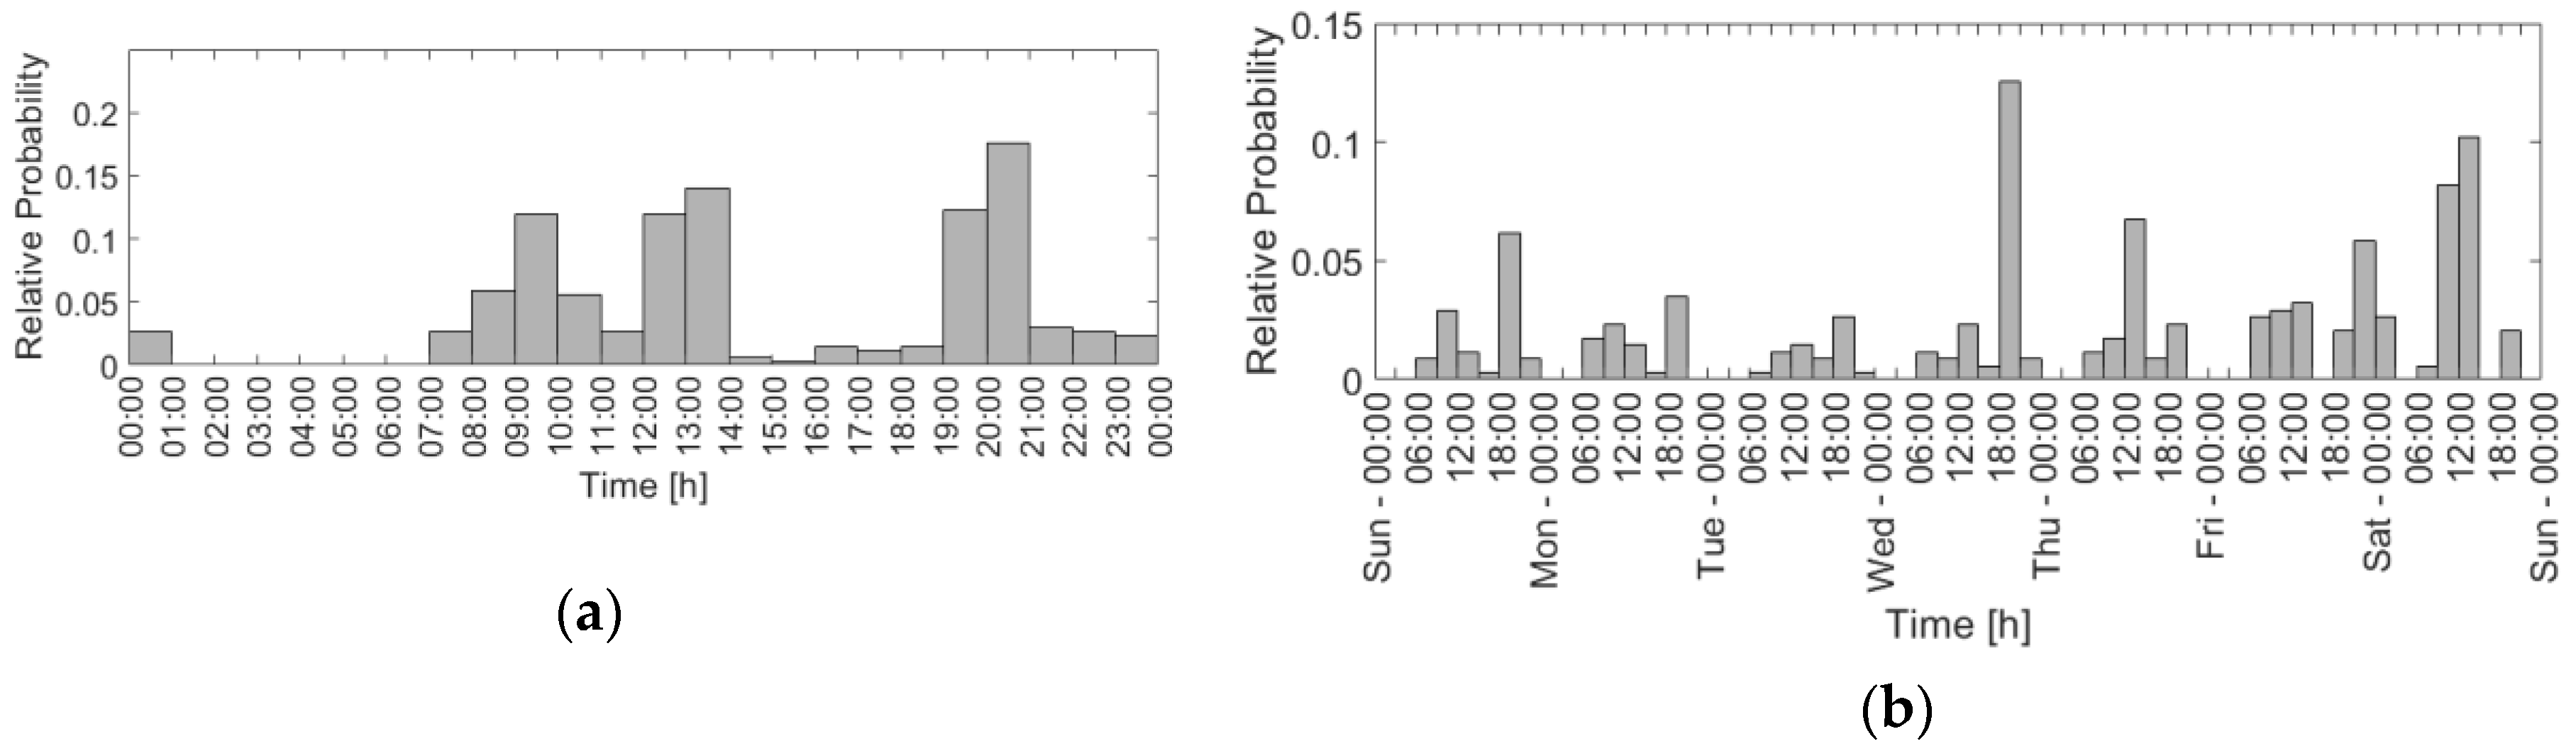
Figure 7.
Magnetic contact (door sensor) activity during the day (a) and during the week (b).

Figure 8.
PIR sensor activity during the day (a) and during the week (b).
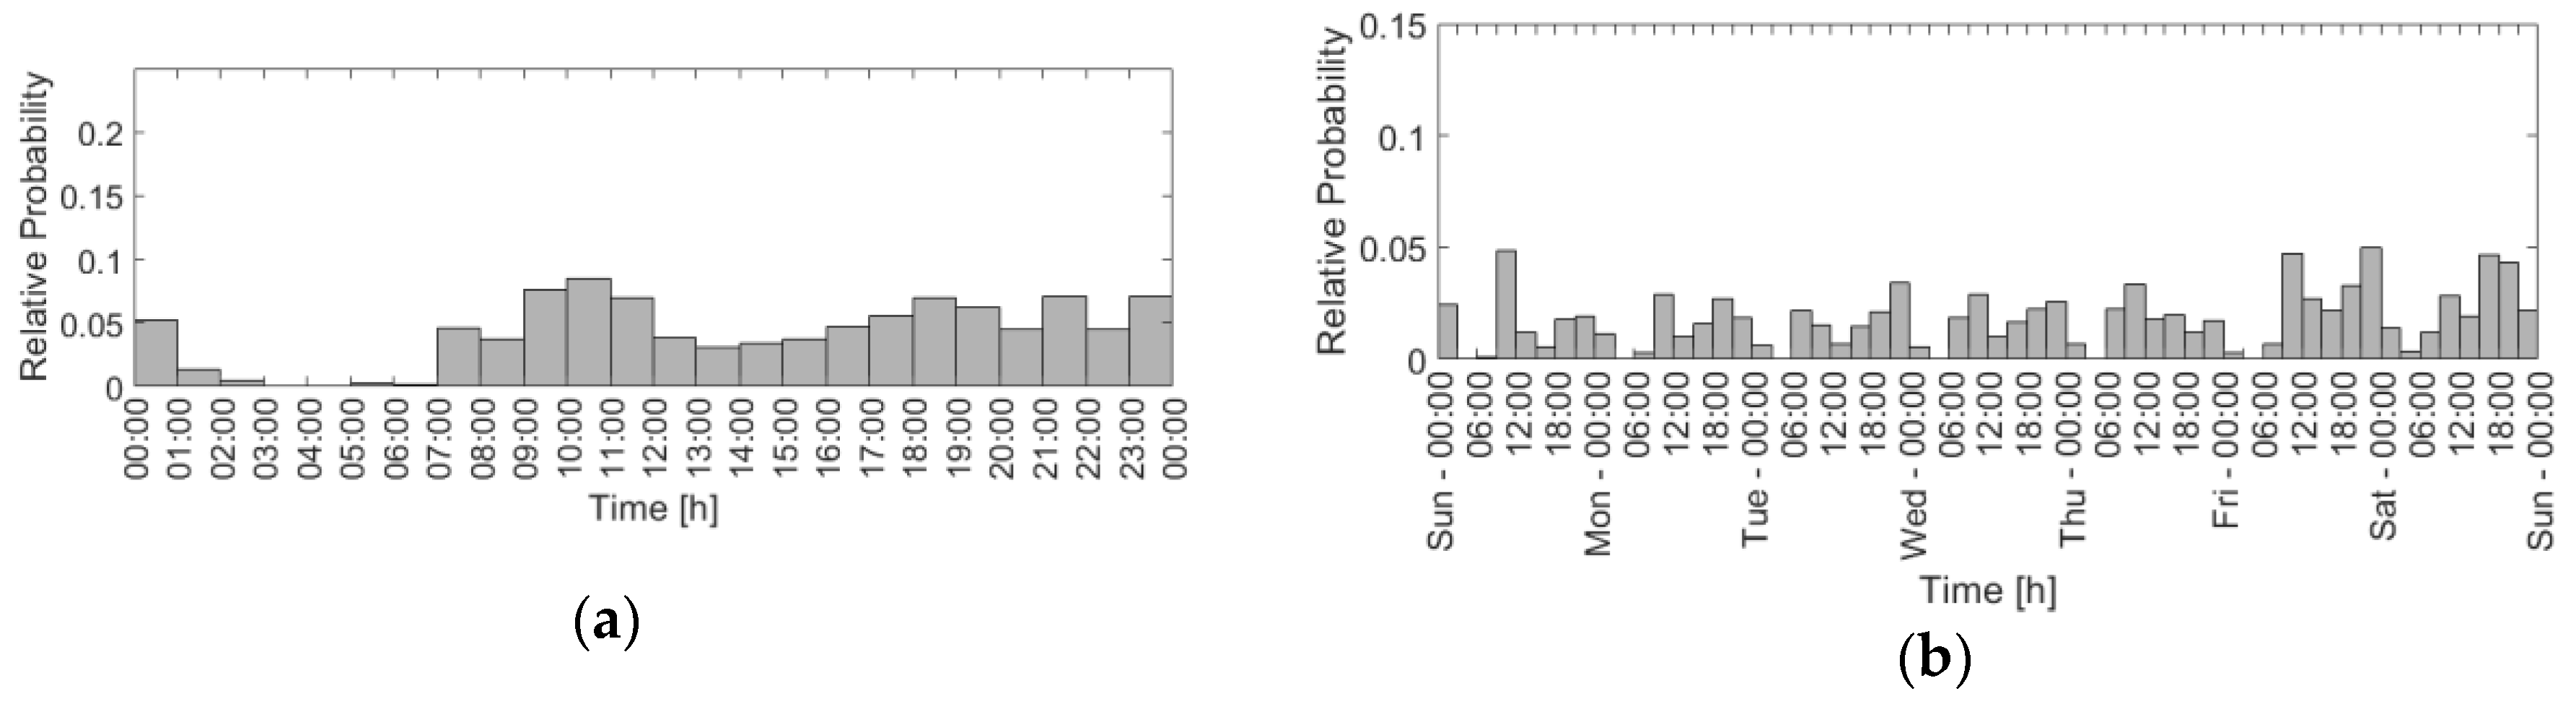
Figure 9.
Toilet sensor activity during the day (a) and during the week (b).


Table 1.
Definition of True Positives (TP), True Negatives (TN), False Positives (FP), and False Negatives (FN).
Table 1.
Definition of True Positives (TP), True Negatives (TN), False Positives (FP), and False Negatives (FN).
| Symbol | Position of the User | Where the User is Identified |
|---|---|---|
| TP | user seated on the chair | user detected as seated on the chair |
| TN | user not seated on the chair | user not detected as seated on the chair |
| FP | user not seated on the chair | user detected as seated on the chair |
| FN | user seated on the chair | user not detected as seated on the chair |
© 2018 by the authors. Licensee MDPI, Basel, Switzerland. This article is an open access article distributed under the terms and conditions of the Creative Commons Attribution (CC BY) license (http://creativecommons.org/licenses/by/4.0/).
Share and Cite
MDPI and ACS Style
Bassoli, M.; Bianchi, V.; Munari, I.D. A Plug and Play IoT Wi-Fi Smart Home System for Human Monitoring. Electronics 2018, 7, 200. https://doi.org/10.3390/electronics7090200
AMA Style
Bassoli M, Bianchi V, Munari ID. A Plug and Play IoT Wi-Fi Smart Home System for Human Monitoring. Electronics. 2018; 7(9):200. https://doi.org/10.3390/electronics7090200
Chicago/Turabian StyleBassoli, Marco, Valentina Bianchi, and Ilaria De Munari. 2018. "A Plug and Play IoT Wi-Fi Smart Home System for Human Monitoring" Electronics 7, no. 9: 200. https://doi.org/10.3390/electronics7090200
Note that from the first issue of 2016, this journal uses article numbers instead of page numbers. See further details here.