Article

An Unpowered Sensor Node for Real-Time Water Quality Assessment (Humic Acid Detection)

1
Intelligent Wireless Technology Lab (IWTL), University of Alberta, Edmonton T6G 1H9, Canada
2
Li Ka Shing Centre for Health Research Innovation, University of Alberta, Edmonton T6G 2E1, Canada
3
Advanced Water Research Lab (AWRL), University of Alberta, Edmonton T6G 1H9, Canada
*
Author to whom correspondence should be addressed.
Electronics 2018, 7(10), 231; https://doi.org/10.3390/electronics7100231
Submission received: 7 September 2018 / Revised: 27 September 2018 / Accepted: 2 October 2018 / Published: 3 October 2018
(This article belongs to the Special Issue Innovative Technologies and Services for Smart Cities)

Abstract

:
A zero-power microwave sensor is reported for the real-time assessment of water quality. The proposed structure is able to transmit sensed data directly to a base-station without additional data processing at the wireless sensor node (WSN) which results in less power consumption. The base-station propagates a single tone signal at the frequency of f0/2. At the sensing node, an antenna absorbs that signal and a passive frequency doubler makes its frequency twice, i.e., f0, which will be used as the carrier signal. Two pairs of open-ended coaxial probes are used as liquid sensors; one inside a known reference sample and the other one inside the water under test. A combination of both sensors’ data will be sent to the base-station. A special six-port structure is used for modulation of sensed data over the carrier. At the base-station, a receiver will demodulate the received signal for extracting the sensed data. As an example, the system has been evaluated at f0 = 2.45 GHz for the detection of Humic-Acid levels as a common contaminant of river waters.

1. Introduction

Water crisis, according to the Global Risks Report by World Economic Forum in 2017, is consistently among the top-ranked global risks since 2012 [1]. Improved technologies make water harvesting possible from rainwater, seawater desalination, and industrial/municipal waste-waters, even at homes [2,3]. These utilities are required to periodically monitor water quality. To prevent unhealthy water usage, the automated in-line sensors are required to detect various pollutions [4,5]. However, most of these systems are not real-time and/or Internet of Things (IoT) compatible, as they need special laboratory equipment. Using wireless sensor nodes and Internet of distributed water systems are a step toward smarter cities [6,7,8,9]. A wireless sensor node (WSN) in a wireless network senses a physical/chemical variation in a desired environment [10,11,12], analyze them, and transmit the extracted data to a receiver which can be a mobile phone or a base-station [13]. In this regard, the WSN usually has a small processing unit, one or more sensors, a telecommunication subsystem, and a source of energy in the form of battery or energy harvesting module. A few un-powered sensor systems were proposed which comprises receiving, frequency conversion, sensing, and transmitting elements [14,15,16].
There are a couple of architecture reported for sensor nodes in the literature which usually include radio frequency identification (RFID). The interferometry systems send a signal and measure the reflection from sensor nodes by a direct conversion receiver [17,18,19,20]. The chip-based sensing nodes have a separate sensor, a digitizer, and a direct conversion modulator [21,22]. Using chips make multi-node networks possible but a higher received signal strength is required for powering-up the sensor and micro-controller chips. The chipless structures in [23,24,25,26] work based on the shift in the operating frequency. These frameworks are sensitive to the undesirable condition varieties that change the frequency response of system and need an accurate frequency discovery at the receiver. This detriment is a major point of confinement on the actualizing functional remote systems based on these type of sensors. The six-port structures (SPS), as a vector modulator, only consists of some passive elements [27,28,29,30] and is an ideal choice for a near-to-zero (N-zero) or zero-power systems. The direct conversion sensors, as of late proposed in [31,32], need a signal generator and a power source with the occasional support or trade necessities at the sensor node. Therefore, these kind of nodes cannot be utilized in applications with restricted access or troubles for upkeep.
This paper proposes real-time water quality assessment using a Base-Station (BS) and sensor nodes in a water harvesting system. The adaptive and switched-beam antenna at the BS makes an exclusive connection with each node possible. The sensor node senses the effects of filter’s output and reference sample on the reflection coefficients of open-ended coaxial probes, simultaneously. This information can be used to determine the quality of filtered water. For systems with exchangeable filters, the reference sample can be taken when the filter is new and works perfectly. After that, the quality of filtering and thus the replacement time of the filter can be determined.
The proposed direct conversion sensor is based on the SPS that simplify the sensing system by eliminating digitizer and integrating the sensor into the modulator. Using the vector modulator eliminates the frequency up-converting chain and leads to a low-cost and straightforward realization of modulation scheme for transmitting data. The introduced unpowered WSN comprises a dual-band receiving/transmitting antenna, a frequency diplexer, a frequency doubler, a SPS, and two pairs of open-ended coaxial probes for sensing in which one pair senses the desired variations in the water under test (WUT) while the other one is in contact with the pure water, as a reference. These probes provide broadband and non-destructive sensing of liquids. The variations in sensing parts modulate the input signal and the reference data can be used in the calibration procedure of six-port receiver at the BS.
For evaluation, the system has been implemented at the frequency of 2.45 GHz. As a common contaminant sample, various concentrations of humic acid in water were used as the WUTs to resemble dissolved organic matter in the river. The measurement results show that the proposed sensor node can detect the level of pollution with a good accuracy.

2. Materials and Methods

The proposed wireless quality sensing system consists of a base station and one or more zero-power sensor nodes, as shown in Figure 1a. The BS transmits the pure and receives the modulated signals at the frequencies of f /2 and f , respectively. The node receives the pure signal at f /2, modulates it with sensed data, and transmits it back at f . In the next sections, both parts are presented in detail.

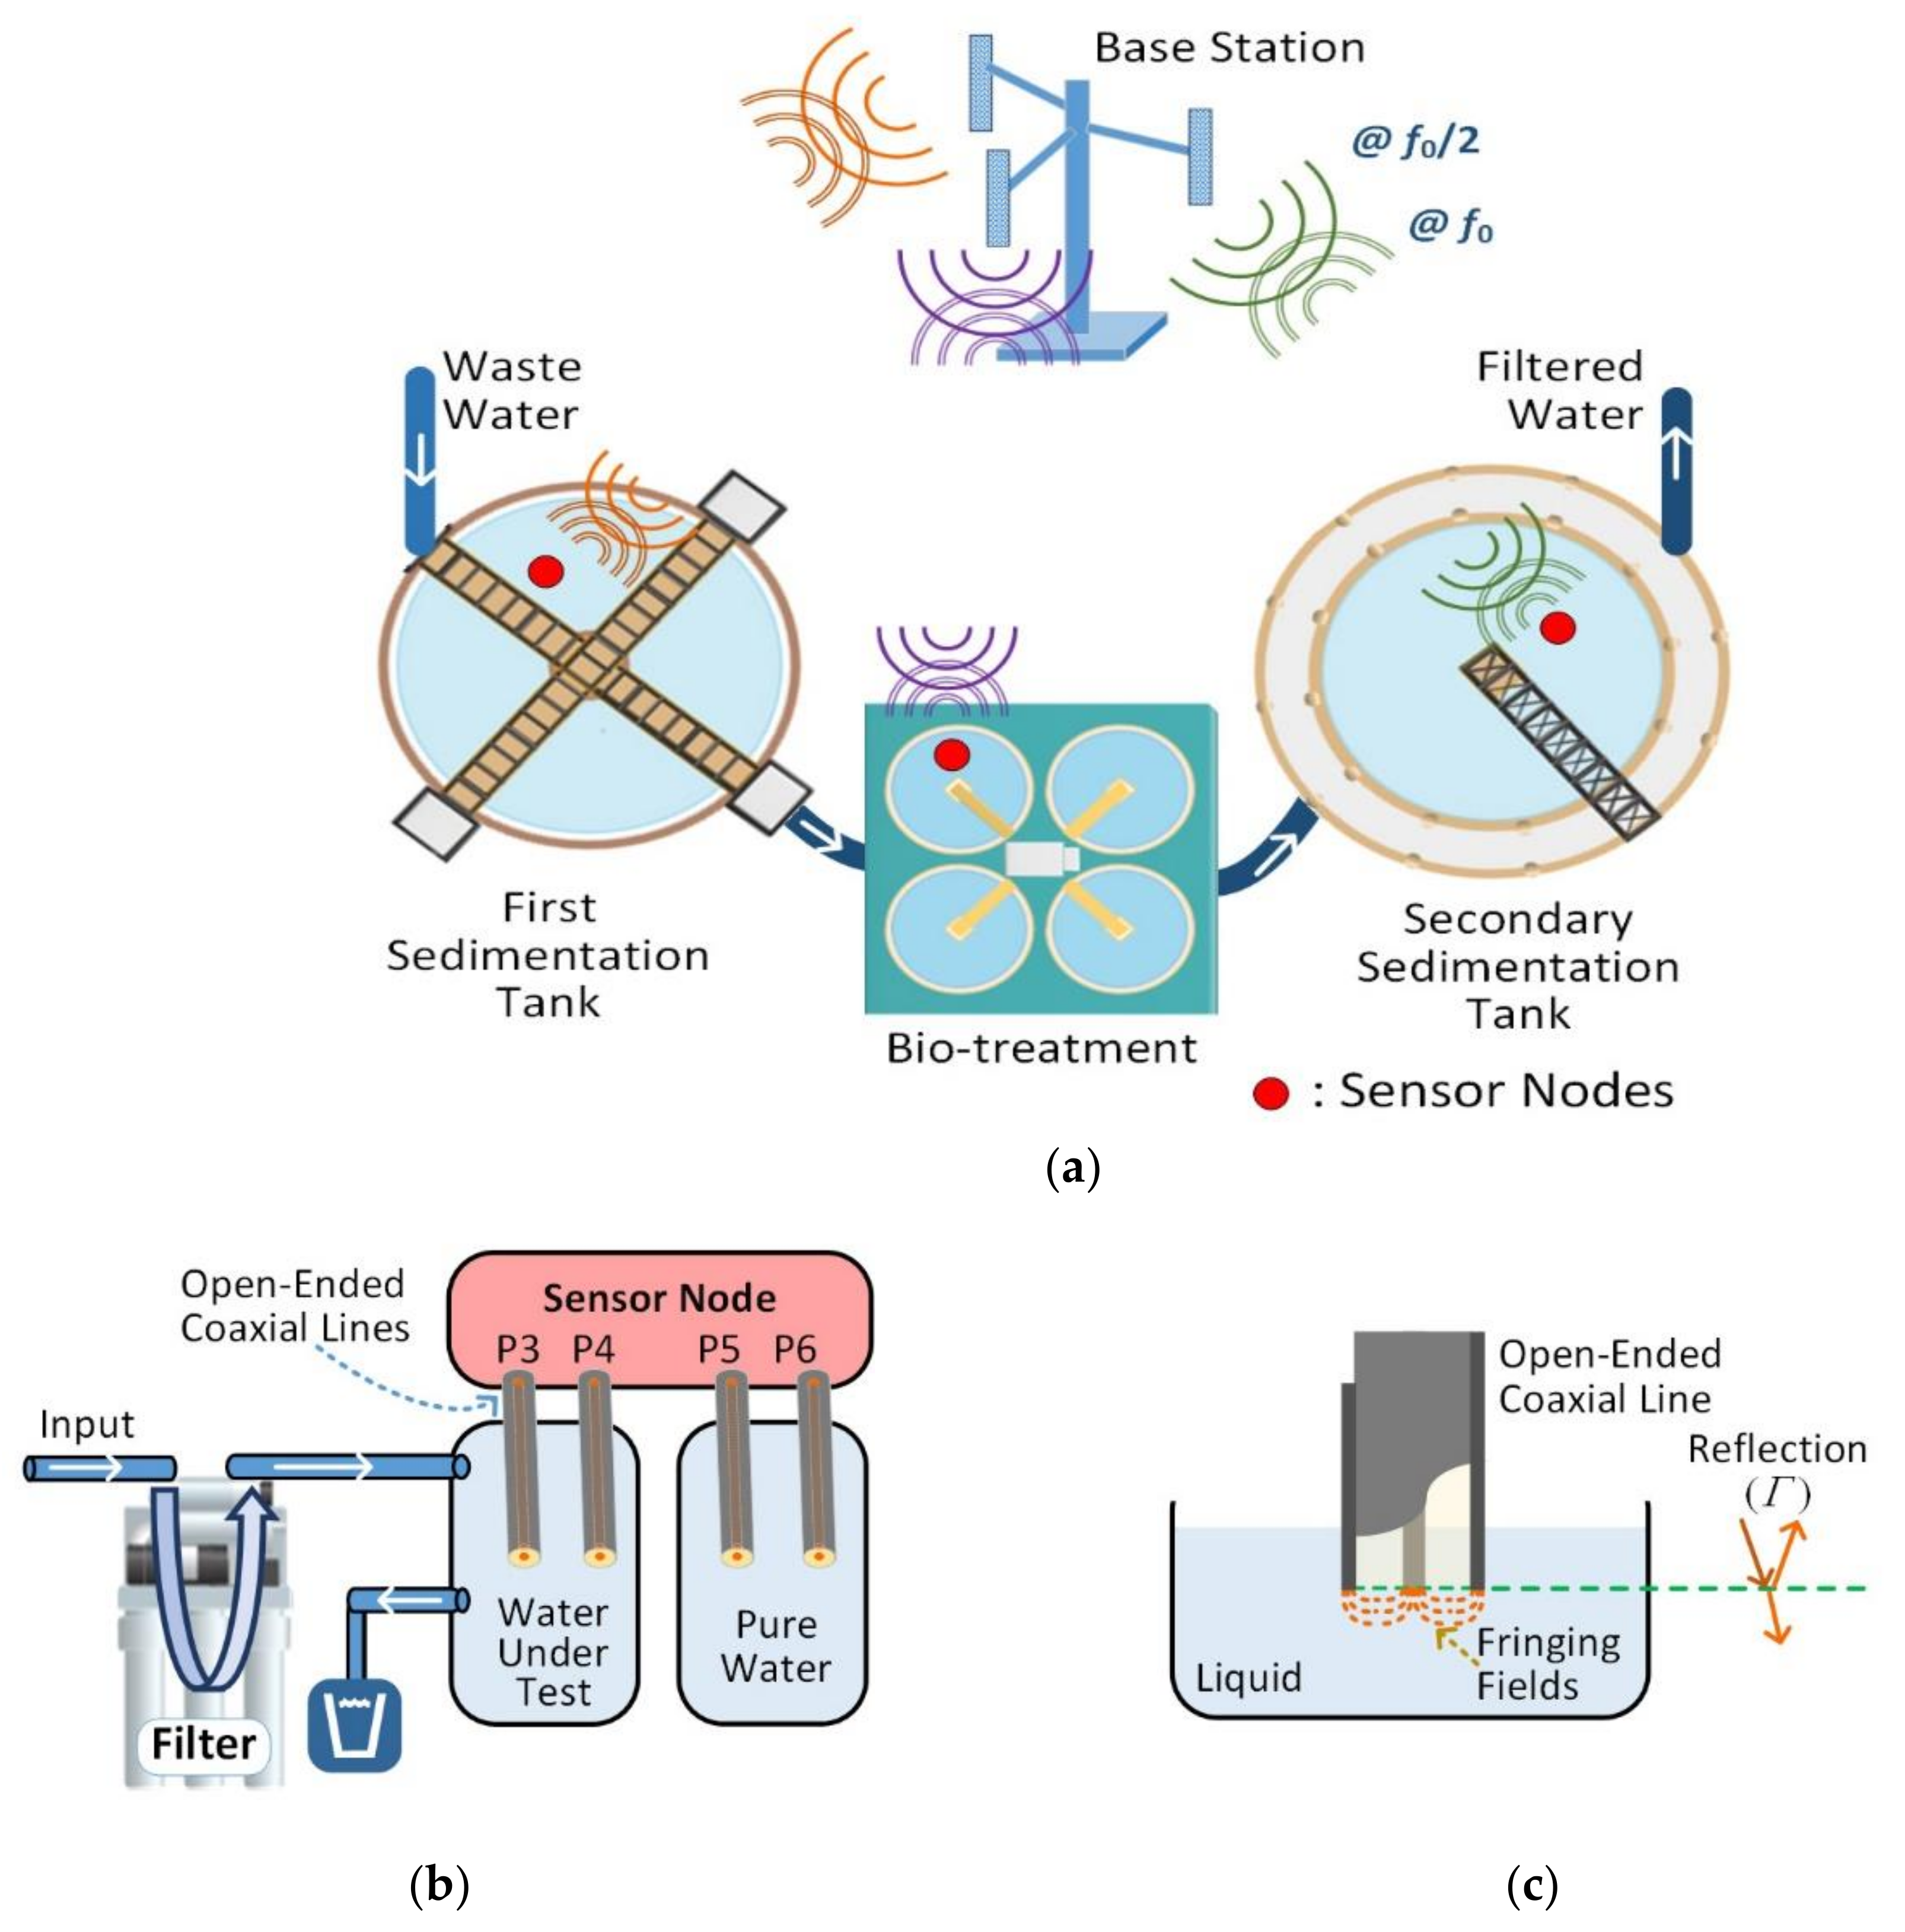
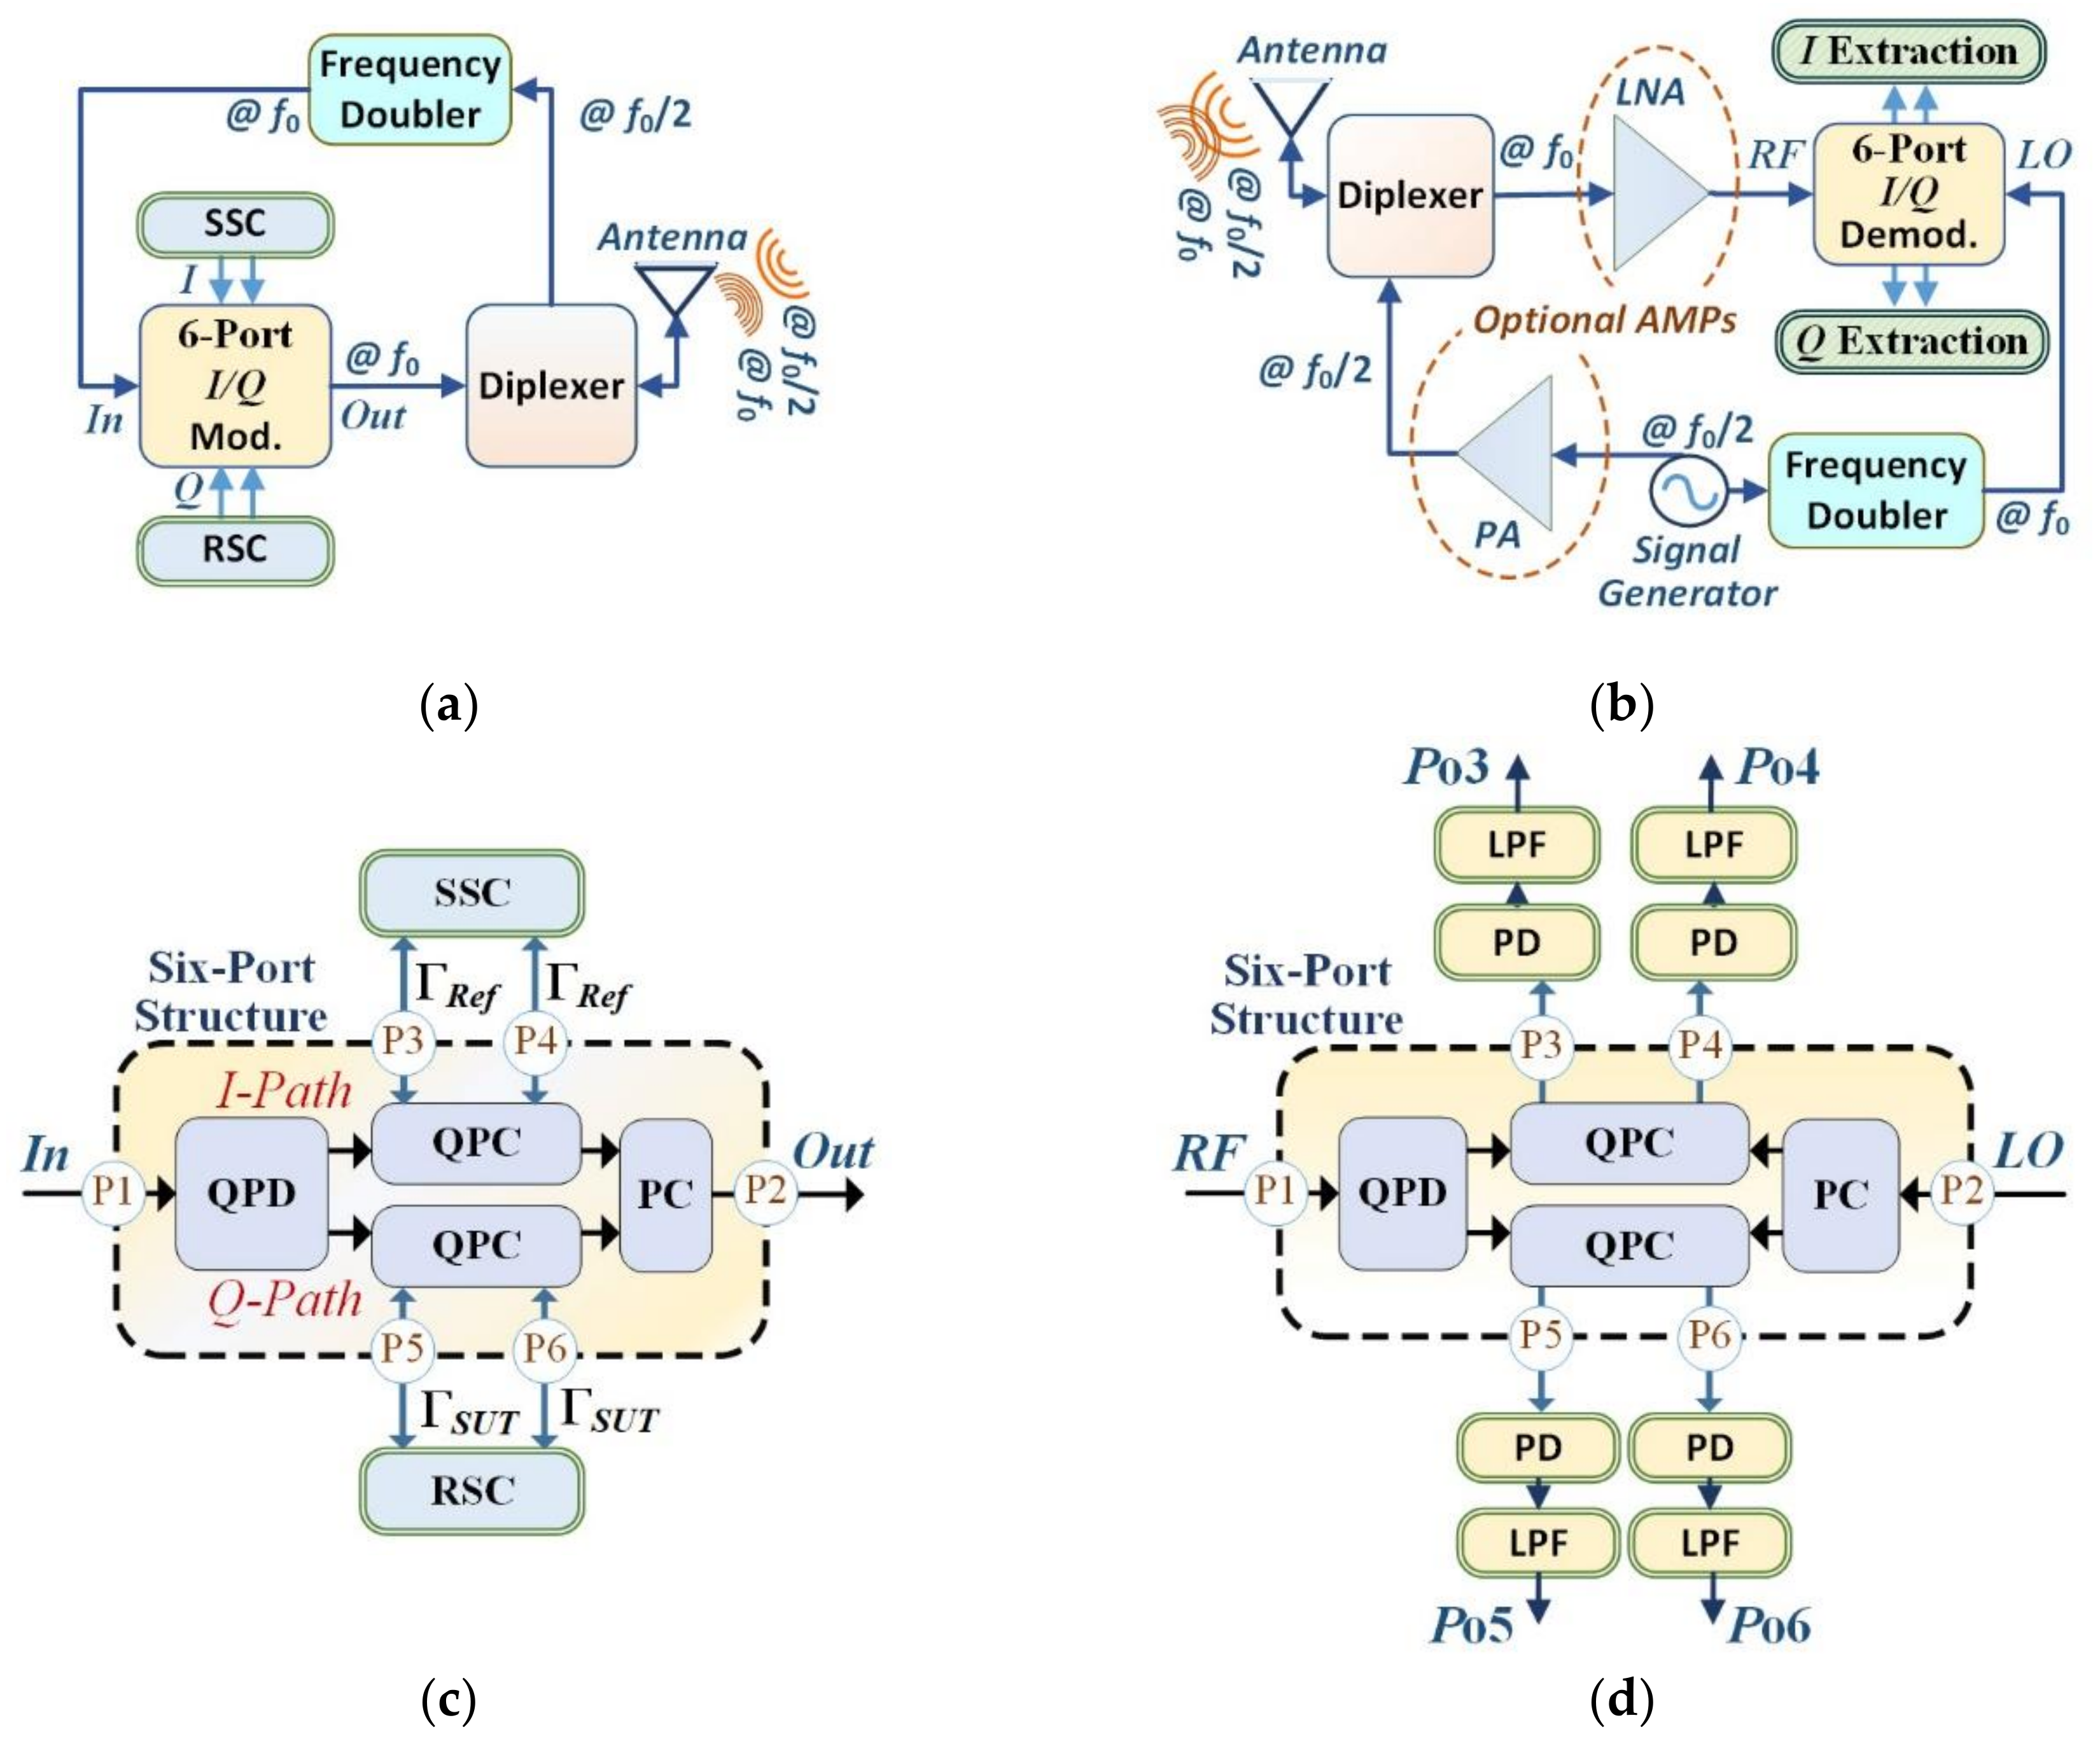
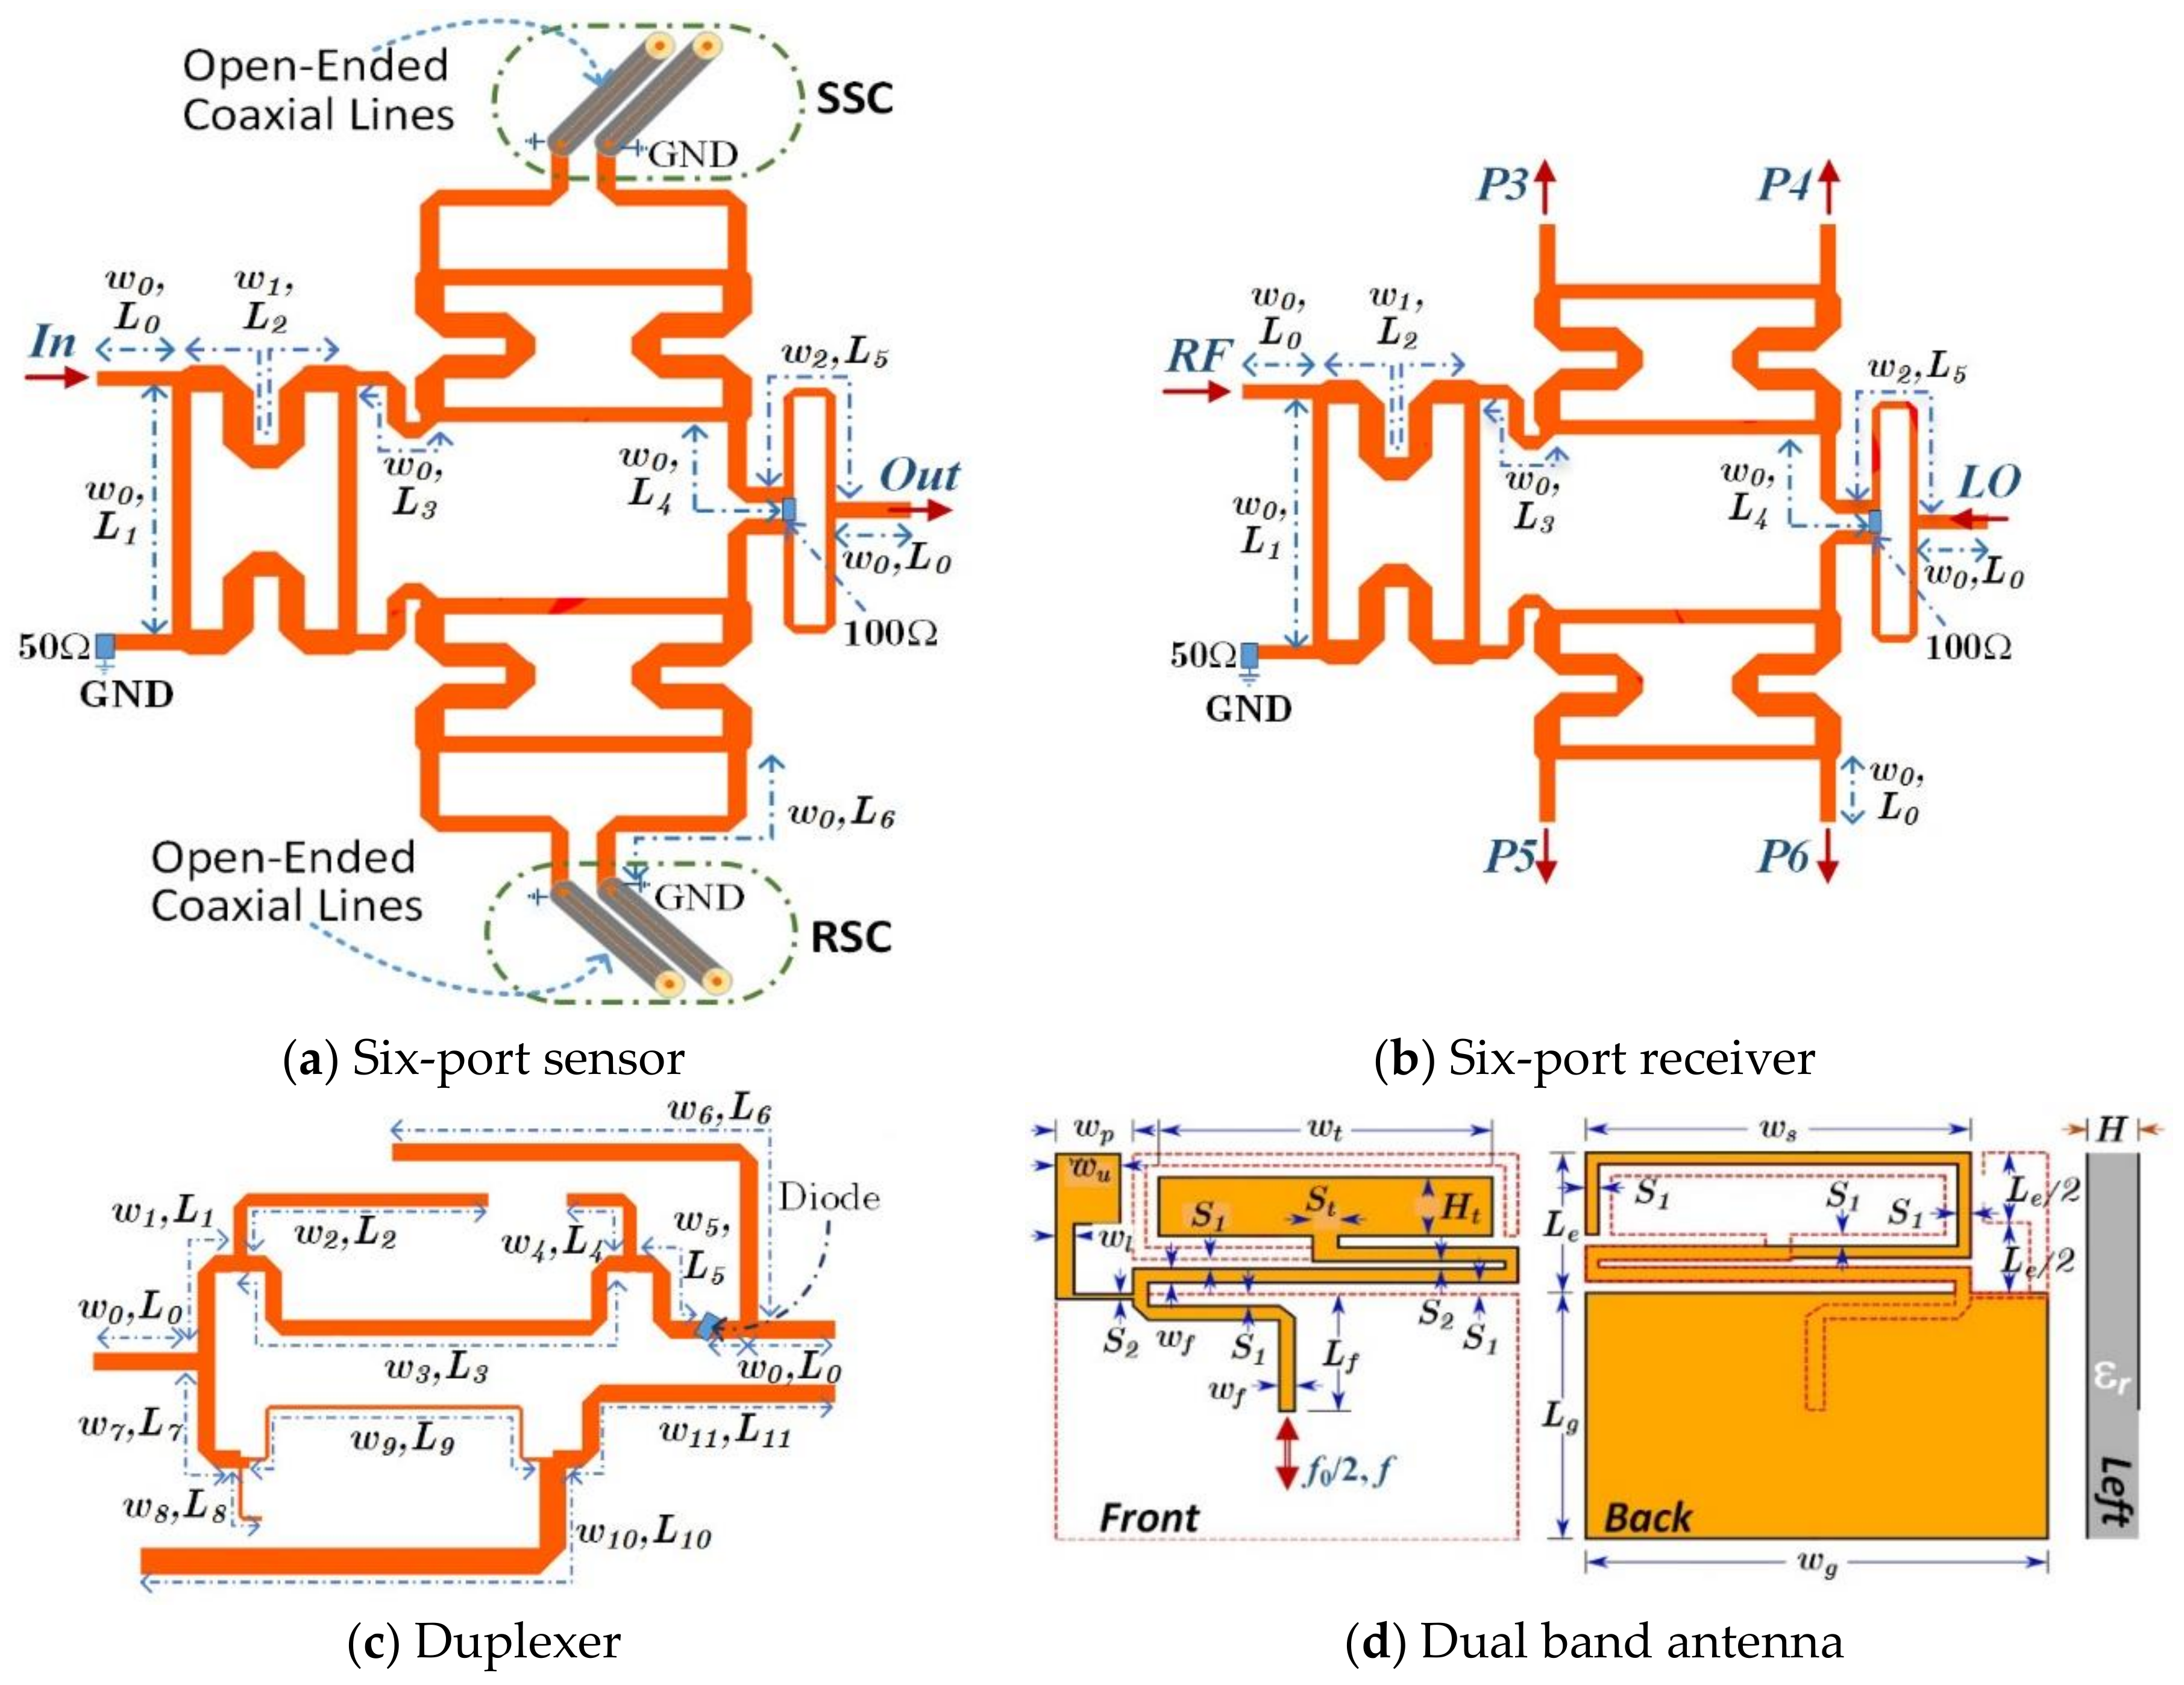
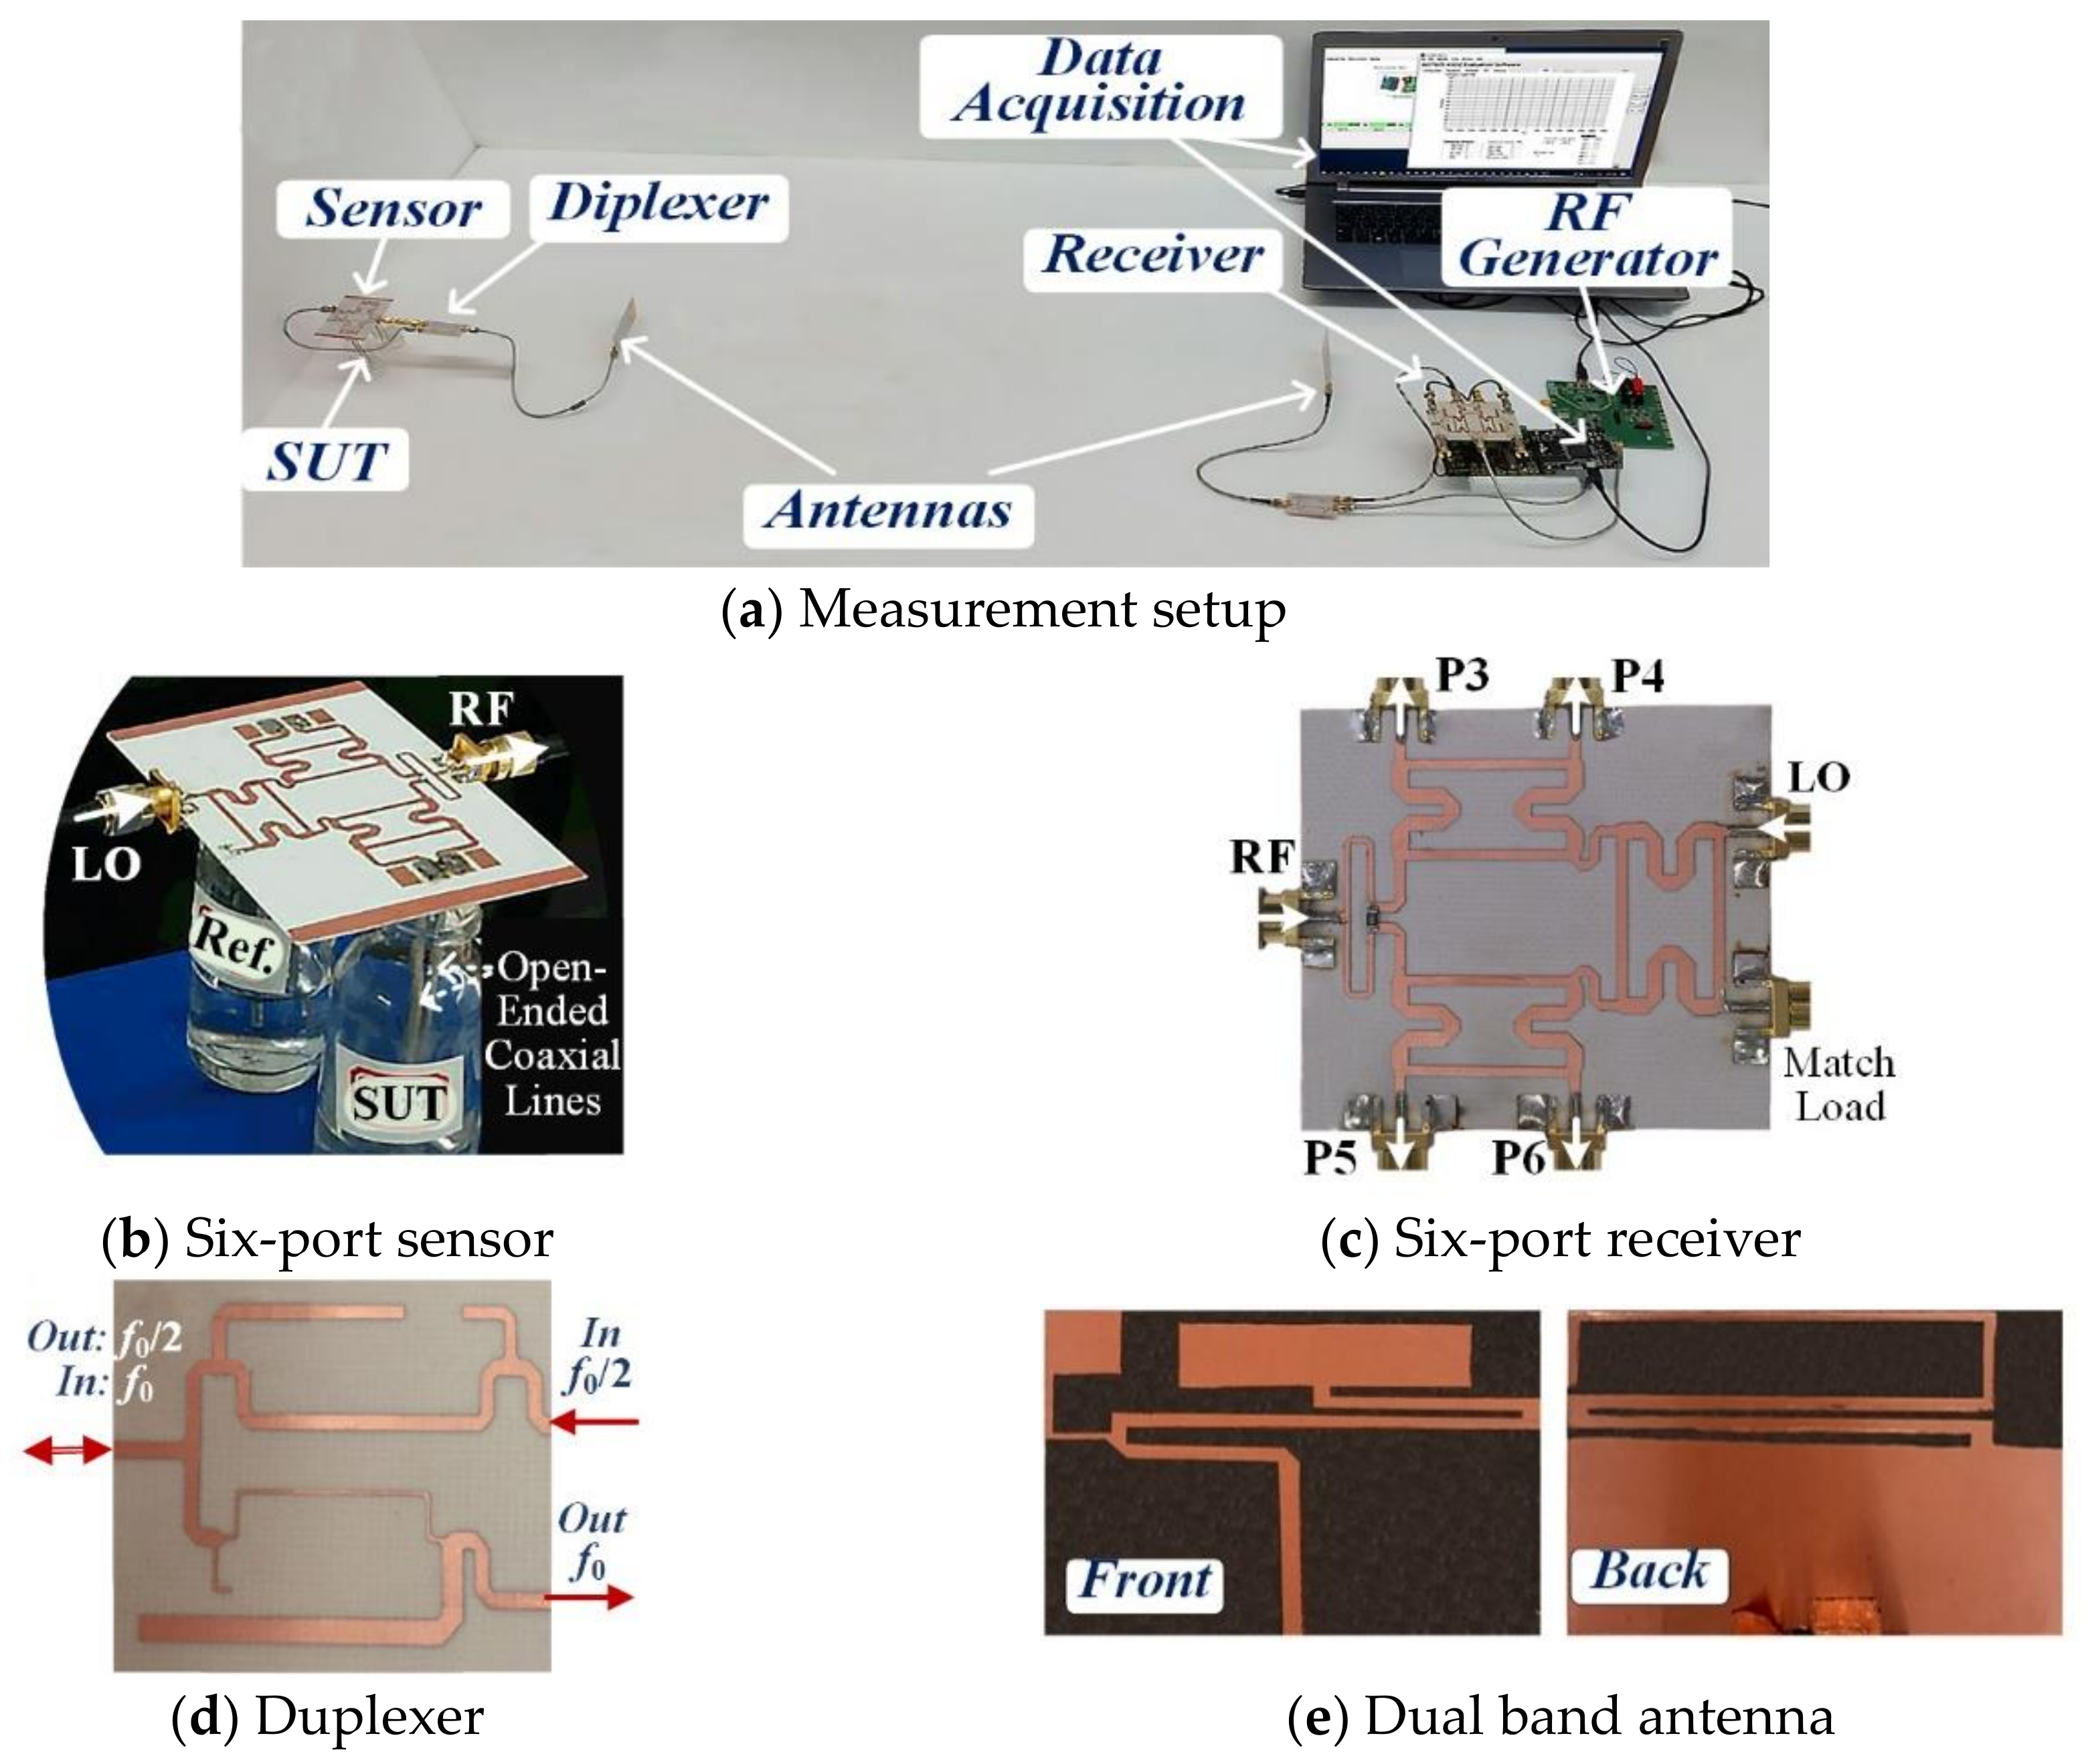
2.1. The Sensing Node

The sensing mechanism is shown in Figure 1b, which is based on a comparison between the water filter’s output as the water under test and a fixed pure water as the reference sample. The open-ended coaxial line is selected as the sensitive circuit that can provide a good accuracy for liquid detection. The material around the open end of the line affects its fringing fields, as shown in Figure 1c. Considering the open-ended coaxial probe as a truncated transmission line, the electromagnetic waves propagate along it and reflected back at the end of line because of an impedance mismatch between the probe and the sample. This mismatch, and thereafter the reflection coefficient, is related to the ratio of dielectric constants for sample and probe, or equivalently ratio of their capacitances. For a WUT with permittivity of ε W U T , the reflection coefficient ( Γ W U T ) of the open-ended line can be represented by [33],
Γ W U T = 1 j ω Z 0 ( ε W U T C 0 + C f ) 1 + j ω Z 0 ( ε W U T C 0 + C f ) ,
where ω is angular frequency, Z 0 is characteristic impedance of coaxial line, i.e., 50 Ω , C 0 and C f are capacitances of air outside and fringing field inside the coaxial line, respectively. For a reference sample with permittivity of ε R e f close to ε W U T , the first approximation of (1) can be obtained as,
Γ W U T = Γ R e f 2 j ω Z 0 ( ε W U T ε R e f ) C 0 .
The proposed sensor node uses the same sensitive circuits for the WUT and reference samples. The node consists of a six-port sensor, a dual-band antenna, a diplexer, and a frequency doubler, as shown in Figure 2a. The antenna absorbs the transmitted signal of BS at f /2 and the diplexer passes it to the frequency doubler. The output signal of the doubler is used as the input signal of the SPS, at f . The output port of SPS is connected to the f branch of diplexer and transmits the output modulated-signal back to the BS through the antenna. The other four ports of SPS are connected to two pairs of open-ended coaxial line for sensing, as described previously. One pair senses the WUT while the other one with a known sample is used as a reference for calibration procedure at the receiver.
The modified SPS as a sensor node uses a 90° hybrid coupler, two pairs of variable reflectors and one power combiner, as shown in Figure 2c. In the first stage, the input signal at port #1 ( P 1 ) is quadrature divided between two branches, named by I - and Q -path. At each path, a pair of sensitive structures reflects the signal at reflection ports, i.e., P 3 , P 4 , P 5 , and P 6 , while the phase and amplitude of reflected signals change according to the WUT. The power combiner adds two reflected signals at the output port P 2 . Considering the SPS as a linear circuit with ideal power combiner (equal power division with 0 degrees phase shift) and quadrature couplers (equal power division with 90 degrees phase shift), its scattering parameters are related as follows,
S 31 = j S 41 = S 32 = j S 42 = j S 51 = S 61 = S 52 = j S 62 , and   S m n = S n m ,
where S m n is the reflected power waves from port m due to the incident power waves at port n , for n and m from 1 to 6. Then, the reflection coefficient at the input ( R 11 ) and transmission from input to output ( T 21 ) of SPS can be represented as,
R 11 = S 31 Γ 3 S 13 + S 41 Γ 4 S 14 + S 51 Γ 5 S 15 + S 61 Γ 6 S 16 = S 31 2 ( Γ 3 Γ 4 ) + S 51 2 ( Γ 5 Γ 6 ) ,
T 21 = S 31 Γ 3 S 23 + S 41 Γ 4 S 24 + S 51 Γ 5 S 25 + S 61 Γ 6 S 26 = S 31 2 ( Γ 3 + Γ 4 ) j S 51 2 ( Γ 5 + Γ 6 ) .
Based on (3) and (4), the input reflection coefficient will be equal to zero ( R 11 = 0 ) if Γ R e f Γ 3 = Γ 4 and Γ W U T Γ 5 = Γ 6 . Then, the normalized transmission coefficient from the input to the output port ( T N ) is simplified to:
T N 1 2 S 31 2 T 21 = Γ R e f + j Γ W U T ,
which is normalized to the known value of S 31 . Hence, for a single tone input signal, the output signal is composed of two reflected components, i.e., Γ R e f and j Γ W U T , which are in a semi-orthogonal vector space and easy to separate at the receiver.

2.2. The Base Station

At the BS, as shown in Figure 2b, a signal generator provides the main signal at the frequency of f /2. An unequal power divider separates a low-power part of this signal for subsequent demodulation. A frequency doubler, which consists of a nonlinear element and its matching circuits, upconverts the frequency to f and feeds it to the input port of the SPS as a direct conversion receiver. Using the same signal source for modulation and demodulation makes the synchronization much easier as there is no frequency difference between the received and local oscillator (LO) signals at the receiver. The high-power part is passed to the f /2 branch of a diplexer which is connected to a dual-band transmitting at f /2 and receiving at f antenna. Therefore, the BS can propagate a single tone signal at the frequency of f /2. The other branch of diplexer separates the received signal at f and feeds it to the input port of SPS for detection. As there is no critical limitation on the power consumption of BS, the transmitted and received signals can be amplified by a power amplifier (PA) and a low noise amplifier (LNA), respectively, to increase the wireless coverage or improve the signal to noise ratio. In the SPS as a direct conversion receiver, various 90° phase shifted versions of received ( R F ) and local oscillator ( L O ) signals at the same frequency are combined, as shown in Figure 2d. Then, signals at the output port #3 through #6 are applied to four power detectors and low-pass filters to find the output powers P o 3 - P o 6 . The normalized coefficient between the ( R F ) and ( L O ) signals is defined by T B , with real and imaginary parts of I B and Q B . In a lossless SPS, T B can be calculated from the linear compositions of the output signals, P o 3 , , o 6 , as [28],
T B I B + j Q B = I B = P o 4 P o 3 2 + j P o 6 P o 5 2 .
As in an ideal communication channel T B = T N = ( Γ R e f + j Γ W U T ) , the value of Γ W U T can be calculated from the measured T B and known Γ R e f . Based on this demodulated data, the pollution index of water and the quality of WUT can be estimated.

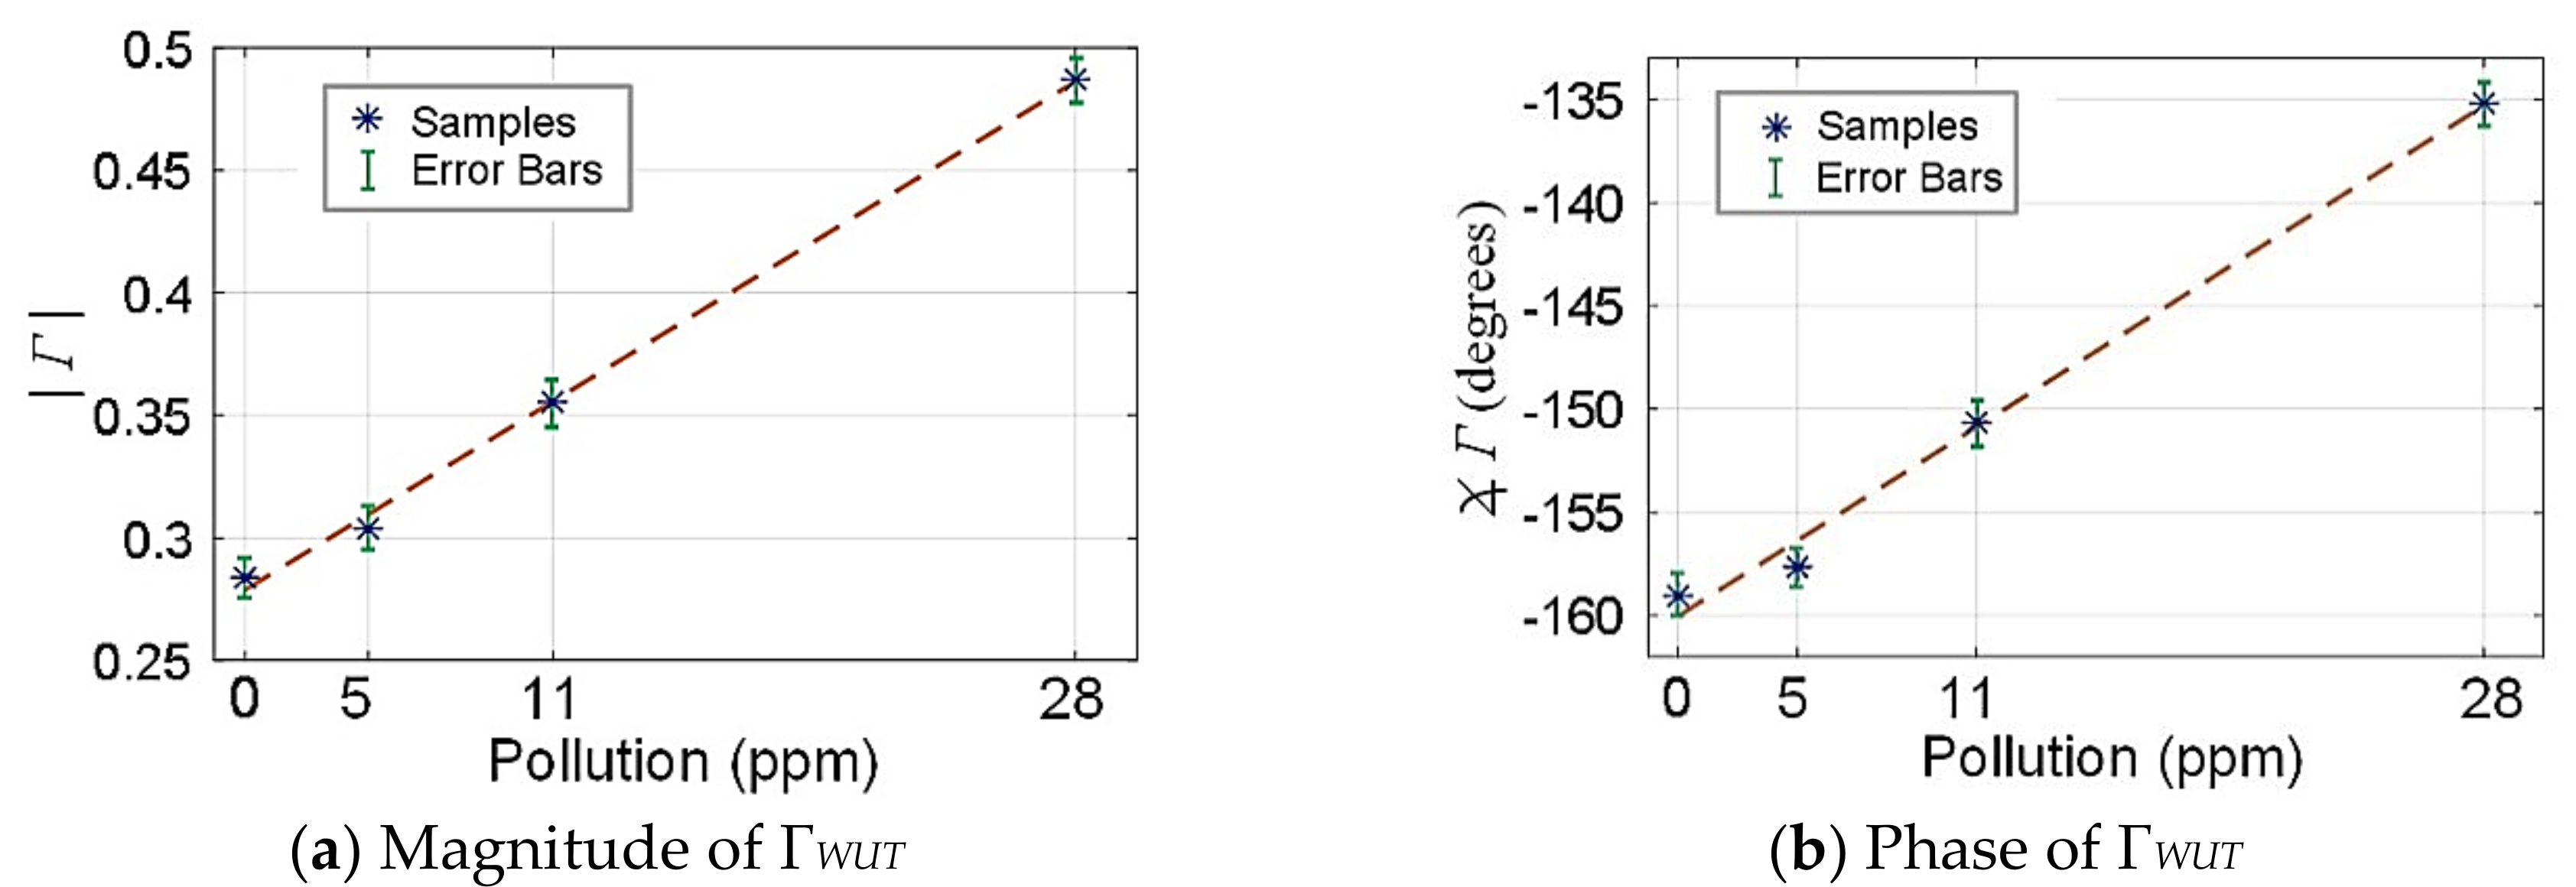
3. Experimental Verification

The proposed system is evaluated at the power and data transmit frequencies of 1.225 GHz and 2.45 GHz, respectively, as shown in Figure 3a. The circuits are fabricated with printed circuit technology on Rogers’ RO4003 material with relative permittivity of 3.55, thickness of 0.508 mm, and loss tangent of 0.0027. The antennas is fabricated on Rogers’ RT/duroid 5880 material with relative permittivity of 2.2, thickness of 0.508 mm, and loss tangent of 0.0009.
An R&S ZVA67 (Rohde & Schwarz: Munich, BY, Germany) vector network analyzers is used for reflection coefficient measurements. An ADF4350 (Analog Devices: Norwood, MA, USA) frequency synthesizer generates both frequencies at the base station. An AD7605 (Analog Devices: Norwood, MA, USA) data acquisition system converts received signals from analog to digital domain for demodulation in a personal computer. The output power of transmitter was +5 dBm and distance between the sensor node and base-station was selected as 1.5 m. The sensor is zero power but there is no critical limitation on the power consumption of base-station. Therefore, the transmitted and received signals can be amplified by a power amplifier (PA) and a low noise amplifier (LNA), respectively, to increase the wireless coverage or improve the signal to noise ratio.
The detailed schematics of all sub-circuits are presented in Figure 3 with the dimensions provided in Table 1 and Table 2. A HSMS-2850 (Broadcom Inc.: San Jose, CA, USA) conventional diode and an open stub are used to generate and filter the second harmonic of the input signal in the output branch. A dual-band low-profile antennas [34] is designed to transmit and receive the frequencies of 1.225 GHz and 2.45 GHz. Figure 4 shows the implemented overall system, sensing node, receiver, diplexer, the combined structure of diplexer and frequency doubler, and dual-band antenna.
The measured parameters of various parts are presented in Figure 5. The SPS provides the acceptable transitions about −6 dB while its isolation and reflection coefficients are better than −10 dB, at the operating frequency of 2.45 GHz. The required phase shifts of 0° and 90° in a conventional SPS are also achieved, as shown in Figure 5a. The antenna response in Figure 5b shows that despite the small size, it can be used in both frequencies with the acceptable gains (more than 1.7 dBi). The diplexer has less than −0.5 dB loss in the pass bands and better than 15 dB isolation in the rejection bands for both branches of 1.225 GHz and 2.45 GHz, as seen in Figure 5c. The performance of frequency doubler in Figure 5d shows about 10 dB conversion loss from main to the second harmonic signals.
To evaluate the sensor in the first step, the sensitive circuit has been tested to find its response to various samples which will be used as the reference to calculate concentrations of contaminant (CoC) in the water at the BS. The system is tested with three water samples with 5, 11, and 28 ppm of humic acid and for each sample the measurements were repeated 10 times. A commercial humic acid (Sigma-Aldrich, CAS no: 1415-93-6) was used in sample preparation. The amplitude and phase of Γ W U T versus CoC are approximately linear, as can be seen in Figure 6a,b. These curves can be used at the BS to extract the CoC from the calculated Γ R .
The calculated constellation at the BS for all samples and 10 times measurements are presented in Figure 7. All data are normalized to a reference case which is obtained by using the pure water as WUT. Using a nonlinear interpolation, we can fit a curve to the measurement points. The errors of demodulated points, (I, Q)Dem, with the points on the fitted curve, (I, Q)Fit, can be defined as,
E r r o r ( I D e m I F i t ) 2 + ( Q D e m Q F i t ) 2 I F i t 2 + Q F i t 2 × 100 % ,
In the above measurements, errors are less than 4% for a laboratory test environment using a +5 dBm transmitter at 1.225 GHz and about 1.5 m wireless range. Undoubtedly, this error depends on the propagation channel conditions, such as propagation power, distance between transmitter and receiver, and environmental noises.
In a real scenario, first, two similar volume of pure water are used as the test and the reference samples. This test gives us a reference node which will be mapped to (1,1,0). Then, the test ports will be put inside the WUT samples while the reference ports remain in the pure water. By using (7), demodulated I and Q will be extracted from the received signal and normalized to the reference values. The demodulated constellation point (I, Q)Dem will be mapped to Figure 7 and the concentration of contaminant can be determined. In a water treatment system, a pre-defined level of pollution is considered for water quality assessment and the proportional limit point, (I, Q)Lim, can be determined for that level of pollution from the fitted curve. Then, the base station can simply compare (I, Q)Dem with (I, Q)Lim and find if the water quality is acceptable or not. Therefore, the system provides a simple real-time assessment without local power sources at the sensor node. This is true that some water quality assessment systems can provide higher wireless ranges and various pollution detection but they need very long processing times and periodic battery maintenances at the sensor nodes.

4. Conclusions

This paper proposed a zero-power direct conversion sensor. The six-port structure was used at the node as a sensing data modulator and at the base station as the IQ data demodulator. The input signal of this sensor was generated by a passive frequency doubler from a pure wave received from the BS at f /2. A dual band antenna was used as the receiver of power-up signal at f /2 and transmitter of modulated signal at f . As an example for validation, a system is fabricated at f = 2.45 GHz and its results for various polluted water samples have been presented. The ability of sensing and directly transmitting its data at the RF frequencies, without local power source and signal processing at the node, expand applications of the proposed system as sensor nodes in real-time water quality assessment with low complexity, power consumption, and cost. In this paper, the system was designed and evaluated by using the conventional microwave structures and inexpensive printed circuit board (PCB) technology. In the next step, the sensor nodes have been optimized and miniaturized for mass production and WSN applications by using compact building blocks and integrated circuit (IC) technologies. Moreover, the application can be extended to human body sensors for wireless measurement of biological tissues [35].

Author Contributions

R.M. conceived design and experiments. M.M.H. assisted in experiments. B.L. and P.M. participated in developing approach and methodology. B.K. and M.S. prepared the samples and assisted with discussion and interpretation of results. All authors reviewed the manuscript.

Funding

This research was funded by NSERC-AITF industrial research chair program.

Conflicts of Interest

The authors declare no conflicts of interest.

Abbreviations

QPDQuadrature Power Divider
QPCQuadrature Power Coupler
PCPower Combiner
PDPower Detector
LPFLow Pass Filter
RSCReference Sensitive Circuits
SSCSample Sensitive Circuits

References

  1. World Economic Forum. The Global Risks Report 2017; World Economic Forum: Geneva, Switzerland, 2017. [Google Scholar]
  2. Allwood, G.; Wild, G.; Hinckley, S. Fiber bragg grating sensors for mainstream industrial processes. Electronics 2017, 6, 92. [Google Scholar] [CrossRef]
  3. Khorshidi, B.; Thundat, T.; Fleck, B.A.; Sadrzadeh, M. A novel approach toward fabrication of high performance thin film composite polyamide membranes. Sci. Rep. 2016, 6, 22069. [Google Scholar] [CrossRef] [PubMed]
  4. Park, S.J.; Hong, J.T.; Choi, S.J.; Kim, H.S.; Park, W.K.; Han, S.T.; Park, J.Y.; Lee, S.; Kim, D.S.; Ahn, Y.H. Detection of microorganisms using terahertz metamaterials. Sci. Rep. 2014, 4, 4988. [Google Scholar] [CrossRef] [PubMed] [Green Version]
  5. Højris, B.; Christensen, S.C.B.; Albrechtsen, H.-J.; Smith, C.; Dahlqvist, M. A novel, optical, on-line bacteria sensor for monitoring drinking water quality. Sci. Rep. 2016, 6, 23935. [Google Scholar] [CrossRef] [PubMed] [Green Version]
  6. Culler, D.E.; Mulder, H. Smart sensors to network the world. Sci. Am. 2004, 290, 84–91. [Google Scholar] [CrossRef] [PubMed]
  7. Tucker, R.; Ruffini, M.; Valcarenghi, L.; Campelo, D.R.; Simeonidou, D.; Du, L.; Marinescu, M.-C.; Middleton, C.; Yin, S.; Forde, T. Connected OFCity: Technology innovations for a smart city project. IEEE/OSA J. Opt. Commun. Networking 2017, 9, A245–A255. [Google Scholar] [CrossRef]
  8. Bouk, S.H.; Ahmed, S.H.; Kim, D.; Song, H. Named-data-networking-based ITS for smart cities. IEEE Commun. Mag. 2017, 55, 105–111. [Google Scholar] [CrossRef]
  9. Li, M.; Lin, H.-J. Design and implementation of smart home control systems based on wireless sensor networks and power line communications. IEEE Trans. Ind. Electron. 2015, 62, 4430–4442. [Google Scholar] [CrossRef]
  10. Im, H.; Lee, S.; Naqi, M.; Lee, C.; Kim, S. Flexible PI-Based Plant Drought Stress Sensor for Real-Time Monitoring System in Smart Farm. Electronics 2018, 7, 114. [Google Scholar] [CrossRef]
  11. Mirzavand, R.; Honari, M.M.; Mousavi, P. High-Resolution Balanced Microwave Material Sensor with Extended Dielectric Range. IEEE Trans. Ind. Electron. 2017, 64, 1552–1560. [Google Scholar] [CrossRef]
  12. Mirzavand, R.; Honari, M.M.; Mousavi, P. High-Resolution Dielectric Sensor Based on Injection-Locked Oscillators. IEEE Sens. J. 2017, 18, 141–148. [Google Scholar] [CrossRef]
  13. Donelli, M.; Manekiya, M. Development of Environmental Long Range RFID Sensors Based on the Modulated Scattering Technique. Electronics 2018, 7, 106. [Google Scholar] [CrossRef]
  14. Visser, H.J.; Vullers, R.J.M. RF energy harvesting and transport for wireless sensor network applications: Principles and requirements. Proc. IEEE 2013, 101, 1410–1423. [Google Scholar] [CrossRef]
  15. Huang, H.; Chen, P.-Y.; Hung, C.-H.; Gharpurey, R.; Akinwande, D. A zero power harmonic transponder sensor for ubiquitous wireless μL liquid-volume monitoring. Sci. Rep. 2016, 6, 18795. [Google Scholar] [CrossRef] [PubMed] [Green Version]
  16. Zhang, J.; Tian, G.Y.; Marindra, A.M.J.; Sunny, A.I.; Zhao, A.B. A review of passive RFID tag antenna-based sensors and systems for structural health monitoring applications. Sensors 2017, 17, 265. [Google Scholar] [CrossRef] [PubMed]
  17. Linz, S.; Oesterle, F.; Talai, A.; Lindner, S.; Mann, S.; Barbon, F.; Weigel, R.; Koelpin, A. 100 GHz reflectometer for sensitivity analysis of MEMS sensors comprising an intermediate frequency six-port receiver. In Proceedings of the 2015 IEEE Topical Conference on Wireless Sensors and Sensor Networks (WiSNet), San Diego, CA, USA, 25–28 January 2015. [Google Scholar]
  18. Vinci, G.; Koelpin, A. Progress of six-port technology for industrial radar applications. In Proceedings of the 2016 IEEE Topical Conference on Wireless Sensors and Sensor Networks (WiSNet), Austin, TX, USA, 24–27 January 2016. [Google Scholar]
  19. Mann, S.; Linz, S.; Erhardt, S.; Lindner, S.; Lurz, F.; Maune, H.; Weigel, R.; Koelpin, A. Differential measuring dual six-port concept and antenna design for an inline foil thickness sensor. In Proceedings of the 2016 German Microwave Conference (GeMiC), Bochum, Germany, 14–16 March 2016. [Google Scholar]
  20. Kuo, H.-C.; Lin, C.-C.; Yu, C.-H.; Lo, P.-H.; Lyu, J.-Y.; Chou, C.-C.; Chuang, H.-R. A fully integrated 60-GHz CMOS direct-conversion Doppler radar RF sensor with clutter canceller for single-antenna noncontact human vital-signs detection. IEEE Trans. Microwave Theory Tech. 2016, 64, 1018–1028. [Google Scholar] [CrossRef]
  21. Von der Mark, S.; Huber, M.; Boeck, G. 24 GHz direct conversion transceiver for sensor networks. In Proceedings of the 2007 IEEE Wireless Communications and Networking Conference, Kowloon, China, 11–15 March 2007. [Google Scholar]
  22. Cook, B.S.; Vyas, R.; Kim, S.; Thai, T.; Le, T.; Traille, A.; Aubert, H.; Tentzeris, M.M. RFID-based sensors for zero-power autonomous wireless sensor networks. IEEE Sens. J. 2014, 14, 2419–2431. [Google Scholar] [CrossRef]
  23. Adhikary, M.; Biswas, A.; Akhtar, M.J. Active Integrated Antenna Based Permittivity Sensing Tag. IEEE sens. let. 2017, 1, 1–4. [Google Scholar] [CrossRef]
  24. Lobato-Morales, H.; Corona-Chavez, A.; Olvera-Cervantes, J.L.; Chávez-Pérez, R.A.; Medina-Monroy, J.L. Wireless sensing of complex dielectric permittivity of liquids based on the RFID. IEEE Trans. Microwave Theory Tech. 2014, 62, 2160–2167. [Google Scholar] [CrossRef]
  25. Bouaziz, S.; Chebila, F.; Traille, A.; Pons, P.; Aubert, H.; Tentzeris, M. Novel micro-fluidic structures for wireless passive temperature telemetry medical systems using radar interrogation techniques in Ka-band. IEEE Antennas Wirel. Propag. Lett. 2012, 11, 1706–1709. [Google Scholar] [CrossRef]
  26. Cole, A.J.; Young, P.R. Chipless Liquid Sensing Using a Slotted Cylindrical Resonator. IEEE Sens. J. 2017, 18, 149–156. [Google Scholar] [CrossRef]
  27. Li, J.; Bosisio, R.G.; Wu, K. Computer and measurement simulation of a new digital receiver operating directly at millimeter-wave frequencies. IEEE Trans. Microwave Theory Tech. 1995, 43, 2766–2772. [Google Scholar] [CrossRef]
  28. Mirzavand, R.; Mohammadi, A.; Abdipour, A. Low-cost implementation of broadband microwave receivers in Ka-band using multiport structures. IET Microwaves Antennas Propag. 2009, 3, 483–491. [Google Scholar] [CrossRef]
  29. Mirzavand, R.; Mohammadi, A.; Ghannouchi, F.M. Five-port microwave receiver architectures and applications. IEEE Commun. Mag. 2010, 48, 30–36. [Google Scholar] [CrossRef]
  30. Beikmirza, M.R.; Mohammadi, A.; Mirzavand, R. Power amplifier linearisation using digital predistortion and multi-port techniques. IET Sci. Meas. Technol. 2016, 10, 467–476. [Google Scholar] [CrossRef]
  31. Mirzavand, R.; Honari, M.M.; Mousavi, P. N-ZERO direct conversion wireless sensor based on six-port structures. In Proceedings of the 2017 IEEE MTT-S International Microwave Symposium (IMS), Honololu, HI, USA, 4–9 June 2017. [Google Scholar]
  32. Mirzavand, R.; Honari, M.M.; Mousavi, P. Direct-conversion sensor for wireless sensing networks. IEEE Trans. Ind. Electron. 2017, 64, 9675–9682. [Google Scholar] [CrossRef]
  33. Berube, D.; Ghannouchi, F.M.; Savard, P. A comparative study of four open-ended coaxial probe models for permittivity measurements of lossy dielectric/biological materials at microwave frequencies. IEEE Trans. Microwave Theory Tech. 1996, 44, 1928–1934. [Google Scholar] [CrossRef]
  34. Li, R.; Pan, B.; Laskar, J.; Tentzeris, M.M. A Novel Low-Profile Broadband Dual-Frequency Planar Antenna for Wireless Handsets. IEEE Trans. Antennas Propag. 2008, 56, 1155–1162. [Google Scholar] [CrossRef]
  35. La Gioia, A.; Porter, E.; Merunka, I.; Shahzad, A.; Salahuddin, S.; Jones, M.; O’Halloran, M. Open-Ended Coaxial Probe Technique for Dielectric Measurement of Biological Tissues: Challenges and Common Practices. Diagnostics 2018, 8, 40. [Google Scholar] [CrossRef] [PubMed]
Figure 1. Schematic presentation of real-time water quality assessment: (a) A water sensor network; (b) A sensor node; (c) Open-ended coaxial line sensing of water.
Electronics 07 00231 g001
Figure 2. Functional block diagrams of system’s sub-circuits: (a) The sensor node; (b) The base station; (c) The six-port sensor; (d) The six-port receiver.
Electronics 07 00231 g002
Figure 3. Detailed schematic of designed circuits: (a) The six-port sensor; (b) The six-port receiver; (c) The duplexer at sensor node including frequency doubler; (d) The dual band antenna.
Electronics 07 00231 g003
Figure 4. Fabricated water quality sensing system.
Electronics 07 00231 g004
Figure 5. Measurement results of sub-circuits.
Electronics 07 00231 g005aElectronics 07 00231 g005b
Figure 6. Measurement results of ΓWUT versus concentrations of pollution (ppm).
Electronics 07 00231 g006
Figure 7. Demodulated data at the receiver (I: real part, Q: imaginary part).
Electronics 07 00231 g007
Table 1. Six-Port Sensor and Demodulator Dimensions.
Parameter(mm)Parameter(mm)
w 0 1.13 L 0 5.00
w 1 1.91 L 1 18.8
w 2 0.62 L 2 8.50
w 3 0.30 L 3 22.4
s0.70 L 4 10.2
Table 2. Diplexer, Frequency Doubler, and Dual-Band Compact Antenna Dimensions.
Parameter(mm)Parameter(mm)Parameter(mm)Parameter(mm)
w 0 1.13 L 0 5.00 w 1 1.13 L 1 7.00
w 2 0.85 L 2 18.8 w 3 1.02 L 3 30.3
w 4 0.85 L 4 7.20 w 5 1.13 L 5 4.80
w 6 1.13 L 6 32.6 w 7 1.13 L 7 7.00
w 8 0.3 L 8 4.40 w 9 0.25 L 9 4.3
w 10 1.70 L 10 31.2 w 11 1.13 L 11 20.3
W t 36.5 W p 10.1 S t 2.525 W u 8.67
H t 9.1 W l 1.11 H 0.508 W g 62
S 2 0.47 L g 111.67 S 1 1.22 W f 2.225
W s 53.3 L f 29.67 ε r 2.2 L e 18.65

