Article

A Raspberry Pi Based Portable Endoscopic 3D Measurement System

Institute of measurement and automatic control, Nienburger Straße 17, Leibniz Universität Hannover, 30167 Hannover, Germany
*
Author to whom correspondence should be addressed.
Electronics 2016, 5(3), 43; https://doi.org/10.3390/electronics5030043
Submission received: 29 April 2016 / Revised: 15 July 2016 / Accepted: 18 July 2016 / Published: 26 July 2016
(This article belongs to the Special Issue Raspberry Pi Technology)

Abstract

:
Geometry measurements are very important to monitor a machine part’s health and performance. Optical measurement system have several advantages for the acquisition of a parts geometry: measurement speed, precision, point density and contactless operation. Measuring parts inside of assembled machines is also desirable to keep maintenance cost low. The Raspberry Pi is a small and cost efficient computer that creates new opportunities for compact measurement systems. We have developed a fringe projection system which is capable of measuring in very limited space. A Raspberry Pi 2 is used to generate the projection patterns, acquire the image and reconstruct the geometry. Together with a small LED projector, the measurement system is small and easy to handle. It consists of off-the-shelf products which are nonetheless capable of measuring with an uncertainty of less than 100 μ m .

1. Introduction

In order to monitor a parts manufacturing quality, reliability and performance, geometry measurements are very important [1]. Optical means of measurement are very fast, contact less and deliver precise geometry information. Fringe projection, for example, is used for a wide range of measurement tasks and multiple scales. It is based on the triangulation principle. A simple setup for fringe projection consists of a camera and a projector set up in a known angle, e.g., 30 degree. The projector then projects certain structured light patterns onto an object to determine a relation between camera pixels and projector pixels. This relation is used to calculate a 3D point cloud of the objects surface. One disadvantage of most fringe projections systems is the size and shape of the projector. While the volume of measurement is usually adjusted for a specific task, only a few systems are capable of measuring inside complex geometries. There are some endoscopic fringe projection systems used to scan rows of teeth in a dental lab [2]. The measurement head is still relatively large and the resolution and capabilities of the projector are limited. Storz offers the MULTIPOINT endoscope which uses 49 laser dots to acquire 3d information of an object [3]. The position of each measurement point is computed using the triangulation principle. General Electric developed a fringe projection system with a fixed pattern projector and a chip on tip camera on a flexible shaft [4]. A similar measurement system was developed by Matthias [5]. It uses a bundle of 100,000 single fibers for projection and image acquisition and has therefore a more flexible measurement head. A disadvantage is the limited resolution of 100,000 pixels. Although these systems all have some capability in measuring in limited space, all of them sacrifice pattern projection quality for a small measurement head. The measurement system presented in this paper uses a borescope with a chip on tip Raspberry Pi camera to deliver high quality measurements with fully adaptable color patterns. With those patterns our measurement system delivers superior measurement quality compared to products on the market. The Raspberry Pi is used for image acquisition as well as pattern generation via built in HDMI output.

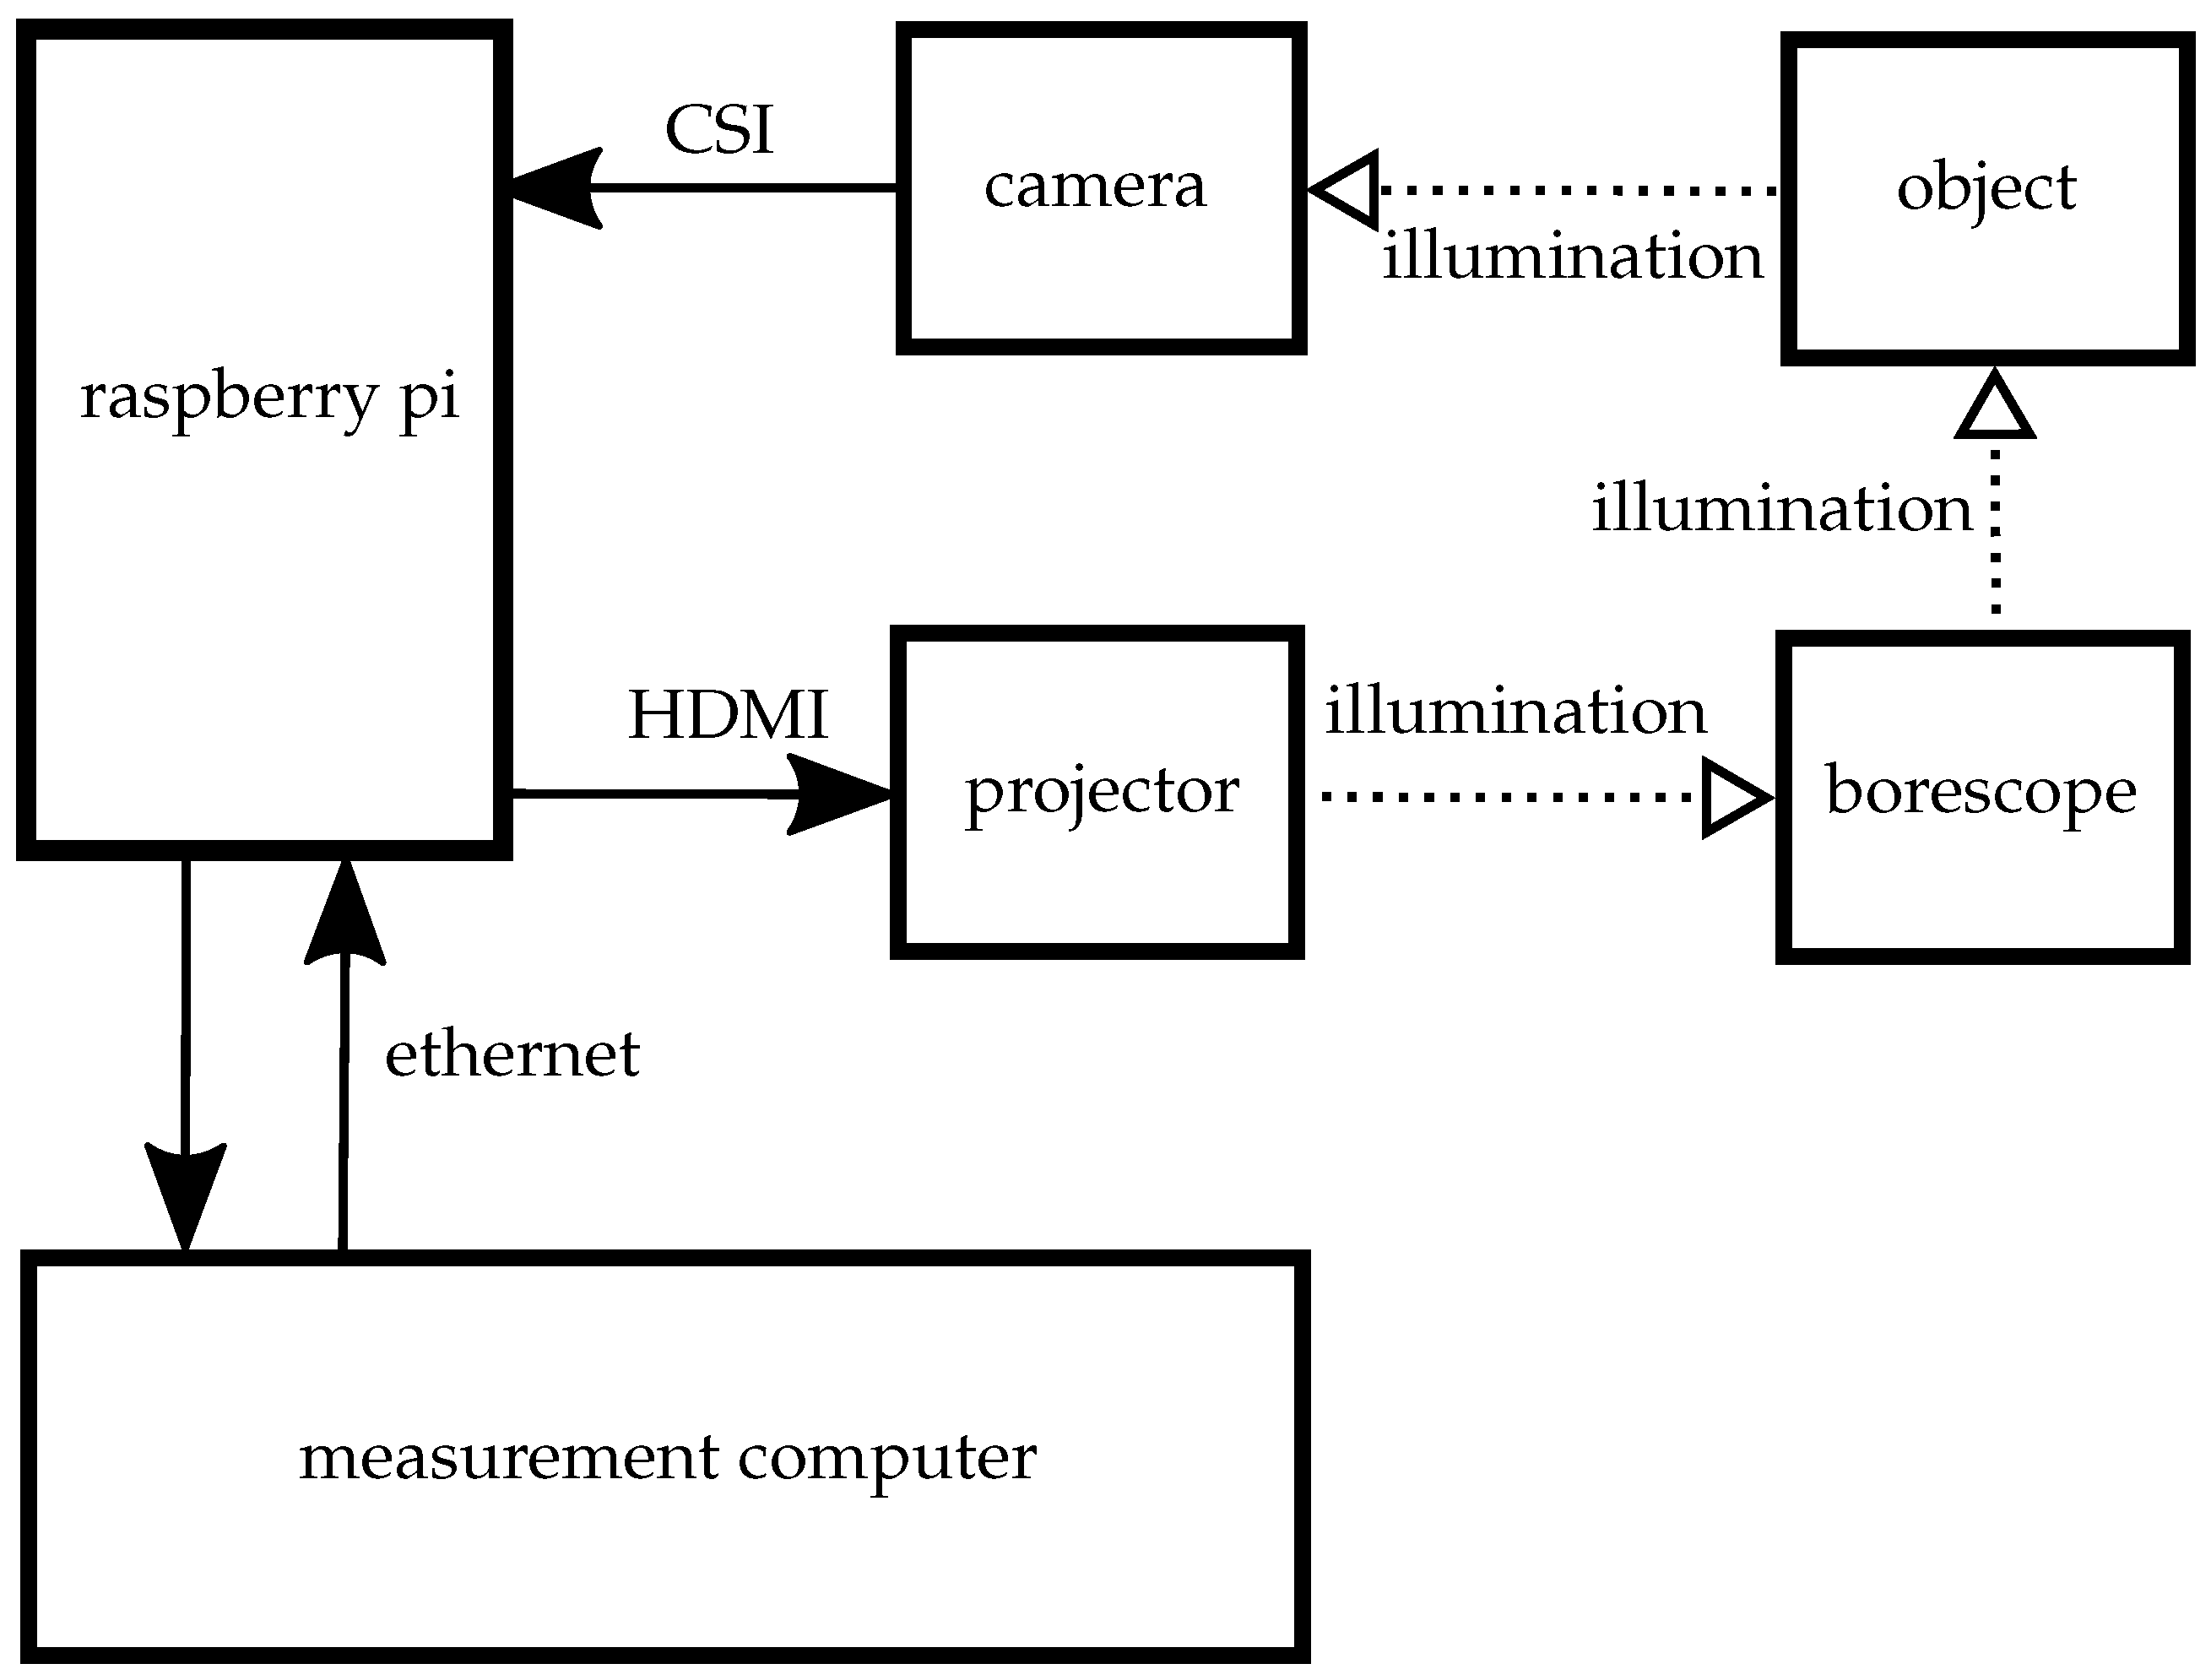
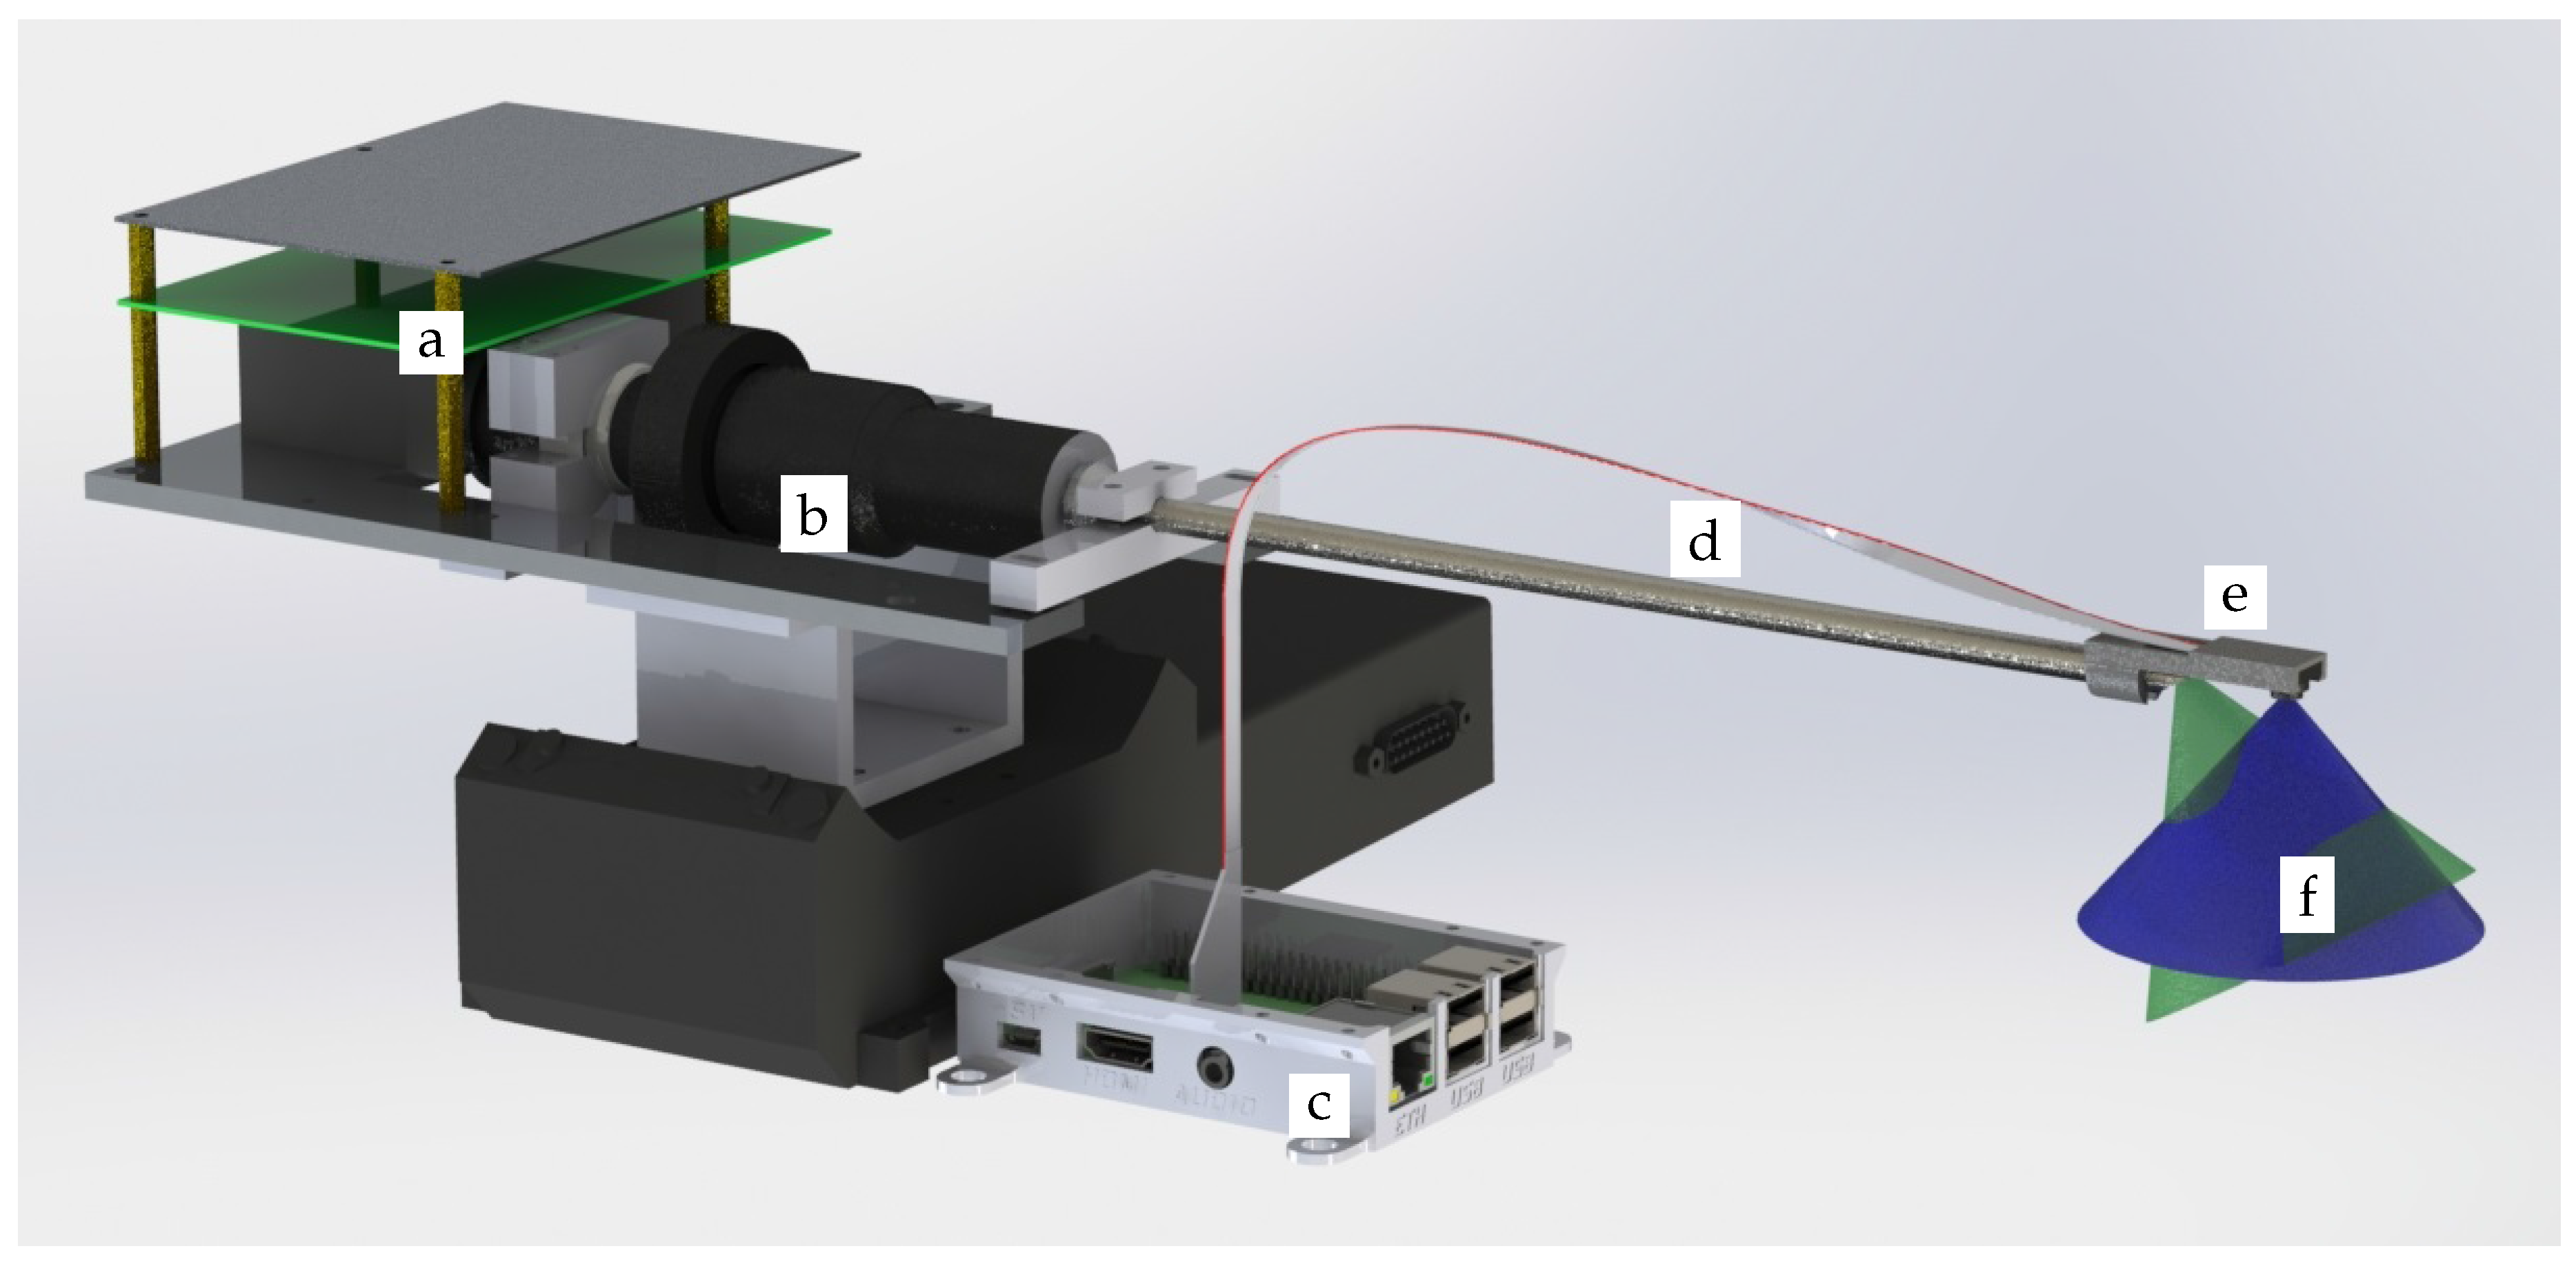
2. The Measurement System

The measurement system consists of a Raspberry Pi with a camera, a borescope and a projector. The camera is the standard Raspberry Pi camera with a special ribbon cable that is only 6 m m wide. The projector Texas Instruments LCR4500 is used because it is very compact and delivers a linear light intensity profile. The borescope is a 86290 CF from Storz. It has a length of 20 m m , an angle of view of 90 and a direction of view of 70 . The cameras is pointed 90 relative to the shaft. Therefore the system has a triangulation angle of approximately 20 . Additionally, a camera adapter is used to couple the light of the projector into the borescope. The optical properties of the projector are very similar to that of a pinhole camera. Therefore the camera adapter is also suitable to be used with the projector. The adapter was originally developed to combine the borescope with an industrial camera with a “C mount” lens mount.
As shown in Figure 1 the Raspberry Pi is connected to the measurement workstation via ethernet. The workstation sends requests for a image pattern sequence to the Raspberry Pi. The Raspberry Pi calculates the patterns and transmits them to the projector via HDMI. The camera is controlled with the Camera Serial Interface (CSI) embedded onto the Raspberry Pi and transmits the images to the Raspberry Pi. Finally the Raspberry Pi transmits the images to the workstation for further processing.
The reconstruction of the measurement is done on the workstation, because it is more suitable to display and manage the measurements. The measurement system itself only needs a power supply and ethernet connection to the workstation and is very compact and portable (see Figure 2 and Figure 3). The base plate of the projector was designed to provide mounting points for the borescope shaft and the camera adapter.

2.1. Image Acquisition

In most scenarios, the Raspberry Pi camera is used with image compression, which is suitable for most consumer applications. The precision of optical measurements though strongly relies on high quality camera images. Lossy image compression would therefore have a negative impact on the measurement quality. On the other hand, most optical measurement systems rely on grayscale images instead of color images. Unfortunately, receiving the raw-data from the image sensor is rather time consuming and takes more than one second per image.
For the measurement systems, the standard application to capture images with the Raspberry Pi, raspistill, has been altered to receive only the intensity value of the camera image. For the developers convenience, a wrapper for python programming language was written.
The adapted application is based on raspistillYUV from the userland library. The image data is converted to the YUF442 format and not compressed. The application then extracts only the luminance part of the image and copies it into a buffer. The buffer has been provided by the caller of the method. In practice the buffer was allocated by the python interpreter, so that the interpreter takes care of the memory management. Figure 4 contains a sequence of patterns used for a measurement. Only one phase per frequency is shown.

2.2. Calibration

The calibration of the measurement system is based on the calibration of a stereo camera system with an extended pinhole camera model. It is roughly based on the work of Zhang [6]. The light path of the projector is very similar to that of a camera so that the same model is applied to both. The pinhole model is a linear equation
s u v 1 = K P x
K = f u 0 u 0 0 f v v 0 0 0 1
P = R t
with the scaling factor s, the pixel coordinates u and v the focal length f u and f v the camera principal point ( u 0 , v 0 ) T , the rotation matrix R , the translation vector t and the homogeneous extension of a point in space x . Additionally the lens distortion is modelled as two non linear functions
u = u + k 1 r 2 + k 2 r 4 + k 3 r 6 + 2 p 1 u v + p 2 ( r 2 + 2 u 2 )
and
v = v + k 1 r 2 + k 2 r 4 + k 3 r 6 + p 1 ( r 2 + 2 v 2 ) + 2 p 2 u v ,
with the undistorted pixel values u and v , the distance of the pixel from the camera principle point r, the radial distortion coefficients k 1 , k 2 , k 3 , and the tangential distortion coefficients p 1 and p 2 . The high manufacturing quality and precise alignment of optics of modern industrial cameras usually leads to p 1 and p 2 being close to 0, so that they have not to be determined. With our measurement system, identifying these parameters improves the results a lot, because the borescope is not aligned perfectly to the projector. The mediocre quality of the raspberry pi camera also makes the identification of these parameters necessary.
The pose P of the camera is assumed to be the identity, so that the world coordinate system lies in the centre of the camera. A standard with printed dots with a distance of 1 m m was used to calibrate the measurement system. For a full calibration, the standard has to be viewed from different poses and angles. The computer vision library openCV was used to calculate the parameters for the camera and the projector. The projector is, obviously, not capable of viewing the printed features. In a first step the camera was calibrated using the printed features. In a second step the projector projects circular features onto the same calibration standard. The pose of the standard is known from the camera calibration, so that the 3D position if the projected features is are also known. The model for camera and projector can be inverted numerically.
The quality of the calibration is influenced by several sources of error. First the calibration standard has some uncertainty. Additionally quantisation of the image sensor and projector mirror array cause some error in the detection and projection of the markers. The round markers are approximated with fitted ellipses. Variances in the illumination around an ellipse will have an influence on which pixels that are detected as being part of the contour.

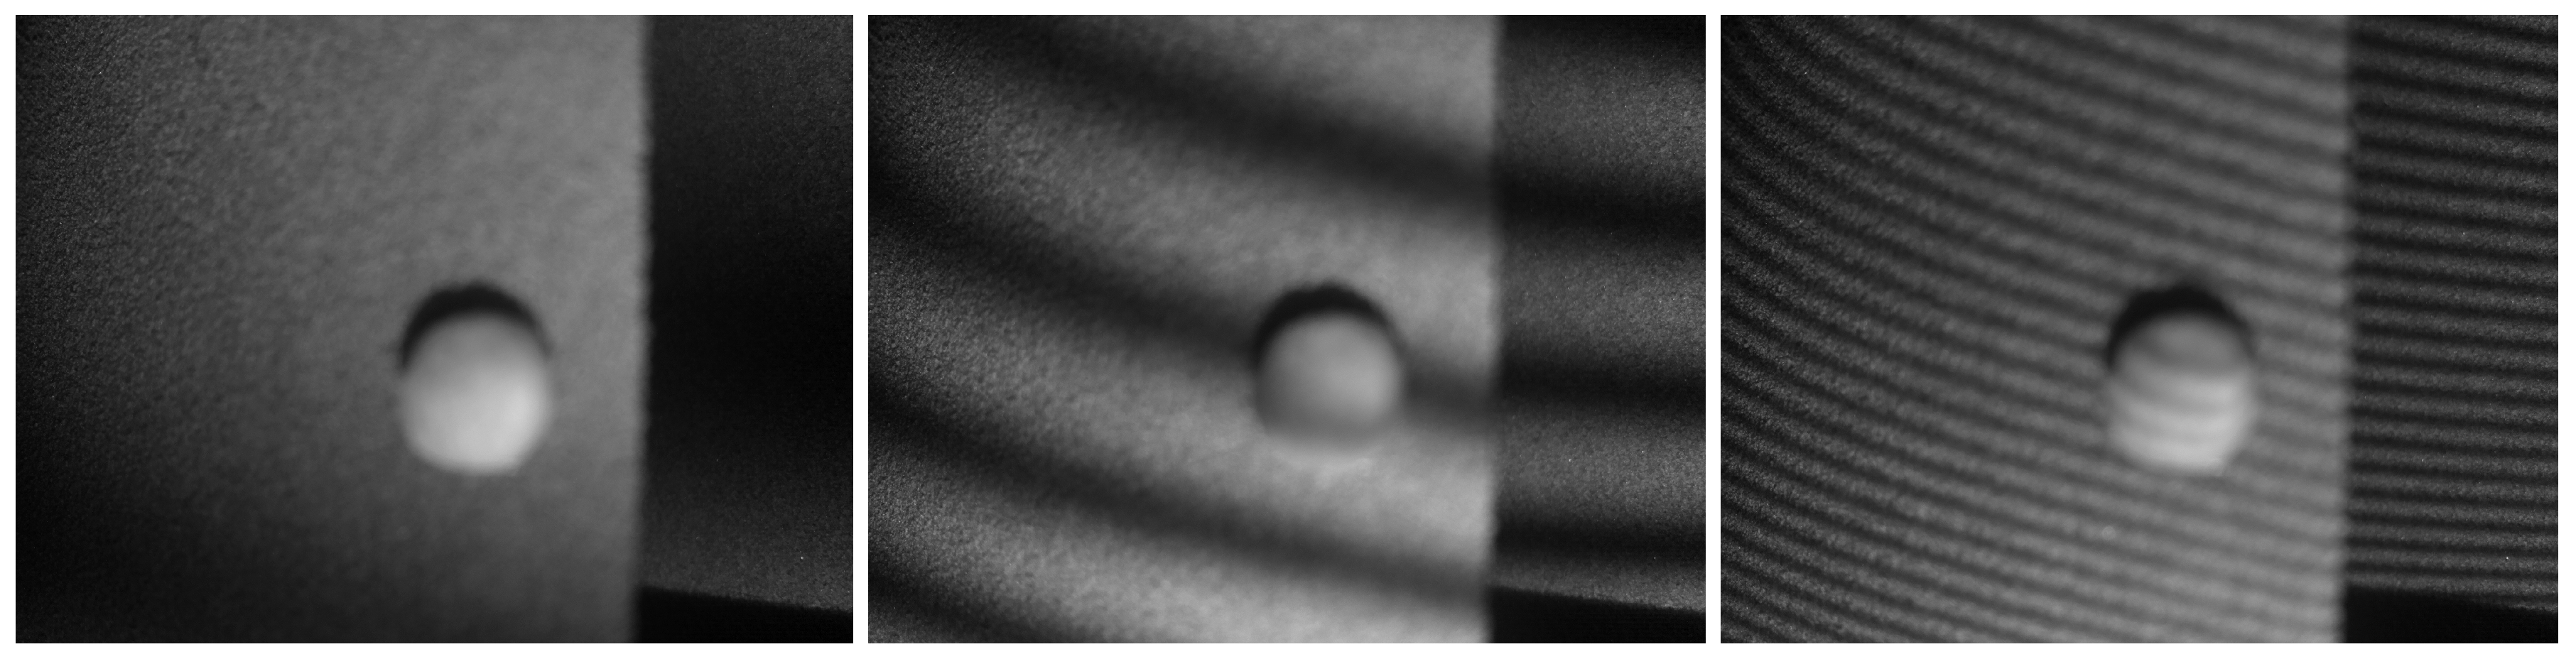
2.3. Pattern Projection and Reconstruction
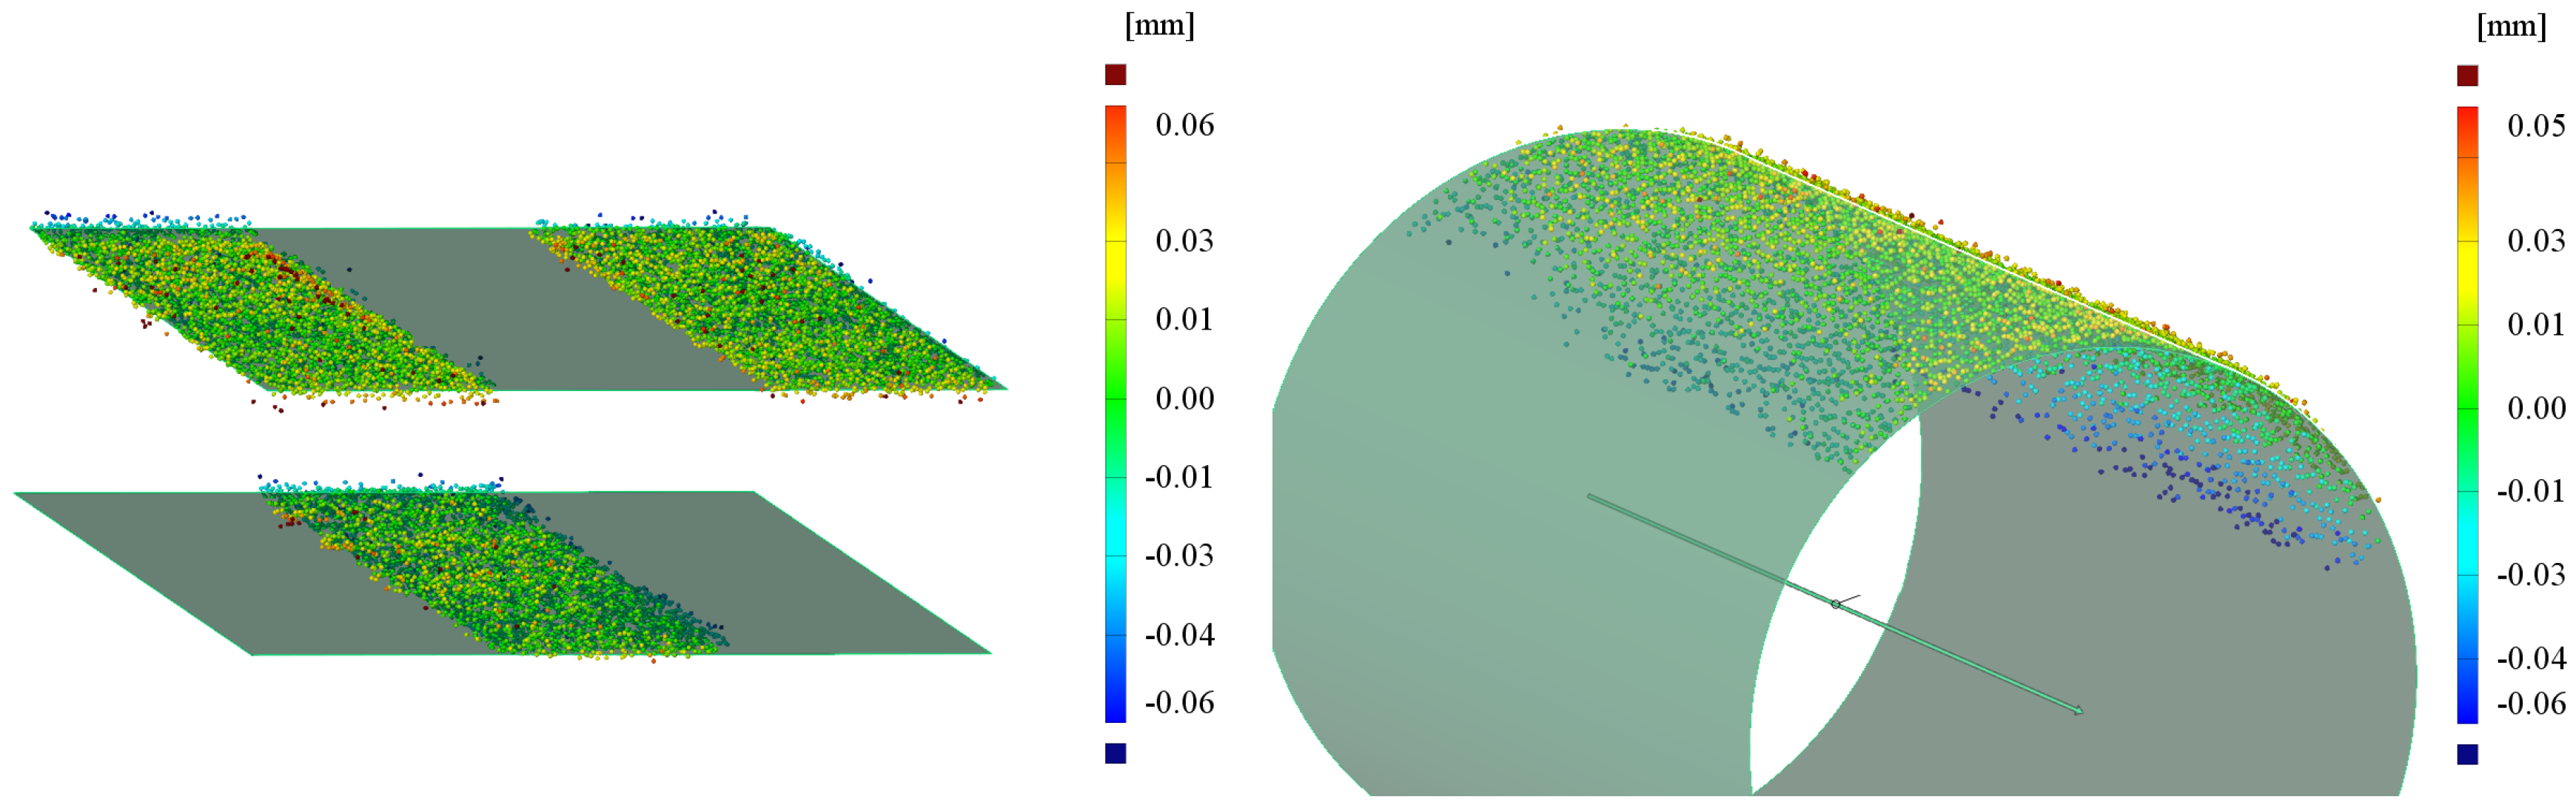
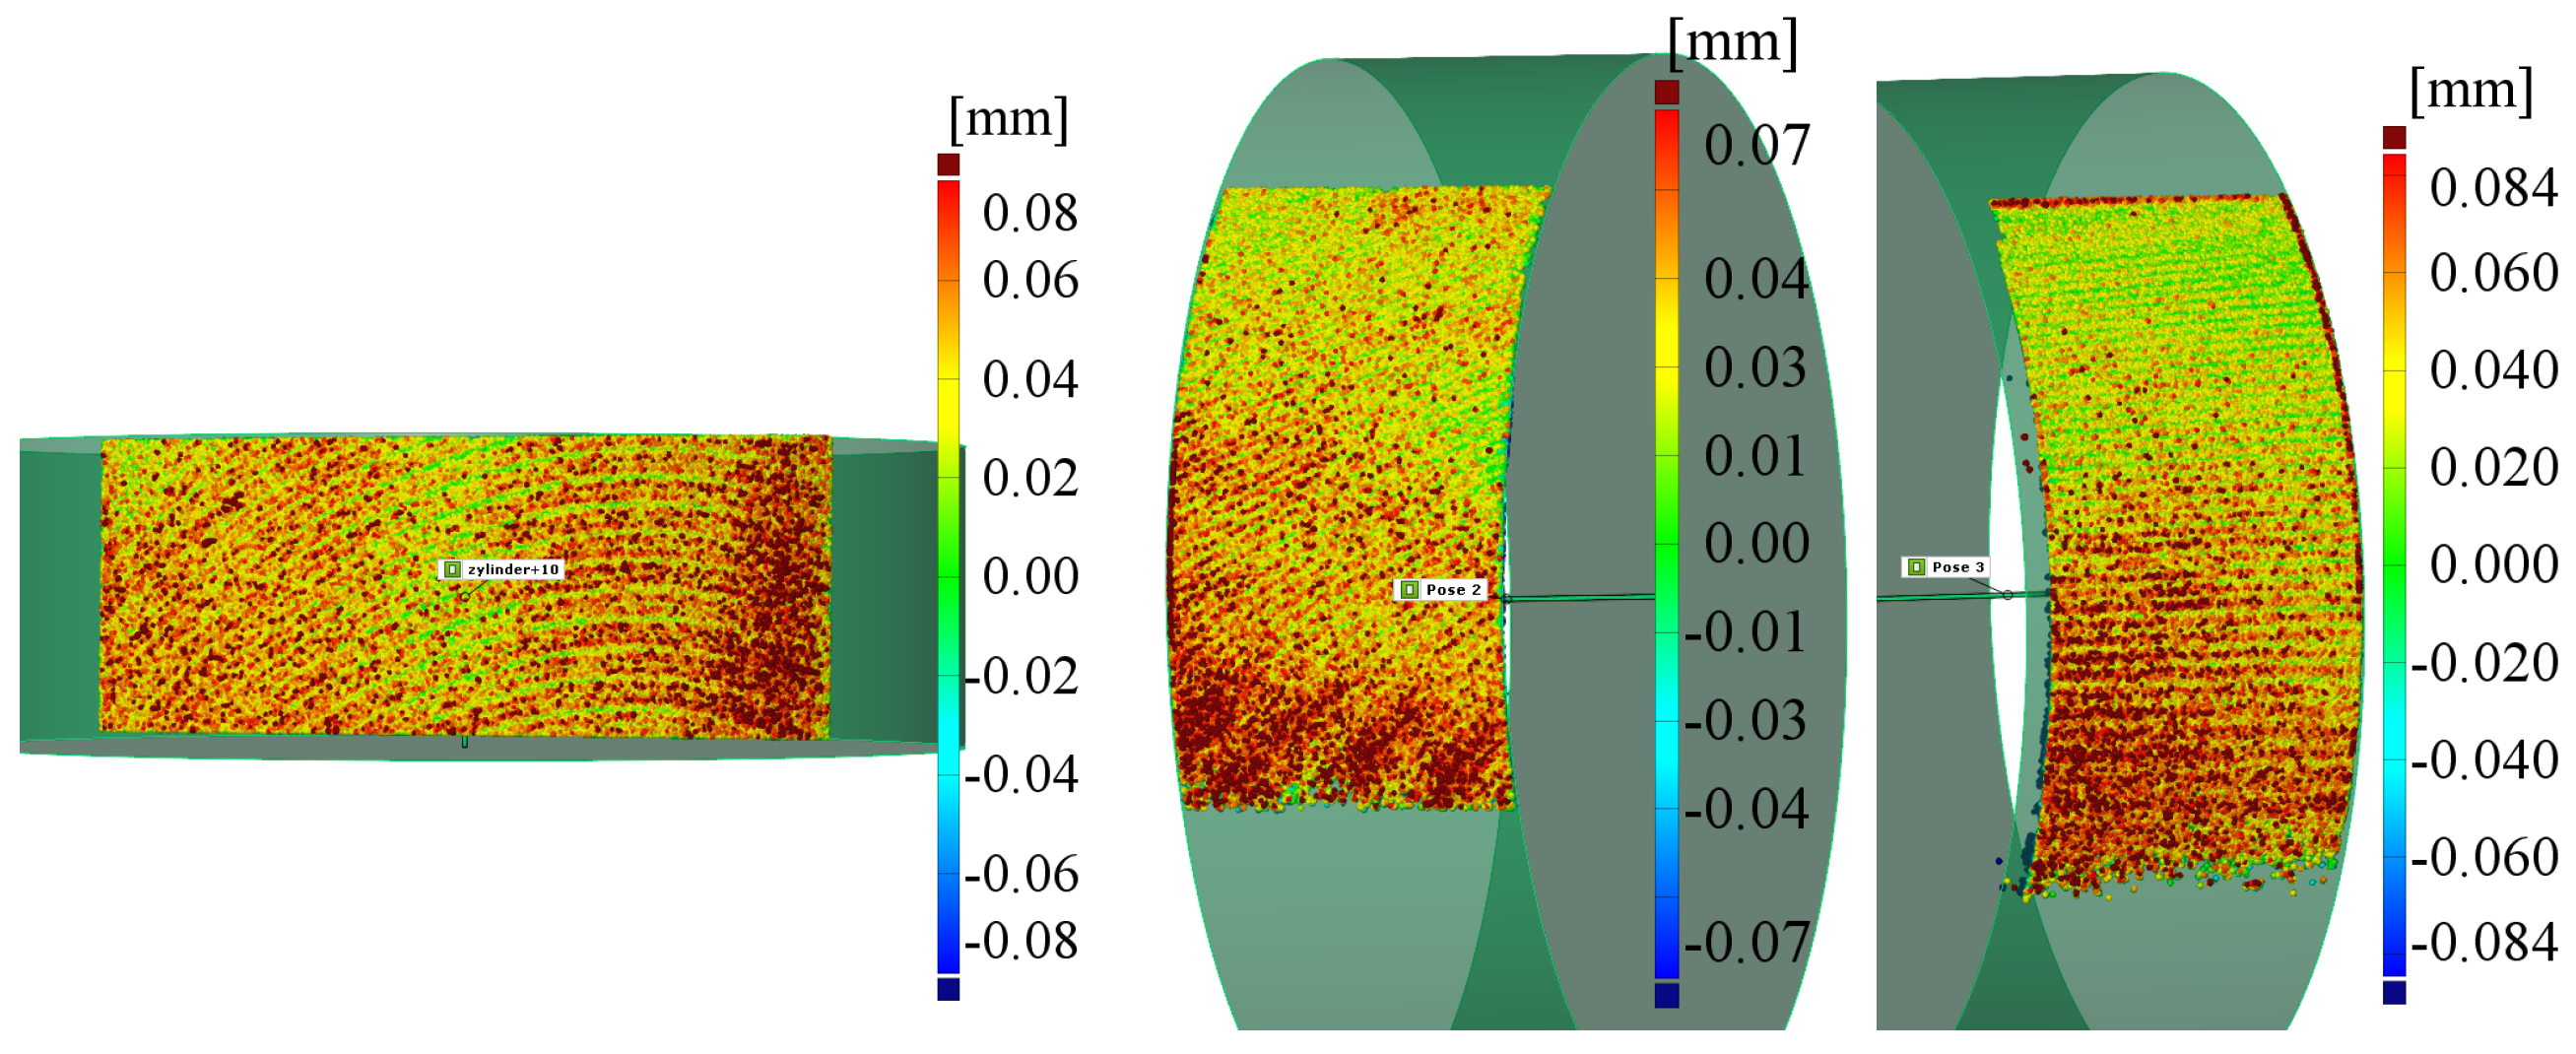
For the calibration and measurements, the projector has to project certain patterns. Those patterns are transferred to the Raspberry Pi with the xmlrpc protocol. Two major pattern types are used: calibration and sinusoidal waves. The first has the parameters size and density, the latter frequency, phase and undistortion parameters. The Raspberry Pi calculates the projector image according to the parameters. The images are undistorted prior to projection, so that the sinusoidal waves projected are already undistorted when reflected by the objects surface.
The measurement algorithm is based on the work of Peng [7]. The points on the objects surface are reconstructed using the triangulation principle. Projecting certain patterns allows us to link each camera pixel to a row or column of the projector. In this example the sinusoidal patterns are projected vertically, so that the row may be determined. The line of sight of each camera pixel and the corresponding plane of the projectors row are calculated. The surface point in 3D space is where both, the line and the point, intersect.
The row of the projector pixels is determined using arctan ( x y - 1 ) and a sine and a cosine pattern. Unfortunately the reflectivity and background illumination are unknown. A minimum of three patterns are used: A sinusoidal pattern with the wavelength equal to the projector image height and three phases, 0 , 90 and 180 . Those patterns lead to the following signals in the three camera images:
s 0 = h 0 + f 0 * sin ( ϕ ) ,
s 1 = h 0 + f 0 * cos ( ϕ ) ,
s 2 = h 0 - f 0 * sin ( ϕ ) ,
with the background illumination h 0 , the reflectivity of the surface f 0 and the projector image row φ. From these equation we derive
ϕ = arctan ( s 0 - s 0 + s 2 2 s 1 - s 0 - s 2 2 ) .
The tangens function is not injective so that the range of its inverse, arctan, is only a subset of the domain of the original funtion. Nevertheless the true quadrant of the result of arctan can be computed observing the signs of the nominator and the denominator of the argument.
Higher frequency patterns lead to an improved sensitivity of the phase signal and more precise measurements. Using more than one wave per pattern makes it necessary to identify each of the fringes. In practice, patterns with a low frequency are used for disambiguation and the highest frequency patterns are used for precise phase measurement. Additionally, using four instead of three phases is more robust towards a dynamic background illumination. The background illumination computed from one frequency, can be used with the other frequencies. In practice the following patterns are used: 1 wave with phases 0 and 90 degree (global disambiguation), 6 waves with 0 and 90 degree (another level of disambiguation) and 36 waves with 0, 90, 180 and 270 degree (best phase signal and background illumination).

3. Results

The measurement uncertainty was characterized following the GUM from the Joint Committee for Guides in Metrology. Four features on two contour standards have been measured: A gap with a depth of 1 m m and a convex cylinder with a radius of 1 m m on a standard from the company Alicona and two convex cylinders with a radius of 6 m m and 10 m m on a standard from the company Hommel. The standards have been calibrated with known uncertainties. Images of sample measurements can be seen in Figure 5 and Figure 6. The gap depth and the small cylinders radius have been measured 25 times from the exact same pose. The latter two cylinders radius has been measured in three different poses with 30 measurements each. Pose one is a top down view, with the cylinder axis being parallel to the image plane. For pose two and three the cylinder axis was rotated to have an angle of 70 and 110 in respect to the normal of the image plane.
The results can been seen in Table 1 and Table 2. The measurement system is capable of determining the depth of the gap with very high precision while the measured cylinder radius has a much higher error. Additionally one can see, that the pose has some major influence on the measurement quality. The results vary especially for the large cylinder.

4. Conclusions

The measurement system is capable of measuring in very limited space while it produces very good results. On the other hand side, it is relatively slow compared to fringe projection systems on the market. The camera is currently only capable of taking a few uncompressed images per second. So that a full measurement with eight images takes several seconds. The fringe projection system from Matthias [5] is faster because it uses an industrial camera, but is limited to a smaller resolution.
A huge advantage is the relative simple setup with off-the-shelf components. A key element is the 5 mega pixel micro camera which is currently only supported by the Raspberry Pi. The single board computer proved very handy for the generation of the projector patterns, controlling the projector and the camera and processing the images.
Future work will include an improved calibration technique, relying on common calibration standards and more sophisticates calibration patterns. The effect of gravitation on the borescope and the camera are currently under research. A better camera, like the Pi Camera Module v2 with the 8 megapixel Sony IMX219 sensor, will be used in a future setup.

Acknowledgments

We would like to thank the German Research Foundation (DFG) for funding this project within the Collaborate Research Center (SFB) 871 ”regeneration of complex capital goods” (http://www.sfb871.de).

Author Contributions

A.P. and E.R. conceived and designed the experiments; J.S. performed the experiments analyzed the data and wrote the paper; A.P. contributed analysis tools.

Conflicts of Interest

The authors declare no conflict of interest. The founding sponsors had no role in the design of the study; in the collection, analyses, or interpretation of data; in the writing of the manuscript, and in the decision to publish the results.

Abbreviations

The following abbreviations are used in this manuscript:
GUM
Guide to the expression of uncertainty in measurement
HDMI
High-definition multimedia interface
CSI
Camera serial interface
LED
Light emitting diode

References

  1. Kästner, M. Optische Geometrieüberprüfung präzisionsgeschmiedeter Hochleistungsbauteile. Ph.D Thesis, Leibniz Universität Hannover, Hannover, Germany, 2008. [Google Scholar]
  2. Chen, L.; Huang, C. Miniaturized 3D surface profilometer using digital fringe projection. Meas. Sci. Technol. 2005, 16, 1061. [Google Scholar] [CrossRef]
  3. Karlstorz, MULTIPOINT, webpage. Available online: https://www.karlstorz.com/be/en/neues-multipoint-mess-videoendoskop.htm (accessed on 20 June 2016).
  4. General Electric, XLG3, webpage. Available online: https://www.gemeasurement.com/download/xlg3-videoprobe-brochure (accessed on 20 June 2016).
  5. Matthias, S.; Loderer, A.; Koch, S.; Gröne, M.; Kästner, M.; Hübner, S.; Krimm, R.; Reithmeier, E.; Hausotte, T.; Behrens, B.-A. Metrological solutions for an adapted inspection of parts and tools of a sheet-bulk metal forming process. Product. Eng. 2016, 10, 51–61. [Google Scholar] [CrossRef]
  6. Zhang, Z. A flexible new technique for camera calibration. IEEE Trans. Pattern Anal. Mach. Intell. 2000, 22, 1330–1334. [Google Scholar] [CrossRef]
  7. Peng, T. Algorithms and Models for 3-D Shape Measurement Using Digital Fringe Projections. Ph.D Thesis, University of Maryland, College Park, MD, USA, 2006. [Google Scholar]
Figure 1. Signal plan for the measurement system.
Electronics 05 00043 g001
Figure 2. Rendering of the measurements system. The system is mounted on a goniometer. The following parts are labeled: (a) projector; (b) camera adapter; (c) Raspberry Pi 2; (d) borescope shaft; (e) camera (f) fields of view of the projector (green) and the camera (blue).
Electronics 05 00043 g002
Figure 3. Photograph of the measurement system from the top. The labels are consistent with Figure 2.
Electronics 05 00043 g003
Figure 4. Example sequence of fringe patterns. Three frequencies (waves per pattern) are used: 1, 6, 36. Only one pattern per frequency is shown.
Electronics 05 00043 g004
Figure 5. Distances of the sample measurements points to the nominal geometry of the gap (top left), the cylinder with radius 1 m m .
Electronics 05 00043 g005
Figure 6. Sample measurements of the cylinder with a radius of 10 m m in pose 1 (left), pose 2 (middle) and pose 3 (right).
Electronics 05 00043 g006
Table 1. Evaluation of a gap with a depth of 1 m m and the cylinder with a radius of 1 m m .
Gap with Depth 1 mm Cylinder with Radius 1 mm
calibrated value1000.5 ± 0.4 μ m 1001.5 ± 0.7 μ m
measured value992.6 ± 0.5 μ m 935.4 ± 1.1 μ m
deviation7.9 μ m 66.1 μ m
single point distance (σ)16.7 μ m 18.6 μ m
Table 2. Evaluation of two cylinders with a radius of 6 m m and 10 m m .
Cylinder with Radius 6 mm Cylinder with Radius 10 mm
calibrated value5994.0 ± 1.2 μ m 10002.1 ± 0.9 μ m
pose one
measured value6037.4 ± 1.6 μ m 9945.1 ± 1.1 μ m
deviation43.4 μ m 57.0 μ m
single point distance (σ)83.4 μ m 100.0 μ m
pose two
measured value5971.5 ± 4.4 μ m 9851.0 ± 4.0 μ m
deviation22.4 μ m 151.1 μ m
single point distance (σ)29.3 μ m 23.1 μ m
pose three
measured value5911.7 ± 2.8 μ m 9905.1 ± 4.3 μ m
deviation82.3 μ m 97.0 μ m
single point distance (σ)71.0 μ m 35.0 μ m

