
Local-Global Representation Enhancement for Multi-View Graph Clustering


1
Key Laboratory of Computational Intelligence and Chinese Information Processing of Ministry of Education, School of Computer and Information Technology, Shanxi University, Taiyuan 030006, China
2
School of Computer Science and Technology, Taiyuan University of Science and Technology, Taiyuan 030024, China
*
Author to whom correspondence should be addressed.
Electronics 2024, 13(9), 1788; https://doi.org/10.3390/electronics13091788
Submission received: 18 March 2024
/
Revised: 22 April 2024
/
Accepted: 30 April 2024
/
Published: 6 May 2024
(This article belongs to the Special Issue Advances in Intelligent Data Analysis and Its Applications, Volume II)
Abstract
:In recent years, multi-view graph clustering algorithms based on representations learning have received extensive attention. However, existing algorithms are still limited in two main aspects, first, most algorithms employ graph convolution networks to learn the local representations, but the presence of high-frequency noise in these representations limits the clustering performance. Second, in the process of constructing a global representation based on the local representations, most algorithms focus on the consistency of each view while ignoring complementarity, resulting in lower representation quality. To address the aforementioned issues, a local-global representation enhancement for multi-view graph clustering algorithm is proposed in this paper. First, the low-frequency signals in the local representations are enhanced by a low-pass graph encoder, which yields smoother and more suitable local representations for clustering. Second, by introducing an attention mechanism, the local embedded representations of each view can be weighted and fused to obtain a global representation. Finally, to enhance the quality of the global representation, it is jointly optimized using the neighborhood contrastive loss and reconstruction loss. The final clustering results are obtained by applying the k-means algorithm to the global representation. A wealth of experiments have validated the effectiveness and robustness of the proposed algorithm.
1. Introduction
Graph clustering, as a crucial task in graph analysis [1], aims to partition a graph into multiple clusters, ensuring that nodes within the same cluster exhibit similarities in terms of both graph topology and attribute values [2,3]. This process enables the identification of cohesive groups within the graph, facilitating various downstream tasks such as community detection, anomaly detection, and recommendation systems [4,5,6]. Various graph clustering algorithms have been applied in fields such as social recommendation, link prediction, citation network analysis, protein interaction analysis, and brain network analysis [7,8]. Most existing graph clustering algorithms focus on single-view graph data [9]. However, the graph data in practical applications are typically multi-relational. For instance, in biological networks, the interactions between proteins in some organisms may involve multiple interaction patterns among thousands of protein molecules, with each protein [10] having specific attribute information. In social networks [11], individuals may have different types of social relationships, such as friends, followers, and co-groups, with each individual possessing certain descriptive characteristics. In a transportation planning network, locations are abstracted as nodes, while different types of roads: subways, highways, railways, etc., are abstracted as sides of different views. By analyzing multi-view graph data, it helps to improve the understanding of the complexity of urban transportation systems, and can provide support for improving traffic mobility and safety [12]. In comparison to single-view graph data, multi-view graph data have a multi-layered topological structure and contain richer information, facilitating a more accurate detection of pattern structures within the network. For example, a social networking platform contains rich user behavioral data and interpersonal relationship information. By integrating multi-view graph clustering algorithms to merge user’s social connections, interests, and other attribute information, the social networking platform can more accurately discover connections between different groups, enabling more precise social circle recommendation services. By introducing more information about user backgrounds, interpersonal relationships, and other aspects, the platform can make product recommendations more targeted and adaptive. By comprehensively considering user behavioral data and rich interpersonal relationships, it is possible to identify potential fake accounts and fraudulent activities, further ensuring the security of the social networking platform. Therefore, multi-view graph clustering algorithms can leverage social information and user behavior patterns on the platform to provide users with more precise, intelligent, and secure services, thereby enhancing the user experience and stickiness of the social networking platform. However, there are both correlations and heterogeneity within the cluster structures contained in different views, which introduces new challenges to clustering tasks [13,14].
In recent years, the issue of multi-view graph clustering has attracted widespread attention from researchers, leading to the emergence of a series of related algorithms. These algorithms can be categorized into two types: graph clustering based on consensus graph learning and graph clustering based on representation learning. The former category attempts to learn a consensus graph by maximizing the consistency between different views. Subsequently, utilizing a traditional clustering algorithm, it derives the final clustering results [15,16]. However, clustering the consensus graph directly may result in the loss of specific information within each view. The latter category aims to integrate the attribute information of each node with the topological structure of the graph, while maximizing the preservation of information from multiple views. These algorithms map the data into a joint low-dimensional vector representation that can be used for clustering [17,18]. However, most algorithms have several limitations. For example, local representations that are constructed directly using a graph convolution network (GCN) are susceptible to high-frequency noise. Additionally, a global representation constructed from local representations of each view often only focuses on the consistency information of each view, effectively ignoring the complementary information [19].
To overcome these limitations, this paper describes a novel local-global representation enhancement for multi-view graph clustering (LGMGC) algorithm. This algorithm enhances low-frequency signals in the local representations through graph filtering, making them more suitable for clustering tasks. An attention mechanism is employed to allow the global representation to integrate information from various views, thus enhancing the connections between similar nodes in the global embedded representation and improving the clustering results. This enhances the attention towards complementary information within the global representation. Specifically, the graph data are encoded using a combination of low-pass graph filters and a multilayer perceptron (MLP). This encoding process enhances the low-frequency signals present in the local representations. The local representations from each view are then integrated into a global representation using the attention mechanism. The exploration of the topological characteristics of each view is strengthened through the reconstruction of the adjacency matrices, and the introduction of neighborhood contrastive regularization enhances the connectivity between nodes with similar attributes in the global representation, which clarifies the cluster structure. Finally, a traditional clustering algorithm is applied to the enhanced representation to obtain the final clustering results.
In summary, the contributions of this article can be outlined as follows:
- A new multi-view graph clustering algorithm via local-global representation enhancement is proposed. LGMGC enhances the local and global representations to obtain a more suitable representation for clustering.
- A simple and effective graph encoder that enhances the low-frequency signals to obtain a smoother representation is proposed.
- Comprehensive experimentation on three benchmark datasets illustrates the excellent performance of the proposed algorithm in comparison to existing deep graph clustering algorithms.
The paper is structured as follows: In Section 2, a review of related work on multi-view graph clustering is offered. In Section 3, the specific process of the proposed algorithm are thoroughly elucidated. In Section 4, we conducts an evaluation of the proposed algorithm, comparing it to existing algorithms. In Section 5, we conducted ablation experiments to verify the effectiveness of each component. In Section 6, we discussed the experimental results of the paper. In Section 7, we conclude this work and suggest the focus for future work.
2. Related Work
In this section, the related work on neighbor-based recommendation of collaborative filtering and attention mechanism is briefly reviewed.
2.1. Graph Clustering Based on Consensus Graph Learning
This category of algorithms aims to maximize the consistency between different views by learning a consensus graph. The final clustering result is obtained by applying graph partitioning or other spectral graph techniques to the consensus graph. These algorithms mainly consist of three steps: (1) preprocessing of multi-view data; (2) learning a consensus graph to maximize view consistency; and (3) clustering based on the learned consensus graph. Utilizing data information or prior knowledge to guide the learning of consensus graphs constitutes a crucial step. The self-weighted multi-view graph clustering (SwMC) algorithm initially generates a similarity matrix between nodes based on the features of each view, before maximizing the consistency of the similarity matrices across different views using a learning consensus graph approach. This algorithm leverages the Laplacian matrix of the constrained consensus graph to aid in clustering The most crucial step is how to utilize data information or prior knowledge to guide the learning of the consensus graph [20]. The multi-view attributed graph clustering (MvAGC) algorithm employs low-pass filters to smooth multiple views, and then simultaneously learns a consensus graph while generating anchor points [15]. Lin et al. [16] employs a learning consensus graph approach to maximize the consistency of smooth representations across different views. This optimizes the consensus graph structure through contrastive learning, ultimately achieving higher-quality clustering results. In this algorithm, contrastive learning brings similar nodes closer to each other and pushes dissimilar nodes apart. Thus, the consensus graph more accurately reflects the relationships between features in different views, resulting in more precise clustering. Lin et al. [21] employ low-pass filters to achieve smooth representations. Subsequently, they aim to maximize the consistency of these representations across various views while also exploring the consistency of high-order topological structure information within each view. Liu et al. [22] applied standard network embedding methods to process merged graphs or individual layers, without leveraging interlayer interactions, aiming to construct a vector space for information from multiple views. Robust multi-view spectral clustering via low-rank and sparse decomposition(RMSC) incorporate elements of low-rank and sparse decomposition. Initially, its construct a transition probability matrix from each individual view. Subsequently, these matrices are utilized to reconstruct a shared low-rank transition probability matrix, serving as a critical input for the standard Markov chain method used in clustering [23]. Fettal et al. uses a simple linear model to simultaneously accomplish clustering and representation learning [24]. These algorithms demonstrate the effectiveness of learning consensus graphs for analyzing multi-view graph data. The learning of consensus graphs reveals hidden relationships and common features between different views. However, directly partitioning the consensus graph may overlook specific information present in individual views.
2.2. Graph Clustering Based on Representation Learning
This category of algorithms learns a compact representation of nodes from multi-view graph data, and then applies clustering to the compact representation. Such algorithms can generally be divided into three steps: (1) the extraction of a compact representation of multiple views using graph embedding techniques; (2) the imposition of external constraints, such as adding corresponding regularization terms to the loss function, which ensures that the representation is more suitable for clustering; and (3) the application of traditional algorithms to the compact low-dimensional representation to obtain clustering results. The purpose of a graph auto-encoder (GAE) is to reconstitute graph by taking node features as input, compressing them into a low-dimensional representation, and reconstructing the resulting graph, followed by k-means clustering on the low-dimensional representation. While GAE serves as the cornerstone of this approach, its limitation lies in its capability to handle only single-view graph data and its inefficiency when dealing with large-scale graph data [25]. Tang et al. [26] introduces an edge sampling algorithm to enhance the effectiveness and efficiency of inference. The one2multi graph autoencoder for multi-view graph clustering (O2MAC) algorithm reconstructs the remaining views by selecting an informative view from among the multiple available views, thereby learning the node embedding. Simultaneously, the O2MAC algorithm uses self-training clustering objectives to make the representation more suitable for clustering. Finally, clustering is performed based on the learned embeddings [17]. Cai et al. [18] extracts representations of both global and local information using autoencoders, and combines different features based on their importance through adaptive weight learning algorithms. Xia et al. [27] uses graph autoencoders to extract representations of each view, before applying block-diagonal representation constraints to better explore the clustering structure. The learned clustering labels are then used to guide the learning of node representations and coeffcient matrices, which are subsequently used for clustering. Cheng et al. [28] uses a dual-path encoder to capture consistency information across different views. The first path extracts node representations, while the second path employs a consistency embedding encoder to capture the consistency of geometric relationships and probability distributions among different views. Ultimately, The resulting clustering is based on the representations learned by the consistency embedding encoder. The powerful representation learning capability of graph neural networks enables representation learning-based algorithms to explore deeper information within graph data. However, when constructing global representations based on the local embeddings of each view, they often only focus on the consistency information among views, while ignoring complementary information.
3. Proposed Algorithm
In this section, we first present some notation and definitions, and then describe the proposed algorithm in detail.
3.1. Notation and Preliminaries
A multi-view graph can be represented as , where is the set of n nodes, and M sets of edges describe the interaction between nodes in the corresponding M views. represents a linkage between nodes i and j in the m-th view. These M interaction types can also be described by adjacency matrices , where if and otherwise. is the node feature matrix, is the feature vector of , and represents the degree matrix of the graph under the m-th view. and represent the normalized adjacency matrix and symmetric normalized Laplacian matrix for the m-th view, respectively.
The objective of multi-view graph clustering is to divide the nodes in into c clusters . The nodes in the same cluster are similar in topology and attributes, while the nodes in different clusters are quite different.
3.2. Framework of Multi-View Graph Clustering via Local-Global Representation Enhancement
The framework of the proposed algorithm, as illustrated in Figure 1, consists of three main modules: local representation generation and enhancement, global representation generation, and global representation enhancement.
3.3. Local Representation Generation and Enhancement
The purpose of this module is to generate local representations for each view while enhancing the low-frequency signals within these representations. This process is accomplished through multiple graph encoders consisting of two inputs: and .
First of all, we will explain the reasons for choosing low frequency signals. The symmetric regularized Laplace matrix can be eigen-decomposed into where, , is the eigenvalue, is the corresponding orthogonal eigenvector. The eigenvalues can be considered as frequencies, and the corresponding eigenvectors can be considered as Fourier bases. The smoothness of can be reflected by .
As can be seen from Equation (1), the smaller the eigenvalue, the smoother the base signal. This means that the attribute components corresponding to smaller eigenvalues in the graph data have less difference between neighboring nodes, that is, the attributes of neighboring nodes are more similar. Therefore, the smaller the eigenvector corresponding to the eigenvalue is more conducive to the formation of cluster structure, which indicates that the graph signal required by the clustering task should contain a larger proportion of low-frequency base signals. Meanwhile, the effectiveness of GCN does not stem from non-linear feature extraction, but from aggregating features from neighboring nodes. The layering of multiple GCNs may lead to intertwining weight matrices, consequently diminishing the quality of representation learning.
Thus, the module is divided into two steps: neighbor aggregation and linear embedding. In the neighbor aggregation step, a low-pass graph filter is used to aggregate neighbor information, which enhances the low-frequency signals in the attributes, resulting in a smoothed representation that is more suitable for downstream clustering tasks. The process of filtering can be described as follows:
where, denotes the smoothed representation of the m-th view after filtering, and k denotes the number of layers in the graph filters. In the linear embedding step, is embedded into a low-dimensional space by the MLP encoders without an activation function, The local embedding representation of the m-th view is obtained as follows:
where, and are the learnable parameters of the encoder for the m-th view. Through the low-pass graph encoder, high-frequency noise in attributes is filtered out, the entanglement of weight matrix is avoided, the quality of representation is enhanced, and the clustering performance is improved (See Section 5.4).
3.4. Global Representation Generation
The objective of this module is to fuse the local representations from each view, thus obtaining a global representation that incorporates information from all views:
However, the quality of the views in multi-view graph data varies. If only high-quality views are selected for clustering, the global embedding representation would lose information from the remaining views. Conversely, treating all views equally would allow lower-quality views to adversely impact clustering results. To effectively combine complementary information from multi-view graph data and mitigate the influence of lower-quality views on clustering outcomes, distinct weights are assigned to each view through a self-supervised strategy.
In Section 3.5, the clustering structure in the global representation is enhanced by neighborhood contrast loss. Consequently, it can be argued that when the clustering result of the local representation of a view is closer to the clustering result of the global representation, the clustering quality of the view is higher and the view quality is better. During the training process, attention mechanisms are utilized to allocate respective weights to each view based on the similarity between the local and global clustering results for different views.
Specifically, the global representation is input into the k-means clustering algorithm to generate pseudo-labels P. Using the same algorithm, predicted labels are also obtained for each view. These pseudo-labels P serve as the ground truth, while the predicted labels are considered as the results for calculating the clustering score (such as normalized mutual information), denoted as i.e., . The weight assigned to the m-th view is calculated according to the following formula:
By Equation (5), Greater weight is assigned to views that are more similar to the clustering result of the global representation. Then normalize the weights of each view.
Therefore, the fusion representation based on the attention mechanism is constructed as follows:
In contrast to traditional data, the primary information in graph data is embedded within its topology. For example, different views of the same group of nodes contain both consistent parts (consistency information) and distinct parts (highlighting complementary information) in their respective topological relationships. Through the introduction of an attention mechanism into the iterative training involving reconstruction loss and neighborhood contrast loss, the global representation can effectively assimilate information from each view while emphasizing the greater impact of views exhibiting more prominent clustering structures. This approach efficiently balances the complementary insights across varying perspectives, maximizing the advantages of multi-perspective learning.
3.5. Global Representation Enhancement
This module optimizes the global representation by exploring the topological and attribute information from multiple views while strengthening the connections between similar nodes in . This process clarifies the cluster structure in .
The exploration of topological and attribute information from each view is accomplished through the reconstruction of the adjacency matrix. To comprehensively integrate information of each view into the global representation, is used to reconstruct the adjacency matrix :
where, denotes the sigmoid activation function. The reconstruction loss is then computed as follows to capture the information of the m-th view.
Considering the variations in quality among different views, the weights acquired from Equations (5) and (6) are integrated into the loss function. Thus, the overall reconstruction loss function is defined as follows
The optimized global representation effectively captures both the consensus information and individual characteristics from views in the graph data. To enhance the connections between similar nodes and highlight the cluster structure in the global embedding representation, the neighborhood contrastive loss algorithm is introduced.
In terms of attributes and topology, nodes within the same cluster are similar, while nodes between different clusters have significant differences. in order to better highlight the cluster structure in the global representation, contrastive learning can be used to push similar node representations closer together, while pushing others away.
Specifically, for the given node representation , the top-K similar nodes to are calculated by KNN algorithm, and these nodes form a positive pair with , and the remaining nodes form a negative pair. The neighborhood contrastive loss is as follows:
where the pair-wise similarity sim() is measured by the cosine similarity. is a set consisting of the indices of the K samples obtained by applying the KNN to .
By minimizing Equation (11), similar samples are pushed closer together while dissimilar samples are pushed father apart. The objective of this minimization is to enhance the discrimination between samples in the global representation.
Combining Equations (10) and (11), our model optimizes the following loss function:
where, is a hyper-parameter used for balancing and . To optimize this objective function, we employ the Adam optimizer. The complete procedures is outlined in Algorithm 1.
| Algorithm 1 LGMGC |
|
4. Experiments
Benchmark datasets, baseline algorithms, evaluation metrics, and parameter settings are introduced in this section.
4.1. Datasets
For our experiments, three widely used real-world datasets, namely ACM (http://dl.acm.org (accessed on 17 November 2023)), DBLP (https://dblp.uni-trier.de/ (accessed on 17 November 2023)), and IMDB (https://www.imdb.com/ (accessed on 17 November 2023)), are used to evaluate our algorithm. Detailed statistics are presented in Table 1.
ACM: This dataset is generated from information about ACM publications. The nodes in this datasets represent the paper. There are two types of relationships between nodes and each type of relationship corresponds to a view. The nodes features are the elements of a bag-of-words of keywords. According to the research field of the paper, it can be divided into three categories.
DBLP: This dataset contains information that describes the author’s network. The nodes in this dataset represent the authors. There are three types of relationships between nodes, each relationship corresponding to a view. The nodes features are elements of a set of keyword words. According to the research field of the author, it can be divided into four categories.
IMDB: This dataset contains information on a movie network. The nodes in this dataset represent the movie. There are two types of relationships between movie, each relationship corresponding to a view. The nodes features are elements of a set of keyword words. According to the theme of the movie, it can be divided into three categories.
4.2. Baseline Algorithms and Evaluation Metrics
In the pursuit of validating the effectiveness of the proposed algorithm, we undertake a comparative analysis against eight baseline algorithms. These algorithms include single-view algorithms GAE [25], large-scale information network embedding (LINE) [26], traditional multi-view algorithms Principled multilayer network embedding (PMNE) [22], RMSC [23], SwMC [20], multi-view graph clustering based on representation O2MAC [17], and multi-view graph clustering based on consensus graph learning MvAGC [15], and multi-view attributed graph clustering(MAGC) [21], and simultaneous linear multi-view attributed graph representation learning and clustering(LMGEC) [24]. A brief introduction to these algorithms is provided below:
- (1)
- GAE is a single view algorithm that uses graph autoencoders to generate embedded representations. this algorithm is applied to each graph view and the best results are reported.
- (2)
- LINE is a single view graph clustering algorithm applied to large-scale graph data. this algorithm is applied to each graph view and the best results are reported.
- (3)
- PMNE projects multi-view graph in to a representative vector space.
- (4)
- RMSC is a multi-view clustering algorithm designed to address noise in input data.
- (5)
- SwMC implements clustering multi-view data while learning weights of each view.
- (6)
- O2MAC learns node embedding by reconstructing entire view with the most information-rich information view.
- (7)
- MvAGC is a multi-view graph clustering algorithm that performs graph filtering to achieve multi-view attributed graph clustering.
- (8)
- MAGC is a multi-view graph clustering method using node attributes and exploring higher-order graph structure information.
- (9)
- LMGEC uses a simple linear model to simultaneously accomplish clustering and representation learning.
To assess the quality of the clustering results, we employ four metrics: clustering accuracy (ACC), normalized mutual information (NMI), adjusted Rand index (ARI), and clustering F1-score (F1).
4.3. Parameter Settings
The hyper-parameters of LGMGC are set as follows: learning rate , maximum number of iterations epochs = 200, number of layers in MLP layers = 1, output dimension of MLP dimension = 512, and number of graph filtering layers . For ACM DBLP and IMDB, the balancing hyper-parameters . For O2MAC, MvAGC and LMGEC, we use original codes. To ensure fairness in comparison, we use the default hyper-parameters settings reported in the original papers. GAE uses same structure as the encoder in O2MAC. Each set of experiments is run ten times, and the average results are reported.
4.4. Experimental Results of Different Algorithms
In this subsection, we present and analyze the results of our experiments.
To evaluate the effectiveness of our LGMGC in multi-view graph clustering tasks, we compare it with nine baseline algorithms on three datasets. Table 2 lists the results. The best results are highlighted in bold. As can be seen, LGMGC performs the best on ACM and DBLP in terms of ACC, NMI, ARI, and F1. For the accuracy (ACC) metrics, the LGMGC model has shown average improvements of 18.59%, 6.74%, and 10.87% on the ACM, DBLP, and IMDB datasets, respectively, compared to existing models. Single-view algorithms such as GAE and LINE do not perform well with multi-view graph data because they cannot leverage information from additional views. LGMGC significantly outperforms other traditional multi-view clustering algorithms, such as PMNE, RMSC, and SwMC. Although these algorithms consider all views, they fail to explore both attribute and topological information. PMNE and SwMC can only explore topological information, whereas RMSC can only leverage attribute information. In contrast, our algorithm effectively uses both topological and attribute information through the graph encoder. Our algorithm performs significantly better than O2MAC across all three datasets. This is because O2MAC solely considers the optimal view and disregards information from the remaining views. Compared with the consensus graph learning algorithms MvAGC, MAGC and LMGEC, the proposed algorithm achieves better performance. This is the result of MvAGC, MAGC and LMGEC relying on learned consensus graphs for clustering, which may lead to the omission of specific information from each view. In particular, the clustering performance of LGMGC on IMDB is inferior to MAGC. The main reason is that each view edge and attribute of IMDB data set are sparse, and the attribute information and topology information in the representation learned by low-pass filter are less.
5. Ablation Study
5.1. Effect of Multi-View Learning
In order to verify the effectiveness of the multi-view learning of LGMGC, The single view of each datasets is entered separately and the results are report in Table 3. It can be seen that the clustering performance of the individual view is always inferior to the consensus. In addition, the clustering performance of different views in the same dataset varies. This validates the effectiveness of multi-view learning in our algorithm.
5.2. Effect of Reconstruction Loss
By minimizing the reconstruction loss, our algorithm maximizes the preservation of topological information from each view in the fused embedding. In order to verify the effectiveness of the reconstruction loss in LGMGC, the clustering results without the reconstruction loss are reported in Table 4. It can be seen that the addition of reconstruction loss achieves clustering performance improvements. These results verify that LGMGC benefits from the reconstruction loss.
5.3. Effect of Neighborhood Contrastive Loss
By minimizing the contrastive loss, our algorithm pulls similar nodes closer and pushes dissimilar nodes further, which could highlight the cluster structure in the global representation.we report the clustering performance without the neighborhood contrastive loss in Table 5. On all datasets, the performance drops sharply without the contrastive loss. LGMGC achieves ACC improvements of 2.7%, 1.0%, and 6.53% on the DBLP, ACM, and IMDB datasets, respectively. Regarding the other metrics, the neighborhood contrastive loss significantly enhances the performance. The experimental results in Table 5 provide strong evidence for the effectiveness of the neighborhood contrastive loss in our proposed model.
5.4. Effect of Graph Encoder
The graph encoder proposed in this paper enhances the low-frequency signals of the local embedding representations in each view, and alleviates the problem of over-smoothing. To validate the effectiveness of the graph encoder, we replaced the original encoder with a GCN and compared the performance of the two models while varying the number of network layers. To ensure a fair comparison, the GCN was applied with the same parameters as the encoder and did not use any activation function. Figure 2 shows the clustering performance of the two models for different numbers of network layers. In most cases, the proposed graph encoder outperforms the GCN. Additionally, as the number of layers increases, the performance of the GCN decreases, while that of the graph encoder remains relatively stable. The reason for this phenomenon may be the trouble caused by redundant weight matrices in GCN.
5.5. Parameter Analysis
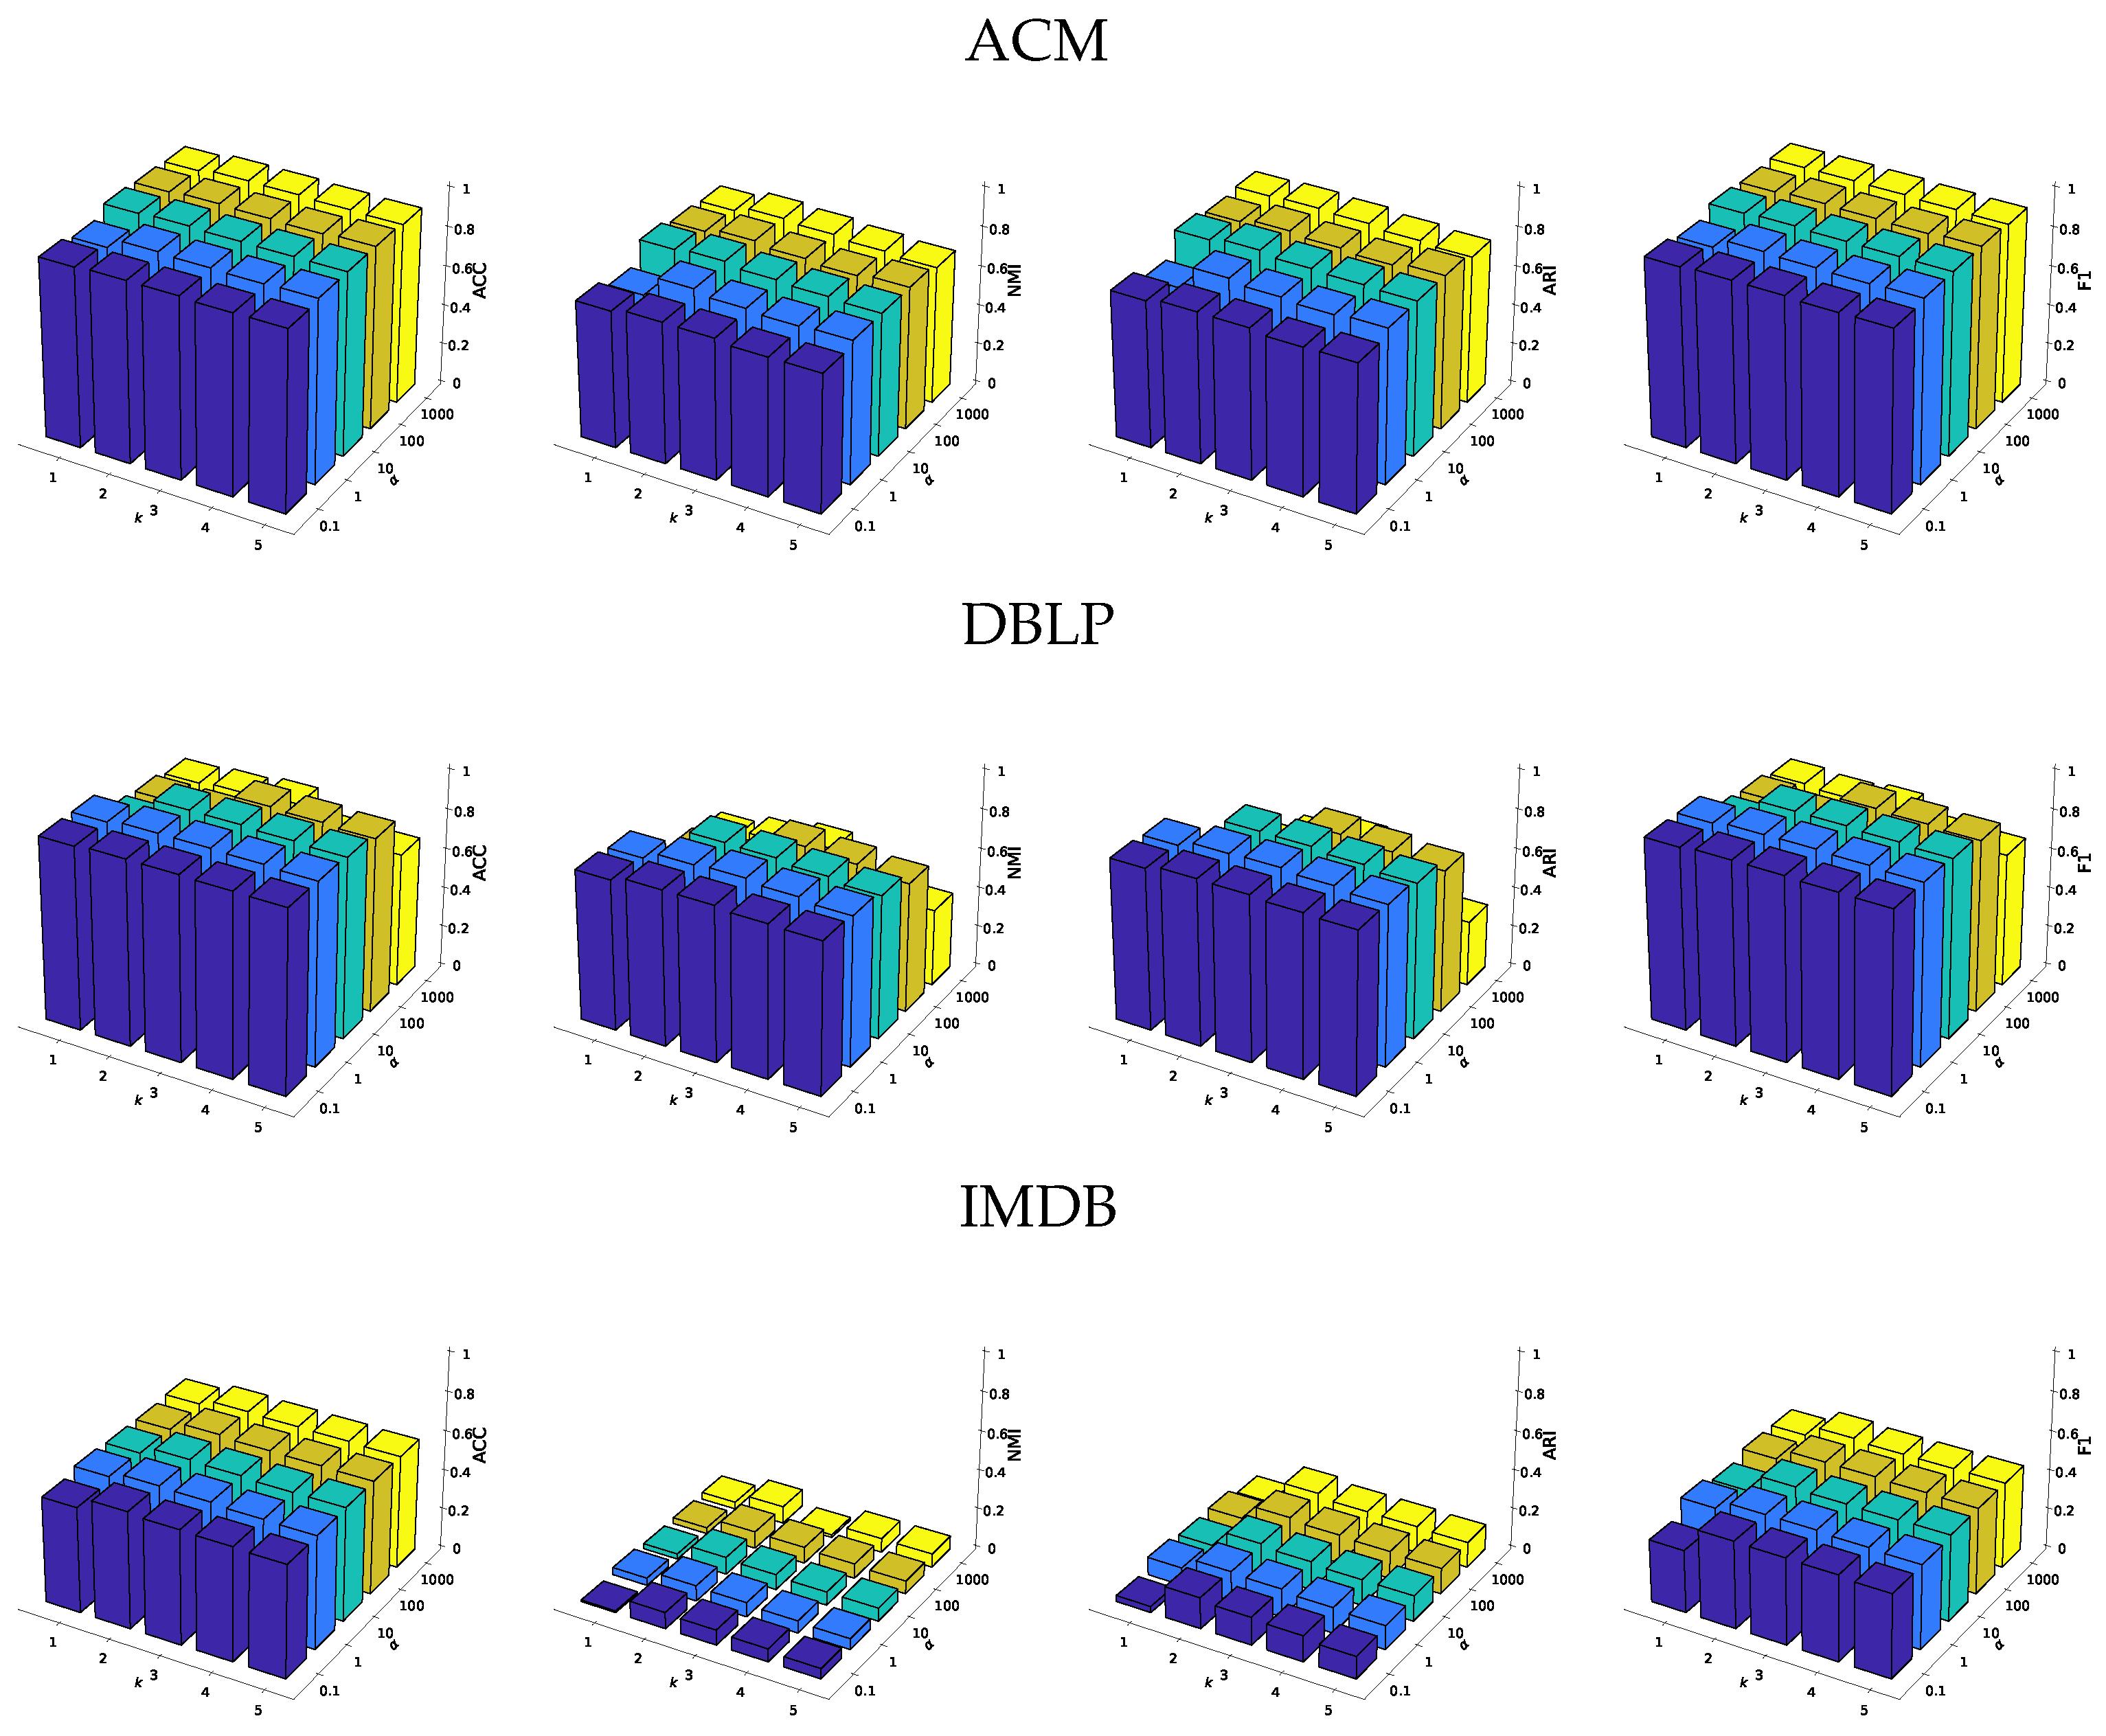
We briefly analyze the impact of parameters k and on the clustering performance to evaluate the stability of LGMGC. The clustering results using parameter settings of and are shown in Figure 3. It can be observed that with a fixed k, the algorithm achieves great clustering performance on all three datasets when the balance parameter is set to 10. However, when is too large, there is a significant decline in clustering performance on the dense DBLP dataset. On the other hand, when the balance parameter is too small, there is a noticeable decrease in clustering performance on the sparse IMDB dataset. When the balance parameter is fixed, both excessively small and large numbers of filter layers lead to unfavorable clustering results. The reason for this phenomenon is that the small k leads encoder fails to capture higher-order topological information, while an excessive number of filter layers leads to over-smoothing, rendering the nodes indistinguishable.
6. Discussion
We have developed a method for multi-view graph clustering that enhances the clustering performance by improving both local and global representations. In contrast to previous approaches that utilized traditional GCN with a single graph filter, our algorithm introduces a new encoder. This encoder is a combination of graph filters and MLP, which enables the amplification of local representations while extracting deeper-level information between data points during the construction of local representations. Additionally, a joint loss function was designed to enhance the clustering quality of global representations. Experimental results demonstrate that compared to existing algorithms, our model achieves superior performance in multi-view graph clustering tasks. This indicates the meaningful improvement in clustering effectiveness through the enhancement of both local and global representations. The proposed algorithm plays a crucial role in exploring community structures in multi-view graph data. This research can aid in capturing the complex relationships within and between communities in multi-view graph data from various perspectives. A single data source might not fully reveal the community structure, while combining multiple data sources can provide a more comprehensive and accurate description of the communities. In the analysis of social networks, companies can take into account multiple types of relationships between users to obtain more accurate and comprehensive community structures. For example, in the analysis of social networks, companies can comprehensively consider multiple types of relationships between users to uncover more accurate and comprehensive community structures. Furthermore, during the analysis of citation networks, it becomes possible to better identify relevant patterns and structures that may have been overlooked or difficult to perceive. This contributes to the elucidation of potential research topics, scholarly communities, and other aspects within a specific field. During the analysis of citation networks, it allows for a better identification of potentially overlooked or hard-to-perceive patterns and structures. This enhanced recognition enables researchers to uncover relevant relationships and structures that may have gone unnoticed using traditional analysis methods.
7. Conclusions and Future Work
In this paper, we propose a multi-view graph clustering model, which optimizes the representation from local and global perspectives within a unified framework to develop a more clustering-suitable representation. The proposed algorithm’s effectiveness is validated through experiments on real-world multi-view graph data. A potential limitation is the high computational cost on large-scale nodes. One of our hypotheses is that in the contrast loss function, we can greatly reduce the time complexity by selecting representative anchor points instead of all nodes to participate in the training. The methods of choosing a representative anchor point will become the focus of our future work.
Author Contributions
Conceptualization, X.Z.; methodology, X.Z. and Z.H.; software, Z.H.; investigation, J.W.; writing—original draft preparation, writing—review and editing, X.Z.; supervision, J.W. All authors have read and agreed to the published version of the manuscript.
Funding
This work was supported by the National Natural Science Foundation of China (Nos. 62072293 and 62306205), and the 1331 Engineering Project of Shanxi Province, China.
Data Availability Statement
The datasets used for this work can be found ACM (http://dl.acm.org (accessed on 17 November 2023)), DBLP (https://dblp.uni-trier.de/ (accessed on 17 November 2023)), and IMDB (https://www.imdb.com/ (accessed on 17 November 2023)).
Conflicts of Interest
The authors declare no conflict of interest.
References
- Yang, H.; Wang, J.; Duan, R.; Yan, C. DCOM-GNN: A Deep Clustering Optimization Method for Graph Neural Networks. Knowl.-Based Syst. 2023, 279, 110961. [Google Scholar] [CrossRef]
- Hu, D.; Feng, D.; Xie, Y. EGC: A novel event-oriented graph clustering framework for social media text. Inf. Process. Manag. 2022, 59, 103059. [Google Scholar] [CrossRef]
- Yu, J.; Jia, A.L. MLGAL: Multi-level Label Graph Adaptive Learning for node clustering in the attributed graph. Knowl.-Based Syst. 2023, 278, 110876. [Google Scholar] [CrossRef]
- Guo, Y.; Zang, Z.; Gao, H.; Xu, X.; Wang, R.; Liu, L.; Li, J. Unsupervised social event detection via hybrid graph contrastive learning and reinforced incremental clustering. Knowl.-Based Syst. 2024, 284, 111225. [Google Scholar] [CrossRef]
- Guo, H.; Zhou, Z.; Zhao, D.; Gaaloul, W. EGNN: Energy-efficient anomaly detection for IoT multivariate time series data using graph neural network. Future Gener. Comput. Syst. 2024, 151, 45–56. [Google Scholar] [CrossRef]
- Zhao, S.; Zheng, Y.; Li, J.; Zhang, X.; Tang, C.; Tan, Z. Pure kernel graph fusion tensor subspace clustering under non-negative matrix factorization framework. Inf. Process. Manag. 2024, 61, 103603. [Google Scholar] [CrossRef]
- Li, X.; Sun, L.; Ling, M.; Peng, Y. A survey of graph neural network based recommendation in social networks. Neural Comput. 2023, 549, 126441. [Google Scholar] [CrossRef]
- Mohamed, H.A.; Pilutti, D.; James, S.; Del Bue, A.; Pelillo, M.; Vascon, S. Locality-aware subgraphs for inductive link prediction in knowledge graphs. Pattern Recognit. Lett 2023, 167, 90–97. [Google Scholar] [CrossRef]
- Liao, H.; Hu, J.; Li, T.; Du, S.; Peng, B. Deep linear graph attention model for attributed graph clustering. Knowl.-Based Syst. 2022, 246, 108665. [Google Scholar] [CrossRef]
- Berahmand, K.; Nasiri, E.; Pir mohammadiani, R.; Li, Y. Spectral clustering on protein-protein interaction networks via constructing affinity matrix using attributed graph embedding. Comput. Biol. Med. 2021, 138, 104933. [Google Scholar] [CrossRef] [PubMed]
- Xia, Y.; Xu, Q.; Fang, J.; Tang, R.; Du, P. Bipartite graph-based community-to-community matching in local energy market considering socially networked prosumers. Appl. Energy 2024, 353, 122245. [Google Scholar] [CrossRef]
- Hu, Z.; Deng, J.; Han, J.; Yuan, K. Review on application of graph neural network in traffic prediction. J. Traffic Transp. Eng. 2023, 23, 39–61. [Google Scholar]
- Liu, L.; Kang, Z.; Ruan, J.; He, X. Multilayer graph contrastive clustering network. Inf. Sci 2022, 613, 256–267. [Google Scholar] [CrossRef]
- Wang, R.; Li, L.; Tao, X.; Wang, P.; Liu, P. Contrastive and attentive graph learning for multi-view clustering. Inf. Process. Manag. 2022, 59, 102967. [Google Scholar] [CrossRef]
- Lin, Z.; Kang, Z. Graph Filter-based Multi-view Attributed Graph Clustering. In Proceedings of the IJCAI, Virtual, 19–27 August 2021; pp. 2723–2729. [Google Scholar]
- Pan, E.; Kang, Z. Multi-view contrastive graph clustering. In Proceedings of the NeurIPS, Virtual, 6–14 December 2021; pp. 2148–2159. [Google Scholar]
- Fan, S.; Wang, X.; Shi, C.; Lu, E.; Lin, K.; Wang, B. One2Multi graph autoencoder for multi-view graph clustering. In Proceedings of the WWW’20, Taipei, China, 20–24 April 2020; pp. 3070–3076. [Google Scholar]
- Cai, E.; Huang, J.; Huang, B.; Xu, S.; Zhu, J. Grae: Graph recurrent autoencoder for multi-view graph clustering. In Proceedings of the ACAI, Sanya, China, 22–24 December 2021; pp. 1–9. [Google Scholar]
- Liang, J.; Liu, X.; Bai, L.; Cao, F.; Wang, D. Incomplete multi-view clustering via local and global co-regularization. Sci. China Inf. Sci. 2022, 65, 152105. [Google Scholar] [CrossRef]
- Nie, F.; Li, J.; Li, X. Self-weighted multiview clustering with multiple graphs. In Proceedings of the 26th IJCAI, Melbourne, Australia, 19–25 August 2017; pp. 2564–2570. [Google Scholar]
- Lin, Z.; Kang, Z.; Zhang, L.; Tian, L. Multi-view Attributed Graph Clustering. IEEE Trans. Knowl. Data Eng. 2023, 35, 1872–1880. [Google Scholar] [CrossRef]
- Liu, W.; Chen, P.; Yeung, S. Principled Multilayer Network Embedding. In Proceedings of the ICDM, New Orleans, LA, USA, 18–21 November 2017; pp. 134–141. [Google Scholar]
- Xia, R.; Pan, Y.; Du, L. Robust Multi-view Spectral Clustering via Low-rank and Sparse Decomposition. In Proceedings of the AAAI, Québec City, QC, Canada, 27–31 July 2014; pp. 2149–2155. [Google Scholar]
- Fettal, C.; Labiod, L.; Nadif, M. Simultaneous Linear Multi-View Attributed Graph Representation Learning and Clustering. In Proceedings of the WSDM, Singapore, 27 February–3 March 2023; pp. 303–311. [Google Scholar]
- Kipf, T.; Welling, M. Variational Graph Auto-Encoders. arXiv 2016, arXiv:1611.07308. [Google Scholar]
- Tang, J.; Qu, M.; Wang, M.; Zhang, Y.; Yan, J.; Mei, Q. LINE: Large-scale Information Network Embedding. In Proceedings of the ICONIP, San Diego, CA, USA, 7–9 May 2015; pp. 1067–1077. [Google Scholar]
- Xia, W.; Wang, S.; Yang, M.; Gao, Q.; Han, J.; Gao, X. Multi-view graph embedding clustering network: Joint self-supervision and block diagonal representation. Neural Netw. 2022, 145, 1–9. [Google Scholar] [CrossRef] [PubMed]
- Cheng, J.; Wang, Q.; Tao, Z.; Xie, D.; Gao, Q. Multi-view attribute graph convolution networks for clustering. In Proceedings of the IJCAI, Virtual, 19–27 August 2021; pp. 2973–2979. [Google Scholar]
Figure 1.
Illustration of LGMGC. In the local representation generation module, low-pass graph filtering combined with MLP is used to enhance the low-frequency signals of each view’s representation. In the global representation generation module, an attention mechanism is employed to fuse the representations of various views, resulting in a global representation that captures both consensus information and view-specific information. In the global enhancement module, topological information of each view is explored by reconstructing the adjacency matrix. Additionally, nodes with similar topological structures and properties are pulled together while dissimilar nodes are pushed farther apart via neighborhood contrastive loss.
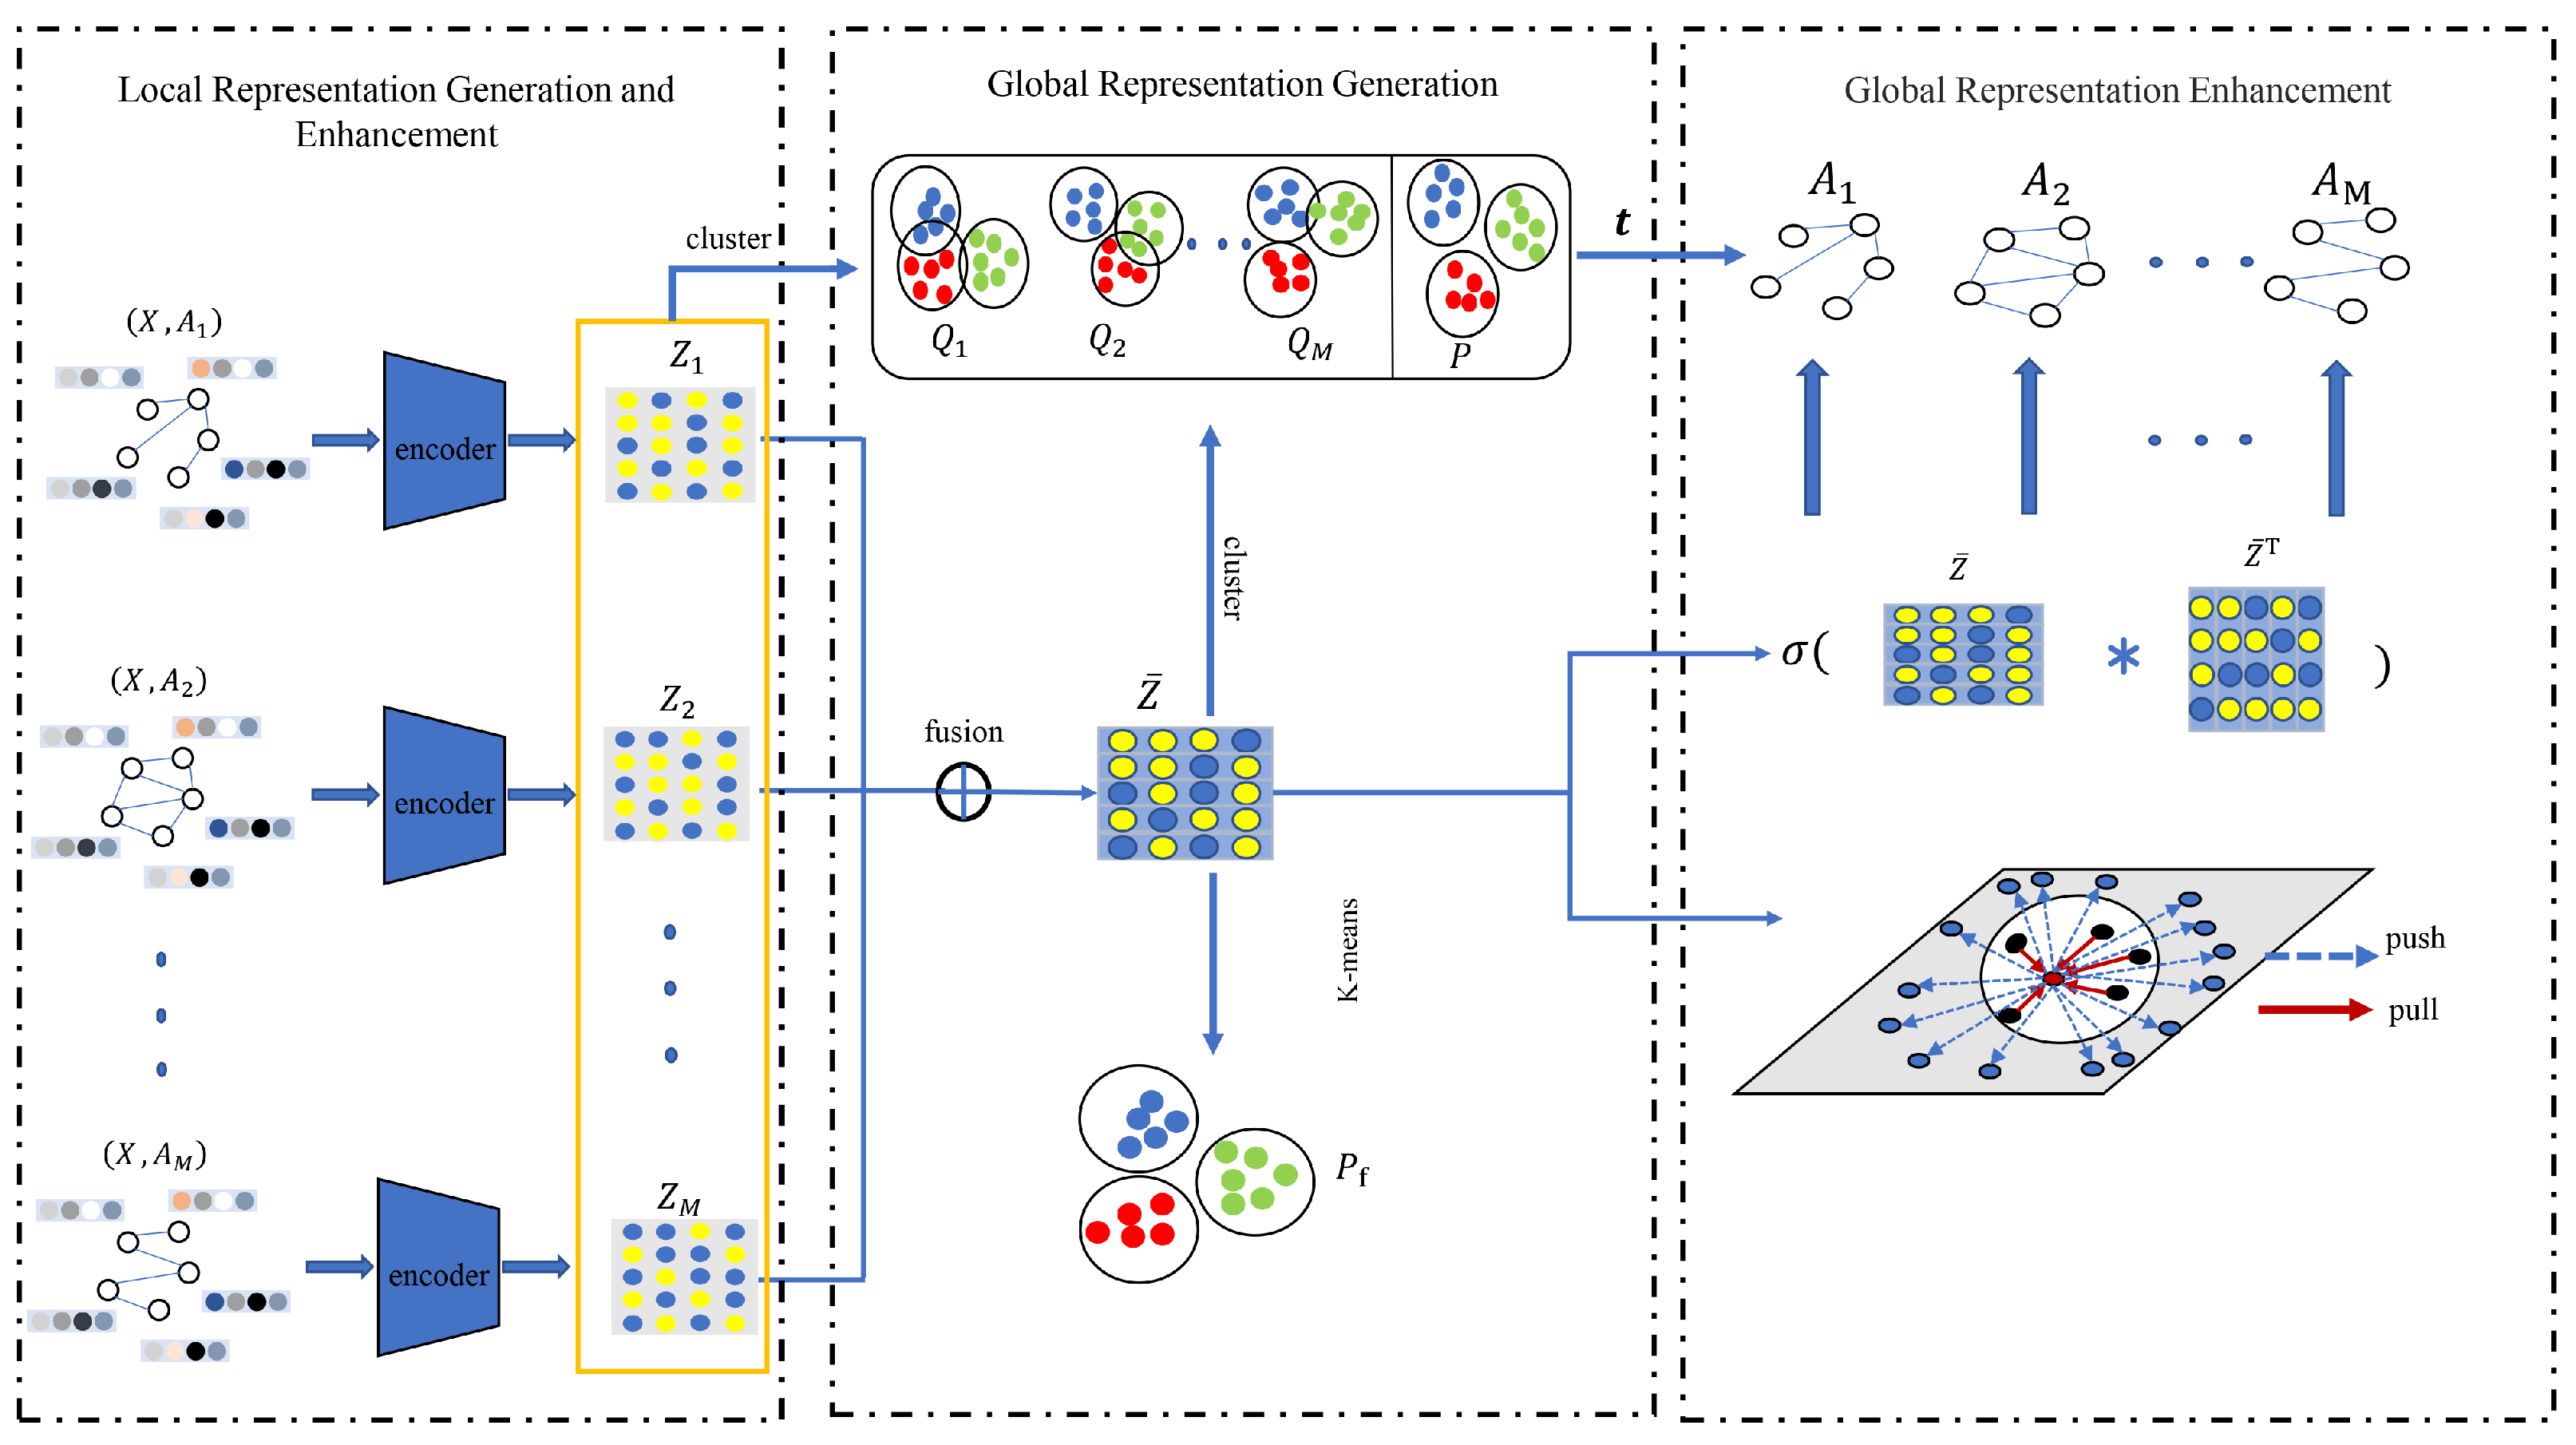
Figure 2.
Clustering results of the GCN and the graph encoder on three datasets with different number of network layers.
Figure 2.
Clustering results of the GCN and the graph encoder on three datasets with different number of network layers.
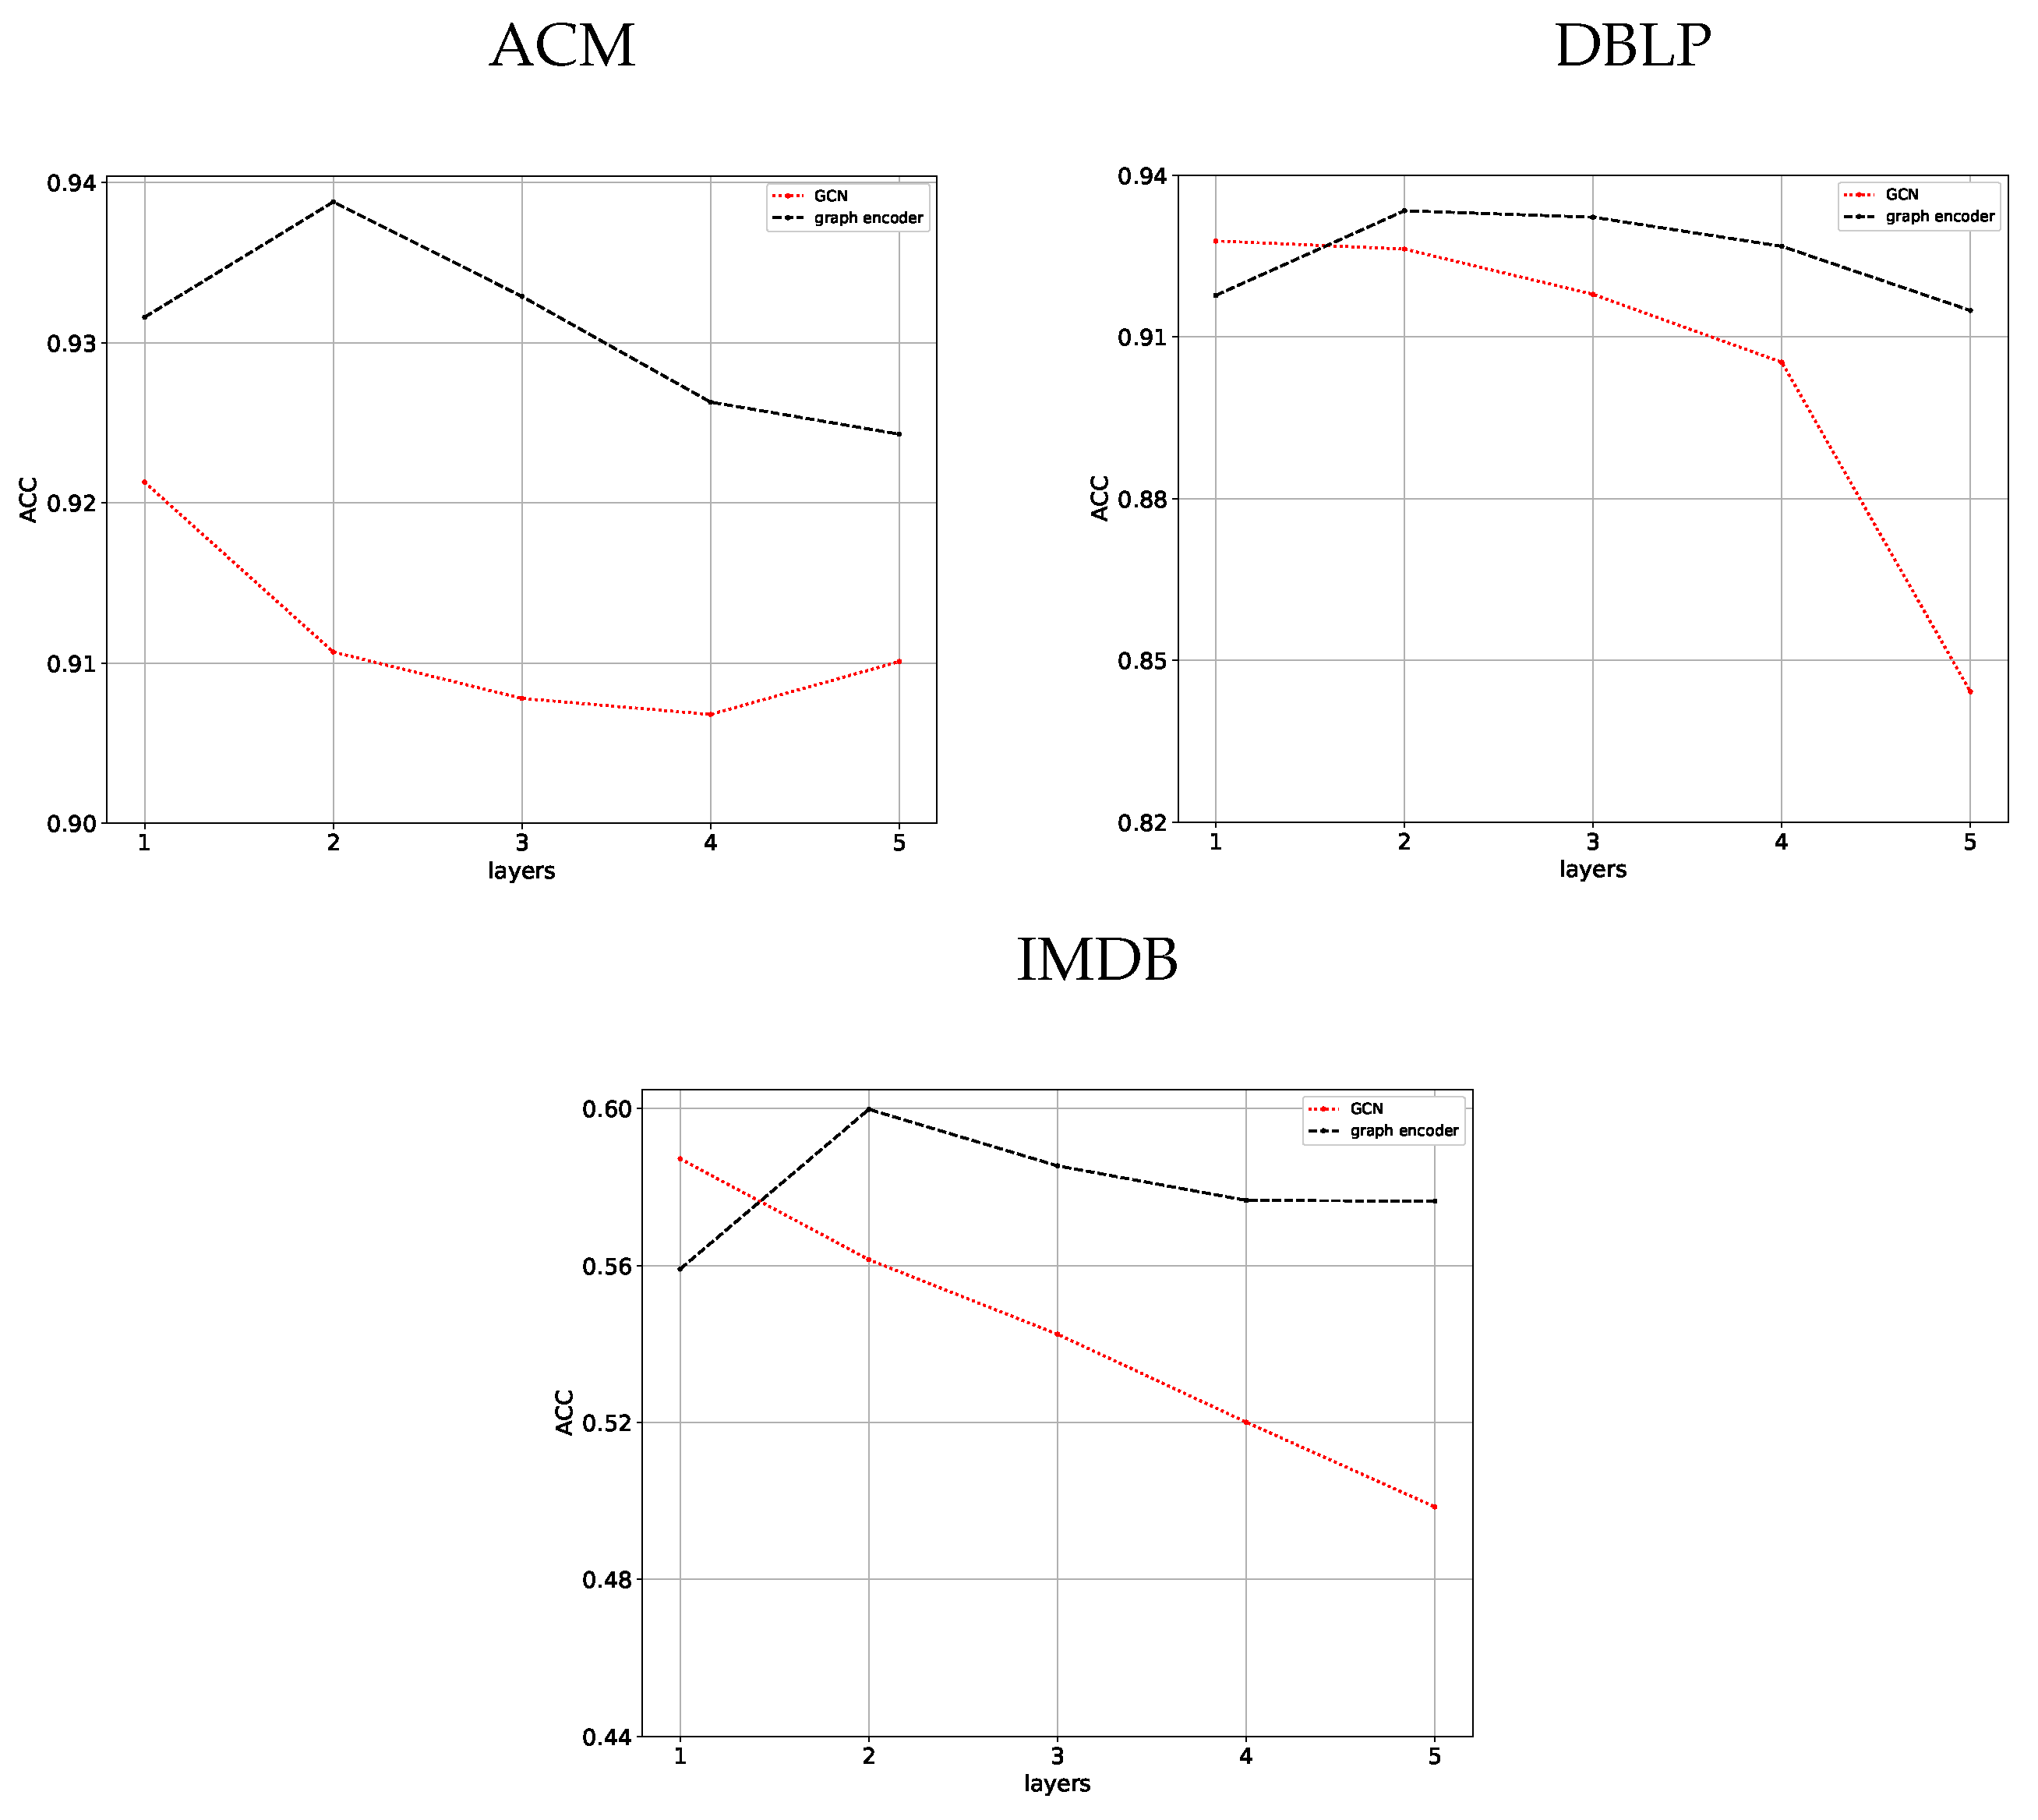
Figure 3.
Sensitivity analysis of parameters k and on three datasets.

Table 1.
Statistical information of the experimental datasets.
| Datasets | Nodes | Edges | Features | Clusters |
|---|---|---|---|---|
| ACM | 3025 | Co-Subject (29,281) | 1830 | 3 |
| Co-Author (2,210,761) | ||||
| DBLP | 4057 | Co-Author (11,113) | 334 | 4 |
| Co-Conference (6,776,335) | ||||
| Co-Term (5,000,495) | ||||
| IMDB | 4780 | Co-Actor (98,010) | 1232 | 3 |
| Co-Director (21,018) |
Table 2.
Clustering results of various algorithms on three datasets.
| Algorithms | GAE | LINE | PMNE | RMSC | SwMC | O2MAC | MvAGC | MAGC | LMGEC | LGMGC | |
|---|---|---|---|---|---|---|---|---|---|---|---|
| ACM | ACC | 0.8216 | 0.6479 | 0.6936 | 0.6315 | 0.3831 | 0.9042 | 0.8975 | 0.8806 | 0.9302 | 0.9388 |
| NMI | 0.4914 | 0.3941 | 0.4648 | 0.3973 | 0.0838 | 0.6923 | 0.6735 | 0.6180 | 0.7513 | 0.7735 | |
| ARI | 0.5444 | 0.3433 | 0.4302 | 0.3312 | 0.0187 | 0.7394 | 0.7212 | 0.6808 | 0.8031 | 0.8263 | |
| F1 | 0.8225 | 0.6594 | 0.6955 | 0.5746 | 0.4709 | 0.9053 | 0.8986 | 0.8835 | 0.9311 | 0.9382 | |
| DBLP | ACC | 0.8859 | 0.8689 | 0.7925 | 0.8994 | 0.6538 | 0.9074 | 0.9277 | 0.9282 | 0.9285 | 0.9334 |
| NMI | 0.6825 | 0.6676 | 0.5914 | 0.7111 | 0.3760 | 0.7287 | 0.7727 | 0.7768 | 0.7739 | 0.7860 | |
| ARI | 0.7410 | 0.6988 | 0.5265 | 0.7647 | 0.3800 | 0.7780 | 0.8276 | 0.8267 | 0.8284 | 0.8394 | |
| F1 | 0.8743 | 0.8564 | 0.7966 | 0.8248 | 0.5602 | 0.9013 | 0.9225 | 0.9237 | 0.9241 | 0.9289 | |
| IMDB | ACC | 0.4298 | 0.4268 | 0.4958 | 0.2702 | 0.2617 | 0.4502 | 0.5633 | 0.6125 | 0.5893 | 0.5998 |
| NMI | 0.0402 | 0.0031 | 0.0359 | 0.0054 | 0.0056 | 0.0421 | 0.0317 | 0.1167 | 0.0632 | 0.0913 | |
| ARI | 0.0473 | −0.0090 | 0.0366 | 0.0018 | 0.0004 | 0.0564 | 0.0940 | 0.1806 | 0.1294 | 0.1710 | |
| F1 | 0.4062 | 0.2870 | 0.3906 | 0.3775 | 0.3714 | 0.1459 | 0.3783 | 0.4551 | 0.4267 | 0.4565 | |
The best results are highlighted in bold.
Table 3.
Clustering results of the proposed algorithm on different views.
| Datasets | V1 | V2 | V3 | ALL | |
|---|---|---|---|---|---|
| ACM | ACC | 0.9197 | 0.7230 | - | 0.9388 |
| NMI | 0.7185 | 0.5155 | - | 0.7735 | |
| ARI | 0.7765 | 0.4719 | - | 0.8263 | |
| F1 | 0.9198 | 0.7101 | 0.9382 | ||
| DBLP | ACC | 0.6621 | 0.6717 | 0.9247 | 0.9334 |
| NMI | 0.3743 | 0.3349 | 0.7782 | 0.7860 | |
| ARI | 0.2649 | 0.3125 | 0.8329 | 0.8394 | |
| F1 | 0.6695 | 0.6724 | 0.9197 | 0.9289 | |
| IMDB | ACC | 0.5730 | 0.5787 | - | 0.5998 |
| NMI | 0.0640 | 0.0811 | - | 0.0913 | |
| ARI | 0.1196 | 0.1518 | - | 0.1710 | |
| F1 | 0.4298 | 0.4504 | - | 0.4565 |
The best results are highlighted in bold.
Table 4.
Clustering results without reconstruction loss.
| Datasets | LGMGC w/o | LGMGC | |
|---|---|---|---|
| ACM | ACC | 0.9233 | 0.9388 |
| NMI | 0.7349 | 0.7735 | |
| ARI | 0.7854 | 0.8263 | |
| F1 | 0.9241 | 0.9382 | |
| DBLP | ACC | 0.7678 | 0.9334 |
| NMI | 0.5124 | 0.7860 | |
| ARI | 0.5198 | 0.8394 | |
| F1 | 0.7432 | 0.9289 | |
| IMDB | ACC | 0.5852 | 0.5998 |
| NMI | 0.0754 | 0.0913 | |
| ARI | 0.1389 | 0.1710 | |
| F1 | 0.4473 | 0.4565 |
The best results are highlighted in bold.
Table 5.
Clustering results without neighborhood contrastive loss.
| Datasets | LGMGC w/o | LGMGC | |
|---|---|---|---|
| ACM | ACC | 0.9111 | 0.9388 |
| NMI | 0.7070 | 0.7735 | |
| ARI | 0.7552 | 0.8263 | |
| F1 | 0.9123 | 0.9382 | |
| DBLP | ACC | 0.9232 | 0.9334 |
| NMI | 0.7774 | 0.7860 | |
| ARI | 0.8293 | 0.8394 | |
| F1 | 0.9185 | 0.9289 | |
| IMDB | ACC | 0.5345 | 0.5998 |
| NMI | 0.0044 | 0.0913 | |
| ARI | 0.0188 | 0.1710 | |
| F1 | 0.2916 | 0.4565 |
The best results are highlighted in bold.
Disclaimer/Publisher’s Note: The statements, opinions and data contained in all publications are solely those of the individual author(s) and contributor(s) and not of MDPI and/or the editor(s). MDPI and/or the editor(s) disclaim responsibility for any injury to people or property resulting from any ideas, methods, instructions or products referred to in the content. |
© 2024 by the authors. Licensee MDPI, Basel, Switzerland. This article is an open access article distributed under the terms and conditions of the Creative Commons Attribution (CC BY) license (https://creativecommons.org/licenses/by/4.0/).
Share and Cite
MDPI and ACS Style
Zhao, X.; Hou, Z.; Wang, J. Local-Global Representation Enhancement for Multi-View Graph Clustering. Electronics 2024, 13, 1788. https://doi.org/10.3390/electronics13091788
AMA Style
Zhao X, Hou Z, Wang J. Local-Global Representation Enhancement for Multi-View Graph Clustering. Electronics. 2024; 13(9):1788. https://doi.org/10.3390/electronics13091788
Chicago/Turabian StyleZhao, Xingwang, Zhedong Hou, and Jie Wang. 2024. "Local-Global Representation Enhancement for Multi-View Graph Clustering" Electronics 13, no. 9: 1788. https://doi.org/10.3390/electronics13091788
Note that from the first issue of 2016, this journal uses article numbers instead of page numbers. See further details here.