1. Introduction
Currently, hematological morphology examination is one of the most commonly used methods for diagnosing blood diseases [
1], and the application of deep learning for classification in hematological morphology has become mainstream [
2]. It plays a crucial role in diagnosing diseases such as leukemia and nutritional anemia [
3,
4].
In recent years, with the improvement of hardware performance and advancements in deep learning technologies, numerous sophisticated deep learning models have emerged [
5,
6,
7,
8,
9], particularly excelling in the medical field [
10,
11]. Undeniably, deep learning has gained a distinct advantage over traditional machine learning methods in blood cell image classification [
12], leading many scholars to apply deep learning in the processing of blood cell images [
13,
14,
15]. Liao et al. [
16] developed a convolutional neural network based on ultrasound RF signals for the extraction of red blood cell classification features. This method not only reduced the network parameters but also improved the classification accuracy, despite not quantitatively assessing the cells. Kishore et al. [
17] optimized a convolutional neural network using the particle swarm optimization algorithm for the quantitative classification assessment of white blood cells, effectively reducing the misclassification rate of white blood cells. However, this method is primarily suited for handling multiple overlapping cells and cell clusters. Khan et al. [
18] combined a convolutional neural network with a dual attention network for the efficient detection and classification of white blood cells, adapting to various cell distribution scenarios. Machine learning and radiomics methods can extract and process the features of various blood cell attributes. Wu et al. [
19] introduced a method to extract the radiomic features from blood cell images. This method uses computational algorithms to convert image structures into quantitative data.
Deep learning technology has undergone wide application and significant achievements in blood cell classification within the medical field. However, critical issues remain. The authenticity of the blood cell results predicted by models lacks clear verification. This lack of verification can lead to misdiagnoses and serious medical accidents [
20]. Additionally, relying only on precisely annotated cell category data is not sufficient to develop deep learning models that excel in cell attribute classification. Each blood cell image contains rich attribute information but does not become accurately annotated. This situation often causes the model’s focus to scatter. It makes it difficult to effectively recognize and capture the subtle differences between attributes. Therefore, developing such models requires a large amount of precisely annotated attribute data. Considering that each blood cell image requires annotations for multiple attributes, the cost of data annotation significantly increases, posing a major challenge [
21]. Hence, there is an urgent need for a blood cell attribute classification method that requires lower demands for attribute data annotation. The classification results should be consistent with the hematological morphology and interpretable. The Concept Bottleneck Model (CBM) [
22] is an interpretable method. It labels tasks with human anatomy concepts related to predictions. Then, it predicts the final label based on the concept labels.
CBM moderates the classification task at an intermediate level to improve credibility. This allows for human intervention to correct wrong concept predictions, enhancing the model performance. Zarlenga et al. [
23] introduced Concept Embedding Models. These models focus on learning interpretable high-dimensional concept representations. They achieved a balance between accuracy and interpretability. Yuksekgonul et al. [
24] proposed Post-hoc Concept Bottleneck Models (PCBM). PCBMs can transform any neural network into a PCBM. This transformation maintains the model performance and increases interpretability. Kim et al. [
25] introduced Probabilistic Concept Bottleneck Models (ProbCBMs). ProbCBMs use probabilistic concept embeddings. They model the uncertainty in concept predictions finely. This approach offers explanations based on concepts and their uncertainties. It also significantly improves the model’s robustness to input data changes.
Studies from [
22,
23,
24,
25] show that the current CBM methods focus on interpretable, image-feature-based classification. However, the current CBM methods annotate attributes with only one value. According to hematological morphology [
26], blood cells have multiple attributes. These attributes often have more than one value. For example, in the same category of blood cells, the cytoplasm color may have various values. Therefore, we cannot use CBM methods alone to train on blood cell images. Instead, we need to find a method that can handle multiple values for the blood cell attribute features.
Partial label learning (PLL) is an emerging framework in weakly supervised learning [
27]. It has a wide range of applications. PLL aims to learn from training samples. It associates each training sample with a set of candidate labels. Only one label is valid for the training sample, known as the ground-truth label. Using PLL can significantly reduce the time and money costs of labeling large amounts of data while ensuring model accuracy. Currently, PLL can be divided into four types: transformation strategy, theory-oriented strategy, extensions, and disambiguation strategy [
28]. The transformation strategy includes binary learning, graph matching, and dictionary learning. In binary learning, Lin et al. [
29] used error-correcting output codes. They combined the feature space and label space for PLL. Lyu et al. [
30] proposed a PLL framework based on graph matching. They turned the one-to-one probabilistic matching algorithm into a many-to-one constraint. Chen et al. [
31] proposed a dictionary-based learning method. It is for ambiguously labeled multiclass classification. They used an iterative alternating algorithm to solve the dictionary learning problem. The transformation strategy might not solve the classification problem of blood cell attributes. Blood cells have many attributes. There are complex interactions between these attributes. The transformation strategy often simplifies the problem. It uses forms like binary learning or graph matching. This simplification cannot fully capture the subtle connections between attributes. Blood cells of the same category might have multiple correct attribute labels. The transformation strategy tends to simplify the problem’s structure. This simplification might lead to the loss of key cellular attribute feature information when dealing with multi-label ambiguity.
The theory-oriented strategy focuses more on the theoretical aspects of PLL. Xu et al. [
32] proposed a theoretically grounded and practically effective method. It is for instance-dependent partial label learning through Progressive Purification. Unfortunately, models in the field of medical image analysis require greater flexibility to handle challenges from data variation or uncertainty. For example, differences in the cell staining agents used by different hospitals can affect cell imaging. This can lead to model misjudgments. At the same time, theory-oriented strategies often rely on strict assumptions. This can limit the model’s generalizability and adaptability.
The extensions include various semi-supervised PLL methods, like partial multi-label learning (PML) [
33]. Blood cells have rich features. Each attribute has its unique candidate label range. A cell category can be defined by a combination of attributes. Thus, training on blood cell attributes to identify cell categories is essentially a multi-label partial label learning task. Unfortunately, the current PML methods are not directly suitable for learning blood cell attributes. In PML methods, the candidate labels do not point to the same attribute. For a specific attribute of blood cells, any candidate label could theoretically represent its presence.
The disambiguation strategy in PLL distinguishes the confidence associated with each candidate label to determine the ground-truth label. This strategy directly addresses the core issue of label ambiguity in partial label learning to infer the most likely correct label. Unlike the transformation strategy that simplifies the PLL problem into other machine learning problems, the disambiguation strategy seeks solutions within the original partial label framework. This approach avoids information loss or added complexity from the transformation process. The disambiguation strategy is data-centric and focuses more on experimental and practical effect verification, avoiding complex theoretical computations. Wang et al. [
34] proposed the Contrastive Label Disambiguation for Partial Label Learning (PICO) algorithm. It identifies the ground-truth labels using embedded prototypes in contrastive learning. Contrast items help to obtain more precise label disambiguation prototypes. In this algorithm framework, the prototype modules play a crucial role, helping the neural network to understand and differentiate features of various cell attributes deeply. In this way, the model can match new cell samples with known blood cell attribute prototypes to accurately infer the most likely attribute values of the samples. At the same time, by using contrastive learning methods to compare the similarities and differences in the attributes between the cell samples, the neural network’s ability to recognize different cell attribute features is further enhanced.
It is worth emphasizing that the blood cell dataset used in this study presents different partial label structures compared to the dataset the PICO algorithm uses. The blood cell morphology analysis [
26] shows that blood cells of the same category can exhibit various attribute combinations. However, these combinations do not repeat across different blood cell categories. We have therefore preset the candidate label sets for the blood cell attribute dataset. For blood cells of the same category, we designed candidate label sets with identical structures. For blood cells of different categories, the structures of these sets vary distinctly. Each set includes the ground-truth label for a cell’s attributes. In contrast, the PICO algorithm generates its candidate label sets through a random process. This approach can lead to inconsistent structures of the candidate label sets for images within the same category. In some instances, the sets may lack the ground-truth labels, as
Figure 1 illustrates. In
Figure 1a, within the candidate label sets for blood cell attributes, the ground-truth label is always present. In
Figure 1b, within the candidate label sets of the original method [
34], the ground-truth label may not be present. Unlike the PICO algorithm, we have predefined reasonable candidate label sets for the attributes of each blood cell category, preventing the model from selecting a result blindly.
Therefore, this study develops a blood cell attribute classification method based on the partial label learning strategy PICO. We named this method P4BC (PLL for blood cells). This method trains deep learning networks using the partial label data of blood cell attributes. During this process, it stores the feature information of the cell attributes in prototype modules. The method uses the prediction results to calculate the attribute classification loss. It selects samples with high similarity regarding the attribute feature information stored in the prototypes as positive samples for contrastive loss calculation. This approach provides interpretability for the model’s prediction results. The study employs a joint optimization strategy of these two losses. It aims to build a network model that can identify the blood cell attributes with high precision. With this attribute network model, the study further achieves the precise classification of blood cell categories. It ensures that the model can accurately determine the cell categories while maintaining high attribute classification accuracy.
This study presents three contributions.
We introduce the partial label learning strategy into the field of blood cell image recognition. Using this strategy, we update the attribute classification loss and contrastive loss with the feature information of the blood cell attributes stored in the prototype modules. The contrastive loss helps the model to capture the subtle differences between different cell attributes. At the same time, the attribute classification loss further guides the model to focus on and learn the key features of the attributes. The combination of these two types of losses allows the model to efficiently use the partially labeled blood cell attribute data for training. Thus, it achieves the precise prediction of blood cell attributes.
Based on the knowledge of blood cell morphology, we preset candidate label sets for the attributes of different blood cell categories. We integrate morphological knowledge with deep learning technology and name it “knowledge alignment”. This ensures that the model makes accurate predictions based on the knowledge of blood cell morphology and the attribute feature information stored in the prototype modules during training. This not only enables the model to precisely identify the correct cell attributes within the appropriate set of attribute labels but also significantly enhances the model’s interpretability. Through this method, we ensure that the model’s attribute prediction results do not conflict with the cell morphology knowledge. This reflects the scientific nature of our approach and successfully achieves knowledge alignment.
The method used in this study not only accurately identifies the blood cell attributes but also effectively reduces the deep learning network’s dependence on a large amount of precisely annotated cell attribute data. It significantly lowers the economic and time costs of labeling. More importantly, by providing additional training for the blood cell category classification to the deep learning network, this study achieves highly precise identification of the cell categories while ensuring the accuracy of the attribute recognition. This demonstrates the great potential and significant value of our method in the practical application of blood cell attribute and category classification.
2. Materials and Methods
This section is divided into three parts. First, we introduce the dataset used in our study. Next, we describe the main body structure of the P4BC algorithm. Then, we provide the specific components and usage methods of our algorithm.
2.1. Dataset
In our study, we use the WBCAtt dataset that Tsutsui et al. [
35] proposed. This dataset includes all White Blood Cells (WBCs) from the PBC dataset [
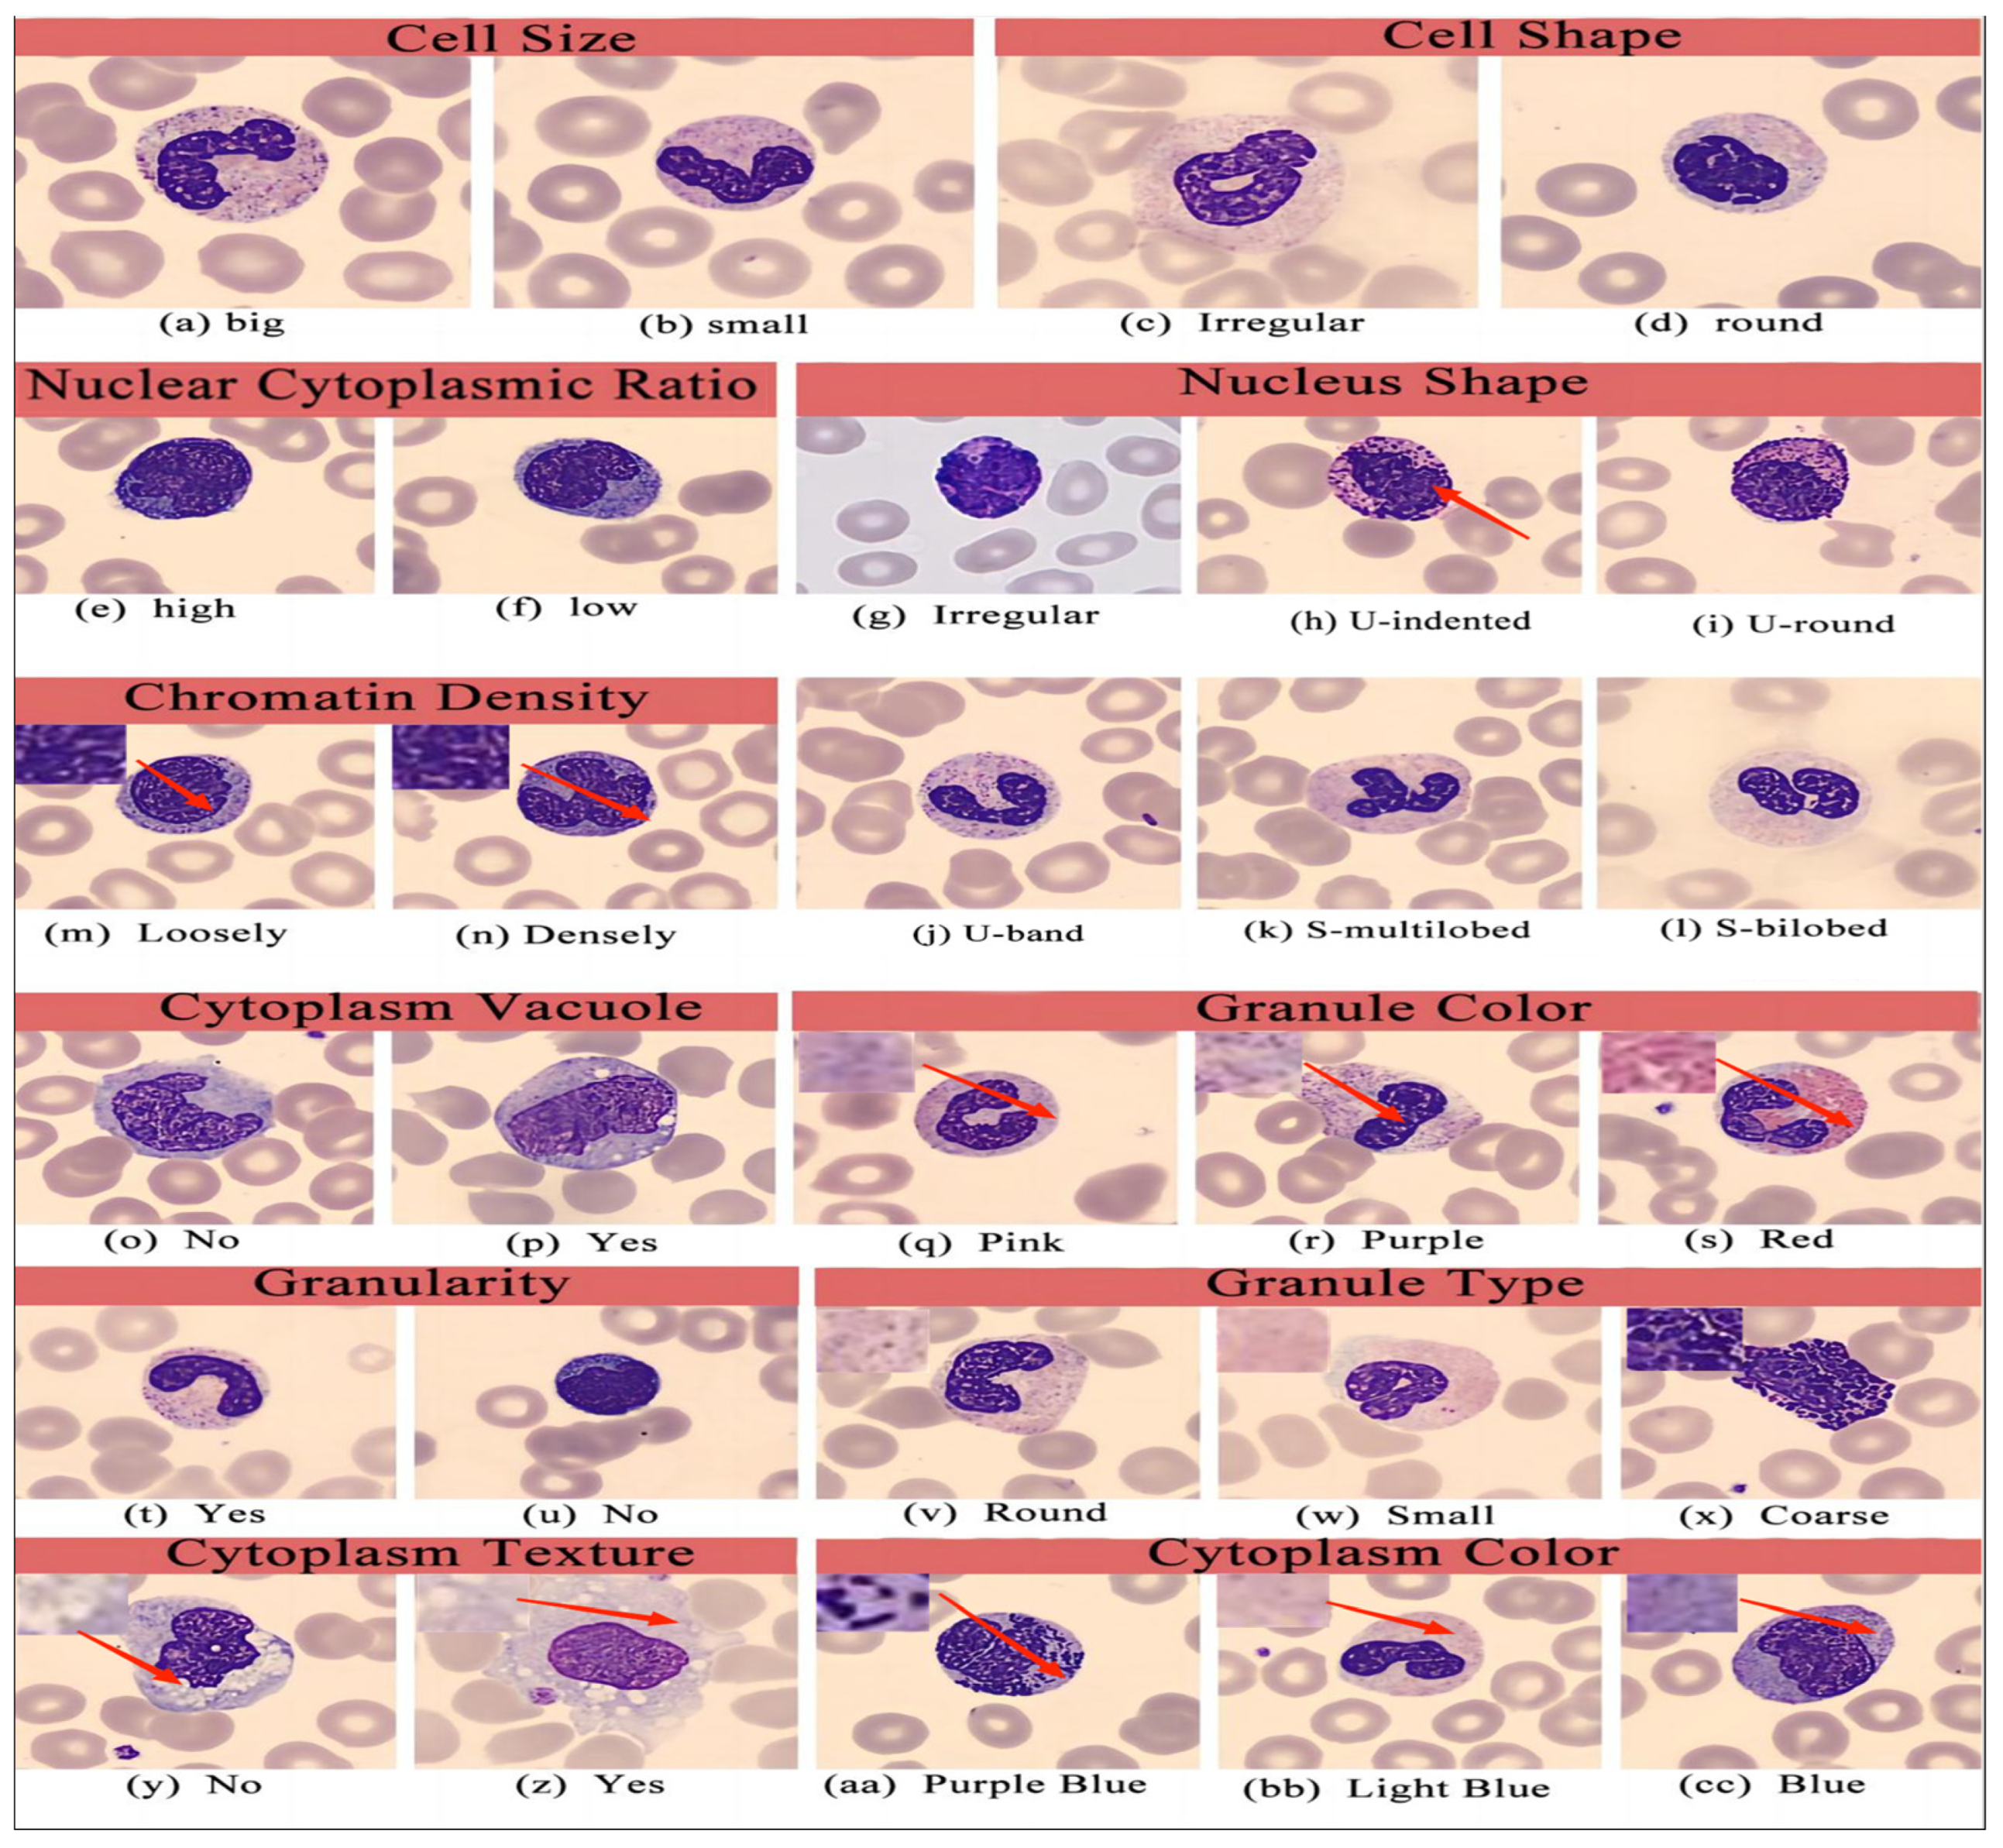
36]. Pathologists, literature reviews, and manual inspection of cell images helped to annotate the cell images in the WBCAtt dataset with 11 attributes.
Figure 2 displays these annotations. Red arrows in the figure serve as the classification criteria for blood cell attributes.
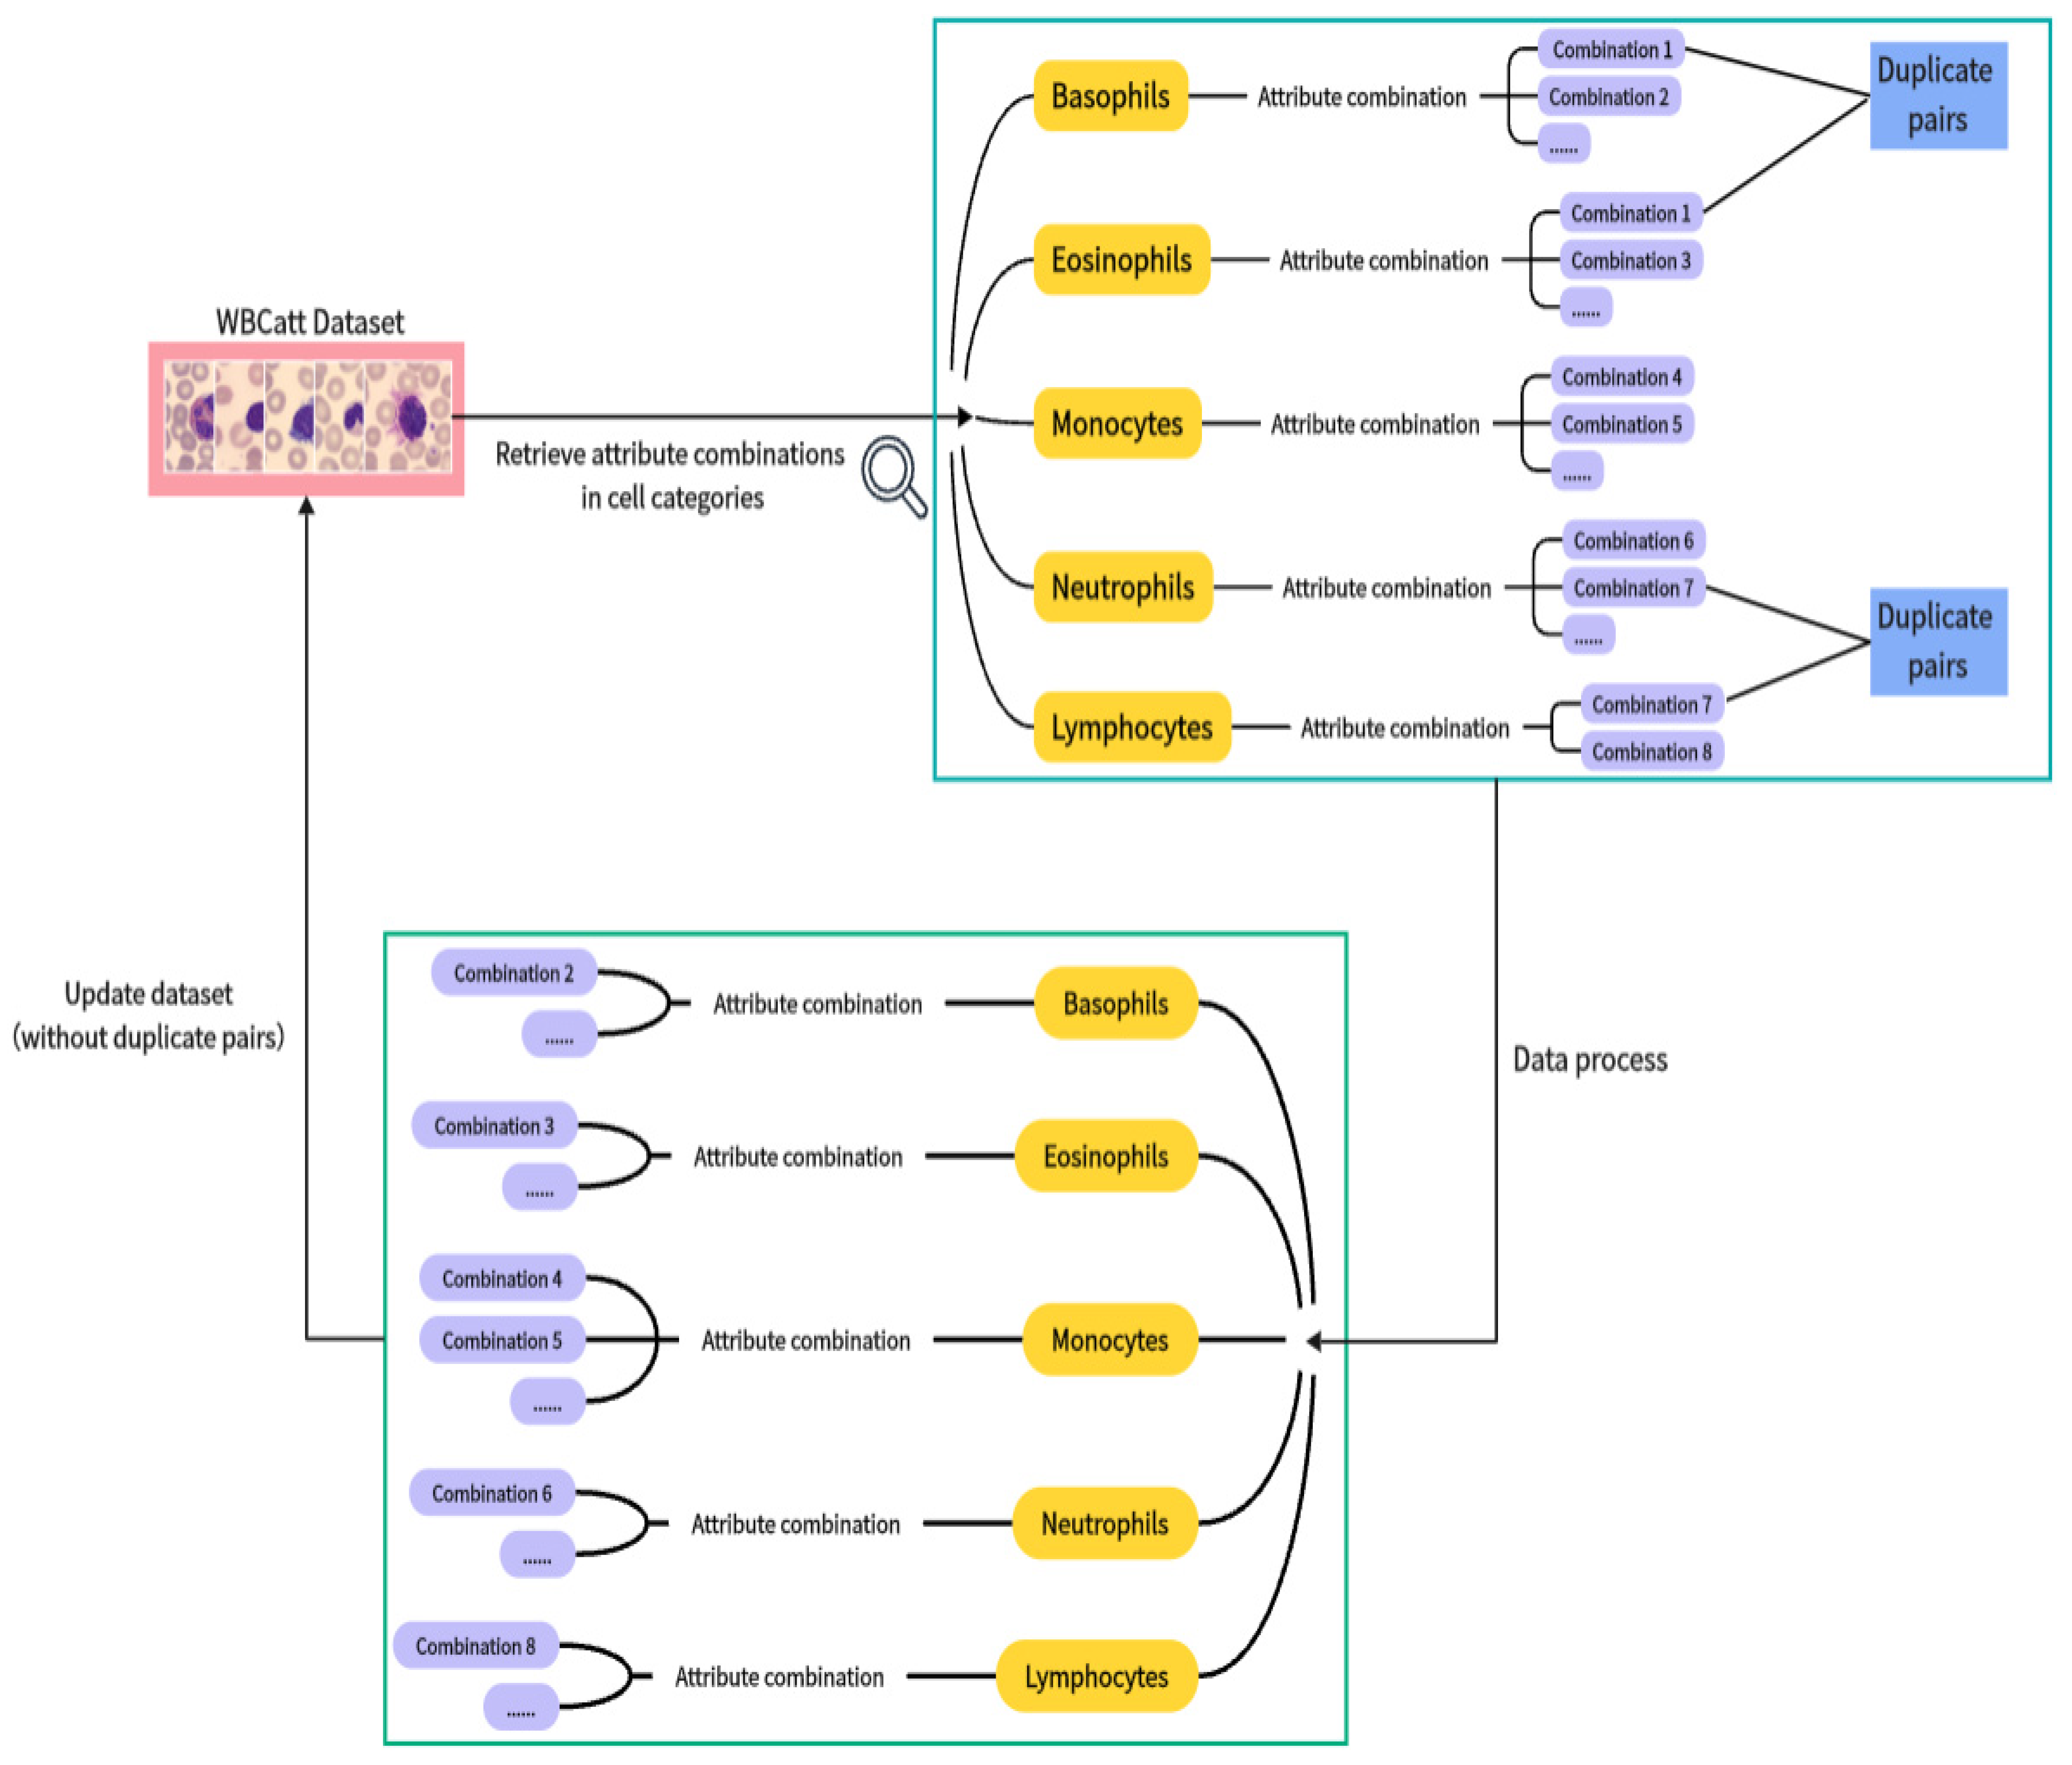
The dataset includes 1218 basophils, 3117 eosinophils, 1420 monocytes, 3329 neutrophils, and 1214 lymphocytes. “Granule type” and “granule color” may be “nil”, indicating the absence of such attributes. We have found some samples in the WBCAtt dataset that, despite belonging to different cell categories, share identical attribute annotations. Therefore, we must process the data to ensure samples of different cell categories in the entire WBC dataset have distinct attribute annotations. Our data process aims to reduce the cases of attribute combination values with very few samples.
Therefore, we propose a data processing method. This method assumes “cell image samples of different categories have different attribute value annotations”. We progress through all samples one by one. We filter out pairs of samples from different categories with the same attributes (we call these “duplicate pairs”) and remove them. The data processing flowchart is illustrated in
Figure 3. A category of blood cells has multiple attribute combinations, with ‘combination 1’, ‘combination 2’, etc., representing different attribute combinations.
Finally, out of 10,298 samples in the WBC dataset, we filtered out 100 samples (less than 1%). This ensures no samples of different cell categories share the same attributes. After manually checking each sample, we found few samples had almost unique attribute combination values in the entire dataset. The distribution of blood cell attributes is shown in
Table 1.
The distribution of blood cell categories after data cleaning is shown in
Table 2.
Based on the knowledge of blood cell morphology [
26], we considered the diverse values each blood cell attribute might have. We constructed a set of reasonable candidate label sets for each category of blood cell based on the distribution of their attribute features. This process introduces the prior knowledge of blood cell morphology to guide the subsequent neural network model training. We aim for our model to prioritize candidate values within blood cell attribute samples that align with cellular morphology, thereby diminishing the introduction of interference. This strategy is intended to reduce incidents of anomalous predictive attributes that diverge from morphological knowledge, thereby bolstering the model’s interpretability and enhancing its scientific rigor. Our objective is to train a partial label learning algorithm using a weakly annotated set of blood cell attributes. We aim for this algorithm to accurately classify blood cell attributes. The predictions should conform to morphological knowledge.
Table 3 shows the candidate label sets for attributes we designed under morphological guidance.
2.2. The Overall Structure of the Algorithm
The P4BC method’s structure is shown in
Figure 4, consisting of two main stages.
Our method proceeds in two phases. It is crucial to note that the training image dataset remains consistent across both phases. In phase 1, we employ attribute candidate label data from the dataset. In phase 2, we use category label data from the dataset. Phase 1 focuses on the partial label learning algorithm. We employ the partial label learning algorithm to extract and store various attribute features from blood cell images, aiming to effectively address the ambiguity of partial label data. Encoders Network and Prototypes Network are crucial components of this algorithm. The Encoders Network extracts feature information from images and uses this feature information to train a classifier contained within the Encoders Network. This classifier performs predictive classification of attributes. Additionally, the feature information extracted from images by the Encoders Network is stored in the Prototypes Network. The attribute prediction results of the classifier are then used to select blood cell attributes matching the stored cell attribute feature information as positive samples for contrastive loss calculation. Additionally, these predictions are used to compute attribute classification loss. During training, the attribute classification loss and the contrastive loss together represent the feature information of blood cell attribute data.
In phase 2, we use the classifier; it has comprehensively learned the feature information of blood cell attributes from phase 1’s training. We refer to this as the cell features network model. Using this model, we continue training for blood cell category classification using category label data on the same training image dataset, aiming for the model to accurately predict the categories of blood cell samples.
2.3. Framework of Partial Label Learning Algorithm
Partial label learning (PLL) represents an advanced form of weak supervision, particularly well-suited for cases where blood cell attribute samples are associated with multiple candidate labels. The primary goal of PLL is to effectively train models on data with incomplete labels by employing strategies for label disambiguation, thus addressing the prevalent ambiguity issues in such datasets. In this context, our research builds upon the general principles of PLL to develop a specialized cell attribute network model. This model is designed to efficiently handle the unique challenges of blood cell image attributes, enabling precise attribute predictions. Our approach extends traditional PLL frameworks by incorporating specific enhancements tailored for high accuracy in medical imaging scenarios, as detailed in
Figure 5. The term “Classifier” refers to the same concept throughout the figure. A and P are crucial elements for calculating contrastive loss. The dashed double arrows in the figure represent the mutual optimization mechanism between the loss function and prototypes.
2.3.1. Encoders Network and Prototypes Network
Before introducing the Encoders Network and Prototypes Network, we need to first explain the expression of the blood cell dataset our method uses. We define the blood cell dataset . Here, n is the number of blood cell samples, is a blood cell sample, and is an attribute of the sample. Based on blood cell morphology, we preset candidate label sets for cell attributes as . The variable stands for a specific cell attribute. Each attribute corresponds to a set of candidate labels.
The algorithm consists mainly of an Encoder Network and a Prototypes Network. The Encoder Network includes a Query Encoder and a Momentum Encoder. Random data augmentation techniques [
37] generate two augmented samples for
. These are Augmented Query View
and Augmented Key View
. We then input them into the Encoders Network.
represents a blood cell attribute sample
with a candidate label set
.
,
denote data augmentation. We define a classifier
, We train the classifier using the Query View and calculate the attribute classification loss based on the prediction results.
In the MLP of the Query Encoder and Momentum Encoder, we employ the Query network
and Key network
methods from the MoCo [
36]. This generates a pair of L2-normalized embeddings. The Query View corresponds to Equation (1):
is used for contrastive loss calculation and participates in the update of prototypes. The Key View corresponds to Equation (2):
is used for the calculation of contrastive loss.
The Prototypes Network consists of
and the prototype modules.
captures the feature information of blood cell attributes. The total number of prototype modules is determined by the number of blood cell attributes, and each cell attribute has its set of dedicated prototype modules. Within each set of prototype modules, the number of modules directly corresponds to the possible range of attribute values. For specific attributes of a specific category of blood cells, we expect the prototypes to save only the attribute feature information that the cell category possesses according to blood cell morphology. This excludes the attribute feature information that the cell category does not possess, as shown in Equation (3):
represents the predicted attribute result.
is a hyperparameter. It determines the update of prototypes using a moving average. It represents the extent of the update compared to the prototype of the previous epoch. The larger
, the more thorough the update of the prototype, and
represents the prototype modules from the previous training epoch before the current one.
denotes that the classifier predicts the label index
based on the input sample
, within our preset candidate label set
, thus not contradicting morphological knowledge. We optimize the attribute classification loss and contrastive loss using the prototype modules to disambiguate the partial labels of blood cell attributes.
2.3.2. Loss Function
Before introducing the loss function, we emphasize that, to focus the model’s prediction on the most likely attribute of the current sample, we modified the concept of pseudo-labels
used in the original method [
34] (in the remaining part of this article, ‘original method’ always represents the same meaning).
is a crucial element in calculating the loss function. For an attribute
in the blood cell sample
, the pseudo-label vector
, being updated throughout the training process, is shown in Equation (4):
represents the prototype of a blood cell attribute predicted to be index
.
denotes the pseudo-label vector for the predicted index of a blood cell attribute sample.
is the set of candidate labels for
. The expression
selects the attribute
most similar to
from all possible attribute prototypes
as the predicted attribute. Here,
is set as a one-hot encoding where the position for attribute
is 1, and all other positions are 0.
Our PLL algorithm utilizes two loss functions: the attribute classification loss
and the contrastive loss
. During training, the model optimizes the classifier through backpropagation of these loss functions, enhancing its understanding of blood cell attribute features. This training mechanism ensures the model gradually improves its prediction accuracy for blood cell attributes. The overall loss function is defined in Equation (5):
represents the loss value for a specific blood cell attribute. To optimize the classifier, we perform loss backpropagation for each attribute of the blood cell separately. Next, we will detail the design principles of attribute classification loss and contrastive loss.
The attribute classification loss updates the classifier using the cross-entropy loss function, as shown in Equation (6):
represents the predicted index for the blood cell attribute sample
by the classifier. The equation
indicates that only one pseudo-label vector is 1 within the candidate label set. Additionally, the algorithm employs a contrastive learning mechanism to learn different representational features under the same cell attribute. The algorithm incorporates a contrastive learning mechanism to learn different representational features under the same cell attribute. It creates a queue to store previous embeddings
. Ultimately, we obtained an embedding pool for calculating contrastive loss, denoted as
. Here, “queue” consists of multiple sets of momentum embeddings from
Figure 4, and
and
represent the current batch’s embedding
and embedding
, respectively. The purpose of contrastive loss is to teach the model to learn multiple cell attribute feature spaces. In these spaces, similar blood cell attribute samples become closer, while dissimilar ones are farther apart, thereby classifying the attributes of various blood cells. The classifier’s prediction results are used as positive samples, as shown in Equation (7):
, and the classifier’s prediction result is
.
represents the embeddings in
chosen for having the attribute label
that matches the current attribute prediction result
. The contrastive loss is provided in Equation (8):
is a temperature coefficient, and
represents elements in the positive sample set.
is a weighting coefficient, as described in Equation (9):
and
are hyperparameters.
is used to calculate the contrastive loss when
. It helps the model focus on the differences in attribute feature information between the most likely correct attribute sample and the current attribute sample to optimize classifier accuracy.
is used to calculate the differences in attribute feature information between current attribute samples. It helps to reduce the impact on classifier accuracy if the wrong attribute sample is considered the most likely correct. The loss function also optimizes the prototypes. Through backpropagation of the loss, the cell attribute feature information stored in the prototypes becomes clearer and more precise.
2.3.3. The Training Process of the PLL Algorithm
Section 2.3.1 and
Section 2.3.2 introduce the components of our algorithm and the details of the loss functions, respectively. The following text will further describe the training process of the algorithm.
In the initial phase, we preset a reasonable set of candidate attribute labels for each cell category, based on the expertise in blood cell morphology. Data augmentation transforms the blood cell attribute sample into the Query View and the Key View . We input these views into the encoder network to obtain two L2-normalized embeddings: and , and we create a queue to store previous . We train the classifier using the Query View and use the classifier’s prediction results as positive samples. In the label prediction phase, we employ a strategy that segments attributes. Specifically, this process slices the algorithm’s predicted labels, dividing the original single classification task into multiple sub-tasks. Each sub-task focuses on classifying different cell attributes. We use the index from prediction results to update the pseudo-label vector . The predicted attribute result and update the prototype (initially set to zero at the start of training). We calculate the attribute classification loss using and the classifier’s prediction results. The contrastive loss is calculated using , , queue, and positive samples, resulting in the total loss . By sequentially backpropagating the loss for each cell attribute, it optimizes the classifier precisely, enhancing understanding of cell attribute feature information. The training process continues to refine the loss function through the ongoing update of pseudo-label vectors and the storage of attribute feature information in prototypes. Consequently, this optimized loss function, in turn, further improves the classifier’s performance.
2.4. Cell Attribute Network and Cell Category Classification
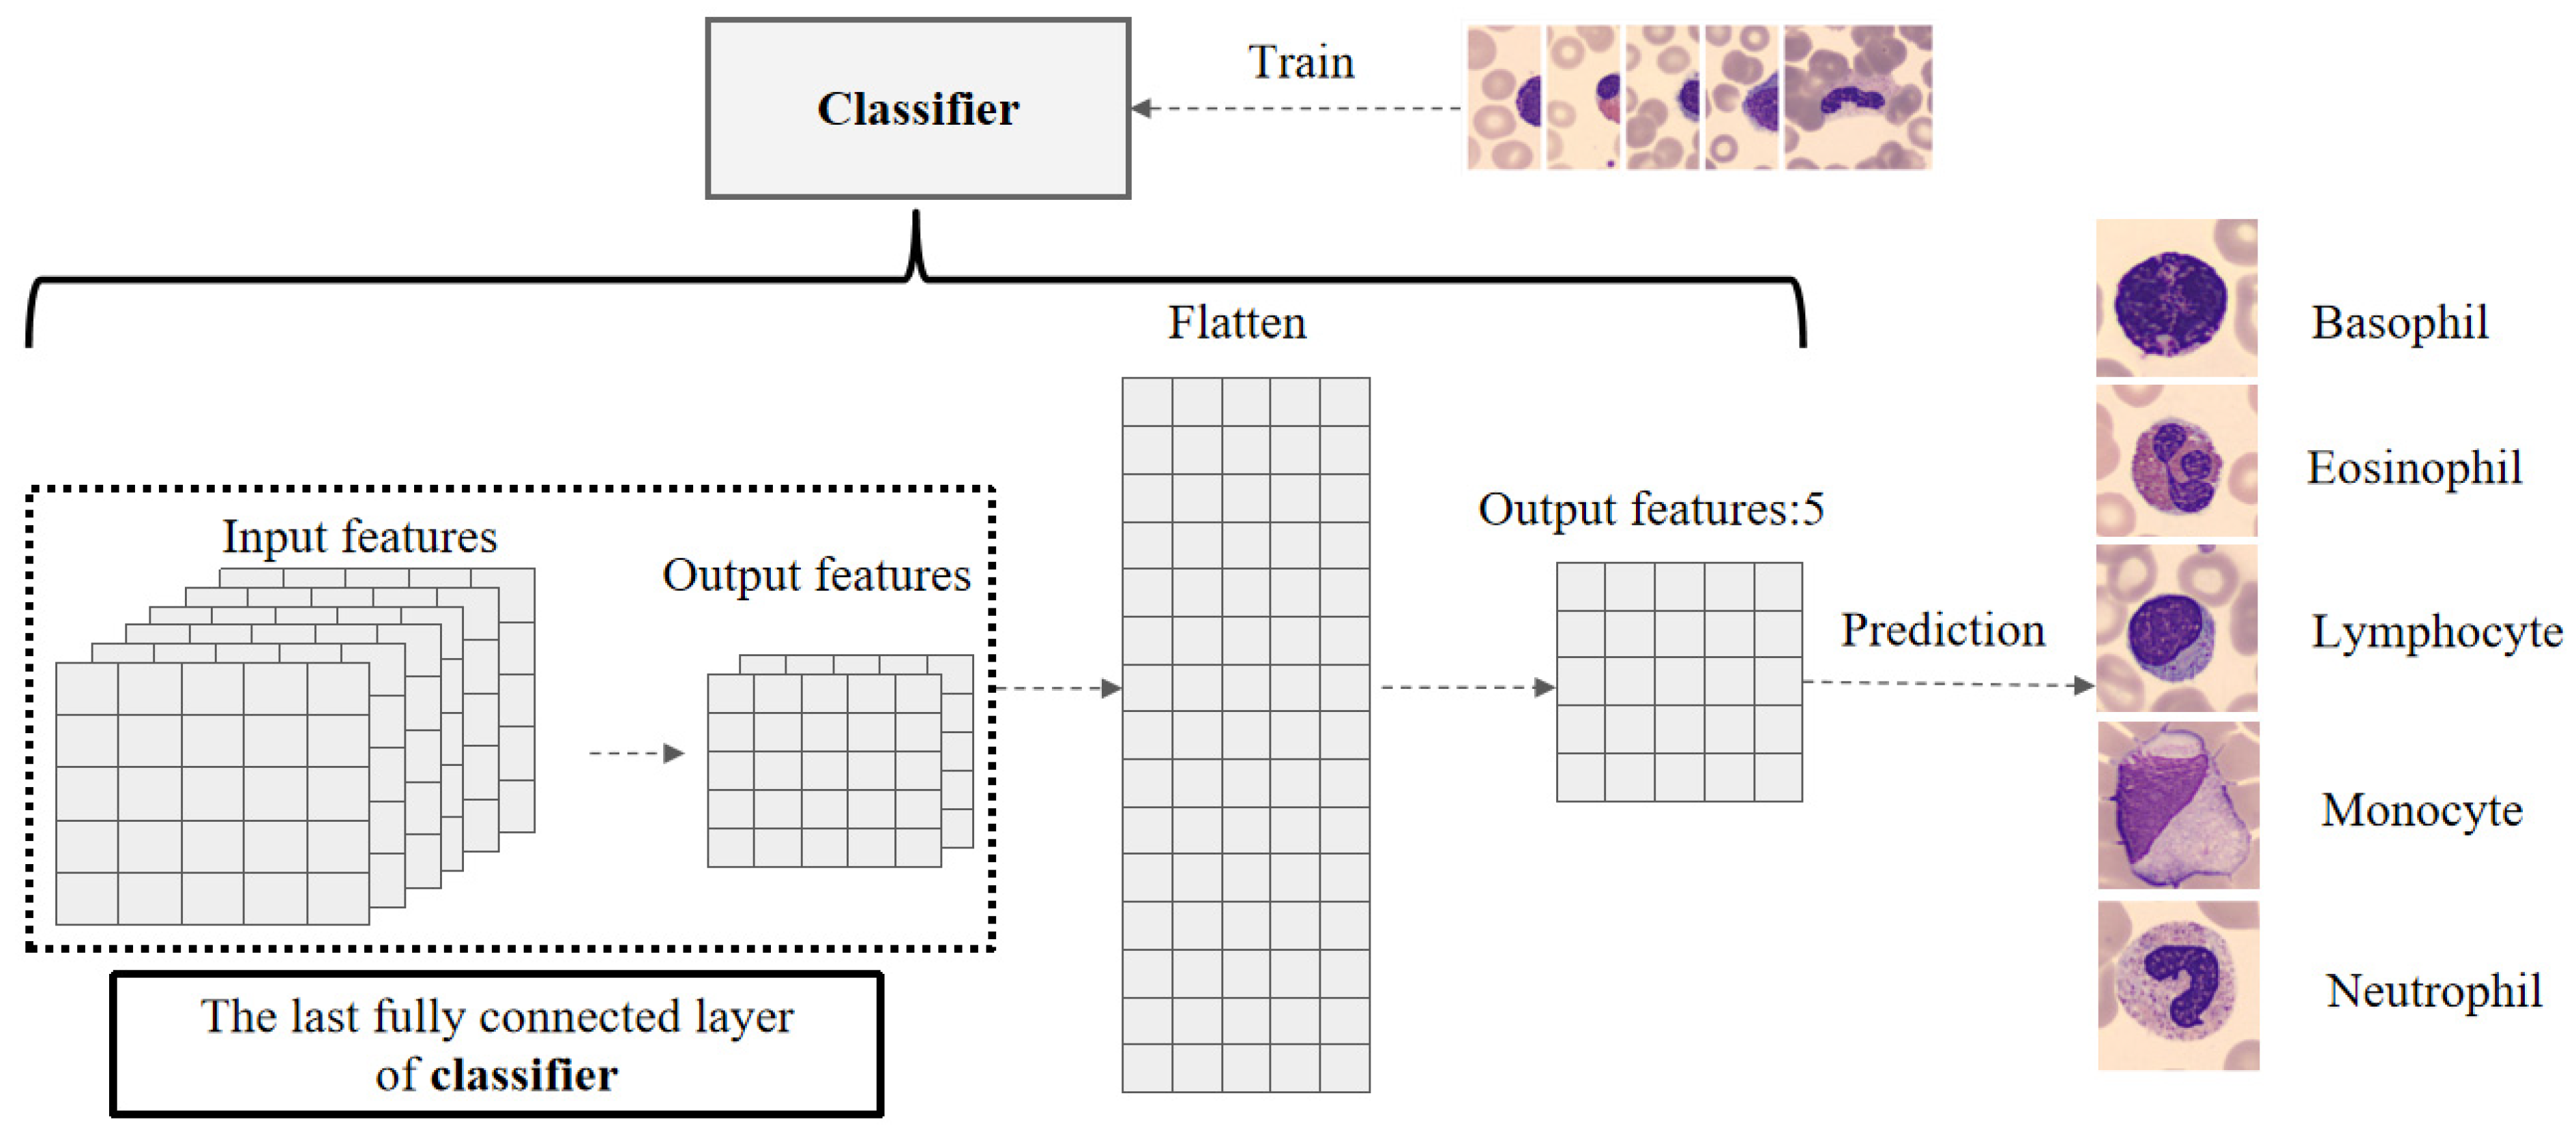
Blood cell category classification is closely related to phase 2 of the P4BC framework. In phase 1 of the framework, we train the classifier located in the Encoders Network with partial label data of blood cell attributes preset based on morphological knowledge. This enables precise prediction of various blood cell attributes, resulting in a model we refer to as the cell attribute network model. Entering phase 2 of the framework, we further use this model for blood cell image category classification training. For this purpose, we conducted targeted modifications regarding the model’s neural network structure, as shown in
Figure 6.
During phase 2 of the P4BC framework training, we utilize the last fully connected layer of the classifier to unfold its output feature layer into one-dimensional data. Subsequently, these one-dimensional data are fed into an output layer with a number of output features equal to the number of cell categories, serving as the model’s final prediction output. Furthermore, we continue to train the classifier
on blood cell image samples
optimizing the classifier using the cross-entropy loss function, as shown in Equation (10):
Here, represents the number of samples in a batch, represents the categories of cells, represents the one-hot encoded true category label vector of the blood cell image , and denotes the probability of the sample being predicted as category . After completing these calculations, we accumulate and average the loss for each batch to determine the overall loss. We then proceed with the backpropagation of the loss.
3. Results
This section details the experiments conducted in this study and the results obtained. We trained an attribute neural network model capable of extracting the cell attribute feature information in the first phase of P4BC (P4BC Phase1). Then, we classified the blood cell images in the second phase of the algorithm (P4BC Phase2). Additionally, we introduced evaluation metrics for attribute classification accuracy and partial label recognition accuracy. We compared the experimental results with the original method [
34].
3.1. Implementation Details of the Experiment
This study utilized a NIVIDA RTX4090 graphics card with Pytorch version 1.13. In the experimental design, ResNet50 was chosen as the base network architecture, with a batch size set to 32 over a total of 500 training epochs. For the contrastive learning part, a dual-layer MLP with an output dimension of 128 served as the projection head. Additionally, to store the key vector embeddings, we established a queue with a capacity of 8192; the temperature parameter τ was set at 0.07, and the momentum coefficient for updating the Momentum Encoder was 0.99 [
37]. The weight parameters δ and u were set at 0.5 and 0.1, respectively; the momentum parameter γ for prototypes updating was set at 0.99; and the update coefficient ϕ was gradually decreased from 0.95 to 0.8 [
34]. These hyperparameters have been proven to be optimal. The experimental data were sourced from the pre-divided training and test sets of the WBCAtt dataset. Additionally, the data augmentation strategy followed the PICO algorithm [
34].
3.2. Definition of Attribute Classification Accuracy and Partial Label Recognition Accuracy
To validate whether our model truly possesses the ability to learn from blood cell partial label data, we consider attribute classification accuracy (ACacc) and partial label recognition accuracy (PLRacc) as key metrics for measuring model performance. ACacc represents the proportion of blood cell attributes correctly identified by the model, namely the ratio of the number of correctly classified blood cell samples to the total number of samples, as shown in Equation (11):
is the number of correctly classified blood cell attribute samples, and
is the total number of attribute samples. PLRacc measures the model’s understanding of the partial label structure and its ability to ensure prediction results always fall within the candidate label set. Taking Basophil cells as an example, suppose the candidate labels for the attribute “Granule type” are “nil”, “round”, “coarse”. We expect the model to make a choice among these three attribute values rather than incorrectly predicting “small”. The calculation of partial label recognition accuracy for a certain cell attribute is shown in Equation (12):
represents the model’s predicted blood cell attribute result. If this prediction falls within the attribute candidate label set
, the prediction is considered correct, yielding a result of 1; if
does not fall within
, the prediction is deemed incorrect, resulting in 0.
ACacc measures the model’s performance on the cell attribute classification task. A higher ACacc indicates a more thorough learning of cell attribute features by the model, demonstrating its strong capability in handling the diversity of cell attributes. PLRacc reflects the model’s understanding of blood cell attribute partial label data and its ability to handle such data. The higher the PLRacc, the fewer instances where the model’s predicted attribute results deviate from blood cell morphology, showing a deep comprehension of the cell attribute partial label structure by the model. Using these two ACC metrics as criteria for measuring the model’s classification performance effectively demonstrates the depth of understanding and mastery of domain knowledge after integrating blood cell morphology knowledge. The improvement in understanding not only signifies an enhancement in model interpretability but also indicates a higher quality of knowledge alignment between the morphology and deep learning technology.
3.3. Evaluation of Cell Attribute Classification Performance
In this study, we compared our proposed P4BC method with the original method in terms of blood cell attribute classification performance. The original method, as a single classification method for addressing PLL problems, trains on a specific attribute of blood cell images in each experiment. We adopted this single classification approach to independently train on 11 different blood cell attributes. Subsequently, we introduced phase 1 of the P4BC algorithm, a multiclassification strategy aimed at solving PLL problems. This algorithm allowed us to train on images of all the blood cell attributes simultaneously. Then, we evaluated the performance of these two algorithms using the ACacc and PLRacc metrics, respectively. Furthermore, to validate the necessity of each modification made to the original method, we designed a series of ablation experiments. These experiments aim to systematically assess the impact of each modification on the overall model performance, ensuring the effectiveness of our method in improving the blood cell attribute classification accuracy.
We enhanced the original method to better handle multiclassification in partial label learning. Our method integrates three key components: A, B, and C.
The original method was a single classification task for solving PLL problems, with only one group of prototype modules, and the number of modules corresponding to the number of categories. In contrast, our method is suitable for multiclassification problems in partial label learning. Considering our dataset contains 11 different blood cell attributes, we expanded the prototype modules into 11 groups, with the number of modules in each group directly reflecting the number of attribute values for the corresponding cell. Storing all the cell attribute features in one group of prototype modules might lead to confusion between attributes. We aim to reduce this risk. We saved each attribute’s feature information in its respective prototype module group. We aim to improve the specificity and accuracy of the attribute classification. We named this improvement the “A” component.
The original method’s candidate label set and our designed blood cell attribute candidate label set show significant structural differences. In the original method, a sample’s category candidate label set might not include the sample’s true label. Therefore, as the training progresses, the original method adjusts the category candidate label set, hoping to include the true label. In contrast, our attribute candidate label sets are reinforced with blood cell morphology knowledge, ensuring the sets contain the attribute’s true label, and each attribute label has the potential to be the correct label. Based on this, we did not adopt the original method’s pseudo-label updating mechanism but instead improved it. We hope that the attribute candidate label sets aligned with the morphology do not introduce new disturbances or lose any potential ground-truth labels during training. We named this improvement the “B” component.
In terms of the backpropagation of the loss function, the original method’s strategy was to backpropagate using the average loss calculated for each batch. In contrast, our algorithm conducts separate backpropagation for the blood cell attribute loss calculated for each batch, instead of using the average value of all the blood cell attribute losses for backpropagation. We hope that the model can learn the unique feature information of each cell attribute and reduce the risk of confusing attribute features. We refer to this improvement as the “C” component.
First, we compared the original method with P4BC Phase 1 using the ACacc metric and conducted a series of ablation experiments. In these experiments, we created a version of P4BC Phase 1 from which the “A”, “B”, and “C” components were removed, referred to as P without ABC. Similarly, versions removing any single component also followed a similar naming convention. The experimental results are shown in
Table 4.
Compared to the original method, our method shows an 8.66% increase in average ACacc. The performance for “Nuclear cytoplasmic ratio” notably increases by 75.74%. “Granule color” also rises by 17.99%. These results confirm the accuracy of the prototype modules in our algorithm in distinguishing and storing feature information for cell attributes. Updating pseudo-labels without changing our attribute candidate label set structure allows the model to focus on the most probable attribute results. These results align with the blood cell morphology. Independently backpropagating the loss for each blood cell attribute reduces the risk of mixing attribute feature information. This process further boosts the model’s learning efficiency. These results demonstrate that our algorithm surpasses the original method in classifying specific cell attributes, proving its superiority in blood cell attribute classification. The method proposed in this study is a partial label multiclassification algorithm. It trains all the blood cell attribute samples within a single deep learning neural network. The original method functions as a single-classification model, dedicating each iteration to training one cell attribute and requiring a distinct model for training each attribute. In contrast, our algorithm can train multiple attributes simultaneously within a single model. This integrated method surpasses the original in cell attribute classification and demonstrates our algorithm’s efficiency.
The ablation experiments show that each modification we made significantly affects the blood cell attribute classification performance of P4BC Phase1. Removing the “C” component led to a 15.04% decrease in the average ACacc. Notably, the overall attribute classification performance suffered greatly under the condition of removing the “C” component (i.e., P without C). This result indicates that, while backpropagating the average value of blood cell attribute losses might slightly enhance the model’s ability to recognize and classify specific attributes locally, it significantly reduces the model’s accuracy in classifying other cell attributes. This phenomenon suggests that backpropagating the average value of blood cell attribute losses causes a dispersion of model attention. This dispersion inevitably integrates feature information from other attributes when learning the features of a specific cell attribute, thus increasing the risk of confusion in feature recognition and significantly weakening the overall learning efficiency of the model. In the scenario of P without C after removing the “B” component, we observed a 7.46% decrease in ACacc. This result indicates that continuing with the original method’s pseudo-label strategy led to changes in our predefined candidate label set structures, reducing the model’s classification performance in later training. This decrease in performance could be due to the incorrect replacement of true labels for blood cell attribute samples in the sets or the introduction of options into the candidate label set for the specific categories of blood cell attributes that do not align with the morphology. This further hindered the model’s ability to effectively learn the attributes of certain categories of cells based on morphology. This discovery emphasizes the scientific nature and importance of attribute candidate label sets based on morphological knowledge. It also highlights the necessity of aligning domain knowledge with deep learning technology. Removing the “A” component, features of different blood cell attributes were stored in the same prototype modules. This approach hinders the model’s ability to distinguish between attribute features, leading to a disorganized state of feature information in the prototypes. As a result, this confusion has serious consequences, affecting the model’s performance and accuracy.
3.4. Partial Label Recognition Performance Evaluation
We used PLRacc as an evaluation metric to compare the performance of our algorithm with the original method, supplemented by ablation experiments for analysis. The results are shown in
Table 5.
P4BC Phase1 achieved a 1.09% improvement over the original method. Thus, our method shows superior performance and clear advantages in handling blood cell attribute partial label data. In our study, comparing P4BC Phase1 to the P without C strategy, which averages all the cell attribute losses before backpropagation, showed a 1.43% increase. This indicates that averaging the attribute losses for backpropagation might blur the distinctions between different attributes. However, it effectively shifts the model’s focus from complex individual attributes to overall attributes. This shift allows for a more balanced understanding of each attribute and its candidate label set. However, a significant downside of P without C is its reduced focus on attributes, which should be prioritized. This reduction leads to a decline in the overall attribute classification performance. Therefore, in our study, we adopted the P4BC Phase1 strategy to balance PLRacc and ACacc.
Our algorithm surpasses the original method in learning the blood cell attribute features and understanding the partial label structures. This indicates the effective application of partial label structures built on blood cell morphology knowledge in the training process of deep learning networks. It ensures the accurate preservation of the cell attributes in the prototype modules that align with the morphology. Also, the pseudo-label updates and prototype modules interact during the optimization of the loss function. This interaction continuously guides the model to precisely learn the blood cell attribute features and distinguish between different attribute features. This method enables the model to deeply understand the feature information of each blood cell attribute and accurately identify the true label among multiple potential attribute labels. This study not only validates the effectiveness of integrating blood cell morphology knowledge into the deep learning training process but also achieves the alignment of domain knowledge with deep learning technology. By using prototype modules that store blood cell attribute feature information and generating predictions that align with blood cell morphology, the model’s interpretability is significantly enhanced.
3.5. Cell Category Classification Based on Blood Cell Attribute Network Model
In phase 1 of the P4BC framework, we trained a blood cell attribute network model using blood cell attribute partial label data. In phase 2 of the framework, this network is used to perform the blood cell category classification task. We conducted a detailed comparison of its performance with a ResNet50 model that was not specifically trained on blood cell attributes. Recall is provided by Equation (10):
where TP represents the number of correct positive predictions by the model. FN represents the number of instances where the model incorrectly predicts a positive as negative. Precision is provided by Equation (11):
where FP represents the number of false positives where the model incorrectly predicts a negative as positive. Comparative results are shown in
Table 6.
The data show that the cell attribute network model and ResNet50 perform similarly in cell classification accuracy, precision, and recall, with the largest gap not exceeding 0.23%. This gap is within an acceptable error margin. It ensures the recognition accuracy of blood cell attributes while maintaining high accuracy for blood cell categories.
4. Discussion
In the field of medical image processing, accurately classifying the specific categories of cells is crucial for doctors. Specific blood cells show attributes that are hard to separate due to their morphology. Thus, creating a deep learning network for blood cell classification requires extensive accurately labeled data, incurring high costs. We propose P4BC, a partial label learning algorithm to train networks with less precisely labeled data, aiming for accurate blood cell attribute classification while cutting costs. The model focuses on the likely attribute labels using a pseudo-label update mechanism and stores the attribute features in prototype modules. By optimizing the classification and contrastive losses and backpropagating each attribute’s loss independently, our approach prevents feature confusion, enhancing the understanding of attribute nuances.
Our algorithm outperforms the original method with an 8.66% increase in blood cell attribute recognition accuracy and a 1.09% rise in partial label recognition accuracy. These enhancements underscore our method’s effectiveness in classifying blood cell attributes and understanding partial label structures. Our candidate label sets differ from the original method’s randomly generated candidate label sets by including morphological knowledge. This ensures that the reasonable attribute ground-truth labels are always in the sets. This integration boosts the interpretability and accuracy of our model, offering more reliable predictions based on morphological insights. Our algorithm trains multiple cell attributes together in a single model, marking a substantial efficiency gain over the original method. The original method demands a unique model for each attribute’s training. Our unified training method not only enhances the cell attribute classification accuracy but also demonstrates our algorithm’s heightened efficiency. Our approach not only maintains high accuracy in attribute prediction but also achieves the knowledge alignment between deep learning and blood cell morphology, while ensuring high precision in cell category classification as well.
Our algorithm has its limitations. First, the PLRacc metric shows a slight decrease for P4BC Phase1 compared to P without C. This forces our algorithm to find a balance between PLRacc and ACacc, ensuring both an understanding of the cell attribute partial label structure and the ability to learn attribute features. Therefore, we chose P4BC as our final approach. Our cell attribute network model shows a slight decrease in accuracy, precision, and recall rates compared to ResNet50 trained without attribute partial labels. This may be due to the increased complexity introduced by the attribute partial labels. Moreover, these outcomes suggest the need for the further optimization of the model structure or training strategies in future research. This would allow the algorithm to better utilize partial label data, enhancing both the understanding of the partial label structure and the learning of attribute features, and thereby improving the cell category classification performance. Despite these challenges, partial label learning can reduce the cost and time associated with labeling cell attribute data while achieving an excellent attribute classification performance. Partial label learning based on blood cell attributes remains a promising research direction.


