1. Introduction
The most important parameter of real-time systems is their repeatability and time predictability. This means that every task performed in such a system must meet its deadline. However, modern electronic systems perform a wide variety of functions with ever-growing complexity. This is a consequence of the constantly increasing requirements and expectations of users. This demanding market is resulting in an increase in the complexity of real-time systems, and this makes the control of the timing parameters of such systems much more difficult. The issue is crucial in systems applied in medicine, transportation, communications, aviation, and many other fields that are related to the need to provide safety.
Research and work on time-predictable systems has been going on for many years. Both hardware solutions in the form of new structures and processing schemes and software solutions in the form of software timing concepts, extensions to the instruction set architecture (ISA microarchitecture), etc., are being explored. One of the very important properties of contemporary time-predictable systems is their multitasking, i.e., the ability to concurrently handle different tasks with various timing requirements.
The authors of the paper also proposed their own original architecture for a time-predictable system, the latest version of which was presented in [
1]. This solution is based on a multi-core regular structure and pipelined processing. The pipelines of the cores can be reconfigured and can consist of 5 to 12 stages, depending on the particular requirements. Moreover, the threads’ interleaving mechanism, when applied to pipeline processing, minimizes the risk of hazards. Previously published works have addressed various design issues related to ensuring time predictability of tasks and the correct process of task distribution among resources (cores). Different task scheduling options were also analyzed depending on additional externally imposed requirements and design constraints related to, among other things, power consumed, processing efficiency, or required resources. In their previous work [
1], the authors presented an original environment for accurately measuring task execution time, which is a key parameter for time-predictable systems. They introduced the original Worst Case Timing Analyzer (WCTA), which allowed precise control of the timing of the designed system. However, a very important element of modern multitasking systems is the determination of the predicted energy requirements.
Unfortunately, commercial design tools such as the VIVADO system rely on probabilistic data. In this paper, the authors present a method for measuring the power consumed by individual tasks operating in different configurations (system scenarios). The main contribution of the authors in the presented work is the development of an accurate method of measuring power depending on the system load and the application of the experimental results for precise prediction of the energy demand of a real-time system in relation to the scenario, i.e., the configuration of such a system. In addition, the authors proposed utilizing the original task frequency (TF) factor for power estimation, which for time-predictable systems includes both switching activity and system operating frequency. They analyze the results obtained and propose a precise way to estimate the energy parameters of a multi-task system at the stage of its design (configuration) with full-time predictability. What is essential is that these results were confirmed using experimental tests for randomly generated system configurations, i.e., for different numbers of processed tasks and different numbers of supported cores. The implementation uses a modern programmable logic platform: field programmable gate array (FPGA) Xilinx KCU105, which is very suitable for prototyping digital systems.
The paper is organized as follows. The next section discusses related work, and then the authors briefly recall the structure of their real-time system. In the fourth section, the power measurement method realized on the FPGA evaluation board is presented. The fifth section includes the experimental part of the work and presents the results of the measurements along with their qualitative and quantitative analysis. The last section summarizes the work.
2. Related Work
At the 2007 DAC conference, Edwards and Lee [
2] conceptualized the idea of PRET (PREcision Time machines), and since then, the problem of time predictability has been intensively studied, and many interesting solutions have been proposed in this area. Authors of the PRET idea [
2] recommended the implementation of pipelined processing with a thread interleaving mechanism [
3], which enabled reducing hazards. Wilhelm in [
4] provided a detailed overview of many issues concerning the design and modeling of real-time systems, including pointing out that “the analysis of pipelines is a very complex part of the overall analysis because (…) most pipelines do not have compact, effectively updatable abstract domains”. This study shows that the timing predictability of embedded systems requires a detailed analysis of many issues including hardware, software design, communication between system modules and layers, and task scheduling. In [
5], a detailed discussion of several aspects of worst-case analysis covering single tasks and various instances of their execution, the task mapping process, operating systems, and memory operations (especially caches) can be found; the authors introduce special traces for this purpose. An interesting time-predictable architecture was described in [
6], in which a worst-case analysis was performed dynamically while the system was running and, based on a set of factors, task scheduling was adjusted online. This analysis was implemented at a high system level of abstraction using the SystemC language. The authors of the paper [
7] presented MPSoCBench, a simulation toolkit that enabled the simulation of a system consisting of a set of scalable virtual multiprocessors on a chip (MPSoC). The environment allowed the development and testing of new applications, methodologies, parallel software, and hardware components. Furthermore, the toolkit was equipped with algorithms and mechanisms for dynamic voltage and frequency scaling (DVFS), thereby controlling overall system throughput and power consumption.
An essential factor in the quality of modern integrated circuits is power consumption. Generally, the power consumption is determined using the circuit currents (leakage, standby, short circuit, etc.) [
8]. Four basic techniques exist for minimizing power dissipation in embedded electronic systems: voltage scaling, frequency scaling, power gating, and clock gating. According to theoretical considerations, as well as practical experiments, many have shown that the energy consumed by electronic circuits strongly depends on the operating frequency [
9,
10,
11,
12,
13].
Numerous experimental studies have shown that the need to reduce energy consumption is often associated with a reduction in system performance [
9]. In the case of real-time applications, when task deadlines are crucial, making a final design decision is very difficult. There is usually a trade-off between energy and system performance [
11]. Ref. [
12] presented experiments on the ARM Big.LITTLE real-time architecture showed a strong correlation between energy and system performance; the authors attempted to match the timing of real-time tasks running in mobile applications with system throughput. Li [
10] went on to make some interesting theoretical considerations in his paper on scheduling tasks with time and energy constraints on multiprocessor computers. He suggested several algorithms working with discrete clock frequencies and supply voltage levels. He also proved that the problem of minimizing schedule length with energy constraints and the problem of minimizing energy consumption with schedule length constraints are NP-hard even on a single-processor computer with only two speed levels.
Another work [
14] offers a set of interesting experiments conducted on various real-time system architectures. The authors showed a correlation between the performance of a real-time system and the overall power dissipated by the system and a number of factors, such as thread-level parallelism, communication models, and microarchitectures of general-purpose processors. Ref. [
15] proposed a set of task scheduling algorithms based on a combination of two different approaches: global DVFS (dynamic voltage and frequency scaling, called GDES), which moves tasks to processor sockets that generate minimal dynamic power consumption, and non-DVFS (NDES), an energy-efficient scheduling based on the concept of forward socket analysis. There are also scheduling techniques based on artificial intelligence algorithms and heuristics, such as machine learning [
12] or linear programming [
13].
The approach presented in [
16] used group-based energy-efficient dual-priority scheduling (GEDP), which isolated different types of tasks and thus avoided interference and minimized context switching between tasks. In contrast, [
17] presented a hierarchical task prioritization approach (HDA), where the mapping process considered the dependencies between tasks, resulting in better resource management and communication organization in the system. The authors of [
18] proposed the use of a dynamic mechanism that analyzes the load on resources during task execution. Specialized managers of resource load and power allowed for control of dynamic energy consumption via an on/off mechanism. An industrial approach was presented in [
19], where many aspects of practical applications of real-time systems and pointed out the limitations of multicore architectures were analyzed. Many other interesting techniques can improve the processing quality of a multitasking system, for example, the use of a benchmark-based approach [
7] or proper synchronization of system clusters [
20]. The authors of [
21] discussed and demonstrated a very interesting clock gating methodology that allowed efficient use of system modules and reduced overall system energy. Another publication [
22] presented clock gating applied to a group of interrupts, and the whole process was preceded by a detailed analysis of block activity. Ref. [
23] also showed a clock gating strategy successfully applied to data flow designs based on stream processing and implemented in FPGA structures. The authors of this work also thoroughly analyzed the impact of gating techniques on energy consumption in various architectures of real-time systems [
24]. The papers [
18,
25] dealt with the problem of load-balanced scheduling, and the authors of the applied techniques reported a reduction in the energy consumed by the systems. The authors of the papers [
26,
27] proposed two alternative hardware scheduler solutions that significantly speed up the operation of a multitasking system compared to software scheduling. The paper [
26] presents Heap Queue which is a MIN/MAX Queue architecture, while the solution discussed in the paper [
27] applies a scheduling mechanism based on the Earliest Deadline First (EDF) rule using priority queues.
3. Real-Time System Architecture
In recent years, the authors have been developing their original real-time system architecture [
1,
6,
9,
28,
29]. The microarchitecture of the cores constituting the presented system is based on the instruction set architecture (ISA) of ARM family processors. However, a special extension has been introduced to handle data exchange and execution time control [
1], including the addition of such instructions as:
AD counter_number—the instruction activating the appropriate deadline counter;
DD counter_number—the instruction deactivating the appropriate deadline counter;
SD counter_number value—the instruction loading the value to the deadline counter (setting the deadline);
WFD counter_number value—the instruction suspending the execution of the program until the deadline counter reaches 1.
The system is fully time-predictable and can process tasks with varying degrees of time criticality [
24]. The structure of the system can be configurable and can consist of one to several cores. The cores are based on pipelined processing with interleaved hardware threads [
3,
4,
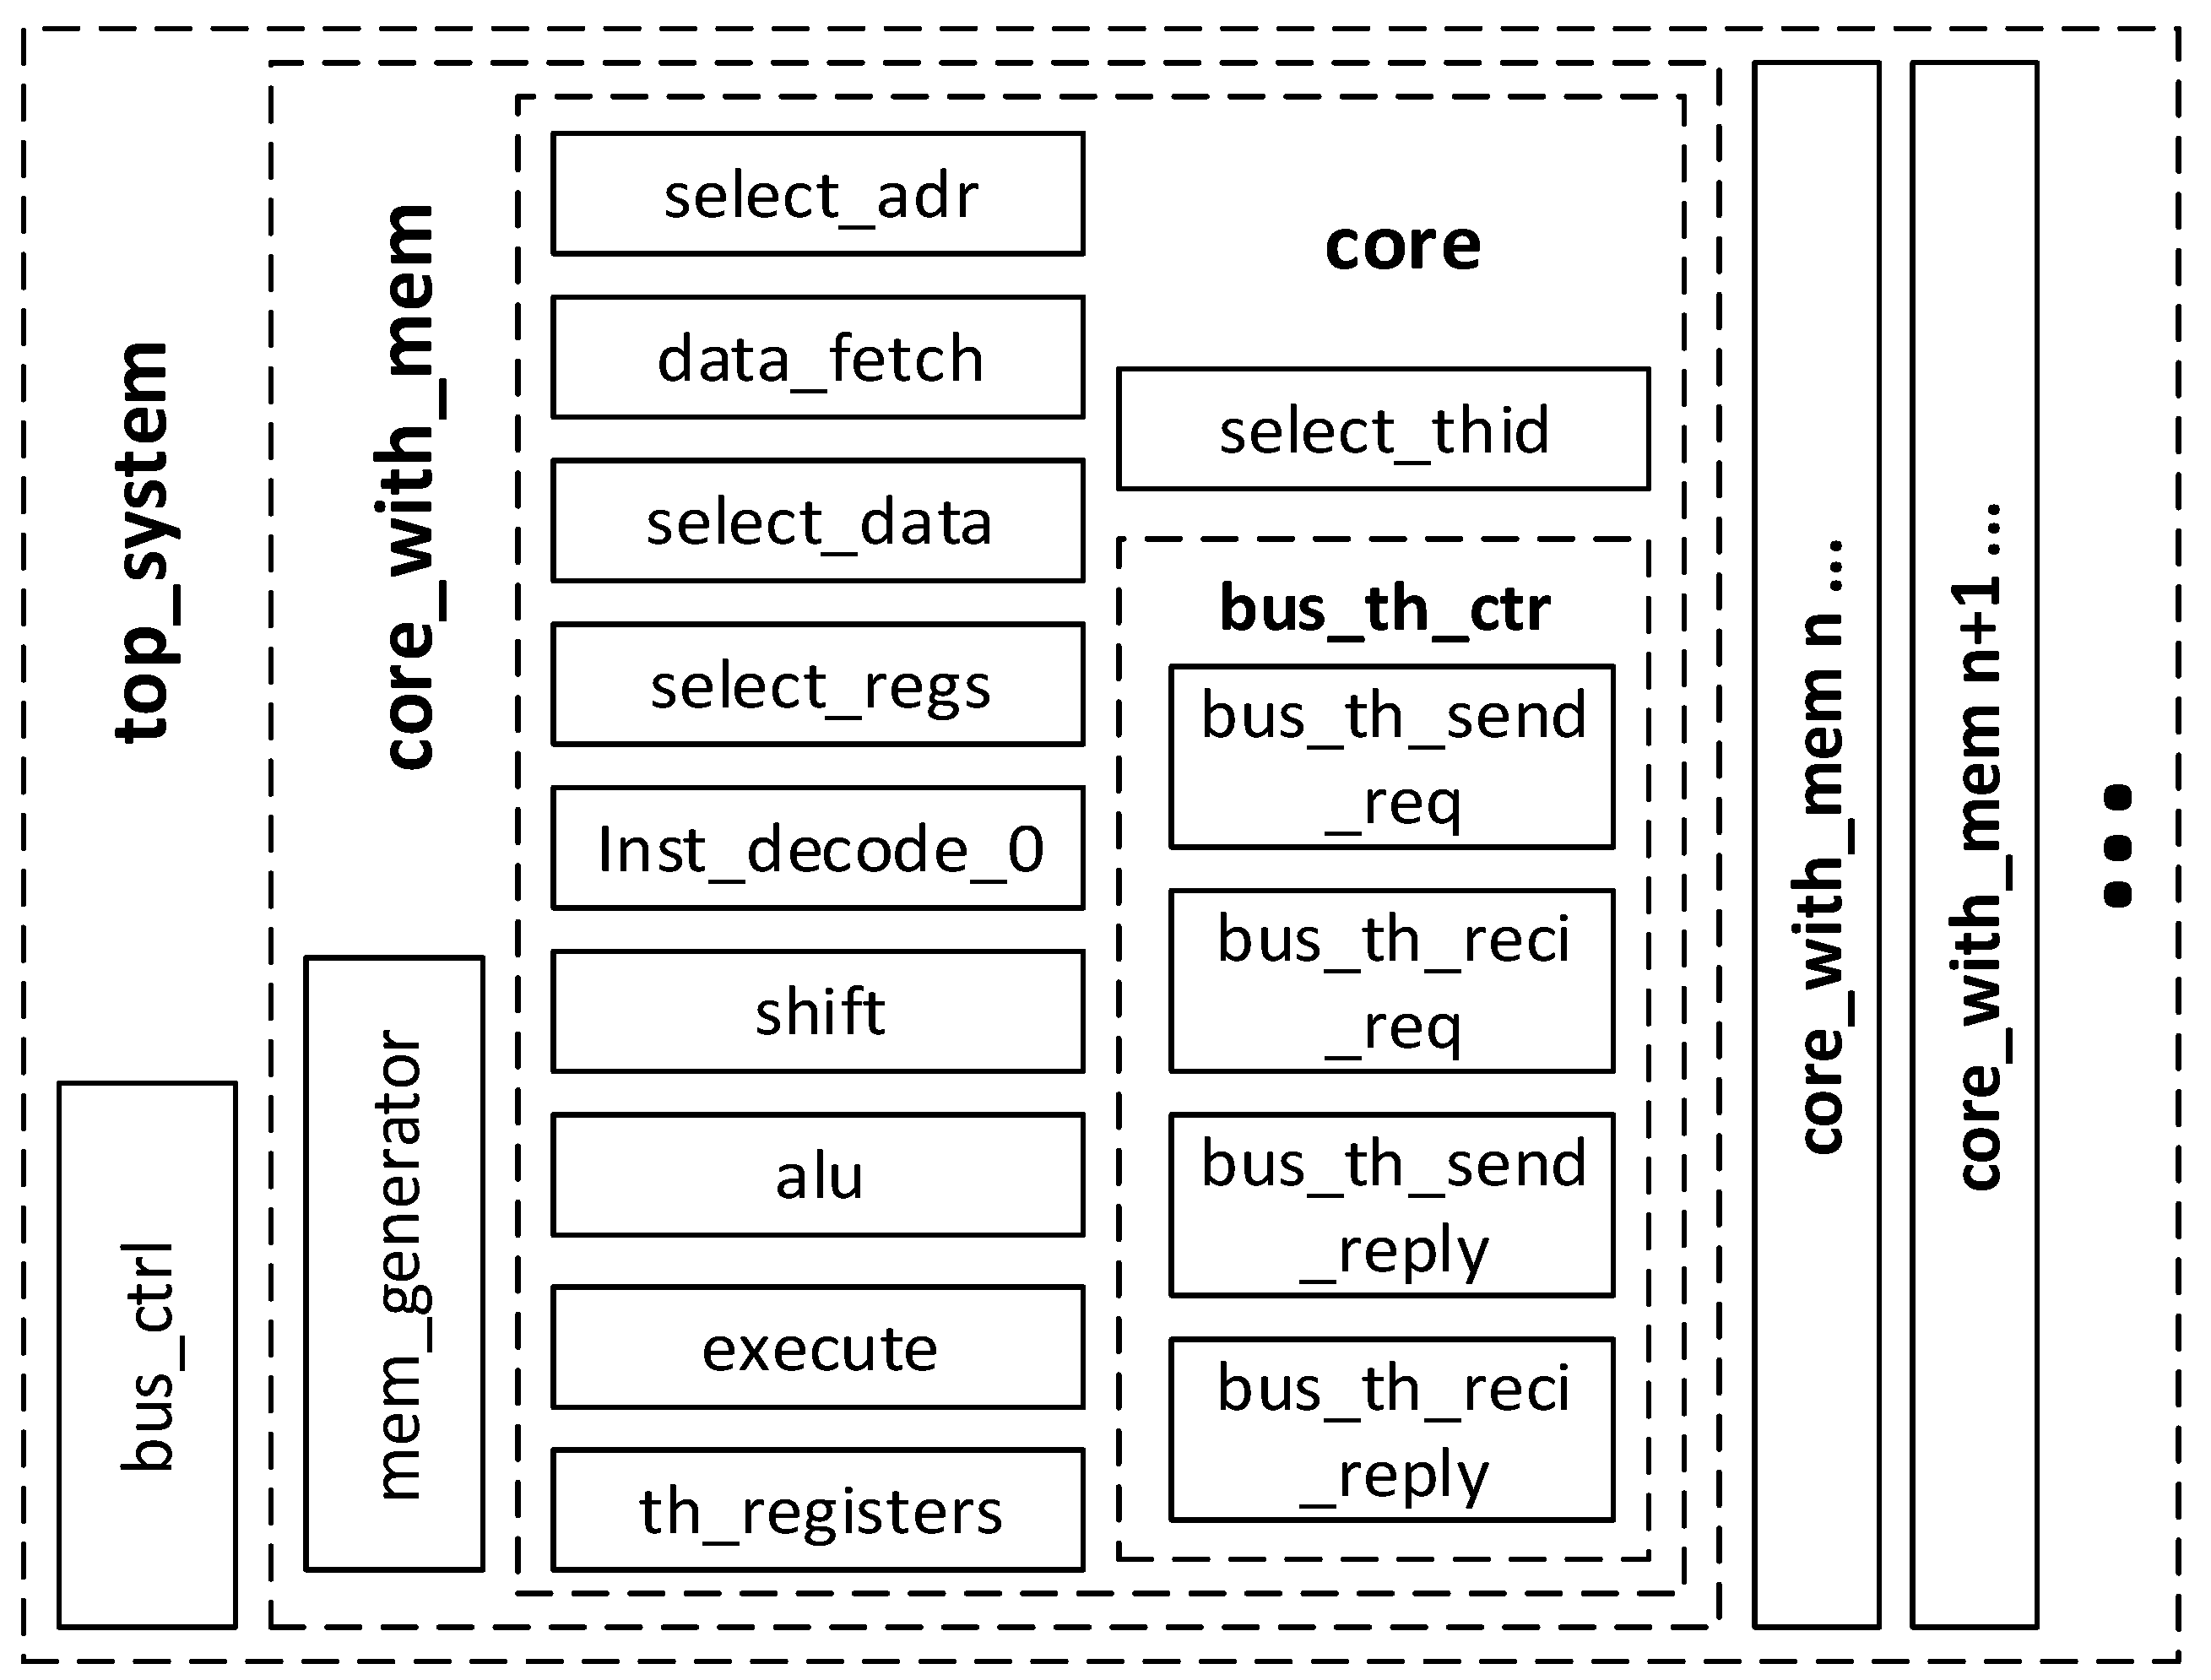
24]. Such a solution protects against the occurrence of hazards, which has been repeatedly emphasized in previous works. The cores are connected by a common bus (
Figure 1), and tasks are assigned to them via a static scheduling process. The number of cores and the size of the pipeline are determined by the number of tasks, their timing parameters, and additional requirements/constraints imposed during the design process. The basic assumption of the system is the capability of fully asynchronous execution of tasks, i.e., the starting moment of each task is unpredictable, a task is initiated using an external signal (
Figure 2), and at a given moment of time, the number of active different tasks can be arbitrary. Of course, if a constant cyclic execution of a given task is required, it is sufficient to permanently set the active signal triggering this task.
As mentioned, thread processing in the core is interleaved. This requires duplication of register files, command counter, stack, etc., so that each task has its individual data and processing is consistent.
Figure 1 shows the structure of one of the cores, and
Figure 3 depicts these operations in detail, with a breakdown of the basic stages of the pipeline. A very important element of this microarchitecture is the interleaving cycle register (ICR). A practical implementation of ICR is shown in the shaded area. The ICR contains identifiers (addresses) of individual threads corresponding to the tasks whose instructions are to be executed in the pipeline at the moment. The creation of the ICR register contents is performed at the task scheduling stage and is based on the analysis of the basic timing parameter, named by the authors the task frequency (
TF). The
TF parameter is calculated from the following relationship:
where:
Ci—the maximal number of instructions of the program to execute the i-th task (except Mi);
Mi—the maximal number of memory access instructions of the i-th task; and
Di—the deadline of the i-th task.
Figure 3.
Basic structure of the core pipeline processing with threads’ interleaving mechanism.
Figure 3.
Basic structure of the core pipeline processing with threads’ interleaving mechanism.
For tasks that do not communicate with other tasks, the value of the
Mi parameter is zero. The other parameters (
Mdur and
Minindistance) are determined using the specific configuration of the system architecture [
1] and are fixed for this configuration.
Mdur denotes the number of clock cycles needed to perform a memory operation and is relevant for dependent tasks, i.e., those threads that exchange data with one another. The parameter
Minindistance determines the minimal interval between two consecutive instructions of the same thread in a pipeline processing cycle (measured using the number of pipeline stages), which allows for avoiding data and control hazards [
3].
Simplifying, we can say that the value of the TFi parameter specifies how many times per second instructions for the i-th task must be executed so that this task is completed on time (i.e., before its deadline).
We have a configurable model of the proposed system, described in the Verilog hardware description language (
Figure 4). This model is synthesizable and has been implemented into an FPGA board [
30], where the post-performance of the concept and the system model have been experimentally verified. Thanks to the configurable model, this system can have a different number of cores that can handle a various number of tasks.
As presented in previous publications [
1,
9,
29], the proposed scheduling process allows obtaining the optimal hardware structure for a specific set of tasks and additional requirements/constraints related to parameters such as system performance, energy consumption, and chip area.
Several task scheduling methodologies have been proposed [
1,
9], and hence, the same set of tasks can be handled using different hardware structures, depending on the chosen methodology.
4. The Idea of Estimating the Energy Required by the System
One of the fundamental and commonly used equations describing the power dissipated in a digital system [
29] is the following:
where:
α—expresses the switching activity of the system (it can be controlled);
CL—a constant that denotes the switching capacitance;
VDD—the value of the voltage supply;
Fsys—the operating frequency.
As mentioned in the previous papers [
1,
9,
29], in the case of FPGA devices, the power consumed by the system can be controlled by reducing the frequency and the number of switches. According to the authors, the proposed
TF combines the two parameters. On the one hand, this coefficient captures the frequency of necessary calls (attachments) of a given task, which is related to the required deadline time. On the other hand, the parameters of tasks mapped to a given core (processing element) affect the final operating frequency of the system (core), so a simple linear relationship between the operating frequency and the power consumed by the system for time-predictable systems is not representative. The other two parameters responsible for dynamic power (2), i.e., a capacitance
CL and supply voltage
VDD, cannot be changed in an FPGA. The first one is technology-related, and the latter one is usually strictly defined for a particular implementation of an FPGA-type programmable structure.
A major drawback of FPGA design systems for prototyping electronic embedded systems is the significant imprecision of power estimation. In most cases, the power properties of the system are determined using probabilistic methods. This observation applies to the parameter related to switching activity. For example, in VIVADO, during system analysis, simulation experiments can be performed for a specific fixed value of this parameter (0%, 10%, 50%, etc.). Unfortunately, this does not accurately reflect the number of switching activities associated with the execution of a specific task in the system. A more precise prediction of the value of power consumed requires very tedious and time-consuming simulations based on accurate state transition tables. Such a solution would significantly increase design time and would be very expensive. Hence, the proposal of a more efficient method is based on real values derived from measurements and the determination of the functional relationship between power and task frequency. Theoretical considerations lead to the hypothesis that this relationship is polynomial. As will be shown, the experimental results presented in the following sections and the approximations confirm these considerations and make it possible to predict the energy requirements of time-predictable systems in a relatively simple way.
5. Practical Implementation of the Power Measurement System
The designed test bench (
Figure 5) enables accurate measurement of the power requirements of the proposed real-time system. It enables precise power measurement for various real-time system loads, unlike the Xilinx VIVADO system—the commercial software used to design FPGAs, in which power consumption is estimated based on very inaccurate probabilistic calculations.
The schematic diagram of the measurement workstation is shown in
Figure 5. It uses the XCKU040-2FFVA1156E FPGA chip, located on Evaluation Board KCU105 [
30]. The system was synthesized in 3 scenarios differing in the number of cores and clock frequency. Several scenarios will allow comparison of results and research over a wider range of parameters. The FPGA chip is clocked at 300 MHz, and then an internal MMCM (Mixed-Mode Clock Manager) primitive is used, allowing the frequency to be adjusted to fit the actuarial core scenario (99 [MHz], 51 [MHz] or 38 [MHz]). Measurement of the power demand of the system was realized by measuring the voltage on the measurement resistor 0.002 Ω through which the current of the VCCINT power rail (0.95 V) of the FPGA chip flows. A Tektronix DMM4040 multimeter (Tektronix, Wroclaw, Poland) was used to measure this voltage, transmitting the measurements to a PC, where they were logged along with the date and time of the measurement. Then, once the measurement was made, the measured voltage was converted to power based on the resistance of the measurement resistor and the voltage of the bus supplying the circuit (0.95 V).
In addition to the real-time system, a proprietary Task Trigger Signal Generator (TTSG) circuit was implemented in the FPGA. It was connected directly to the signals triggering tasks in the system, allowing them to run in any combination. This circuit forces the selected tasks to run continuously (when a task is completed, it is restarted). The TTSG was designed in such a way that it could be controlled via a PC, allowing external changes in the system load at will. To make it easier to control the startup of tasks in the system, a program in C# has been developed, allowing a simple change in the tasks being started, logging these changes along with the date and time. This allows comparisons of the log of the application changing the load with the logs sent by the multimeter.
Figure 6 shows an example of raw data from a voltage measurement on a measurement resistor, along with the plotted moments of time when the load of the entire system changed. During this measurement, the system load was randomly changed every minute (combinations of running tasks were changed). As can be observed, changes in voltage (and therefore power) occurred only for system load swapping. With significant changes in the load (for example, for a sample of about 15,000 marked in green on the graph), the measured voltage changes over time are visible. This phenomenon is associated with thermal changes in the system. The system requires some time to stabilize the temperature. Although these fluctuations are not large, in order to eliminate the influence of previous measurements on subsequent ones, the authors decided to measure the voltage for a sufficiently long time (here more than 1 min), and the final value is an average counted from the last 100 samples before any change in the system load.
Table 1 shows the consumption of resources needed to implement the tested scenarios. This information applies to the entire environment: the system and the TTSG. Resource consumption increases with the number of cores because computing units are multiplexed.
6. Results of Measurement Experiments
For the measurement experiments, a KCU105 board containing the Kintex UltraScale FPGA (XCKU040-2FFVA1156E) was used, which is more modern than previous versions of the [
1] system. The advantage of this kit is the ability to measure the currents drawn by the chip, thus accurately measuring power. A major disadvantage of the Kintex chip compared to the Virtex7 chip (XC7VX485T-2FFG1761C) used in this work is the much smaller available resources [
31,
32], which makes full approximation and comparison of systems impossible. Therefore, it was decided to test and measure three basic configurations: single-core, dual-core, and triple-core. In addition, 60 different tasks were implemented experimentally. These tasks had different deadlines and complexity. Different real-time system configurations can be used for all tasks. Since the basic assumption of the system is its full-time predictability, the minimum operating frequency of such a system decreases with a larger number of cores. This is, of course, due to the parallelization of calculations in a multi-core configuration.
In the beginning, 60 individual tests were performed, i.e., the measurement environment was configured so that only one task was run consecutively. In this way, the system’s power consumption results were obtained for each task individually executed. The results obtained in this way are presented in the graph in
Figure 7. These preliminary results show the relationship between power and the operating frequency, with the operating frequencies varying with the number of cores: the highest value of 99 MHz corresponds to a one-core configuration (1C), and the lowest value of 38 MHz corresponds to a system consisting of three cores (3C). The results of the initial experiments indicate the correctness of the hypothesis stated in
Section 4 regarding the relationship between power and task frequency (
TF). Further experiments were conducted to determine a more accurate empirical relationship.
6.1. Test of the System with Different Load
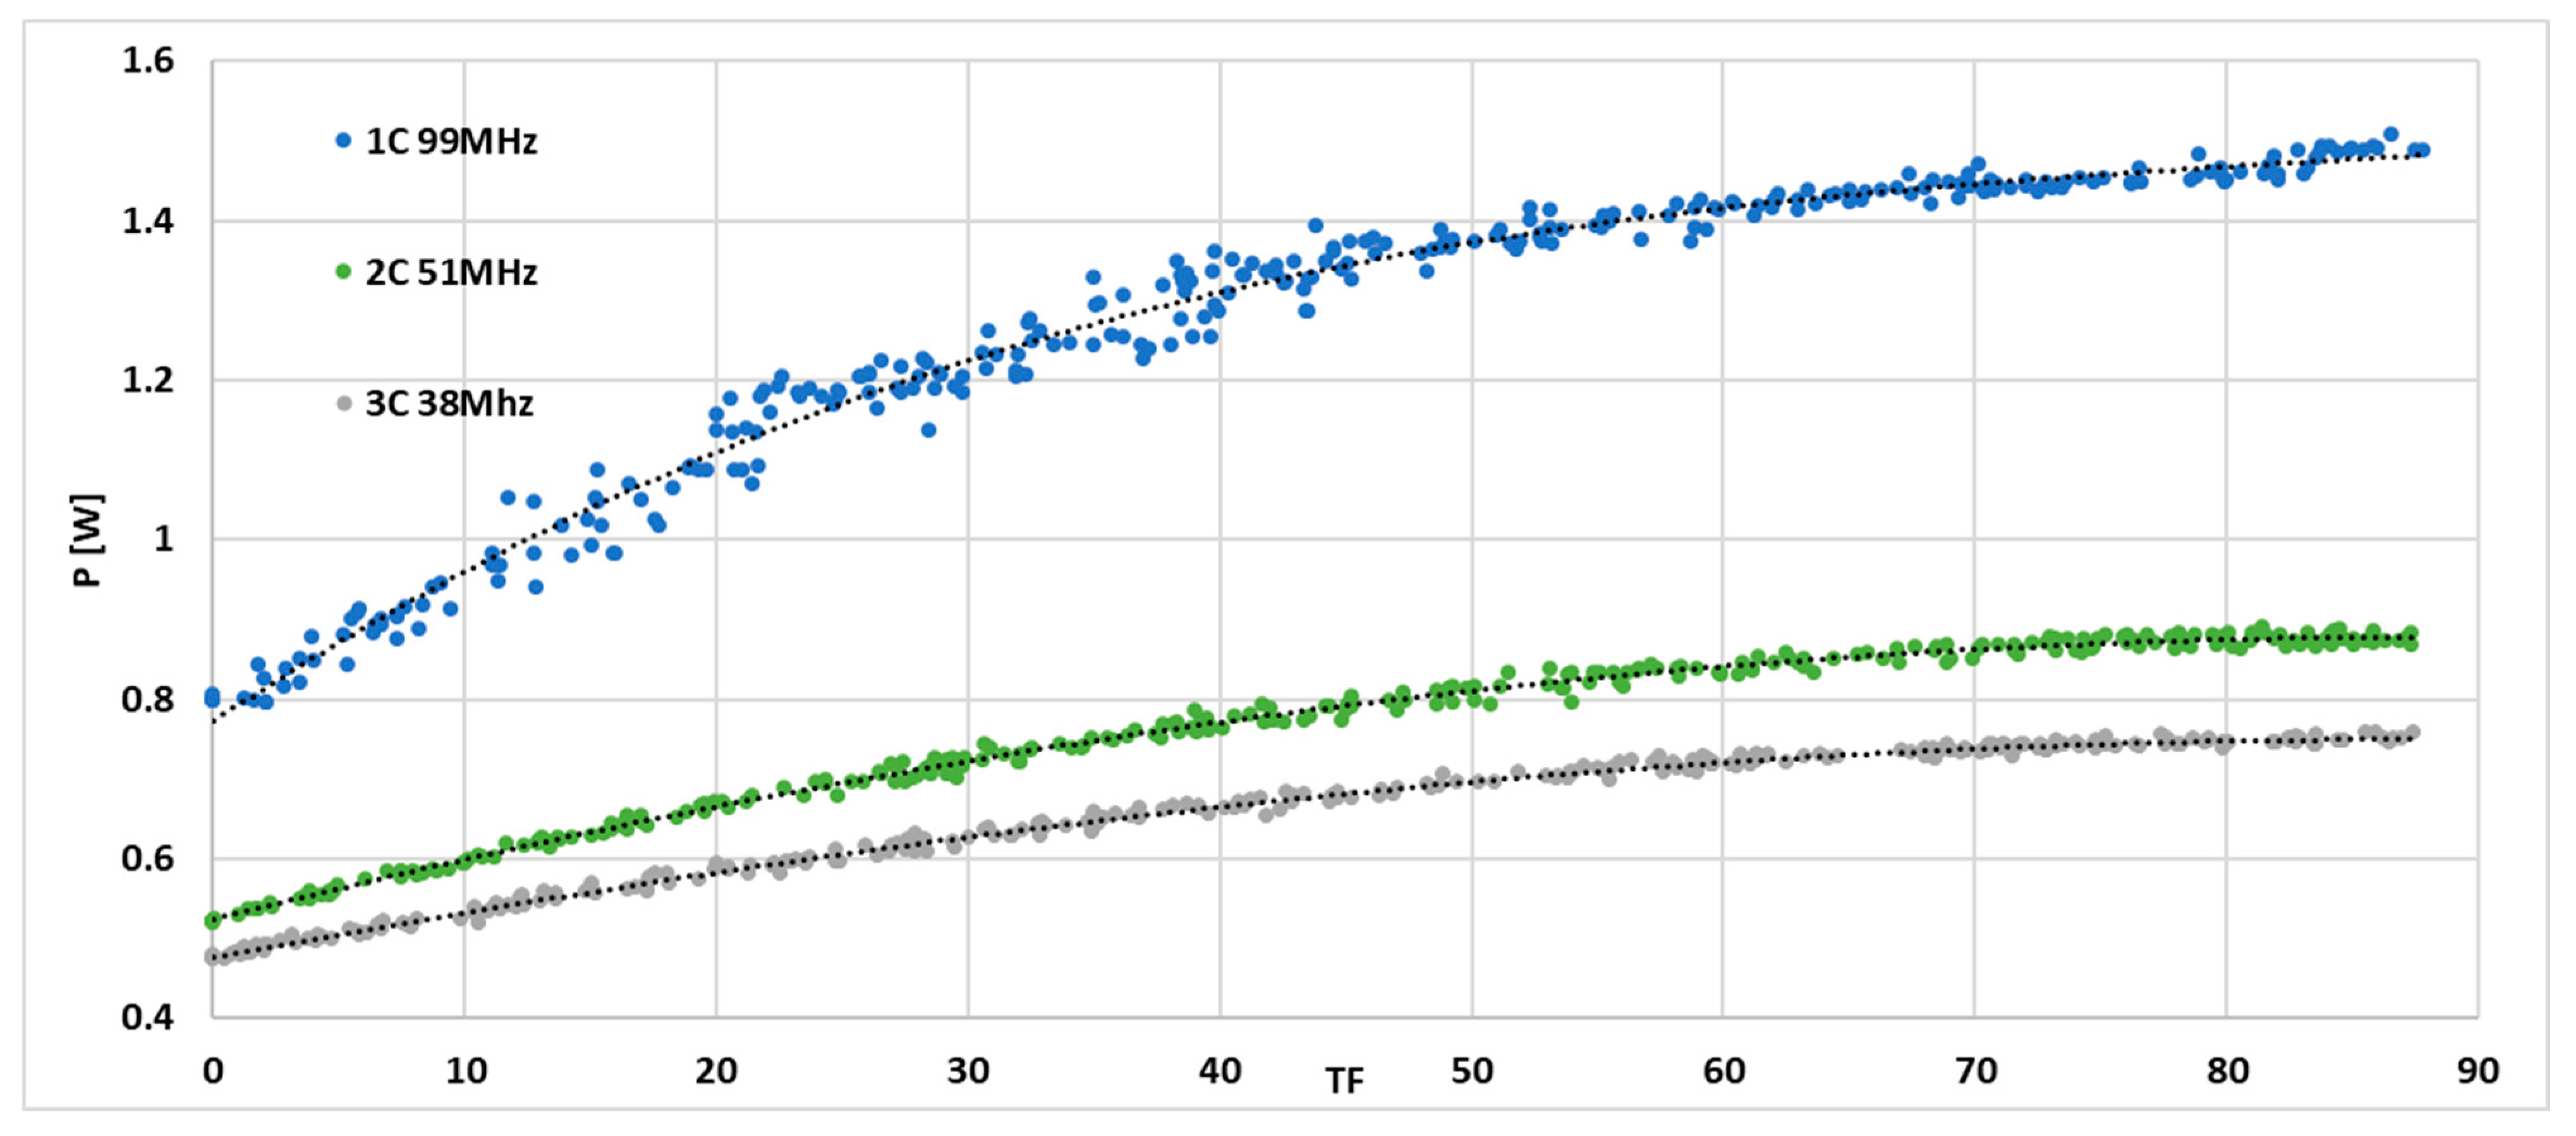
Figure 8 shows the measurement results obtained for randomly generated 300 different system loads, i.e., different summed values of the
TF parameter in each of the three configurations. The obtained results show a polynomial dependence, although some scatter in the results of up to ±10% is evident for some measurements. To eliminate the spread of these random measurements, an additional experiment was performed by monotonically increasing the load capacity of the system by running additional tasks in successive time windows so that the total task frequency factor (
TF) increased. Thus, the results obtained are illustrated in the graphs in
Figure 9. The particular implementations differ in both the amount of resources (the number of cores used) and the frequency of system operation.
6.2. Empirical Approximation
According to the authors, all curves show a clear polynomial character. It was possible to obtain a common general empirical dependence of the system power consumption curve on the frequency of
TF tasks and the frequency of system operation closely related to the number of cores (time-predictable system). If we consider the operating frequency as a parameter, the power consumed by the system for all configurations can be expressed by the empirical relation (3):
where:
The above relationship makes it possible to determine the energy requirements of a multitasking time-predictable system under a certain computational load. The graphs in
Figure 10a–c present the approximations and results obtained from the measurements. In this case, the obtained values of the coefficients, along with the 95% confidence bounds (given in parentheses), were:
a00 = 0.2564 (0.2465, 0.2664);
a01 = −0.000357 (−0.001033, 0.0003189);
a02 = −7.595·10−6 (−2.179·10−5, 6.604·10−6);
a03 = 2.089·10−7 (1.084·10−7, 3.095·10−7);
a10 = 0.005373 (0.005227, 0.005519);
a11 = 0.0001866 (0.0001789, 0.0001944);
a12 = −1.322·10−6 (−1.409·10−6, −1.235·10−6).
Figure 10.
Comparison of the power consumed by the time-predicted system for its various configurations (a–c). The solid lines indicate the power determined from the approximation, while the bars represent the measured values for a specific load (TF) of the system.
Figure 10.
Comparison of the power consumed by the time-predicted system for its various configurations (a–c). The solid lines indicate the power determined from the approximation, while the bars represent the measured values for a specific load (TF) of the system.
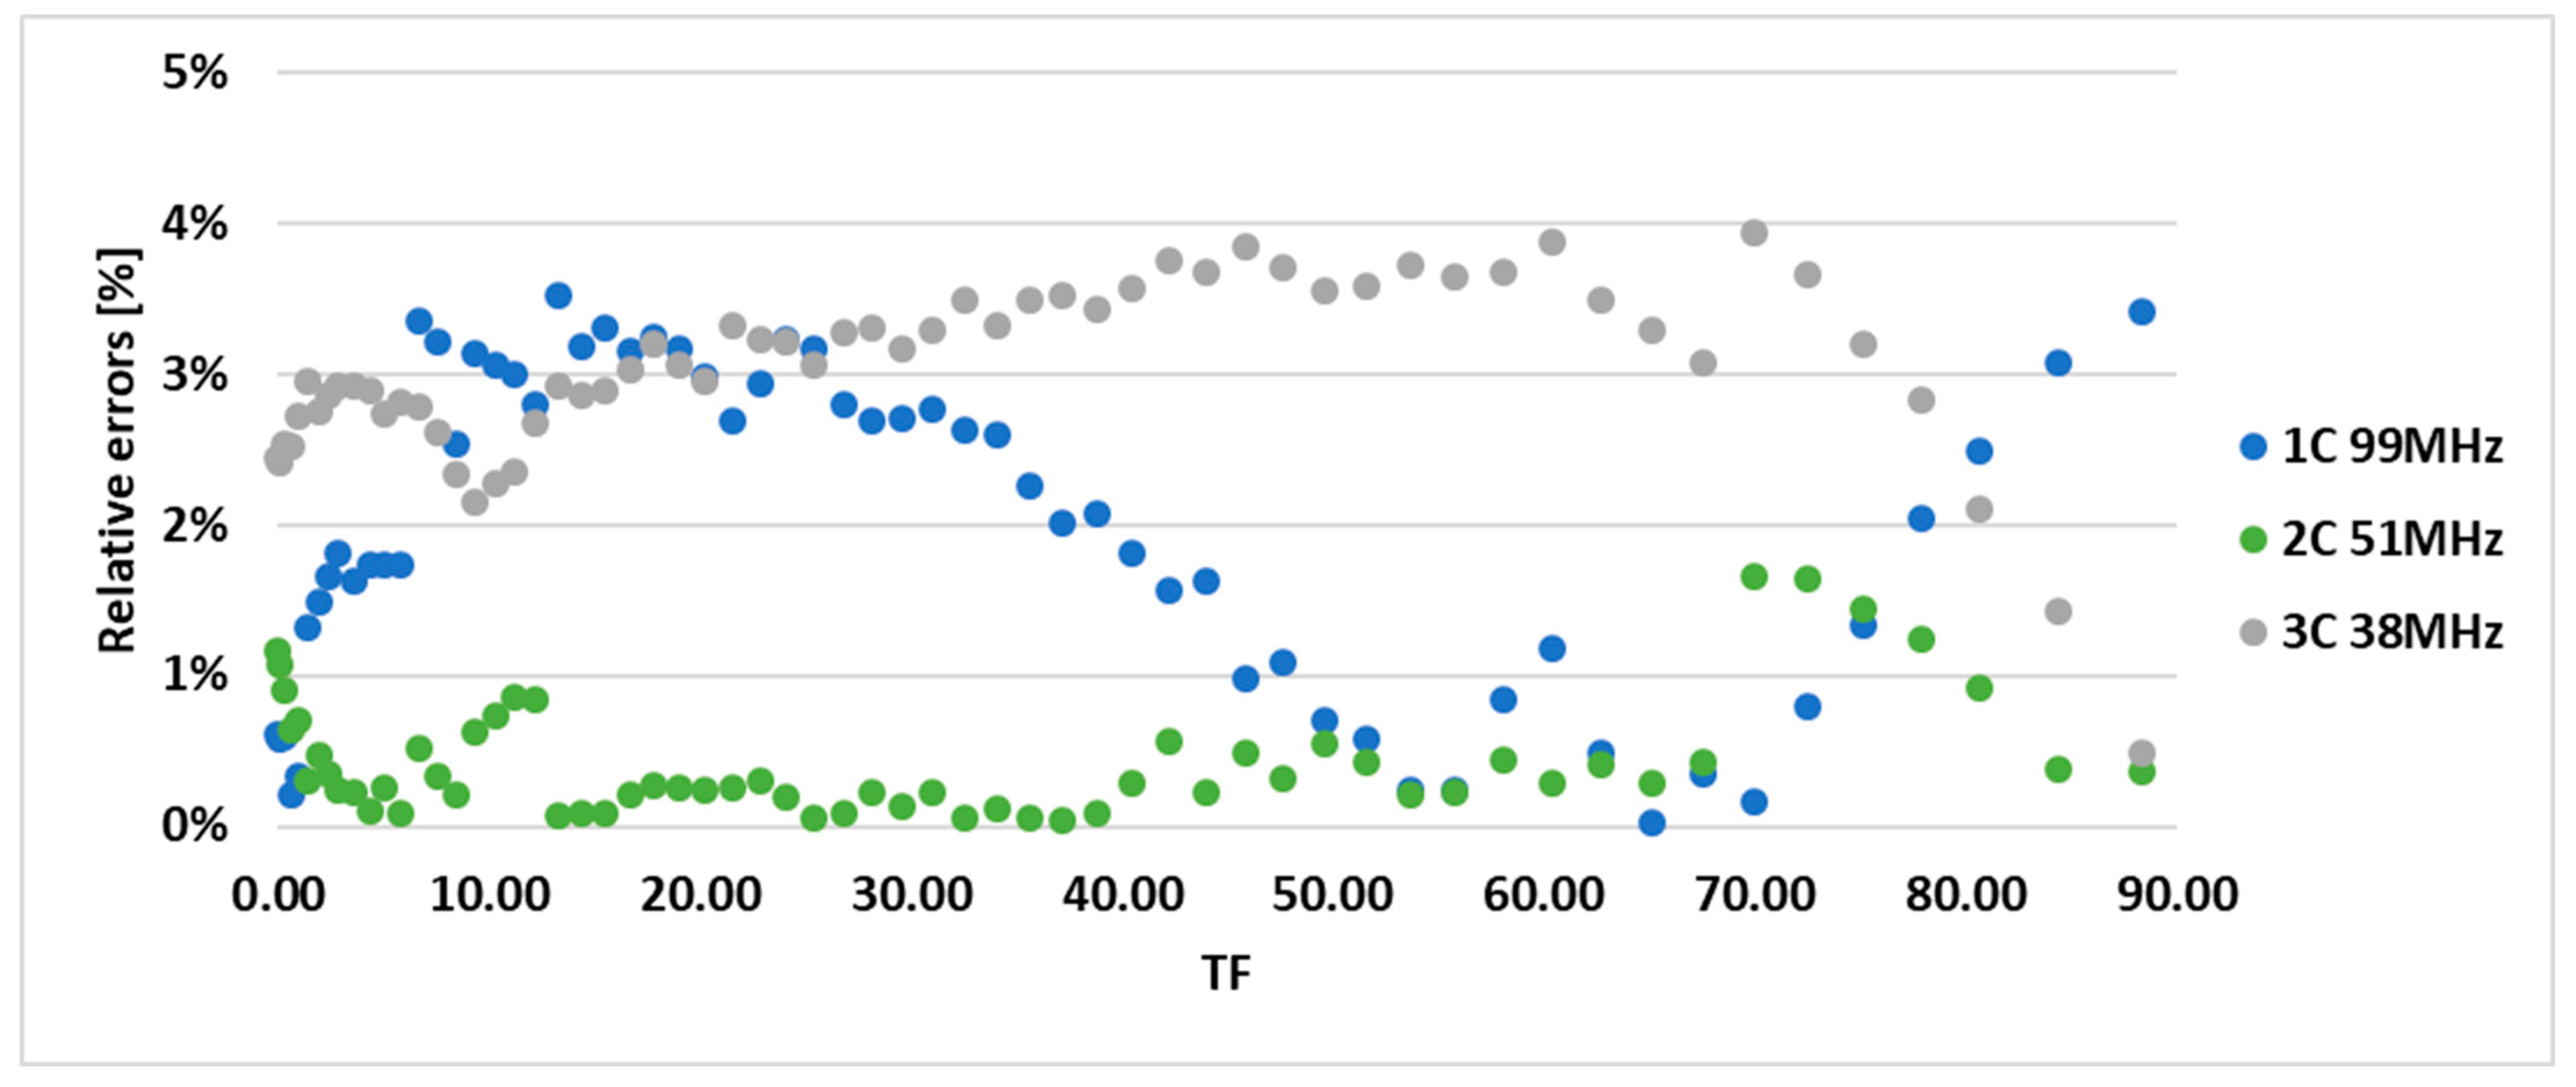
Based on the results obtained, it can be concluded that the method of estimating power consumption based on the approximation curve is reasonably accurate; the relative error does not exceed a few percent (
Figure 11). The errors shown in the graph above (
Figure 11) are acceptable for the coarse power estimation process (in the worst case, they do not exceed the 4% level) and are much smaller than the discrepancies reported in the VIVADO system. According to the authors, these are due to the very long time required for the experiment, which in this case lasted several hours. Despite using the procedure associated with the determination of the values described in
Figure 6, some parameters, especially the temperature of the FPGA, could change significantly. The approximation was carried out when the system load changed monotonically, i.e., the TF value was continuously increased, while during the measurement experiments, the system load value changed randomly. The two-dimensional power distribution function as a function of
F and
TF parameters is shown in
Figure 12.
6.3. Comparison to EDA Tools
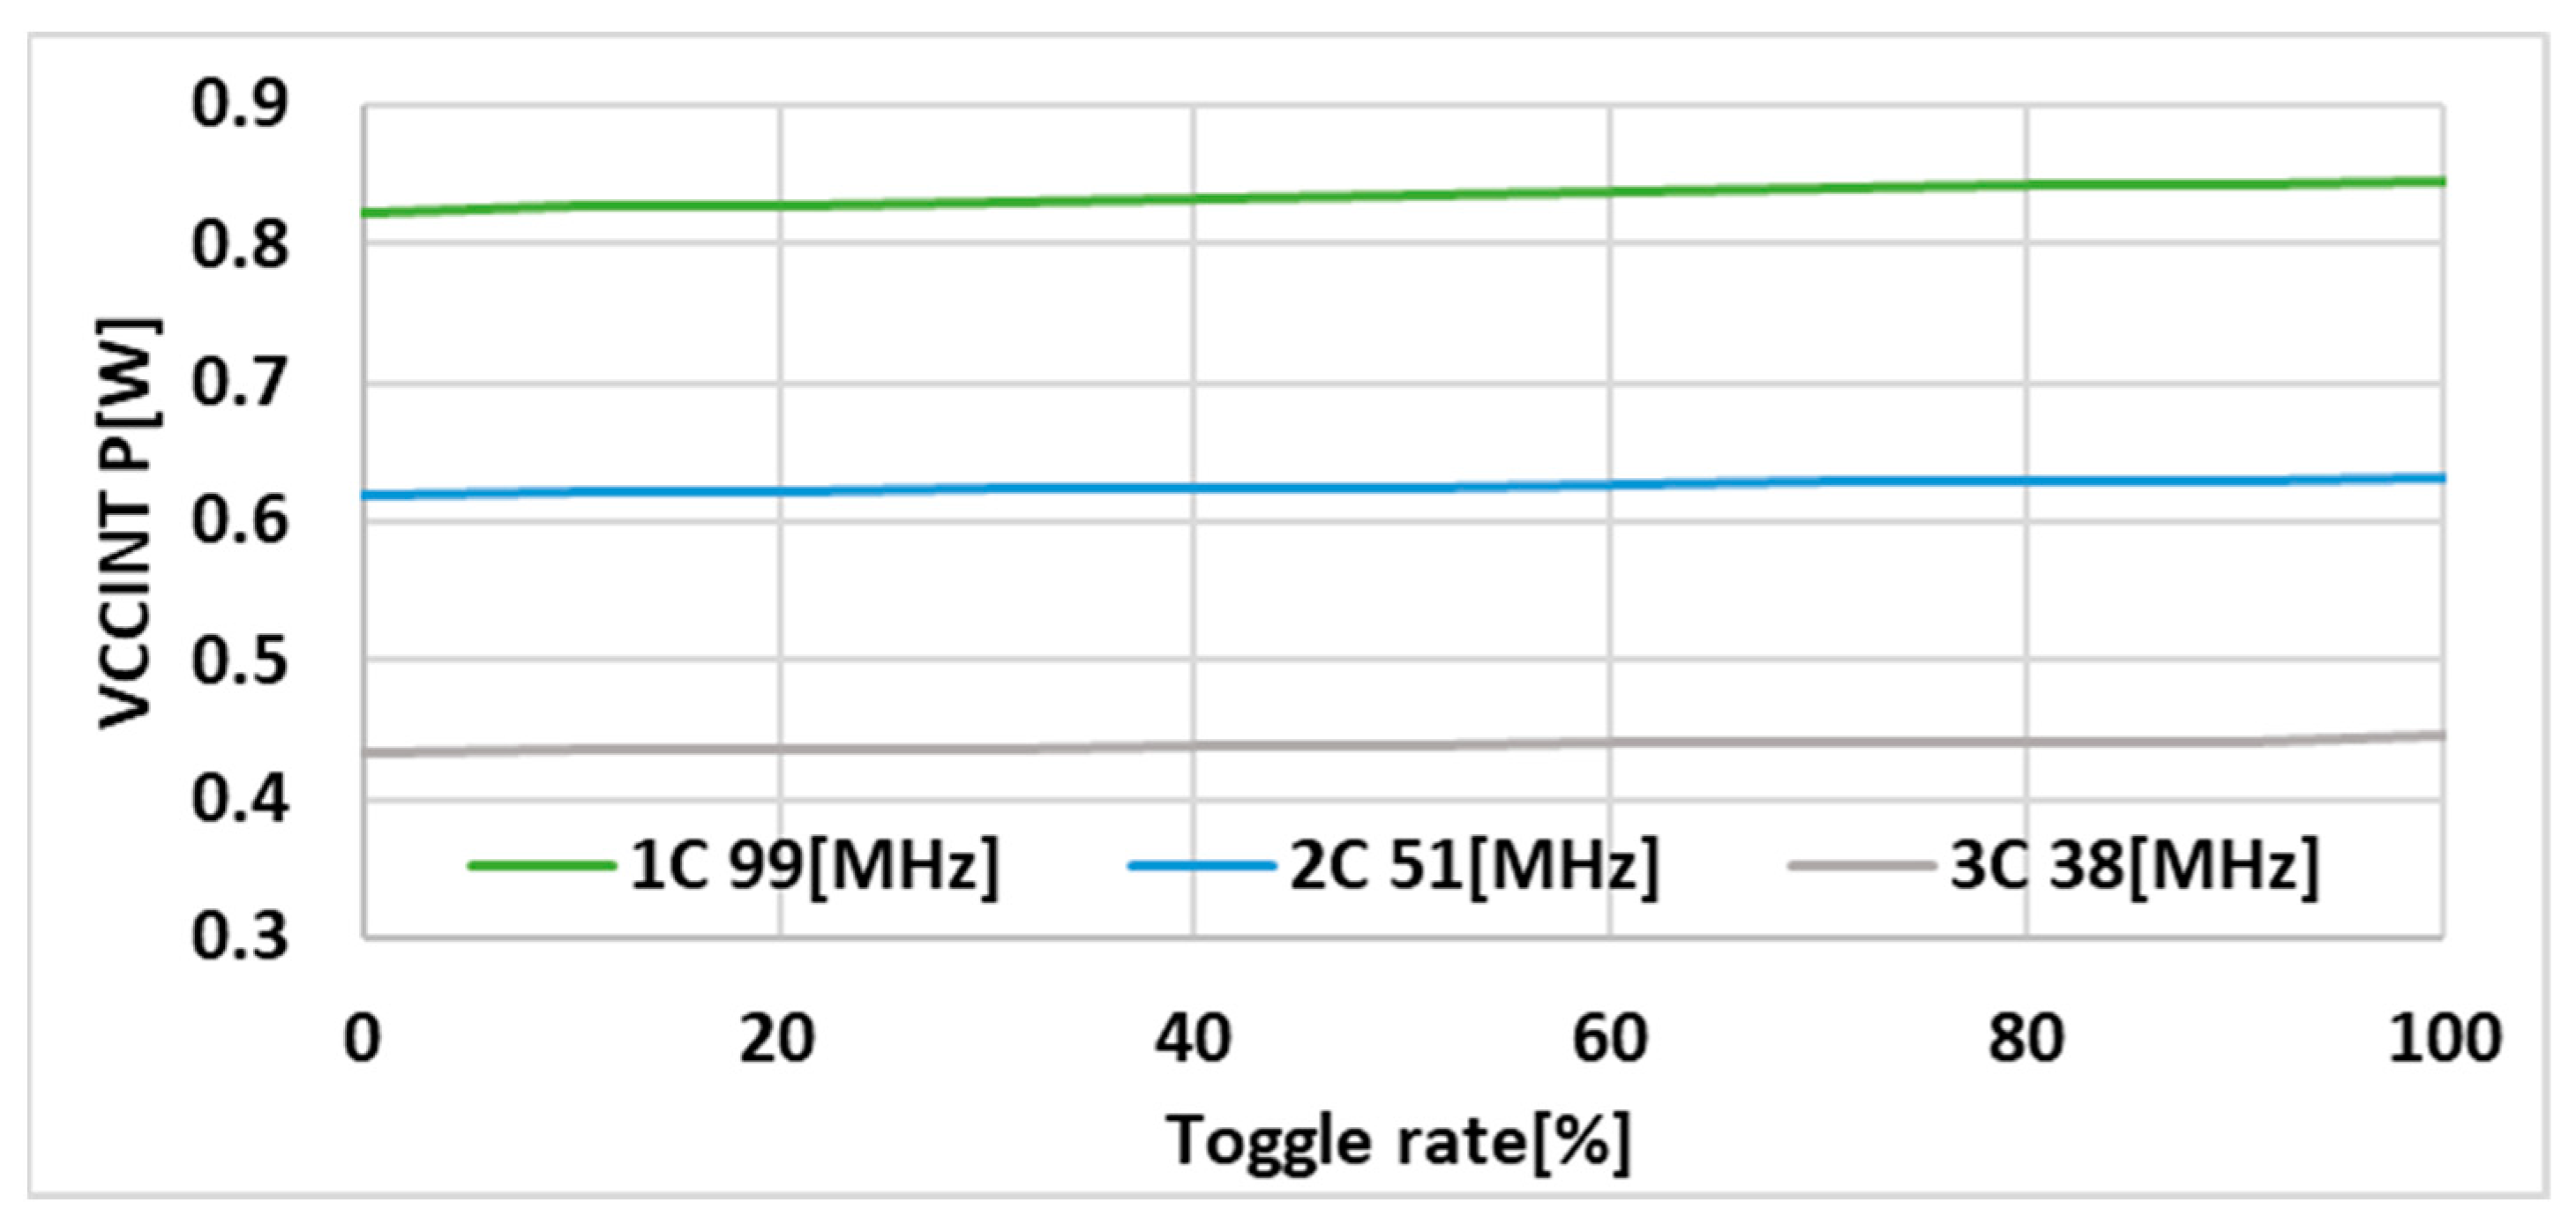
Xilinx’s VIVADO 2019.2 software was used to synthesize and implement the system on an FPGA chip. This software allows probabilistic estimation of the power requirements of the implemented system. The power is estimated, amongst others, based on the Toggle Rate (TR) parameter that allows the probability of changes in the system’s input signals to be assumed. TR equal to 100% means that each input signal will change once in each cycle of the chip clock. The remaining settings were configured by default. The first set of experiments conducted was to check the influence of the TR parameter on the estimated power in the tested configurations.
Figure 13 shows the power estimated using VIVADO 2019.2 software for the main power line VCCINT.
As expected, power increases as TR increases, but the changes in estimated power are very small. For a single-core configuration, the difference between TR equal to 0% and TR equal to 100% is only 0.023 W. Because of such small changes, only one value of the TR parameter, equal to 50%, was used in the following comparisons.
In further experiments, the results of which are shown in
Figure 14,
Figure 15 and
Figure 16, the results of the VIVADO software estimated power were compared with actual practical measurements in three configurations. In order to better demonstrate the comparison of scenarios with different
TFs, the
TF parameter was converted to a
Load percentage, where the load is equal to the ratio of the maximum
TF to the current
TF, i.e.:
where:
Figure 14.
Comparison of the estimated power to the measured power in 1C configurations.
Figure 14.
Comparison of the estimated power to the measured power in 1C configurations.
Figure 15.
Comparison of the estimated power to the measured power in 2C configurations.
Figure 15.
Comparison of the estimated power to the measured power in 2C configurations.
Figure 16.
Comparison of the estimated power to the measured power in 3C configurations.
Figure 16.
Comparison of the estimated power to the measured power in 3C configurations.
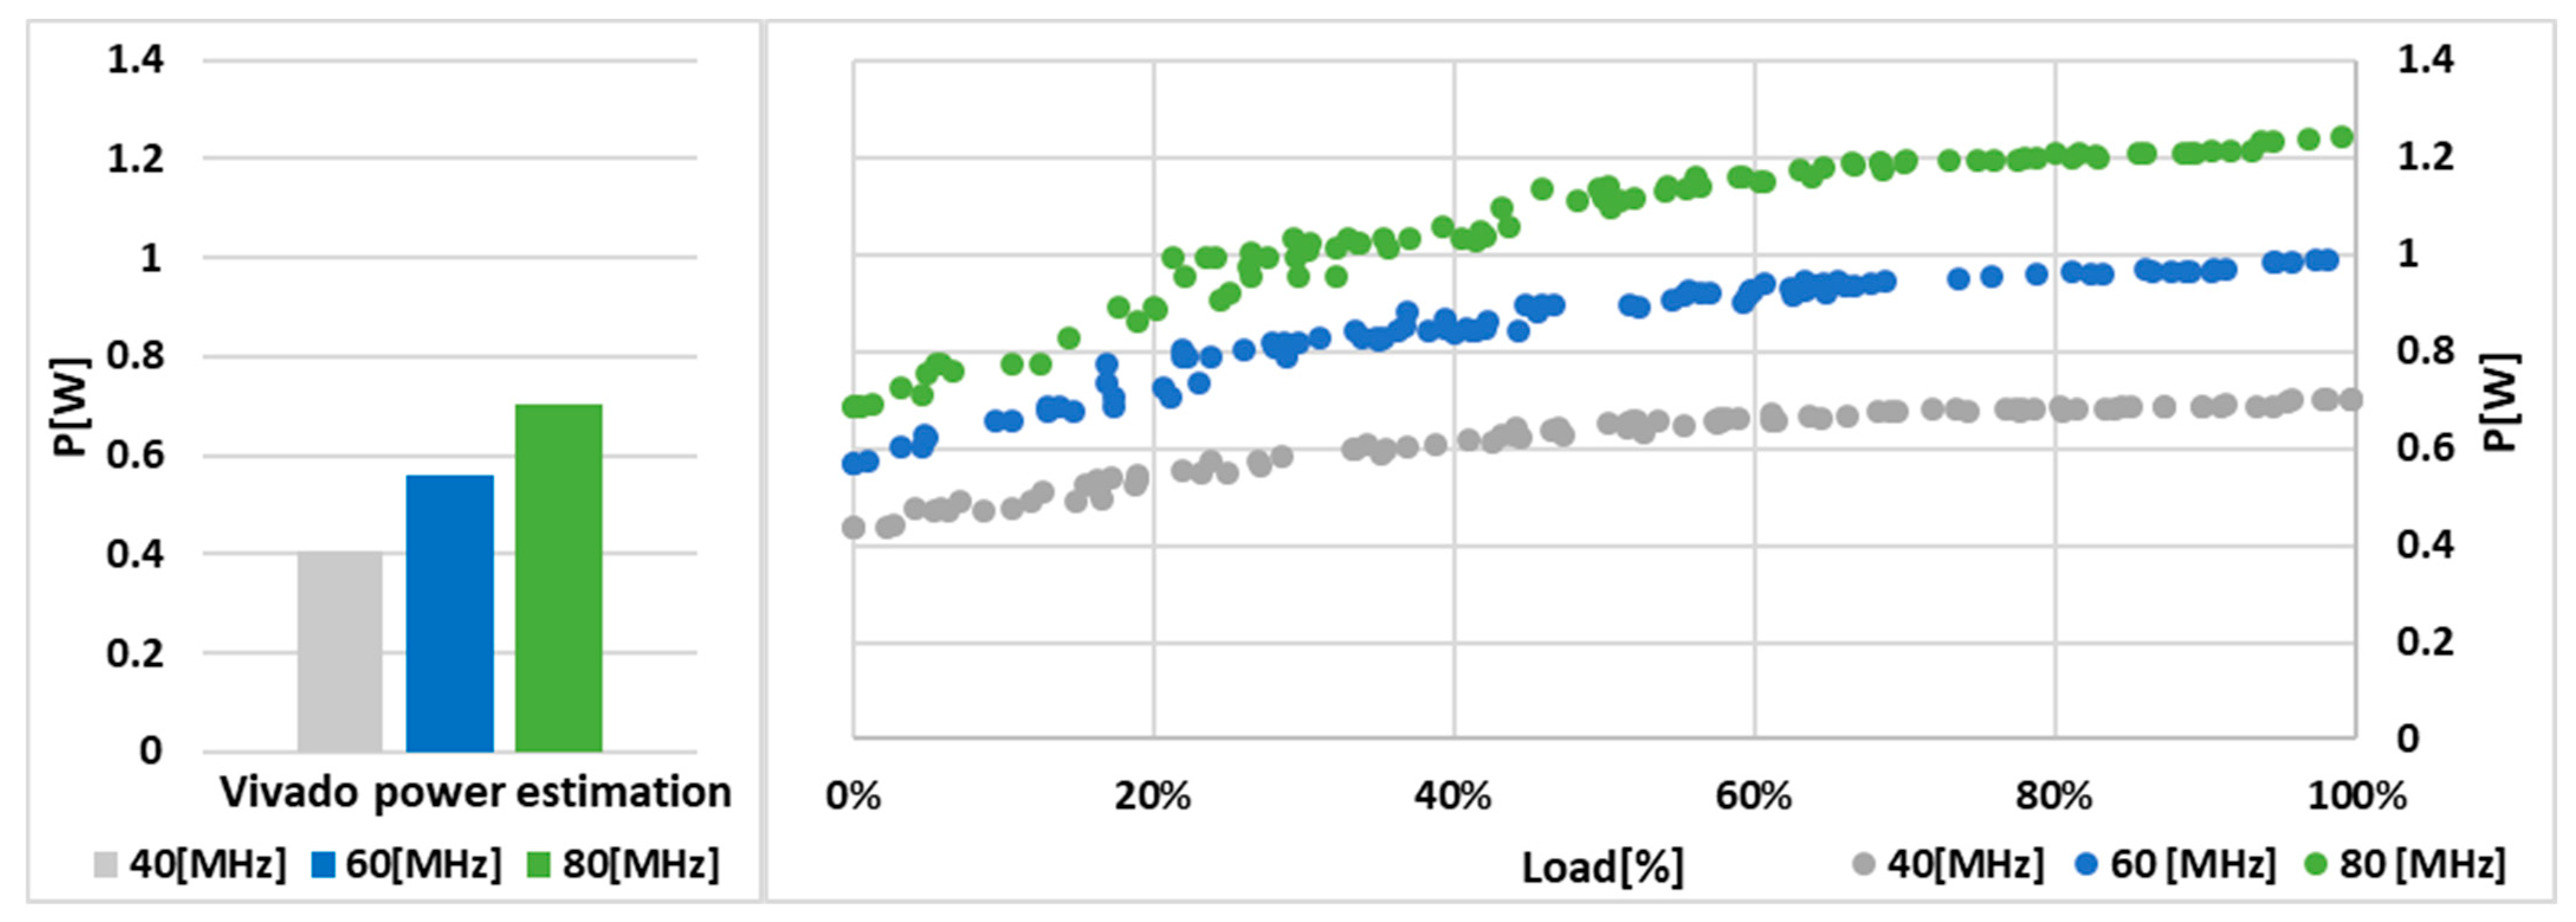
At the lowest tested operating frequency of the system, equal to 40 MHz, the power estimated by VIVADO software is about 0.05 W less than the measured value, even with a load equal to 0%. At the higher frequency equal to 60 MHz, the estimated results are close to the measurement at no load. At the highest frequency tested (80 MHz), the estimation is pretty close to the measurement at about 5% load.
The above results confirmed that probabilistic power estimation used in commercial tools such as the VIVADO system can only be approximate. In this particular example, all of the power values are underestimated and only provide an approximation of the system’s minimum power requirements. The
TR parameter was set to 50% during the analysis, which should reflect the increased load on the system; unfortunately,
Figure 13 shows how negligible the effect of this parameter is on the final value of the estimated power.
6.4. Use of an Accurate Power Model in the System Design Process
In a previous paper [
1], the authors showed that their proposed task frequency (
TF) parameter is perfectly suited for defining the time parameters of critical tasks. This was especially evident in the process of scheduling and assigning tasks to computing resources. Meanwhile, the results of the experiments presented in this work showed that the
TF parameter could also be successfully used for estimating the power consumed by a real-time system.
As mentioned above, the authors used two Xilinx FPGA platforms: the Virtex7 chip (XC7VX485T-2FFG1761C) realized in 28 nm technology, and the Kintex UltraScale FPGA (XCKU040-2FFVA1156E) realized in 20 nm technology. Although the Kintex Ultrascale chip is more technologically advanced, it contains about 80% of the available logic resources compared to the Virtex 7. However, with the online power measurement capability available on the Ultascale family board, the authors were able to use automatic dynamic power measurements (
Figure 5). The internal architecture of the two programmable logic structures is also different. In FPGA programmable logic circuits, the basic unit is the Configurable Logic Block (CLB), which is further subdivided into SLICEs in modern circuits. In the Ultrascale family of devices, the CLB contains twice as many SLICEs, which is not always advantageous, especially if not all available logic is used; some resources may be wasted. Logic functions are implemented based on Look-Up Tables (LUTs). In both structures, the LUTs available in the CLB have six inputs. In addition to the implementation of sequential circuits, the CLB contains edge-triggered flip-flops and latches. In addition, CLBs contain circuits that carry logic and multiplexers. In all of the presented measurement experiments implemented in the Kintex UltraScale FPGA, automatic recording of dynamic power measurement results was used. A thorough analysis of the implementation results showed that a relatively significant percentage of the FPGA resources was consumed by circuits related to the operation of the measurement system. In this context,
Table 2 shows the resource consumption for three different implementations: the full real-time measurement system in the Kintex UltraScale chip (Full M-RST), the real-time system only in the Kintex UltraScale chip (RTS-KintexU), and the real-time system in the Virtex7 chip (RTS-Virtex7).
As many works on real-time systems [
9,
10,
13,
15,
16,
26,
27] point out, the task scheduling process is a very important part of their design and operation (in the case of dynamic scheduling). Scheduling methods are based on a wide variety of approaches, which are addressed in the second section of the paper concerning related work. The author’s solution presented in the paper [
1] also introduced its own task-scheduling methodology. The scheduling process was divided into five stages: task mapping, task arrangement, initial simulation, frequency determination, and final simulation. A detailed description of this method can be found in [
1] and is not fully quoted here. However, in order to better understand the design scenarios used,
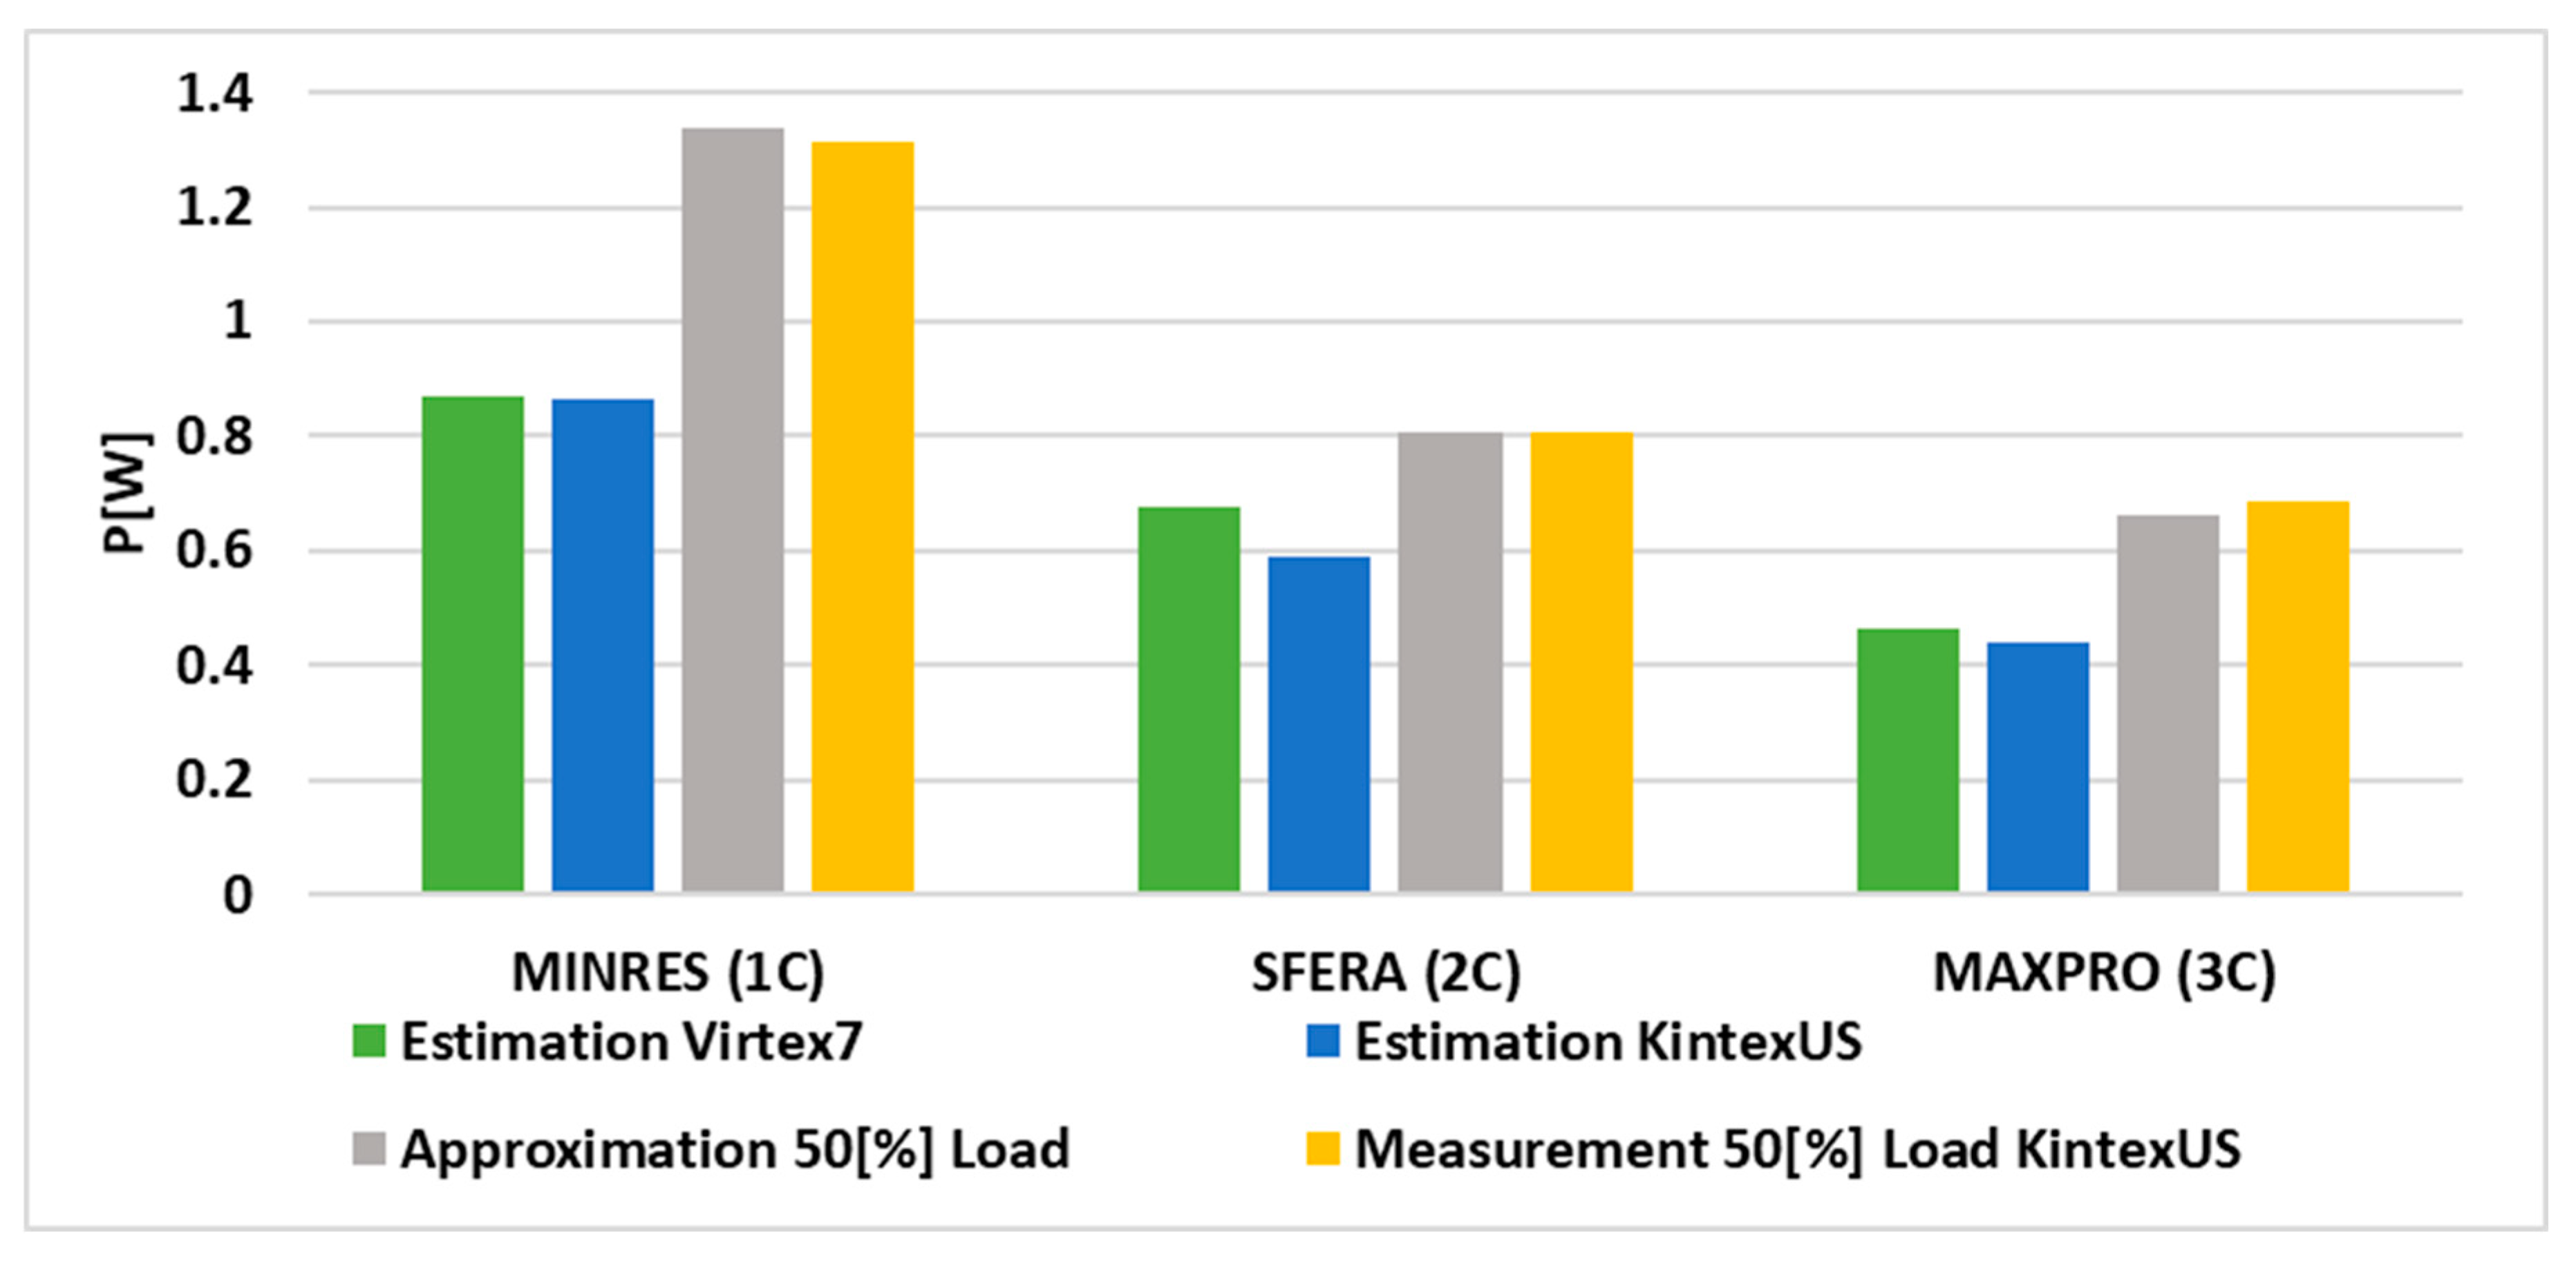
Figure 17 shows the three basic design strategies that determine the implementation of the first stage of scheduling, namely task mapping. During the task mapping stage, all tasks executed by the system are assigned to available resources. These design strategies differed in their optimization goals: MINRES, SFERA, and MAXPRO.
In the following experiment, the three methodologies were used to implement different real-time system configurations for different optimization goals. In each of these cases, different system configurations were obtained.
Figure 18 summarizes the power values obtained from estimation in the VIVADO environment for both FPGAs, as well as the values obtained from approximation and measurement for a 50% load on the Kintex Ultrascale system. The result of the comparison clearly shows the significant inaccuracies of the estimation of real power in commercial tools.
Figure 19 shows the implementation report of the 3-core structure of the time-predictable system, showing the percentage utilization of the chip area, and
Figure 20 presents the timing report of the designed system. Both reports are obtained from the VIVADO environment.
7. Conclusions
The paper presented a practical and accurate method for estimating the power consumed by a multi-tasking, multi-core real-time system. The approach is based on a series of measurements using an automated environment (
Figure 5) and a mathematical description (approximation) mapping the system’s behavior to the author’s task frequency factor (
TF). The dependence of the power consumed by the time-predictable system on the task frequency factor is nonlinear and, as shown, can be approximated by a polynomial curve. For small values of the total
TF, the power changes more rapidly, while when approaching the limit of the computational capability of the system, the approximation curve shows a saturation-like for.
Because of the fact that the architecture of the designed time-predictable system is regular and configurable, it was possible to obtain a uniform mathematical description that takes into account the number of switches, and the operating frequency (or the corresponding number of cores) is considered a function parameter. Thus, knowing the load of the system, i.e., the total value of the TF parameter, it is possible to determine the energy required by the system with very high accuracy (a few percent error).
The paper also showed that, in the case of time-predictable systems that impose strong time requirements on the tasks to be performed, the power-frequency dependence is much more complicated than that expressed by Equation (2). For this reason, it is very difficult to compare directly the different structures of real-time systems in terms of energy.
The results of the tests showed significant discrepancies between the estimated values and the proposed approximation method, which reflected the actual power consumed by the system. Thus, according to the authors, the proposed power approximation method can be used during system design and resource allocation planning.
As for directions for further research, the authors consider introducing the proposed methodology for precise power estimation into the design process of time-predictable systems. Such an extension of the design flow could be used for more efficient planning solutions, such as clock gating [
22,
23,
29], especially for tasks with high power consumption. A second research direction would be transferring the proposed methods to other FPGA platforms and to ASIC design in tools provided by leading EDA Vendors like Synopsys or CADENCE. In the case of ASICs, the supply voltage can be controlled, and power gating can be applied. In addition, the authors plan to carry out further experimental studies on the influence of external factors, in particular the temperature, on the accuracy of the power estimation.


