
A Test System for Transmission Expansion Planning Studies


Zero Emission, Realization of Optimized Energy Systems (ZEROES) Laboratory, Department of Electrical and Computer Engineering, The University of Texas at Dallas, Richardson, TX 75080, USA
*
Author to whom correspondence should be addressed.
Electronics 2024, 13(3), 664; https://doi.org/10.3390/electronics13030664
Submission received: 6 January 2024
/
Revised: 26 January 2024
/
Accepted: 4 February 2024
/
Published: 5 February 2024
(This article belongs to the Special Issue Power Delivery Technologies)
Abstract
:This paper introduces a 17-bus 500 kV test system intended for transmission expansion planning (TEP) studies. The overhead lines used in the system are based on an actual 500 kV transmission line geometry. Although several test systems have been developed for various forms of power system analysis, few are specifically tailored for TEP studies at the transmission voltage level, as opposed to the distribution voltage level. Current test systems for TEP studies are limited to single loading conditions only for normal operating conditions, and the majority of these systems are intertwined with issues related to the energy market or devised specifically for integrating new generations and loads into the existing power systems. However, ensuring a test system satisfies both voltage drop and line loading criteria during both normal and all single contingency operations is crucial in TEP studies, and addressing these issues under contingency conditions poses notable challenges. Moreover, practical TEP scenarios involve varied loadings, including peak load and dominant loading (60% of peak load) scenarios, while the existing test systems are configured solely for single loading conditions. To address these technical gaps, this paper introduces the 17-bus test system operating at a transmission voltage level of 500 kV, meeting technical requirements under normal and all single contingency operations for both peak load and dominant load scenarios. Detailed specifications of the proposed test system and load flow analysis at both normal and contingency conditions for different loading conditions are presented. This test system serves as an invaluable resource for TEP studies.
1. Introduction
The power industry has experienced significant change, moving from a vertically integrated structure to a horizontally integrated open-market system. Substantial alternations on the generating and demand sides were brought about by this restructuring. Despite the integration of cutting-edge energy-saving technologies and the implementation of the demand response concept in contemporary power distribution, there is a relentless surge in load demand. As outlined in the 2022 Western Assessment of Resource Adequacy report of the Western Electricity Coordinating Council (WECC) [1], there is an expected 11.4% increase in collective demand across the entire Western interconnection from 2023 to 2032. On the supply side, the transition from traditional, bulky generators to lighter and more flexible electricity generation is underway. Forecasts suggest significant alterations in the future generation mix compared to the past, predominantly due to the prevalence of renewable energy in new additions to the generation landscape, propelled by state-mandated Renewable Portfolio Standards (RPS) focused on reducing carbon emissions [2]. These standards compel utilities and power providers to acquire a specified portion of their electricity from renewable sources. Over the next decade, by the year 2032, it is estimated that around 26 GW of conventional units, primarily coal and natural gas resources, will be decommissioned, while there is an expected development of 80 GW in new generation, predominantly encompassing wind, solar, and energy storage units, in the U.S. sector of western interconnection [1]. The future power system’s planning and operations will face many technical difficulties as a result of these anticipated changes. The changes in load and generation are likely to alter the flow of power within the current system, potentially leading to reliability issues such as stability problems and system overloads. The integration of forthcoming extensive renewable sources demands careful consideration of their connection to the main power grid. Factors like the placement of the plant and the voltage level at the interconnection point could impact small-signal or transient stability, thereby influencing the overall reliability of the system [3,4].
Within the ever-evolving landscape of power systems, it remains crucial to guarantee the consistent and reliable delivery of sufficient energy within the power network. As energy demand continues to escalate and the integration of large-scale renewable energy sources grows within the primary grid, there is an urgent need to develop a robust, reliable, and economically feasible power grid capable of meeting both current and future needs.
Transmission expansion planning is the long-term decision-making process that plays a crucial role in strengthening the transmission network by incorporating new lines, serving as the foundation of this process [5]. It entails evaluating the current network, identifying power system needs, and strategizing upgrades to transmission lines. This aims to accommodate the increasing demands and improve grid resiliency in future systems while considering diverse technical, economic, and environmental constraints, as well as the security constraints of the power system [6].
Developing a base test system is of utmost importance in TEP studies, enabling comparisons among different TEP formulations, different optimization techniques, and innovations within the field, all using the same base test system [7].
In the literature, several test systems at transmission voltage levels have been suggested for TEP studies. These include the six-bus Garner test system [8], the IEEE 24-bus system [9,10], the HRP-38 bus system designed for TEP with high renewable energy penetration [11], the 46-bus Southern Brazilian system [9,12], the 87-bus Brazilian north-northeastern network [13,14], the Columbian power system with 93 nodes [15], the IEEE 118-bus test system, also known as NREL-118 [16], and a reduced Western Electricity Coordinating Council (WECC) system with 300 nodes [17]. Additionally, a few other systems have been proposed for TEP in references [5,18]. Moreover, a few test systems aimed at evaluating the reliability of transmission and distribution systems have been proposed in [19,20,21,22,23,24]. All these test systems are designed for single loading conditions and operated solely under normal conditions without considering single contingencies. However, in practical power systems, the loading varies significantly, particularly with seasonal changes, ranging from peak load to dominant load and light load throughout the year.
There are also some test systems for the expansion planning and efficient reconfiguration of networks with distributed generators [25,26], and some test systems for system expansion planning with reliability evaluations [21,27]. In [28], a test system for network expansion planning with n − 1 contingencies has been proposed. However, all the aforementioned test systems are for distribution voltage level, not transmission voltage level (over 230 kV), or are for other types of studies that do not need to consider single contingencies and different loading conditions.
The technical gaps and our contributions in this paper are as follows:
- Technical gap 1: In TEP studies, it is essential to conduct assessments under both normal operating conditions and all single contingencies. Therefore, the base system used in TEP studies must demonstrate robustness and reliability under both conditions. However, as previously mentioned, existing test systems have significant limitations: they adhere to technical requirements solely under normal operating conditions, lacking their validation under all single contingency conditions. This raises uncertainty about whether these systems meet requirements across all single contingencies. The reliability concerns escalate with the outcomes of TEP, and winning scenarios cannot be achieved when utilizing a base test system that has not been evaluated under all single contingencies for TEP studies.
- Technical gap 2: In the cases mentioned above, it is essential to verify whether the chosen base test system satisfies the requirements under all single contingencies. If it cannot satisfy the requirements, necessary adjustments should be made to the base test system before utilizing it for TEP studies. However, this poses a challenge, especially for large-scale test systems, as first we need to check the test system for all single contingencies. It should not be too difficult since there are many papers and open-source and commercial software programs that can do n − 1 (and even n − 2) contingency analysis quickly. The challenge is when the test system cannot meet requirements under a single contingency. Resolving the problem of ensuring a test system meets operational requirements under both normal and all single contingencies lacks a straightforward solution. Exploring various alternatives—like adding new lines, modifying generations or loads, adjusting shunt compensators, and so on—requires a trial-and-error process. It is essential to acknowledge that a modification to resolving an issue in a particular single contingency may lead to violations in other contingencies, different loading conditions, or even in normal operation. Therefore, every modification necessitates a comprehensive load flow analysis under both normal and all single contingencies. This task is exhaustive, particularly within a large network, without a guaranteed solution. Even if successful, different researchers may obtain various mitigations to address an identical violation for one of the single contingencies. This results in different, but not the same, test systems.
- Contributions: The main objective of this paper is to address the issues, difficulties, and technical gaps highlighted above by introducing a new test system specifically for TEP studies, operating at a transmission voltage level of 500 kV. In our previous effort and very challenging task, we developed a test system that meets the requirements under peak load, for normal conditions, and for all single contingencies [29]. However, there was still an issue: the test system was under one loading condition, peak load, while TEP studies are needed for different loading conditions. This paper deals with this challenge, and the test system introduced within satisfies the requirements for voltage drop and line loading limits under both normal and all single contingency conditions. This applies to two distinct loading conditions: peak load and dominant load (representing 60% of peak load). The paper provides comprehensive details regarding the new test system, along with power flow analysis results under normal conditions and the most critical single contingency for two different loading scenarios.
2. Information on the Test System
2.1. Power Network Topology
Figure 1 illustrates a network connection diagram of the 17-bus test system. In this configuration, bus 1 functions as a swing bus, whereas buses 3, 6, 8, 10, 12, 13, and 15 are identified as voltage-controlled buses (PV buses), with the remaining buses serving as load buses (PQ buses). The test system developed in this paper is not a real power system. It is a synthetic transmission network developed at a transmission level of 500 kV, especially for transmission expansion planning studies. The geographical locations of the buses depicted in Figure 1 dictate the accurate measurement of transmission line lengths, as detailed in Table 1. The assumed length of lines 7–12 is 300 km, serving as a reference for calculating the lengths of the other lines. Line 1–2 is comprised of two circuits, and the length indicated in Table 1 for this line, 512.90 km, signifies the length of each circuit. This characteristic holds for the other double-circuit lines depicted in Figure 1.
2.2. Transmission Line Configuration
The geometrical layout of the test system is shown in Figure 2. It is important to note that for a double-circuit line, each circuit of the line follows the same configuration and arrangement as shown in Figure 2, positioned on separate towers, which is a common practice for this voltage level. The line is configured horizontally (flat configuration) by maintaining a distance of 12.3 m between two phases and situated at 28 m above the surface of the ground. It incorporates four subconductors per bundle, and the selected conductor type for this line is Macaw. This particular configuration corresponds to that of a real 500 kV line [30]. Additional specifications regarding bundled configuration and line parameters that have been calculated for this arrangement are outlined in Table 2.
2.3. Generation Units and Load Data
The voltage magnitude and angle for the swing bus, bus 1, are |V1| = 1.05 p.u. and = 0. Table 3 shows detailed information regarding the power generation and voltage magnitudes for all voltage-controlled buses. A standard assumption made for all voltage-controlled buses is = 0.6 and = −0.3 for conventional power plants with synchronous generating units. This assumption is commonly adopted by utilities to perform load flow studies for TEP purposes.
The test system has 16 loads distributed across all buses except the swing bus. It is assumed that each of these loads operates in a 0.9-lagging power factor mode. The system also incorporates fixed shunt compensators, comprising both shunt reactors and capacitors connected to five buses: buses 2, 7, 9, 11, and 17. Shunt reactors are rated at 100 Mvar on bus 2 and 300 Mvar on bus 17, while shunt capacitors have a capacity of 100 Mvar on bus 7, and 250 Mvar on bus 9 and bus 11. Table 4 offers detailed information about the loads and shunt compensators linked to various buses in the test system under peak loading conditions.
3. Power Flow Formulation
The system planners can pinpoint the area of congestion, voltage violations, and potential reliability concerns by analyzing the outcomes of power flow analysis for normal operating conditions and all single contingency conditions. This information plays a crucial role in making well-informed decisions on the expansion and improvement of the transmission infrastructure. To determine whether the proposed test system offers technically feasible solutions, a through-load flow analysis is conducted under normal conditions and in all single contingency scenarios. This analysis specifically focuses on peak load and dominant load conditions, and the results are examined for validity.
3.1. Normal Operating Condition
For conducting load flow analysis in AC power systems, the problem is formulated based on load flow equations:
where and are the voltage magnitude and phase angle at bus , is the conjugate of , denotes the number of buses within the network, is the admittance matrix, and are the magnitude and angle of the element of , the admittance matrix. is the injected active power, and is the injected reactive power into the bus .
Equation (5) shows the range of voltage that each bus should maintain during normal operation, and Equation (6) specifies the limits of each generating unit on reactive power generation based on their active power generation, , presented in Table 2. Equation (7) defines the power flow limit in a transmission line connecting buses i and k. Maximum power flow, denoted as , is restricted by the thermal limit of the specified line. For four Macaw conductors per bundle, the thermal limit of a three-phase line is ( × (500 kV) × (4 × 0.870 kA)) is 3014. Therefore, the line rating for this test system is set to 2400 MVA, 80% of thermal capacity.
3.2. Single Contingency Conditions
Power systems need to continue functioning satisfactorily following the unexpected failure or outage of a single component, termed a single contingency. Components taken into consideration as contingency conditions for TEP studies are transformers and transmission lines. In the context of this test system, a contingency scenario involves the outage of a transmission line. Equations (1)–(4) and constraints Equations (6) and (7) are still applied for load flow analysis under contingency conditions. However, instead of having 0.95 p.u. voltage magnitude at each bus, it should be more than 0.9 p.u., as illustrated in Equation (8). This 0.9 p.u. limit under single contingencies is the limit accepted by utilities for TEP studies in practice.
4. Power Flow Result and Analysis
4.1. Peak Load: Normal Condition
The power flow problem described in Equations (1)–(4) for the proposed test system, illustrated in Figure 1 and accompanied by generation and load data presented in Table 3 and Table 4, is solved by using the Newton-Raphson method. The analysis is conducted using the PSS/E 35.4 simulator. All the power flow results presented in this paper were convergent and met convergence tolerance. Figure 3 shows the power flow result for the 17-bus test system under normal operating conditions. In this power flow model, the numbers on the left and right sides of each transmission line/generating unit/load/shunt capacitor/shunt reactor show active and reactive powers, respectively. Positive and negative numbers mean the output and input powers to the bus connected to that transmission line, respectively; this is the opposite for generating units, shunt capacitors, and reactors. Numbers for each bus mean voltage magnitude, voltage angle, and bus number.
Table 5 presents a summary of the power flow results for normal operating conditions. It shows that the per-unit voltage at each bus and the reactive power generation by individual generating units adhere to the defined thresholds stated in Equations (5) and (6). As observed from the power flow diagram in Figure 3, the maximum loading lines are lines 1–7 with 36.18%, lines 6–9 with 32.33%, line 2–3 with 29.73%, lines 8–11 with 26.68%, and lines 10–14 with 26.48%. The rest of the lines show loadings below 26%, significantly lower than their thermal limit considered. This result confirms that the test system adheres to both voltage, reactive power generation, and the loading limits for normal operating conditions at peak load.
4.2. Peak Load: Single Contingency Conditions
The results of the load flow analysis performed for each contingency within the test system have been summarized in Table 6. Each row within Table 6 represents a unique contingency scenario. For instance, in the first row, the scenario assumes the outage of one of the two circuits of line 1–2. In this specific single contingency, bus 2 has the lowest voltage magnitude with 0.937 p.u., and lines 1–7 have the highest line loadings with 39.8%. The worst single contingency, as seen in Table 6, occurs when one of two circuits of lines 15–17 is out, where = 0.900 p.u. Other severe single contingencies are when one of the circuits of lines 13–16 or 5–6 experiences an outage, resulting in = 0.900 p.u. and = 0.900 p.u., respectively. Notably, the highest line loadings peak at 56.6% and 54.7% for one of lines 6–9 and one of lines 1–7, respectively, when the other line in these pairs is out of operation. However, for all remaining single contingency cases, the maximum line loadings remain below 50%. The detailed load flow analysis result for the worst single contingency condition is shown in Figure 4, with one circuit of lines 15–17 switched off where = 0.900 p.u. and the maximum loading on the line at this condition is 36.2% in one of lines 1–7. Reactive power generation from all generating units adheres to acceptable limits. Evaluating results across all contingencies, the test system fulfills the criteria under single contingency scenarios as well.
4.3. Dominant Load: Normal Condition
For the dominant loading condition, the generations and loads are taken as 60% of those of the peak loading conditions, and likewise, in the peak load condition, the power factors for all loads are taken as 0.9 lagging. For the generating units, each unit’s scheduled voltage has been set to 1.0 p.u., and reactive power generation limits have been set as defined in Equation (6). The loads and shunt compensator data for dominant loading conditions are illustrated in Table 7. Figure 5 shows the power flow result for the 17-bus test system at the dominant load under normal operating conditions. The load flow result is summarized in Table 8. It shows that the reactive power of all generating units and the voltage magnitude at each bus remain within the defined thresholds given in Equations (5) and (6). Lines 1–7 have the highest loadings (23.9%), followed by lines 6–9 (21.94%), and line 2–3 (21.6%). The remaining lines have line loadings below 20%.
4.4. Dominant Load: Single Contingencies
The results for all single contingencies are presented in Table 9. As the total connected load in this scenario is lower than the peak load, the lowest voltage in each contingency remains comfortably above 0.950 p.u. The most significant line loading occurs when one of two lines 6–9 is out and another circuit experiences a loading of 33.0%, and when one of two lines 1–7 is out, and another line has a loading of 32.3%. All other lines have loadings below 30%. The most critical contingency at the dominant load arises when line 5–6 is switched off, and its detailed load flow analysis for this scenario is illustrated in Figure 6. In this condition, the minimum voltage is observed at bus 5 with a magnitude of 0.950 p.u., and the maximum loading on one of the lines 1–7 reaches 23.7%. Based on the results of normal operating conditions, and all single contingencies, the test system loading at 60% of peak load also meets the criteria of load flow analysis under normal conditions, and all single contingencies as well.
5. Case Studies for TEP Using the Test System
Two transmission expansion planning cases are studied using the proposed 17-bus test system.
- Case I: Connecting a new power plant to the network
At first, a new power plant of 1000 MW, located at a newly designated location known as bus 18, is planned to be connected to the test system. To integrate this new generation unit into the test system, the nearest available buses are bus 16, situated at a distance of 342.54 km, and bus 17 at 341.83 km. It is crucial to emphasize that the system must operate in compliance with all technical requirements under normal conditions and single contingency conditions following the transmission expansion necessary for connecting the new generation. To facilitate this new generation unit, it is imperative to establish two lines connecting bus 16 and bus 18. The detailed load flow analysis after this TEP condition, conducted at peak load under normal loading conditions, is illustrated in Figure 7. The voltage setting of generator buses 3, and 10 is changed to 1.0 p.u., and bus 6 to 1.02 p.u. for this study. The voltage of the new unit is set to 1.0 p.u. This configuration ensures the satisfactory operation of the system under both normal and all single contingency conditions.
To ensure technically viable operation under the dominant loading condition, a cumulative shunt reactor capacity of 3400 Mvar must be deployed across various buses. Remarkably, this system after TEP provides satisfactory operation under normal conditions and proves reliable under all single conditions at dominant loading. The capacity of the required shunt compensator in each bus for peak loading and dominant loading conditions for the TEP of case I is shown in Table 10. The values indicated with (Cap.) in the table denote shunt capacitors, while the remaining values correspond to shunt reactors.
- Case II: Addition of a generation unit and a load
TEP is further extended from case I; an additional TEP is conducted to facilitate the connection of a 1200 MW load with a power factor of 0.9 lagging at bus 19. This new bus is positioned at a distance of 350 km from bus 3, 285 km from bus 6, and 370 km from bus 9. In the context of this TEP, three viable options are considered: (i) one-line connection from bus 3, bus 6, and bus 9, (ii) two-line connection from bus 3 and one line from bus 6, and (iii) one-line connection from bus 3 and two-line connection from bus 6. Remarkably, the system demonstrates successful operation under normal and all single contingency conditions for all three scenarios. Considering the criterion of minimizing the total transmission line length of the TEP, option (iii) emerges as the most practical choice, involving a single-line connection from bus 3 and two-line connections from bus 6.
This system also satisfies all technical requirements for the dominant loading condition under both normal and all single contingency conditions. A total capacity of 4000 Mvar shunt reactors and 300 Mvar shunt capacitors must be connected at different buses for the dominant loading condition of the operation. Table 11 illustrates the capacity of the necessary shunt compensators at each bus for peak load and dominant loading conditions in the TEP of Case II.
Some test systems include a 500 kV voltage level [31]. The potential utilization of these systems in TEP hinges on the availability of all required information. The available file on these systems lacks details about transmission line lengths. An additional noteworthy concern pertains to the absence of clear specifications regarding the line loading conditions within the system. While it could be assumed that the provided loading conditions align with peak loading, it is pivotal to acknowledge the existence of partial loading conditions in a real power system. Ensuring satisfactory operation under various loading scenarios becomes imperative for TEP studies. The proposed test system provides detailed information.
For the two loading conditions described above, all test system information will be available on GitHub by authors in both PSS/E (.sav and .raw) and MATPOWER formats. Therefore, all the results presented in this paper can be reproduced and used by others.
6. Conclusions
This paper introduces a test system comprising 17 buses and a 500 kV system voltage designated for Transmission Expansion Planning (TEP) studies. The primary limitation of existing test systems for TEP is their inability to satisfy voltage drop and line loading limits for all single contingencies, confining their effectiveness solely to normal conditions. Moreover, these systems are for only one loading condition, mainly peak load, or operate at distribution voltage levels rather than transmission voltage levels (over 230 kV). To address this issue, this paper presents the aforementioned test system capable of satisfying operational criteria not just during normal operations but also under all single contingencies for two loading scenarios: peak load and dominant load (60% of the peak load). Alongside detailing the test system comprehensively, this paper includes load flow analysis conducted under both normal and all single contingency conditions. The operational validation of the system was performed by simulating the power flow using PSS/E and the MATLAB coding platform. The results of the simulation demonstrated that the bus voltage, line loading, and reactive power generation remained within the acceptable limit for the test system. Moreover, two TEP studies were presented in the paper to clarify and emphasize the significance and value of the introduced test system. This test system serves as an invaluable resource as a reference system for TEP studies, facilitating researchers and planners in their exploration of TEP research. The future work aims to utilize the dataset of the introduced test system for transmission expansion planning in the EHV transmission system, particularly over long distances, basically with conventional lines and the novel unconventional high surge impedance loading lines. Assessing the power system performance and detailed economic analysis of TEP under these two different transmission structures can enable the research capability to determine the hardware upgrades of the future transmission line.
Author Contributions
Conceptualization, B.D. and M.G.; methodology, B.D. and M.G.; software, B.D. and M.G.; validation, B.D. and M.G.; formal analysis, B.D. and M.G.; investigation, B.D. and M.G.; writing—original draft preparation, B.D.; writing—review and editing, M.G.; supervision, M.G.; project administration, M.G.; funding acquisition, M.G. All authors have read and agreed to the published version of the manuscript.
Funding
This research was supported in part by the National Science Foundation (NSF) under Award 2306098.
Data Availability Statement
Data are contained within the article.
Conflicts of Interest
The authors declare no conflicts of interest.
References
- Western Assessment of Resource Adequacy, WECC. 2022. Available online: https://www.wecc.org/Reliability/2022WesternAssessment%20of%20Resource%20Adequacy.pdf (accessed on 20 December 2023).
- Heeter, J.S.; Speer, B.K.; Glick, M.B. International Best Practices for Implementing and Designing Renewable Portfolio Standard (RPS) Policies (NREL/TP-6A20-72798); National Renewable Energy Lab. (NREL): Golden, CO, USA, 2019; p. 1507986. [Google Scholar]
- Gautam, D.; Vittal, V.; Harbour, T. Impact of Increased Penetration of DFIG-Based Wind Turbine Generators on Transient and Small Signal Stability of Power Systems. IEEE Trans. Power Syst. 2009, 24, 1426–1434. [Google Scholar] [CrossRef]
- Nwaigwe, K.N.; Mutabilwa, P.; Dintwa, E. An Overview of Solar Power (PV Systems) Integration into Electricity Grids. Mater. Sci. Energy Technol. 2019, 2, 629–633. [Google Scholar] [CrossRef]
- Mehrtash, M.; Hobbs, B.F.; Cao, Y. A Large-Scale Test System for Transmission Expansion Planning with AC Networks Model. In Proceedings of the IEEE Texas Power & Energy Conference (TPEC), College Station, TX, USA, 28 February–1 March 2022; pp. 1–5. [Google Scholar]
- Conejo, A.J.; Baringo Morales, L.; Kazempour, S.J.; Siddiqui, A.S. Investment in Electricity Generation and Transmission; Springer International Publishing: Cham, Switzerland, 2016. [Google Scholar]
- Quintero, J.; Zhang, H.; Chakhchoukh, Y.; Vittal, V.; Heydt, G.T. Next Generation Transmission Expansion Planning Framework: Models, Tools, and Educational Opportunities. IEEE Trans. Power Syst. 2014, 29, 1911–1918. [Google Scholar] [CrossRef]
- Haffner, S.; Monticelli, A.; Garcia, A.; Mantovani, J.; Romero, R. Branch and Bound Algorithm for Transmission System Expansion Planning Using a Transportation Model. IEE Proc. Gener. Trans. Distrib. 2000, 147, 149. [Google Scholar] [CrossRef]
- Meneses, M.; Nascimento, E.; Macedo, L.H.; Romero, R. Transmission Network Expansion Planning Considering Line Switching. IEEE Access 2020, 8, 115148–115158. [Google Scholar] [CrossRef]
- Mutlu, S.; Şenyiğit, E. Literature Review of Transmission Expansion Planning Problem Test Systems: Detailed Analysis of IEEE-24. Electr. Power Syst. Res. 2021, 201, 107543. [Google Scholar] [CrossRef]
- Zhuo, Z.; Zhang, N.; Yang, J.; Kang, C.; Smith, C.; O’Malley, M.J.; Kroposki, B. Transmission Expansion Planning Test System for AC/DC Hybrid Grid with High Variable Renewable Energy Penetration. IEEE Trans. Power Syst. 2020, 35, 2597–2608. [Google Scholar] [CrossRef]
- Dechamps, C.; Jamoulle, E. Interactive Computer Program for Planning the Expansion of Meshed Transmission Networks. Int. J. Electr. Power Energy Syst. 1980, 2, 103–108. [Google Scholar] [CrossRef]
- Romero, R.; Monticelli, A.; Garcia, A.; Haffner, S. Test Systems and Mathematical Models for Transmission Network Expansion Planning. IEE Proc. Gener. Trans. Distrib. 2002, 149, 27–36. [Google Scholar] [CrossRef]
- Rahmani, M. Study of New Mathematical Models for Transmission Expansion Planning Problem. Ph.D. Dissertation, Ilha Solteira UNESP, São Paulo, Brazil, 2013. [Google Scholar]
- Sierra, J.E.; Giraldo, E.A.; Lopez-Lezama, J.M. Weighting Transmission Loading Relief Nodal Indexes for the Optimal Allocation of Distributed Generation in Power Systems. Contemp. Eng. Sci. 2018, 11, 2601–2611. [Google Scholar] [CrossRef]
- Pena, I.; Martinez-Anido, C.B.; Hodge, B.-M. An Extended IEEE 118-Bus Test System with High Renewable Penetration. IEEE Trans. Power Syst. 2018, 33, 281–289. [Google Scholar] [CrossRef]
- Xu, Q.; Hobbs, B.F. Value of Model Enhancements: Quantifying the Benefit of Improved Transmission Planning Models. IET Gener. Trans. Distrib. 2019, 13, 2836–2845. [Google Scholar] [CrossRef]
- Electric Grid Test Cases. Available online: https://electricgrids.engr.tamu.edu/electric-grid-test-cases/ (accessed on 25 July 2023).
- Probability Methods Subcommittee IEEE Reliability Test System. IEEE Trans. Power Appar. Syst. 1979, 98, 2047–2054.
- Grigg, C.; Wong, P.; Albrecht, P.; Allan, R.; Bhavaraju, M.; Billinton, R.; Chen, Q.; Fong, C.; Haddad, S.; Kuruganty, S.; et al. The IEEE Reliability Test System-1996. A Report Prepared by the Reliability Test System Task Force of the Application of Probability Methods Subcommittee. IEEE Trans. Power Syst. 1999, 14, 1010–1020. [Google Scholar] [CrossRef]
- Allan, R.N.; Billinton, R.; Sjarief, I.; Goel, L.; So, K.S. A Reliability Test System for Educational Purposes-Basic Distribution System Data and Results. IEEE Trans. Power Syst. 1991, 6, 813–820. [Google Scholar] [CrossRef]
- Leite Da Silva, A.M.; Cassula, A.M.; Billinton, R.; Manso, L.A.F. Integrated Reliability Evaluation of Generation, Transmission and Distribution Systems. IEE Proc. Gener. Trans. Distrib. 2002, 149, 1–6. [Google Scholar] [CrossRef]
- Akhavein, A.; Porkar, B. A Composite Generation and Transmission Reliability Test System for Research Purposes. Renew. Sustain. Energy Rev. 2017, 75, 331–337. [Google Scholar] [CrossRef]
- Barrows, C.; Bloom, A.; Ehlen, A.; Ikäheimo, J.; Jorgenson, J.; Krishnamurthy, D.; Lau, J.; McBennett, B.; O’Connell, M.; Preston, E.; et al. The IEEE Reliability Test System: A Proposed 2019 Update. IEEE Trans. Power Syst. 2020, 35, 119–127. [Google Scholar] [CrossRef]
- Zou, K.; Agalgaonkar, A.P.; Muttaqi, K.M.; Perera, S. Distribution System Planning with Incorporating DG Reactive Capability and System Uncertainties. IEEE Trans. Sustain. Energy 2012, 3, 112–123. [Google Scholar] [CrossRef]
- Wu, Y.-K.; Lee, C.-Y.; Liu, L.-C.; Tsai, S.-H. Study of Reconfiguration for the Distribution System with Distributed Generators. IEEE Trans. Power Deliv. 2010, 25, 1678–1685. [Google Scholar] [CrossRef]
- Lotero, R.C.; Contreras, J. Distribution System Planning with Reliability. IEEE Trans. Power Deliv. 2011, 26, 2552–2562. [Google Scholar] [CrossRef]
- Lin, Z.; Hu, Z.; Song, Y. Distribution Network Expansion Planning Considering N-1 Criterion. IEEE Trans. Power Syst. 2019, 34, 2476–2478. [Google Scholar] [CrossRef]
- Dhamala, B.; Ghassemi, M. A Test System for Transmission Expansion Planning Studies Meeting the Operation Requirements Under Normal Condition as Well as All Single Contingencies. In Proceedings of the North American Power Symposium (NAPS), Asheville, NC, USA, 15–17 October 2023; pp. 1–5. [Google Scholar]
- Wei-Gang, H. Study on Conductor Configuration of 500 kV Chang-Fang Compact Line. IEEE Trans. Power Deliv. 2003, 18, 1002–1008. [Google Scholar] [CrossRef]
- Birchfield, A.B.; Gegner, K.M.; Xu, T.; Shetye, K.S.; Overbye, T.J. Statistical Considerations in the Creation of Realistic Synthetic Power Grids for Geomagnetic Disturbance Studies. IEEE Trans. Power Syst. 2017, 32, 1502–1510. [Google Scholar] [CrossRef]
Figure 1.
Connection diagram of the 17-bus test system for TEP studies.
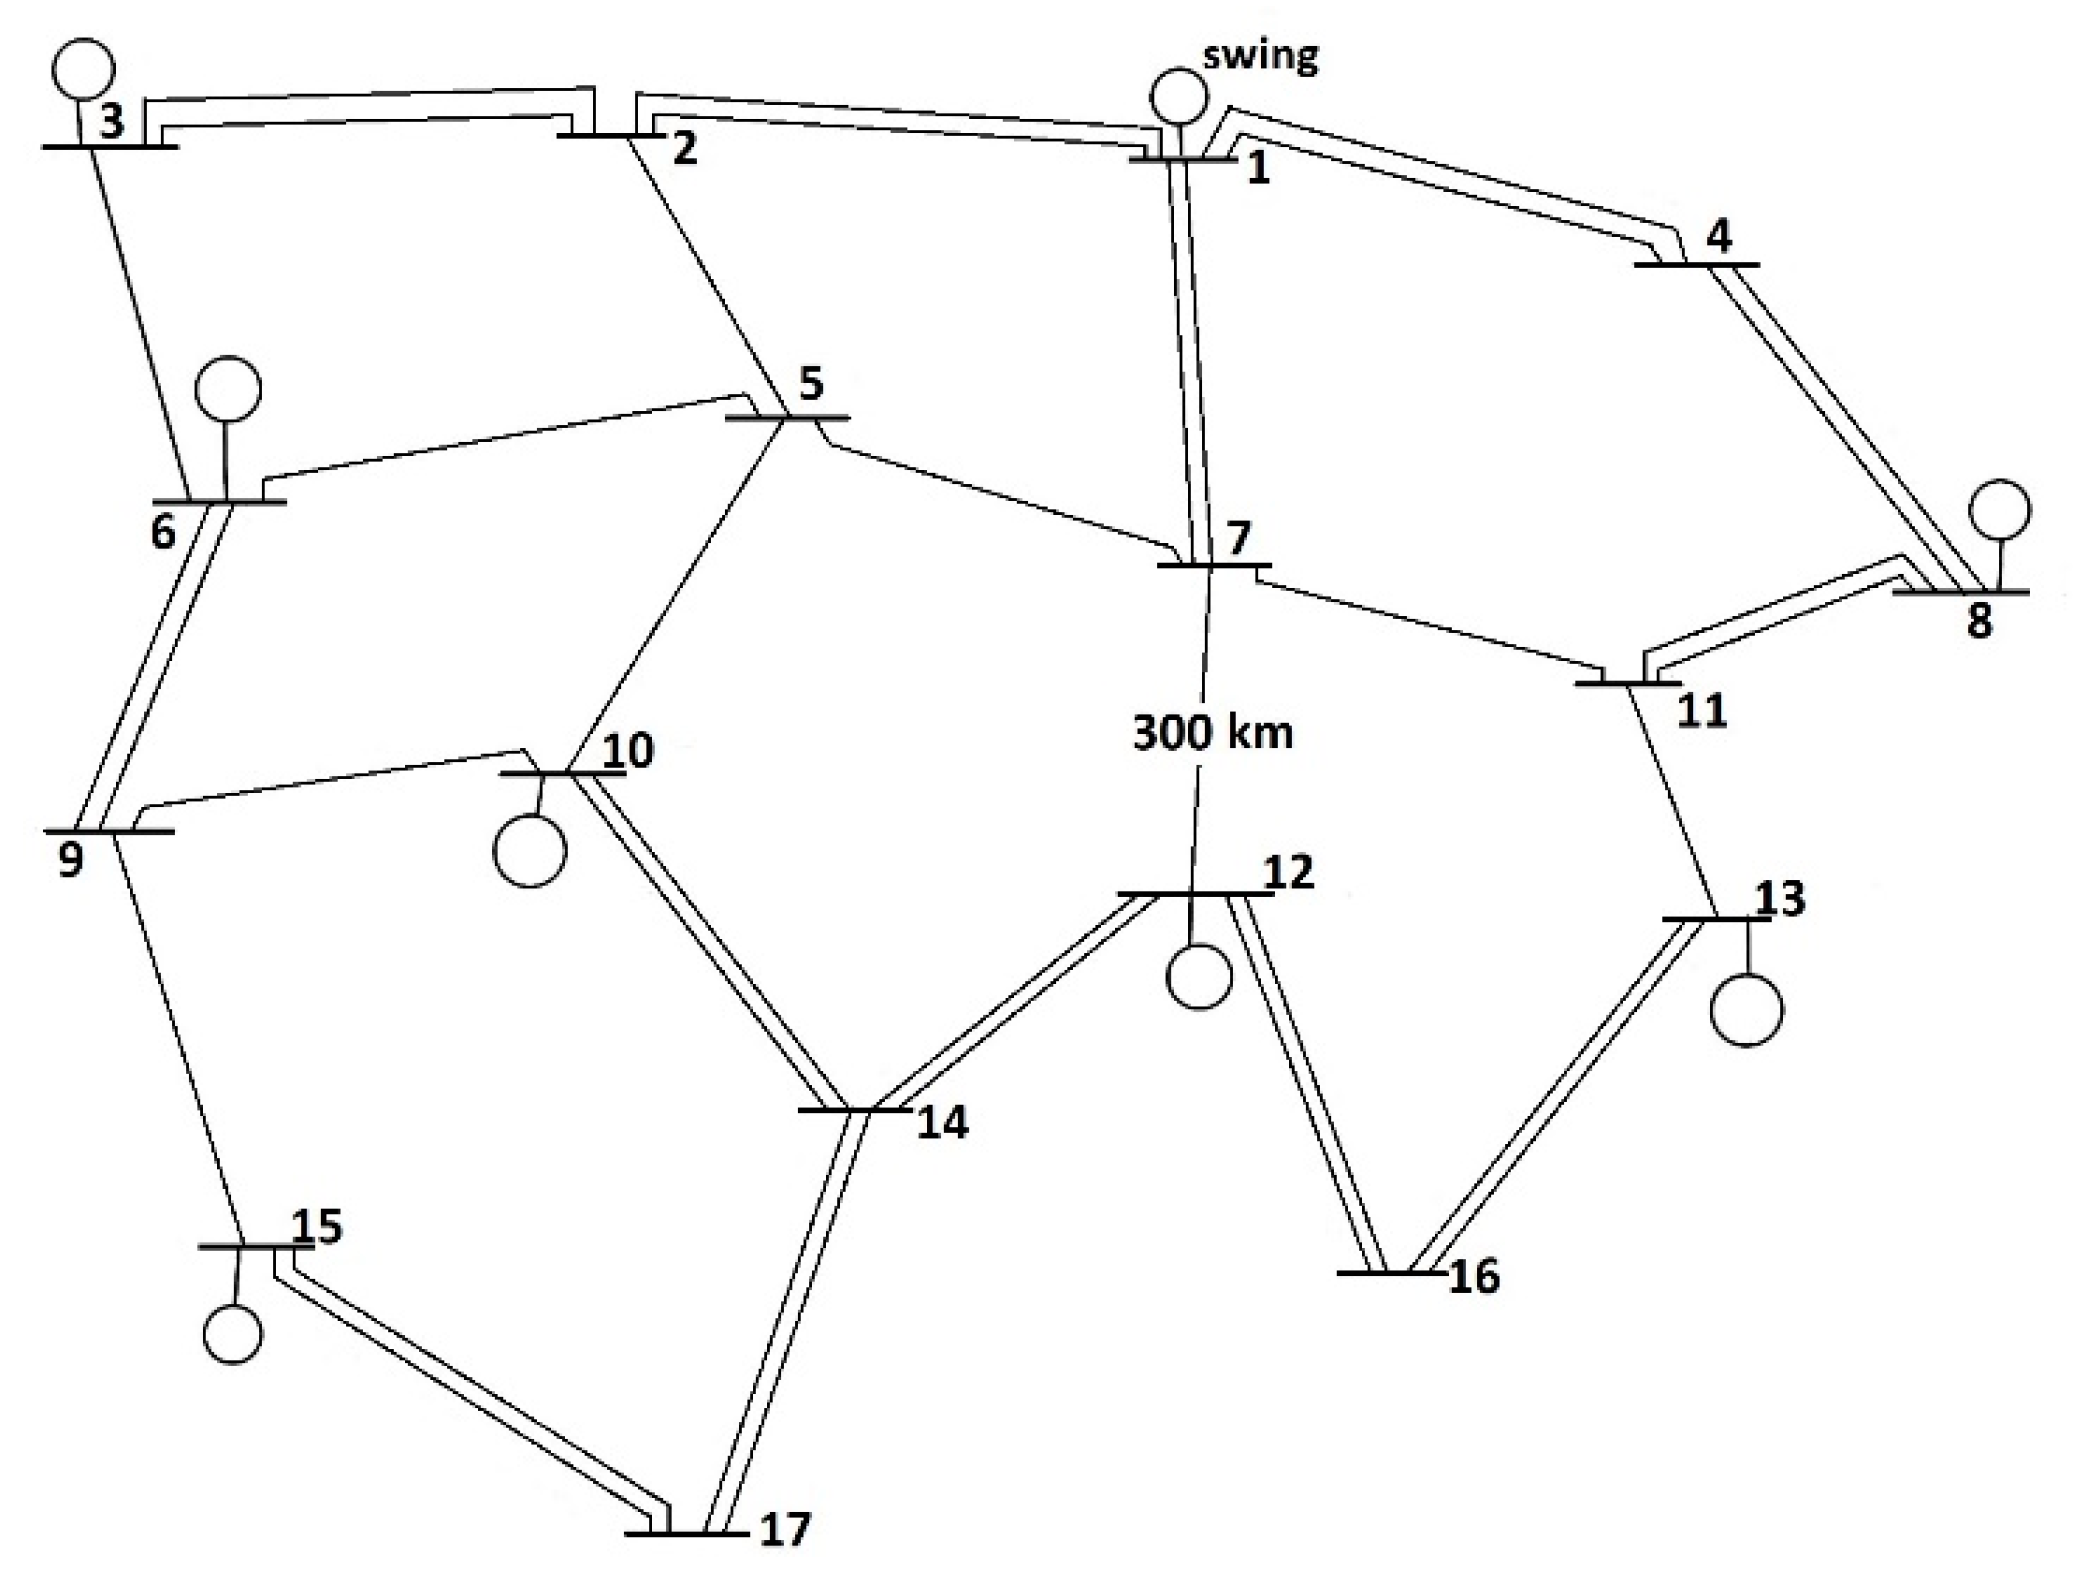
Figure 2.
Configuration of 500 kV transmission lines in the test system.
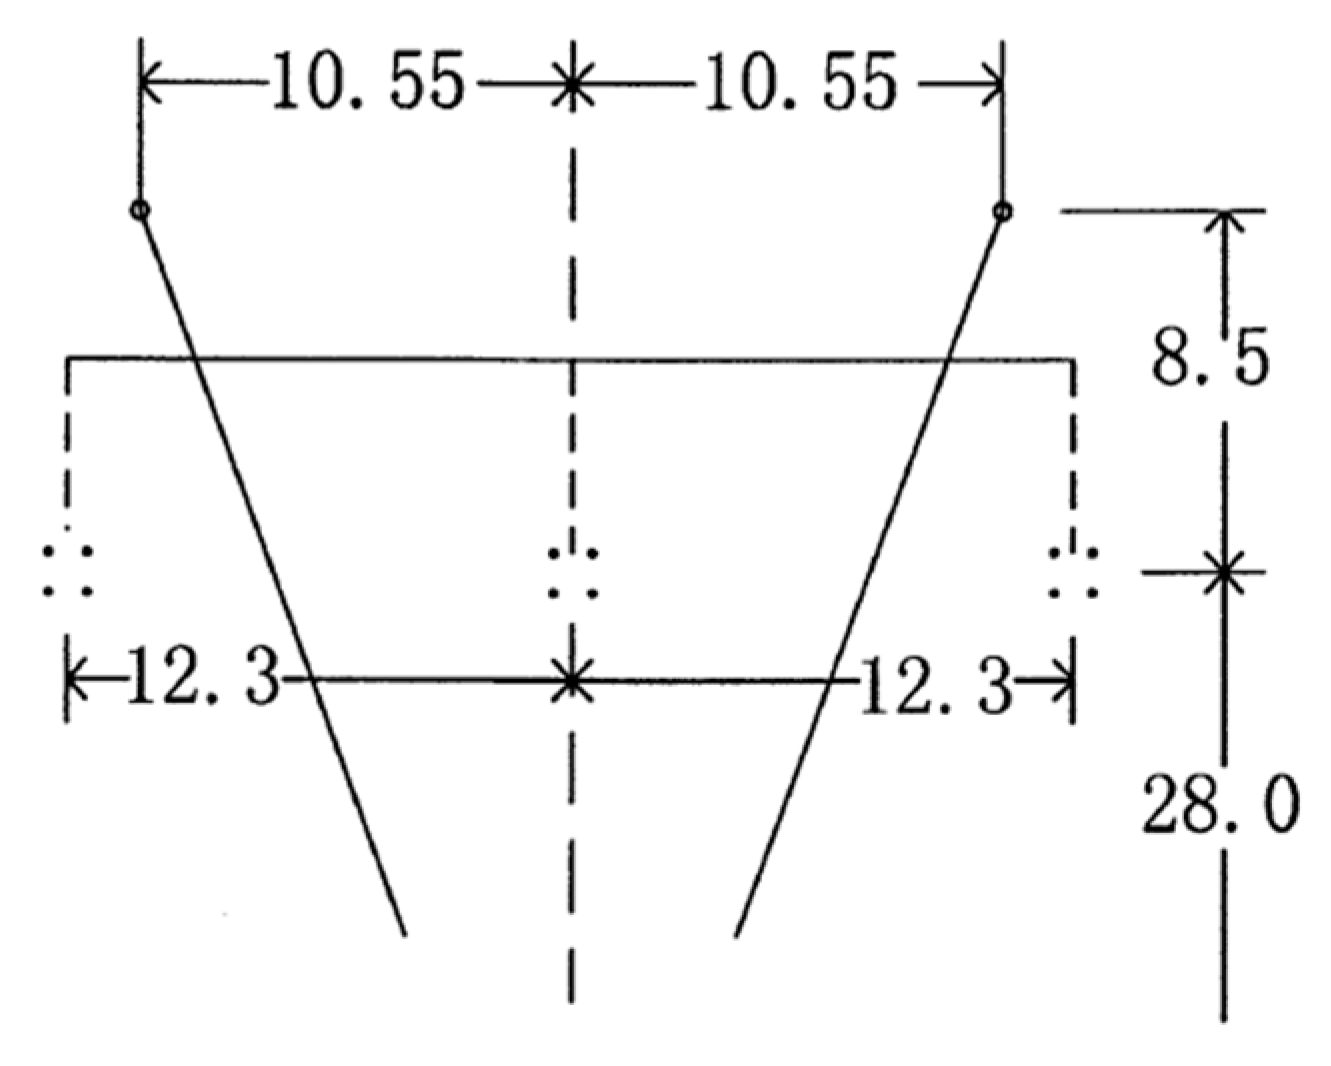
Figure 3.
Power flow for the test case at peak load under normal operating conditions.

Figure 4.
Load flow results for the test case at peak load under the worst contingency condition.

Figure 5.
Load flow for the test case at dominant load (60% of peak load) under normal conditions.
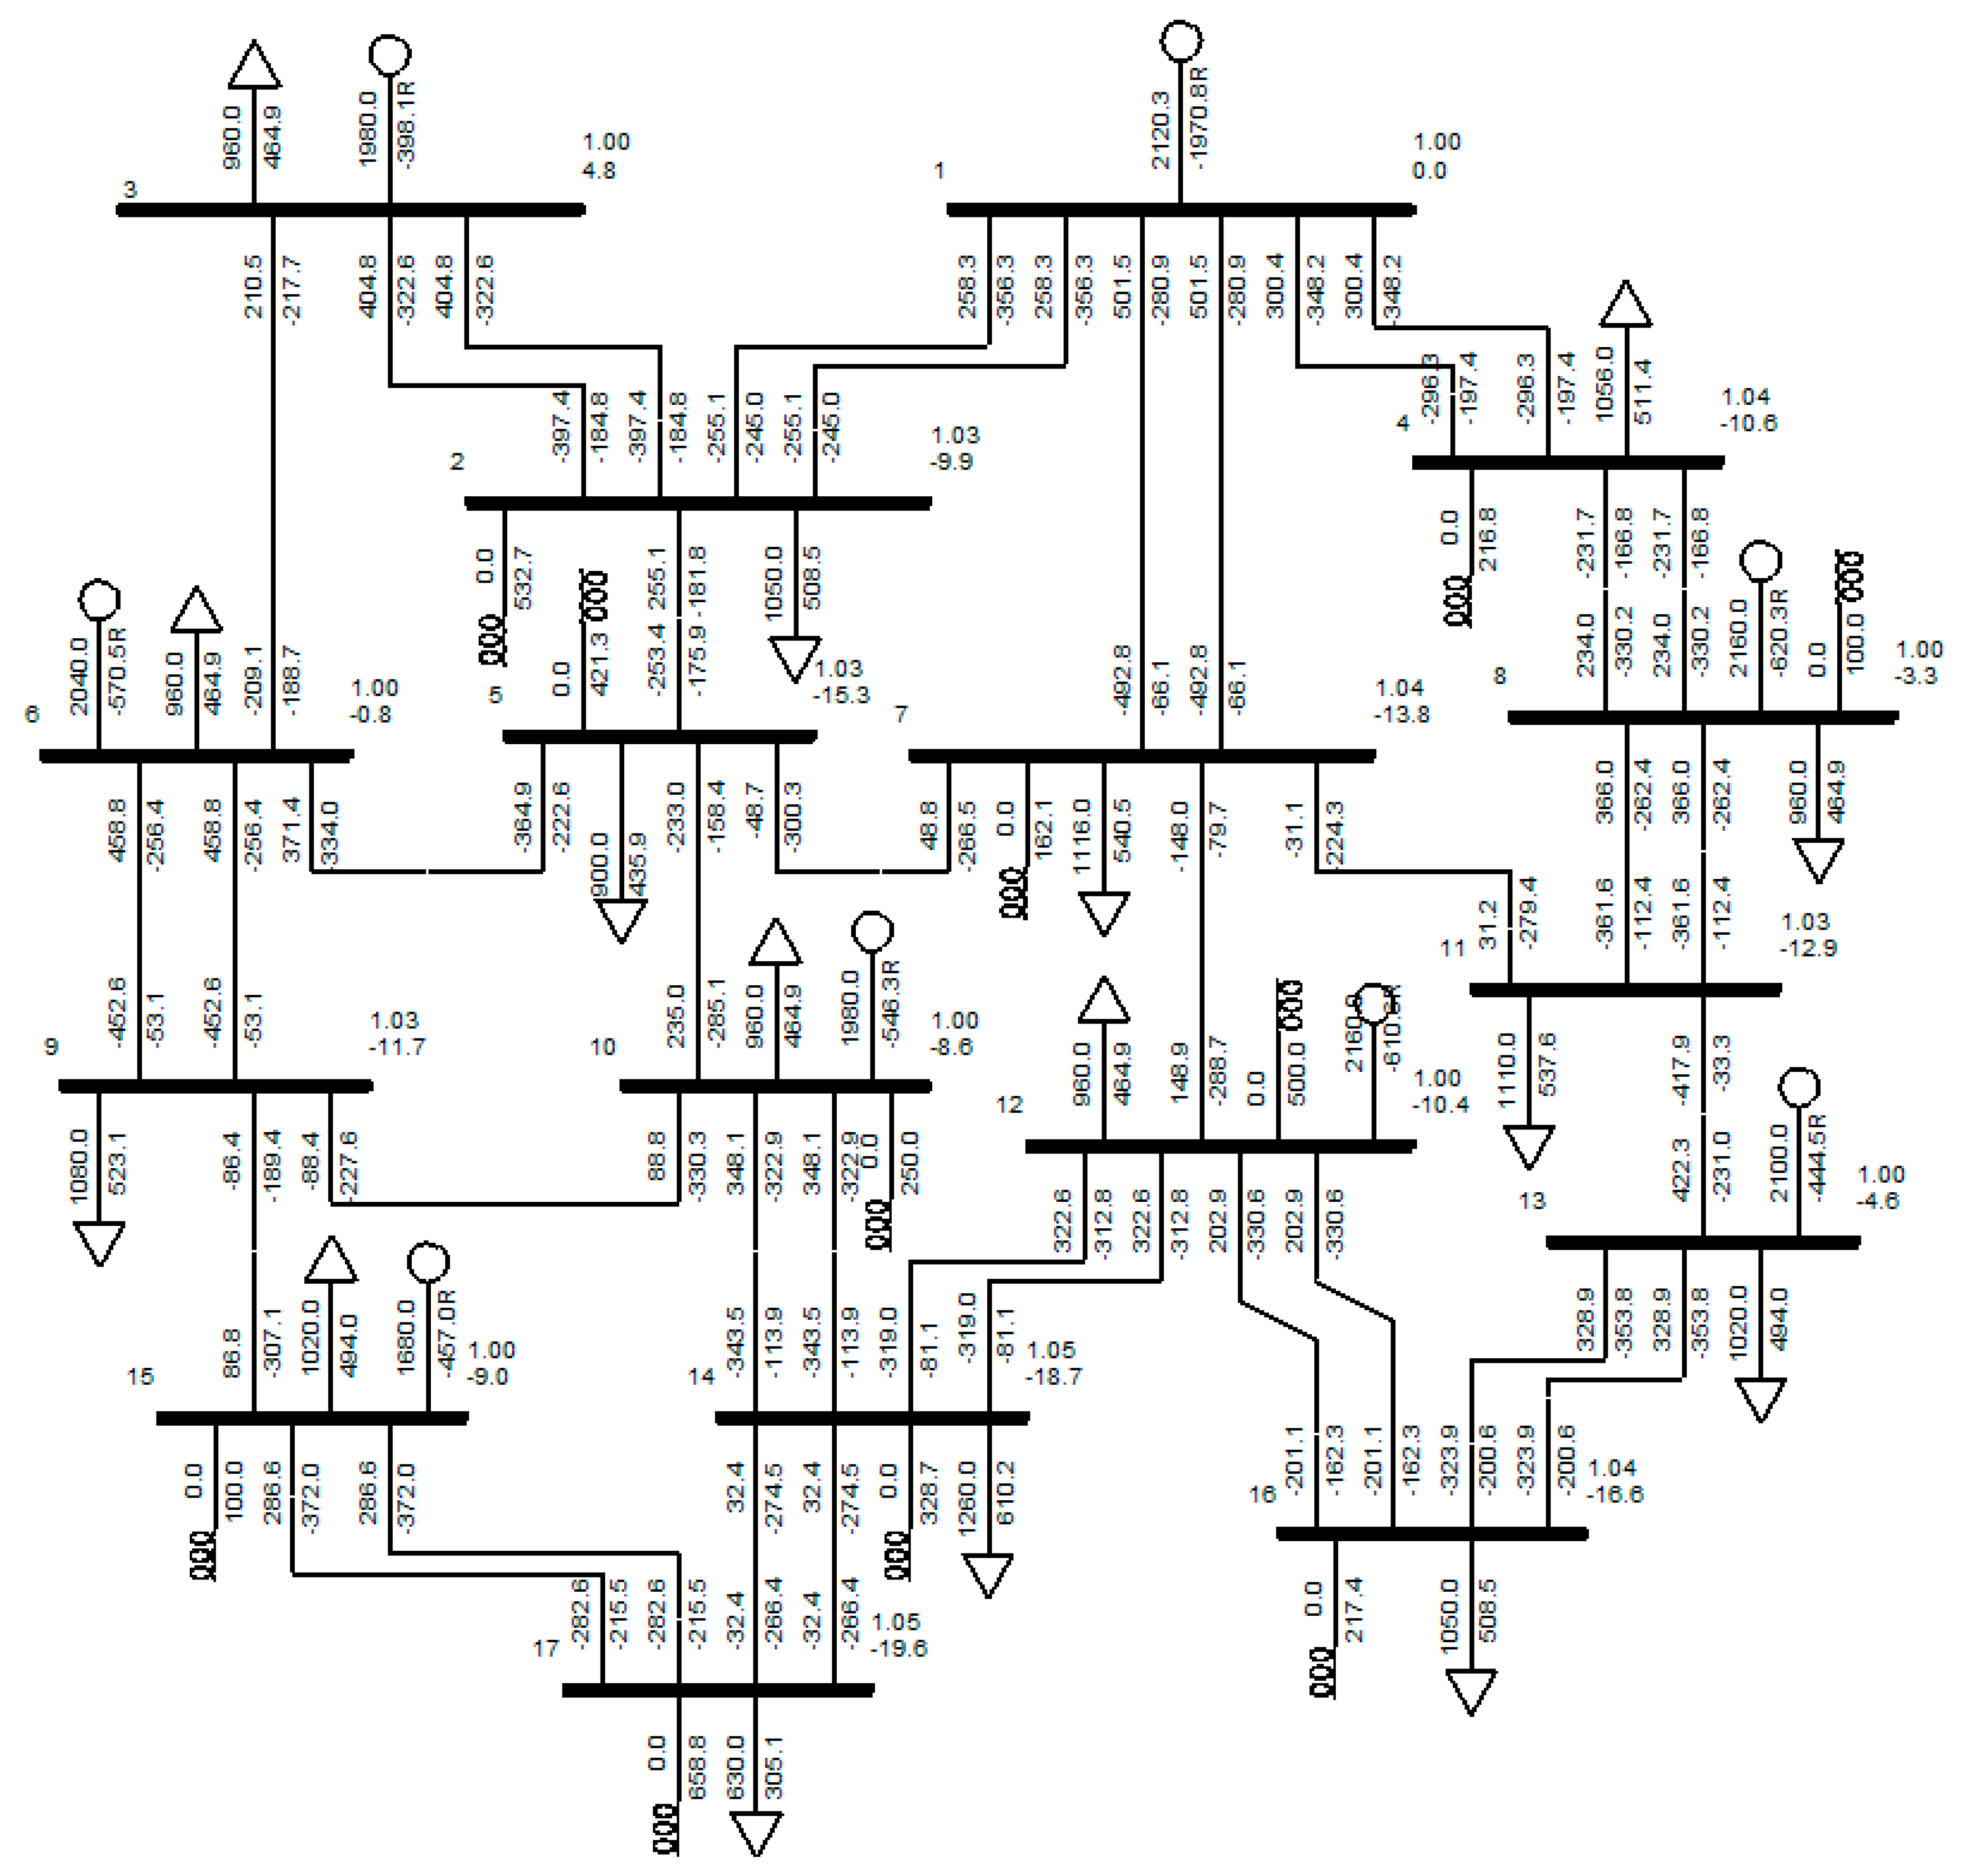
Figure 6.
Load flow results for the test case at dominant load under the worst contingency condition.
Figure 6.
Load flow results for the test case at dominant load under the worst contingency condition.

Figure 7.
Load flow result after TEP for adding generation unit at bus 18 at peak load under normal conditions.
Figure 7.
Load flow result after TEP for adding generation unit at bus 18 at peak load under normal conditions.


Table 1.
Transmission line length of the 17-bus test system.
| Line | Length (km) | Line | Length (km) |
|---|---|---|---|
| 1–2 | 512.90 | 7–12 | 300.00 |
| 1–4 | 474.19 | 8–11 | 349.09 |
| 1–7 | 370.91 | 9–10 | 447.27 |
| 2–3 | 485.45 | 9–15 | 398.18 |
| 2–5 | 294.55 | 10–14 | 392.73 |
| 3–6 | 349.55 | 11–13 | 261.29 |
| 4–8 | 416.13 | 12–14 | 348.38 |
| 5–6 | 519.00 | 12–16 | 406.45 |
| 5–7 | 435.48 | 13–16 | 490.91 |
| 5–10 | 376.36 | 14–17 | 403.64 |
| 6–9 | 316.36 | 15–17 | 502.70 |
| 7–11 | 387.09 |
Table 2.
Conductor information and line parameters for the 17-bus test system.
| Conductor and Bundle Information | Line Parameters | ||
|---|---|---|---|
| Type | 4 Macaw | Rsistance | 0.0228 |
| The outside diameter of the conductor (inches) | 1.055 | Inductance (mH/km) | 0.878 |
| Subconductor spacing(m) | 0.45 | Capacitor (nF/km) | 12.975 |
Table 3.
Generation information at peak load for the 17-bus test system.
| Bus (Type) | |V| (p.u.) | (MW) | (Mvar) | (Mvar) |
|---|---|---|---|---|
| Bus 3 (PV) | 1.04 | 3300 | −990 | 1980 |
| Bus 6 (PV) | 1.04 | 3400 | −1020 | 2040 |
| Bus 8 (PV) | 1.05 | 3600 | −1080 | 2160 |
| Bus 10 (PV) | 1.03 | 3300 | −990 | 1980 |
| Bus 12 (PV) | 1.05 | 3600 | −1080 | 2160 |
| Bus 13 (PV) | 1.05 | 3500 | −1050 | 2100 |
| Bus 15 (PV) | 1.00 | 2800 | −840 | 1680 |
Table 4.
Load and shunt compensator information at peak load for the 17-bus test system.
| Bus | Load | Fixed Shunt | |
|---|---|---|---|
| (MW) | (Mvar) | ||
| Bus 2 | 1750.00 | 847.56 | 100 Mvar Reactor |
| Bus 3 | 1600.00 | 774.92 | - |
| Bus 4 | 1760.00 | 852.41 | - |
| Bus 5 | 1500.00 | 731.33 | - |
| Bus 6 | 1600.00 | 774.92 | - |
| Bus 7 | 1860.00 | 900.88 | 100 Mvar Capacitor |
| Bus 8 | 1600.00 | 774.92 | - |
| Bus 9 | 1800.00 | 871.78 | 250 Mvar Capacitor |
| Bus 10 | 1600.00 | 774.92 | - |
| Bus 11 | 1850.00 | 896.00 | 250 Mvar Capacitor |
| Bus 12 | 1600.00 | 774.92 | - |
| Bus 13 | 1700.00 | 823.35 | - |
| Bus 14 | 2100.00 | 1017.07 | - |
| Bus 15 | 1700.00 | 823.35 | - |
| Bus 16 | 1750.00 | 847.56 | - |
| Bus 17 | 1050.00 | 508.54 | 300 Mvar Reactor |
Table 5.
Power flow analysis results for the test system at peak load under normal conditions.
| Bus # | Voltage | Generation | ||
|---|---|---|---|---|
| (deg.) | Pg (MW) | Qg (Mvar) | ||
| 1 | 1.050 | 0.00 | 3645.46 | −1454.12 |
| 2 | 1.050 | −16.05 | 0.0 | 0.0 |
| 3 | 1.040 | 6.93 | 3300.0 | 47.86 |
| 4 | 1.050 | −16.90 | 0.0 | 0.0 |
| 5 | 1.050 | −24.88 | 0.0 | 0.0 |
| 6 | 1.040 | −1.99 | 3400.0 | 99.33 |
| 7 | 1.046 | −22.34 | 0.0 | 0.0 |
| 8 | 1.050 | −5.91 | 3600.0 | −105.07 |
| 9 | 1.026 | −19.38 | 0.0 | 0.0 |
| 10 | 1.030 | −14.59 | 3300.0 | −297.31 |
| 11 | 1.038 | −20.99 | 0.0 | 0.0 |
| 12 | 1.050 | −17.65 | 3600.0 | −387.79 |
| 13 | 1.050 | −8.32 | 3500.0 | 154.92 |
| 14 | 1.050 | −30.84 | 0.0 | 0.0 |
| 15 | 1.000 | −14.89 | 2800.0 | −159.61 |
| 16 | 1.050 | −27.17 | 0.0 | 0.0 |
| 17 | 1.050 | −32.51 | 0.0 | 0.0 |
Table 6.
Summarized power flow analysis of test system for all single contingencies at peak load.
| Line Outage | Lowest Voltage | The Highest Line Loading | ||
|---|---|---|---|---|
| Bus # | % Loading | Line | ||
| 1–2 (1 line) | 0.937 | 2 | 39.8% | 1–7 |
| 1–4 (1 line) | 0.908 | 4 | 39.6% | 1–7 |
| 1–7 (1 line) | 0.957 | 7 | 54.7% | 1–7 |
| 2–3 (1 line) | 0.908 | 2 | 43.5% | 2–3 |
| 2–5 | 0.942 | 5 | 40.2% | 1–7 |
| 3–6 | 1.000 | 15 | 38.2% | 1–7 |
| 4–8 (1 line) | 0.921 | 4 | 34.4% | 1–7 |
| 5–6 | 0.900 | 5 | 37.2% | 1–7 |
| 5–7 | 0.949 | 5 | 34.7% | 1–7 |
| 5–10 | 0.901 | 5 | 35.4% | 1–7 |
| 6–9 (1 line) | 0.908 | 9 | 56.6% | 6–9 |
| 7–11 | 0.988 | 7 | 36.0% | 1–7 |
| 7–12 | 0.985 | 7 | 37.0% | 1–7 |
| 8–11 (1 line) | 0.948 | 11 | 44.2% | 8–11 |
| 9–10 | 0.953 | 9 | 36.0% | 1–7 |
| 9–15 | 0.991 | 9 | 35.9% | 1–7 |
| 10–14 (1 line) | 0.979 | 14 | 38.2% | 10–14 |
| 11–13 | 0.959 | 11 | 35.5% | 13–16 |
| 12–14 (1 line) | 0.970 | 14 | 39.1% | 12–16 |
| 12–16 (1 line) | 0.923 | 16 | 35.4% | 1–7 |
| 13–16 (1 line) | 0.900 | 16 | 37.1% | 13–16 |
| 14–17 (1 line) | 0.941 | 17 | 36.2% | 1–7 |
| 15–17 (1 line) | 0.900 | 17 | 36.2% | 1–7 |
Table 7.
Information on the load and shunt reactor at the dominant load for the test system.
| Bus | Load | Fixed Shunt Reactor | |
|---|---|---|---|
| (MW) | (Mvar) | ||
| Bus 2 | 1050.00 | 508.54 | 500 Mvar |
| Bus 3 | 960.00 | 464.95 | - |
| Bus 4 | 1056.00 | 511.44 | 200 Mvar |
| Bus 5 | 900.00 | 435.89 | 400 Mvar |
| Bus 6 | 960.00 | 464.95 | - |
| Bus 7 | 1116.00 | 540.50 | 150 Mvar |
| Bus 8 | 960.00 | 464.95 | 100 Mvar |
| Bus 9 | 1080.00 | 523.07 | - |
| Bus 10 | 960.00 | 464.95 | 250 Mvar |
| Bus 11 | 1110.00 | 537.60 | - |
| Bus 12 | 960.00 | 464.95 | 500 Mvar |
| Bus 13 | 1020.00 | 494.01 | - |
| Bus 14 | 1260.00 | 610.25 | 300 Mvar |
| Bus 15 | 1020.00 | 494.01 | 100 Mvar |
| Bus 16 | 1050.00 | 508.54 | 200 Mvar |
| Bus 17 | 630.00 | 305.12 | 600 Mvar |
Table 8.
Power flow results of the test system at dominant load under normal conditions.
| Bus # | Voltage | Generation | ||
|---|---|---|---|---|
| (deg.) | Pg (MW) | Qg (Mvar) | ||
| 1 | 1.000 | 0.00 | 2120.30 | −1970.84 |
| 2 | 1.032 | −9.90 | 0.0 | 0.0 |
| 3 | 1.000 | 4.77 | 1980.0 | −398.05 |
| 4 | 1.041 | −10.58 | 0.0 | 0.0 |
| 5 | 1.026 | −15.27 | 0.0 | 0.0 |
| 6 | 1.000 | −0.82 | 2040.0 | −570.53 |
| 7 | 1.040 | −13.81 | 0.0 | 0.0 |
| 8 | 1.000 | −3.30 | 2160.0 | −620.27 |
| 9 | 1.032 | −11.67 | 0.0 | 0.0 |
| 10 | 1.000 | −8.61 | 1980.0 | −546.31 |
| 11 | 1.025 | −12.89 | 0.0 | 0.0 |
| 12 | 1.000 | −10.39 | 2160.0 | −610.56 |
| 13 | 1.000 | −4.60 | 2100.0 | −444.45 |
| 14 | 1.047 | −18.73 | 0.0 | 0.0 |
| 15 | 1.000 | −8.99 | 1680.0 | −457.01 |
| 16 | 1.043 | −16.57 | 0.0 | 0.0 |
| 17 | 1.048 | −19.65 | 0.0 | 0.0 |
Table 9.
Summarized power flow result of the test system for all single contingencies at the dominant load.
Table 9.
Summarized power flow result of the test system for all single contingencies at the dominant load.
| Line Outage | Lowest Voltage | The Highest Line Loading | ||
|---|---|---|---|---|
| Bus # | % Loading | Line | ||
| 1–2 (1 line) | 0.971 | 2 | 25.3% | 1–7 |
| 1–4 (1 line) | 0.972 | 4 | 25.4% | 1–7 |
| 1–7 (1 line) | 1.000 | PV Buses | 32.2% | 1–7 |
| 2–3 (1 line) | 0.967 | 2 | 27.5% | 2–3 |
| 2–5 | 0.965 | 5 | 25.4% | 1–7 |
| 3–6 | 1.000 | PV Buses | 24.9% | 1–7 |
| 4–8 (1 line) | 0.982 | 4 | 23.0% | 1–7 |
| 5–6 | 0.950 | 5 | 23.7% | 1–7 |
| 5–7 | 0.953 | 5 | 22.0% | 1–7 |
| 5–10 | 0.963 | 5 | 23.1% | 1–7 |
| 6–9 (1 line) | 0.993 | 9 | 33.0% | 6–9 |
| 7–11 | 0.980 | 7 | 22.8% | 1–7 |
| 7–12 | 1.000 | PV Buses | 23.9% | 1–7 |
| 8–11 (1 line) | 0.986 | 11 | 26.3% | 8–11 |
| 9–10 | 0.987 | 9 | 23.9% | 1–7 |
| 9–15 | 0.992 | 9 | 23.8% | 1–7 |
| 10–14 (1 line) | 1.000 | PV Buses | 24.8% | 10–14 |
| 11–13 | 1.000 | PV Buses | 25.4% | 13–16 |
| 12–14 (1 line) | 1.000 | PV Buses | 24.7% | 12–16 |
| 12–16 (1 line) | 0.986 | 16 | 23.8% | 1–7 |
| 13–16 (1 line) | 0.970 | 16 | 23.7% | 13–16 |
| 14–17 (1 line) | 0.964 | 17 | 23.9% | 1–7 |
| 15–17 (1 line) | 0.960 | 17 | 24.1% | 1–7 |
Table 10.
Shunt compensator data for the TEP study: adding a new generation unit at bus 18.
| Peak Loading Condition | |||||||||||||
|---|---|---|---|---|---|---|---|---|---|---|---|---|---|
| Bus | 5 | 9 | 11 | 14 | 16 | 17 | 18 | ||||||
| Mvar | 100 (Cap.) | 350 (Cap.) | 350 (Cap.) | 100 (Cap.) | 250 | 300 | 300 | ||||||
| Dominant Loading Condition | |||||||||||||
| Bus | 2 | 3 | 4 | 5 | 6 | 7 | 8 | 10 | 12 | 14 | 16 | 17 | 18 |
| Mvar | 450 | - | 150 | 300 | 50 | 150 | 100 | 250 | 450 | 300 | 300 | 600 | 300 |
Table 11.
Shunt compensator data for the TEP to add a new generation at bus 18 and a new load at bus 19.
Table 11.
Shunt compensator data for the TEP to add a new generation at bus 18 and a new load at bus 19.
| Peak Loading Condition | ||||||||||||||
|---|---|---|---|---|---|---|---|---|---|---|---|---|---|---|
| Bus | 5 | 7 | 9 | 11 | 14 | 16 | 17 | 18 | 18 | |||||
| Mvar | 50 (Cap.) | 100 (Cap.) | 350 (Cap.) | 350 (Cap.) | 100 (Cap.) | 250 | 300 | 300 | 300 (Cap.) | |||||
| Dominant Loading Condition | ||||||||||||||
| Bus | 2 | 3 | 4 | 5 | 6 | 7 | 8 | 10 | 12 | 14 | 16 | 17 | 18 | 19 |
| Mvar | 450 | 150 | 150 | 300 | 500 | 150 | 100 | 250 | 450 | 300 | 300 | 600 | 300 | 300 (Cap.) |
Disclaimer/Publisher’s Note: The statements, opinions and data contained in all publications are solely those of the individual author(s) and contributor(s) and not of MDPI and/or the editor(s). MDPI and/or the editor(s) disclaim responsibility for any injury to people or property resulting from any ideas, methods, instructions or products referred to in the content. |
© 2024 by the authors. Licensee MDPI, Basel, Switzerland. This article is an open access article distributed under the terms and conditions of the Creative Commons Attribution (CC BY) license (https://creativecommons.org/licenses/by/4.0/).
Share and Cite
MDPI and ACS Style
Dhamala, B.; Ghassemi, M. A Test System for Transmission Expansion Planning Studies. Electronics 2024, 13, 664. https://doi.org/10.3390/electronics13030664
AMA Style
Dhamala B, Ghassemi M. A Test System for Transmission Expansion Planning Studies. Electronics. 2024; 13(3):664. https://doi.org/10.3390/electronics13030664
Chicago/Turabian StyleDhamala, Bhuban, and Mona Ghassemi. 2024. "A Test System for Transmission Expansion Planning Studies" Electronics 13, no. 3: 664. https://doi.org/10.3390/electronics13030664
Note that from the first issue of 2016, this journal uses article numbers instead of page numbers. See further details here.