
Synthetic Aperture Radar Image Despeckling Based on a Deep Learning Network Employing Frequency Domain Decomposition
1
School of Science, Yanshan University, Qinhuangdao 066004, China
2
School of Mechanical Engineering, Tianjin University, Tianjin 300072, China
*
Author to whom correspondence should be addressed.
Electronics 2024, 13(3), 490; https://doi.org/10.3390/electronics13030490
Submission received: 14 December 2023
/
Revised: 20 January 2024
/
Accepted: 22 January 2024
/
Published: 24 January 2024
(This article belongs to the Special Issue Application of Machine Learning and Intelligent Systems)
Abstract
:Synthetic aperture radar (SAR) images are inevitably interspersed with speckle noise due to their coherent imaging mechanism, which greatly hinders subsequent related research and application. In recent studies, deep learning has become an effective tool for despeckling remote sensing images. However, preserving more texture details while removing speckle noise remains a challenging task in the field of SAR image despeckling. Furthermore, most despeckling algorithms are designed specifically for a specific look and seriously lack generalizability. Therefore, in order to remove speckle noise in SAR images, a novel end-to-end frequency domain decomposition network (SAR−FDD) is proposed. The method first performs frequency domain decomposition to generate high-frequency and low-frequency information. In the high-frequency branch, a mean filter is employed to effectively remove noise. Then, an interactive dual-branch framework is utilized to learn the details and structural information of SAR images, effectively reducing speckles by fully utilizing features from different frequencies. In addition, a blind denoising model is trained to handle noisy SAR images with unknown noise levels. The experimental results demonstrate that the SAR−FDD achieves good visual effects and high objective evaluation metrics on both simulated and real SAR test sets (peak signal-to-noise ratio (PSNR): 27.59 ± 1.57 and structural similarity index (SSIM): 0.78 ± 0.05 for different speckle noise levels), demonstrating its strong denoising performance and ability to preserve edge textures.
1. Introduction
Synthetic aperture radar (SAR) is an active observation device that uses wideband signal pulse compression and virtual aperture synthesis to obtain high-resolution images. SAR has the ability to generate high-resolution remote sensing images at all times and under all weather conditions, unaffected by factors such as weather conditions and environmental lighting. Due to the numerous advantages of SAR imaging, it is widely used in military and civilian reconnaissance fields, such as forest detection, disaster prevention, and sea vessel detection [1,2,3]. However, due to the phenomenon of radar signal attenuation in SAR imaging systems, random biases are generated. Speckle noise is a common particle interference present in SAR images, which can degrade image quality and obscure image detail information, significantly affecting subsequent tasks such as target detection and image classification. Therefore, effectively suppressing speckle noise in SAR images plays an important role in its subsequent applications.
In the past few decades, researchers have proposed many methods to remove speckle noise. Initially, spatial domain filtering techniques were employed, which involved selecting local pixels and estimating their true values for filtering. Some famous filters include the Lee filter [4], Kuan filter [5], Frost filter [6], Gamma MAP filter [7], etc. However, the performance of these spatial domain filters is easily influenced by the filter window size. Larger windows may lead to the loss of texture details during denoising, while smaller windows may not effectively suppress noise.
Transform domain despeckling methods have been proposed since the early 1990s [8,9,10,11,12]. Compared to spatial domain filtering algorithms, transform domain-based methods not only effectively separate noise from the image but also better preserve edge and texture structures. However, if the threshold setting in the transform domain filtering process is not precise enough, spurious details and ringing artifacts may appear in the speckle-free results. Subsequently, researchers proposed non-local means (NLM) denoising methods, which filter the noisy image based on the similarity between the current noisy image patch and its neighboring patches using weighted averaging. Based on the NLM method, algorithms such as PPB [13], SAR-BM3D [14], FANS [15], and LPG-PCA [16] have been proposed, which have been proven to be effective for SAR image denoising. However, these methods require high computational costs and the selection of filtering parameters is crucial.
As an important branch of denoising techniques, variational-based methods establish an energy function between the actual values and the observed values for despeckling, which includes a data fitting term and a regularization term. By optimizing the energy function, these methods preserve edge information and smooth the image to achieve denoising. Rudin et al. [17] proposed the total variation (TV) method, which minimizes the total variation to remove image noise. Aubert and Aujol [18] introduced the AA model, which utilizes the maximum a posteriori estimator to establish a function and find the minimum value. Building upon the AA model, Shi and Osher [19] modified the regularization term and proposed the SO model. Chen et al. [20] proposed a denoising model that incorporates fractional order total variation and non-local low-rank regularization terms to suppress speckles in SAR images. In [21], Ren et al. presented a novel optimization model for removing multiplicative noise and blur, employing a Gaussian curvature regularization that captures high-order variational information of the image. However, the above variational-based methods often rely on the selection of model parameters and prior information. Improper parameter choices may lead to detail loss and compromise the denoising and structure-preserving capabilities.
In recent years, convolutional neural networks (CNN) [22] have received widespread attention in the field of image processing, achieving significant advancements in image denoising [23], image segmentation [24,25], and object detection [26]. In the field of despeckling, Chierchia et al. [27] were the first to apply CNN to SAR image denoising. They used homomorphic transformation to convert the multiplicative noise in SAR images into additive noise, and then used residual learning for training. Subsequently, Wang et al. [28] proposed the ID-CNN network, which relies on residual learning to estimate the noise in images and obtains denoised images by dividing the residual connection. Zhang et al. [29] used dilated convolution [30] to increase the receptive field and proposed a lightweight network called SAR-DRN, which greatly reduced the training time and achieved good despeckling results. Another lightweight network, HDRANet [31], enhanced the model’s representation and performance by using skip connections and a convolutional block attention module (CBAM) to construct a hybrid dilated convolution (HDC). Gui et al. [32] used dilated convolution to enlarge the receptive field and used a dense connection network to alleviate the gradient vanishing problem, proposing a speckle noise suppression network called SAR-DDCN. Lattari et al. [33] used a U-Net network to remove speckles and used a total variation term as a loss function. Shen et al. [34] decoupled the SAR variational model into two subproblems, a data fitting term and a regularization term, and solved them iteratively using two modules. This model also used an updated despeckling gain loss function. In addition, Aghababaei et al. [35] proposed a stand-alone model-free non-local (NL) despeckling framework for the removal of speckle noise from single-channel and multi-channel SAR data. In addition to the above-mentioned fully supervised training methods, many semi-supervised and self-supervised training methods have been proposed, such as SAR2SAR [36], Speckle2Void [37], and MERLIN [38]. They solved the problem of difficulty in obtaining a large number of SAR clear labels. Although the above algorithms have improved the effectiveness of speckle noise suppression in SAR images to some extent, there are still shortcomings in preserving image details. The denoised images often suffer from over-smoothing or artifacts.
To maximize the denoising capability of the network, this paper introduces a dual-branch interactive network architecture based on frequency domain decomposition. The main contributions of this study are as follows:
(1) We propose a dual-branch interactive network architecture based on frequency domain decomposition, which not only effectively removes speckle noise but also preserves the edge texture details of SAR images well.
(2) The proposed SAR−FDD can achieve good despeckling effects in both known and unknown noise levels, and outperforms many existing speckle reduction methods.
(3) An updated despeckling gain loss, as well as a combination of first order and second order variational losses is adopted in the SAR−FDD model, all of which have strong advantages compared to the commonly used MSE loss function.
The rest of this article is organized as follows. Section 2 introduces the SAR speckle statistical model and the frequency domain decomposition model. In Section 3, the specific implementation details and methods of the proposed network are described. In Section 4, we validate the performance of the SAR−FDD method on simulated and real SAR datasets. Finally, our conclusions are presented in Section 5.
2. Related Works
2.1. Statistical Model of SAR Speckle
The speckle noise present in SAR images can be classified as a type of multiplicative noise, which is different from the additive Gaussian noise in natural images. Assuming is the degraded image, denotes the clean image, and is the speckle, the definition of the multiplicative noise model is as follows:
In general, for SAR images, satisfies a Gamma distribution with a mean of 1 and a variance of . Its probability density function (pdf) is defined as:
where , , is the equivalent number of looks (ENL) and is the gamma function.
2.2. Frequency Domain Decomposition Model
All images are composed of signals of different frequencies. The main information of an image is primarily present in the low-frequency signals [39], while speckle noise is mainly distributed in the high-frequency signals. Exploiting this characteristic, we can focus on preserving the structural information in the low-frequency information of the image, removing the speckle noise in the high-frequency information, and retaining the details. Many methods based on frequency domain decomposition have been proposed in various fields. Chen et al. [40] introduced a novel octave convolution that separately stores high-frequency and low-frequency information, reducing spatial redundancy in convolutional neural networks. Yang et al. [41] utilized a modified octave convolution and proposed a frequency domain decomposition algorithm to remove speckle noise in ultrasound images. Deng et al. [42] also tackled image restoration from a frequency domain perspective and proposed an end-to-end detail-recovery image deraining network (DRD-Net). However, due to the complex composition of speckle noise and background information in SAR images, some traditional deep learning methods are limited in their ability to restore clean images. Therefore, inspired by the aforementioned frequency domain decomposition methods, this paper proposes a deep learning network employing frequency domain decomposition for SAR image despeckling tasks.
3. Methodology
3.1. General Network Architecture
The overall framework of the SAR image despeckling algorithm based on the frequency domain decomposition network proposed in this paper is shown in Figure 1. It is an end-to-end interactive dual-branch neural network. Firstly, the noisy input image is downsampled using max pooling and average pooling. Inspired by reference [41], the original image is treated as the high-frequency component, while the downsampled image is treated as the low-frequency component. Then, a convolution operation, batch normalization (BN) [43], and a PReLu activation function are applied to expand the channels of both components to 64 channels, generating the high-frequency feature and the low-frequency feature . Next, both components are simultaneously processed by the iterative “Denoising Block”. Finally, the high-frequency component and the low-frequency component are added together, and feature extraction is performed using convolutional layers. To ensure the resolution of the feature maps, the convolution kernels are set to 3 × 3. The BN and activation function are added after the convolution to prevent gradient vanishing during training and better utilize the network’s non-linear modeling capability. At the end of the model, a residual strategy [44] with a long skip connection (LSC) is used to facilitate fast convergence during model training without feature degradation.
The core idea of the network proposed in this paper is to divide SAR image features into high-frequency components and low-frequency components, namely a dual-branch module, representing the detailed information and structural information of the image, respectively. In consideration of the properties of speckle noise, the high-frequency branch of the network incorporates a mean filter to effectively remove noise. Meanwhile, the low-frequency branch serves the purpose of restoring structural information and facilitating the recovery of intricate details in subsequent stages. By utilizing the interaction between these two components, the SAR−FDD model effectively removes speckles from SAR images.
In this paper, we propose the method with frequency domain decomposition to create interactive networks for high and low frequencies, which are different from existing approaches. The denoising block, feature extraction block, and feature denoising block in the SAR−FDD network are all submodules we designed based on our experience. The specific details of these submodules will be explained in Section 3.2. Additionally, we propose a blind despeckling model called SAR−FDD−B, which changes the training approach while keeping the model unchanged. This model aims to remove noisy images with unknown noise levels.
3.2. Network Subblock Structure
(1) Denoising Block
Inspired by the ultrasound image despeckling network [41], we decompose the input image in the frequency domain. As shown in Figure 2, the high-frequency component and the low-frequency component are taken as the two inputs of the denoising block, and both branches are processed simultaneously. The feature denoising block (FDB) is applied in the high-frequency branch for denoising, while the low-frequency branch only utilizes the feature extraction block (FEB) for extracting low-frequency features. Additionally, in the high-frequency branch, the combination of the FEB and channel attention (CA) through skip connections significantly improves the despeckling performance. The high-frequency component provides fine details to the low-frequency component, while the low-frequency component provides structural information to the high-frequency component. The denoising block facilitates the exchange of high-frequency and low-frequency information in the dual-branch network, achieving the goal of removing speckles while preserving the details.
(2) Feature Extraction Block (FEB)
SAR images exhibit different image features in different regions. This fact implies that our denoising network should capture contextual information at multiple scales. In the field of image denoising, focusing on contextual information can effectively help us restore images, and increasing the receptive field is the main approach. Therefore, the FEB employs parallel cascades of convolutional layers with different dilation rates, as shown in Figure 3. Dilated convolutions increase the receptive field while keeping the number of parameters unchanged, and also ensure that the size of the output feature maps remains the same. In addition, we also use skip connections to propagate the input image’s feature information to the output layer, reducing the loss of image details.
(3) Feature Denoising Block (FDB)
The presence of noise can affect the extraction of image features, so it is crucial to effectively suppress unnecessary noise before feature extraction. The structure of the FDB is shown in Figure 4. The FDB module first goes through a convolutional layer and a PReLu non-linear activation function. Then, it utilizes a mean filter as the primary denoising operation. Finally, the denoising process is encapsulated using a convolution and skip connections. Since some pixels in SAR images have high values and are prone to speckle noise, median filters may overlook pixels with higher values. In contrast, a mean filter can remove noise while smoothing details [34]. In addition, the mean filter algorithm is simple, computationally efficient, and does not introduce any parameters.
(4) Channel Attention (CA)
Integrating a channel attention mechanism into the network enhances its ability to capture features. It can selectively emphasize effective features and suppress irrelevant ones. In recent years, researchers have widely used the attention mechanism in the field of SAR image despeckling [31,45] and achieved significant results. The channel attention mechanism used in this paper is illustrated in Figure 5. CA first performs squeezing operations on the feature map through average pooling, , and max pooling, . Then, they are fed into a shared network composed of a multi-layer perception (MLP) model. Finally, the input and output features are aggregated to obtain the features . The entire CA process can be represented as follows:
where and denote convolution operations, represents the ReLU activation function, and represents the sigmoid function.
3.3. Overall Network Training
During the training process of the SAR−FDD network proposed in this paper, we construct a training set which consists of a set of clean reference SAR images, , and a set of noisy SAR images, . Our goal is to minimize the loss between the network’s output, , and by adjusting the parameter of the network, which is expressed as
Here, represents the loss function. Therefore, the choice of loss function is crucial. In order to satisfy the multiplicative property of speckles, this paper adopts the improved DG measure as part of the loss function [46]. The DG measure is defined as
where , , and are the speckled image, the clean image, and the filtered image. In order to improve the convergence of the model, the DG loss function is transformed into the following form:
Although the DG loss function can effectively train the network and achieve stability, the denoised images often exhibit various artifacts. To address this issue, we introduce first order and second order variation loss functions [47] on top of the DG loss to achieve better denoising results. The comparison results of different loss functions are presented in Section 4.5. The definitions of the first order and second order variation loss functions are as follows:
So, the total loss function is calculated as follows:
where and are the weight coefficients of the first order variation and the second order variation loss functions, respectively. The first term in Equation (9) is primarily used to control the despeckling performance. The second and third terms mainly control the smoothness of the despeckled image. The final despeckled image should both preserve the fine details of the original image and have a certain level of smoothness. Therefore, the values of and should be less than 1. In this paper, we have chosen as the weight coefficient.
4. Results and Discussion
4.1. Experimental Setting
(1) Parameter settings and network training
The model proposed in this article was trained using the ADAM [48] optimization algorithm with , , and . In the training process, the initial learning rate of the model was set to , and the learning rate was reduced by a factor of 0.1 every 10 epochs. The model was trained for a total of 50 epochs with a batch size of 256. The SAR−FDD model was implemented using Pytorch 1.7.1 and all experiments were conducted on a computer with an NVIDIA GeForce RTX 3090 GPU.
(2) Training and testing datasets
Due to the absence of clean SAR images in real life, we chose the UC Merced Land-Use remote sensing image dataset [49] as the dataset in this paper. This dataset includes 21 categories of scene images such as buildings, forests, harbors, and highways. Each category has 100 images, totaling 2100 images, with a size of 256 × 256 pixels for each image. The images were manually extracted from large images from the USGS National Map Urban Area Imagery collection for various urban areas around the country. The pixel resolution of this public domain imagery is 1 foot. To train the proposed network, 50 images were selected randomly from each category of scenes in this dataset, with a total of 1050 clean training samples. Then, we segmented the training samples into 40 × 40 blocks with a stride of 15 and applied random rotations and flips to increase the diversity of the data. For training the model with known noise levels, we added multiplicative noise with an L of 1, 2, and 4 to the training sets to simulate SAR noisy images, which were used as inputs to the network. For the blind despeckling model, we randomly added speckle noise with an L of 1, 2, 4, 6, 8, and 10 to the training sets. This model only needs to be trained once to restore SAR noisy images with different noise levels. The test dataset was divided into simulated and real image parts. For the simulated dataset, 5 images were selected randomly from each category of scenes in the UC Merced Land-Use dataset, totaling 105 images, and noise with an L of 1, 2, and 4 was added to each image. It should be noted that the images in the test dataset are not included in the training dataset. For the real SAR image denoising test, we used three images: Noerdlingen, a horse track, and Volgograd [50].
4.2. Comparative Methods and Quantitative Evaluations
To demonstrate the feasibility and effectiveness of the proposed network for SAR image despeckling, we tested it on simulated and real SAR image datasets and compared it with nine representative methods, including PPB [13], SAR-BM3D [14], SAR-POTDF [51], FANS [15], ID-CNN [28], SAR-DRN [29], HDRANet [31], SAR-RDCP [34], and SAR-CAM [45]. The first four methods are traditional despeckle algorithms, while the latter five are deep learning-based methods. It is worth noting that, in order to make a fair comparison among CNN-based models, we retrained all deep learning-based methods using the same dataset as ours and kept their model parameters consistent with those set in their respective papers.
The quality of the model is mainly evaluated through subjective analysis and objective analysis. Subjective analysis involves visually comparing the denoised images generated by our proposed method with the original images and the denoised images produced by other methods. The main observation is the suppression of speckle noise and the preservation of edge and texture structures. For objective evaluation of the denoising performance on simulated SAR images with reference labels, peak signal-to-noise ratio (PSNR) and structural similarity index (SSIM) can be chosen as evaluation metrics.
The PSNR is a metric that calculates the result by measuring the mean square error between corresponding pixels of two images. In general, a higher PSNR value indicates that the denoised image is closer to the clean image. The definition of PSNR is as follows:
where and are the pixel points of image and image , respectively, and denote the length and width of the image, and is the maximum pixel value of the SAR image, whose value is the constant 255.
The SSIM measures the similarity between two images in terms of luminance, contrast, and structure. It effectively evaluates the edge-preserving capability of the denoised image. The SSIM ranges from 0 to 1, with a higher value indicating a better denoising effect. The definition of SSIM is as follows:
where and denote the mean of the images and , and denote the variance of the images and , and denotes the covariance of the two images. and are constants that are not equal to zero.
For real SAR images without a clean reference image, this study utilizes no-reference metrics for evaluation, including the equivalent number of looks (ENL) [52], mean of image (MoI) [53], mean of radio image (MoR) [53], and the edge preservation degree based on the ratio of the average (EPD-ROA) [46].
(1) The ENL is an evaluation metric used to measure the noise suppression capability of an algorithm in a homogeneous area of an image. A higher ENL value indicates that the calculated homogeneous area is smoother, indicating better noise suppression performance of the algorithm. The calculation formula for the ENL is as follows:
where and denote the mean and variance of image in the homogeneous area .
(2) The MoI calculates the ratio of the mean values between the noisy image and the original image within a homogeneous area. A higher MoI value closer to 1 indicates a better filtering effect. The MoI is formulated as
where and denote the average values of the despeckled image and the noisy image in a homogeneous area , respectively.
(3) The MoR calculates the mean of the ratio image, which is the ratio between the noisy image and the denoised image. It can be used to measure the preservation degree of radiometric information in the filtered result. The closer the value of the MoR is to the ideal value of 1, the better the preservation of radiometric information. The MoR is expressed as
where and denote the denoised image and the noisy image, respectively.
(4) The EPD-ROA is used to measure the edge-preserving ability of the despeckled image. A higher value indicates a stronger edge-preserving ability. The EPD-ROA is calculated as
where represents the index of the SAR image, and and represent the adjacent pixel values in the horizontal and vertical directions of the denoised image, while and represent the adjacent pixel values in the horizontal and vertical directions of the noisy image, respectively.
4.3. Simulated Data Experiments
In order to verify the feasibility and effectiveness of our proposed model for denoising simulated SAR images, we utilize two objective metrics, namely PSNR and SSIM, to compare and analyze the results of various algorithms. The average quantitative results on the test sets are shown in Table 1. To facilitate the comparison of metric values, the best results and the second-best results are highlighted in bold and underlined, respectively. From Table 1, it can be observed that the deep learning methods consistently outperform the traditional methods in terms of metric values under different noise levels. The PPB method exhibits the lowest metric values among all methods, indicating that it has the worst denoising effect. In contrast, the SAR-POTDF shows a significant improvement in both PSNR and SSIM metrics, especially at L = 4, while the SAR-BM3D and the FANS achieve the strongest denoising performance among the traditional methods. The FANS has a lower SSIM value compared to the SAR-BM3D, which suggests that the structure preservation ability of the FANS is poor. However, the deep learning methods demonstrate significant improvements in the metric values, indicating their stronger denoising capabilities compared to the traditional methods. The early proposed ID-CNN method exhibits a relatively poor despeckling performance. On the other hand, the SAR-DRN and the HDRANet show further enhancement in denoising capabilities. Among these deep learning methods, the proposed SAR−FDD method achieves the highest values in both PSNR and SSIM metrics. The PSNR value of the SAR−FDD is about 0.4 dB higher than the SAR-RDCP and the SAR-CAM, and the SSIM value gain is about 0.2. Additionally, we trained a blind denoising model, SAR−FDD−B. Although the SAR−FDD−B has lower values in objective evaluation metrics compared to the SAR−FDD, it exhibits strong generalization ability in removing speckles from SAR images with unknown noise levels.
In this study, three representative images were randomly selected from the test datasets of 105 images for result demonstration, as shown in Figure 6. They show an airplane, an overpass, a tennis court, and a dense residential area with specific areas highlighted by red boxes for zoomed views. The denoising algorithms mentioned above were applied to compare the visual results across these three images. Figure 7, Figure 8 and Figure 9 display the noisy and denoised images of the airplane at different noise levels (L = 1, 2, 4). We observed that, as the noise level increased, the images became increasingly blurry and difficult to restore. From the experimental results in Figure 7, it can be seen that the four traditional methods exhibited significant blurring, failing to fully restore the shape of the airplane’s wings. While the ID-CNN, the SAR-DRN, and the HDRANet preserved more structural information compared to the traditional methods, they introduced artifacts around sharp edges. The SAR-RDCP and the SAR-CAM are the two most competitive methods compared to the proposed SAR−FDD method, but the edge structures of the transportation vehicle are still incomplete as seen from the local zoomed-in images. Compared with these methods, the proposed SAR−FDD method achieved the best restoration results, with the clearest airplane wings and other edge structures.
Figure 10, Figure 11 and Figure 12 show the noisy images and denoised images of the overpass with different values of L (L = 1, 2, 4). As shown in Figure 10b, Figure 11b, and Figure 12b, the PPB method applies over-smoothing to homogeneous areas of the images, resulting in ringing artifacts in the edge areas and significant degradation of the structural information. In Figure 10c,d and Figure 11c,d, both the SAR-BM3D and the SAR-POTDF methods still exhibit noise in the denoised images. Compared to the first three traditional methods, the FANS performs better but the restoration of the lane lines is incomplete. However, the convolutional neural network models achieve a better balance between image smoothing and edge feature preservation. In Figure 10f–j and Figure 11f–j, the ID-CNN, the SAR-DRN, the HDRANet, the SAR-RDCP, and the SAR-CAM fail to restore clear edge shapes of the vehicles and cause distortion and degradation of the lane lines. At L = 4, all methods achieve relatively complete recovery of the lane lines, but from the zoomed-in region, it can be observed that the SAR−FDD and the SAR−FDD−B perform the best in restoring the right lane line. Therefore, the proposed method in this study can effectively restore the structural shape of vehicles and the texture information of lane lines, yielding the best visual results.
Figure 13, Figure 14 and Figure 15 present the noisy images and denoised images of a tennis court for different values of L (L = 1, 2, 4). From the visual results of L = 1 and L = 2, it can be observed that the traditional methods PPB, SAR-POTDF, and FANS hardly preserve the boundary features of the tennis court. The SAR-BM3D retains some edge structures but suffers from a significant amount of speckle noise. On the other hand, the ID-CNN, the SAR-DRN, the HDRANet, the SAR-RDCP, and the SAR-CAM partially recover the outer shape of the tennis court but distort its texture details. The proposed methods maintain the crucial contours and structural elements, with minimal noise residue in homogeneous regions. However, when the noise level is low, the PPB, the SAR-POTDF, and the FANS exhibit over-smoothing in homogeneous areas, while the ID-CNN shows edge artifacts. Although other methods maintain the key contour information, they exhibit incomplete edges and slight distortions. In comparison, our proposed methods, the SAR−FDD and the SAR−FDD−B, preserve the clearest boundary lines of the tennis court, allowing for easy differentiation of image edges and contours. For dense residential area images in Figure 16, Figure 17 and Figure 18, we can also draw the same conclusion as before, that our method achieves good denoising results and outperforms the other methods.
4.4. Real SAR Data Experiments
To test the effectiveness of the proposed algorithm on real SAR images, three real SAR images from different regions were selected in this study, as shown in Figure 19. Figure 19a presents a 1 m resolution TerraSAR-X image capturing landscapes in Noerdlingen, Germany. Figure 19b displays an SAR image with a resolution of 1 m in Ku-band, capturing a horse track near Albuquerque, NM. Figure 19c shows a TerraSAR-X image from the west of Volgograd with a resolution of 10 m. All of these images are four-look images and can be used to assess the performance of various algorithms. In the figure, the blue rectangle represents the homogeneous area used for calculating ENL, MoI, and MoR, while the green rectangle represents another homogeneous area used for calculating ENL. The size of both blue and green rectangles is .
Figure 20, Figure 21 and Figure 22 show the results of despeckling visualization for the real images Noerdlingen, horse track, and Volgograd. It is observed that the SAR-BM3D still retains a significant amount of residual noise, while the other methods perform well in terms of noise suppression. The PPB and the FANS exhibit over-smoothing in homogeneous regions. The SAR-POTDF method introduces undesired artifacts in uniform regions, especially producing noticeable black unrelated speckles in the image of Volgograd. Compared to traditional methods, deep learning approaches demonstrate good performance in preserving edge textures. Among them, the SAR−FDD−B stands out by achieving a good balance between smoothness and edge texture preservation. From the zoomed-in images, the ID-CNN, the SAR-DRN, and the HDRANet result in blurring and artifacts at sharp boundaries. The SAR-RDCP, the SAR-CAM, and the SAR−FDD all have good overall structural restoration results, but the SAR−FDD method produces images with the clearest and most complete lines. Therefore, the SAR−FDD and the SAR−FDD−B exhibit outstanding performance in removing abundant edge textures and sharp features, delivering satisfactory despeckling results.
As objective evaluation metrics for reference-free images, ENL, MoI, MoR, and EPD-ROA were calculated and are presented in Table 2. For the purpose of comparison, the maximum values and the second-best results are highlighted in bold and underlined, respectively. It is observed that the SAR−FDD method performs the best in the EPD-ROA metric, indicating that this method maintains enough edge structural information. The SAR−FDD−B method exhibits the optimal ENL results in most regions, suggesting its superior noise suppression capability in uniform areas. Additionally, the SAR−FDD ranks among the top three in terms of MoI and MoR results for the Noerdlingen and horse track images.
In order to further evaluate the despeckling effect of real images, inspired by reference [34], our study employs an unsupervised estimation method called “ENL map”. This method calculates the ENL value of a block of images and slides it until the entire image is covered. In homogeneous areas, the pixel values have less variation, resulting in a higher ENL value. Conversely, in edge regions, the pixel values differ more, leading to a lower ENL value. The ENL map reflects the despeckling effect in both homogeneous and edge areas. The results of the ENL maps for the three real test images are shown in Figure 23, Figure 24 and Figure 25. It is observed that the SAR-BM3D and the FANS methods have serious detail loss. The PPB method exhibits an obvious despeckling effect in homogeneous areas but introduces artifacts in edge regions, resulting in thick lines in the ENL map. The SAR-POTDF method has noise residue, which is particularly evident in Figure 25d. Regarding deep learning methods, the despeckling capability of the ID-CNN, the SAR-DRN, the HDRANet, and the SAR-RDCP in homogeneous areas needs to be improved. The SAR-CAM method shows a strong despeckling ability but falls short in edge preservation compared to the proposed SAR−FDD−B. Regarding the two proposed methods in this study, the edge feature preservation of SAR−FDD is sufficient, but there is more noise present. So, when it comes to removing noise from real noisy SAR images, the SAR−FDD−B method achieved excellent results in speckle suppression and edge preservation.
4.5. Ablation Study
(1) The impact of the CA module on algorithm performance
In Section 3.2, this paper introduces the channel attention mechanism (CA) used in the network, which enables the network to focus on important feature information and improve the performance of the convolutional neural network. To verify the effectiveness of CA on the network model, two sets of experiments are presented in this paper, one with the CA module and the other without it. Figure 26 shows the curves of average PSNR and SSIM with epoch in the test datasets under a noise level of L = 4. It was found that the metric values were improved by about 0.1 dB and 0.01, respectively, with the CA module compared to the model without the CA module. So, the CA module can enhance the network’s information extraction capability, thereby improving the denoising effect of the network.
(2) The impact of the denoising block on algorithm performance
In Figure 1, the denoising block plays a key role. The number of denoising blocks used in this study is determined based on the experimental results shown in Figure 27. It is observed that, when the number of denoising blocks is less than 5, both the PSNR and SSIM values increase as the number of denoising blocks increases. However, when the number of denoising blocks reaches 5, the gains in PSNR and SSIM are not significant or even tend to decrease. Therefore, considering the computational complexity and denoising performance, this study selects 4 as the number of denoising blocks.
(3) The impact of the loss function on algorithm performance
In order to validate the effectiveness of the loss function proposed in Section 3.3, we trained the model using five different loss functions. Table 3 shows the results of the denoising performance of the model with different loss functions when L = 4, with the best result marked in bold. We found that the loss function used in this paper achieved the highest PSNR and SSIM values. However, the commonly used MSE loss function showed the lowest quantitative results, likely due to its susceptibility to outliers. Therefore, using the loss function pays more attention to the speckle noise, resulting in the best denoising results.
4.6. About Runtime and Number of Parameters
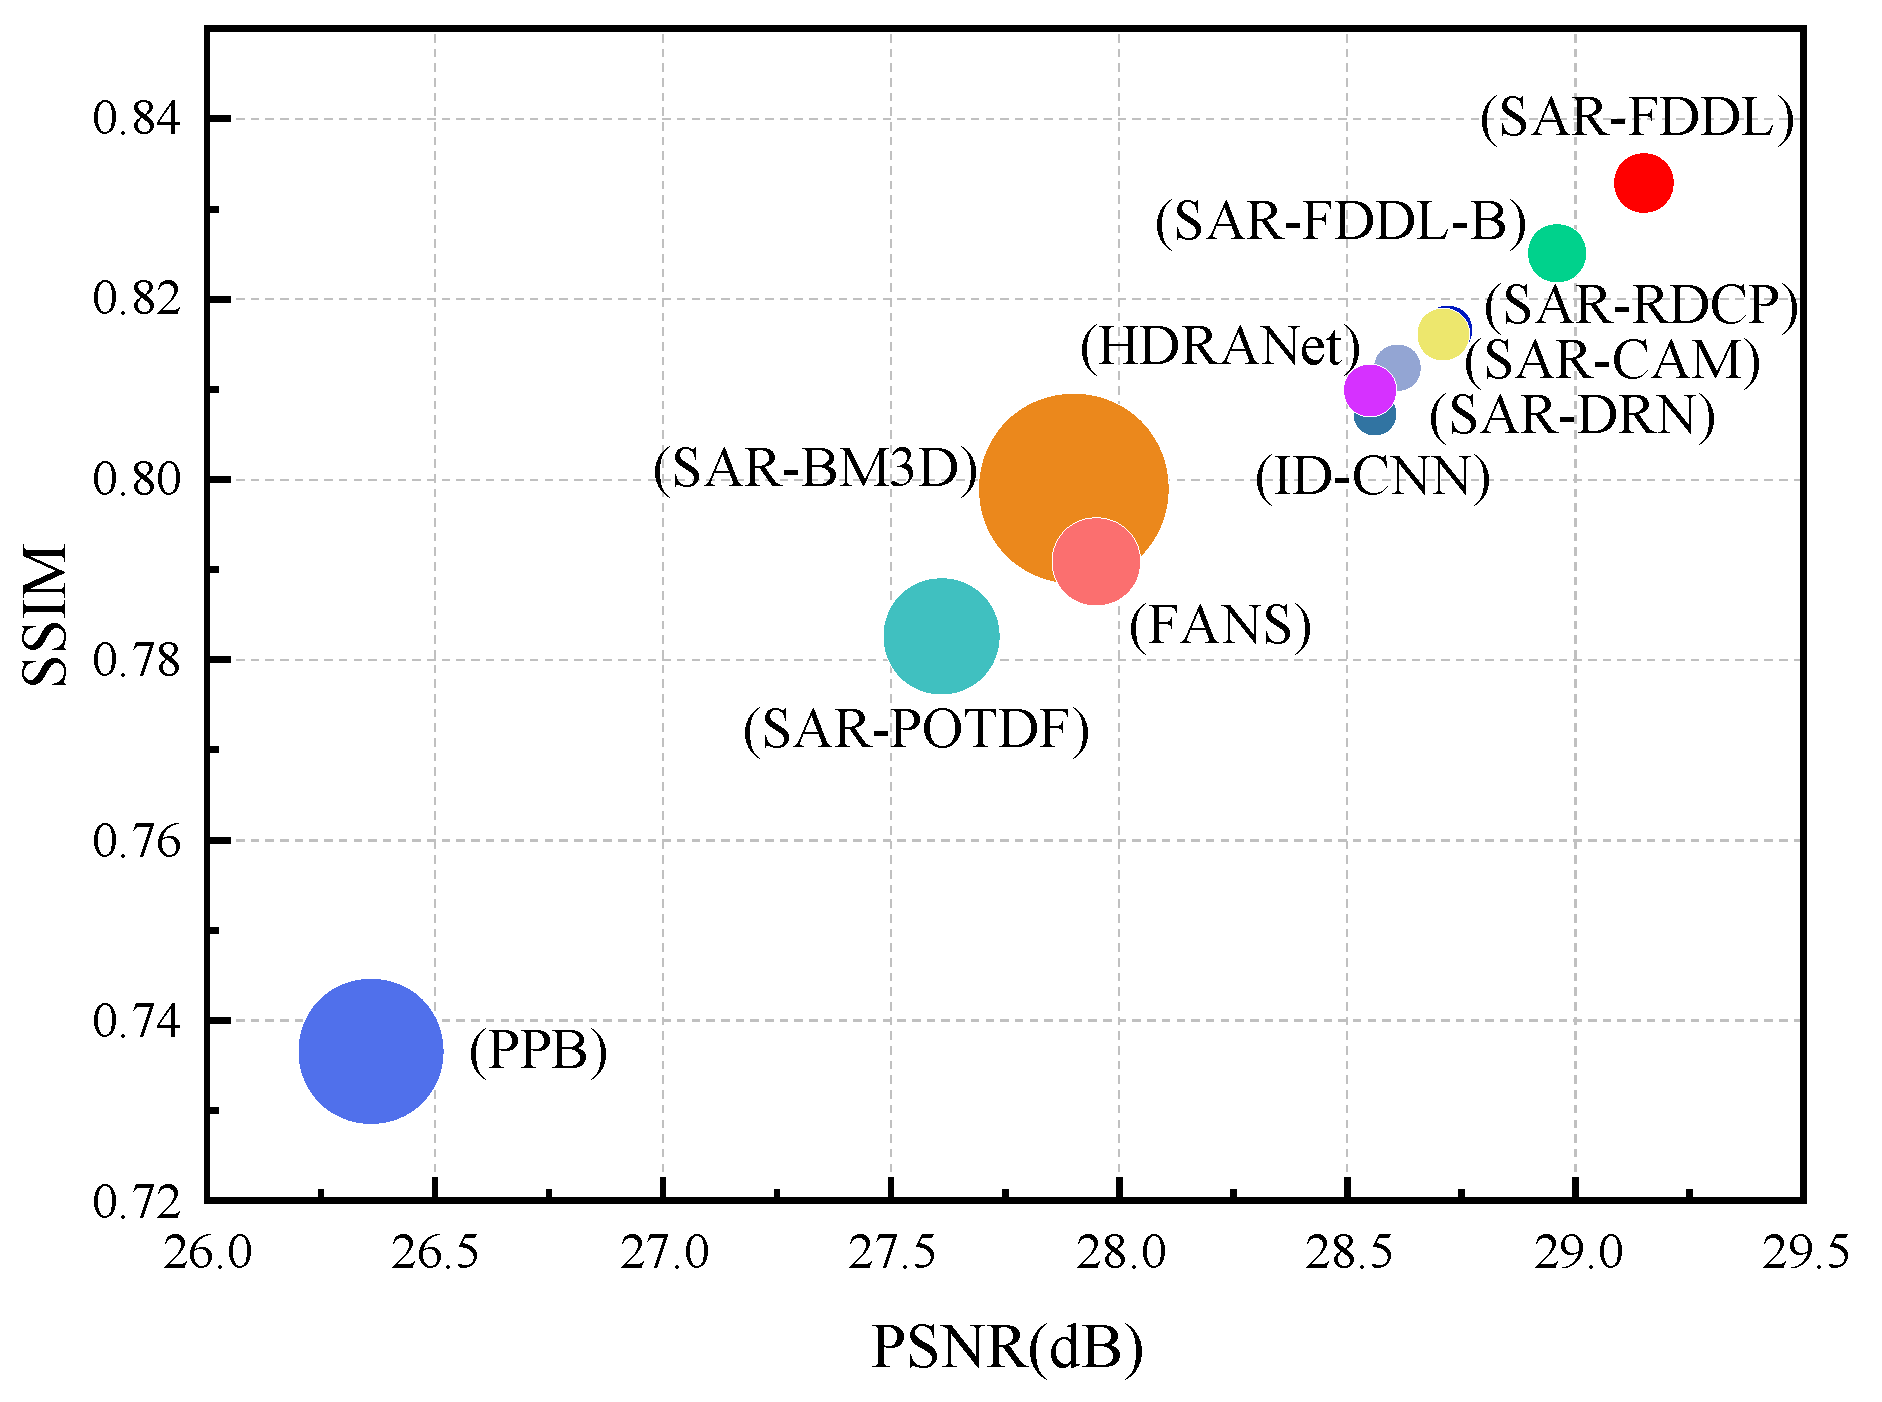
Figure 28 presents the comparison of various algorithms in terms of denoising performance and runtime. The horizontal axis represents the values of the evaluation metric PSNR, while the vertical axis represents the values of SSIM at L = 4. The size of the circles indicates the time used to test a single image, with larger circles indicating longer processing times. The SAR-BM3D takes the longest time, so it is likely to be limited in practical applications. The FANS algorithm shows comparable denoising performance to the SAR-BM3D but the time is greatly shortened. From Figure 28, it is evident that deep learning methods have significant advantages over traditional methods in terms of denoising performance and runtime, particularly the method proposed in this paper exhibits an outstanding denoising performance. Although our method may not have the shortest runtime, with the rapid development of computers runtime is no longer a major concern. The parameter quantities of eight deep learning methods are shown in Table 4. The proposed models in this paper have a lower parameter quantity compared to the SAR-CAM, and achieve better despeckling performance than it.
5. Conclusions
In this study, we propose a new framework called SAR−FDD for blind and non-blind SAR image restoration. The method employs an end-to-end interactive dual-branch neural network, which can effectively remove speckle noise and preserve the edge and texture structures of the image. The input image is divided into high-frequency and low-frequency components, and their feature information interacts through four denoising blocks to achieve denoising. Additionally, to improve the despeckling performance of the network, we use a weighted combination of three loss functions: the DG loss and the first order and second order variation. Experimental results demonstrate that the proposed method achieves an excellent denoising performance and edge structure preservation on both simulated and real SAR datasets, with objective evaluation metrics and visual effects superior to many state-of-the-art algorithms.
In future work, we can further investigate denoising model learning without a clean reference image (Noise2Noise) by considering the SAR imaging mechanism and utilizing phase information. Additionally, we can explore the combination of generative adversarial network frameworks with the denoising task to enhance the denoising performance.
Author Contributions
Methodology, X.Z. and F.R.; validation, X.Z.; data curation, Q.Q.; writing—original draft, X.Z.; writing—review and editing, F.R. and H.S.; visualization, Q.Q.; supervision and funding acquisition, F.R. All authors have read and agreed to the published version of the manuscript.
Funding
This research was funded by the National Natural Science Foundation of China, Grant No. 61807029, the Provincial Natural Science Foundation of Hebei, Grant No. A2022203004, and the Science Research Project of the Hebei Education Department, Grant No. QN2020203.
Data Availability Statement
The dataset used in this article is from the UC Merced Land-Use remote sensing image dataset [49] at https://vision.ucmerced.edu/datasets (accessed on 11 September 2023).
Conflicts of Interest
The authors declare no conflicts of interest.
References
- Moreira, A.; Prats-Iraola, P.; Younis, M.; Krieger, G.; Hajnsek, I.; Papathanassiou, K.P. A tutorial on synthetic aperture radar. IEEE Geosci. Remote Sens. Mag. 2013, 1, 6–43. [Google Scholar] [CrossRef]
- Goodman, J.W. Statistical properties of laser speckle patterns. In Laser Speckle and Related Phenomena; Springer: Berling/Heidelberg, Germany, 1975; pp. 9–75. [Google Scholar]
- Chen, Y.; He, Y.; Zhang, L.; Chen, Y.; Pu, H.; Chen, B.; Gao, L. Prediction of InSAR Deformation Time-Series Using a Long Short-Term Memory Neural Network. Int. J. Remote Sens. 2021, 42, 6921–6944. [Google Scholar] [CrossRef]
- Lee, J.S. Digital Image Enhancement and Noise Filtering by Use of Local Statistics. IEEE Trans. Pattern Anal. Mach. Intell. 1980, 2, 165–168. [Google Scholar] [CrossRef] [PubMed]
- Kuan, D.T.; Sawchuk, A.A.; Strand, T.C.; Chavel, P. Adaptive Noise Smoothing Filter for Images with Signal-Dependent Noise. IEEE Trans. Pattern Anal. Mach. Intell. 1985, 7, 165–177. [Google Scholar] [CrossRef] [PubMed]
- Frost, V.S.; Stiles, J.A.; Shanmugan, K.S.; Holtzman, J.C. A Model for Radar Images and Its Application to Adaptive Digital Filtering of Multiplicative Noise. IEEE Trans. Pattern Anal. Mach. Intell. 1982, 4, 157–166. [Google Scholar] [CrossRef]
- Foucher, S.; Benie, G.B.; Boucher, J.M. Multiscale MAP filtering of SAR images. IEEE Trans. Image Process. 2001, 10, 49–60. [Google Scholar] [CrossRef] [PubMed]
- Guo, H.; Odegard, J.E.; Lang, M.; Gopinath, R.A.; Selesnick, I.W.; Burrus, C.S. Wavelet based speckle reduction with application to SAR based ATD/R. In Proceedings of the 1st International Conference on Image Processing, Austin, TX, USA, 13–16 November 1994; pp. 75–79. [Google Scholar]
- Franceschetti, G.; Pascazio, V.; Schirinzi, G. Iterative homomorphic technique for speckle reduction in synthetic-aperture radar imaging. J. Opt. Soc. Am. A 1995, 12, 686–694. [Google Scholar] [CrossRef]
- Gagnon, L.; Jouan, A. Speckle filtering of SAR images: A comparative study between complex-wavelet-based and standard filters. Wavelet Applications in Signal and Image Processing V. SPIE 1997, 3169, 80–91. [Google Scholar]
- Chang, S.G.; Yu, B.; Vetterli, M. Spatially adaptive wavelet thresholding with context modeling for image denoising. IEEE Trans. Image Process. 2000, 9, 1522–1531. [Google Scholar] [CrossRef]
- Argenti, F.; Alparone, L. Speckle removal from SAR images in the undecimated wavelet domain. IEEE Trans. Geosci. Remote Sens. 2002, 40, 2363–2374. [Google Scholar] [CrossRef]
- Deledalle, C.A.; Denis, L.; Tupin, F. Iterative Weighted Maximum Likelihood Denoising with Probabilistic Patch-Based Weights. IEEE Trans. Image Process. 2009, 18, 2661–2672. [Google Scholar] [CrossRef] [PubMed]
- Parrilli, S.; Poderico, M.; Angelino, C.V.; Verdoliva, L. A Nonlocal SAR Image Denoising Algorithm Based on LLMMSE Wavelet Shrinkage. IEEE Trans. Geosci. Remote Sens. 2011, 50, 606–616. [Google Scholar] [CrossRef]
- Cozzolino, D.; Parrilli, S.; Scarpa, G.; Poggi, G.; Verdoliva, L. Fast Adaptive Nonlocal SAR Despeckling. IEEE Geosci. Remote Sens. Lett. 2013, 11, 524–528. [Google Scholar] [CrossRef]
- Zhang, L.; Dong, W.; Zhang, D.; Shi, G. Two-stage image denoising by principal component analysis with local pixel grouping. Pattern Recognit. 2010, 43, 1531–1549. [Google Scholar] [CrossRef]
- Rudin, L.I.; Osher, S.; Fatemi, E. Nonlinear total variation based noise removal algorithms. Phys. D Nonlinear Phenom. 1992, 60, 259–268. [Google Scholar] [CrossRef]
- Aubert, G.; Aujol, J.F. A Variational Approach to Removing Multiplicative Noise. SIAM J. Appl. Math. 2008, 68, 925–946. [Google Scholar] [CrossRef]
- Shi, J.; Osher, S. A Nonlinear Inverse Scale Space Method for a Convex Multiplicative Noise Model. SIAM J. Imaging Sci. 2008, 1, 294–321. [Google Scholar] [CrossRef]
- Chen, G.; Li, G.; Liu, Y.; Zhang, X.P.; Zhang, L. SAR Image Despeckling Based on Combination of Fractional-Order Total Variation and Nonlocal Low Rank Regularization. IEEE Trans. Geosci. Remote Sens. 2019, 58, 2056–2070. [Google Scholar] [CrossRef]
- Ren, F.; Zhou, R.R. Optimization model for multiplicative noise and blur removal based on Gaussian curvature regularization. J. Opt. Soc. Am. A Opt. Image Sci. Vis. 2018, 35, 798–812. [Google Scholar] [CrossRef]
- Krichen, M. Convolutional Neural Networks: A Survey. Computers 2023, 12, 151. [Google Scholar] [CrossRef]
- Zhang, K.; Zuo, W.; Zhang, L. FFDNet: Toward a Fast and Flexible Solution for CNN-Based Image Denoising. IEEE Trans. Image Process. 2018, 27, 4608–4622. [Google Scholar] [CrossRef] [PubMed]
- Tomar, N.K.; Jha, D.; Riegler, M.A.; Johansen, H.D.; Johansen, D.; Rittscher, J.; Halvorsen, P.; Ali, S. Fanet: A Feedback Attention Network for Improved Biomedical Image Segmentation. IEEE Trans. Neural Netw. Learn. Syst. 2023, 34, 9375–9388. [Google Scholar] [CrossRef] [PubMed]
- Tomar, N.K.; Jha, D.; Bagci, U.; Ali, S. TGANet: Text-Guided Attention for Improved Polyp Segmentation. In Proceedings of the International Conference on Medical Image Computing and Computer Assisted Intervention (MICCAI), Singepore, 18–22 September 2022; pp. 151–160. [Google Scholar]
- Hu, Q.; Hu, S.; Liu, S. Ship detection in SAR images based on region growing and multi-scale salienc. In Proceedings of the Chinese Conference on Pattern Recognition and Computer Vision (PRCV), Nanjing, China, 16–18 October 2020; pp. 117–128. [Google Scholar]
- Chierchia, G.; Cozzolino, D.; Poggi, G.; Verdoliva, L. SAR image despeckling through convolutional neural networks. In Proceedings of the 2017 IEEE International Geoscience and Remote Sensing Symposium (IGARSS), Fort Worth, TX, USA, 23–28 July 2017; pp. 5438–5441. [Google Scholar]
- Wang, P.; Zhang, H.; Patel, V.M. SAR Image Despeckling Using a Convolutional Neural Network. IEEE Signal Process. Lett. 2017, 24, 1763–1767. [Google Scholar] [CrossRef]
- Zhang, Q.; Yuan, Q.; Li, J.; Yang, Z.; Ma, X. Learning a dilated residual network for SAR image despeckling. Remote Sens. 2018, 10, 196. [Google Scholar] [CrossRef]
- Wang, P.; Chen, P.; Yuan, Y.; Liu, D.; Huang, Z.; Hou, X.; Cottrell, G. Understanding convolution for semantic segmentation. In Proceedings of the 2018 IEEE Winter Conference on Applications of Computer Vision (WACV), Lake Tahoe, NV, USA, 12–15 March 2018; pp. 1451–1460. [Google Scholar]
- Li, J.; Li, Y.; Xiao, Y.; Bai, Y. HDRANet: Hybrid Dilated Residual Attention Network for SAR Image Despeckling. Remote Sens. 2019, 11, 2921. [Google Scholar] [CrossRef]
- Gui, Y.; Xue, L.; Li, X. SAR image despeckling using a dilated densely connected network. Remote Sens. Lett. 2018, 9, 857–866. [Google Scholar] [CrossRef]
- Lattari, F.; Gonzalez Leon, B.; Asaro, F.; Rucci, A.; Prati, C.; Matteucci, M. Deep Learning for SAR Image Despeckling. Remote Sens. 2019, 11, 1532. [Google Scholar] [CrossRef]
- Shen, H.; Zhou, C.; Li, J.; Yuan, Q. SAR Image Despeckling Employing a Recursive Deep CNN Prior. IEEE Trans. Geosci. Remote Sens. 2021, 59, 273–286. [Google Scholar] [CrossRef]
- Aghababaei, H.; Ferraioli, G.; Vitale, S.; Zamani, R.; Schirinzi, G.; Pascazio, V. Nonlocal Model-Free Denoising Algorithm for Single- and Multichannel SAR Data. IEEE Trans. Geosci. Remote Sens. 2021, 60, 1–15. [Google Scholar] [CrossRef]
- Dalsasso, E.; Denis, L.; Tupin, F. SAR2SAR: A Semi-Supervised Despeckling Algorithm for SAR Images. IEEE J. Sel. Top. Appl. Earth Obs. Remote Sens. 2021, 14, 4321–4329. [Google Scholar] [CrossRef]
- Molini, A.B.; Valsesia, D.; Fracastoro, G.; Magli, E. Speckle2Void: Deep Self-Supervised SAR Despeckling With Blind-Spot Convolutional Neural Networks. IEEE Trans. Geosci. Remote Sens. 2021, 60, 1–17. [Google Scholar] [CrossRef]
- Dalsasso, E.; Denis, L.; Tupin, F. As if by Magic: Self-supervised Training of Deep Despeckling Networks with MERLIN. IEEE Trans. Geosci. Remote Sens. 2021, 60, 1–13. [Google Scholar] [CrossRef]
- Perona, P.; Malik, J. Scale-space and edge detection using anisotropic diffusion. IEEE Trans. Pattern Anal. Mach. Intell. 1990, 12, 629–639. [Google Scholar] [CrossRef]
- Chen, Y.; Fan, H.; Xu, B.; Yan, Z.; Kalantidis, Y.; Rohrbach, M.; Yan, S.; Feng, J. Drop an octave: Reducing spatial redundancy in convolutional neural networks with octave convolution. In Proceedings of the IEEE/CVF International Conference on Computer Vision, Seoul, Republic of Korea, 27 October–2 November 2019; pp. 3435–3444. [Google Scholar]
- Yang, T.; Wang, W.; Cheng, G.; Wei, M.; Xie, H.; Wang, F.L. FDDL-Net: Frequency domain decomposition learning for speckle reduction in ultrasound images. Multimed. Tools Appl. 2022, 81, 42769–42781. [Google Scholar] [CrossRef]
- Deng, S.; Wei, M.; Wang, J.; Feng, Y.; Liang, L.; Xie, H.; Wang, F.L.; Wang, M. Detail-recovery image deraining via context aggregation networks. In Proceedings of the IEEE/CVF Conference on Computer Vision and Pattern Recognition, Seattle, WA, USA, 13–19 June 2020; pp. 14560–14569. [Google Scholar]
- Ioffe, S.; Szegedy, C. Batch normalization: Accelerating deep network training by reducing internal covariate shift. In Proceedings of the International Conference on Machine Learning, Lillie, France, 6–11 July 2015; pp. 448–456. [Google Scholar]
- He, K.; Zhang, X.; Ren, S.; Sun, J. Deep residual learning for image recognition. In Proceedings of the IEEE Conference on Computer Vision and Pattern Recognition, Las Vegas, NV, USA, 27–30 June 2016; pp. 770–778. [Google Scholar]
- Ko, J.; Lee, S. SAR image despeckling using continuous attention module. IEEE J. Sel. Top. Appl. Earth Obs. Remote Sens. 2022, 15, 3–19. [Google Scholar] [CrossRef]
- Feng, H.; Hou, B.; Gong, M. SAR Image Despeckling Based on Local Homogeneous-Region Segmentation by Using Pixel-Relativity Measurement. IEEE Trans. Geosci. Remote Sens. 2011, 49, 2724–2737. [Google Scholar] [CrossRef]
- Papafitsoros, K.; Schönlieb, C.B. A combined first and second order variational approach for image reconstruction. J. Math. Imaging Vis. 2014, 48, 308–338. [Google Scholar] [CrossRef]
- Kingma, D.; Ba, J. Adam: A Method for Stochastic Optimization. arXiv 2014, arXiv:1412.6980. [Google Scholar]
- Yang, Y.; Newsam, S. Bag-of-visual-words and spatial extensions for land-use classification. In Proceedings of the 18th SIGSPATIAL International Conference on Advances in Geographic Information Systems, San Jose, CA, USA, 2–5 November 2010; pp. 270–279. [Google Scholar]
- Li, Y.; Gong, H.; Feng, D.; Zhang, Y. An Adaptive Method of Speckle Reduction and Feature Enhancement for SAR Images Based on Curvelet Transform and Particle Swarm Optimization. IEEE Trans. Geosci. Remote Sens. 2011, 49, 3105–3116. [Google Scholar] [CrossRef]
- Xu, B.; Cui, Y.; Li, Z.; Zuo, B.; Yang, J.; Song, J. Patch Ordering-Based SAR Image Despeckling Via Transform-Domain Filtering. IEEE J. Sel. Top. Appl. Earth Obs. Remote Sens. 2015, 8, 1682–1695. [Google Scholar] [CrossRef]
- Xie, H.; Pierce, L.E.; Ulaby, F.T. SAR speckle reduction using wavelet denoising and Markov random field modeling. IEEE Trans. Geosci. Remote Sens. 2002, 40, 2196–2212. [Google Scholar] [CrossRef]
- Di Martino, G.; Poderico, M.; Poggi, G.; Riccio, D.; Verdoliva, L. Benchmarking Framework for SAR Despeckling. IEEE Trans. Geosci. Remote Sens. 2013, 52, 1596–1615. [Google Scholar] [CrossRef]
Figure 1.
Overall framework of the SAR−FDD method.
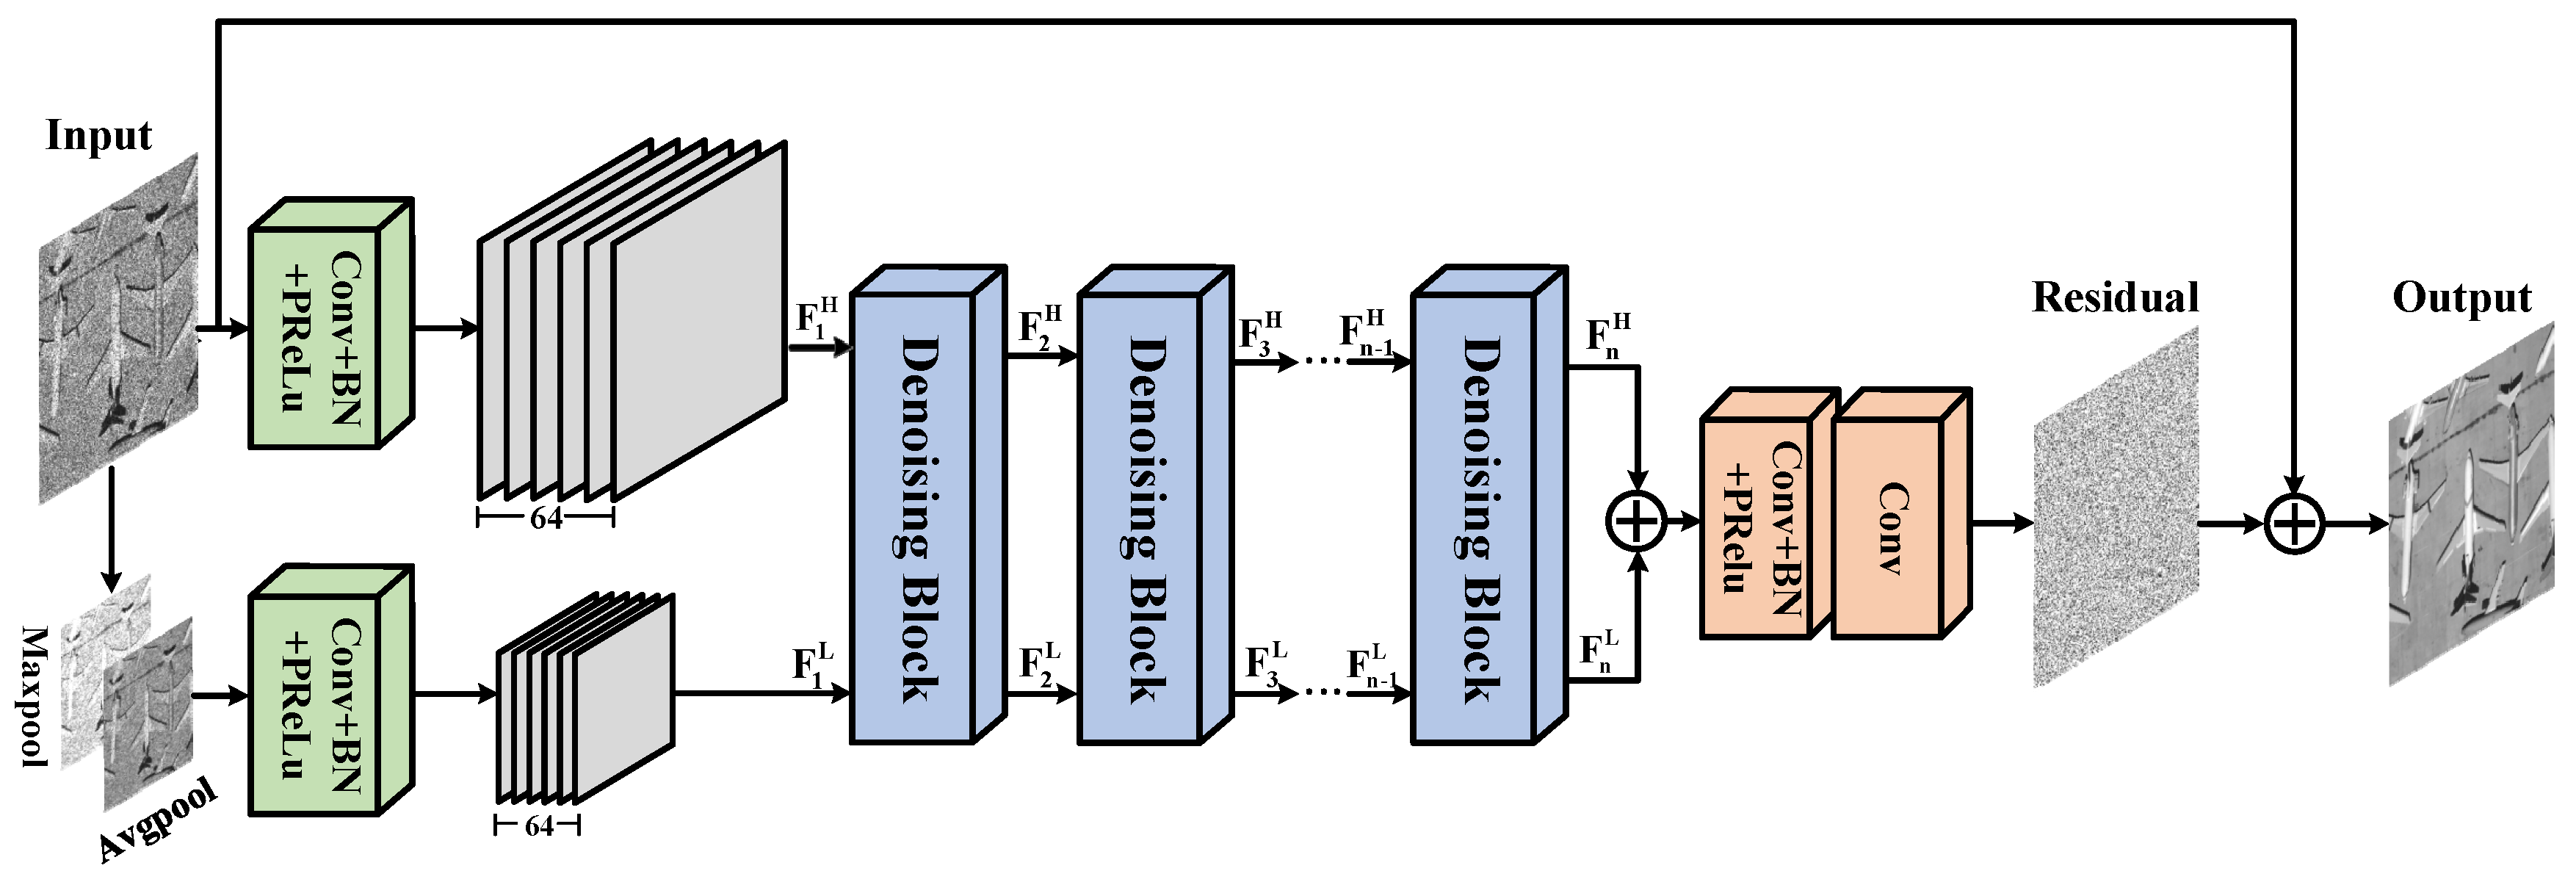
Figure 2.
The framework of the denoising block.

Figure 3.
The framework of the feature extraction block (FEB).

Figure 4.
The framework of the feature denoising block (FDB).
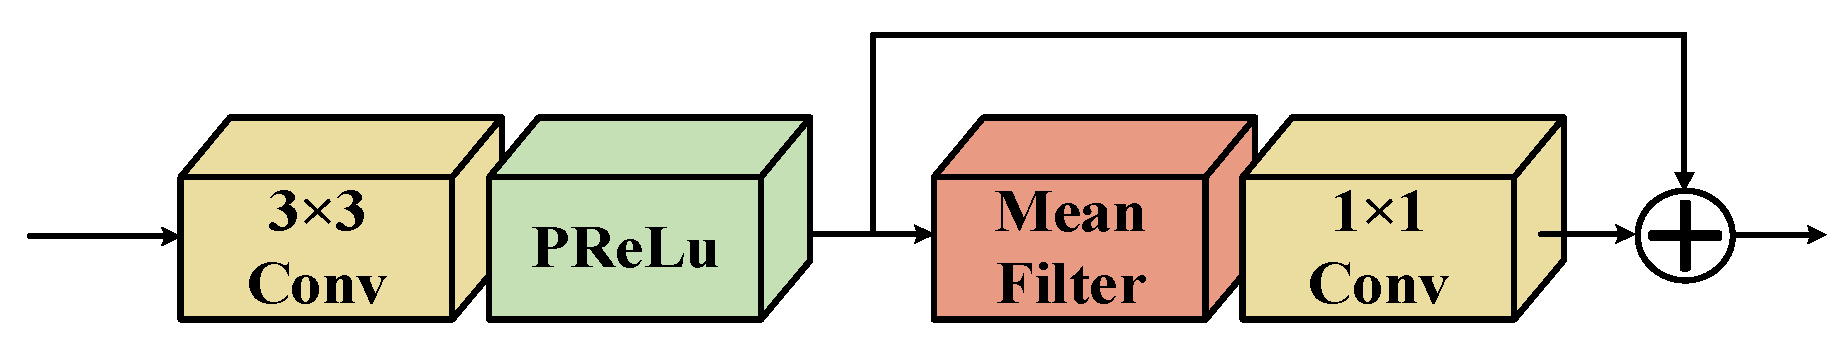
Figure 5.
The framework of the channel attention (CA).
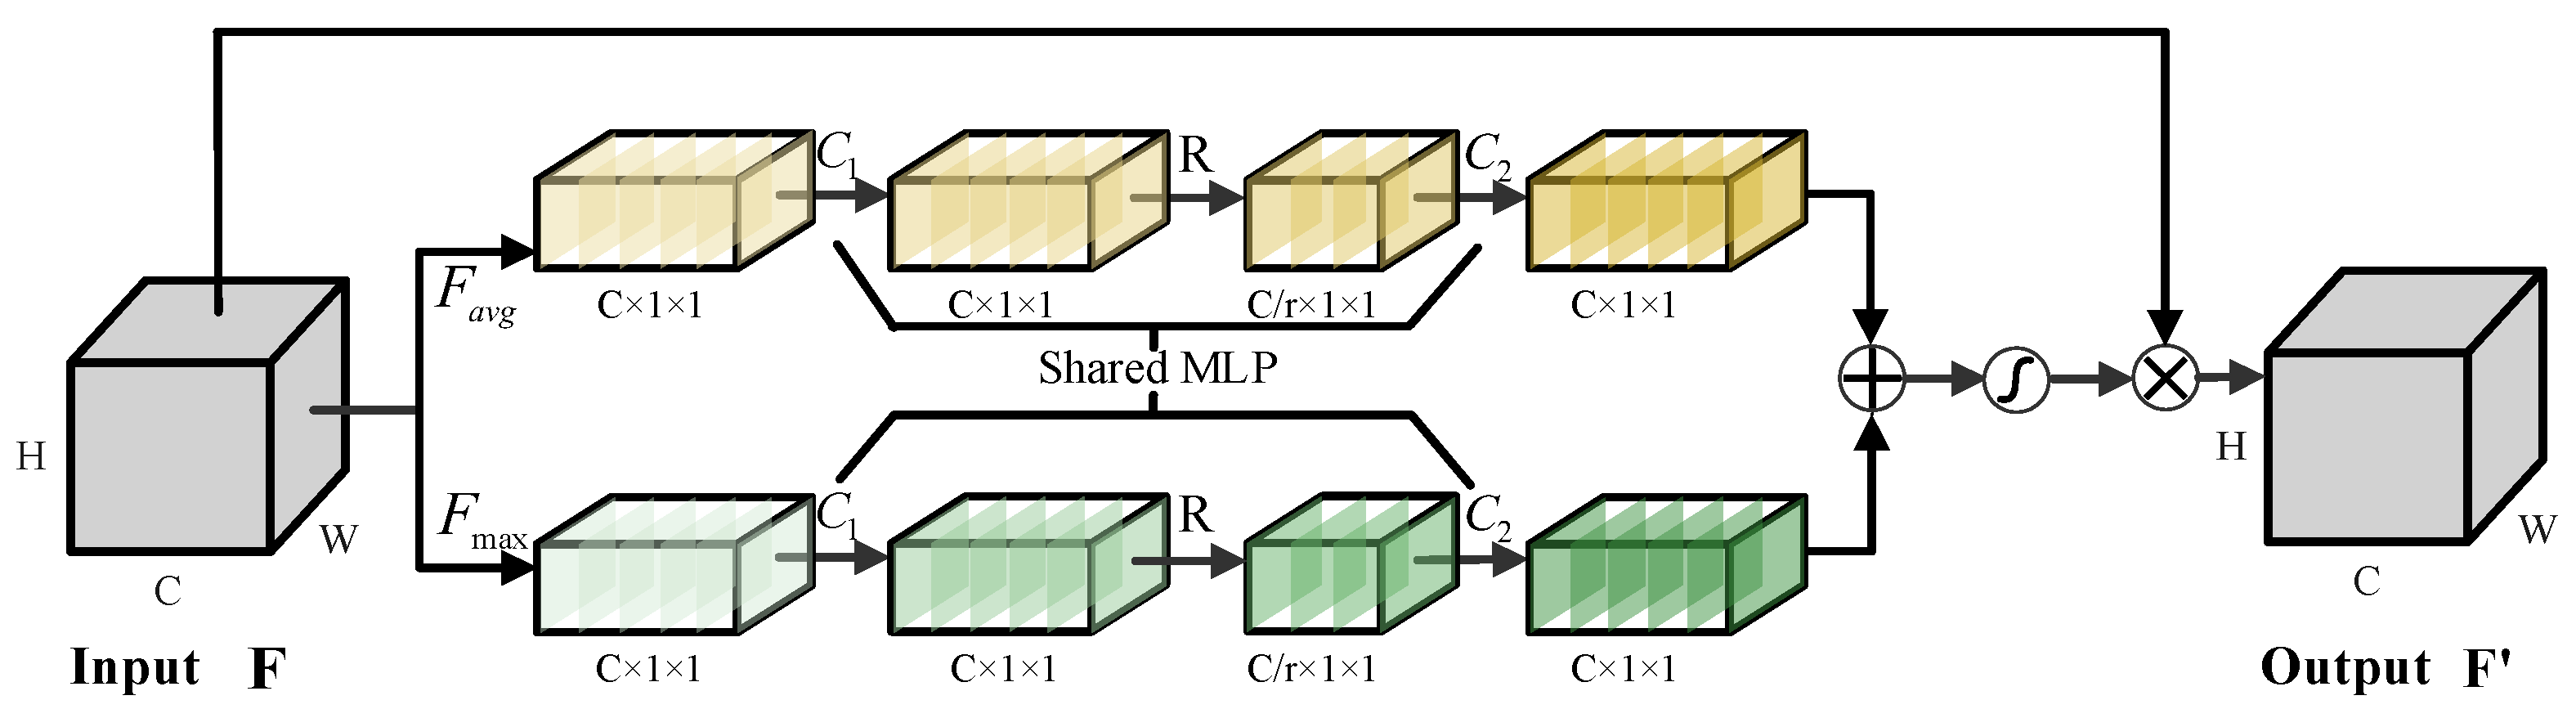
Figure 6.
Original images used in the test experiments with specific areas highlighted by red boxes for zoomed views.
Figure 6.
Original images used in the test experiments with specific areas highlighted by red boxes for zoomed views.
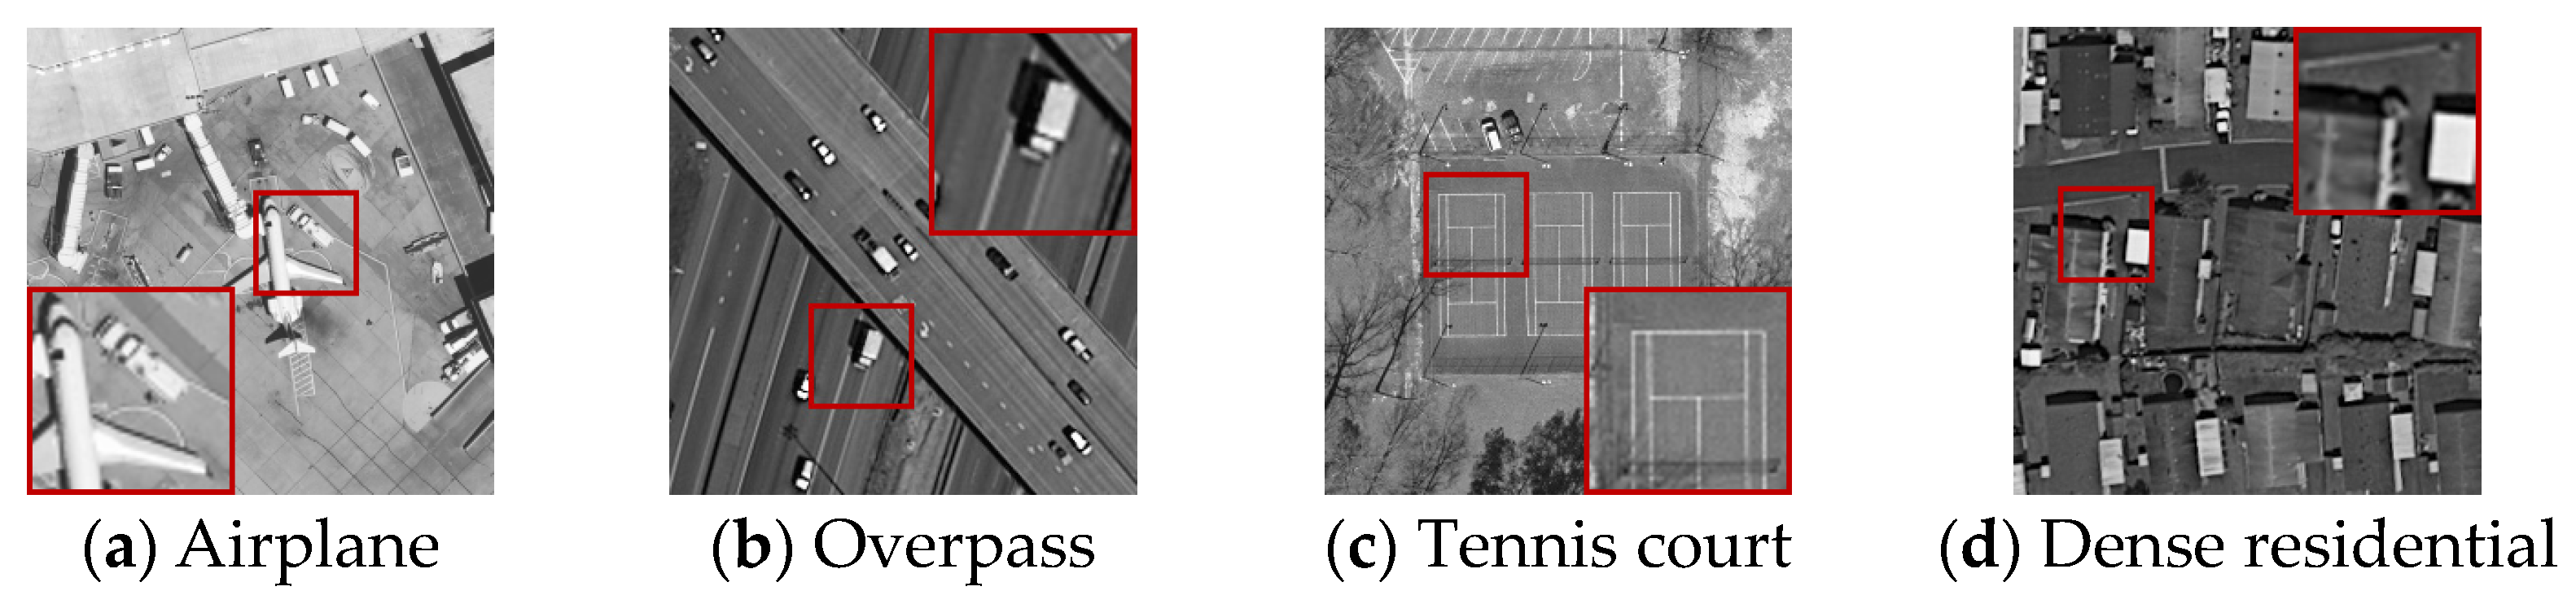
Figure 7.
Results for the airplane image with 1-look speckle noise.
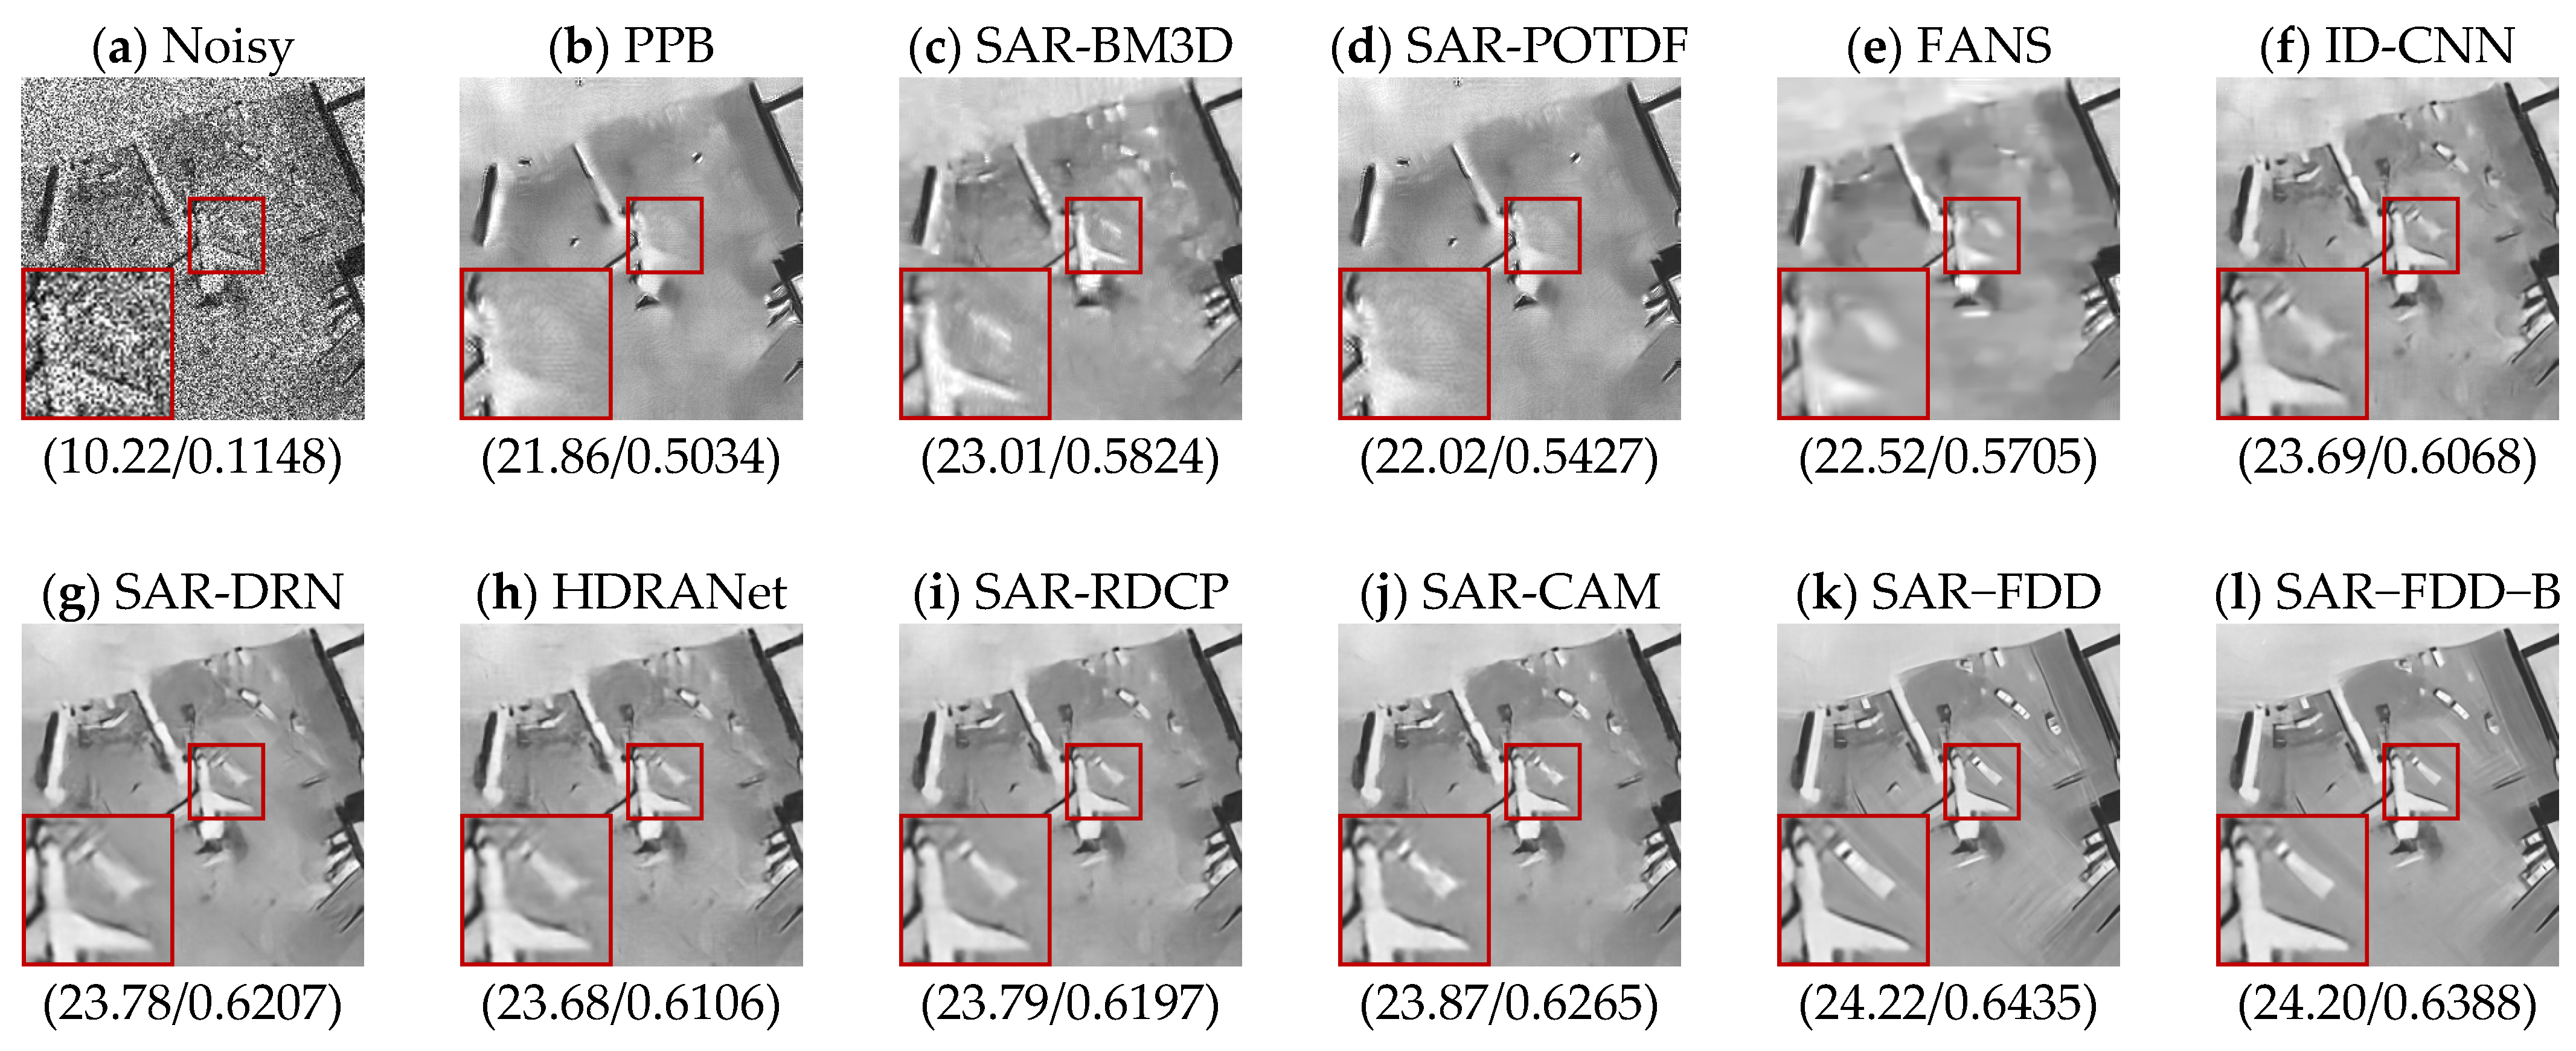
Figure 8.
Results for the airplane image with 2-look speckle noise.
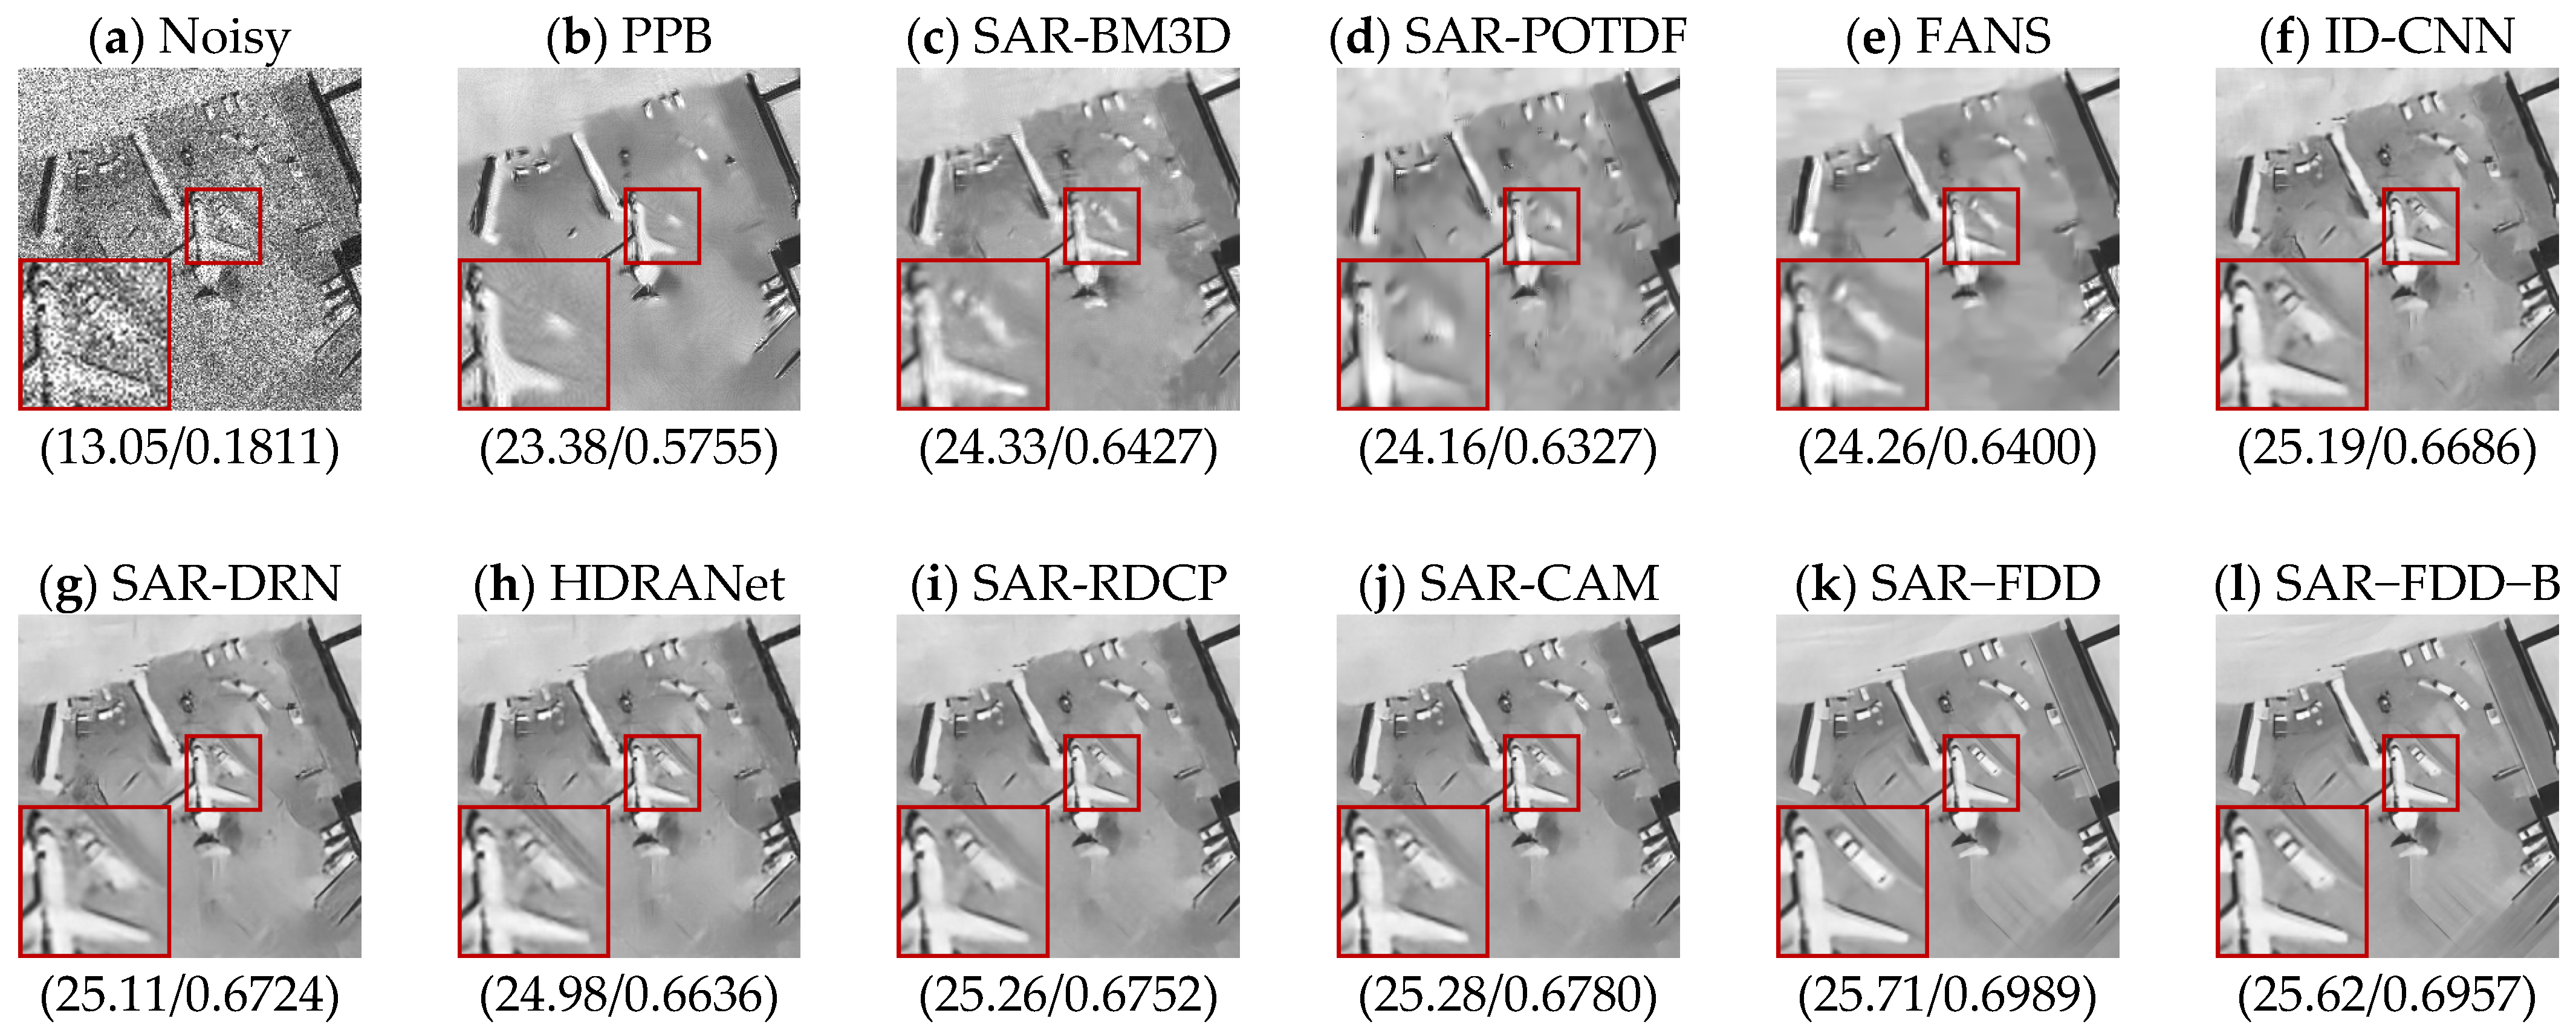
Figure 9.
Results for the airplane image with 4-look speckle noise.
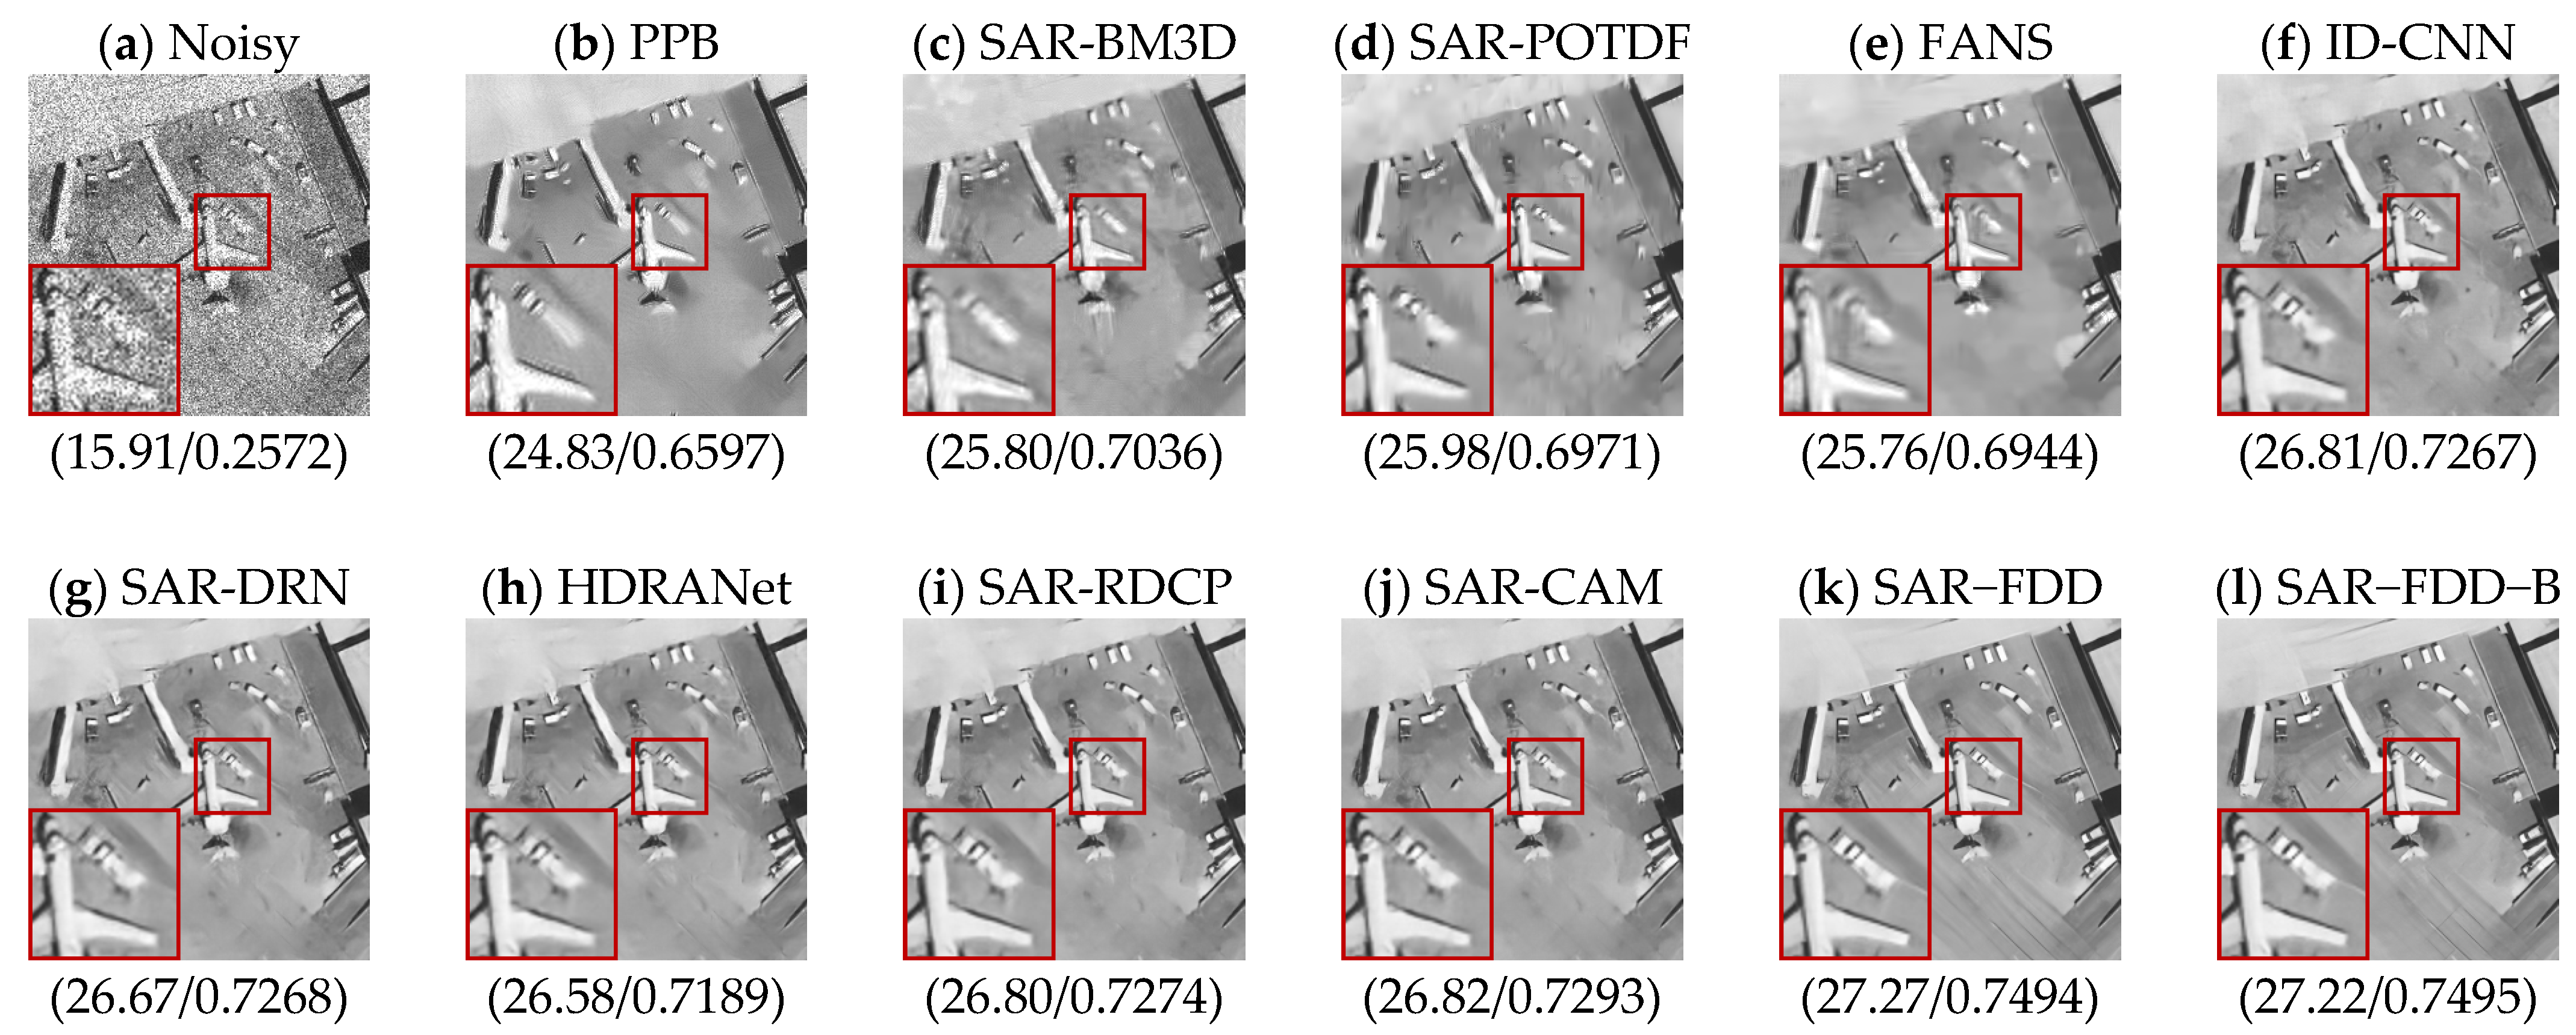
Figure 10.
Results for the overpass image with 1-look speckle noise.

Figure 11.
Results for the overpass image with 2-look speckle noise.
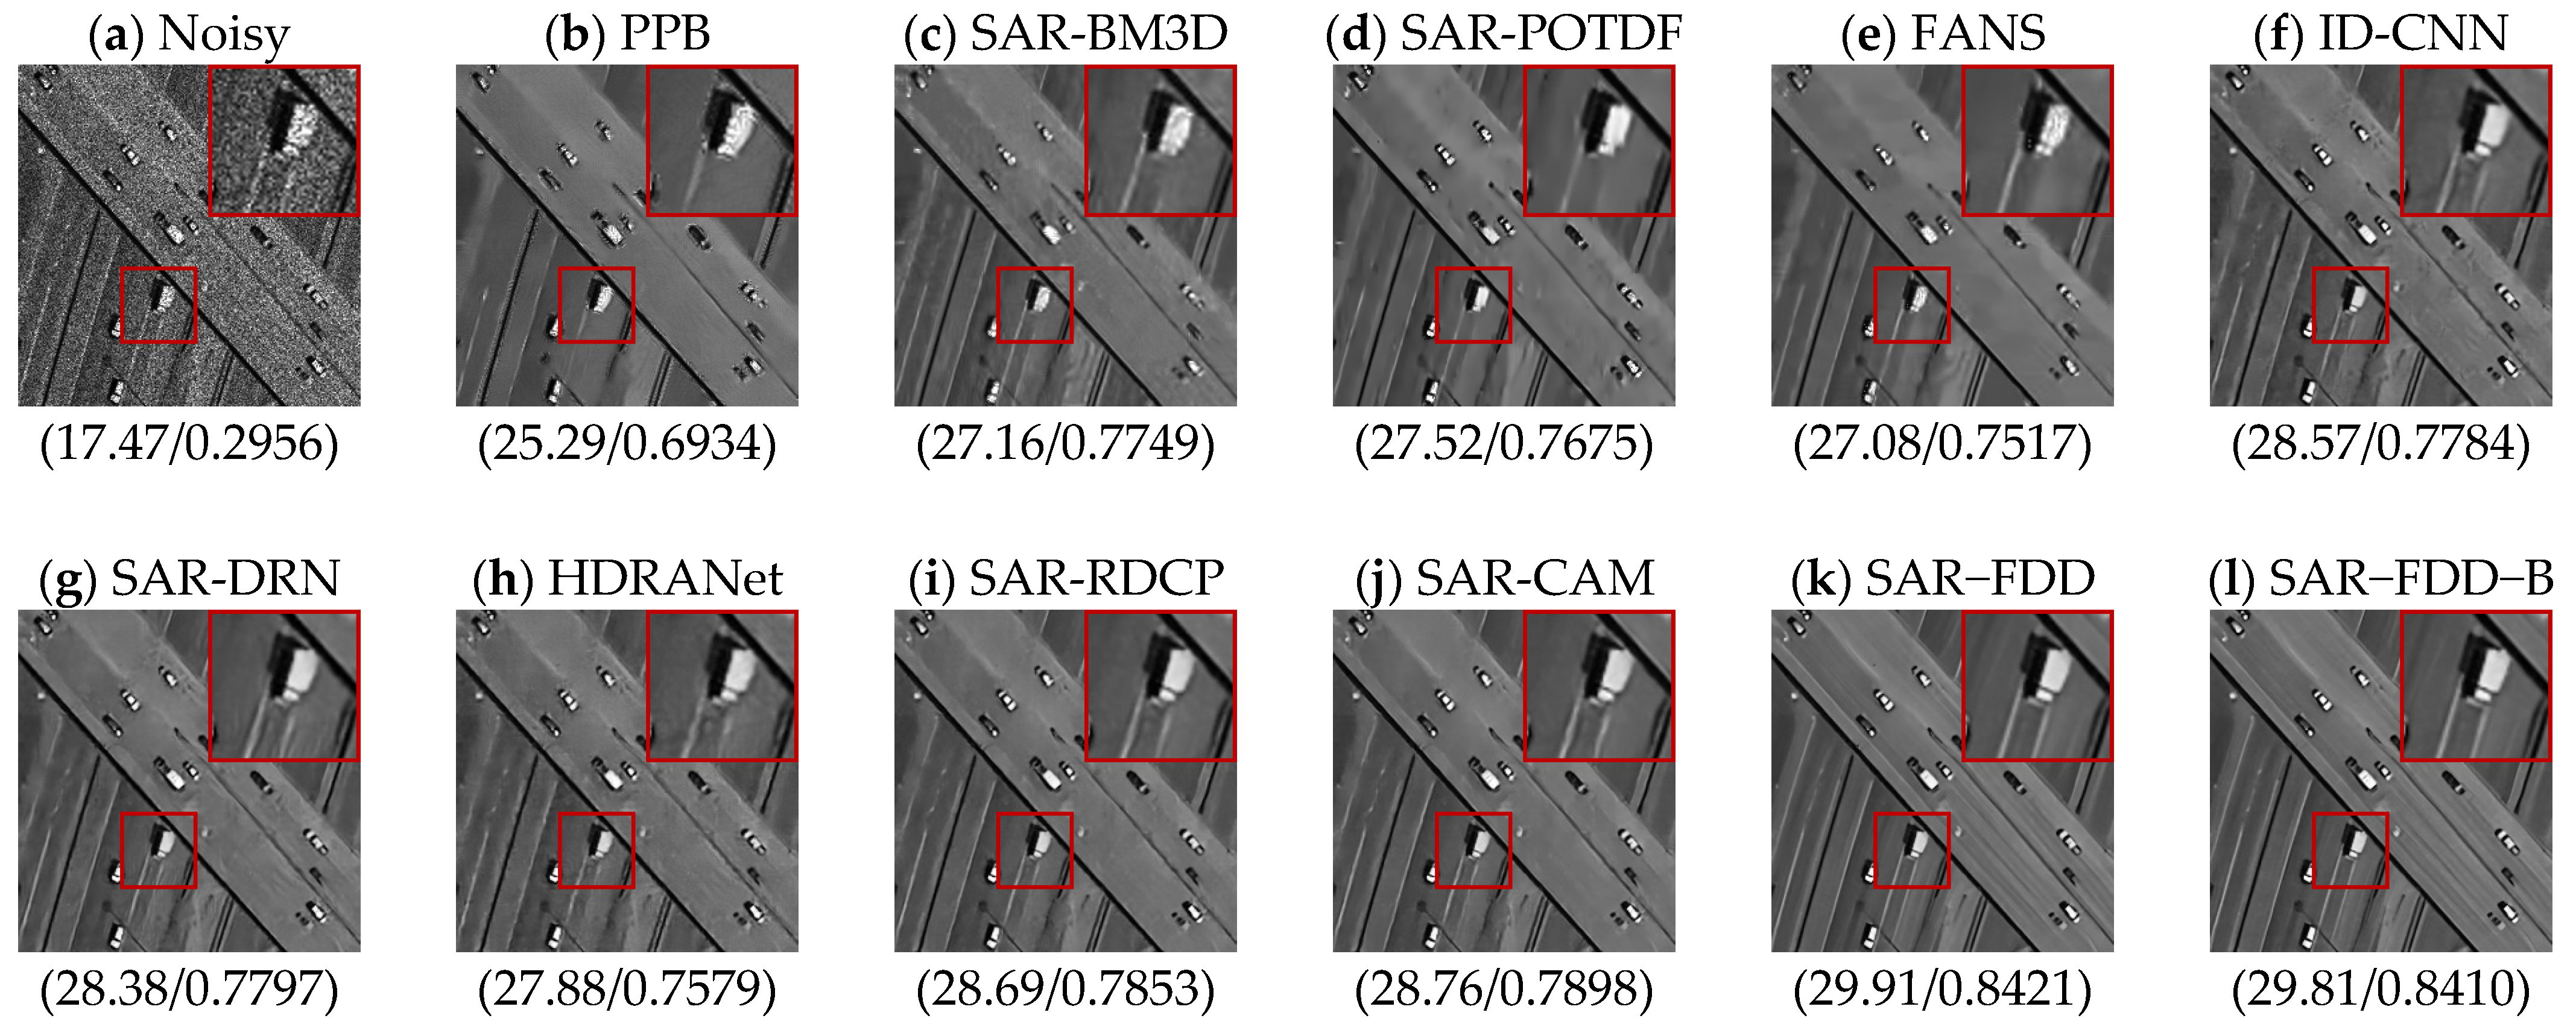
Figure 12.
Results for the overpass image with 4-look speckle noise.
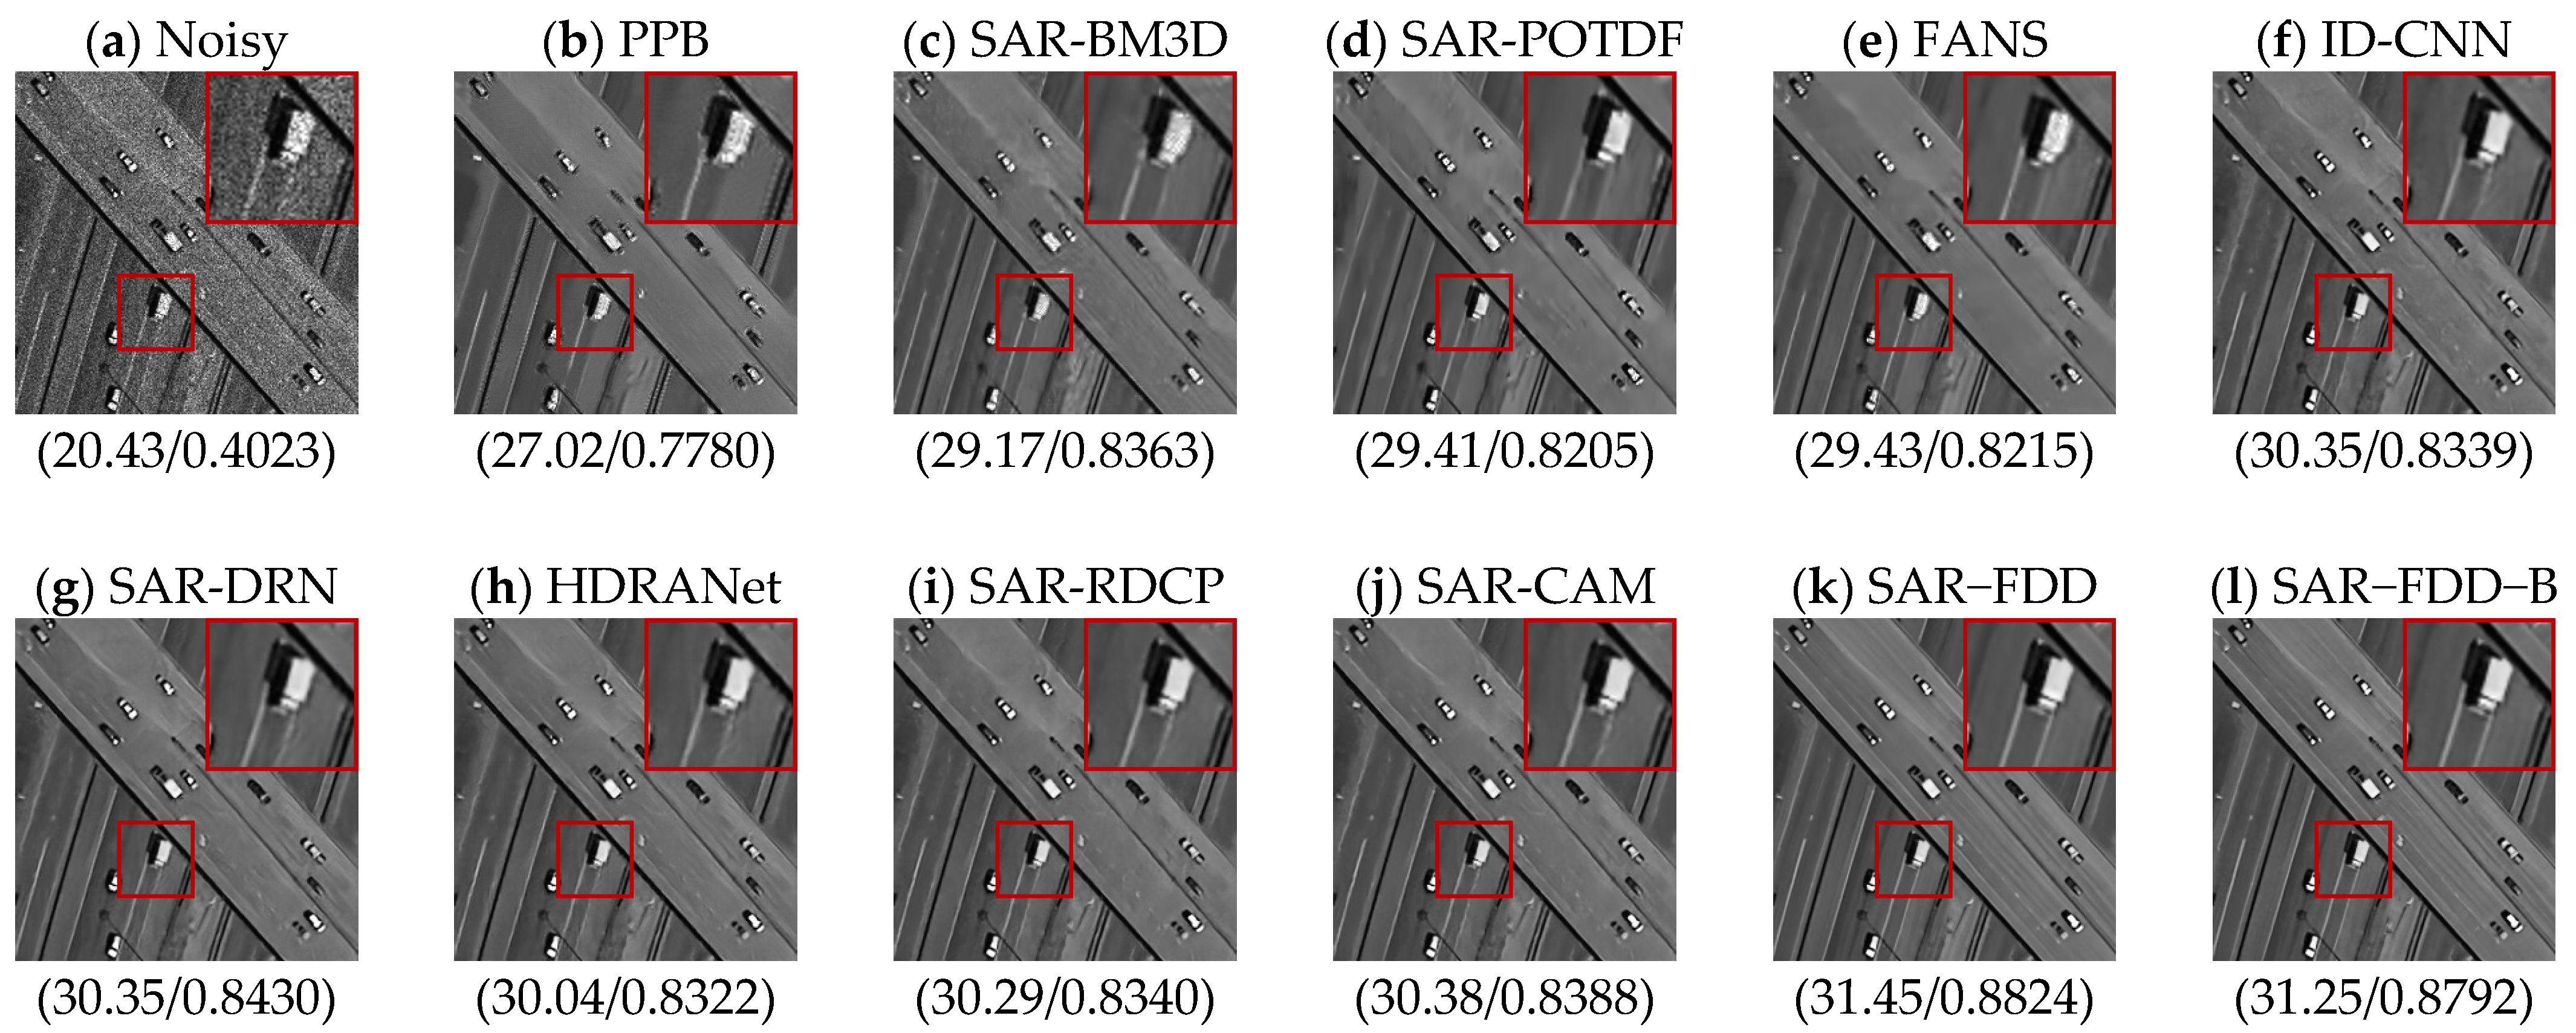
Figure 13.
Results for the tennis court image with 1-look speckle noise.
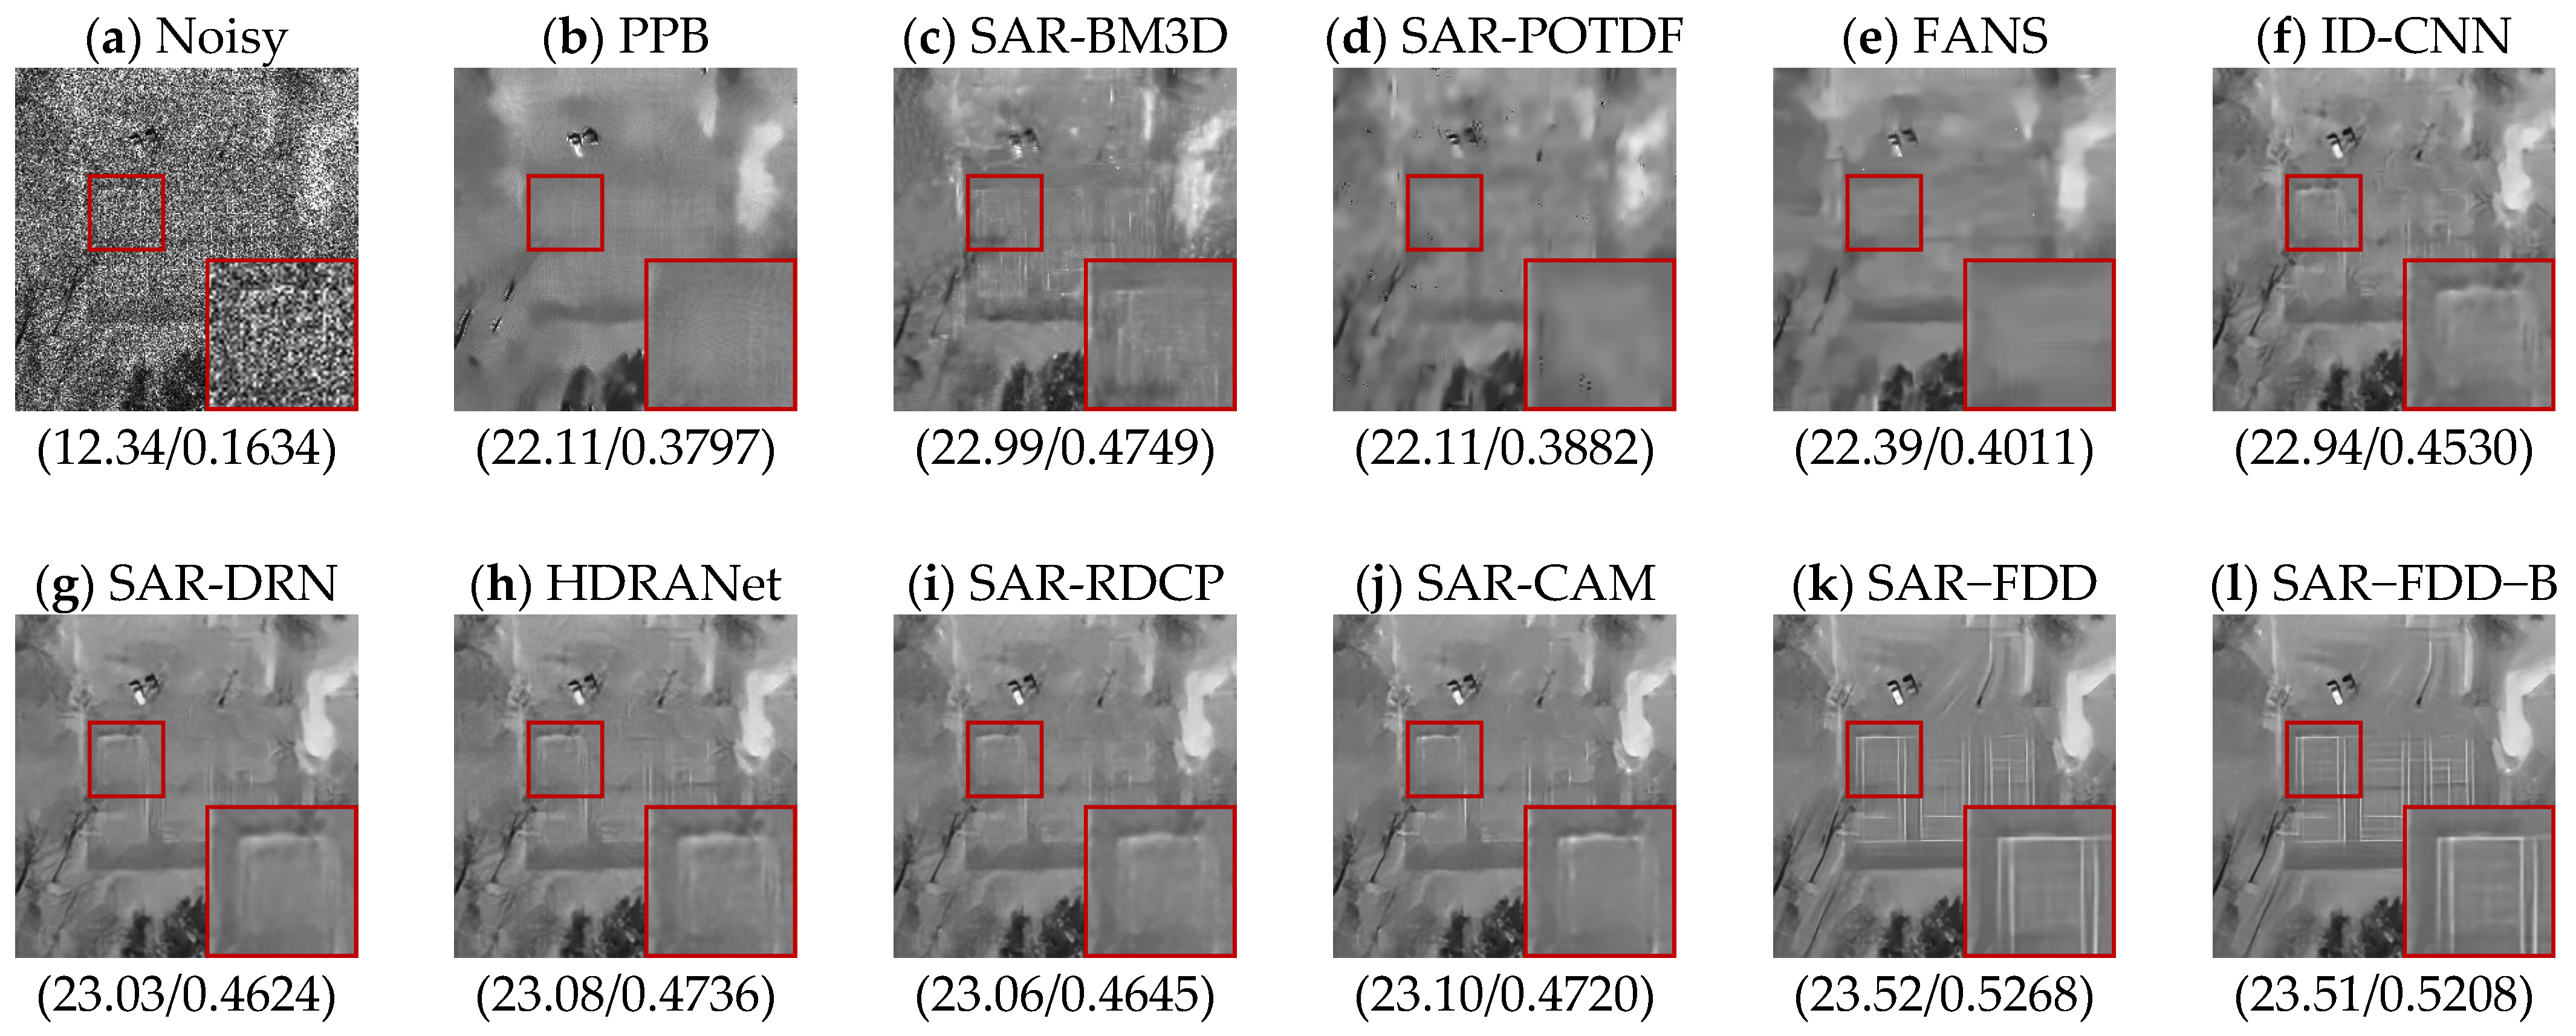
Figure 14.
Results for the tennis court image with 2-look speckle noise.

Figure 15.
Results for the tennis court image with 4-look speckle noise.

Figure 16.
Results for the dense residential area image with 1-look speckle noise.
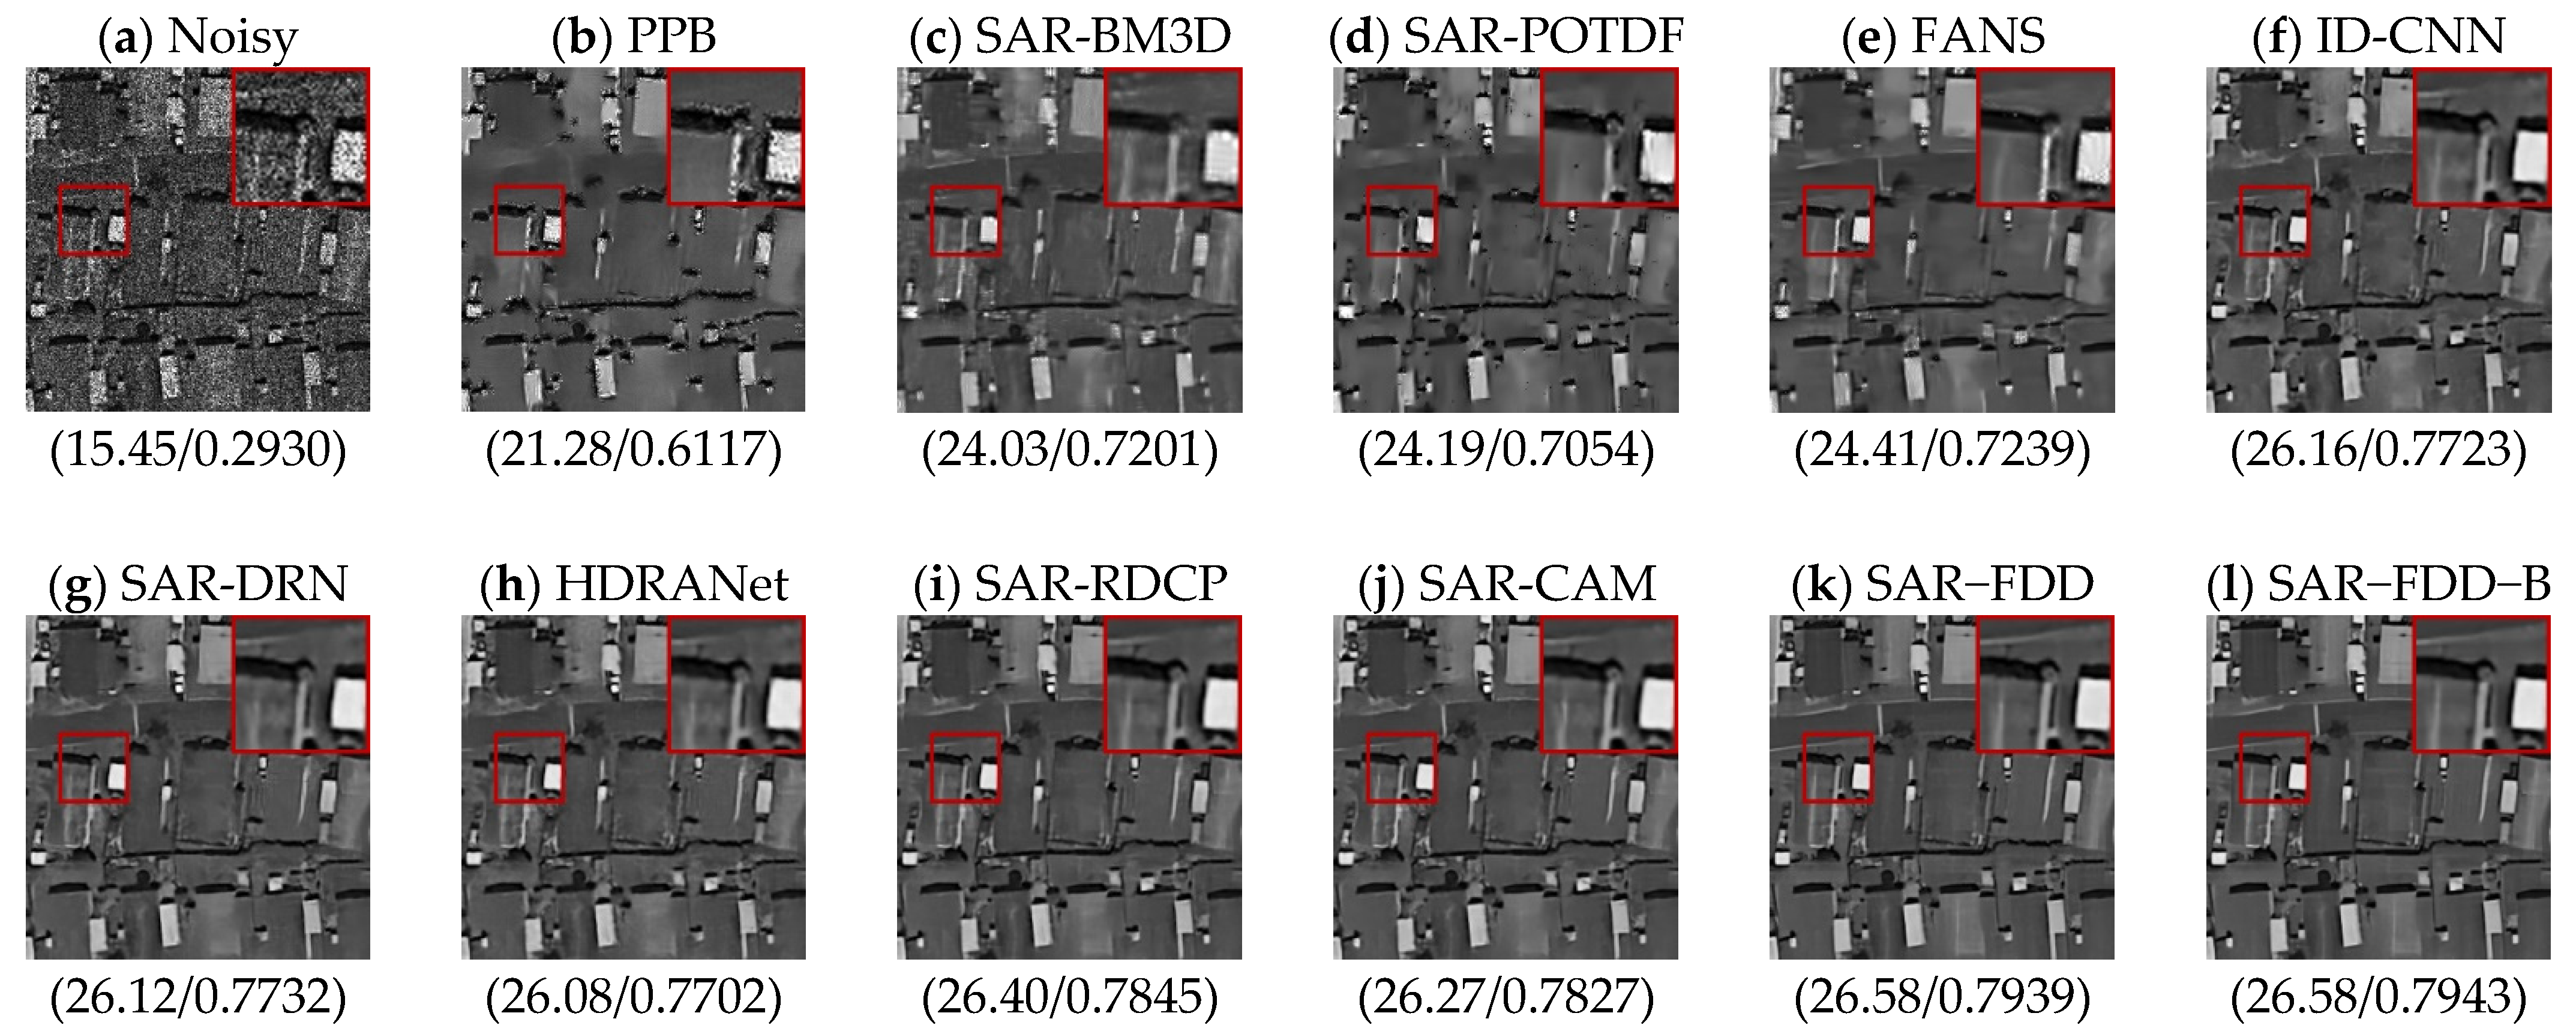
Figure 17.
Results for the dense residential area image with 2-look speckle noise.
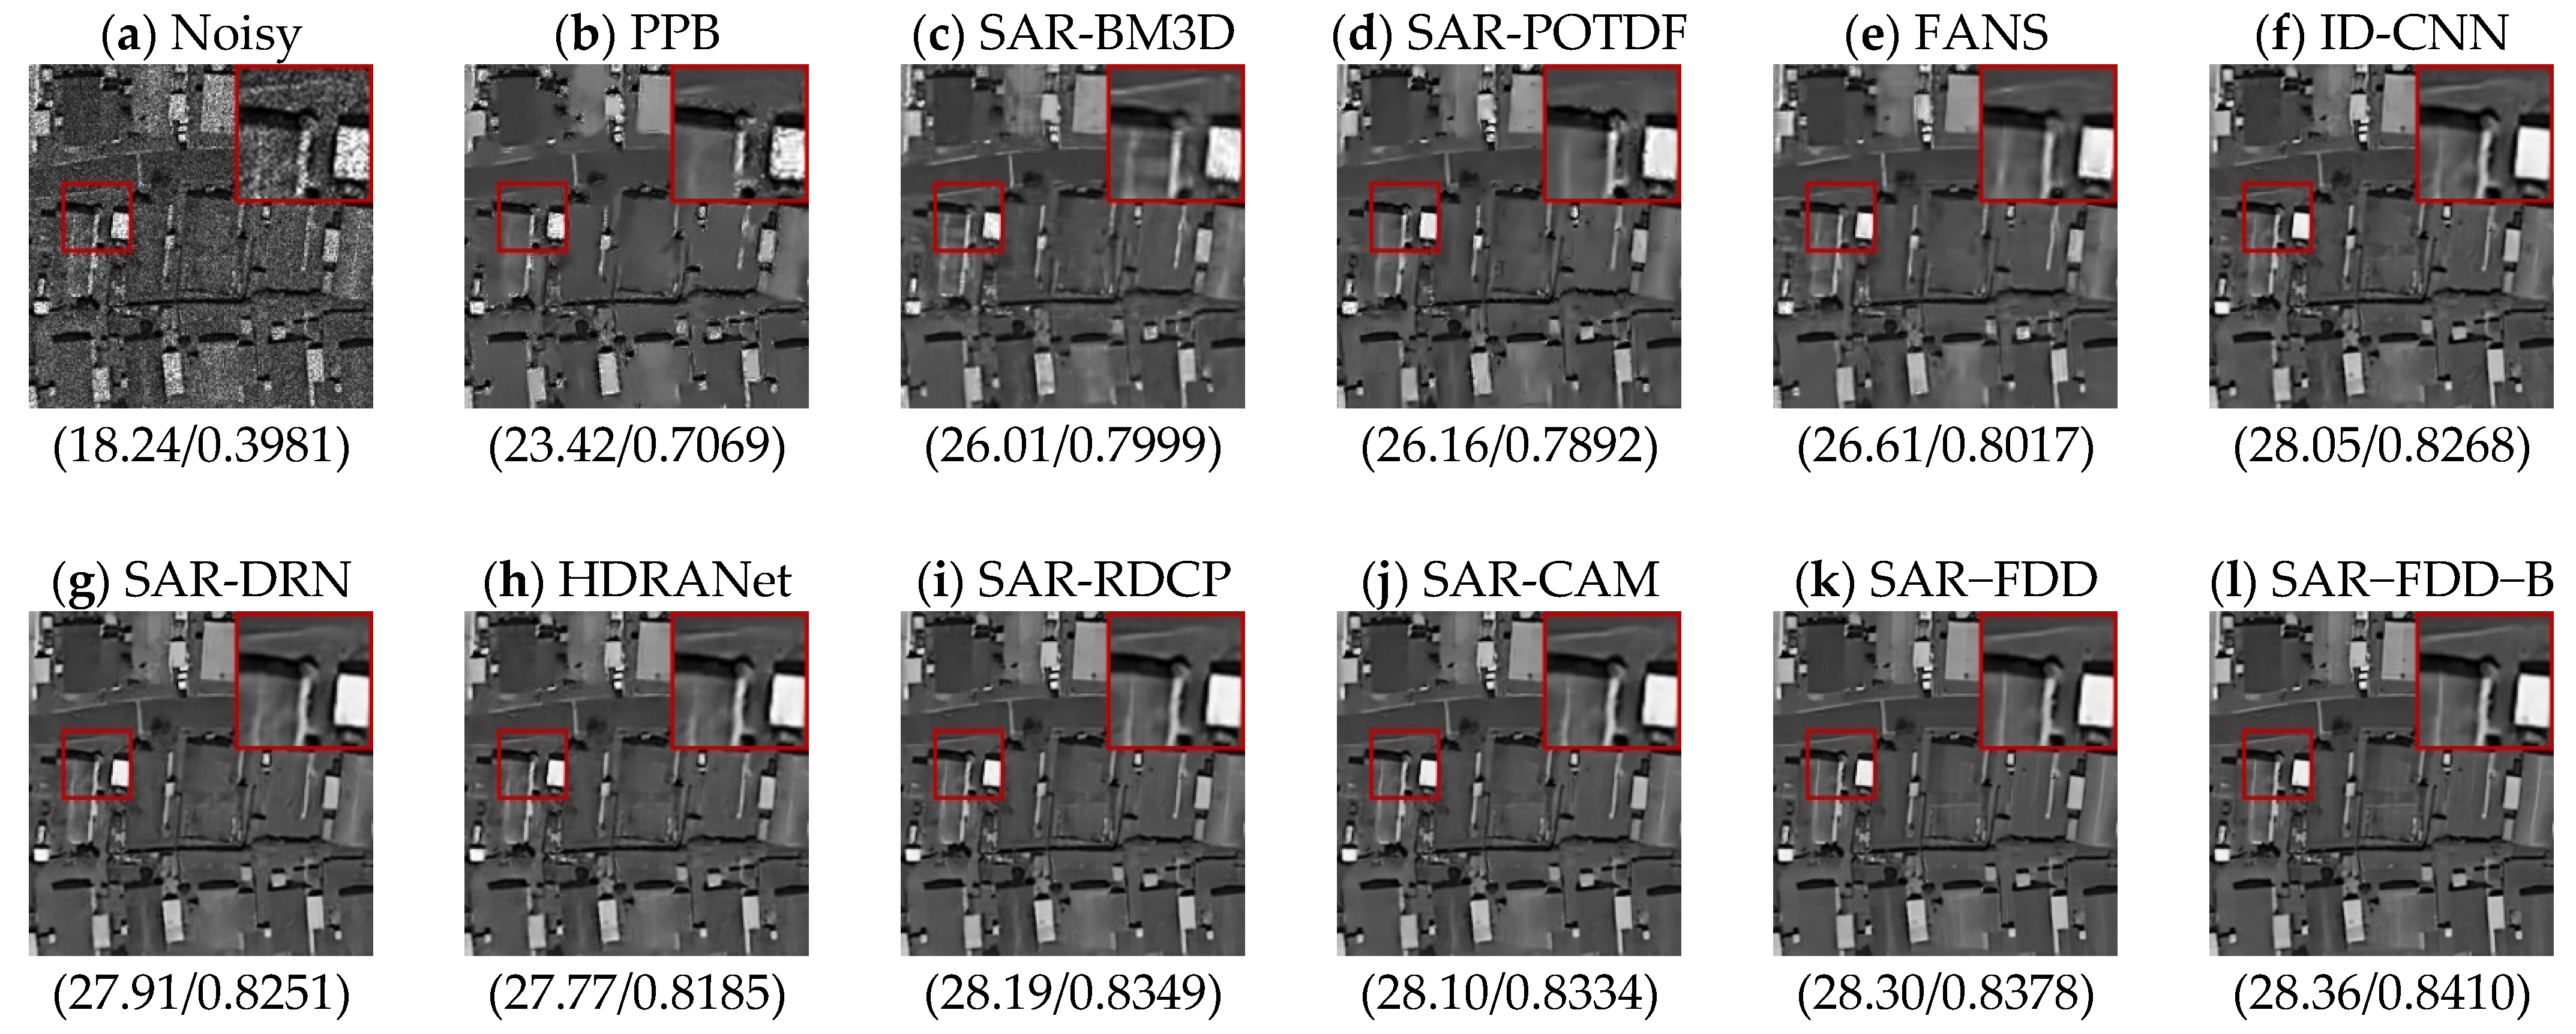
Figure 18.
Results for the dense residential area image with 4-look speckle noise.
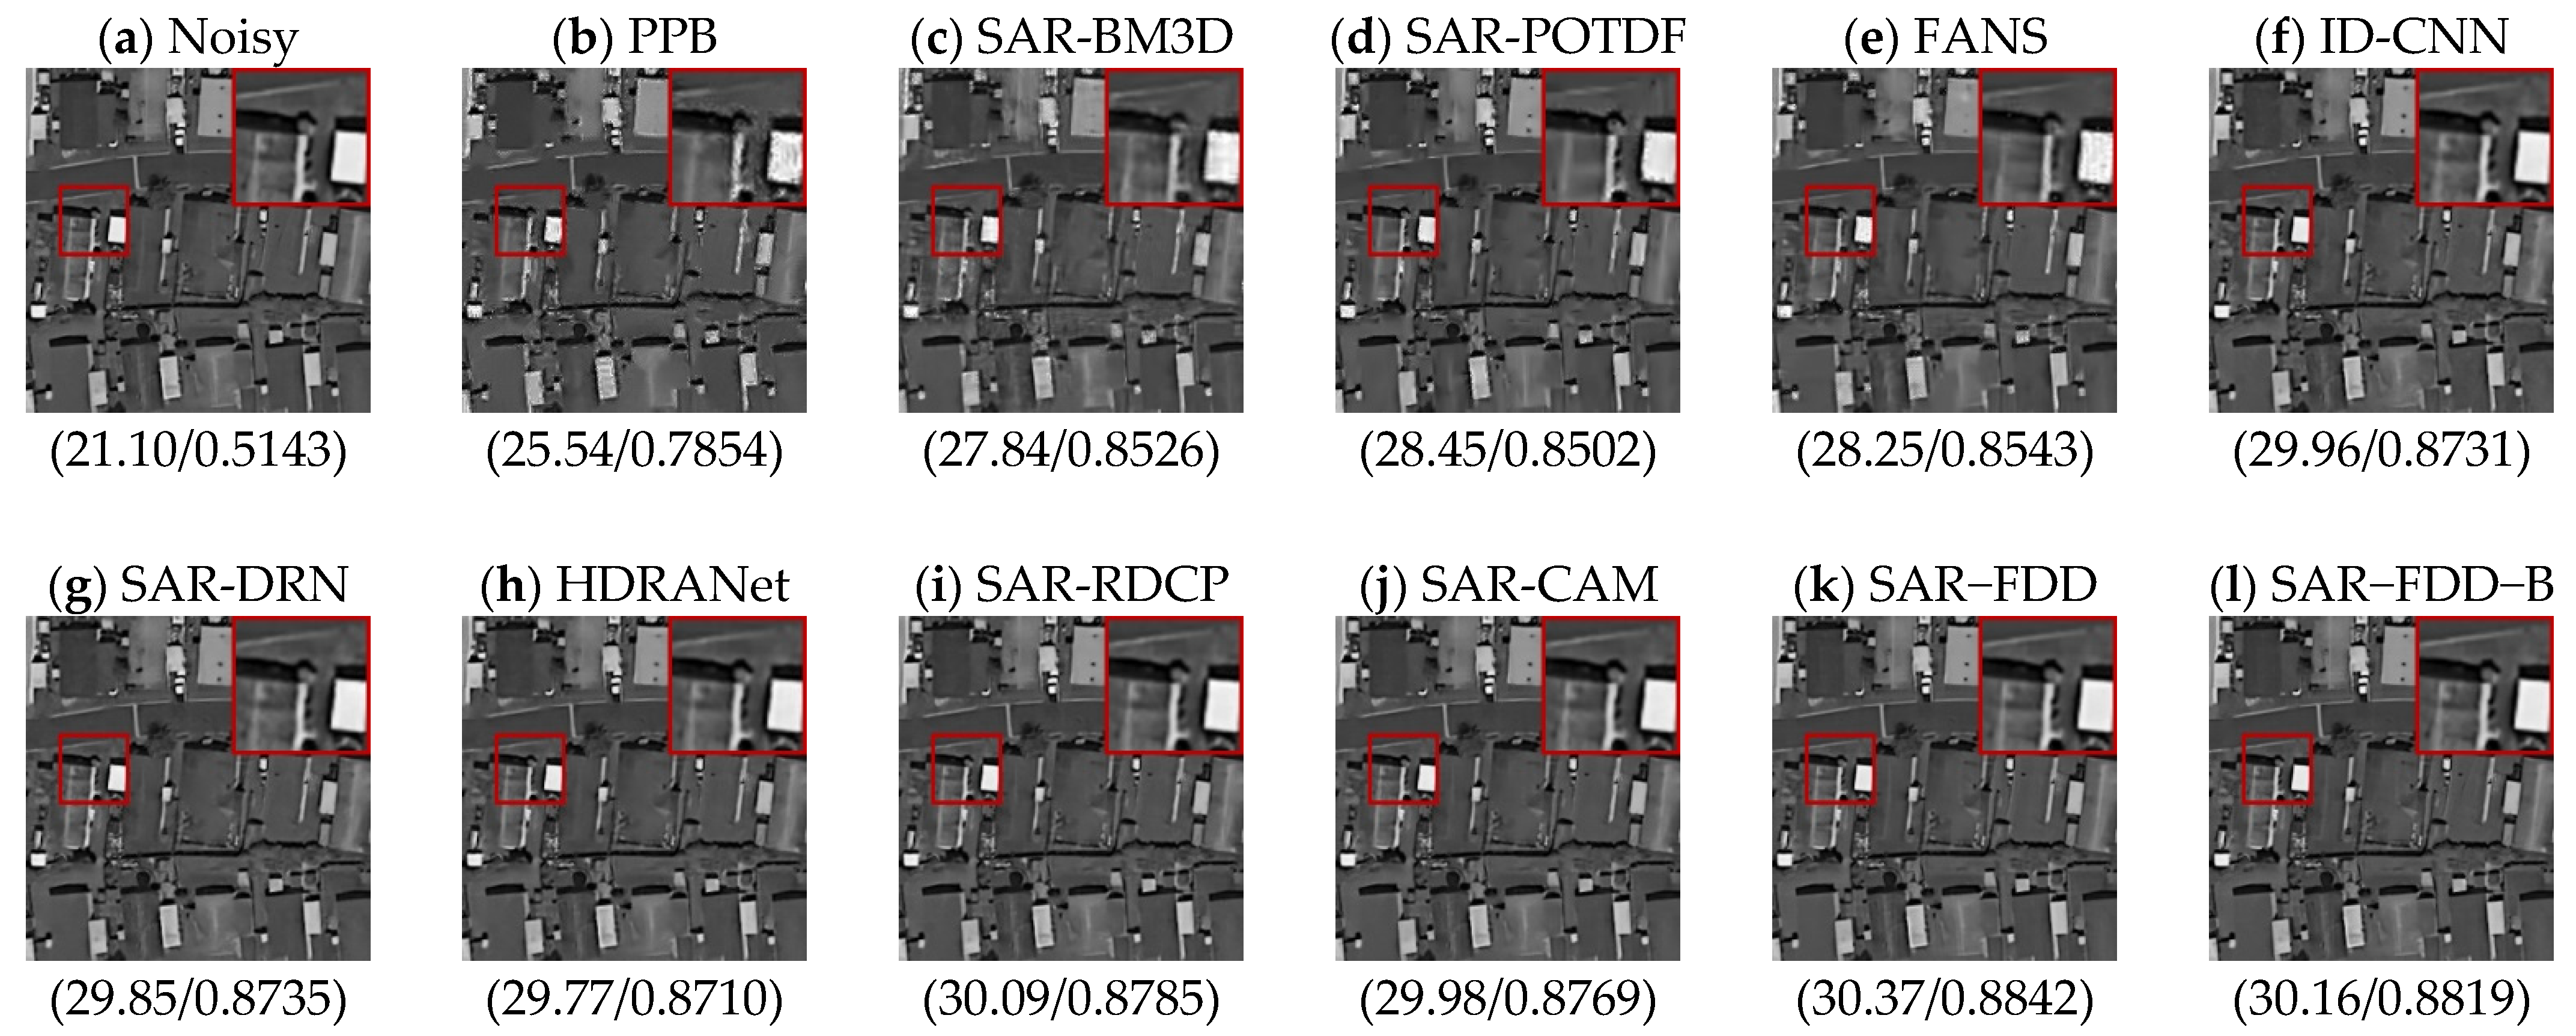
Figure 19.
Real SAR images.
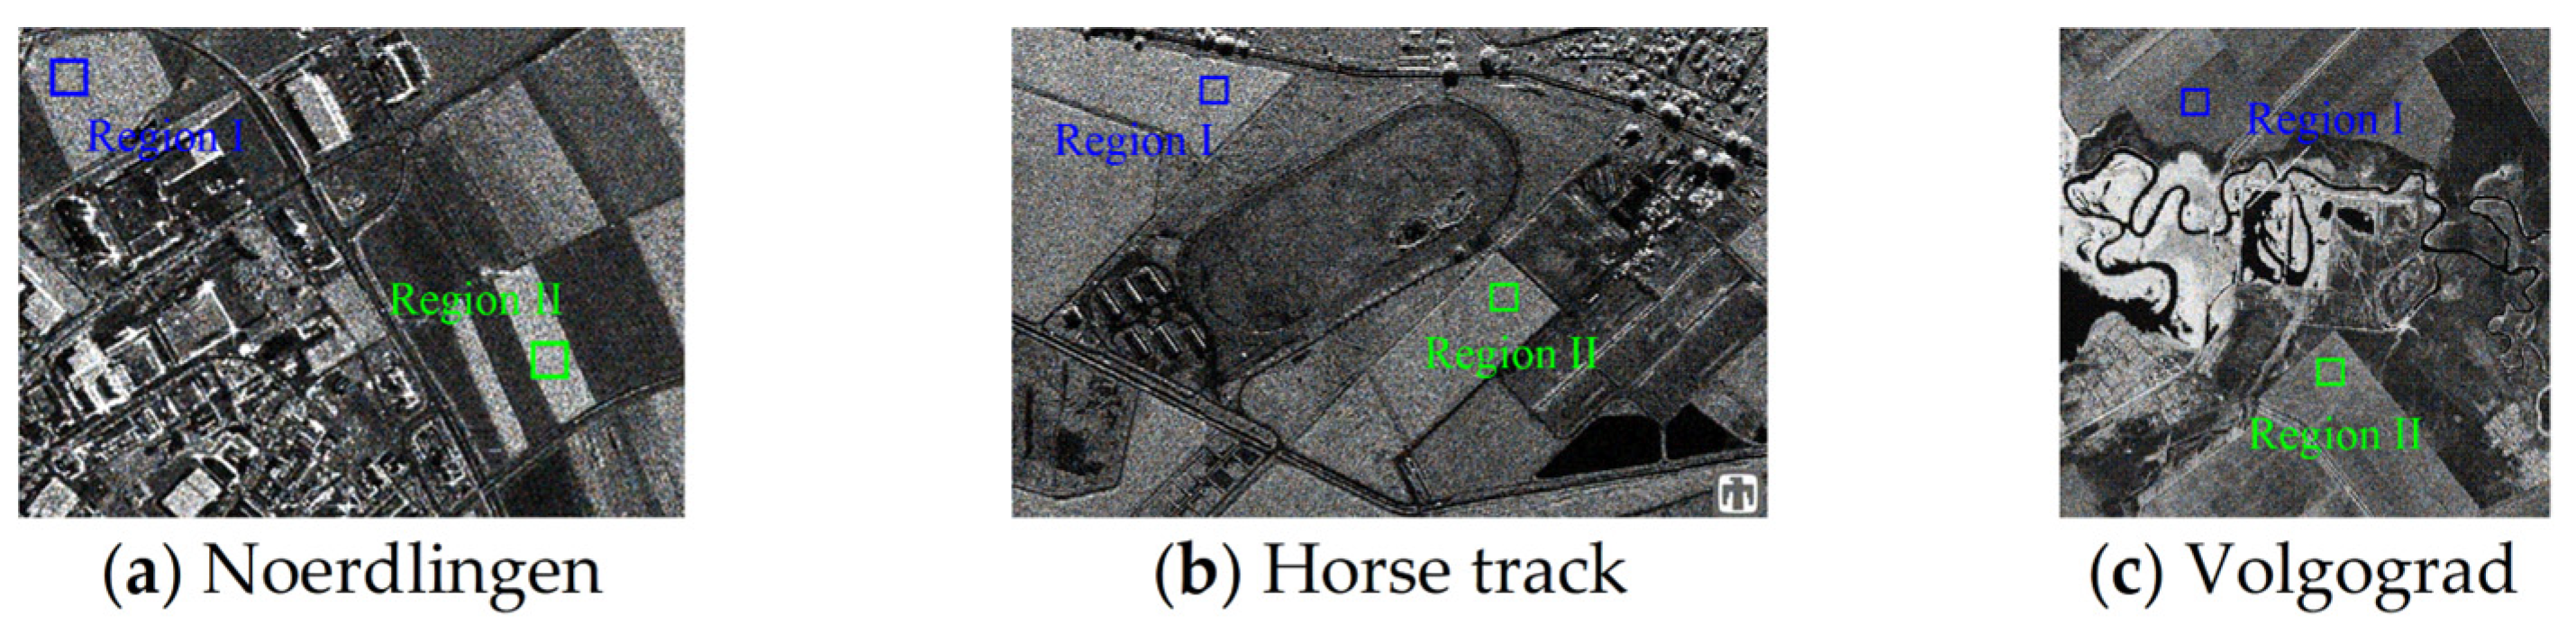
Figure 20.
Results for the Noerdlingen image with 4-look speckle noise.

Figure 21.
Results for the horse track image with 4-look speckle noise.
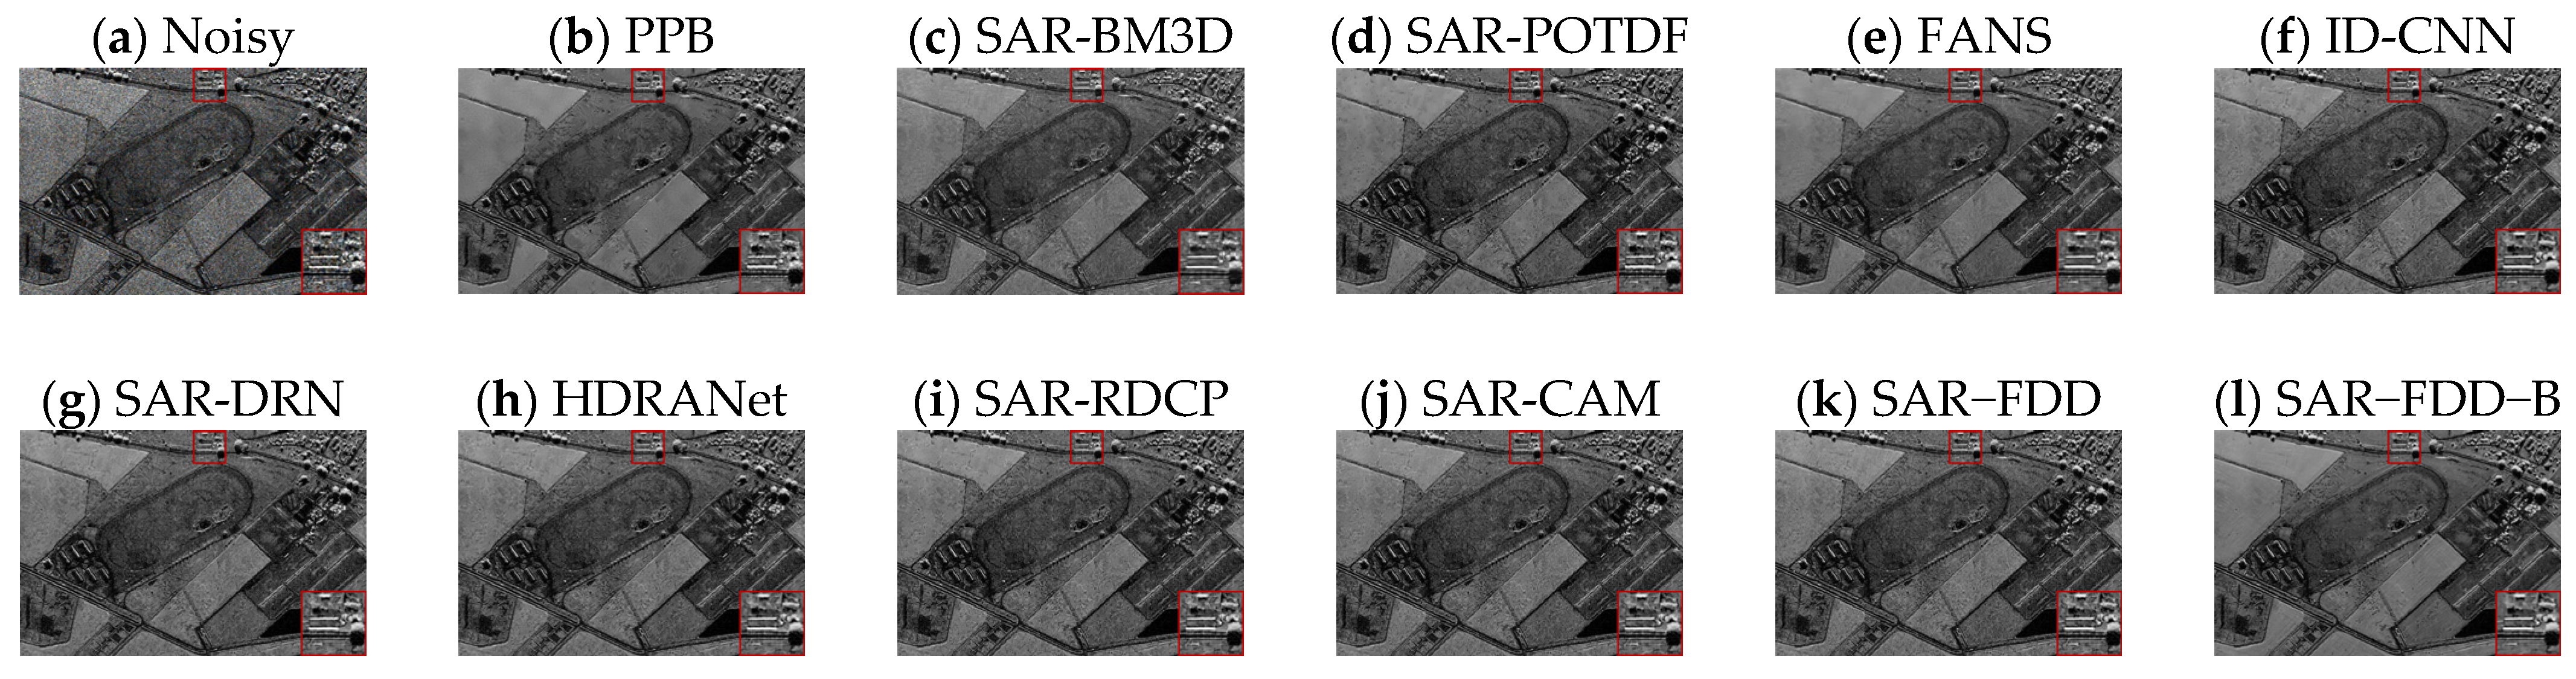
Figure 22.
Results for the Volgograd image with 4-look speckle noise.
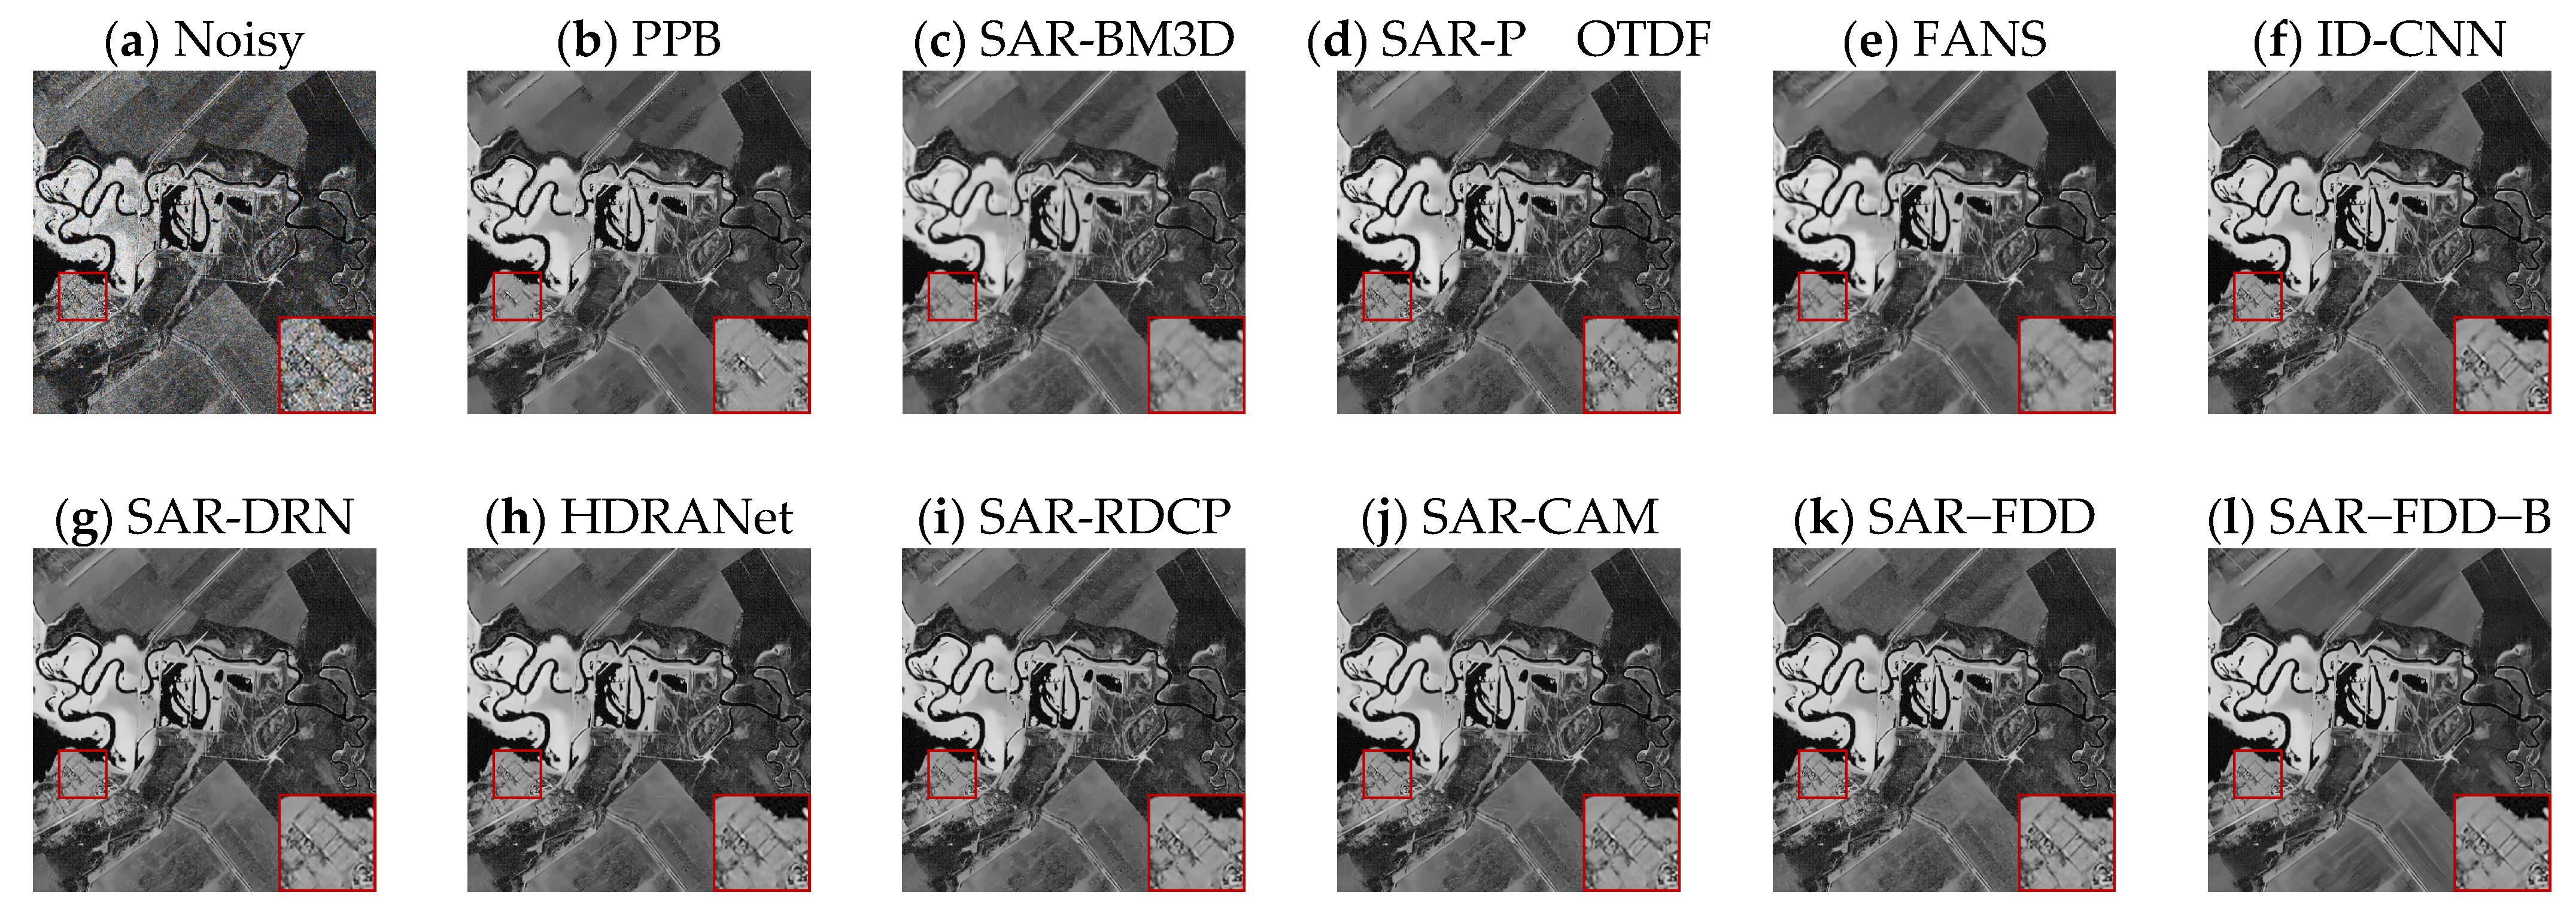
Figure 23.
ENL map of the Noerdlingen image.
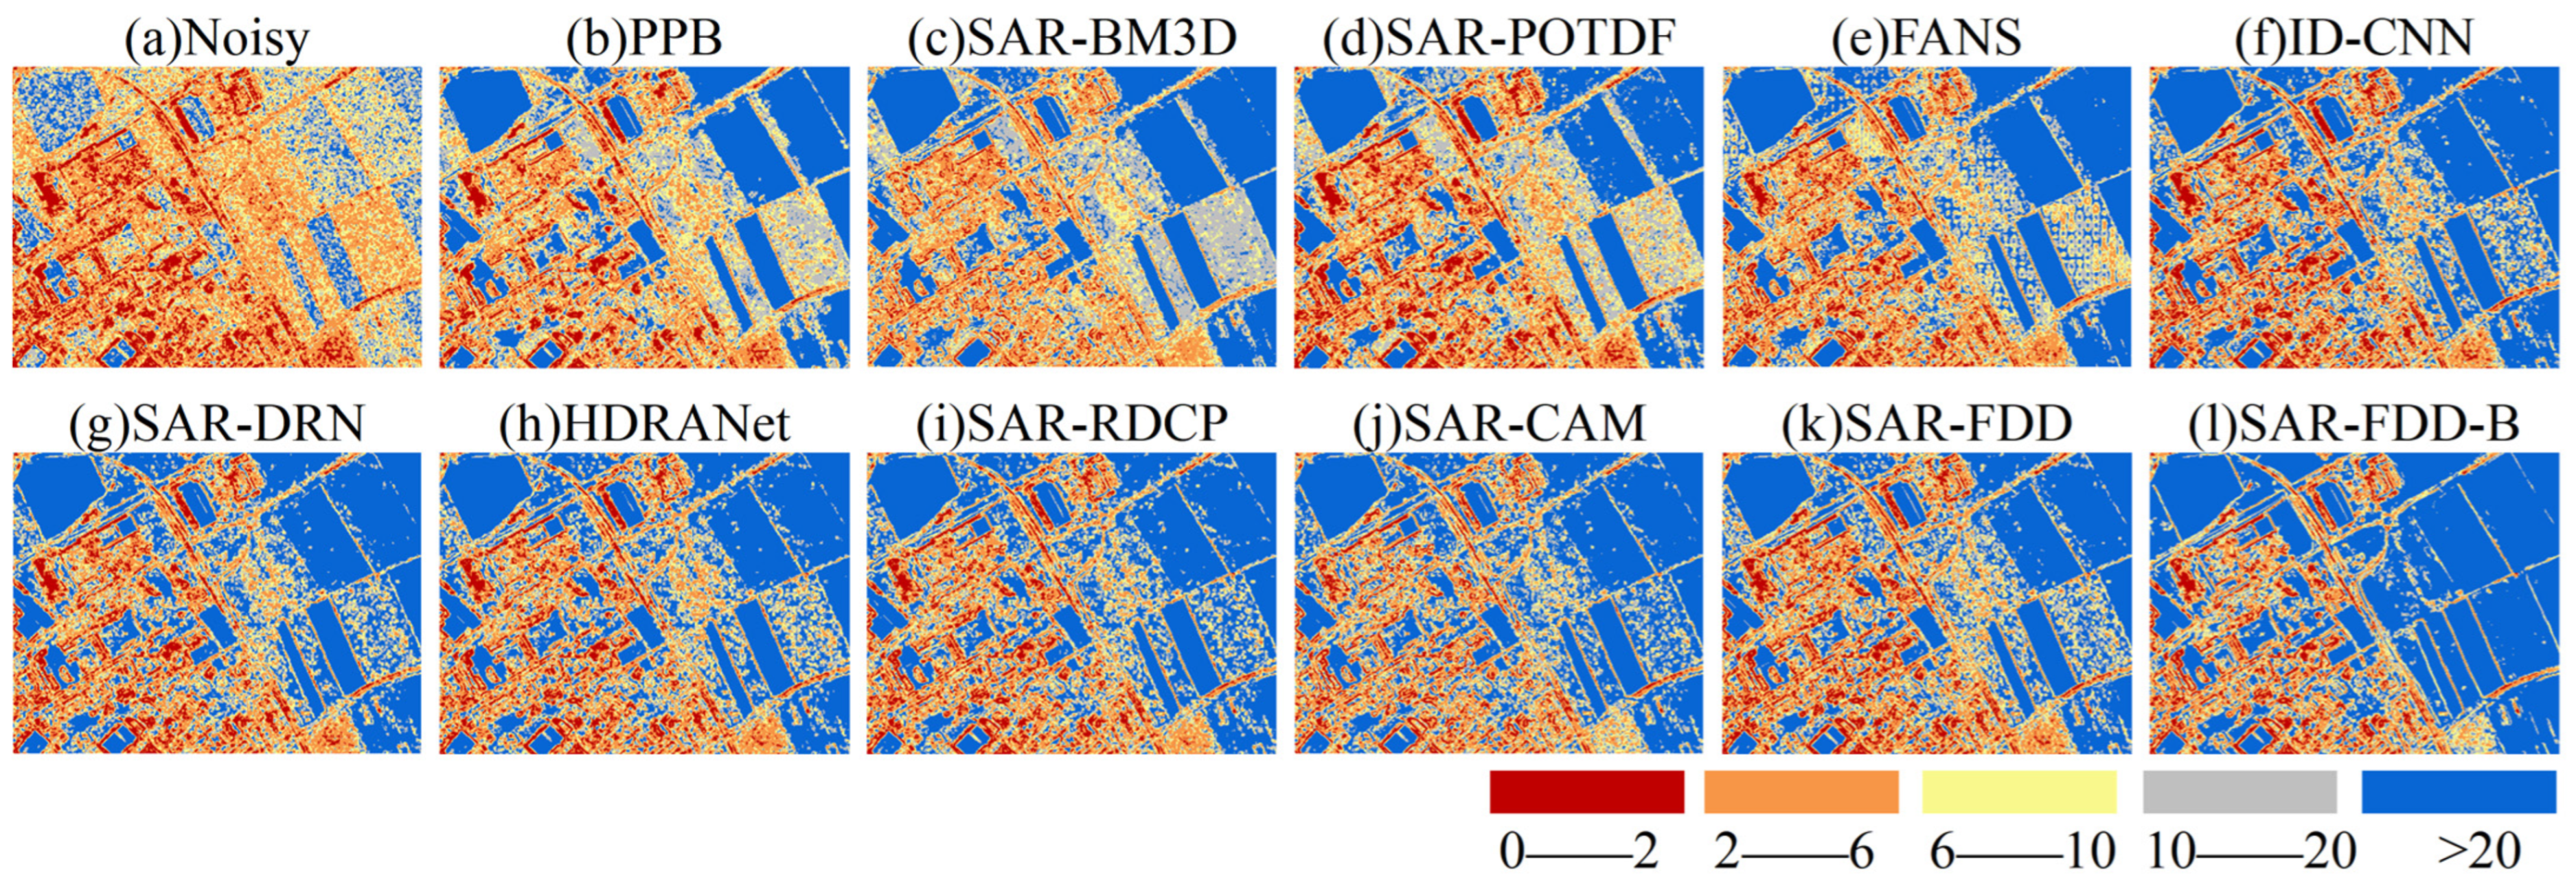
Figure 24.
ENL map of the horse track image.
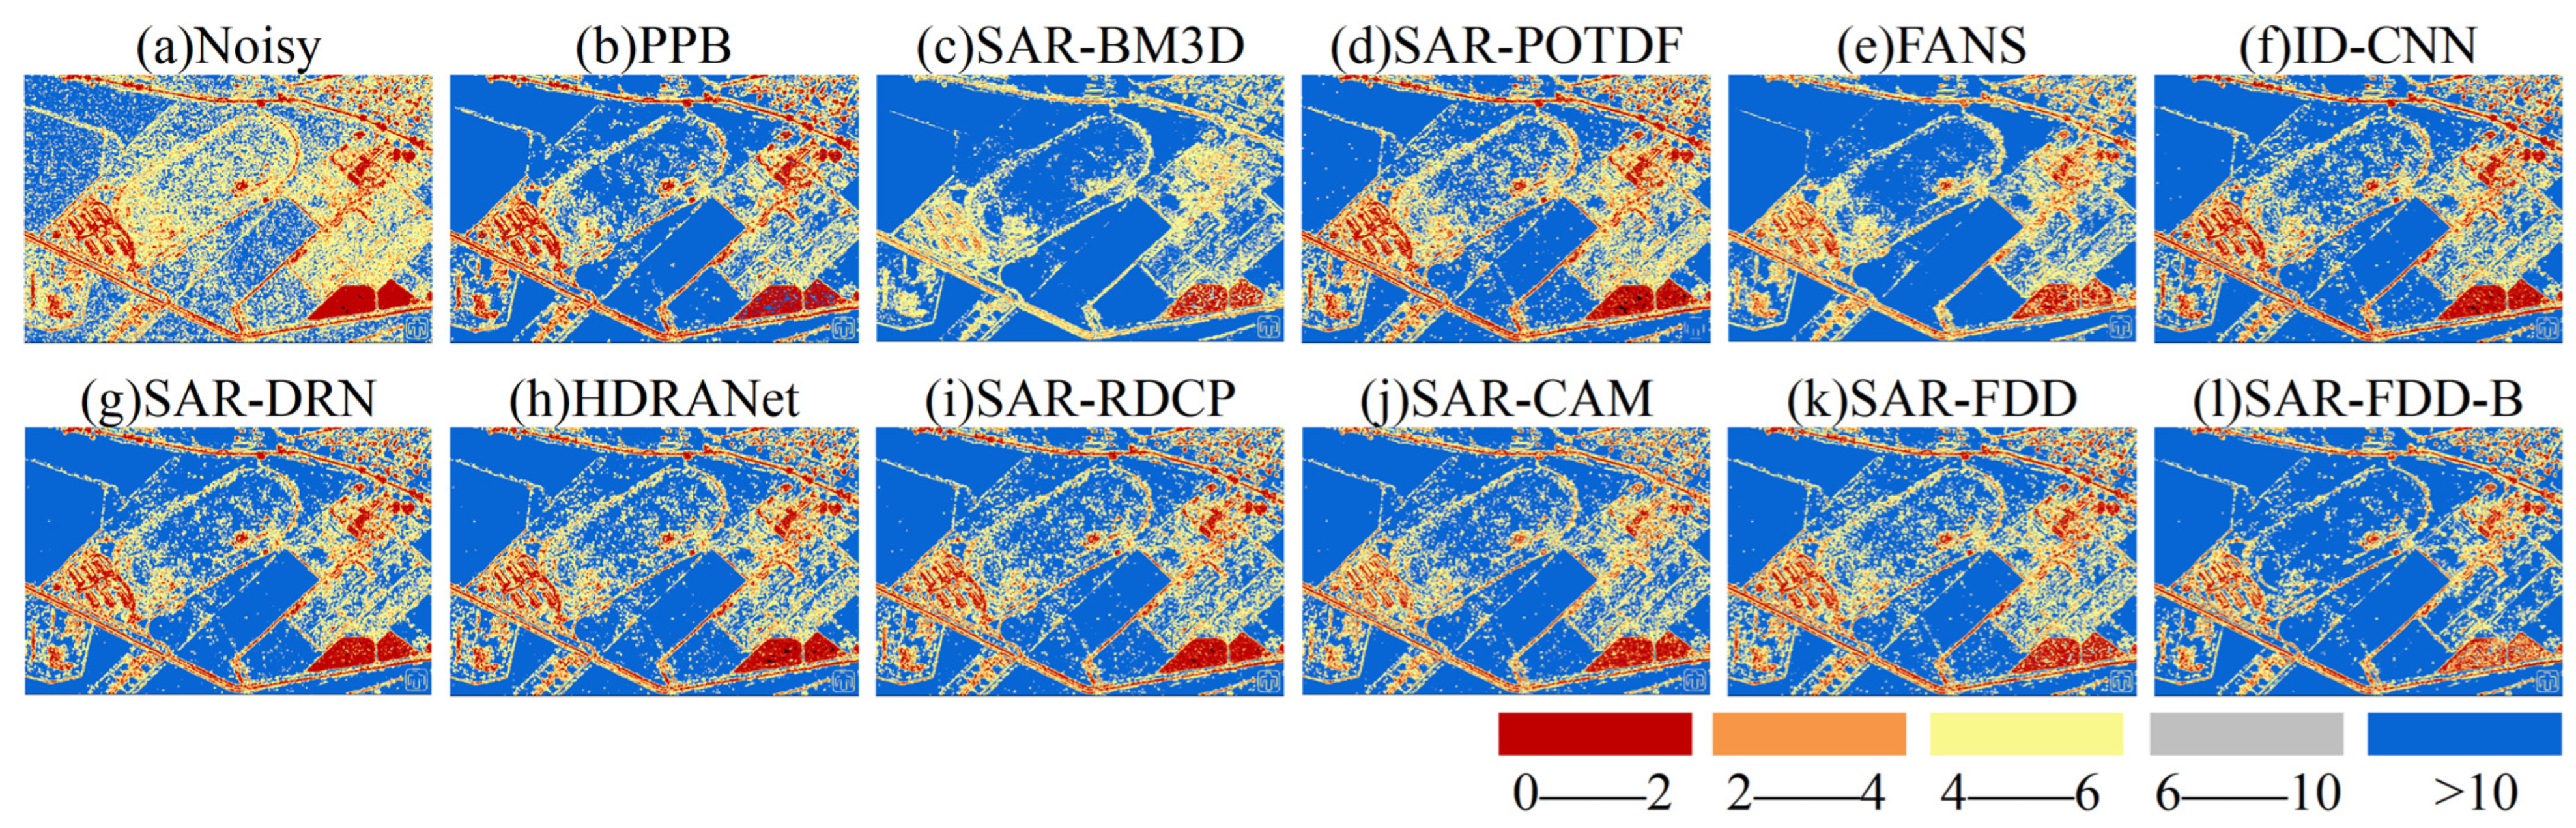
Figure 25.
ENL map of the Volgograd image.

Figure 26.
Average PSNR and SSIM of model with CA and without CA in the test datasets. (a) PSNR. (b) SSIM.
Figure 26.
Average PSNR and SSIM of model with CA and without CA in the test datasets. (a) PSNR. (b) SSIM.
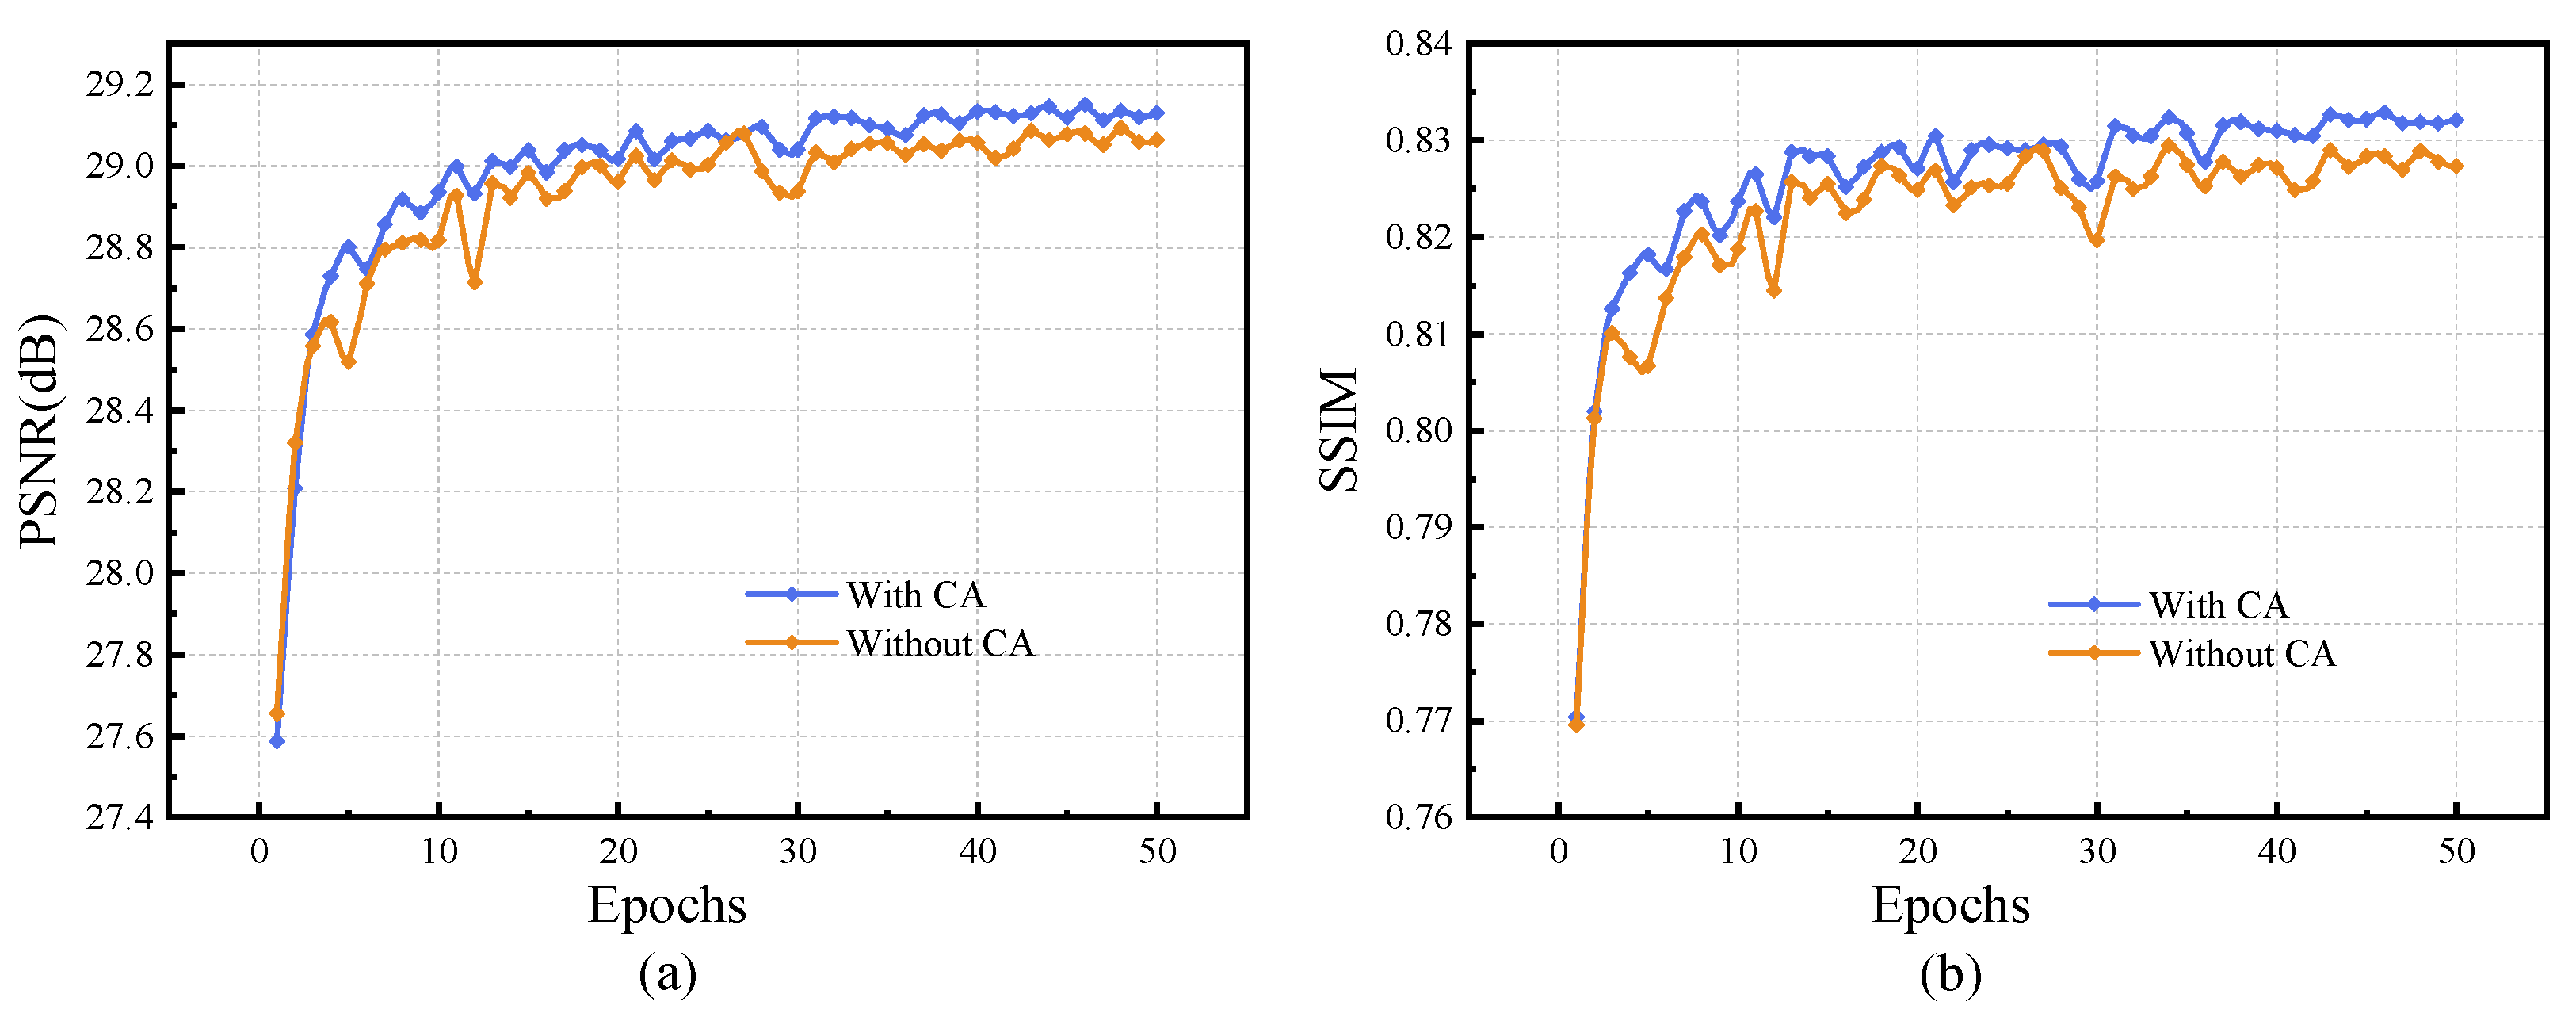
Figure 27.
Average PSNR and SSIM of model with different blocks in the test datasets. (a) PSNR. (b) SSIM.
Figure 27.
Average PSNR and SSIM of model with different blocks in the test datasets. (a) PSNR. (b) SSIM.
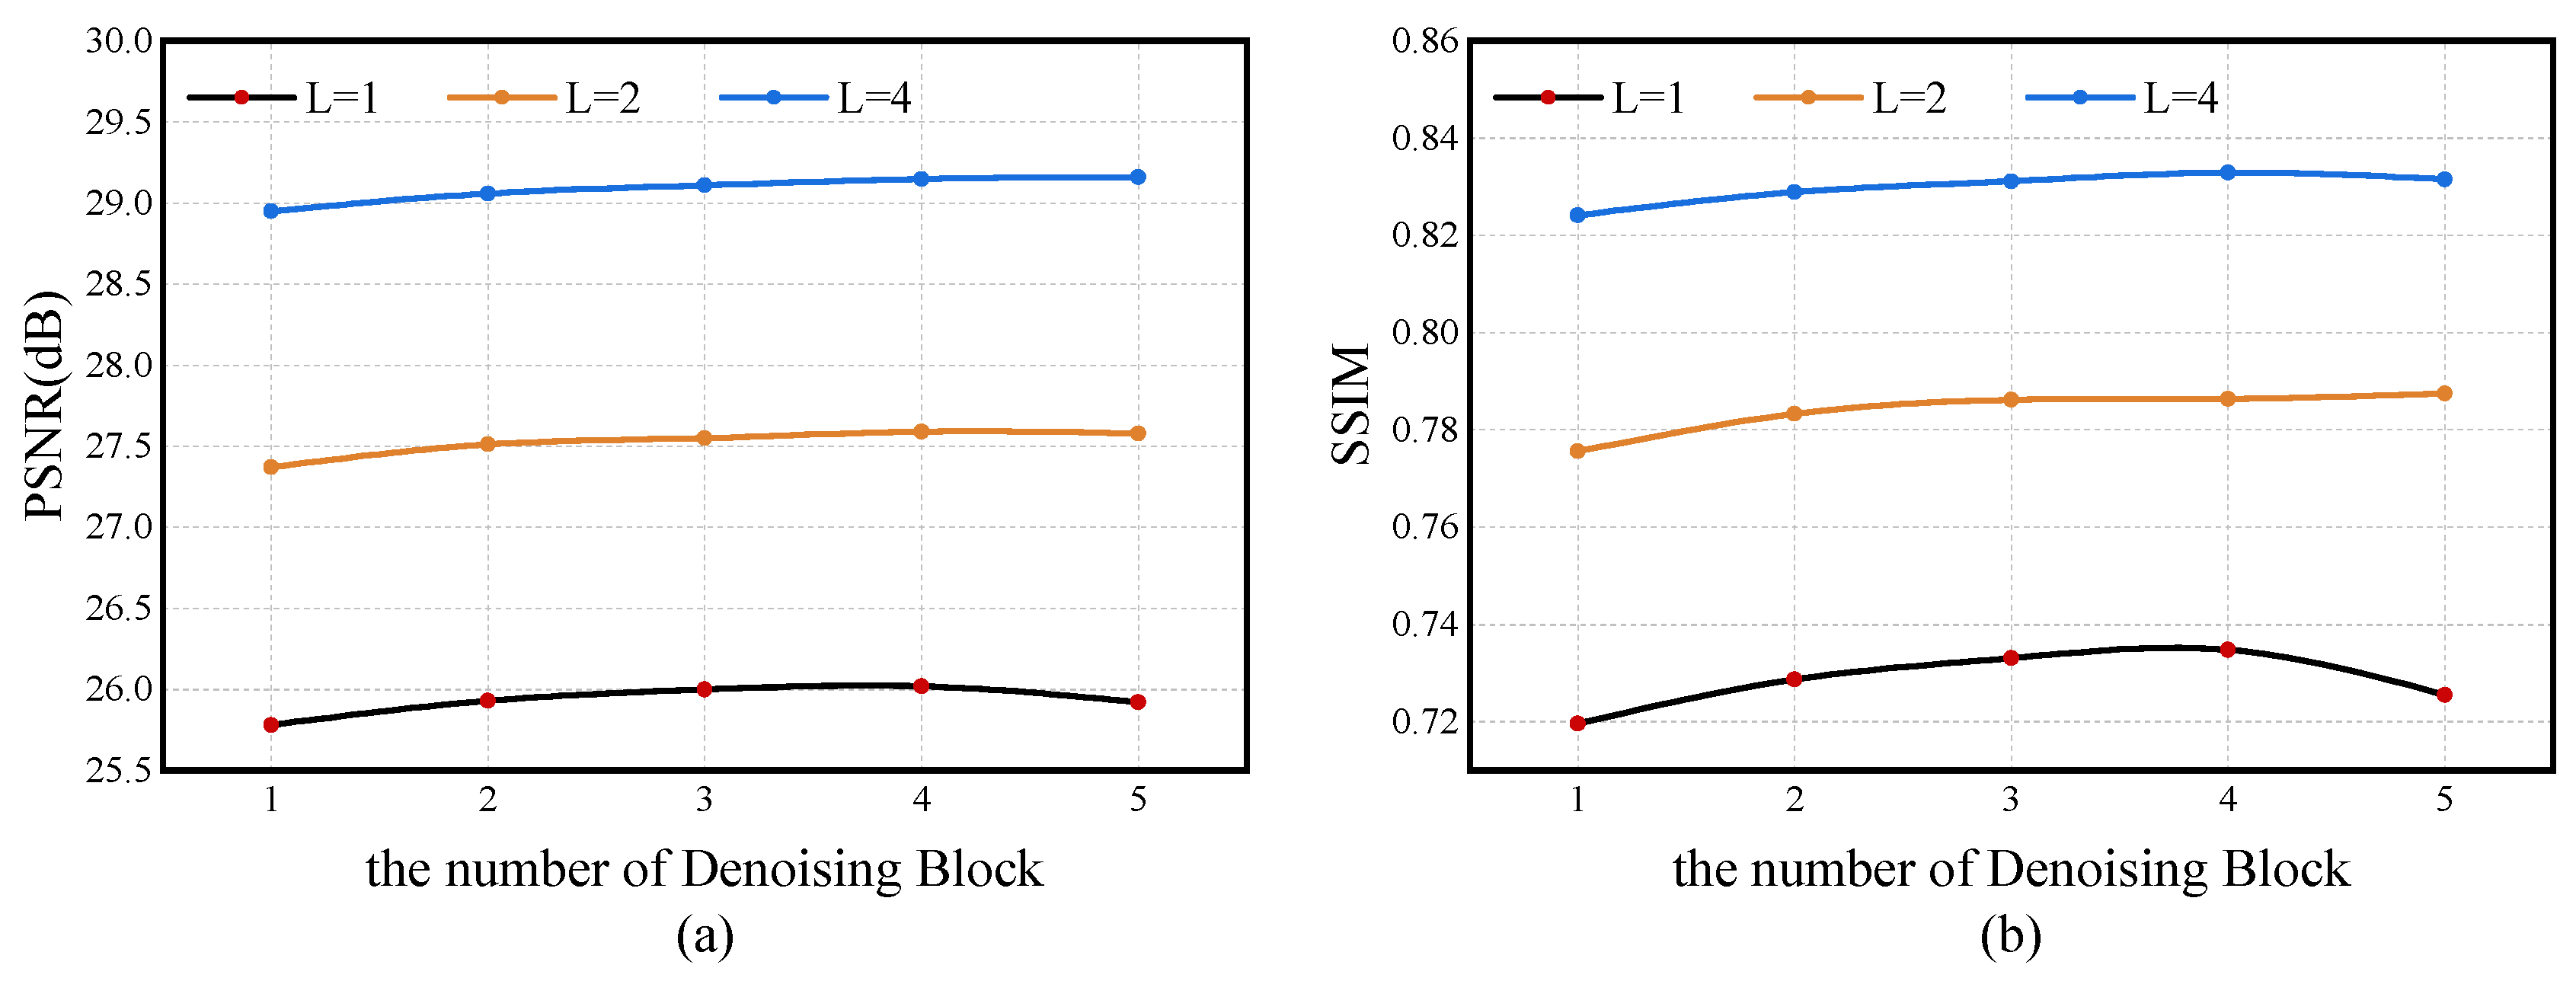
Figure 28.
Comparison of running speed and denoising performance for 11 algorithms.

Table 1.
Average quantitative evaluation results for the simulated dataset.
| Methods | L = 1 (PSNR/SSIM) | L = 2 (PSNR/SSIM) | L = 4 (PSNR/SSIM) |
|---|---|---|---|
| PPB | 23.19/0.5790 | 24.81/0.6637 | 26.36/0.7366 |
| SAR-BM3D | 24.65/0.6733 | 26.28/0.7407 | 27.90/0.7990 |
| SAR-POTDF | 23.32/0.6120 | 25.58/0.7086 | 27.61/0.7826 |
| FANS | 24.43/0.6601 | 26.22/0.7313 | 27.95/0.7909 |
| ID-CNN | 25.21/0.6871 | 26.92/0.7535 | 28.56/0.8073 |
| SAR-DRN | 25.42/0.7035 | 27.01/0.7623 | 28.61/0.8124 |
| HDRANet | 25.41/0.7010 | 26.83/0.7528 | 28.55/0.8099 |
| SAR-RDCP | 25.53/0.7095 | 27.19/0.7690 | 28.72/0.8166 |
| SAR-CAM | 25.61/0.7142 | 27.19/0.7693 | 28.71/0.8161 |
| SAR−FDD | 26.02/0.7348 | 27.59/0.7864 | 29.15/0.8329 |
| SAR−FDD−B | 25.94/0.7263 | 27.48/0.7797 | 28.96/0.8251 |
Table 2.
Quantitative results of the real dataset.
| Sensor | Method | ENL | MoI | MoR | EPD-ROA | ||
|---|---|---|---|---|---|---|---|
| Region I | Region II | HD | VD | ||||
| Noerdlingen | PPB | 137.91 | 340.42 | 0.9624 | 0.9626 | 0.9432 | 0.9511 |
| SAR-BM3D | 111.11 | 51.51 | 0.9656 | 0.9654 | 0.9366 | 0.9515 | |
| SAR-POTDF | 167.94 | 367.51 | 0.9632 | 0.9665 | 0.9319 | 0.9316 | |
| FANS | 152.18 | 481.57 | 0.9598 | 0.9634 | 0.9211 | 0.9380 | |
| ID-CNN | 163.55 | 179.27 | 0.9615 | 0.9626 | 0.8898 | 0.8923 | |
| SAR-DRN | 169.27 | 188.83 | 0.9635 | 0.9643 | 0.9288 | 0.9308 | |
| HDRANet | 179.32 | 222.61 | 0.9654 | 0.9661 | 0.9282 | 0.9312 | |
| SAR-RDCP | 171.92 | 259.43 | 0.9649 | 0.9656 | 0.9266 | 0.9347 | |
| SAR-CAM | 179.52 | 557.32 | 0.9682 | 0.9699 | 0.8883 | 0.9063 | |
| SAR−FDD | 174.40 | 177.04 | 0.9675 | 0.9663 | 0.9411 | 0.9395 | |
| SAR−FDD−B | 172.01 | 609.34 | 0.9643 | 0.9660 | 0.9040 | 0.9138 | |
| Horse track | PPB | 138.42 | 117.20 | 0.9523 | 0.9478 | 0.9469 | 0.9457 |
| SAR-BM3D | 86.64 | 39.31 | 0.9587 | 0.9529 | 0.9462 | 0.9731 | |
| SAR-POTDF | 112.57 | 84.70 | 0.9712 | 0.9680 | 0.9558 | 0.9555 | |
| FANS | 135.09 | 130.45 | 0.9532 | 0.9537 | 0.9268 | 0.9518 | |
| ID-CNN | 135.24 | 99.11 | 0.9587 | 0.9540 | 0.9008 | 0.9073 | |
| SAR-DRN | 94.83 | 84.75 | 0.9587 | 0.9540 | 0.9479 | 0.9473 | |
| HDRANet | 107.91 | 70.47 | 0.9604 | 0.9594 | 0.9386 | 0.9457 | |
| SAR-RDCP | 118.20 | 90.98 | 0.9598 | 0.9537 | 0.9415 | 0.9525 | |
| SAR-CAM | 127.56 | 117.71 | 0.9611 | 0.9565 | 0.9315 | 0.9581 | |
| SAR−FDD | 93.42 | 73.23 | 0.9651 | 0.9567 | 0.9685 | 0.9726 | |
| SAR−FDD−B | 342.87 | 494.92 | 0.9588 | 0.9580 | 0.9494 | 0.9700 | |
| Volgograd | PPB | 93.28 | 146.67 | 0.9668 | 0.9548 | 0.9256 | 0.9327 |
| SAR-BM3D | 94.75 | 115.61 | 0.9747 | 0.9631 | 0.9037 | 0.9269 | |
| SAR-POTDF | 179.10 | 102.52 | 0.9911 | 0.9762 | 0.9163 | 0.9276 | |
| FANS | 125.86 | 121.59 | 0.9779 | 0.9725 | 0.8998 | 0.9210 | |
| ID-CNN | 360.75 | 178.11 | 0.9749 | 0.9603 | 0.8782 | 0.8939 | |
| SAR-DRN | 470.37 | 164.41 | 0.9723 | 0.9577 | 0.9019 | 0.9153 | |
| HDRANet | 509.75 | 255.59 | 0.9752 | 0.9621 | 0.9059 | 0.9257 | |
| SAR-RDCP | 424.98 | 178.73 | 0.9711 | 0.9556 | 0.9030 | 0.9210 | |
| SAR-CAM | 754.82 | 284.08 | 0.9746 | 0.9620 | 0.8706 | 0.8953 | |
| SAR−FDD | 249.87 | 106.28 | 0.9624 | 0.9533 | 0.9283 | 0.9443 | |
| SAR−FDD−B | 954.39 | 849.73 | 0.9656 | 0.9632 | 0.8880 | 0.9082 | |
Table 3.
Average quantitative results of different loss functions.
| Loss Function | PSNR (dB) | SSIM |
|---|---|---|
| MSE | 29.1388 | 0.8315 |
| DG | 29.1418 | 0.8318 |
| 29.1357 | 0.8317 | |
| 29.1423 | 0.8316 | |
| 29.1501 | 0.8329 |
Table 4.
Comparison of parameter quantities for 8 deep learning methods.
| Method | ID-CNN | SAR-DRN | HDRANet | SAR-RDCP | SAR-CAM | SAR−FDD | SAR- FDDL-B |
|---|---|---|---|---|---|---|---|
| Parameters | 223,104 | 185,857 | 112,611 | 272,196 | 3,317,284 | 377,537 | 377,537 |
Disclaimer/Publisher’s Note: The statements, opinions and data contained in all publications are solely those of the individual author(s) and contributor(s) and not of MDPI and/or the editor(s). MDPI and/or the editor(s) disclaim responsibility for any injury to people or property resulting from any ideas, methods, instructions or products referred to in the content. |
© 2024 by the authors. Licensee MDPI, Basel, Switzerland. This article is an open access article distributed under the terms and conditions of the Creative Commons Attribution (CC BY) license (https://creativecommons.org/licenses/by/4.0/).
Share and Cite
MDPI and ACS Style
Zhao, X.; Ren, F.; Sun, H.; Qi, Q. Synthetic Aperture Radar Image Despeckling Based on a Deep Learning Network Employing Frequency Domain Decomposition. Electronics 2024, 13, 490. https://doi.org/10.3390/electronics13030490
AMA Style
Zhao X, Ren F, Sun H, Qi Q. Synthetic Aperture Radar Image Despeckling Based on a Deep Learning Network Employing Frequency Domain Decomposition. Electronics. 2024; 13(3):490. https://doi.org/10.3390/electronics13030490
Chicago/Turabian StyleZhao, Xueqing, Fuquan Ren, Haibo Sun, and Qinghong Qi. 2024. "Synthetic Aperture Radar Image Despeckling Based on a Deep Learning Network Employing Frequency Domain Decomposition" Electronics 13, no. 3: 490. https://doi.org/10.3390/electronics13030490
Note that from the first issue of 2016, this journal uses article numbers instead of page numbers. See further details here.