Article

Enhancement of Two-Dimensional Barcode Restoration Based on Recurrent Feature Reasoning and Structural Fusion Attention Mechanism

School of Opto-Electronics and Communication Engineering, Xiamen University of Technology, Xiamen 361024, China
*
Author to whom correspondence should be addressed.
Electronics 2024, 13(10), 1873; https://doi.org/10.3390/electronics13101873
Submission received: 8 April 2024 / Revised: 6 May 2024 / Accepted: 7 May 2024 / Published: 10 May 2024

Abstract

:
In practical scenarios, such as in electronics, where barcodes on electronic component carriers often wear out, and in logistics, where package labels frequently get damaged, this type of damage makes the recognition of two-dimensional (2D) barcodes challenging. In this study, a new repair method was introduced for quick response (QR) and PDF417 codes. In addition, a structural fusion attention (SFA) mechanism with a recurrent feature reasoning network was integrated to enhance structural integrity and recognition rates. The proposed method significantly outperforms existing inpainting models in terms of accuracy and robustness, which is demonstrated by the custom dataset provided by the authors. Notably, the approach ensures near-perfect recognition rates despite extensive structural impairments. It achieves an accuracy of 98% for large-area PDF417 occlusions and maintains a recognition rate of 100% for QR codes with 75–90% structural damage. These findings highlight the exceptional ability of the proposed method to restore 2D barcodes impaired by diverse levels of structural occlusion.

1. Introduction

Two-dimensional barcodes have found extensive application across multiple sectors, including but not limited to electronic payments, the Internet of Things, healthcare, and transportation [1,2,3]. They are prevalent in marketing, business tracking, and ticketing because of their cost-effectiveness and ease of use [4,5]. Nevertheless, challenges such as damage, obstructions, and poor lighting can hinder QR code recognition in complex environments, with such conditions impeding regular decoders from accurately reading QR codes, complicating information tracing efforts [5,6,7,8,9,10].
Advances in barcode recognition have contributed to the definition of edge detection thresholds, segmentation enhancements for 2D barcodes in text-dense environments, and improvements in rotation handling and positioning accuracy [11,12,13,14,15,16]. In general, traditional image processing techniques fall short in complex environments. Research has been directed towards developing deep learning-based anti-interference methods to improve barcode localization. An end-to-end region-based network model has been introduced for accurate positioning and robust multi-class barcode detection in challenging environments [17]. A streamlined deep neural network incorporating convolutional neural networks (CNNs) and network compression techniques has been utilized to swiftly and accurately identify the four vertices of barcodes [18]. Edge prior knowledge was integrated based on the average distance from the center of an image to the edges of a clear QR code. Focal blur parameters were determined through iterative estimation and the Wiener filter was utilized to enhance the clarity of barcode images [19]. The edge-enhanced hierarchical feature pyramid generative adversarial network (EHFP-GAN) model addresses tainted and damaged QR codes, demonstrates superior performance, and notably achieves higher recognition rates under various contamination levels [20].
The described methods significantly enhance image clarity, system robustness, and computational efficiency, and prove their high applicability in barcode systems within warehouse logistics and automated production. Studies have thoroughly investigated a variety of technical strategies for recognizing and detecting 2D barcodes in challenging environments. Despite their efficacy in resolving noise and ambiguity, these methods have limitations in identifying 2D barcodes that are damaged or obscured due to abrasions, stains, folds, partial tear-offs, and other common occurrences in real-world scenarios such as shipping, handling, and consumer purchasing.
Deep learning advancements have greatly improved image restoration, particularly for extensive damage and complex textures. Based on this progress, the application of CNNs for inferring image contexts and filling gaps marked an early milestone in deep learning for image restoration in 2016 [21]. Subsequently, the Pix2Pix model leveraging conditional GAN (cGAN) further elevated the quality of image restoration and achieved results nearly indistinguishable from the original images [22]. Following this, models built on GAN foundations have strengthened the naturalness and coherence of restored images, which sets new benchmarks in the field [23,24,25]. In particular, the implementation of attention mechanisms has markedly improved the performance of image restoration, which underscores the importance of focused details [26,27,28]. Furthermore, the development of a graduated attention module has balanced global consistency with detail enhancement, which showcases adaptive approaches in restoration [29]. Moreover, PCNet utilized a partial convolutional attention mechanism to restore images naturally and coherently, even those with irregular or fragmented content, which advanced the adaptability of restoration techniques [30]. Afterwards, a multi-step attention-enhanced structural image repair model was unveiled, which significantly reduced structural errors and improved repair outcomes by focusing on stabilizing and detailing structural elements [31,32,33].
In summary, this research addressed the structural damage in 2D barcodes, with an emphasis on obscured key symbols hindering recognition efficacy. The focus was placed on revitalizing 2D barcodes compromised in vital regions, to augment decoding success via proficient restoration methods. The proposed methodological framework and novel contributions are exposed in the subsequent sections.

2. Method

Under the inspiration of [34], a recurrent feature reasoning network was adopted with a core encoder–decoder module as the main body of the model, where the image mask part was iteratively completed through feature filling. This iterative approach not only enhanced the structure and texture of the reconstructed areas but also progressively strengthened the constraints within the center of the hole. A structural fusion attention (SFA) mechanism was then introduced, and local attention maps were utilized to guide global attention maps, which ensured that the texture information of the restored defective parts was more complete. Finally, the loss function was introduced. The workflow of the model is shown in Figure 1.

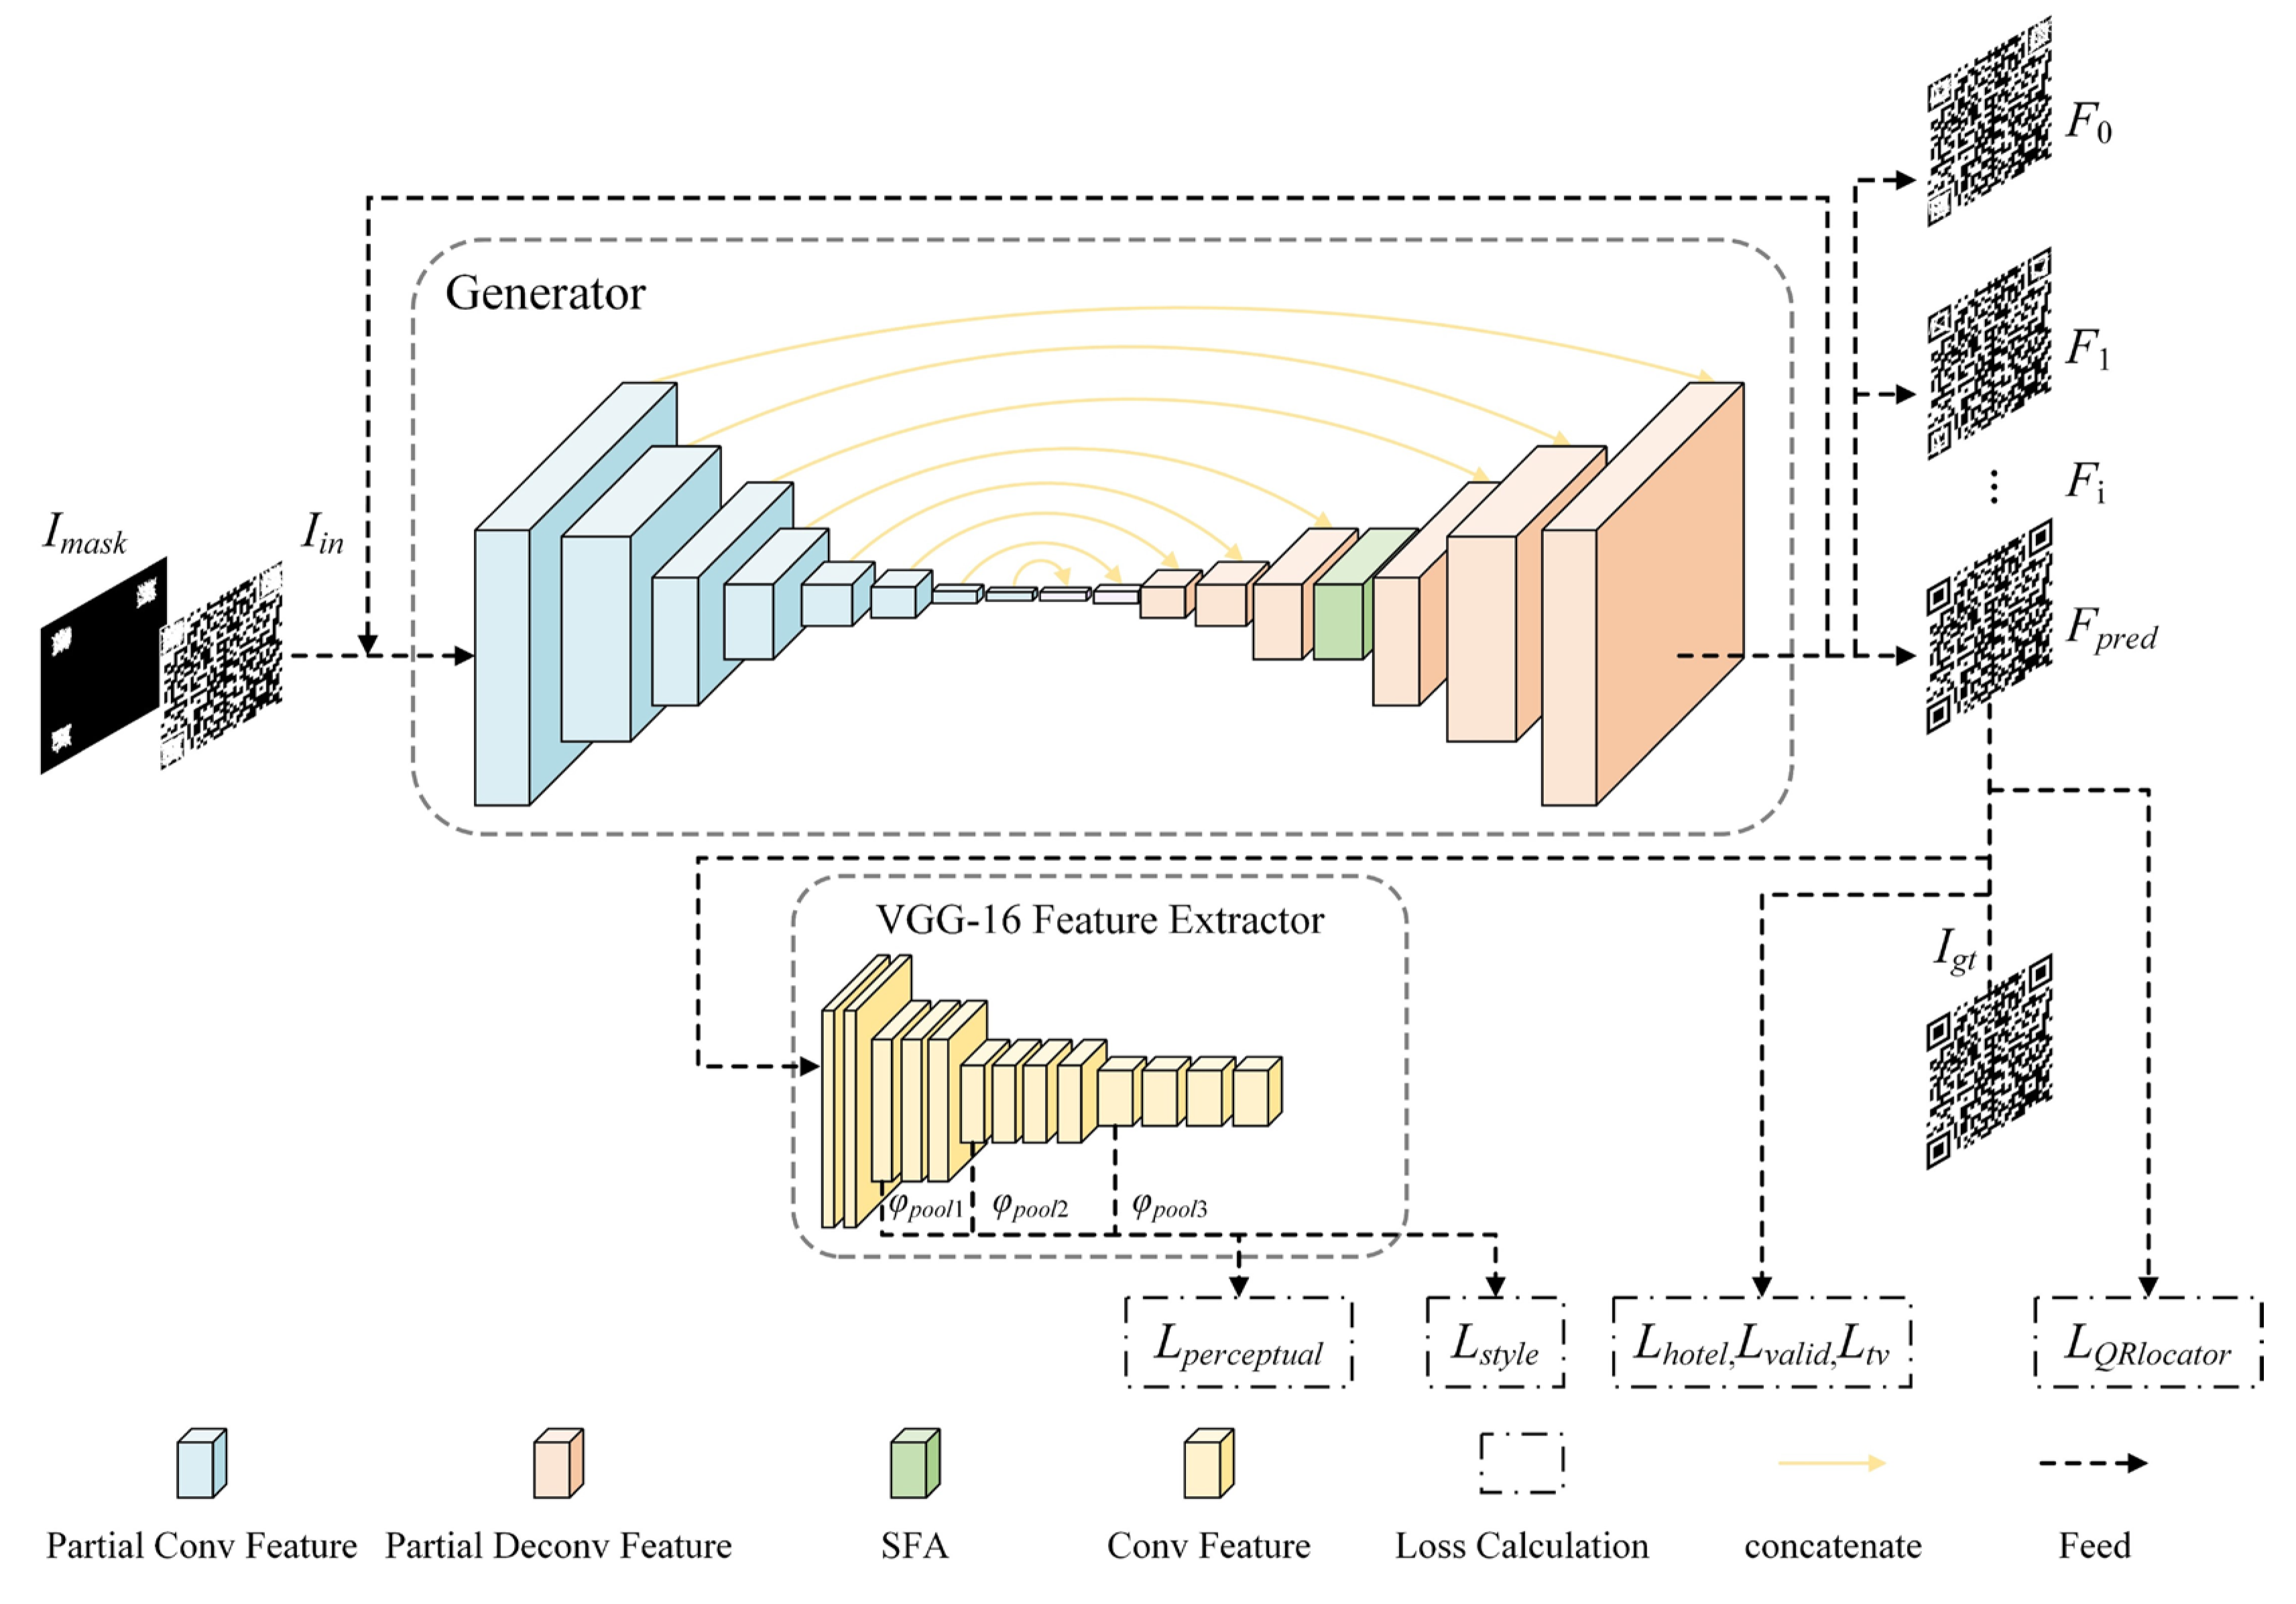
2.1. Recurrent Feature Reasoning Network
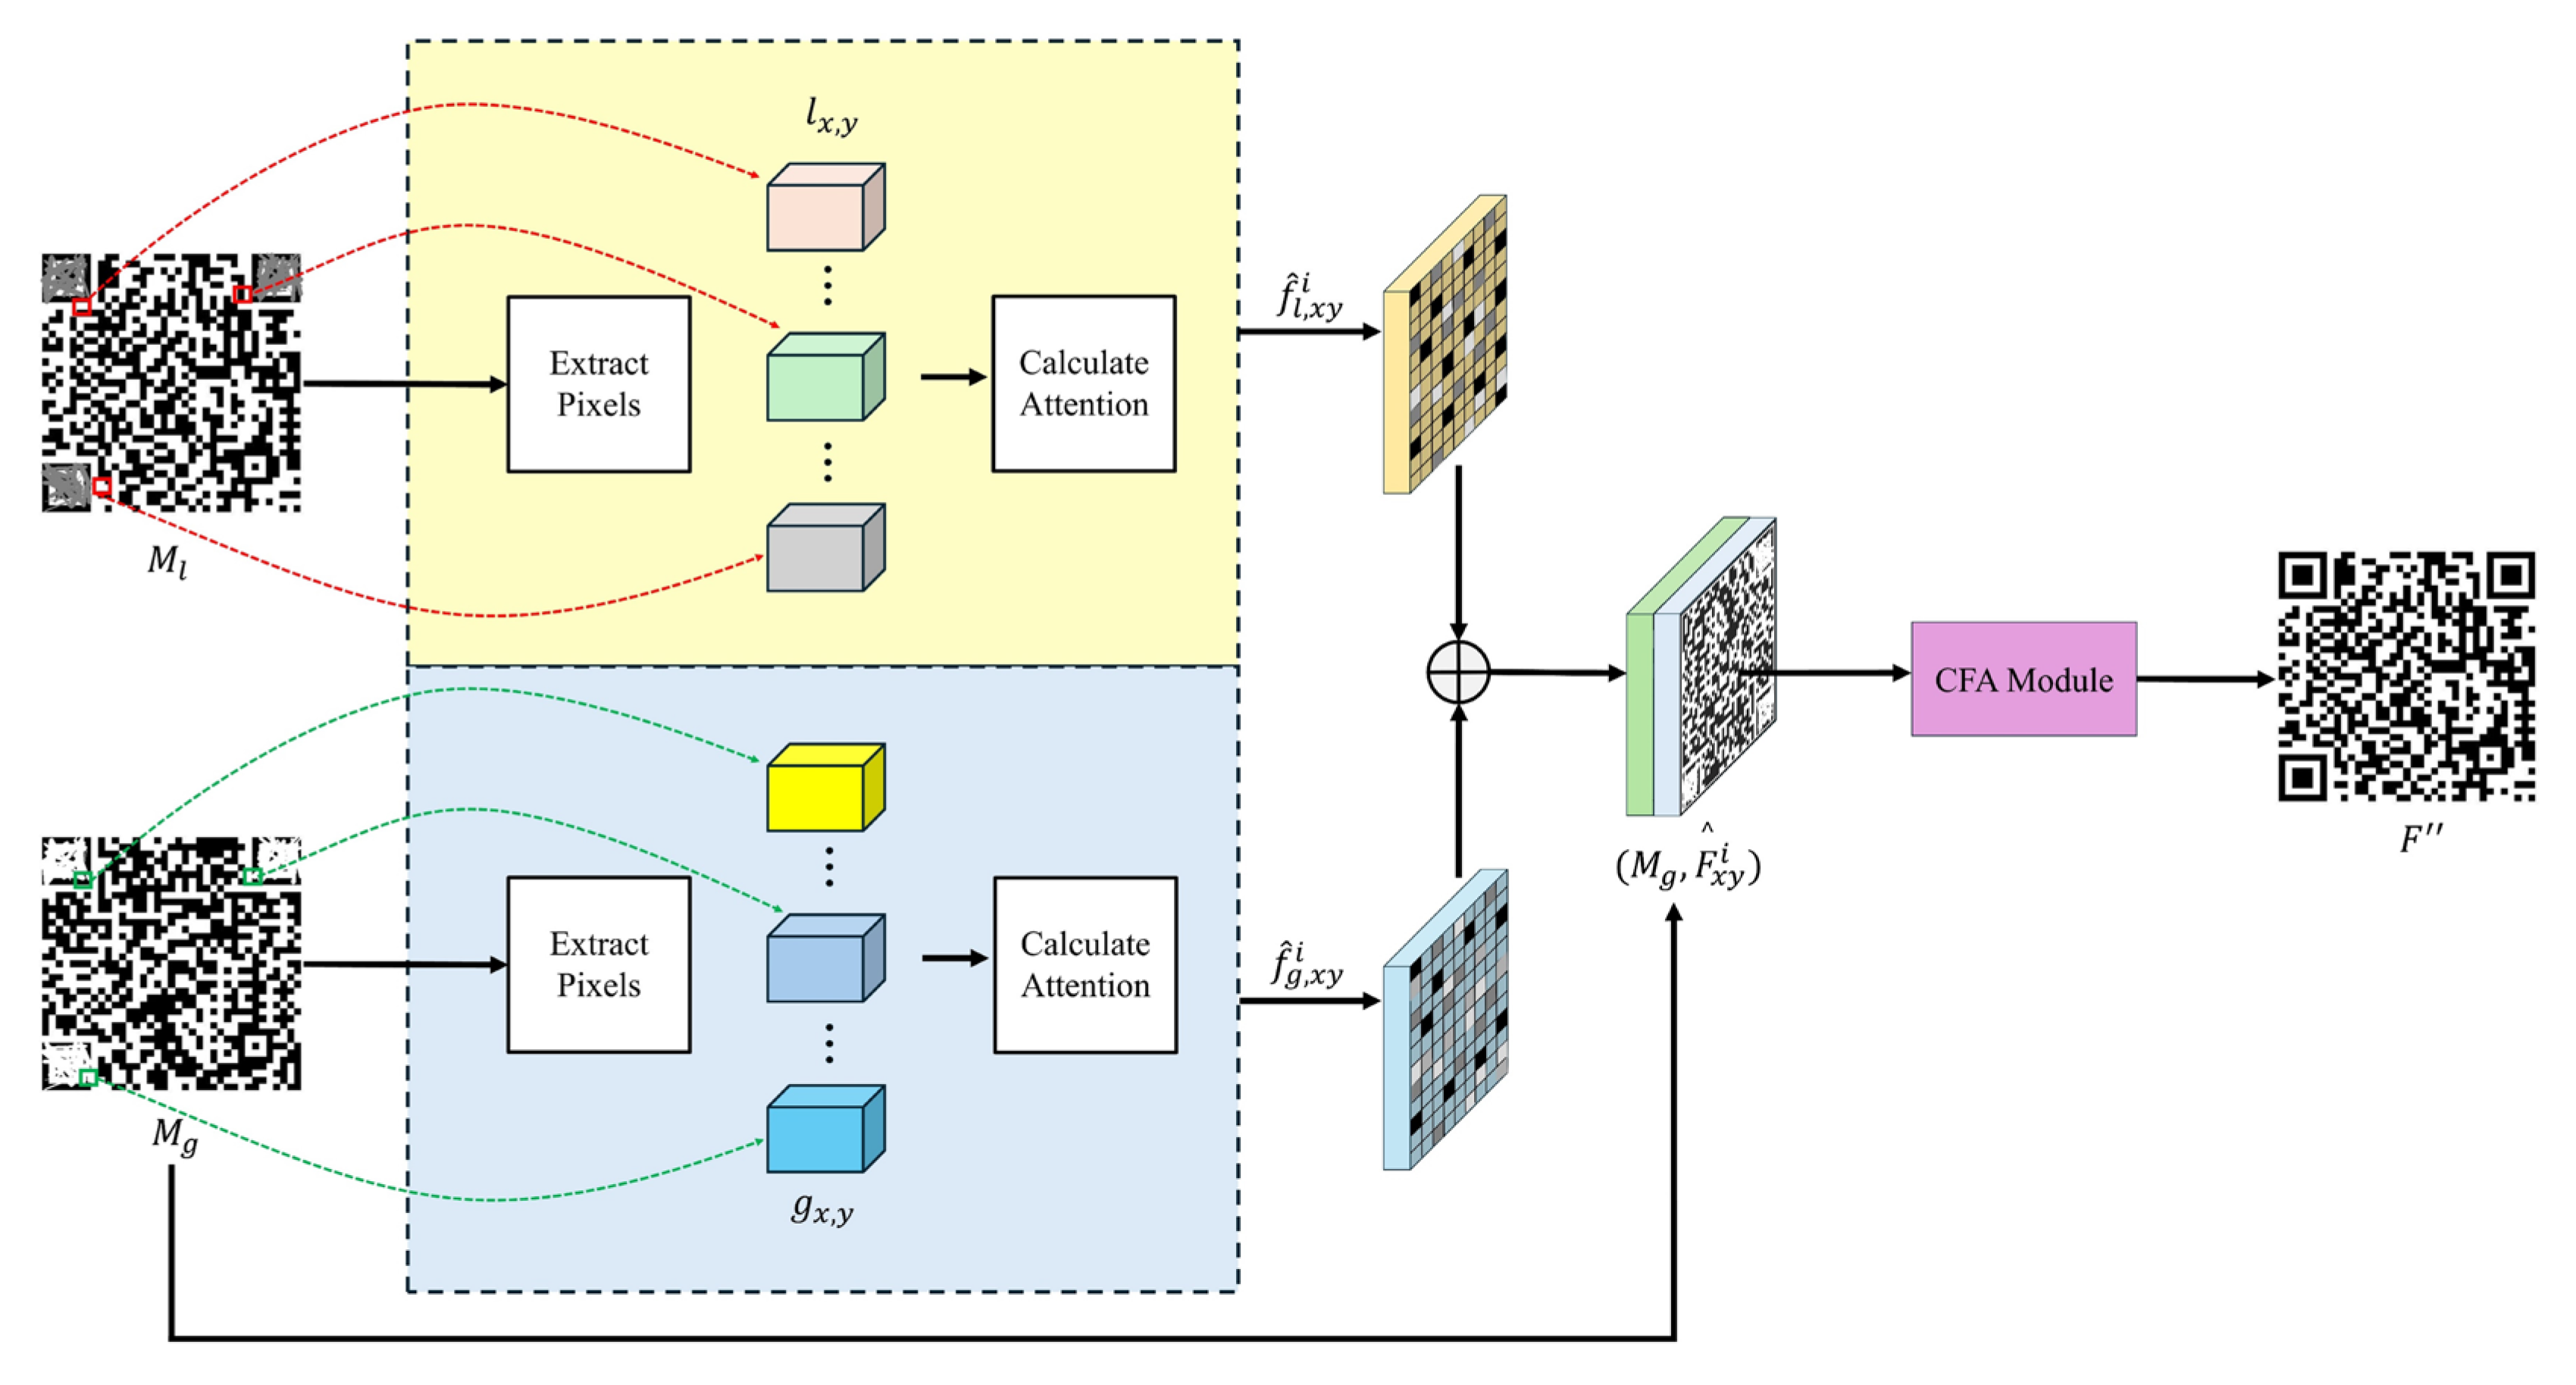
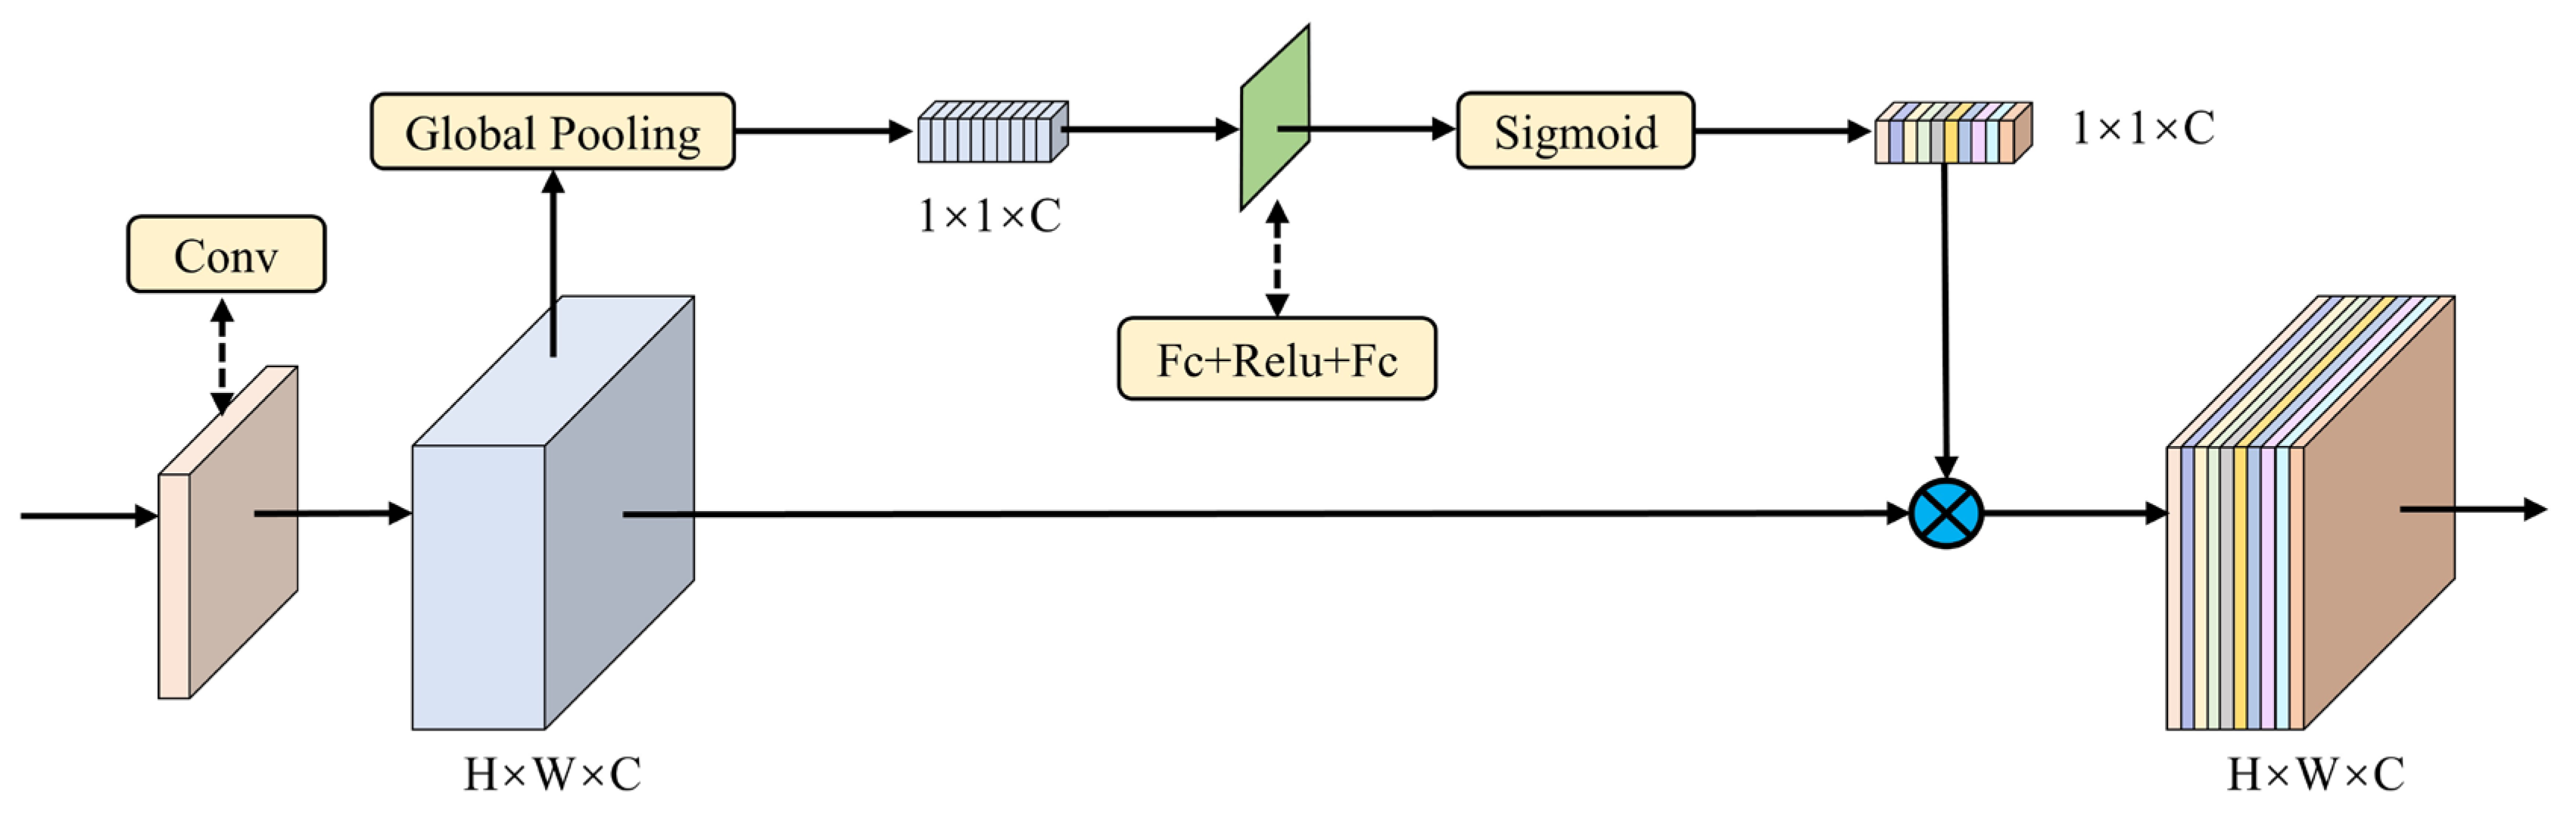
A U-Net-like architecture, which is widely used in image inpainting models to effectively handle missing data reconstruction, is employed as the backbone of the generator block in iterative repair network. In this block, an encoder–decoder structure with skip connections is deployed to minimize information loss. These connections directly relay features from the intermediate layers of the encoder to the decoder, which facilitates detailed and structural restoration. The encoder that comprises convolutional layers extracts key features from damaged barcodes and reduces spatial dimensions. In particular, it includes partial convolutional layers aimed at damaged regions and performs convolutions only on intact pixels, which thus enables the model to deduce and repair missing data. The decoder stage of the block integrates the SFA mechanism into its fourth-to-last layers, and can enhances the accuracy of the restoration by utilizing both global and local attention maps.
Partial convolutions use a mask to distinguish between damaged and intact areas and focus convolutions on the latter to ensure that restoration is based on valid pixels, which thereby avoids erroneous data from the damaged sections. The convolution operation is defined as:
F c o n v = W T ( X i n M i n ) ,
where X i n   is the input feature map; M i n   represents the corresponding binary mask map; W T stands for the weight of the convolution kernel; and denotes element-wise multiplication.
After the partial convolution, the output feature map F o u t   is normalized to ensure the use of only the features from valid regions for subsequent calculations. The normalization is conducted using the following formula:
F o u t = F c o n v s u m ( M ) + b .
In the formula, s u m ( M ) denotes the count of valid pixels in the masked area. b represents the bias term, which adjusts the baseline of the normalization and ensures stability in the output even when the count of valid pixels is low. If the masked area is empty (all pixels masked), the output feature value at that location is set to zero.
After each partial convolution, the mask is updated to indicate the restored areas. This ensures that the network incrementally focuses on unrepaired areas, which expands the scope of restoration. The updated mask is expressed as follows:
M n e w = 1 i f s u m M > 0 0 o t h e r w i s e .
According to this formula, post-partial convolution positions in M , with any non-zero value (indicating unmasked valid pixels), become 1 (valid) in M n e w . If all M values are zero (indicating fully masked invalid pixels), that position in M n e w becomes 0 (invalid). This strategy prompts the network to incrementally focus on yet-to-be-repaired areas until the complete restoration of the damaged zone.
The network employs an iterative strategy to further improve reconstruction quality. Each iteration infers the features of target areas via the encoder–decoder structure and feeds them into the subsequent cycle. This approach allows the updated masks and inferred features to enter directly into the next iteration, which streamlines the process without additional steps.
After multiple iterations, an adaptive feature merging strategy is applied once the feature map is detailed enough or the set iteration number is reached. This approach combines features from various iterations, which prevents gradient vanishing and retains valuable early iteration information. The process is as follows:
The pixel values of the output feature map are computed solely from filled feature maps at each specific location. Specifically, the value of the merged output feature map F at ( x , y , z ) can have the following definition: if F i is the feature map generated by the feature inference module in the ith iteration, f x , y , z is the value at the position ( x , y , z ) in the feature map F , and M i is the binary mask corresponding to F i :
f ¯ x , y , z = i = 1 N f x , y , z i i = 1 N m x , y , z i ,
where N represents the total number of feature maps produced through iterations. This method enables the network to merge variable numbers of feature maps, which removes limits on iterations and improves its ability to fill extensive voids. Through repeated iterations, the 2D barcode reconstruction network consistently yields high-quality outputs.

2.2. SFA Mechanism

Traditional repair methods often rely solely on scanning background textures to fill in missing features in the context of 2D barcode damage restoration, where QR code images exhibit significant structural features and varying degrees of damage. This may not adequately address the unique structural aspects of 2D barcodes. To tackle this issue, an innovative SFA module, aimed at enhancing the repair of specific encoding structures inherent to QR codes rather than merely restoring background textures, was introduced in this article. As illustrated in Figure 2, this module utilizes a dual-attention system comprising a global attention map ( M g ) and a local one ( M l ), which focuses on areas outside the typical mask coverage. M l is specifically designed to refine detailed textures and structural elements within the masked region, which compensates for potential errors in M g caused by information loss. This synergy between M g and M l not only guarantees the accuracy of structural detail restoration but also significantly boosts decoding success rates by repairing contaminated sections more effectively than conventional methods. Therefore, the SFA module presents a theoretical advantage in maintaining the integrity of QR code structural features, which ultimately facilitates better restoration outcomes. The module details are as follows:
In the designed SFA module, a similarity-based metric method is adopted to accurately evaluate the consistency between global attention maps M g i and local ones M l i across different iteration cycles. The similarity between global attention maps is defined as follows:
s i m g , x y , x y i = f g , x y f g , x y f g , x y f g , x y .
Similarly, the similarity between local attention maps is defined as:
s i m l , x y , x y i = f l , x y f l , x y f l , x y f l , x y ,
where “·” denotes the dot product of vectors, and “‖·‖” represents the Euclidean norm of a vector.
To enhance the reconstruction quality of feature maps, a strategy is introduced to smooth attention scores. This strategy involves calculating the similarity between neighboring target pixels and then averaging these similarities to smooth original attention scores. To be specific, the formula for smoothing global attention scores is as follows:
s i m g i x y , x y = p , q N k s i m g i x + p y + q x y N k .
The smoothing of local attention scores is defined as follows:
s i m l i x y , x y = p , q N k s i m l i x + p y + q x y N k ,
where N k represents the k × k neighborhood centered around ( x , y ) . N k stands for the total number of elements within this neighborhood and acts as the divisor for the smoothing operation. p and q indicate the offsets within the neighboring area surrounding the target pixel ( x , y ) . Specifically, they traverse a k × k neighborhood around the target pixel, where p , q k , · · · , k .
Then, the softmax function is applied to compute the normalized scores for the pixels at ( x , y ) . Resulting scores are denoted as s . The formulas for global and local attention maps are given as follows:
s g , x y , x y = s o f t m a x ( λ ( s i m g ) x y , x y ) ,
s l , x y , x y = s o f t m a x ( λ ( s i m l ) x y , x y ) ,
where λ acts as a scaling factor used to adjust similarity scores before the application of the softmax function, which ensures that the sum of scores s at all possible positions ( x , y ) equals 1.
Attention scores are subsequently used for reconstructing the feature map. In specific terms, the new feature map is calculated by taking a weighted sum of features at each position with their corresponding normalized scores. This can be separately represented for both global and local feature maps:
f ^ g , x y i = x = 1 W y = 1 H s g , x y x y f g , x , y i ,
f ^ l , x y i = x = 1 W y = 1 H s l , x y x y f l , x , y i ,
where W and H denote the width and height of the image, respectively. This method constructs new feature maps by calculating a weighted sum of features at each position and is weighted by the scores obtained through the softmax function.
Subsequently, the global feature map f ^ g , x y i and the local one f ^ l , x y i are integrated through a merging process. The resultant feature map can be derived from a weighted summation. The explicit formula for merging can be expressed as follows:
F ^ x y i = α f ^ g , x y i + ( 1 α ) f ^ l , x y i ,
where α is a weight parameter between 0 and 1 and balances the contributions of global and local feature maps in the final fused feature map. This fusion strategy allows the integration of the advantages of both global perspectives and local details, which further optimizes the repair effect of the 2D barcode.
Following the reconstruction of the feature map, the input feature M g   and the newly formed feature map F ^ x y i are merged and subsequently forwarded to a convolution layer:
F = ϕ ( C o n c a t [ F ^ x y i , M g ] ) ,
where “ C o n c a t [ ] ” refers to the act of connecting the reconstructed feature map F ^ x y i   with the initial global feature map M g . Additionally, ϕ denotes the transformation applied by a convolution layer.
Through concatenation, global and local attention features with original features are integrated into a unified feature map. These composite feature maps are subsequently processed by further convolution operations in the network. However, the relevance of attention feature maps can differ across iteration stages, which emphasizes the need for an adaptive fusion process to balance original and attention features effectively. Consequently, the channel feature aggregation (CFA) module is introduced for adaptive channel reweighting under the inspiration of the Squeeze Excitation (SE) module [26]. As depicted in Figure 3, the squeeze operation employs global average pooling, which compresses feature maps through spatial dimensions and summarizes important features across all channels to facilitate adaptive reweighting that enhances the representation of critical features:
z c = 1 H × W i = 1 H j = 1 W F c i j ,
where H and W represent the height and width of the feature map, respectively, and F c i j stands for the feature value at channel c and position   ( i , j ) .
Subsequently, a simple multilayer perceptron (MLP) extracts and transforms information from the compressed feature vector z c to generate a channel-specific weight vector w c . This step involves operations across two fully connected layers, represented as follows:
w c = σ ( W 2 ψ ( W 1 Z + b 1 ) + b 2 ) ,
where ψ and σ denote ReLU and Sigmoid activation functions, respectively; W 1 and W 2 are weights for the two fully connected layers, with b 1 and b 2 as their respective bias terms.
Finally, the weight vector w c is applied to each channel of the original feature map F via element-wise multiplication. This step is described by the following formula:
F = F w c ,
where F represents the input feature map; w c stands for the adaptive weight vector for each channel; and signifies element-wise multiplication. In this way, the features of each channel are weighted based on their importance to the final task, which thus enhances the representational ability of the feature map and facilitates more effective image restoration.

2.3. Loss Function

This section aligns with the proposed methodology and highlights the importance of blending the global and local features of 2D barcode structures. A comprehensive set of loss functions is carefully developed to enhance structural integrity beyond mere pixel-level accuracy. This ensemble, which is composed of perceptual, style, total variation (TV), and barcode-specific structural losses, aims to enhance both global and local coherence. This methodological framework enhances the structural and textural understanding of the model and supports the precise reconstruction of 2D barcode images via an innovative multi-task loss function approach.
Perceptual Loss: This loss ensures that the high-level structural information of the generated image aligns with the original by inputting the predicted image F p r e d and the target image F g t into a pre-trained VGG-16 network and comparing their feature maps instead of comparing pixel values directly. The perceptual loss L p is calculated as follows:
L p = i = 1 N 1 H i W i C i | ϕ g t p o o l i ϕ p r e d p o o l i | 1 ,
where ϕ g t p o o l i   and ϕ p r e d   p o o l i   denote the original and predicted feature maps from the ith pooling layer of the fixed VGG-16, respectively. H i , W i , and C i indicate the height, width, and channel count of the ith feature map, respectively.
Style Loss: To preserve color and pattern consistency, style loss compares the style feature maps between the generated and real images. These style feature maps are derived from the Gram matrices of the respective feature maps at each layer. The Gram matrix ϕ p o o l i s t y l e is computed as the product of the feature map ϕ p o o l i and its transpose ϕ p o o l i T . This calculation involves comparing the feature maps and their Gram matrices:
ϕ p o o l i s t y l e = ϕ p o o l i ϕ p o o l i T ,
where ϕ p o o l i denotes feature maps from the ith pooling layer in VGG-16. The style loss L s then quantifies the difference between the Gram matrices of the predicted and real images, emphasizing the preservation of textural and stylistic elements across layers:
L s = i = 1 N 1 C i C i | 1 H i W i C i ( ϕ p o o l i s t y l e g t ϕ p o o l i s t y l e p r e d ) | 1 .
The total variation loss L t is applied as a smoothing penalty to region P, which undergoes a 1-pixel dilation aimed at diminishing noise and artifacts in the synthesized image. P represents the missing area of the damaged image [35]:
L t = ( i , j ) P , ( i , j + 1 ) P F p r e d ( i , j + 1 ) F p r e d ( i , j ) 1 + ( i , j ) P , ( i + 1 , j ) P F p r e d ( i + 1 , j ) F p r e d ( i , j ) 1 .
where F p r e d represents the predicted feature maps, while i and j denote the coordinates of the pixels within this damaged area.
As depicted in Figure 4, QR codes display distinct structural elements, with essential position markers typically at the three corners. Each marker is composed of a 7 × 7 outer black square, a 5 × 5 inner white square, and a central 3 × 3 black block, all vital for QR identification. To assess QR code repair precision, we developed a loss function focused on restoring this particular feature. This loss function calculates the pixel discrepancies along the markers’ central line between the repaired and ideal patterns, ensuring that the restored QR accurately reflects the original structure. The loss function is defined as follows:
L Q R = 1 N i = 1 N P g t i P p r e d i 2 ,
where   P g t i and P p r e d i denote the values of the ith pixel on the centerline of the position marker in the actual and predicted feature maps, respectively, with N being the total number of pixels on the centerline. The minimization of this loss function can enhance the accuracy of position markers during the QR code repair process.
Additionally, the proposed model incorporates L v and L h , which separately calculate the L1 difference for the unmasked and masked areas, respectively. Hence, the combination of various loss functions can be expressed as:
L t o t a l = λ p L p + λ s L s + λ t L t + λ Q R L Q R + λ h L h + λ v L v
where λ coefficients determine the relative importance of each loss function, balancing their effects for image restoration. Their specific values are provided in Section 3.3.
The integration of multiple loss functions leads to producing high-quality QR code images. These loss functions work together, which enhances the overall performance of QR code image restoration.

3. Experimental Results and Analysis

To evaluate the effectiveness of the model in repairing damaged 2D barcodes and facilitate equitable comparisons with other algorithms, a custom dataset comprising original QR codes and versions with irregular masks in the locator areas was compiled.

3.1. Original 2D Barcode Images

A specialized dataset was developed in this study to assess the effectiveness of the model in repairing structurally damaged QR codes like those with obscured locators. Unlike the dataset of Zheng et al. [20], this specialized dataset excludes QR codes of varying error correction levels and presumes negligible impact from such levels under structural damage and occlusion. It is made up of QR codes with random combinations of letters, numbers, and symbols, which mirrors real-world diversity. In addition, it includes different versions of QR and PDF417 codes, which ensures the versatility and robustness of the model across various styles and complexities. Python’s qrcode library was used to generate 18,000 original 2D barcode images. Moreover, 16,000 images were assigned to the training set for benchmarking algorithm performance, with 2000 images from each QR code version (1 to 6) and 4000 images of PDF417 codes. The remaining 2000 images served as the test set, including 500 images of QR codes from each of versions 5 and 6, and 1000 images of PDF417 codes. Training and testing sets were both standardized to a 256 × 256 resolution, to reduce potential performance impacts from varying locator symbol proportions across QR code versions. Damaged QR codes were generated by overlaying QR code images with mask images for testing, which facilitated the evaluation of the generalizability and robustness of repair algorithms beyond training data. The testing set included varying levels of damage to thoroughly assess the repair capabilities of the model across different locator damage scenarios.

3.2. Irregular Mask of the Locator Region

To simulate structural damage in the locator areas of QR codes and the identification areas of PDF417, distinct masks were created for a variety of QR code versions and categorized by area ratios: 0.15–0.3, 0.3–0.45, 0.45–0.6, 0.6–0.75, and 0.75–0.9. Each category consists of 500 masks featuring diverse and random patterns to ensure variability. This setup realistically simulates various degrees of locator damage and offers comprehensive testing scenarios to assess the performance of the repair model across different damage extents. The dataset contains QR images of varying damage degrees and corresponding irregular masks to simulate structural damage, which specifically targets locator area damage for the evaluation of model performance.

3.3. Training Parameter Settings

The Adam optimizer with a batch size of 6 was employed to train the model, and only the generator network was updated as the discriminator did not require an optimizer. Initially, the model was trained with a learning rate of 1 × 10⁻⁴. For hyperparameter settings, the following weights were applied: 0.1, 120, 0.05, 100, 600, and 0.05 for TV, style, perceptual, valid, hole, and QR locator losses, respectively. All experiments were conducted using Python on an Ubuntu 20.04 system, developed by Canonical Ltd. (London, UK), equipped with an i5-12490F CPU and a 12 G NVIDIA 4070 GPU.

3.4. Evaluation Metrics

The fixed structure area of the two-dimensional code is shown in Figure 5. To thoroughly evaluate the performance of 2D barcode repair methods, metrics such as decoding rate (DR), peak signal-to-noise ratio (PSNR), structural similarity index (SSIM), and L1 distance were adopted as assessment standards. These metrics collectively gauge the effectiveness and accuracy of the repair model from diverse dimensions. Specifically, DR measures the decode ability of the repaired codes; PSNR and SSIM evaluate the similarity of image quality to the original; and L1 distance quantifies the accuracy of pixel-level restoration.

3.5. Comparison Models

To comprehensively assess the 2D barcode repair method, it was compared against three advanced algorithms: attention overlap transition-GAN (AOT-GAN) [36], causal-based time series domain generalization (CTSDG) [37], and LGNet [38]. These algorithms are renowned for their effectiveness in image restoration, especially in addressing extensive damage and complex structures. AOT-GAN is specialized in repairing large free-form missing areas and exhibits superior texture synthesis capabilities. As a dual-stream network, CTSDG achieves a balance between structural and textural restoration, which improves overall coherence. LGNet enhances repair quality across diverse scenarios through the integration of local and global refinement networks, which effectively restores both detail and extensive structures. These methods stand out in image restoration, and their application suggests potential adaptability and effectiveness in 2D barcode repair projects.

3.6. Experimental Analysis

To validate the effectiveness of the model, the specified test dataset was utilized to conduct a quantitative comparison against three benchmark models: AOT-GAN, CTSDG, and LGNet. The experimental outcomes shown in Table 1 indicate a decline in recognition rates for certain algorithms with the increase of hole rates in QR codes in the test dataset. Additionally, variations in metrics such as L1, SSIM, and PSNR further confirm the challenging nature of the dataset.
As indicated in Table 1 and Table 2, the proposed model demonstrates a recognition rate of 100% for QR codes across mask ratios from 0.15 to 0.9, and significantly outperforms existing advanced algorithms. Remarkably, the recognition rate of LGNet shows a significant decline in the mask ratio range of 75% to 90%. This is unlike the proposed model, which demonstrates superior robustness and maintains accuracy even at high mask ratios. For PDF417 codes, the model still performs exceptionally, with a slow decrease from 99.6% to 98.2% although the recognition rates of all models decline with increasing mask ratios; this performance significantly outshines other models at high mask ratios.
In terms of image restoration quality, the proposed method underperforms LGNet in two key metrics: PSNR and SSIM. Regarding the L1 metric, whose better performance is indicated by lower values, the proposed method demonstrates exceptional resilience across varying levels of occlusion. To be specific, the L1 value of 0.0069 of the model significantly outperforms the 0.0511 of AOT at an occlusion ratio of 15–30%, which indicates the superior effectiveness of the model in handling partial occlusions. Nevertheless, it is slightly less effective than the 0.0028 of CTSDG and comparable to the 0.0065 of LGNet. It is worth noting that the L1 value of the model marginally rises to 0.0099 with the increase of occlusion to 75–90%. This is significantly better than AOT, which increases to 0.0571 and demonstrates a marked improvement over the increase of CTSDG and LGNet to 0.0147 and 0.0159, respectively. This highlights the remarkable consistency and robustness of the proposed model in preserving image quality across various challenges, which demonstrates its superior restoration ability, especially in cases of significant occlusion.
Although LGNet has impressive PSNR and SSIM scores, the proposed method stands out in practical 2D barcode decoding, particularly due to its sustained high DRs even under severe occlusion. This underscores the superior performance of the proposed algorithm in handling severely corrupted QR codes, particularly in scenarios with medium and low occlusion ratios.
To objectively assess the 2D barcode reconstruction capabilities of different models, a qualitative analysis was performed, which illustrated the recovery results of each model under high occlusion rates with images. As illustrated in Figure 6 and Figure 7, AOT-GAN and CTSDG exhibit a clear bias towards structure reduction in the locator region during 2D barcode image restoration. In contrast, LGNet and the proposed model demonstrate superior recovery outcomes, particularly in the precise restoration of locator regions.
Furthermore, the recovery effectiveness of the proposed model was assessed under different mask ratios (15–30%, 45–60%, and 75–90%). The results demonstrate that the proposed model proficiently restores the edges and structures of QR and PDF417 codes across different occlusion levels despite significant information loss resulting from increased masking, which ensures successful QR code recognition. AOT-GAN exhibits significant smudging in repairing 2D barcodes at high mask ratios. Meanwhile, CTSDG displays commendable color accuracy but defects in structural restoration. LGNet achieves acceptable restoration outcomes on the whole but struggles with precise barcode texture detail rendering. This confirms the robustness and efficiency of the proposed model in repairing damaged QR code structures.
In summary, the qualitative analysis reveals that the proposed model substantially surpasses existing comparative models in restoring 2D barcodes with varying levels of damage, particularly in precisely recovering the localization areas of 2D barcodes. Additionally, quantitative analysis further underscores the advantages of the proposed model over other models, particularly highlighting its exceptional ability to manage severely damaged cases.

4. Discussion

In this part, the real-world applications and consequences of the proposed approach to 2D barcode repair are deeply explored. Notwithstanding the significant achievements made by this research in 2D barcode repair, some aspects still require enhancement and additional investigation.
  • Practical applications: The proposed 2D barcode restoration method can significantly improve the readability and visual quality of damaged codes, which is critical for industries like retail and logistics. This leads to smoother transactions and better inventory management. Furthermore, considering the potential damage to barcodes carrying electronic device information, this method could resolve barcode detection challenges in electronics manufacturing.
  • Future directions in 2D barcode repair: In this research, the focus was put on repairing structural damage in standard 2D barcodes. However, the varied uses of 2D codes call for the study of specific types like data matrix. Future studies should explore these variants using algorithms like transformers for better data section repair. This aligns with the goal of enhancing structural integrity and developing repair methods for diverse codes used across different industries.
  • Consideration of external factors: In real-world environments, external factors such as lighting conditions, blurriness, and skew can significantly affect the restoration results of 2D barcodes. This study acknowledges these challenges and suggests incorporating image enhancement and preprocessing techniques to mitigate their effects. Future research should pay attention to enhancing model robustness against these variables, which ensures the practical applicability of the proposed 2D barcode restoration method in diverse conditions. Additionally, collecting electronic device-specific barcode damage datasets will improve our repair techniques, boosting the robustness and practical use of the restoration method in electronics.

5. Conclusions

In this paper, a network employing recurrent feature reasoning and SFA mechanisms was introduced to address structural damage in PDF417 and QR codes. The cyclic feature repair mechanism iteratively leverages damaged code information, which enhances the capability of the model to identify and repair damaged areas. The SFA mechanism concentrates on the critical structural elements of 2D barcodes and bolsters repair quality and precision by prioritizing different features. Experimental outcomes demonstrate that the model excels in repairing damaged images and has good robustness, which allows it to maintain 100% recognition rates for QR codes and 98.2% for PDF417 even under extensive structural damage. Compared with various mainstream image processing models, the model introduced in this study is distinctly proficient in restoring the structural integrity of 2D barcodes.

Author Contributions

The main contributions of J.Y. and J.C. were the creation of the main ideas and performance evaluation through extensive simulations. J.Y. and J.C. contributed to the manuscript preparation and designed the theoretical analysis. All authors have read and agreed to the published version of the manuscript.

Funding

This work was supported in part by the Natural Science Foundation of Xiamen, China, under Grant 3502Z20227218, and in part by the National Natural Science Foundation of China under Grant 61701422.

Data Availability Statement

Data underlying the results presented in this paper are not publicly available at this time but may be obtained from the authors upon reasonable request.

Conflicts of Interest

The authors declare no conflicts of interest.

References

  1. Czuszynski, K.; Ruminski, J. Interaction with medical data using QR-codes. In Proceedings of the 2014 7th International Conference on Human System Interactions (HSI), Lisbon, Portugal, 16–18 June 2014; IEEE: Piscataway, NJ, USA; 2014; pp. 182–187. [Google Scholar] [CrossRef]
  2. Singh, S. QR code analysis. Int. J. Adv. Res. Comput. Sci. Softw. Eng. 2016, 6, 89–92. [Google Scholar]
  3. Bai, H.; Zhou, G.; Hu, Y.; Sun, A.; Xu, X.; Liu, X.; Lu, C. Traceability technologies for farm animals and their products in China. Food Control 2017, 79, 35–43. [Google Scholar] [CrossRef]
  4. Petrova, K.; Romaniello, A.; Medlin, B.D.; Vannoy, S.A. QR codes advantages and dangers. In Proceedings of the 13th International Joint Conference on e-Business and Telecommunications, Lisbon, Portugal, 26–28 July 2016; SCITEPRESS—Science and Technology Publications: Setbal, Portugal, 2016; pp. 112–115. [Google Scholar] [CrossRef]
  5. Xiong, J.; Zhou, L. QR code detection and recognition in industrial production environment based on SSD and image processing. In Proceedings of the International Conference on Algorithms, High Performance Computing, and Artificial Intelligence (AHPCAI 2023), Yinchuan, China,, 18–19 August 2023; SPIE: Bellingham, DC, USA, 2023; pp. 640–644. [Google Scholar] [CrossRef]
  6. Jin, J.; Wang, K.; Wang, W. Research on correction and recognition of QR code on cylinder. In Proceedings of the 2021 IEEE 4th Advanced Information Management, Communicates, Electronic and Automation Control Conference (IMCEC), Chongqing, China, 18–20 June 2021; IEEE: Piscataway, NJ, USA, 2021; pp. 1485–1489. [Google Scholar] [CrossRef]
  7. Tribak, H.; Zaz, Y. QR code recognition based on principal components analysis method. Int. J. Adv. Comput. Sci. Appl. 2017, 8, 241–248. [Google Scholar] [CrossRef]
  8. Cao, Z.; Li, J.; Hu, B. Robust hazy QR code recognition based on dehazing and improved adaptive thresholding method. In Proceedings of the 2019 IEEE 15th International Conference on Automation Science and Engineering (CASE), Vancouver, BC, Canada, 22–26 August 2019; IEEE: Piscataway, NJ, USA, 2019; pp. 1112–1117. [Google Scholar] [CrossRef]
  9. Belussi, L.F.F.; Hirata, N.S.T. Fast component-based QR code detection in arbitrarily acquired images. J. Math. Imaging Vis. 2013, 45, 277–292. [Google Scholar] [CrossRef]
  10. Chen, R.; Zheng, Z.; Pan, J.; Yu, Y.; Zhao, H.; Ren, J. Fast blind deblurring of QR code images based on adaptive scale control. Mob. Netw. Appl. 2021, 26, 2472–2487. [Google Scholar] [CrossRef]
  11. Ohbuchi, E.; Hanaizumi, H.; Hock, L.A. Barcode readers using the camera device in mobile phones. In Proceedings of the 2004 International Conference on Cyberworlds, Tokyo, Japan, 18–20 November 2004; IEEE: Piscataway, NJ, USA, 2004; pp. 260–265. [Google Scholar] [CrossRef]
  12. Ciążyński, K.; Fabijańska, A. Detection of QR-codes in digital images based on histogram similarity. Image Process. Commun. 2015, 20, 41–48. [Google Scholar] [CrossRef]
  13. Gaur, P.; Tiwari, S. Recognition of 2D barcode images using edge detection and morphological operation. Int. J. Comput. Sci. Mob. Comput. 2014, 3, 1277–1282. [Google Scholar]
  14. Lopez-Rincon, O.; Starostenko, O.; Alarcon-Aquino, V.; Galan-Hernandez, J.C. Binary large object-based approach for QR code detection in uncontrolled environments. J. Electr. Comput. Eng. 2017, 2017, 4613628. [Google Scholar] [CrossRef]
  15. Yi, J.; Xiao, Y. Efficient localization of multitype barcodes in high-resolution images. Math. Probl. Eng. 2022, 2022, 5256124. [Google Scholar] [CrossRef]
  16. Chen, R.; Huang, H.; Yu, Y.; Ren, J.; Wang, P.; Zhao, H.; Lu, X. Rapid detection of multi-QR codes based on multistage stepwise discrimination and a compressed MobileNet. IEEE Internet Things J. 2023, 10, 15966–15979. [Google Scholar] [CrossRef]
  17. Zhang, J.; Min, X.; Jia, J.; Zhu, Z.; Wang, J.; Zhai, G. Fine localization and distortion resistant detection of multi-class barcode in complex environments. Multimed. Tools Appl. 2021, 80, 16153–16172. [Google Scholar] [CrossRef]
  18. Jia, J.; Zhai, G.; Ren, P.; Zhang, J.; Gao, Z.; Min, X.; Yang, X. Tiny-BDN: An efficient and compact barcode detection network. IEEE J. Sel. Top. Signal Process. 2020, 14, 688–699. [Google Scholar] [CrossRef]
  19. Chen, R.; Zheng, Z.; Yu, Y.; Zhao, H.; Ren, J.; Tan, H.-Z. Fast restoration for out-of-focus blurred images of QR code with edge prior information via image sensing. IEEE Sens. J. 2021, 21, 18222–18236. [Google Scholar] [CrossRef]
  20. Zheng, J.; Zhao, R.; Lin, Z.; Liu, S.; Zhu, R.; Zhang, Z.; Fu, Y.; Lu, J. EHFP-GAN: Edge-enhanced hierarchical feature pyramid network for damaged QR code reconstruction. Mathematics 2023, 11, 4349. [Google Scholar] [CrossRef]
  21. Pathak, D.; Krahenbuhl, P.; Donahue, J.; Darrell, T.; Efros, A.A. Context encoders: Feature learning by inpainting. In Proceedings of the 2016 IEEE Conference on Computer Vision and Pattern Recognition (CVPR), Las Vegas, NV, USA, 27–30 June 2016; IEEE: Piscataway, NJ, USA, 2016; pp. 2536–2544. [Google Scholar] [CrossRef]
  22. Isola, P.; Zhu, J.-Y.; Zhou, T.; Efros, A.A. Image-to-image translation with conditional adversarial networks. In Proceedings of the 2017 IEEE Conference on Computer Vision and Pattern Recognition (CVPR), Honolulu, HI, USA, 21–26 July 2017; IEEE: Piscataway, NJ, USA, 2017; pp. 5967–5976. [Google Scholar] [CrossRef]
  23. Zhang, X.; Wang, X.; Shi, C.; Yan, Z.; Li, X.; Kong, B.; Lyu, S.; Zhu, B.; Lv, J.; Yin, Y.; et al. DE-GAN: Domain embedded GAN for high quality face image inpainting. Pattern Recognit. 2022, 124, 108415. [Google Scholar] [CrossRef]
  24. Jo, Y.; Park, J. SC-FEGAN: Face editing generative adversarial network with user’s sketch and color. In Proceedings of the 2019 IEEE/CVF International Conference on Computer Vision (ICCV), Seoul, Republic of Korea, 27 October–2 November 2019; IEEE: Piscataway, NJ, USA, 2019; pp. 1745–1753. [Google Scholar] [CrossRef]
  25. Liu, H.; Wan, Z.; Huang, W.; Song, Y.; Han, X.; Liao, J. PD-GAN: Probabilistic diverse GAN for image inpainting. In Proceedings of the 2021 IEEE/CVF Conference on Computer Vision and Pattern Recognition (CVPR), Nashville, TN, USA, 20–25 June 2021; IEEE: Piscataway, NJ, USA, 2021; pp. 9371–9381. [Google Scholar] [CrossRef]
  26. Hu, J.; Shen, L.; Sun, G. Squeeze-and-excitation networks. In Proceedings of the 2018 IEEE/CVF Conference on Computer Vision and Pattern Recognition (CVPR), Salt Lake City, UT, USA, 18–23 June 2018; IEEE: Piscataway, NJ, USA, 2018; pp. 7132–7141. [Google Scholar] [CrossRef]
  27. Yang, C.; Lu, X.; Lin, Z.; Shechtman, E.; Wang, O.; Li, H. High-resolution image inpainting using multi-scale neural patch synthesis. In Proceedings of the 2017 IEEE Conference on Computer Vision and Pattern Recognition (CVPR), Honolulu, HI, USA, 21–26 July 2017; IEEE: Piscataway, NJ, USA, 2017; pp. 6721–6729. [Google Scholar] [CrossRef]
  28. Yan, Z.; Li, X.; Li, M.; Zuo, W.; Shan, S. Shift-Net: Image inpainting via deep feature rearrangement. In Proceedings of the Computer Vision—ECCV 2018, Munich, Germany, 8–14 September 2018; Ferrari, V., Hebert, M., Sminchisescu, C., Weiss, Y., Eds.; Springer: Berlin/Heidelberg, Germany, 2018; pp. 3–19. [Google Scholar] [CrossRef]
  29. Wang, N.; Ma, S.; Li, J.; Zhang, Y.; Zhang, L. Multistage attention network for image inpainting. Pattern Recognit. 2020, 106, 107448. [Google Scholar] [CrossRef]
  30. Yan, S.; Zhang, X. PCNet: Partial convolution attention mechanism for image inpainting. Int. J. Comput. Appl. 2022, 44, 738–745. [Google Scholar] [CrossRef]
  31. Ran, C.; Li, X.; Yang, F. Multi-step structure image inpainting model with attention mechanism. Sensors 2023, 23, 2316. [Google Scholar] [CrossRef]
  32. Li, P.; Chen, Y. Research into an image inpainting algorithm via multilevel attention progression mechanism. Math. Probl. Eng. 2022, 2022, 8508702. [Google Scholar] [CrossRef]
  33. Liu, J.; Gong, M.; Tang, Z.; Qin, A.K.; Li, H.; Jiang, F. Deep Image Inpainting with Enhanced Normalization and Contextual Attention. IEEE Trans. Circuits Syst. Video Technol. 2022, 32, 6599–6614. [Google Scholar] [CrossRef]
  34. Li, J.; Wang, N.; Zhang, L.; Du, B.; Tao, D. Recurrent feature reasoning for image inpainting. In Proceedings of the 2020 IEEE/CVF Conference on Computer Vision and Pattern Recognition (CVPR), Seattle, WA, USA, 13–19 June 2020; IEEE: Piscataway, NJ, USA, 2020; pp. 7757–7765. [Google Scholar] [CrossRef]
  35. Liu, G.; Reda, F.A.; Shih, K.J.; Wang, T.-C.; Tao, A.; Catanzaro, B. Image Inpainting for Irregular Holes Using Partial Convolutions. In Proceedings of the Computer Vision (ECCV), Munich, Germany, 8–14 September 2018; pp. 89–105. [Google Scholar] [CrossRef]
  36. Zeng, Y.; Fu, J.; Chao, H.; Guo, B. Aggregated contextual transformations for high-resolution image inpainting. IEEE Trans. Vis. Comput. Graph. 2023, 29, 3266–3280. [Google Scholar] [CrossRef] [PubMed]
  37. Guo, X.; Yang, H.; Huang, D. Image inpainting via conditional texture and structure dual generation. In Proceedings of the 2021 IEEE/CVF International Conference on Computer Vision (ICCV), Montreal, QC, Canada, 10–17 October 2021; IEEE: Piscataway, NJ, USA, 2021; pp. 14134–14143. [Google Scholar] [CrossRef]
  38. Quan, W.; Zhang, R.; Zhang, Y.; Li, Z.; Wang, J.; Yan, D.M. Image inpainting with local and global refinement. IEEE Trans. Image Process. 2022, 31, 2405–2420. [Google Scholar] [CrossRef] [PubMed]
Figure 1. Overall architecture of a 2D barcode structure iterative repair network.
Electronics 13 01873 g001
Figure 2. Global ( M g ) and local ( M l ) attention maps combined by the SFA module to maintain structural integrity and visual consistency in the repaired areas excluding gray sections.
Electronics 13 01873 g002
Figure 3. CFA module optimizing feature representations by adaptively reweighting feature channels to support more efficient 2D barcode reconstruction.
Electronics 13 01873 g003
Figure 4. Detailed zoom-in on the QR code locator illustrating its dimensions.
Electronics 13 01873 g004
Figure 5. Structural information of QR and PDF417 codes, as well as corresponding masks: (a) structural area of the QR code; (b) structural area of the PDF417 code; (c) mask of the QR code; and (d) mask of the PDF417 code.
Electronics 13 01873 g005
Figure 6. Qualitative comparison of the repair effects of QR codes: (a) damaged QR code; (b) AOT-GAN; (c) CTSDG; (d) LGNet; (e) proposed method; and (f) original image.
Electronics 13 01873 g006
Figure 7. Qualitative comparison of repair effects of PDF417: (a) damaged QR code; (b) AOT-GAN; (c) CTSDG; (d) LGNet; (e) proposed method; and (f) original image.
Electronics 13 01873 g007
Table 1. Quantitative comparison model of the proposed model with representative comparisons on the QR code dataset.
MaskedMasked_QRAOTCtsdgLGNetOurs
DR0.15–0.3094.2100100100
0.3–0.45085100100100
0.45–0.6073.299.4100100
0.6–0.75057.695.4100100
0.75–0.9030.67799.2100
PSNR0.15–0.3-30.181237.589249.413642.2146
0.3–0.45-27.865335.178547.783542.0115
0.45–0.6-26.333432.729646.709941.8028
0.6–0.75-25.147930.412345.929041.6074
0.75–0.9-23.842827.653145.375941.4301
SSIM0.15–0.3-0.99170.99540.99990.9933
0.3–0.45-0.98810.99330.99980.9932
0.45–0.6-0.98520.99140.99980.9931
0.6–0.75-0.98270.98930.99980.9930
0.75–0.9-0.97990.98660.99970.9927
L10.15–0.3-0.00790.00550.00370.0052
0.3–0.45-0.00810.00630.00530.0053
0.45–0.6-0.00840.00730.00650.0056
0.6–0.75-0.00910.00870.00760.0057
0.75–0.9-0.00980.01090.00840.0061
DR, decoding rate; PSNR, peak signal-to-noise ratio; SSIM, structural similarity index.
Table 2. Quantitative comparison model between the proposed model and representative comparison on the PDF417 dataset.
MaskedMasked_PDF417AOTCtsdgLGNetOurs
DR0.15–0.3028.840.691.699.6
0.3–0.4502.210.889.499.6
0.45–0.6001.484.899.4
0.6–0.75000.282.098.8
0.75–0.900079.298.2
PSNR0.15–0.3-27.876533.029144.856737.0854
0.3–0.45-25.730629.882642.876735.8876
0.45–0.6-24.408527.305641.653634.7828
0.6–0.75-23.424325.308940.760833.8335
0.75–0.9-22.667323.642239.942933.0167
SSIM0.15–0.3-0.99160.99150.99990.9849
0.3–0.45-0.98700.98750.99980.9834
0.45–0.6-0.98280.98360.99980.9818
0.6–0.75-0.97900.97970.99970.9802
0.75–0.9-0.97580.97600.99970.9786
L10.15–0.3-0.05110.00280.00650.0069
0.3–0.45-0.05510.00490.00950.0078
0.45–0.6-0.05590.00770.01200.0086
0.6–0.75-0.05630.01100.01410.0093
0.75–0.9-0.05710.01470.01590.0099
Disclaimer/Publisher’s Note: The statements, opinions and data contained in all publications are solely those of the individual author(s) and contributor(s) and not of MDPI and/or the editor(s). MDPI and/or the editor(s) disclaim responsibility for any injury to people or property resulting from any ideas, methods, instructions or products referred to in the content.

