


Abstract
This research presents a novel approach by applying convolutional neural networks (CNNs) to enhance optical camera communication (OCC) signal detection under challenging indoor lighting conditions. The study utilizes a smartphone app to capture images of an LED lamp that emits 25 unique optical codes at distances of up to four meters. The developed CNN model demonstrates superior accuracy and outperforms traditional methodologies, which often struggle under variable illumination. This advancement provides a robust solution for reliable OCC detection where previous methods underperform, particularly in the tourism industry, where it can be used to create a virtual museum on the Unity platform. This innovation showcases the potential of integrating the application with a virtual environment to enhance tourist experiences. It also establishes a comprehensive visible light positioning (VLP) system, marking a significant advance in using CNN for OCC technology in various lighting conditions. The findings underscore the effectiveness of CNNs in overcoming ambient lighting challenges, paving the way for new applications in museums and similar environments and laying the foundation for future OCC system improvements.
1. Introduction
The integration of communication and detection technologies, known as Joint Communication and Sensing (JCS), is poised to transform spectral efficiency and detection precision, opening doors to groundbreaking applications in next-generation mobile networks and intelligent transportation systems. This fusion, endorsed by the International Telecommunication Union (ITU) guidelines, supports the development of Optical Camera Communication (OCC) and Visible Light Positioning (VLP) as innovative solutions for indoor positioning and data transmission [1,2]. These technologies utilize existing lighting infrastructure to offer efficient communication, which is particularly impactful in various sectors including museums and tourism. However, implementing OCC and VLP in environments with lighting constraints, such as museums, presents significant challenges due to ambient light interference and the specific conservation needs of artifacts. This research tackles these challenges head-on by utilizing Convolutional Neural Networks (CNNs) for optical code classification under such conditions, based on a dataset comprising images of optical codes emitted by LED lamps and captured at various distances.
To enhance the discussion on emerging technologies in OCC and VLP systems, it is crucial to incorporate advanced architectures such as Stacked Intelligent Metasurfaces (SIM). These architectures have significantly improved light manipulation for signal detection, offering a new dimension of efficiency in environments with complex lighting conditions. Recent advancements in SIM technology demonstrate their potential to seamlessly integrate into OCC systems, optimizing both the detection and transmission of signals under diverse environmental conditions [3].
Our methodological approach involves systematically developing and evaluating various CNN model configurations, ranging from basic to complex, to determine the most effective model for detecting and classifying OCC signals across different lighting conditions. Additionally, we simulate a VLP in a virtual 3D museum environment, demonstrating our proposal’s viability in a controlled setting. This simulation is a solid foundation for future research and practical applications of OCC and VLP in the tourism sector and beyond.
Incorporating the Social, Contextual, Mobile (SoCoMo) framework [4] into our analysis, which leverages the interplay between social interactions, physical context, and mobility to enhance technology integration, we illustrate how this synergy can augment OCC and VLP applications for extracting information from location systems. This approach aims to improve the accuracy and reliability of indoor positioning systems and explore new possibilities for these technologies in the tourism industry, aligning with the move towards more immersive, personalized, and technologically enriched experiences [5]. Museums are presented as the initial testing grounds for these broader applications.
This document is structured as follows: Section 2 offers a comprehensive literature review on OCC, VLP, and CNNs. Section 3 details the methodology (data collection, neural network design, and the VLP simulation setup). Section 4 presents the results obtained, followed by a discussion in Section 5 on the implications of these findings and directions for future research.
2. Related Works
Optical Camera Communication (OCC) has emerged as a promising solution for low-rate applications, lauded for its low power consumption, cost-effectiveness, and enhanced security. Operating across infrared or visible spectra, OCC leverages image sensors for signal reception and LEDs for transmission. Despite its potential, the technology faces limitations such as low data rates, primarily attributed to commercial cameras’ limited sampling rates and challenges, including out-of-focus effects and inconsistent frame rates. Camera specifications, LED dimensions, channel properties, synchronization, and modulation techniques determine the efficacy of OCC transmission [6,7,8]. The last decade has seen significant advancements in OCC systems, with applications extending to smartphones and computers. For example, a smartphone-based OCC system achieved a communication distance of 7.5 m using a large LED, though it was limited to low data rates and did not support motion capture [9]. Other research has focused on overcoming motion capture challenges and flickering issues, employing under-sampling and multi-level modulation methods to achieve flicker-free communication. Notably, integrating OCC systems with standard lighting sources has been highlighted as a critical advantage for seamless communication. Recognizing small LEDs in static and dynamic environments poses considerable challenges, with mobile conditions exacerbating bit-error rates (BER). Research by Ahmed et al. (2020) introduced an OCC system using a small LED array and a low-frame rate camera as the receiver, significantly enhancing bit-error rates in mobile scenarios by developing a specialized neural network [10].
Optical Camera Communication (OCC) and Visible Light Positioning (VLP) have been recognized as pivotal technologies in the advancement of indoor navigation systems. These technologies not only leverage the existing lighting infrastructure for efficient communication but also introduce innovative solutions for precise data transmission and localization.
Joint Communication and Sensing systems (JCAS) represent a cutting edge in spectral efficiency and detection accuracy, crucial for the effective deployment of OCC and VLP technologies under various lighting conditions. These systems face critical trade-offs between communication efficiency and detection accuracy, explored within the framework of JCAS systems [11].
Following this, several studies have explored the integration of OCC with various communication protocols, emphasizing the need to enhance both the data transmission capabilities and the accuracy of the localization features. This integration is crucial for deploying robust and reliable indoor navigation systems, particularly in environments such as museums where precision and efficiency are paramount.
Visible Light Positioning (VLP) [12,13,14,15], utilizing LED lighting for precise data transmission and localization, represents another frontier in indoor navigation technologies. Recent studies have focused on improving the integration of optical localization techniques with network infrastructures, enhancing mobility awareness, and refining channel modeling. The ITU-T G-9991 standard has been instrumental in promoting the development of VLP technologies, ensuring their interoperability and efficiency. Innovations in receiver diversity and computational methods, such as neural networks, have markedly improved positioning accuracy within Light Positioning Technologies [16]. Recent research has introduced innovative tracking algorithms and explored the potential of artificial intelligence in optimizing VLP signal decoding processes, addressing challenges such as the need for dense LED distributions [17], line-of-sight constraints [18], and the impact of environmental factors.
A noteworthy study proposed the pixel-to-bit calculation (PBC) decoding algorithm, achieving significant decoding rates in practical VLP applications [19]. This advancement underscores the potential of artificial intelligence in enhancing signal decoding processes for VLP systems. In Optical Localization Techniques, advances in receiver diversity and neural networks have markedly improved positioning accuracy, allowing for precise three-dimensional location tracking. Innovative algorithms employing visible light communication have been developed to refine indoor positioning precision, attesting to the versatility of these technologies in complex settings. Additionally, exploring convolutional neural networks (CNNs) in optical camera communication has underscored the potential of artificial intelligence to enhance signal decoding processes. Visible Light Positioning (VLP) systems also face challenges, including dense LED array requirements, line-of-sight limitations, and environmental influences such as tilt angles and multipath reflections. These complexities necessitate significant data inputs, like high-resolution images, for precise positioning within intricate indoor environments. Current research is directed at overcoming these hurdles to broaden the applicability of VLP technologies.
Optical positioning systems represent a significant stride in indoor navigation by utilizing pervasive LED lighting to deliver precise locational data, merging illumination with data transmission—vital for navigating indoor spaces beyond the reach of GPS signals. The seamless integration of these positioning systems into existing lighting infrastructures emphasizes their operational efficiency and straightforward deployment, attributed to their resistance to electromagnetic interference, presenting a compelling option for indoor settings requiring minimal infrastructural changes [20]. Advances in accuracy for location systems have been propelled by enhanced receiver diversity and advanced computational methods, such as neural networks, instrumental for achieving precise three-dimensional positioning. These breakthroughs signal a critical shift towards more robust and nuanced indoor navigation solutions [21].
A novel tracking algorithm that harnesses visible light communication has been introduced to further advance positioning systems’ proficiency, elevating the standard for indoor positioning precision. This method demonstrates VLP’s adaptability to intricate indoor landscapes and establishes new benchmarks for overcoming traditional navigation challenges in such environments [22]. The dynamic nature of indoor spaces poses significant challenges in decoding VLP signals. Recent research has delved into the capabilities of CNN-based frameworks for optical camera communication [23], illustrating the considerable role that artificial intelligence and machine learning may play in improving the decoding processes and, consequently, the performance of VLP systems. Recent enhancements in VLP technology have involved varied computational strategies to heighten system accuracy and dependability. Studies [21,22] have shown the benefits of employing sophisticated algorithms and neural networks to refine system precision, even in multifaceted indoor scenarios. These methodologies indicate a shift towards advanced decoding and signal processing techniques designed to navigate environmental variances and the innate challenges of indoor navigation [24,25].
The burgeoning field of Joint Communication and Sensing (JCAS) holds promise to revolutionize the use of the electromagnetic spectrum, particularly with emerging technologies such as 6G [26]. Relevant to the Internet of Things (IoT), JCAS combines communication with environmental sensing [27]. A proof of concept in greenhouse monitoring using LoRaWAN and a multilayer perceptron neural network has been demonstrated to predict plant growth effectively [28]. A tutorial on Orthogonal Frequency-Division Multiplexing (OFDM) [29] sensing in JCAS systems has reviewed the latest advancements, presenting a novel approach to simplify sensing complexity. Within OCC frameworks, JCAS has the potential to substantially improve signal detection and classification by utilizing existing network infrastructure for sensing, providing a more reliable and efficient solution in environments with complex lighting conditions, such as museums. An evolution towards an integrated Joint Communication, Sensing, and Localization (JCSL) system is occurring, which would amalgamate communication, sensing, and precise localization functionalities, thereby enhancing the system’s utility in IoT applications. The implementation of JCSL is anticipated to foster richer, context-aware interactions with the environment and introduce forward-thinking navigation and resource management approaches in intricate settings.
3. Proposed System
Despite the advancements in OCC and the application of neural networks, there remain gaps in the literature, particularly in the context of lighting-constrained environments like museums. The current study aims to fill these gaps by developing a CNN model tailored for the classification of a set of 25 optical codes. The model is trained, validated, and tested using a dataset of images captured with a smartphone camera in a controlled environment, simulating the conditions of a museum. The proposed CNN model’s performance is evaluated based on its accuracy in classifying the optical codes, its training efficiency, and its validation results, contributing to the field of OCC by providing a solution that is both reliable and adaptable to the unique requirements of lighting-constrained environments.
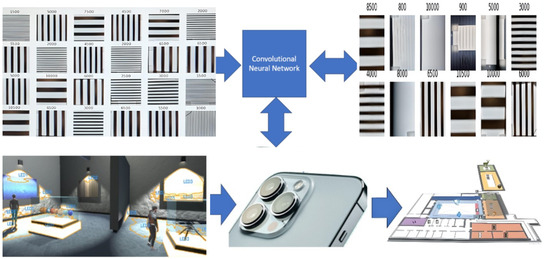
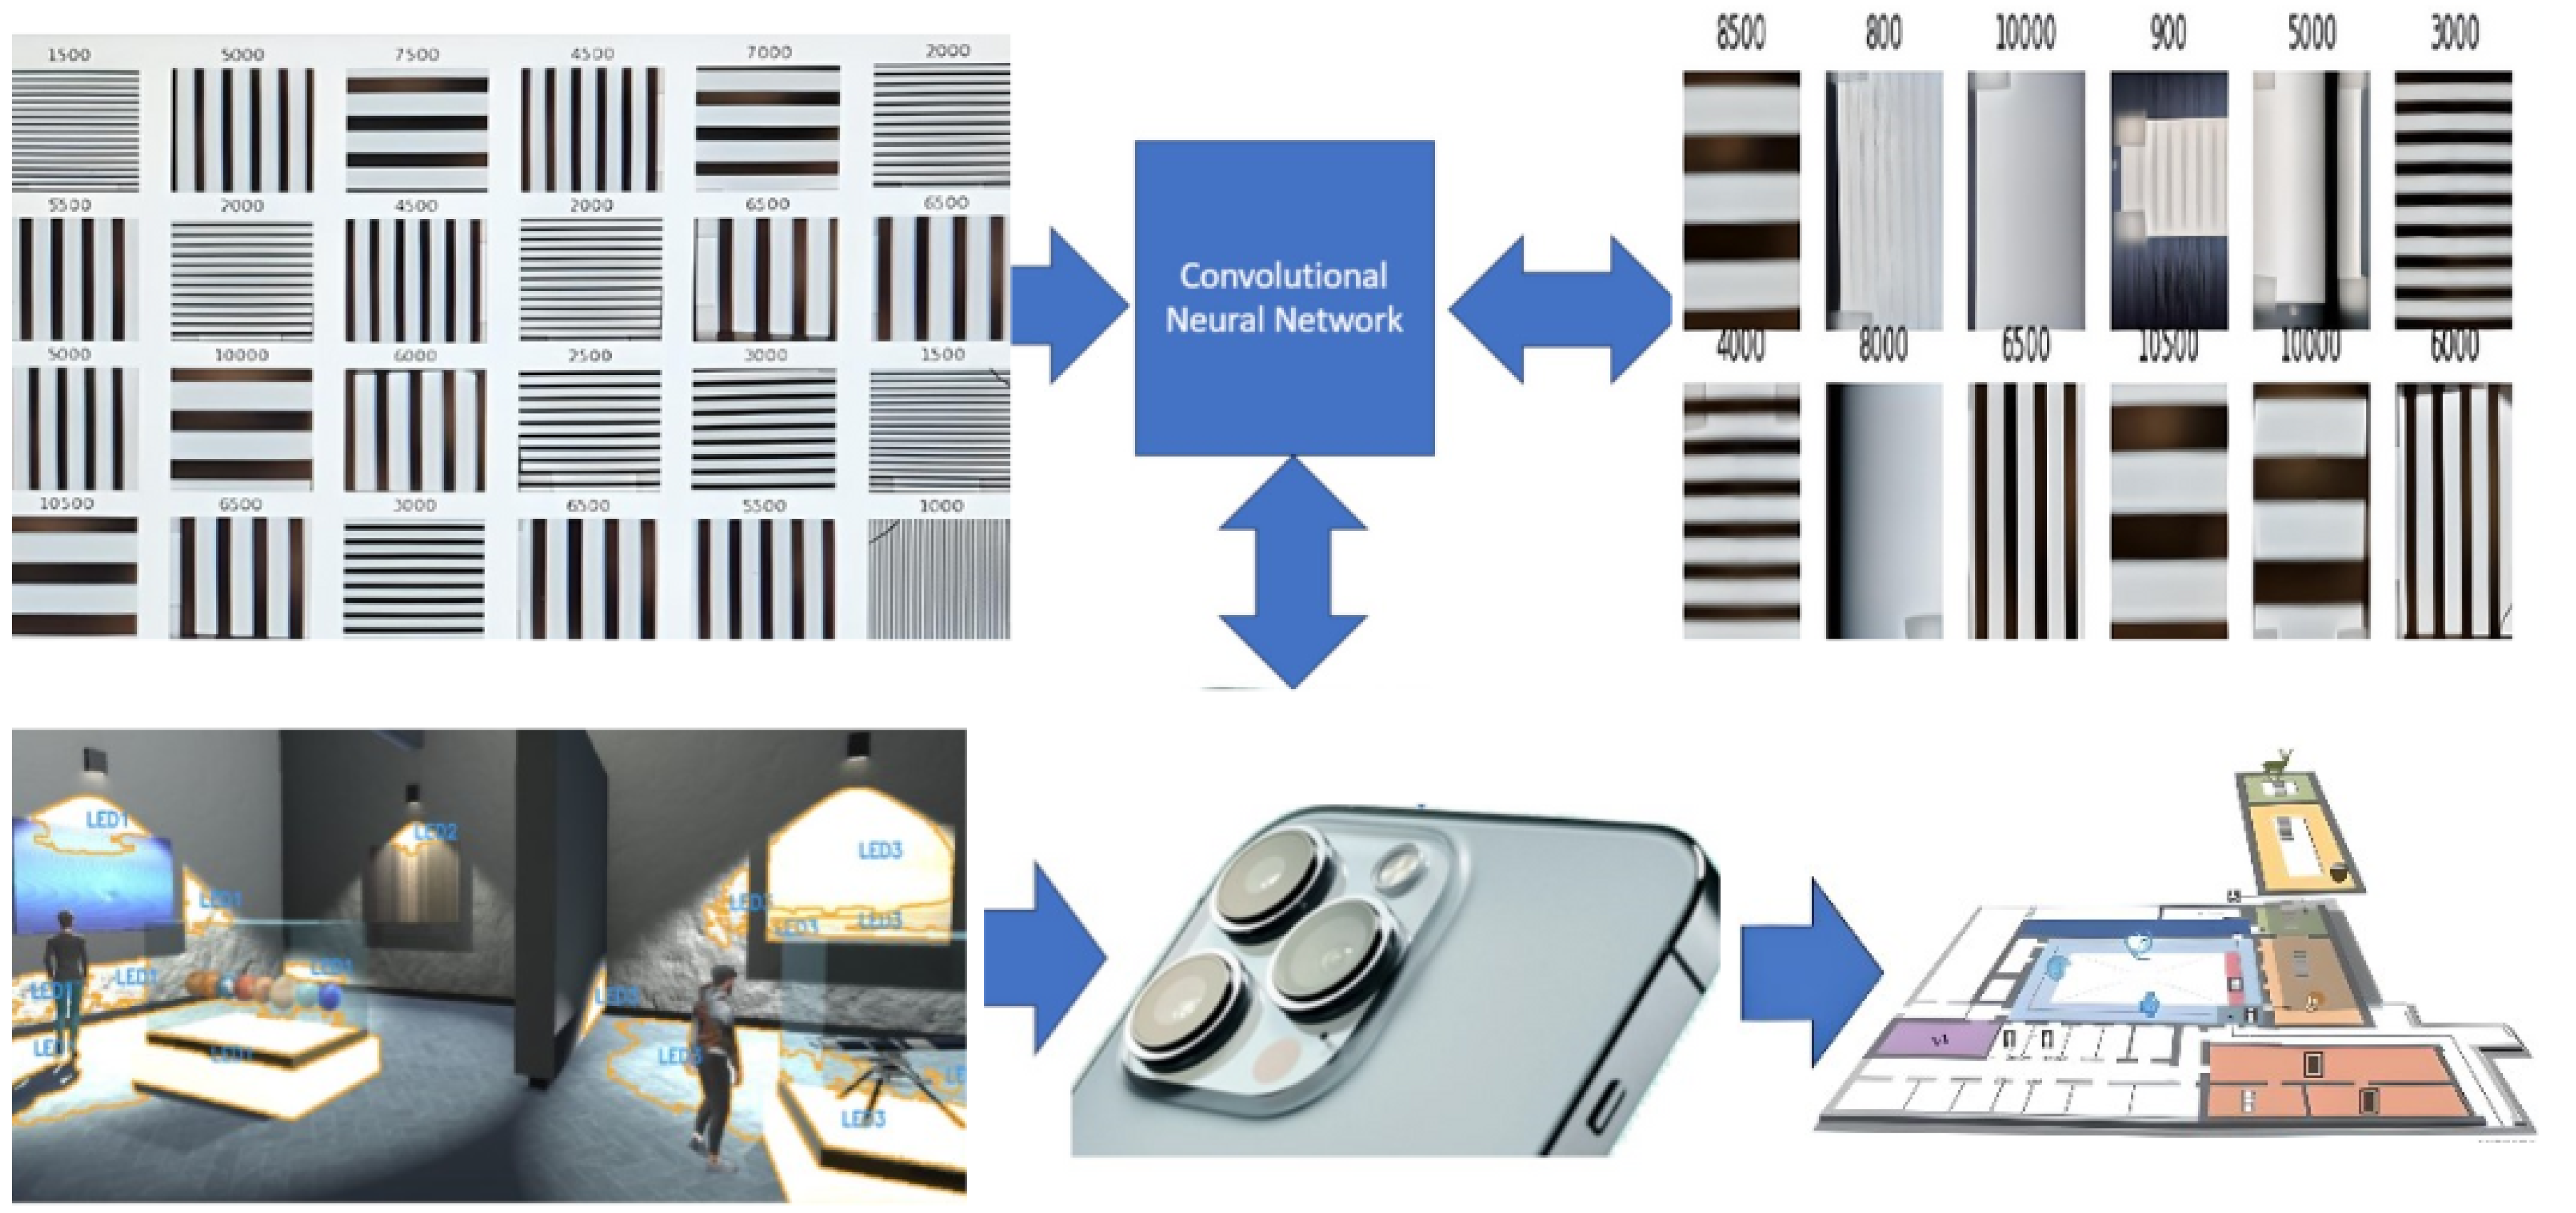
The proposed system aims to integrate Optical Camera Communication (OCC) and Visible Light Positioning (VLP) technology within a museum setting, to simulate real-time positioning on a 3D platform. Our methodology unfolds through several strategic phases, as illustrated in Figure 1, collectively forming a comprehensive approach from data collection to real-time simulation. Initially, images of an LED lamp are collected using a mobile phone camera. These images feature distinct optical codes—patterns such as stripes or lines—generated by the LED lamp, resulting in a total of 25 different codes. Each code is manually labeled to serve as a reference for the subsequent learning process.
Figure 1.
Proposed system scheme in this contribution.
Once labeled, these images serve as input data for a Convolutional Neural Network (CNN), which is tasked with the training, validation, and classification of the optical codes. The CNN’s role is to accurately identify and categorize the unique patterns in the images, learning the characteristics that define each class of code.
After the CNN is trained and the optical codes are classified, the data are used to conduct a 3D simulation of indoor positioning. This simulation gathers information to feed back into the CNN, aiming to refine the predictions and classifications of the optical codes. Through iterative training and simulation, the system’s ability to accurately determine indoor positioning is enhanced, advancing the potential for precise and reliable navigation in interior environments such as museums.
At the onset of this study, we performed a thorough process of collecting, labeling, and categorizing images of LED lamps, each encoded with unique and distinct optical codes essential for the functionality of Indoor Positioning Technology based on VLP. This foundational work sets the stage for the sophisticated analytical processes that follow, ensuring a rich dataset that mirrors the complexities and variability encountered in museum lighting conditions.
3.1. CNN Model Developed
The core of our research is the development of a highly specialized Convolutional Neural Network (CNN) model designed to accurately identify and classify OCC signals within museums, where lighting conditions can vary significantly.
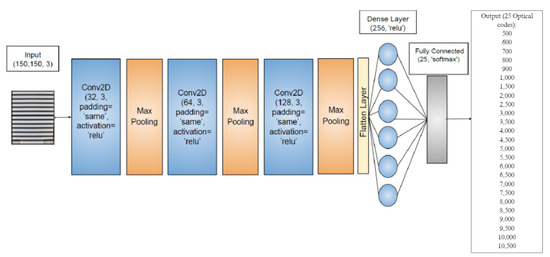
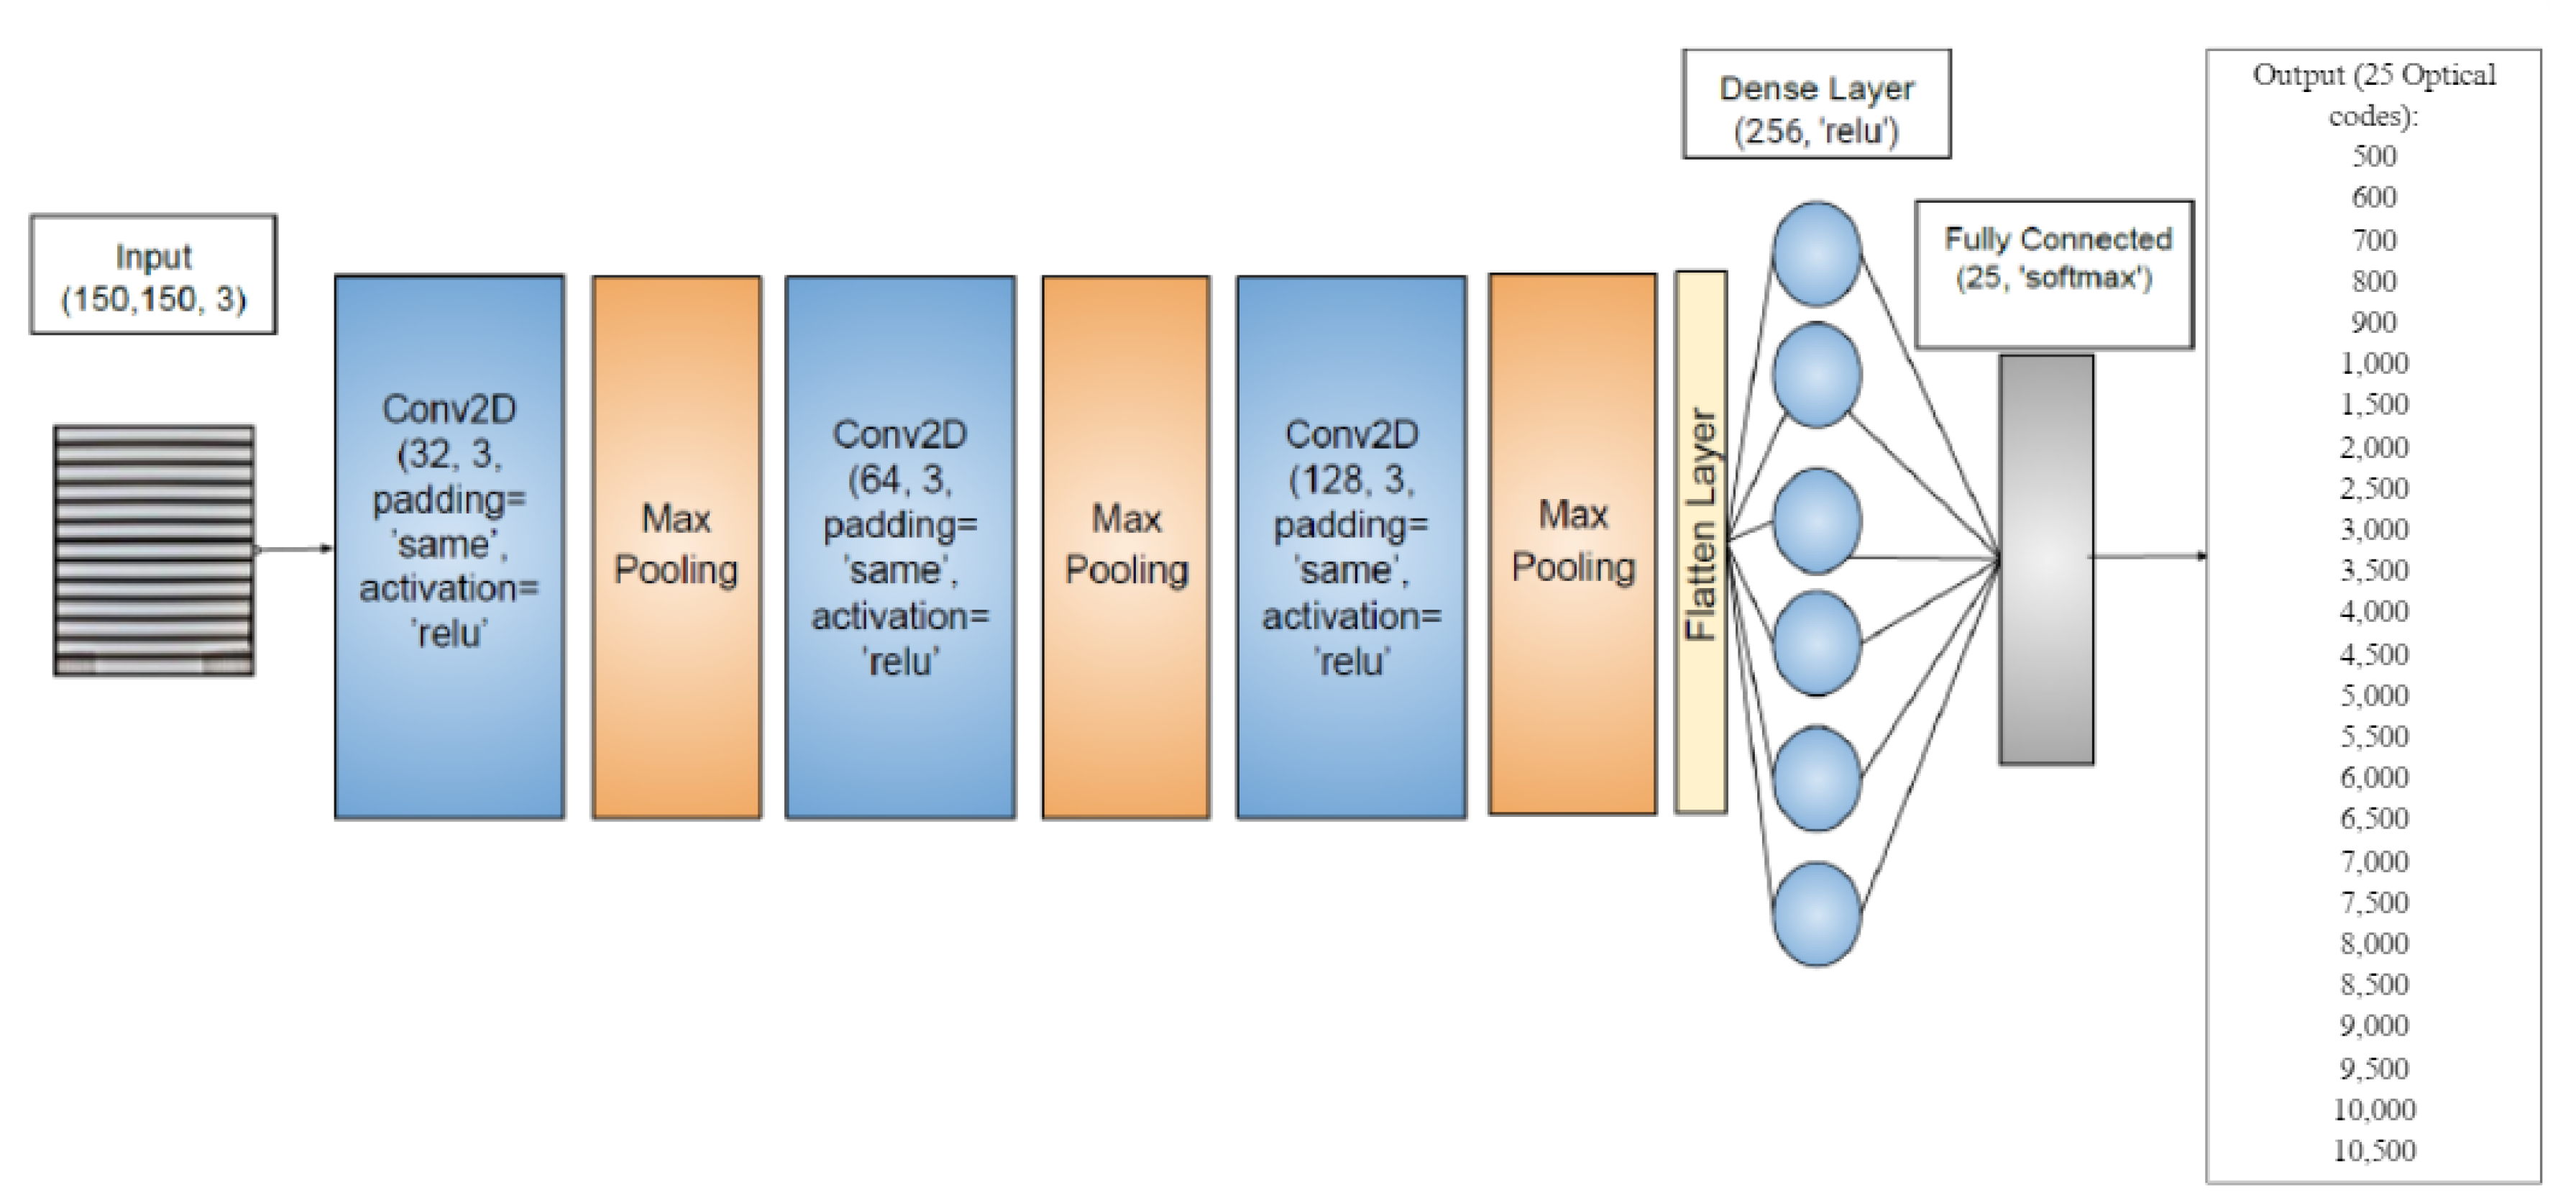
Our CNN architecture, is outlined in Figure 2, is structured to incorporate a series of convolutional layers activated by the ReLU (Rectified Linear Unit) function. This choice is strategic, leveraging ReLU’s ability to introduce non-linearity into the model, enabling it to learn and model complex patterns in the data efficiently. These convolutional layers are the backbone of the model, designed to detect and learn from the spatial patterns present in the images of LED lamps, capturing the essence of the optical codes they emit.
Figure 2.
CNN structure used in this work.
Following the convolutional layers, max pooling layers are employed to perform dimensionality reduction. This process simplifies the information by retaining only the most salient features, thereby reducing the computational load for subsequent layers and mitigating the risk of overfitting. This step is crucial for maintaining the model’s performance and generalization ability across varying lighting conditions and optical codes. A flattening layer then transforms the processed features into a one-dimensional vector, making them suitable for classification through dense layers. To enhance the model’s robustness and adaptability to new, unseen data, we integrated dropout techniques within the dense layers. This approach randomly deactivates a fraction of the neurons during training, compelling the model to learn more generalized patterns that are not dependent on the presence of specific neurons. The culmination of the classification process is achieved via a softmax activation layer. This layer assigns a probability to each of the model’s output classes, effectively determining the specific optical code category for each input image. This probabilistic approach is instrumental in handling the inherent uncertainty and variability in the optical codes generated by the LED lamps.
The model initiates with a scaling layer to normalize the input values, enhancing the model’s ability to learn efficiently from the start. Sequentially, the convolutional layers, equipped with an array of filters, embark on the task of extracting and learning diverse spatial features from the input images. The complexity and depth of learning escalate with each layer, as indicated by the increasing number of filters designed to capture an ever-expanding spectrum of visual characteristics.
In our experiments, the hyperparameters of this model, summarized in Table 1, were optimized to enhance performance. These parameters, including learning rates and epochs, were adjusted to maximize classification accuracy and efficiency.
Table 1.
Hyperparameter values for the proposed CNN model.
Through this intricate architecture and the strategic layering of convolutional, pooling, and dense layers, our model embodies a sophisticated learning mechanism. It is adept at navigating the complexities of optical code recognition within the dynamic and often challenging lighting environments of museums.
With over ten million trainable parameters, our CNN model stands as a testament to the depth of its learning capacity and its prowess in classifying images into 25 distinct optical code categories. This complexity not only highlights the model’s advanced analytical capabilities but also underscores its potential to revolutionize indoor navigation systems by accurately interpreting the nuanced optical signals critical for VLP technology.
This development phase underscores our commitment to pushing the boundaries of what is possible with OCC signal detection and classification, setting a new standard for accuracy and reliability in museum navigation solutions.
3.2. Precision and Loss Function Explanation
The accuracy of our CNN model is quantitatively evaluated using the accuracy metric, which measures the proportion of correctly predicted instances out of the total number of instances in the dataset:
This metric provides a straightforward measure of the model’s overall performance. Additionally, we employ the sparse categorical crossentropy as our loss function, which is particularly effective for multi-class classification problems. This loss function is defined as:
where
- -
- is a binary indicator (0 or 1) if class label c is the correct classification for observation o;
- -
- is the predicted probability of observation o being of class c.
This function penalizes incorrect classifications by evaluating the logarithm of the predicted probabilities, which intensifies the penalty as the prediction deviates further from the actual class. The use of logarithmic loss ensures that large errors are heavily penalized, fostering a more precise model calibration.
3.3. Normalization of the Confusion Matrix
To ensure a fair comparison of the model’s performance across different classes, we normalize the confusion matrix. This normalization process adjusts the matrix values to represent probabilities instead of absolute counts, enabling an equitable comparison across all classes regardless of their sample size in the dataset:
This approach ensures each row in the confusion matrix sums to one, reflecting the distribution of predictions for each actual class, and is critical for identifying biases towards particular classes or potential areas of improvement in the model’s classification accuracy.
3.4. Data Collection, Labelling and Preprocessing
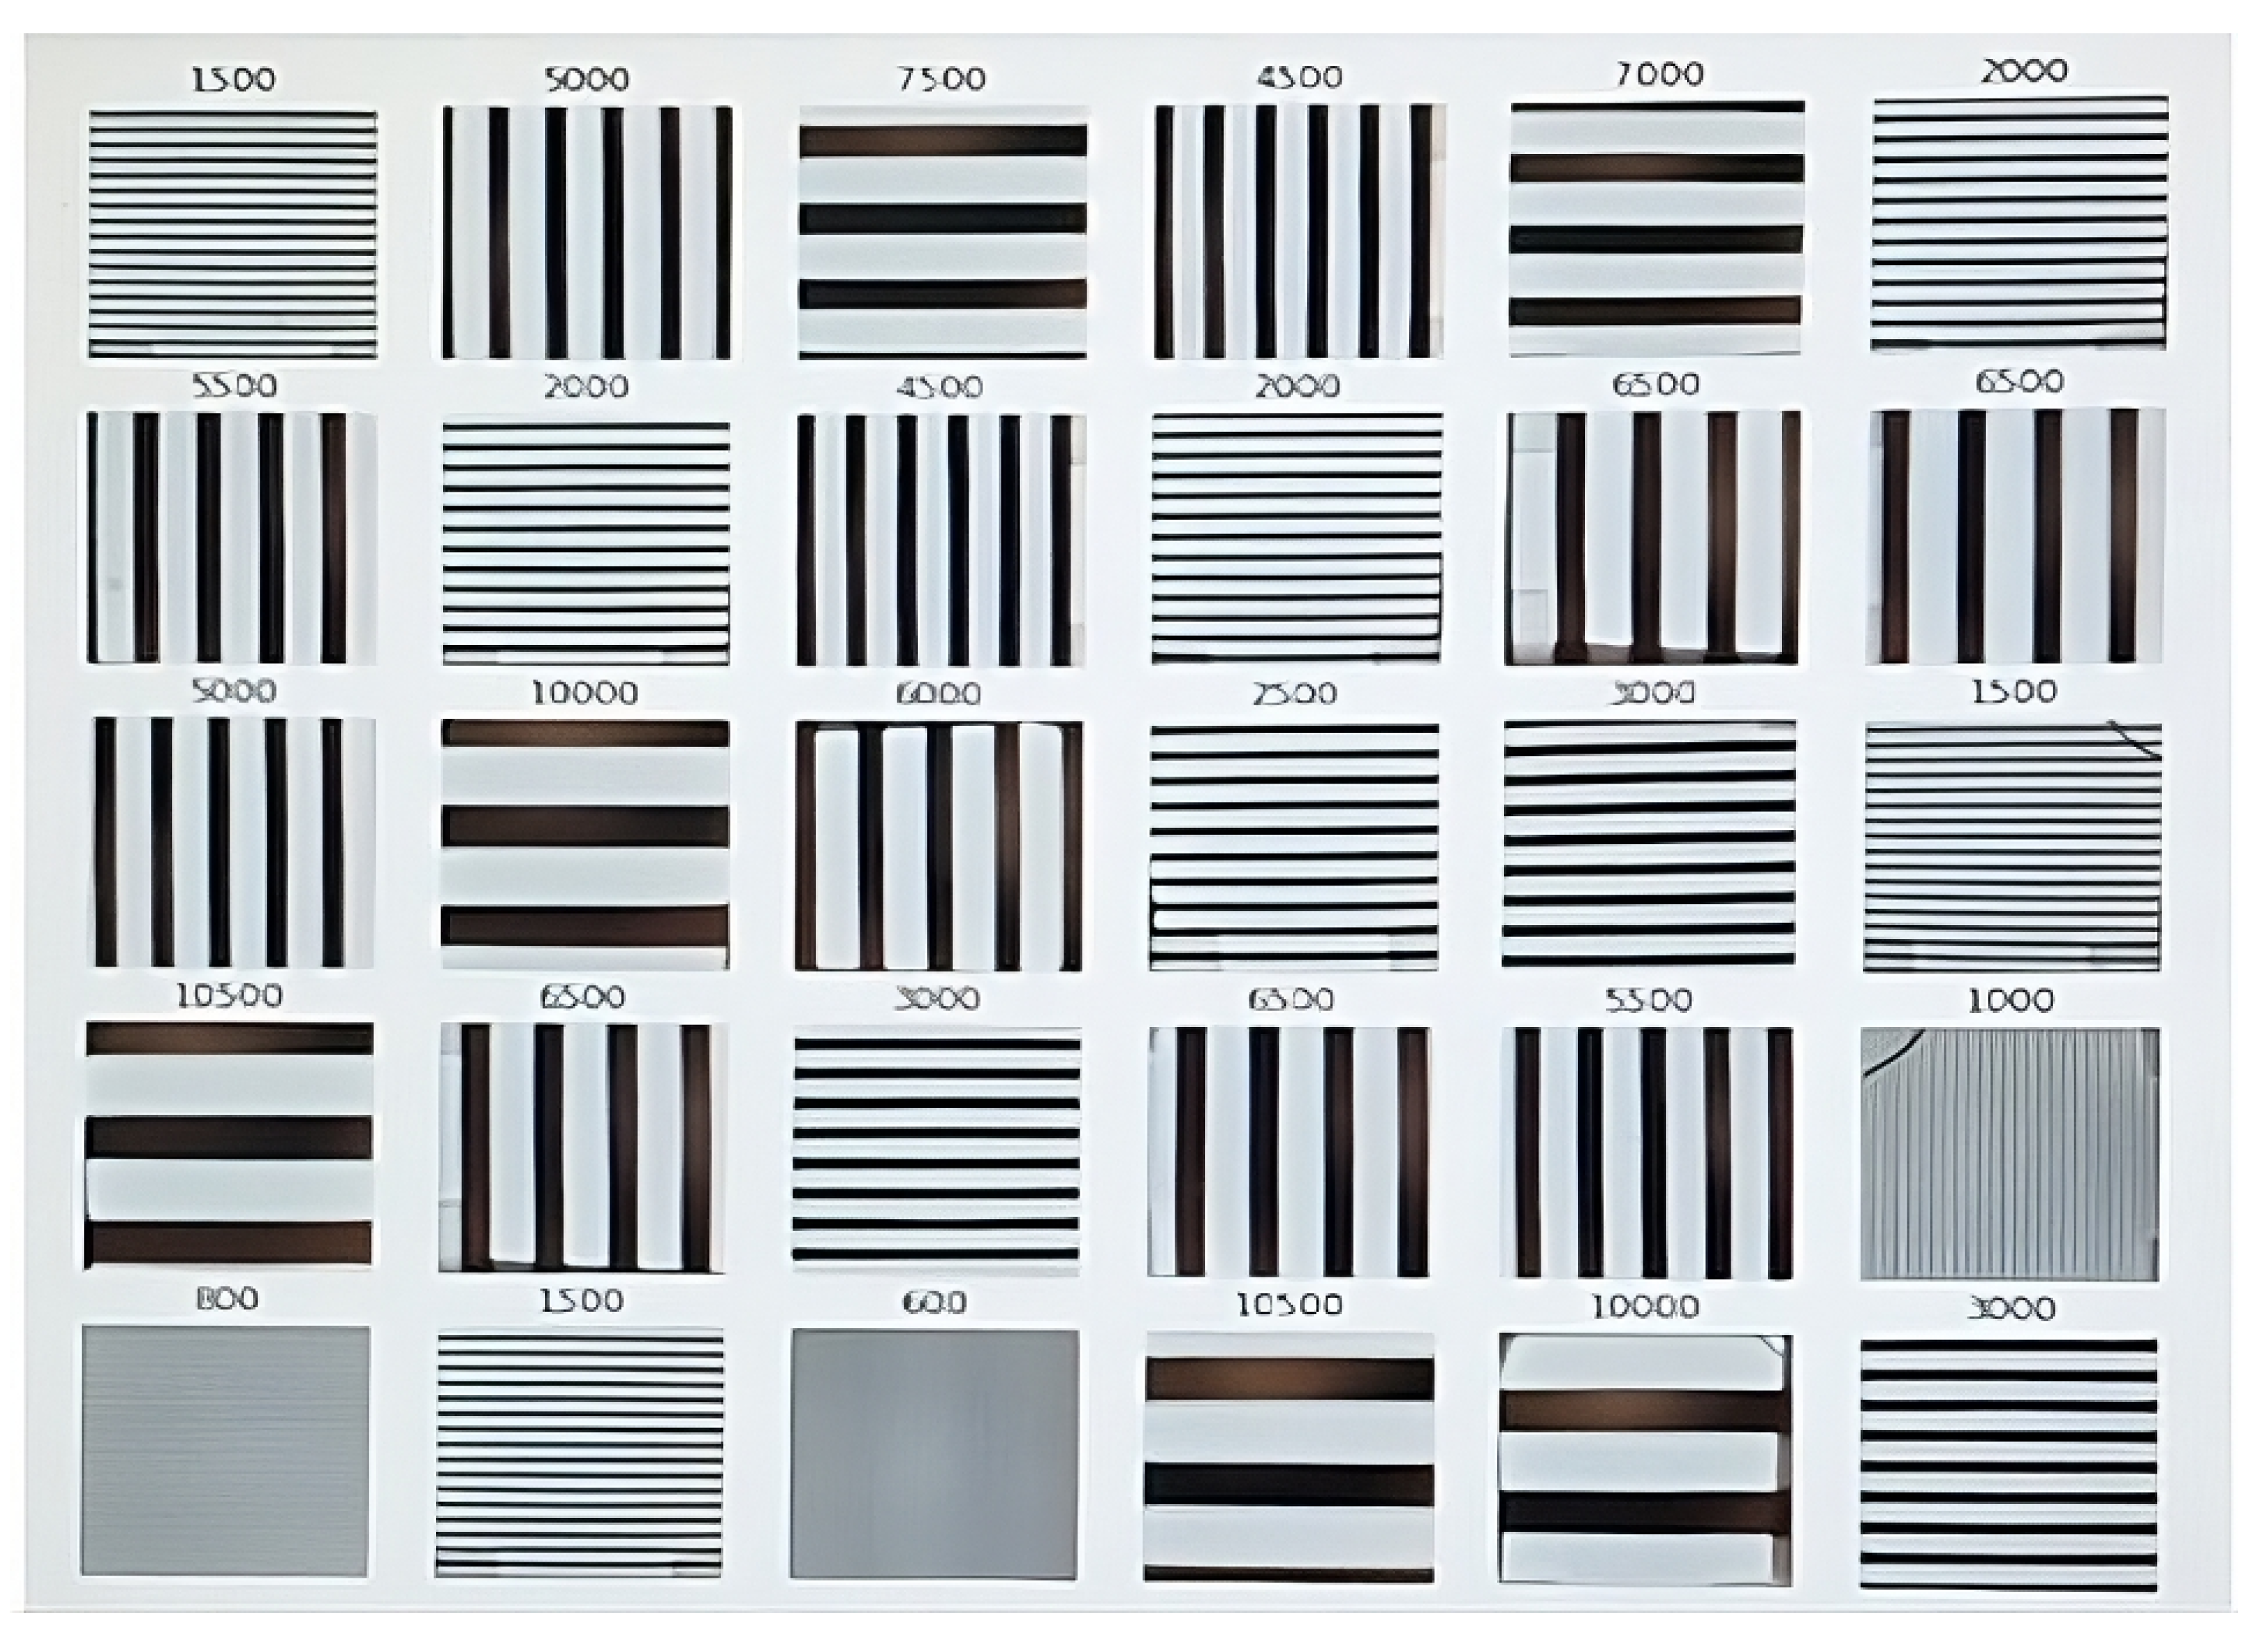
To ensure representativeness and diversity that accurately reflects real-world conditions, more than 18,000 images were taken of an LED lamp sending different optical codes. This dataset spanned a wide range of optical codes generated with OOK modulation, named from 500 to 10,500, and captured at various distances—from less than 1 m to up to 4 m—and at different angles—30°, 45°, and 60°—to precisely simulate the varied viewing conditions found in a museum environment. Additionally, images of LED lamps emitting light at different frequencies were obtained, resulting in a rich diversity of optical codes.
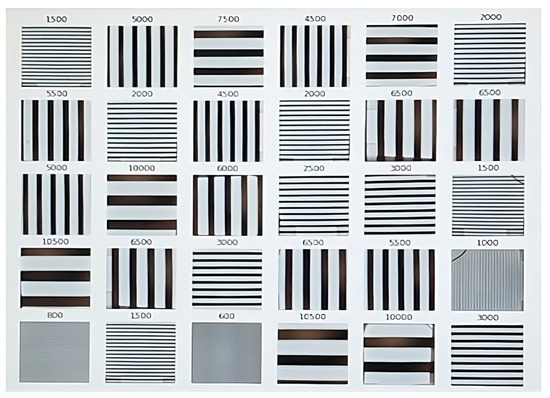
These optical codes are composed of unique patterns of light and darkness, often appearing as a series of alternating lines or dashes, as shown in Figure 3. The nature of these patterns is due to the inherent operation of LED lamps, which emit light through a rapid sequence of turning on and off, too fast to be perceived by the human eye. However, mobile device cameras are capable of capturing these quick changes in light intensity, resulting in distinct visual patterns. These patterns, in turn, generate unique optical codes for each LED lamp.
Figure 3.
Capture of the 25 different optical codes.
The image classification process resulted in the definition of 25 distinct classes, each corresponding to a unique optical code associated with a specific LED lamp. Each class represents a particular optical code, determined by the specific combination of distance, angle, and optical code of each lamp.
Given that OCC technology utilizes the blinking of LEDs, it is essential to consider the refresh rates of LEDs and the frame rates of cameras. If the LED’s refresh rate and the camera’s frame rate are not synchronized, the rolling shutter effect may complicate the extraction of the proposed optical codes. In our experiments, the system was receiving until a recognized optical code was obtained and, as the frame rate of the camera is slower than the change of the LED, there is a fast response from the CNN as can be seen in Figure 3.
3.5. Model Training and Testing
The CNN model was trained using an extensive dataset, consisting of images, of which a set was exclusively reserved for validation and evaluation purposes. This meticulous process involved fine-tuning the model’s parameters and architecture to ensure its accuracy in identifying LED lamps within the museum environment. The model was trained to recognize these lamps based on their unique optical codes, composed of distinctive patterns of light and darkness generated by the lamps themselves.
The training phase was conducted by dividing the dataset into 80% for training and 20% for validation, experimenting with batch sizes of 32 to find the optimal configuration that maximized learning. The evaluation of the model focused on accuracy and loss over 30 and 50 epochs, using graphs to visualize the learning progression and adjust the model’s settings as necessary. Additionally, a confusion matrix was used to provide a detailed analysis of the model’s performance in classification.
3.6. VLP System Based on 3D Platform in Real-Time Simulator
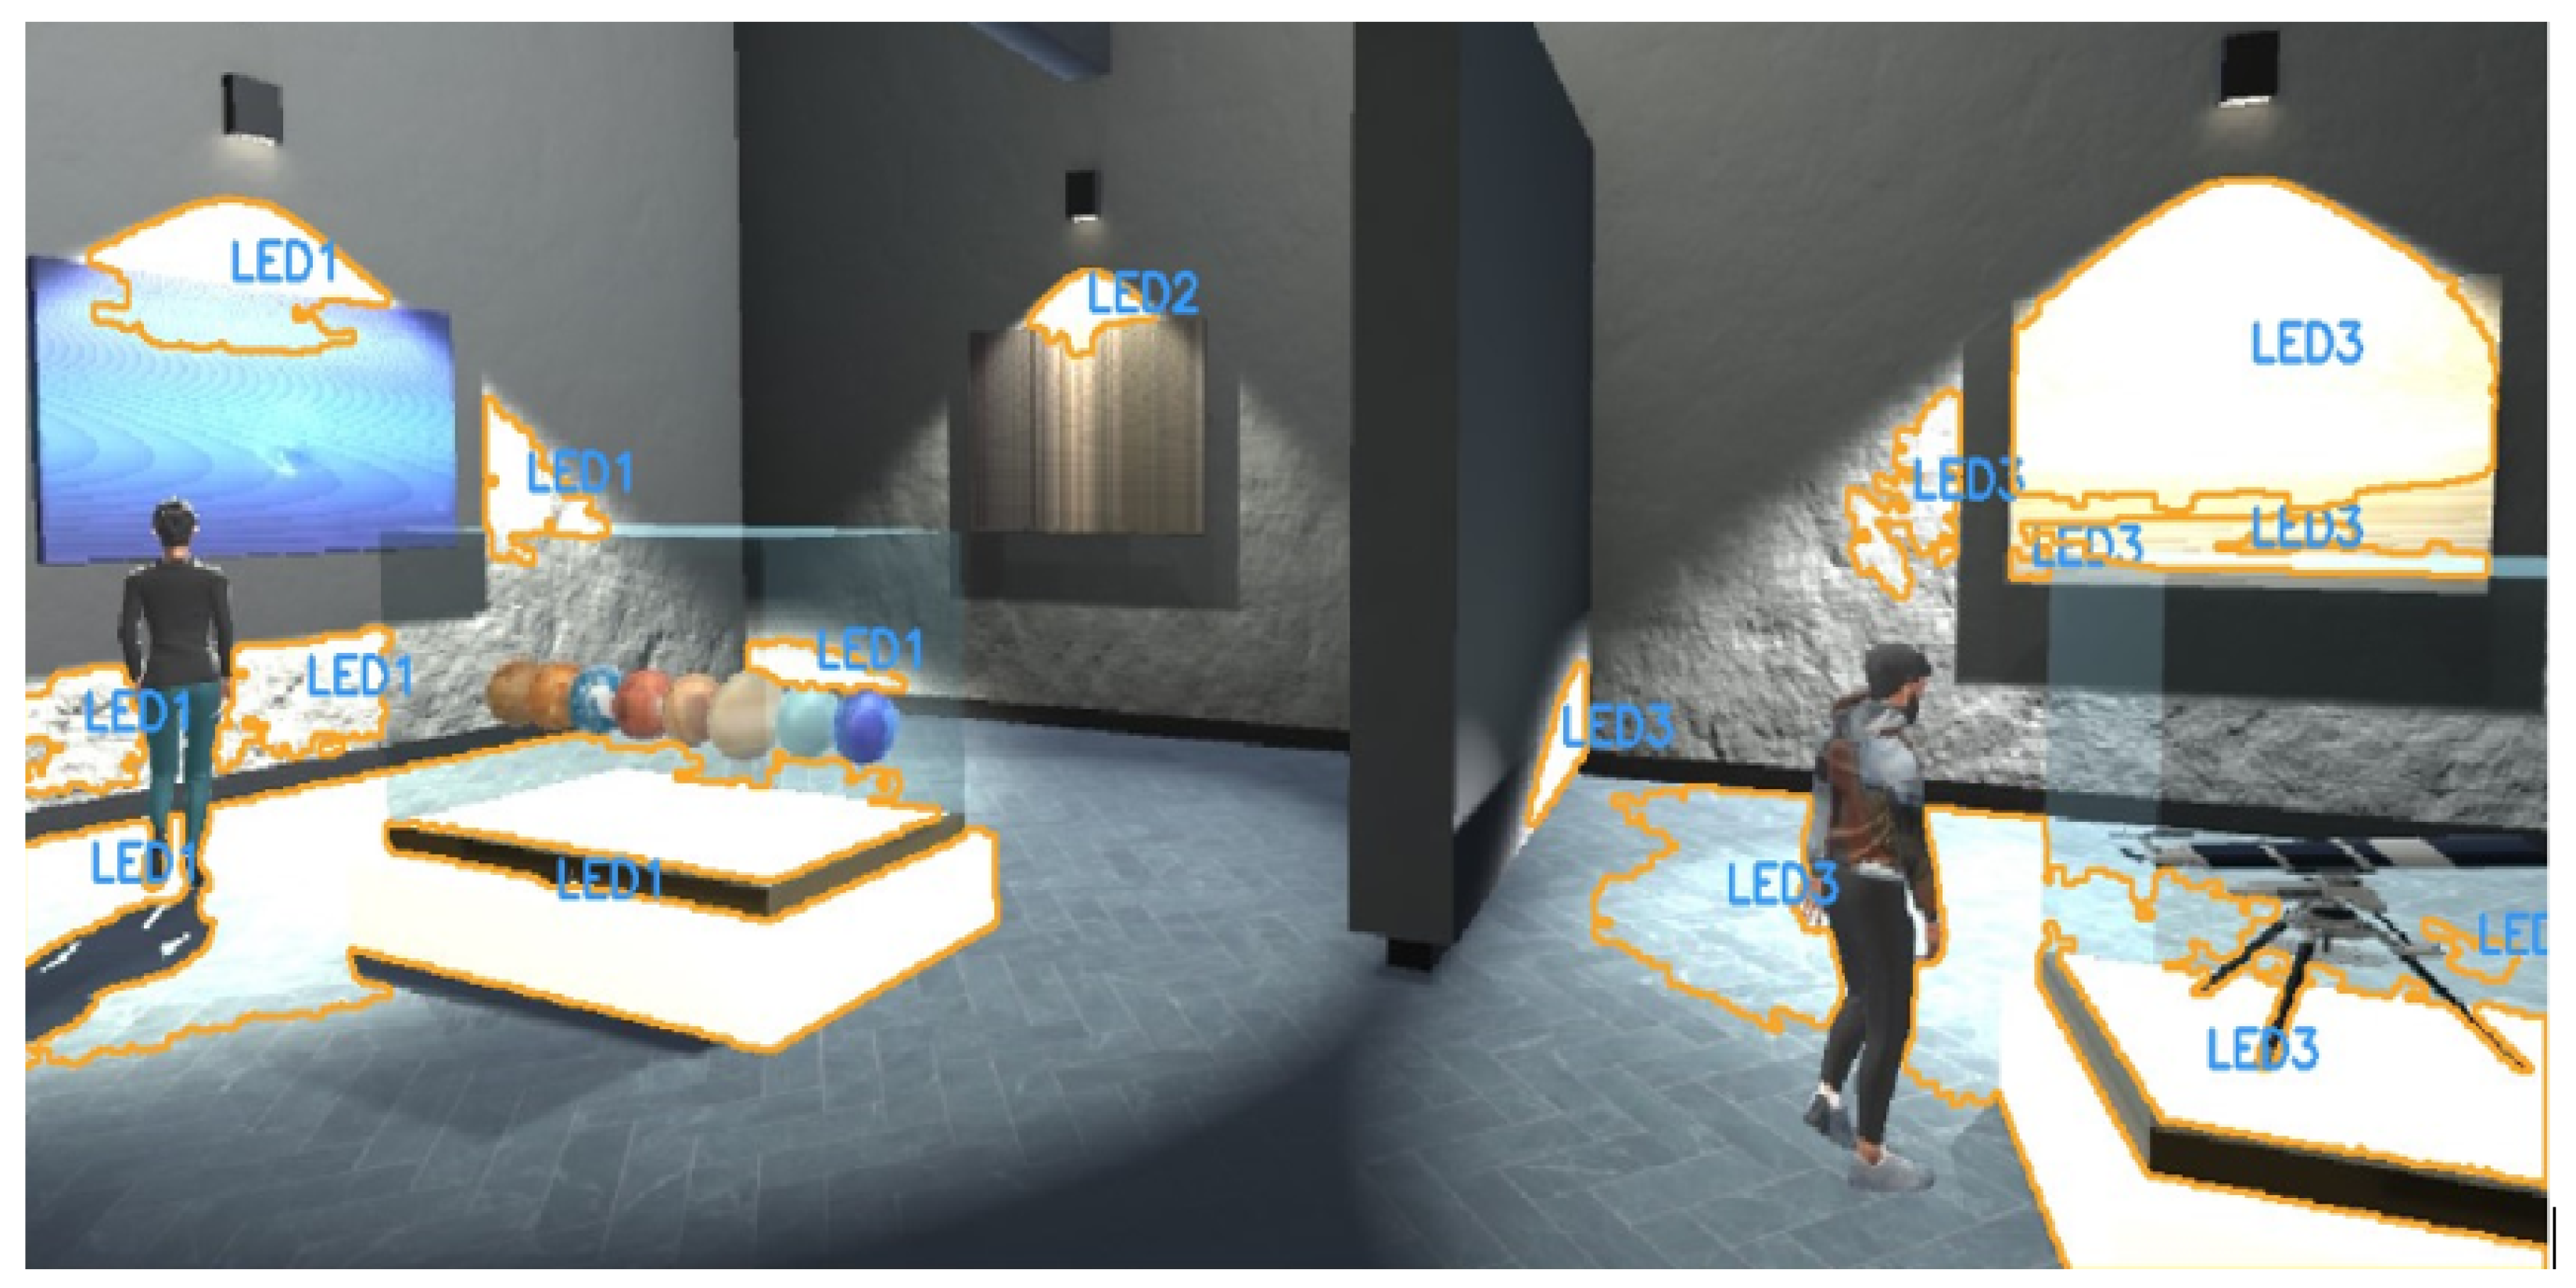
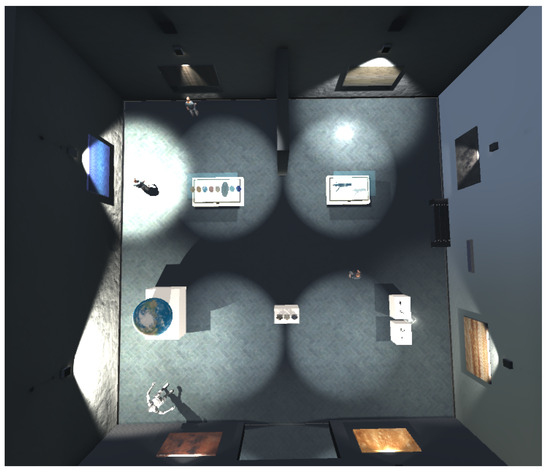
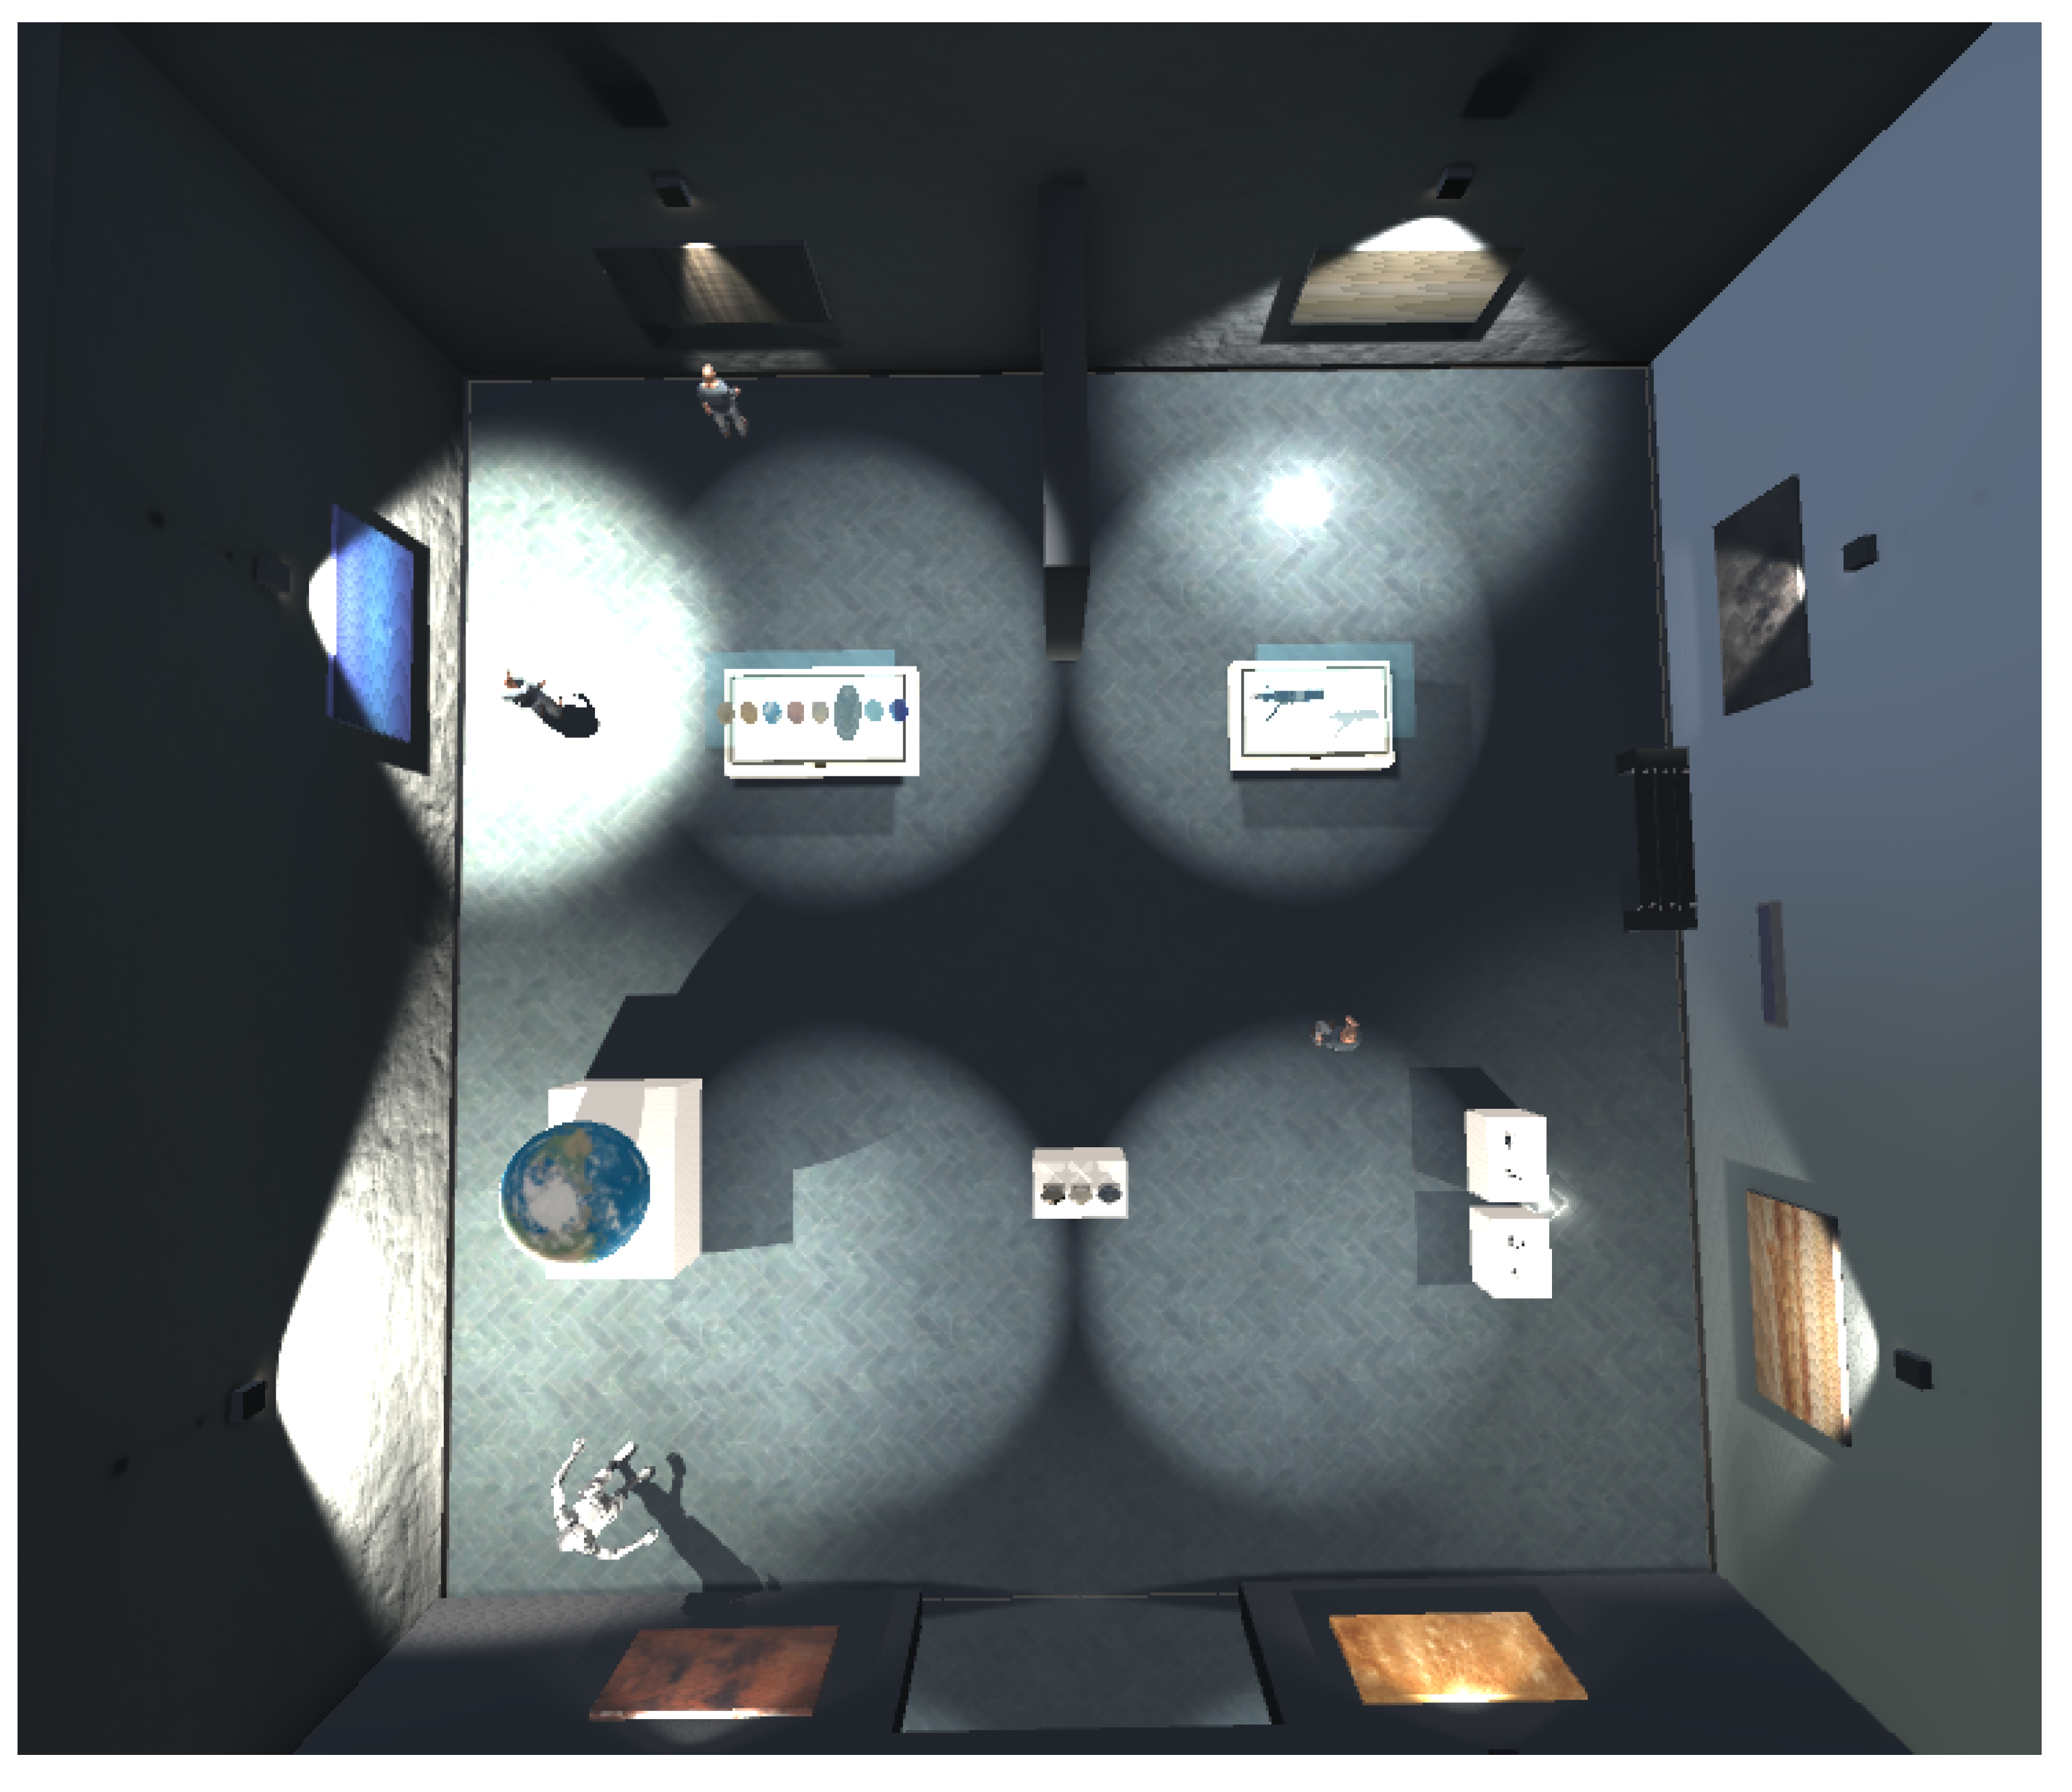
An exhibition room within a museum has been simulated within a 3D platform. This environment, designed to emulate a real museum space, becomes the ideal stage for implementing and validating the VLP technology, offering a testing ground that faithfully simulates the conditions to which the system would be subjected in real applications (see Figure 4).
Figure 4.
Virtual room created in 3D Develop Platform.
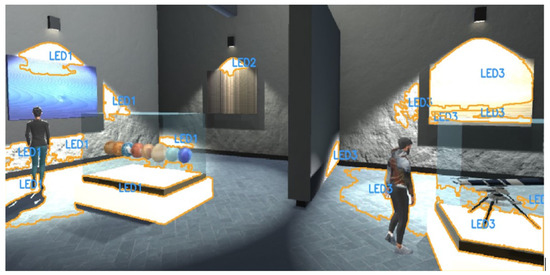
Figure 4 showcases the VLP system’s coverage within a virtual room, where repeated labels like LED1, LED2, and LED3 visually demarcate the illuminated zones, illustrating the LED sources’ range.
The design of the virtual room incorporates key elements such as detailed exhibitions, an adaptable lighting system, and avatars programmed to simulate the presence and movement of visitors, among other aspects, enabling a detailed evaluation of the accuracy and reliability of the VLP system under different lighting conditions and spatial configurations. The ability to dynamically adjust the lighting conditions in this simulated environment allows the testing of how the VLP system responds to significant variations in light, a critical element for validating the efficacy of light-based technologies, and increases robustness against ambient light-induced noise.
The implementation of the convolutional neural network (CNN) specialized in classifying 25 distinct optical codes emitted by the light sources within the simulation is crucial in this study. This CNN has undergone an exhaustive development and refinement process and has been trained using a diverse array of light patterns to ensure it classifies images accurately across a wide range of lighting conditions. The integration of this CNN with the VLP system enables quick and precise identification of each optical code, thereby facilitating detailed and contextualized navigation within the virtual environment.
The implementation of this virtual museum room, complemented with deep learning technology, marks a significant advancement in the simulation of VLP systems. This approach not only validates the technical viability of accurately classifying multiple optical codes in a controlled environment but also highlights the potential of VLP systems to enhance the navigation experience in complex and culturally significant indoor spaces, such as museums. The synergy between detailed environmental simulation and advanced CNN analytics establishes a robust and flexible methodology for testing and continuous improvement of the VLP system, ensuring that the technology is not only pioneering but also applicable and effective for accurately guiding visitors and enriching their experience in indoor environments.
4. Results
The CNN model demonstrated high accuracy in classifying optical codes across all tested distances, outperforming traditional detection methods, especially in low-light conditions. The results indicate that our neural network-based approach can significantly enhance OCC signal detection in environments with challenging lighting conditions.
4.1. CNN Evaluation
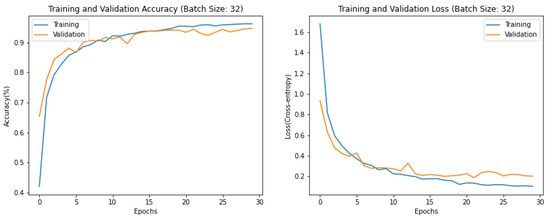
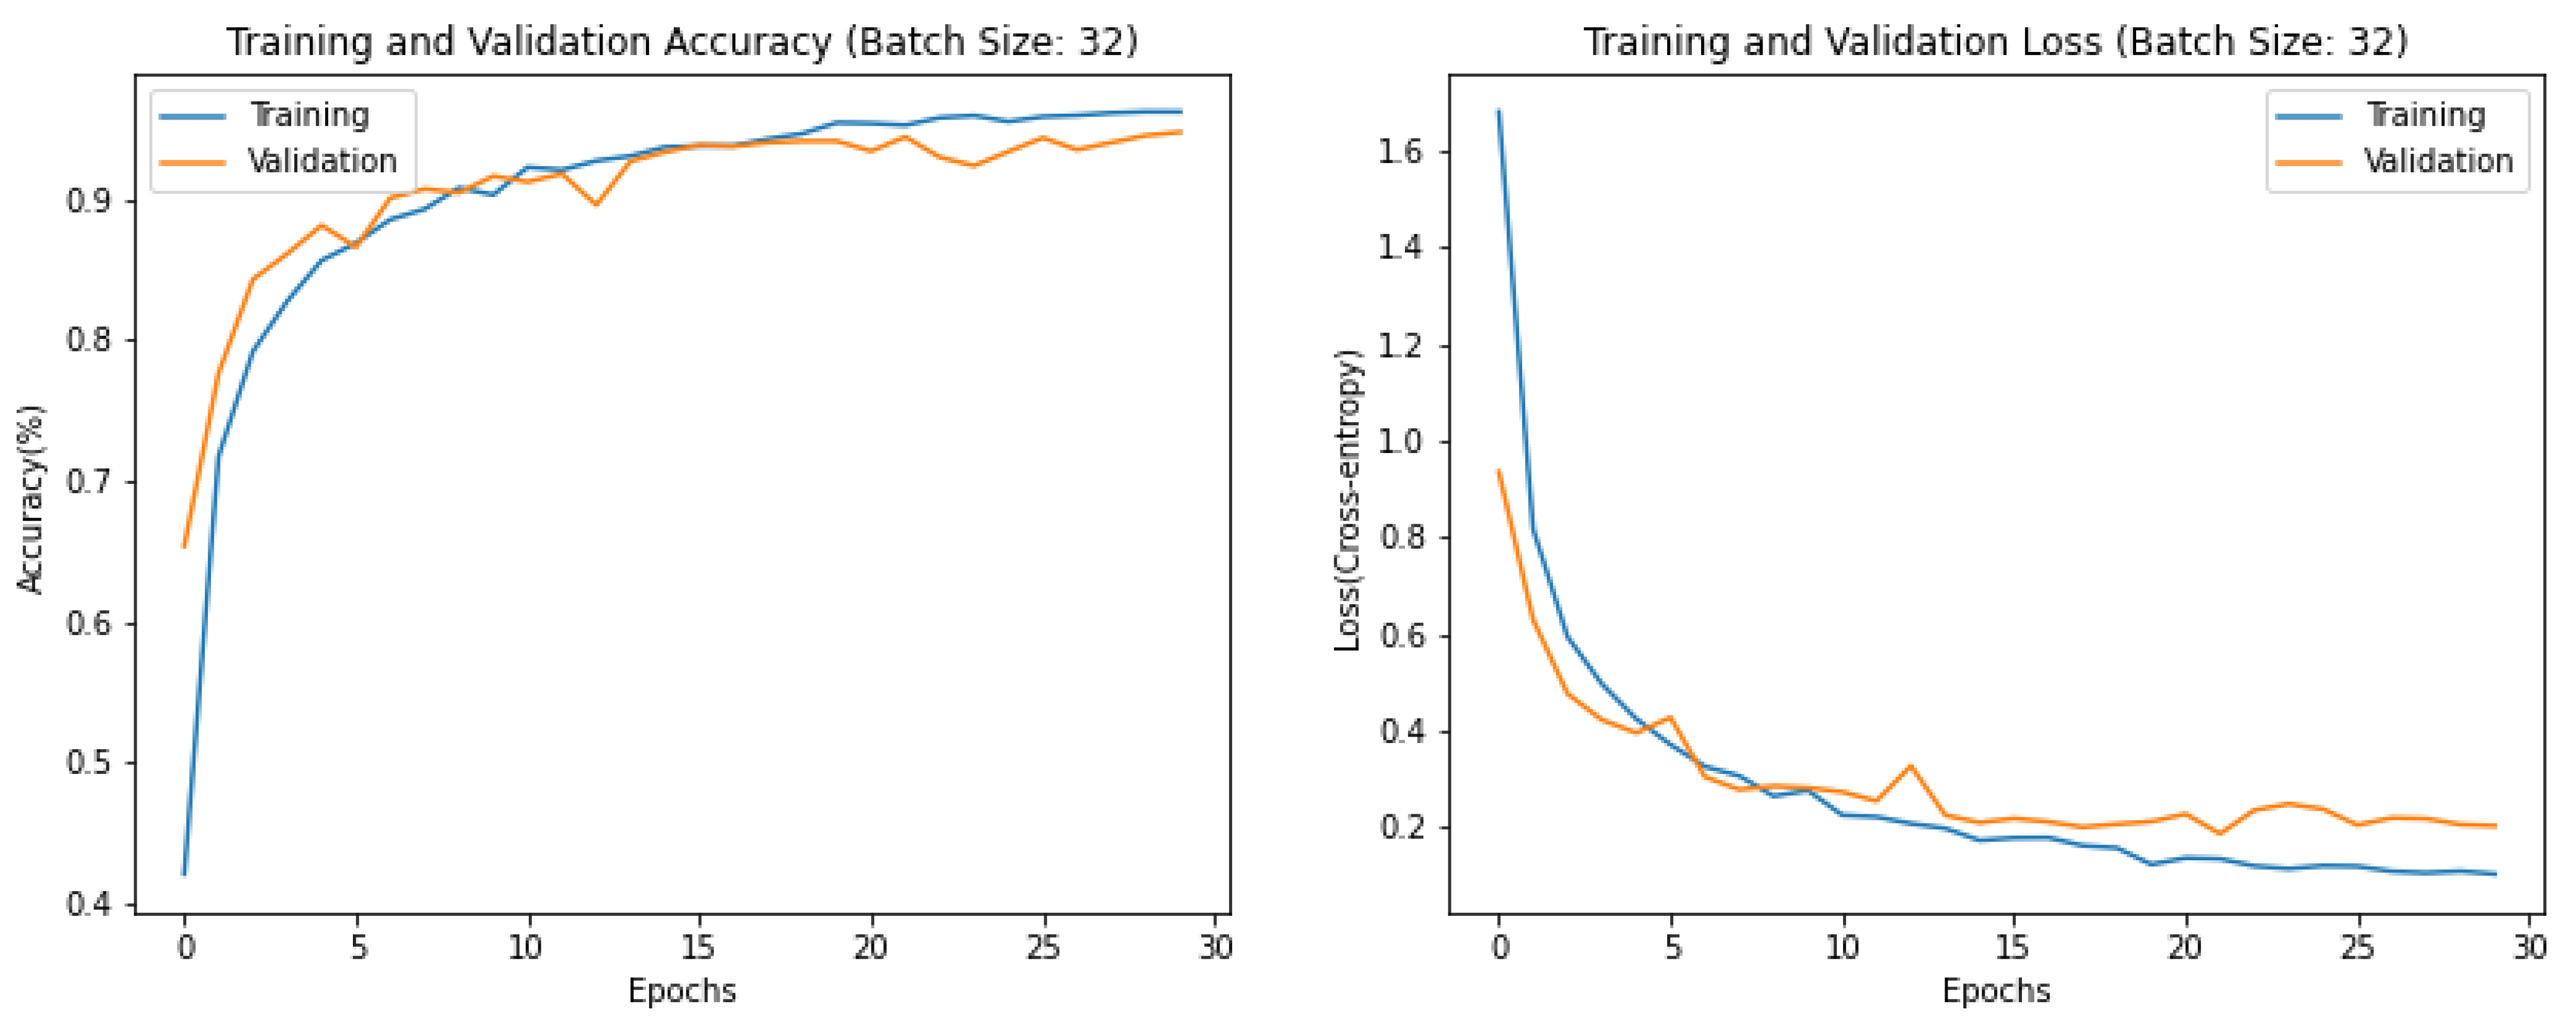
The learning curves for the CNN model provide valuable insight into the training and validation process over 30 epochs, with a focus on accuracy and loss for a batch size of 32 (Figure 5).
Figure 5.
Results of training and validation of CNN after 30 epochs.
The learning curves provide a clear visualization of the model’s performance throughout the training process over 30 epochs. Initially, we observe a phase of rapid learning, where the accuracy quickly ascends, and the loss—which reflects the model’s error rate—sharply declines. This indicates that the model is efficiently learning from the training data and improving its predictions at a fast rate.
Approaching the fifth epoch, the model begins to show signs of convergence. This is evident as the pace of improvement in accuracy decelerates, and the reduction in loss becomes less pronounced. The curves for both metrics start to level off, suggesting the model is reaching a state where further training yields little to no improvement in learning, the phenomenon commonly referred to as a “plateau”.
From around the 10th epoch onwards, the plateau phase is fully established. The accuracy curve flattens, and the loss curve stabilizes, indicating that the error rate of the model’s predictions has minimized to an optimal level given the current setup. The consistency in the loss curve, particularly the validation loss, confirms that the model is generalizing well to new, unseen data and is not merely memorizing the training dataset.
By the 30th epoch, the model’s learning curve exhibits no significant changes in both accuracy and loss, affirming that the model has reached its learning capacity. The slight gap between the training and validation loss remains steady. These results confirm the model as being well balanced between fitting the training data and generalizing to the validation data without overfitting.
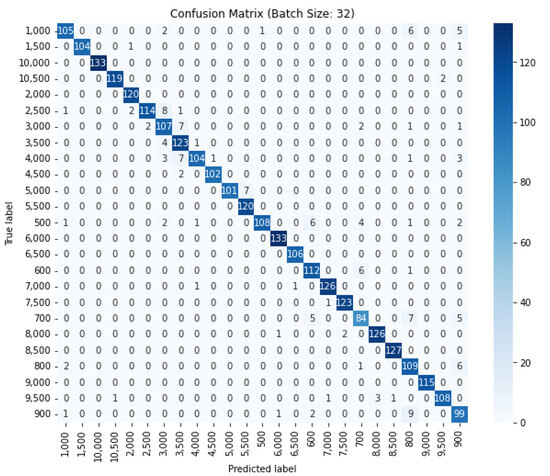
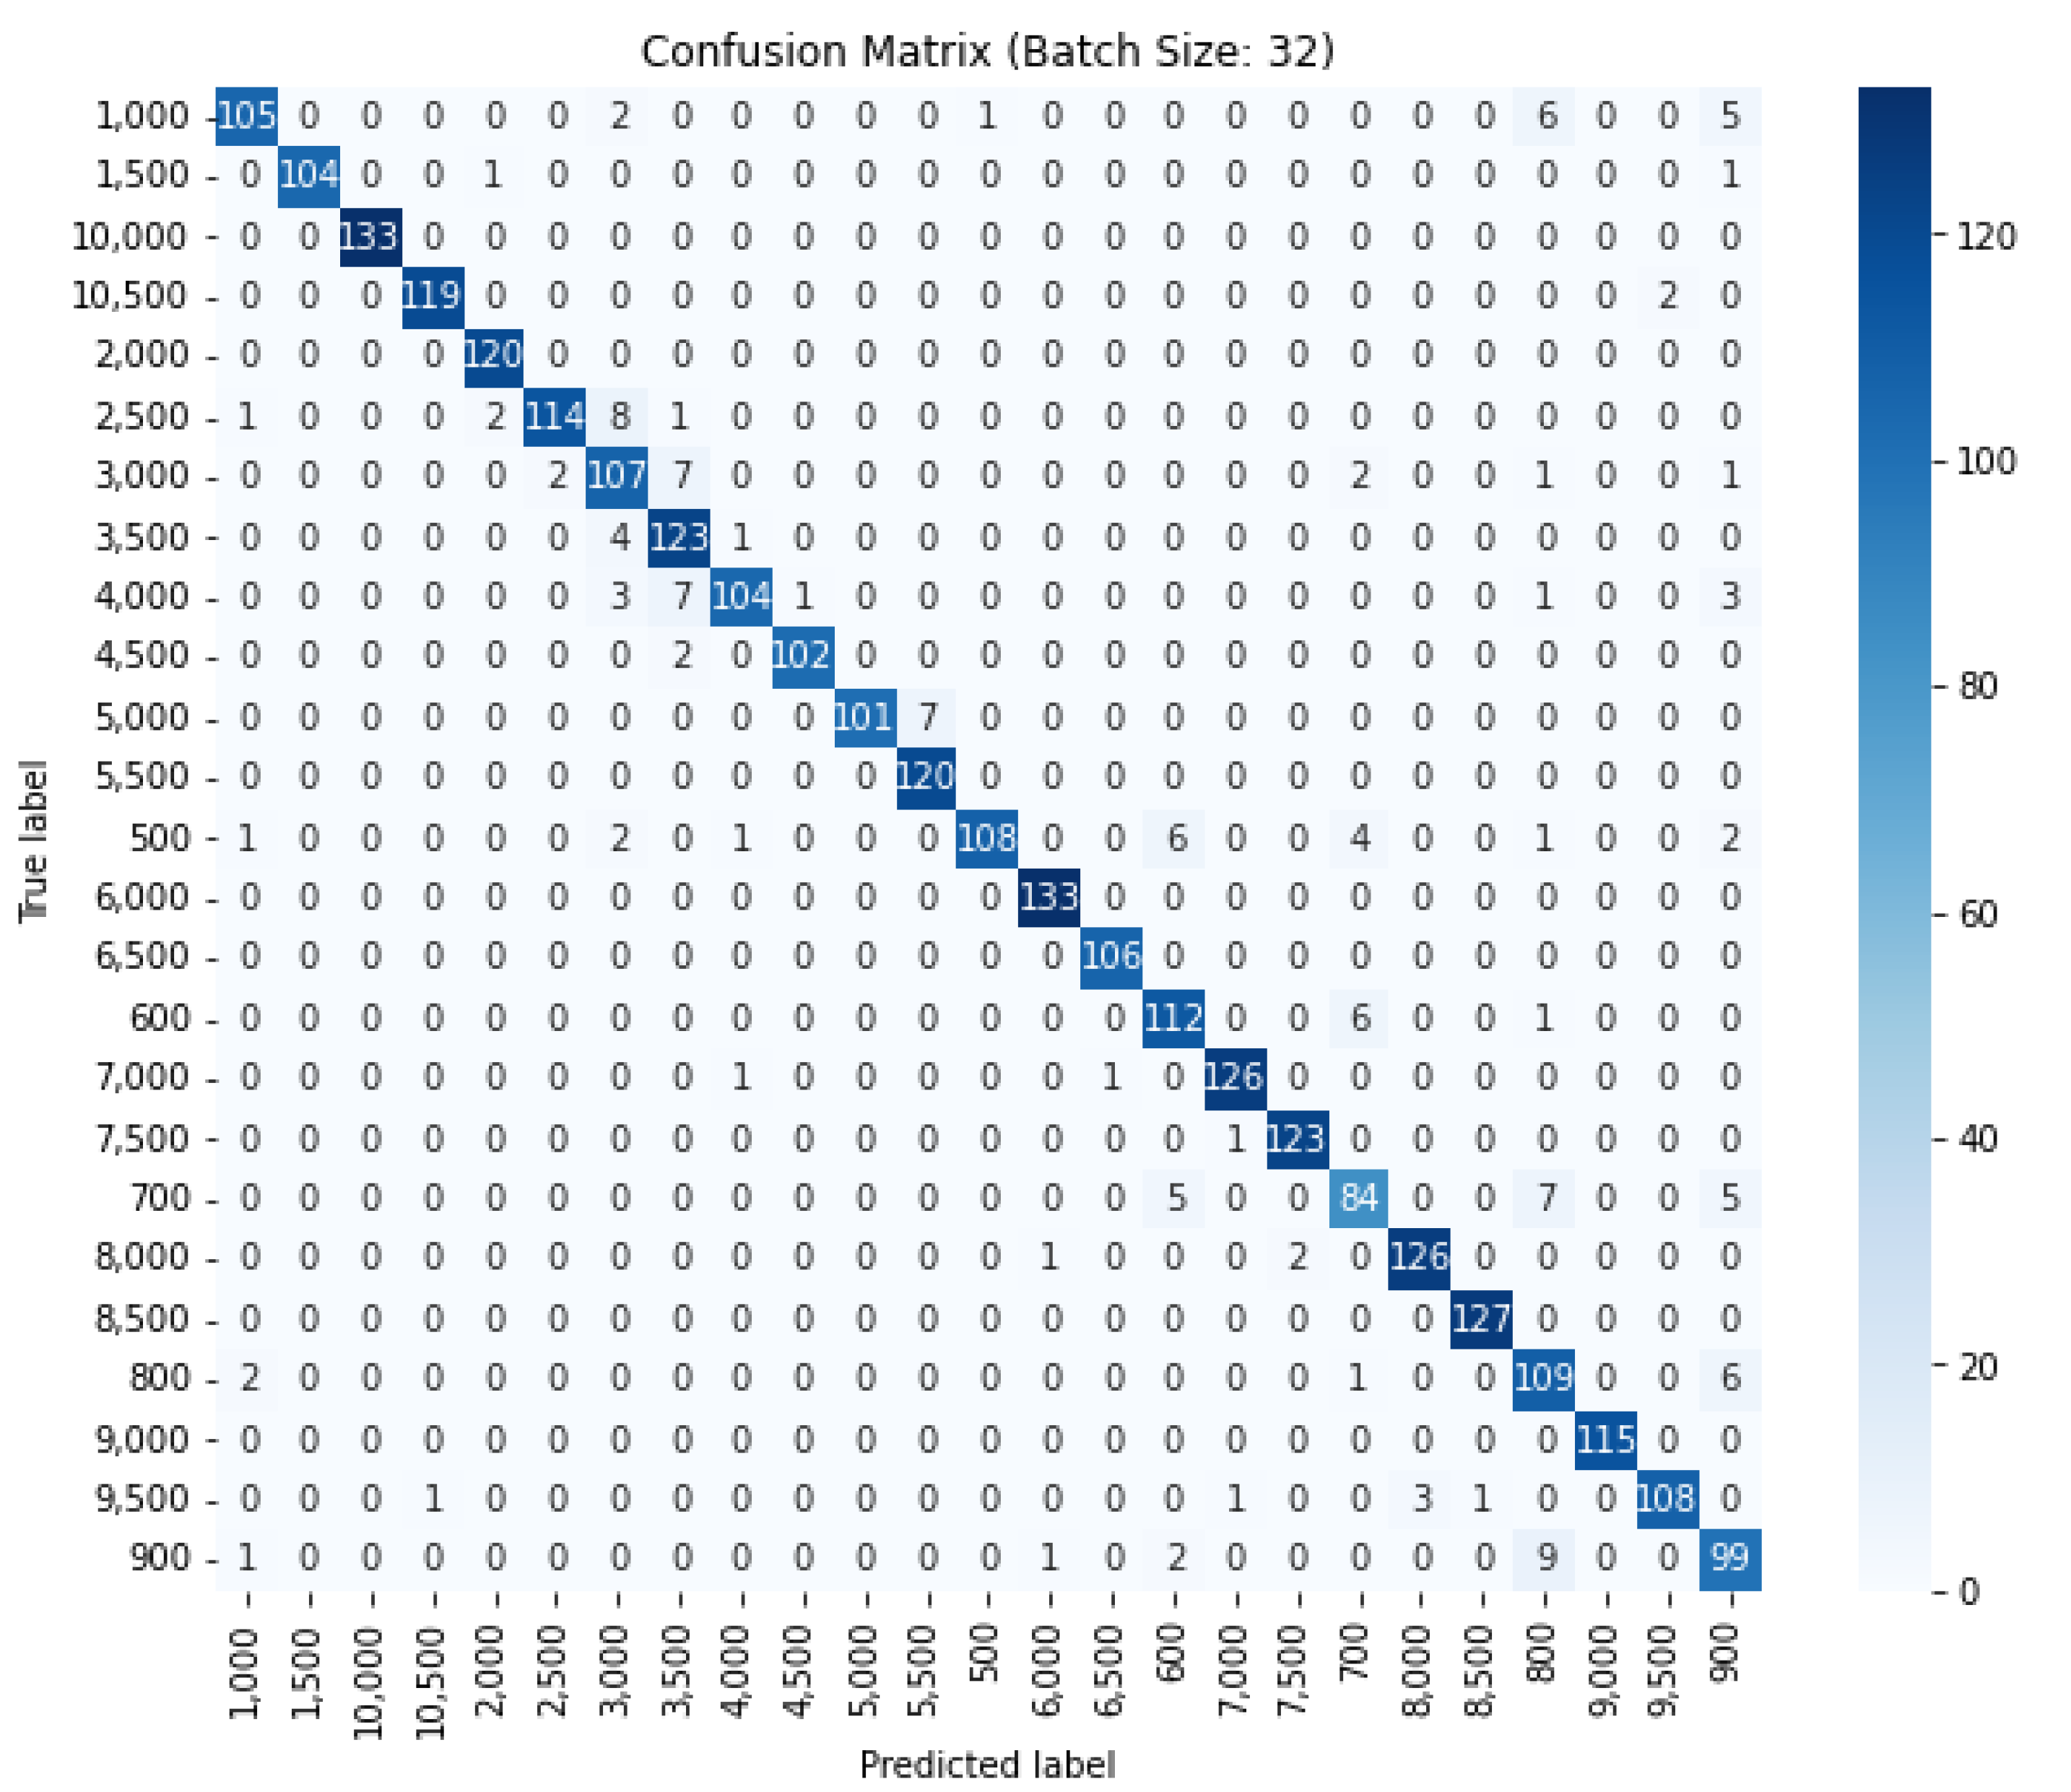
A comprehensive examination of the confusion matrix (Figure 6) indicates the model’s commendable accuracy across a broad spectrum of classes, effectively distinguishing the majority of optical codes. This performance attests to the model’s capacity for extracting and applying key features of each code towards accurate classification.
Figure 6.
Confusion matrix after 30 epochs.
Notably, the model exhibited remarkable accuracy with specific classes, such as ‘10,500’, ‘600’, ‘3500’, ‘1500’, ‘5500’, ‘2000’, and ‘8000’, with correct classifications numbering 134, 128, 124, 121, and 120, respectively. These outcomes highlight the model’s robustness in identifying a vast array of codes, evidencing its superior capability in feature extraction and the application of learned patterns to novel data.
Conversely, the matrix also shed light on precise instances of misclassification, offering pivotal insights for model enhancement. A recurrent issue was observed with the optical code ‘1000’, which saw misclassifications primarily with codes bearing close numerical or visual resemblance, such as ‘3000’, ‘500’, ‘700’, ‘800’, and ‘900’. This trend underscores the challenges in differentiating between codes with closely aligned numerical associations or visual characteristics, pinpointing an area ripe for improvement in the model’s feature discrimination aptitude.
A particular challenge was the differentiation between codes ‘900’ and ‘800’, where ‘900’ was frequently misclassified as ‘800’ on 17 occasions. This pattern of confusion between two closely related codes calls for a refinement in the model’s ability to discern the subtle distinctions between similar codes.
Moreover, the matrix intricately details the interaction among various codes, for instance, ‘2500’ being misclassified as ‘3000’ nine times. Alongside other notable confusions, such as between ‘5000’ and ‘5500’, this emphasizes the need to refine the specificity of the features that uniquely identify each class.
The insights gleaned from the confusion matrix not only affirm the model’s strengths in accurately classifying a diverse array of optical codes but also illuminate specific areas where the model struggles to distinguish between codes with near-identical numerical or visual features. Tackling these issues through strategic enhancements—like refining the model’s architecture, advancing feature extraction methodologies, or diversifying the training dataset—promises significant improvements in the model’s precision. This meticulous analysis serves as a cornerstone for future explorations aimed at rectifying the identified shortcomings, thereby bolstering the model’s functionality and reliability for precise optical code classification in practical applications.
The learning curves for the CNN model offer a compelling narrative of the model’s initial rapid learning phase over the first 30 epochs, where accuracy markedly increases and loss—an indicator of the model’s error rate—sharply decreases. By the 5th epoch, the model shows signs of convergence; as we progress to the 10th epoch and beyond, a plateau phase is evident, suggesting an optimal learning state has been achieved within the given configuration.
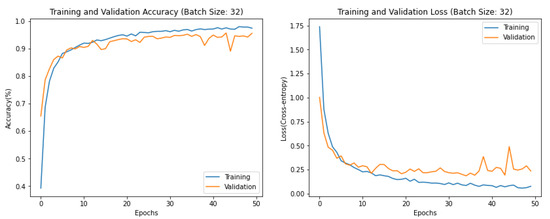
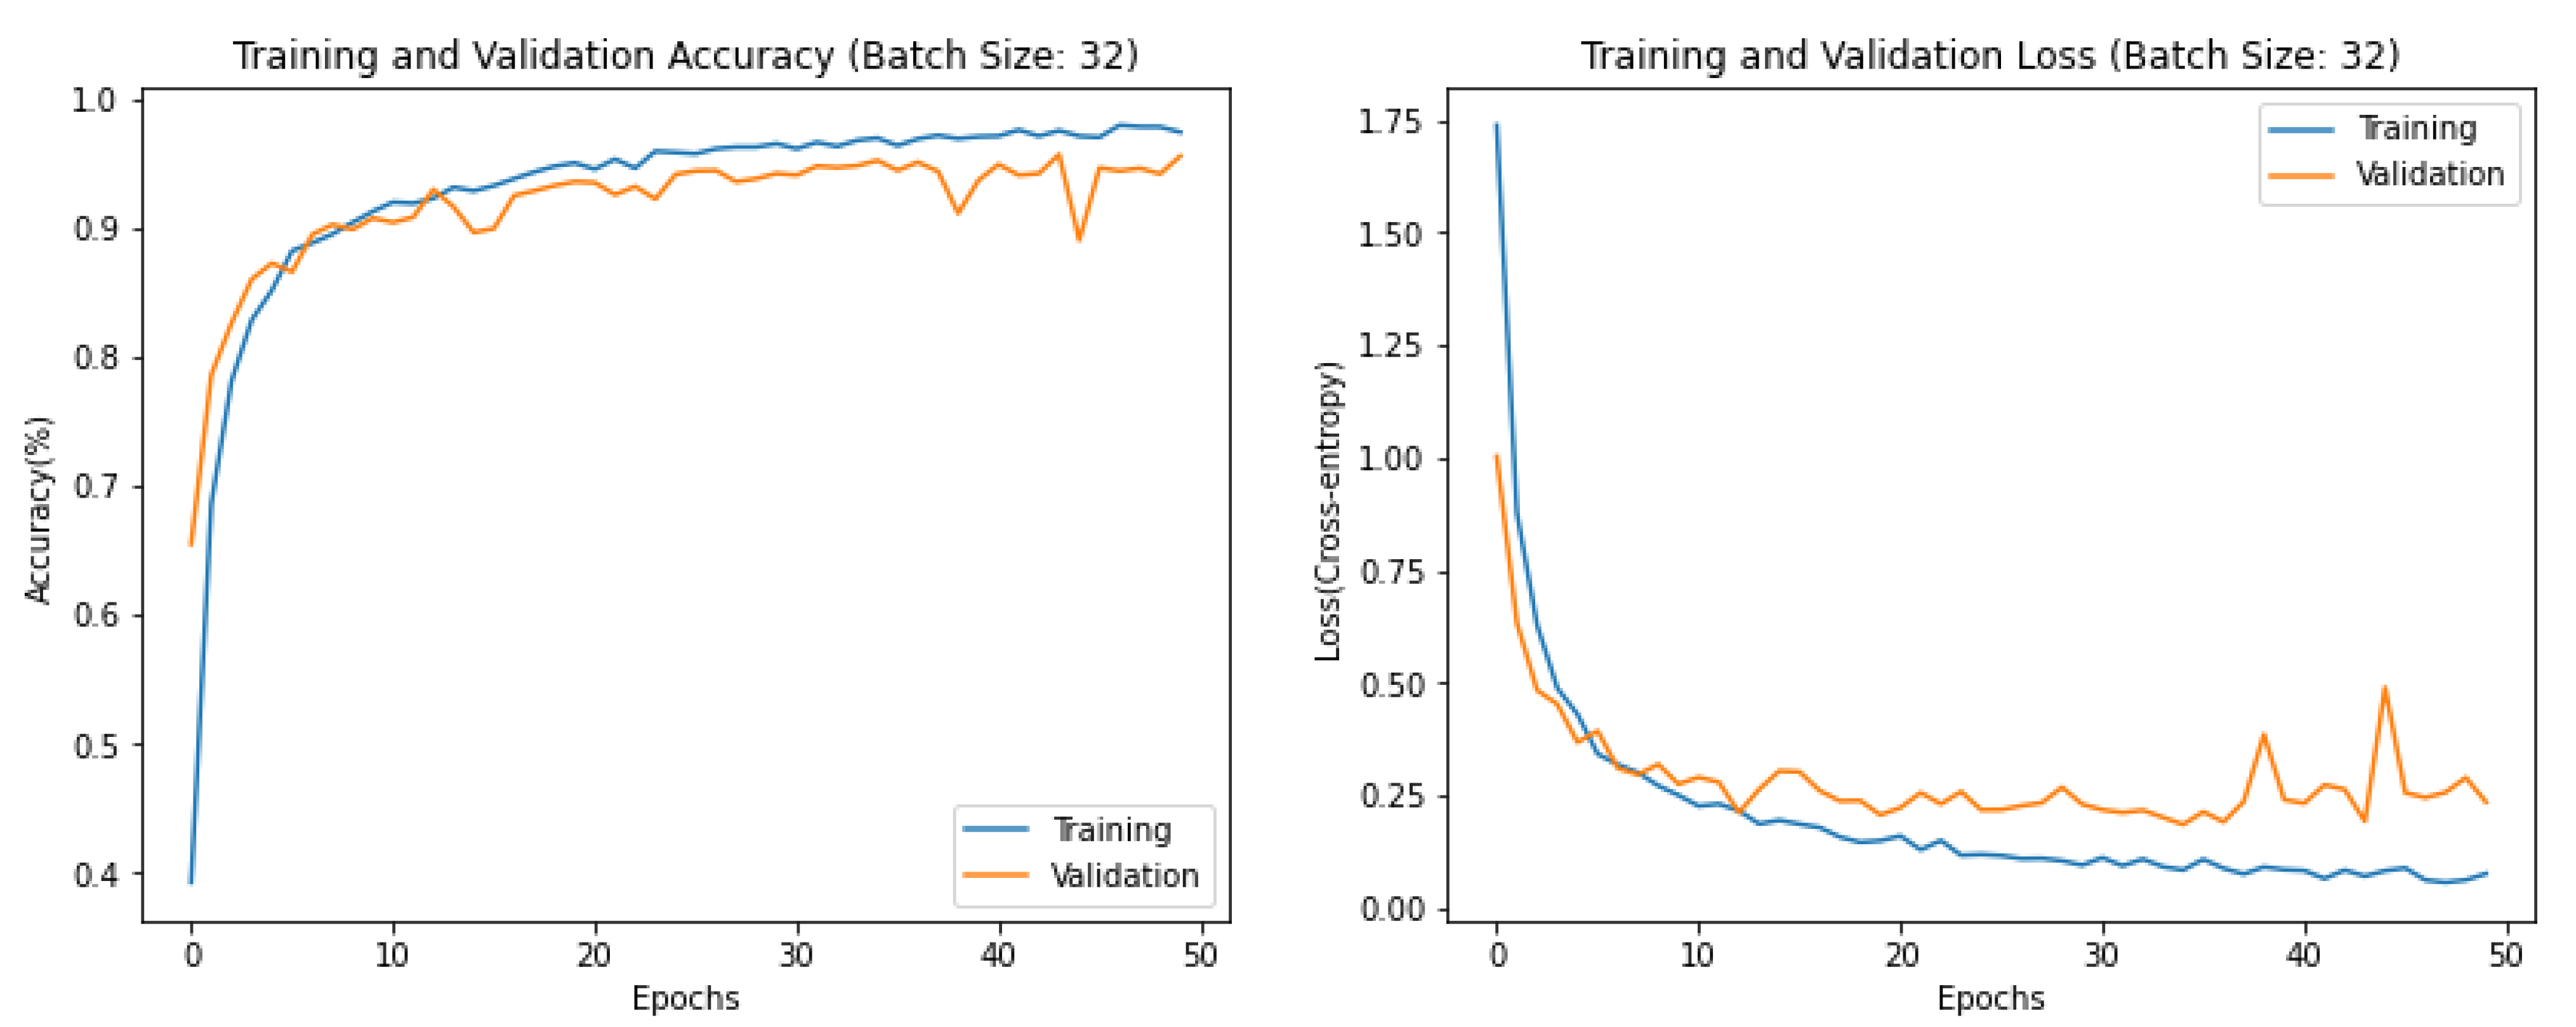
When these results are compared with the extended training period of 50 epochs (see Figure 7), a continued albeit slower improvement in accuracy suggests a nearing to the performance limit achievable with the current dataset. The validation loss shows a tendency to stabilize, with a slight uptick, potentially indicative of the early stages of overfitting.
Figure 7.
Results of training and validation of CNN after 50 epochs.
The confusion matrix at 30 epochs (see Figure 6) reveals commendable classification accuracy across a broad spectrum of optical codes, with certain classes achieving correct classification rates well over 120. Notable misclassifications occur for code ‘1000’, which is frequently confused with numerically or visually similar codes, as well as between the ‘900’ and ‘800’ codes.
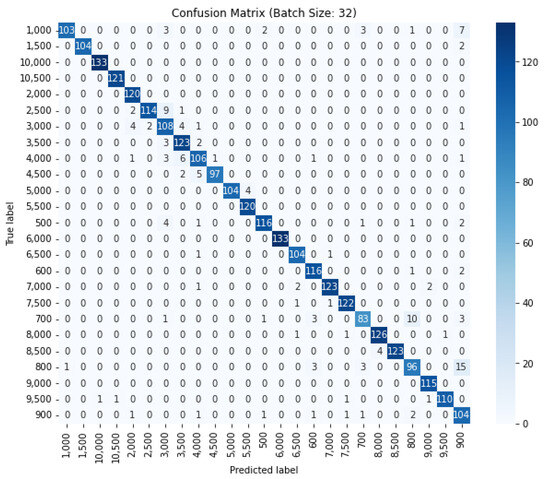
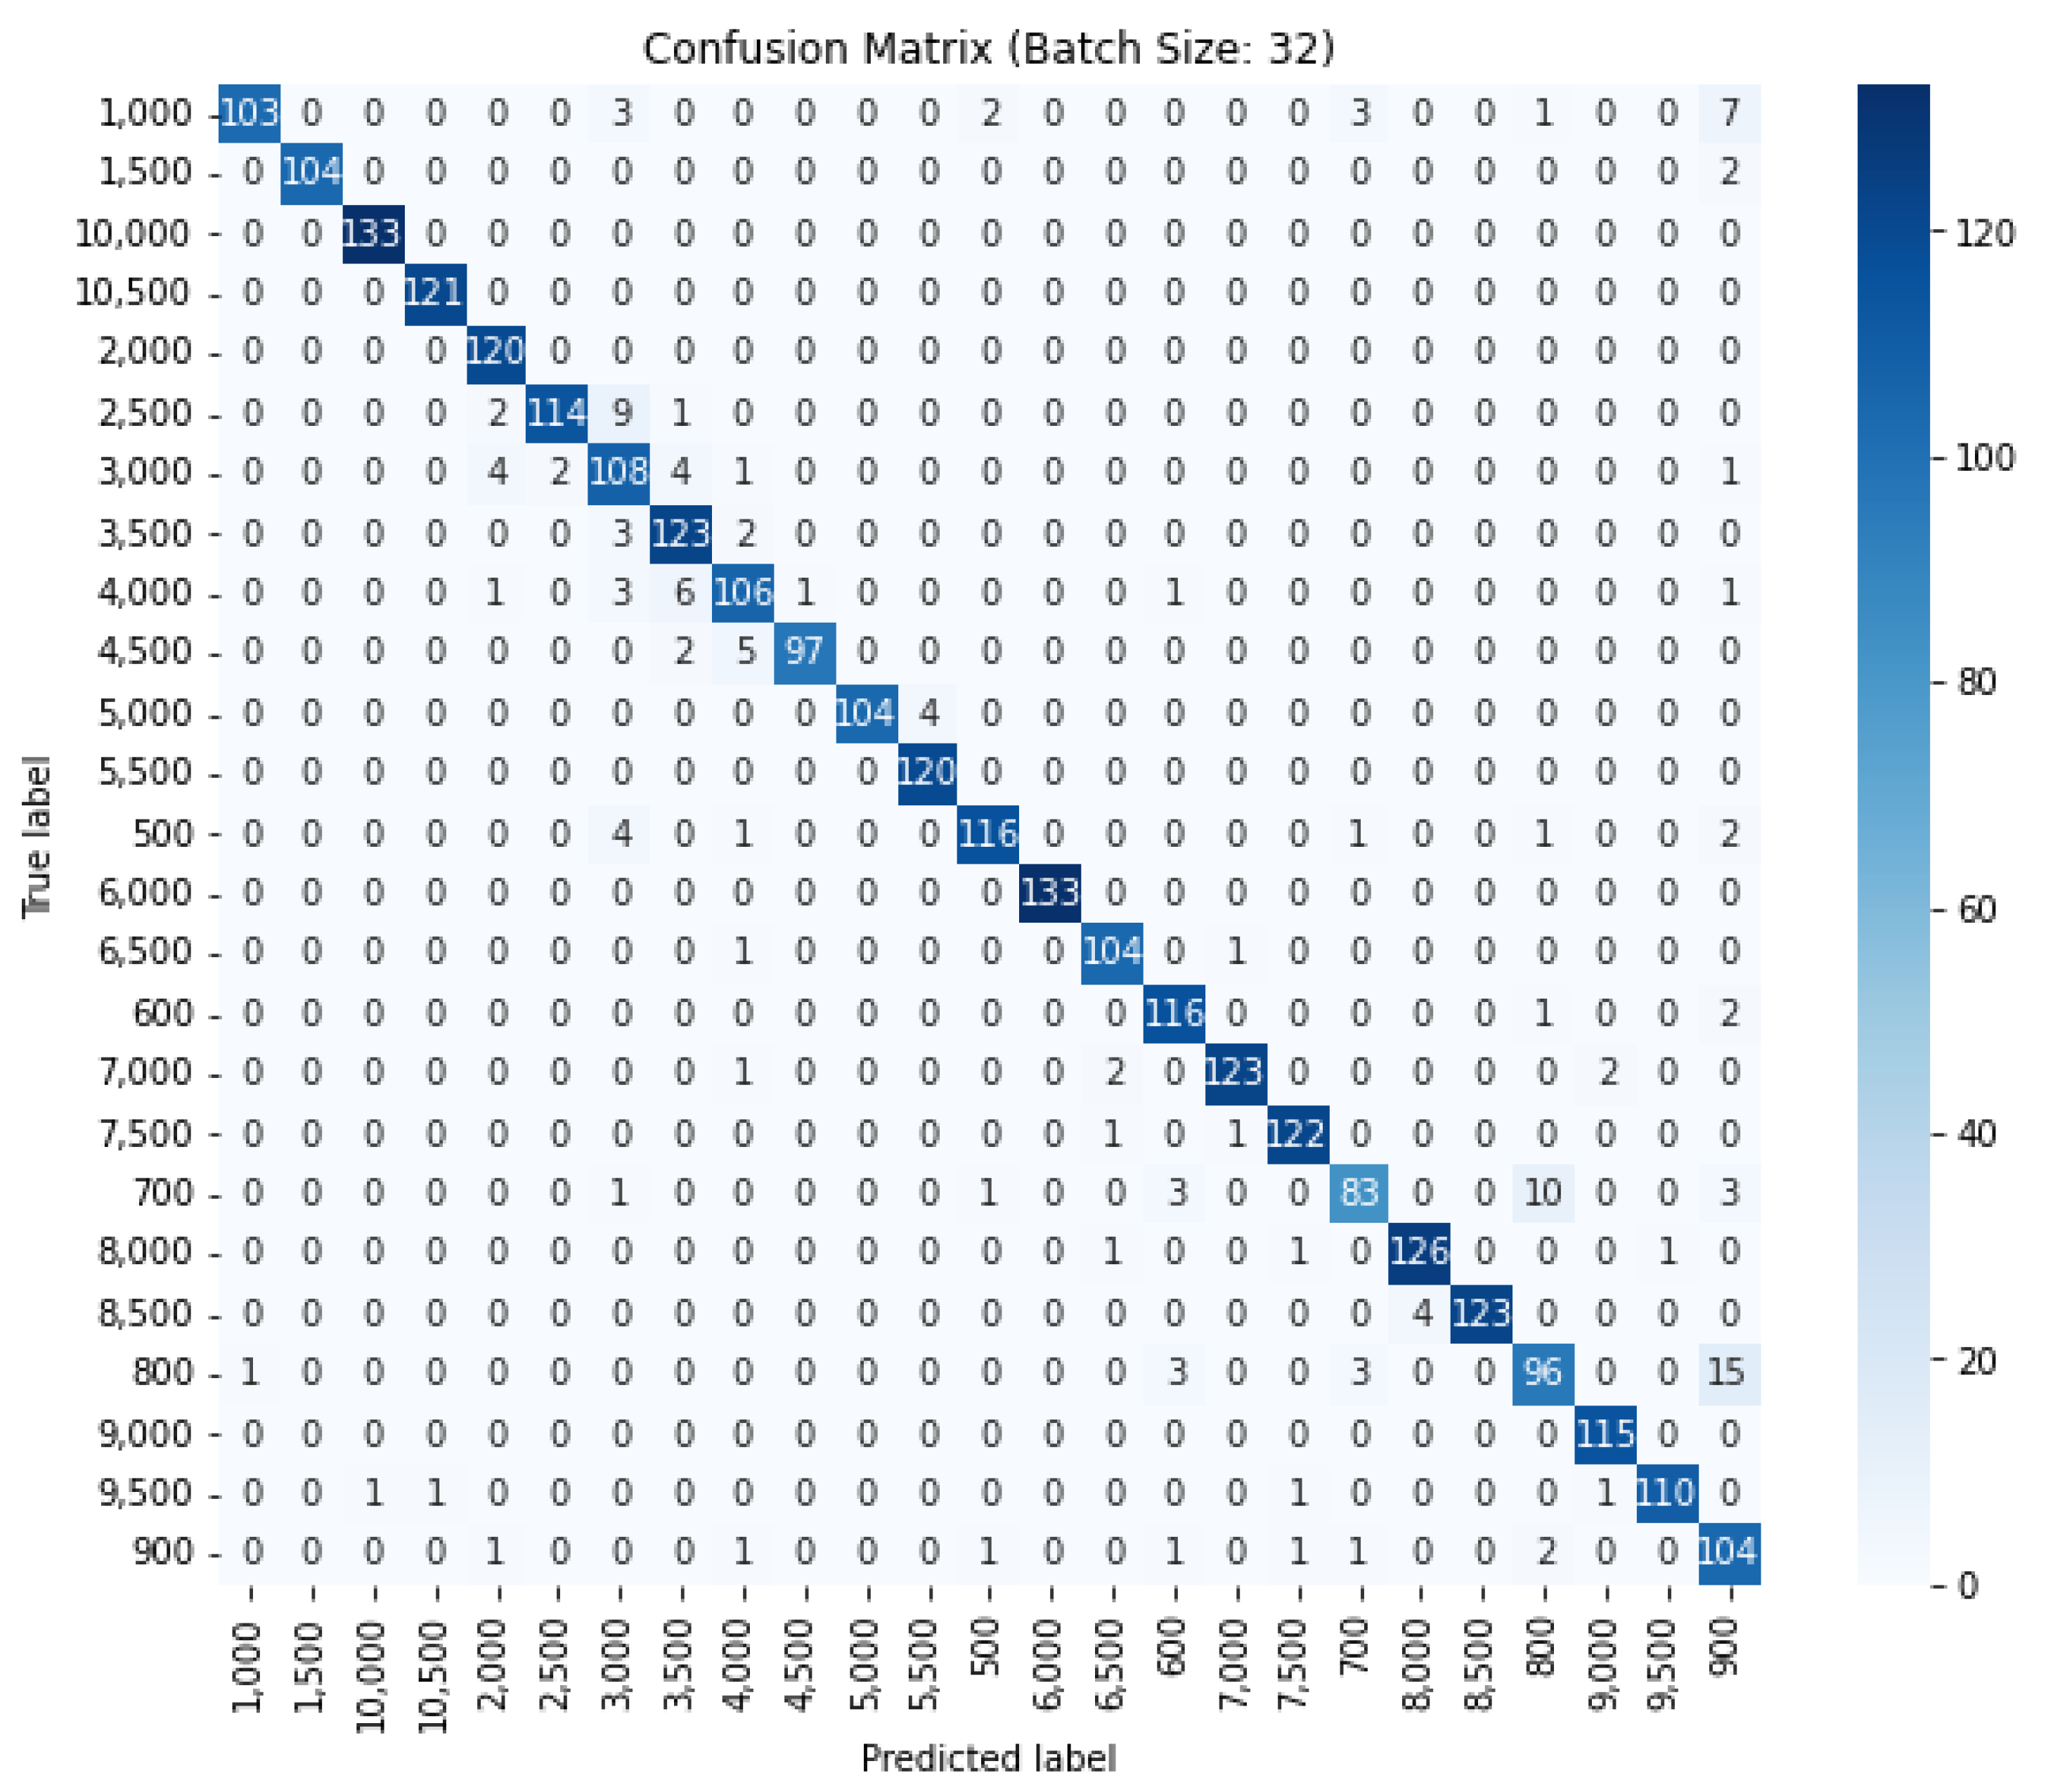
Examining the confusion matrix after 50 epochs (see Figure 8), it can be noticed a consistent pattern with some classes showing slight improvements in classification accuracy and continued misclassification errors for specific codes. This underscores that while additional training has led to incremental model improvements, certain structural confusions between similar classes remain unaddressed.
Figure 8.
Confusion matrix after 50 epochs.
These findings suggest that while the model is capable of effective learning and generalization up to a point, there is a performance threshold that requires further strategic intervention to surpass. Future research might focus on experimenting with deeper or more complex network architectures, advanced data augmentation techniques, and more sophisticated regularization methods to overcome current limitations and achieve even more precise discrimination between optical codes.
4.2. System Evaluation
Data exchange in the system evaluation is a crucial aspect that enables these virtual representations to simulate, analyze, and predict the performance and behavior of their physical counterparts in real-time. In this work, a virtual museum environment was programmed using a 3D rendering framework. The first step involved collecting data from the physical entity that the virtual entity represents. The positioning information obtained from the CNN was send to this virtual museum. This can include a wide range of data types such as operational data, sensor readings, environmental data, and maintenance records. The collected data are then integrated into the virtual environment. This process involves ensuring the data are in the correct format, are accurate, and reflect the current state of the physical entity. Data integration tools and middleware are often used to automate and streamline this process. For a virtual representation to be effective, it needs to be synchronized with its physical counterpart. This means that any changes in the physical entity should be reflected in the virtual environment in real-time or near-real-time. This synchronization is achieved through continuous data exchange between the physical and virtual models. With the data integrated, the virtual representation can simulate the behavior and performance of the physical entity under various conditions. Advanced analytics and machine learning models can be used to analyze the data, identify patterns, predict future performance, and potentially uncover insights that could lead to optimizations.
The virtual simulator environment, shown in Figure 9, was set with uniform light intensity for all LEDs during experiments. Future work, related to this aspect, will be done for demonstrating how accurately the proposed network can predict values across different LED brightness levels.
Figure 9.
Simulation of visible light positioning system in a virtual room.
The insights and predictions generated by the virtual environment can be fed back to the operators or automated systems controlling the physical entity. This creates a feedback loop where the physical and virtual continuously inform and improve each other’s performance. Given the sensitive nature of the data involved, security and privacy are paramount in the data exchange process. This includes securing the data transmission channels, ensuring data integrity, and implementing access controls and privacy measures.
5. Discussion
In addition to the configuration of the lighting conditions for each of the lamps, an advanced convolutional neural network (CNN) is implemented specifically designed for the classification of the 25 unique optical codes emitted. This CNN is the result of a rigorous development and training process, where it has been fed with a data set composed of varied light patterns, corresponding to the optical codes generated by the lighting system. The integration of this deep learning technology into the VLP system represents a qualitative leap in the system’s ability to accurately and efficiently interpret the light data received.
The network has been optimized to recognize and classify these codes with high precision, even in conditions of light variability and under different spatial configurations. The implementation of CNN allows the VLP system to not only detect the presence of an encoded light source, but also to unambiguously identify the specific optical code it emits. This is essential for the effective operation of the system, since each optical code is associated with a precise location within the simulated or real environment, thus allowing detailed guidance and navigation for users.
The integration of CNN into the museum room simulation adds an additional layer of intelligence to the VLP system, enabling real-time classification of optical codes in the environment. This ensures that regardless of fluctuations in lighting conditions or changes in space configuration, the system can deliver accurate and up-to-date positioning information. Such capability is essential for applications in dynamic, culturally rich environments such as museums, where accuracy in wayfinding and the provision of relevant contextual content can significantly enrich the visitor experience.
The synergy between detailed lighting simulation and the powerful analytical capabilities of CNN is at the heart of the innovation in our VLP system. This combination not only demonstrates the technical feasibility of classifying multiple optical codes in a complex environment, but also underlines the transformative potential of visible light positioning technology for indoor navigation and spatial interaction.
Researchers investigating future research opportunities should be aware of the limitations of this study. First, depending on the data used to train it and the conditions under which the images were captured, the model developed to classify LED images may have some limitations. It is important to note that LEDs can emit light at higher or lower frequencies, and depending on the frequency of the flicker, it can affect the quality of the illumination and how the light is perceived. Another consideration is that reducing mobile images from 1440 × 1440 pixels to 150 × 150 pixels can impact image quality to make the model load and run faster. As a result, the quality of the photos is another major limitation, as low-resolution photos can make it difficult for the model to distinguish between different light patterns. The size of the photos has been reduced due to problems with loading and running the images to train the model. Future studies will consider this reduction, as it may affect the quality of the images collected for the LED detection model. Variations in lighting can also cause problems, and the model may need assistance to accurately identify photos if the lighting conditions change too much during image collection. In terms of future research, this study may inspire investigations into the combined use of VLP and OCC in indoor tourist localization beyond museums. In addition, this study may motivate future research on the application of machine learning techniques in the tourism industry to examine and understand the data collected by VLP and OCC technologies.
Author Contributions
Conceptualization, L.A.-C.; Methodology, L.A.-C.; Software, J.R.; Validation, S.R.; Formal analysis, L.A.-C., J.R. and R.P.-J.; Data curation, S.R. and L.A.-C.; Writing—original draft, S.R., L.A.-C. and J.R.; Writing—review & editing, R.P.-J.; Supervision, R.P.-J.; Funding acquisition, R.P.-J. All authors have read and agreed to the published version of the manuscript.
Funding
This work has been partially funded by the Spanish Science, Universities and Innovation Ministry, projects PID2020-114561RB-I00 OCCAM and TED2021-130049-C21/22-SUCCESS.
Data Availability Statement
Data is contained within the article.
Conflicts of Interest
The authors declare no conflicts of interest. The funders had no role in the design of the study; in the collection, analyses, or interpretation of data; in the writing of the manuscript; or in the decision to publish the results.
Abbreviations
The following abbreviations are used in this manuscript:
| OCC | Optical Camera Communications |
| VLP | Visible Light Positioning |
| CNN | Convolutional Neural Network |
| SIM | Stacked Intelligent Metasurfaces |
| JCAS | Joint Communication and Sensing |
| JCSL | Joint Communication, Sensing, and Localization |
| OFDM | Orthogonal Frequency-Division Multiplexing |
References
- Framework and Overall Objectives of the Future Development of IMT for 2030 and Beyond. International Telecommunication Union. ITU-R Working Groups-IMT Systems. WP5D Document 5/131-E. 2023. Available online: https://www.itu.int/md/R19-WP5D-230612-TD-0905/en (accessed on 4 May 2024).
- Liu, F.; Cui, Y.; Masouros, C.; Xu, J.; Han, T.X.; Eldar, Y.C.; Buzzi, S. Integrated Sensing and Communications: Toward Dual-Functional Wireless Networks for 6G and Beyond. IEEE J. Sel. Areas Commun. 2022, 40, 1728–1767. [Google Scholar] [CrossRef] [Scilit]
- An, J.; Yuen, C.; Guan, Y.L.; Di Renzo, M.; Debbah, M.; Poor, H.V.; Hanzo, L. Two-Dimensional Direction-of-Arrival Estimation Using Stacked Intelligent Metasurfaces. arXiv 2024, arXiv:2402.08224. [Google Scholar]
- Buhalis, D.; Foerste, M. SoCoMo marketing for travel and tourism: Empowering co-creation of value. J. Destin. Mark. Manag. 2015, 4, 151–161. [Google Scholar] [CrossRef] [Scilit]
- Aguiar-Castillo, L.; Guerra, V.; Rufo, J.; Rabadan, J.; Perez-Jimenez, R. Survey on optical wireless communications-based services applied to the tourism industry: Potentials and challenges. Sensors 2021, 21, 6282. [Google Scholar] [CrossRef] [Scilit]
- Ahmed, M.F.; Hasan, M.K.; Shahjalal, M.; Alam, M.M.; Jang, Y.M. Experimental Demonstration of Continuous Sensor Data Monitoring Using Neural Network-Based Optical Camera Communications. IEEE Photonics J. 2020, 12, 1–11. [Google Scholar] [CrossRef] [Scilit]
- Schaedler, M.; Bluemm, C.; Kuschnerov, M.; Pittalà, F.; Calabrò, S.; Pachnicke, S. Deep Neural Network Equalization for Optical Short Reach Communication. Appl. Sci. 2019, 9, 4675. [Google Scholar] [CrossRef] [Scilit]
- Li, X.; Hassan, N.B.; Burton, A.; Ghassemlooy, Z.; Zvanovec, S.; Perez-Jimenez, R. A simplified model for the rolling shutter based camera in optical camera communications. In Proceedings of the 2019 15th International Conference on Telecommunications (ConTEL), Graz, Austria, 3–5 July 2019; pp. 1–5. [Google Scholar]
- Shahjalal, M.; Hasan, M.K.; Chowdhury, M.Z.; Jang, Y.M. Smartphone Camera-Based Optical Wireless Communication System: Requirements and Implementation Challenges. Electronics 2019, 8, 913. [Google Scholar] [CrossRef] [Scilit]
- Soares, M.R.; Chaudhary, N.; Eso, E.; Younus, O.I.; Nero Alves, L.; Ghassemlooy, Z. Optical Camera Communications with Convolutional Neural Network for Vehicle-toVehicle Links. In Proceedings of the 2020 12th International Symposium on Communication Systems, Networks and Digital Signal Processing (CSNDSP), Porto, Portugal, 20–22 July 2020; pp. 1–6. [Google Scholar] [CrossRef] [Scilit]
- An, J.; Li, H.; Ng, D.W.K.; Yuen, C. Fundamental Detection Probability vs. Achievable Rate Tradeoff in Integrated Sensing and Communication Systems. IEEE Trans. Wirel. Commun. 2023, 22, 9835–9853. [Google Scholar] [CrossRef] [Scilit]
- Zhu, Z.; Guo, C.; Bao, R.; Chen, M.; Saad, W.; Yang, Y. Positioning Using Visible Light Communications: A Perspective Arcs Approach. IEEE Trans. Wirel. Commun. 2023, 22, 6962–6977. [Google Scholar] [CrossRef] [Scilit]
- Armstrong, J.; Sekercioglu, Y.A.; Neild, A. Visible light positioning: A roadmap for international standardization. IEEE Commun. Mag. 2013, 51, 68–73. [Google Scholar] [CrossRef] [Scilit]
- Rabadan, J.; Guerra, V.; Rodríguez, R.; Rufo, J.; Luna-Rivera, M.; Perez-Jimenez, R. Hybrid visible light and ultrasound-based sensor for distance estimation. Sensors 2017, 17, 330. [Google Scholar] [CrossRef] [Scilit] [PubMed]
- Chavez-Burbano, P.; Guerra, V.; Rabadan, J.; Jurado-Verdu, C.; Perez-Jimenez, R. Novel indoor localization system using optical camera communication. In Proceedings of the 2018 11th International Symposium on Communication Systems, Networks & Digital Signal Processing (CSNDSP), Budapest, Hungary, 18–20 July 2018; pp. 1–5. [Google Scholar]
- Long, Q.; Zhang, J.; Cao, L.; Wang, W. Indoor Visible Light Positioning System Based on Point Classification Using Artificial Intelligence Algorithms. Sensors 2023, 23, 5224. [Google Scholar] [CrossRef] [Scilit] [PubMed]
- Ma, S.; Yang, R.; Li, B.; Chen, Y.; Li, H.; Wu, Y.; Safari, M.; Li, S.; Al-Dhahir, N. Optimal Power Allocation for Integrated Visible Light Positioning and Communication System With a Single LED-Lamp. IEEE Trans. Commun. 2022, 70, 6734–6747. [Google Scholar] [CrossRef] [Scilit]
- Chen, S.Q.; Chi, X.F.; Li, T.Y. Non-line-of-sight optical camera communication aided by a pilot. Opt. Lett. 2021, 46, 3348–3351. [Google Scholar] [CrossRef] [Scilit]
- Song, H.; Wen, S.; Yang, C.; Yuan, D.; Guan, W. Universal and Effective Decoding Scheme for Visible Light Positioning Based on Optical Camera Communication. Electronics 2021, 10, 1925. [Google Scholar] [CrossRef] [Scilit]
- Afzalan, M.; Jazizadeh, F. Indoor Positioning Based on Visible Light Communication: A Performance-based Survey of Real-world Prototypes. ACM Comput. Surv. 2019, 52, 35. [Google Scholar] [CrossRef] [Scilit]
- Mahmoud, A.A. Precision indoor three-dimensional visible light positioning using receiver diversity and multi-layer perceptron neural network. IET Optoelectron. 2020, 14, 440–446. [Google Scholar] [CrossRef] [Scilit]
- Mao, W.; Xie, H.; Tan, Z.; Liu, Z.; Liu, M. High precision indoor positioning method based on visible light communication using improved Camshift tracking algorithm. Opt. Commun. 2020, 468, 125599. [Google Scholar] [CrossRef] [Scilit]
- Zhang, J.; Yan, L.; Jiang, L.; Yi, A.; Pan, Y.; Pan, W.; Luo, B. Convolutional Neural Network Equalizer for Short-reach Optical Communication Systems. In Proceedings of the Asia Communications and Photonics Conference/International Conference on Information Photonics and Optical Communications 2020 (ACP/IPOC), Beijing, China, 24–27 October 2020; Optica Publishing Group: Washington, DC, USA, 2020; p. M4A.320. [Google Scholar] [CrossRef] [Scilit]
- Yu, K.; He, J.; Huang, Z. Decoding scheme based on CNN for mobile optical camera communication. Appl. Opt. 2020, 59, 7109–7113. [Google Scholar] [CrossRef] [Scilit] [PubMed]
- Islam, A.; Hossan, M.T.; Jang, Y.M. Convolutional neural networkscheme–based optical camera communication system for intelligent Internet of vehicles. Int. J. Distrib. Sens. Netw. 2018, 14, 1550147718770153. [Google Scholar] [CrossRef] [Scilit]
- Wild, T.; Braun, V.; Viswanathan, H. Joint Design of Communication and Sensing for Beyond 5G and 6G Systems. IEEE Access 2021, 9, 30845–30857. [Google Scholar] [CrossRef] [Scilit]
- Nemati, M.; Kim, Y.H.; Choi, J. Toward joint radar, communication, computation, localization, and sensing in IoT. IEEE Access 2022, 10, 11772–11788. [Google Scholar] [CrossRef] [Scilit]
- Singh, R.K.; Rahmani, M.H.; Weyn, M.; Berkvens, R. Joint Communication and Sensing: A Proof of Concept and Datasets for Greenhouse Monitoring Using LoRaWAN. Sensors 2022, 22, 1326. [Google Scholar] [CrossRef] [Scilit] [PubMed]
- Wu, K.; Zhang, J.A.; Huang, X.; Guo, Y.J. Joint Communications and Sensing Employing Multi- or Single-Carrier OFDM Communication Signals: A Tutorial on Sensing Methods, Recent Progress and a Novel Design. Sensors 2022, 22, 1613. [Google Scholar] [CrossRef] [Scilit]

Disclaimer/Publisher’s Note: The statements, opinions and data contained in all publications are solely those of the individual author(s) and contributor(s) and not of MDPI and/or the editor(s). MDPI and/or the editor(s) disclaim responsibility for any injury to people or property resulting from any ideas, methods, instructions or products referred to in the content. |
© 2024 by the authors. Licensee MDPI, Basel, Switzerland. This article is an open access article distributed under the terms and conditions of the Creative Commons Attribution (CC BY) license (https://creativecommons.org/licenses/by/4.0/).