Article

A Novel Electric Motor Fault Diagnosis by Using a Convolutional Neural Network, Normalized Thermal Images and Few-Shot Learning

1
Department of Electromechanical Engineering, University of Macau, Taipa 999078, Macau
2
Department of Computer and Information Science, University of Macau, Taipa 999078, Macau
3
State Key Laboratory of Internet of Things for Smart City and Department of Ocean Science and Technology, University of Macau, Taipa 999078, Macau
*
Author to whom correspondence should be addressed.
Electronics 2024, 13(1), 108; https://doi.org/10.3390/electronics13010108
Submission received: 18 November 2023 / Revised: 16 December 2023 / Accepted: 25 December 2023 / Published: 26 December 2023

Abstract

:
Motors constitute one critical part of industrial production and everyday life. The effective, timely and convenient diagnosis of motor faults is constantly required to ensure continuous and reliable operations. Infrared imaging technology, a non-invasive industrial fault diagnosis method, is usually applied to detect the equipment status in extreme environments. However, conventional Infrared thermal images inevitably show a large amount of noise interference, which affects the analysis results. In addition, each motor may only possess a small amount of fault data in practice, as collecting an infinite amount of motor data to train the diagnostic system is impossible. To overcome these problems, a novel automatic fault diagnosis system is proposed in this study. Data features are enhanced by a normalization module based on color bars first, as the same color in various infrared thermal images represent different temperatures. Then, the few-shot learning method is used to diagnose the faults of unseen electric motors. In the few-shot learning method, the minimum dataset size required to expand system universality is fifteen pieces, effectively solving the universality problem of artificial-to-natural data migration. The method saves a large amount of training data resources and the experimental training data collection. The accuracy of the fault diagnosis system achieved 98.9% on similar motor datasets and 91.8% on the dataset of motors that varied a lot from the training motor, which proves the high reliability and universality of the system.

1. Introduction

In recent years, driven by the rapid advancement of industries, motors have become indispensable power sources in automated industrial production processes. Motors typically handle demanding tasks, running for extended periods under high power and heavy loads, and even in harsh environmental conditions [1,2,3]. Faults in motor components can result in accidents and operational shutdowns, exerting a substantial impact on personal safety and economic efficiency. The early detection of the core causes of motor faults through types of monitoring equipment and advanced diagnostic methods can yield substantial cost savings in labor and maintenance. Additionally, it also shields factory productivity from unexpected disruptions [4,5]. Hence, the developments of condition detection and fault diagnosis methods are vital for motors.
In general, motor faults can be categorized into two primary types: electrical and mechanical faults [6,7]. The most prevalent faults are mechanical in nature, encompassing issues such as bearing faults, gear faults, fan faults, and short coil faults, among others [8,9,10,11]. Nowadays, techniques that rely on capturing current and vibration signals using traditional intrusion sensors are widely employed for motor fault diagnosis. The utilization of various signal types opens diverse avenues for enhancing the possibilities of motor fault diagnosis [12]. Conventional approaches diagnose faults by scrutinizing and analyzing the frequency of the gathered current, vibration, and acoustic signals [13,14]. The sensors in the above methods should usually be positioned in easily accessible locations for routine inspections, which usually show high efficiency. Detecting faults becomes a tough task in scenarios with inadequate lubrication or difficulties in sensor installation [15,16]. Additionally, the intricacies of industrial motor configurations sometimes necessitate their placement within machinery or specific areas of a factory. This placement can pose challenges in accessing the motors for routine checks, often requiring disassembling the machinery casing and installing sensors to detect current and vibration signals. As a result, manual extraction of fault features from motor signals becomes significantly restricted under such circumstances. This limitation impacts the safety maintenance of equipment for engineers and may even lead to considerable economic losses [17]. Moreover, traditional manual feature engineering methods also necessitate advanced expertise and the use of expensive sensor equipment and data acquisition systems, leading to escalating maintenance costs. Although these traditional methods are well-established, they consume considerable time for computation and diagnosis, which subsequently causes delays. Consequently, conventional diagnostic approaches frequently lack efficiency and cost-effectiveness in various scenarios [18,19].
Recently, infrared thermography (IRT) has gained prominence as a condition-monitoring technique, which relies on non-invasive temperature measurements obtained using a single sensor, without the need for physical contact [20,21,22]. The noise level on IRT images is small, which can address the challenge of signals being heavily influenced by noise and other environmental factors, and they are now extensively applied in the inspection of transformers and electrical installations [23,24]. Guan et al. [25] used IRT images to diagnose hot-water pipe leaks and insulation damage and achieved an overall accuracy of 97%. Glowacz et al. [26] proposed a diagnostic technique based on extracting feature vectors from IRT images that could effectively detect faults in electrical equipment. Omneya et al. [27] adapted the infrared thermography technique to the offshore environment and accurately detected problems with all electrical and mechanical components of wind turbines. By eliminating the need for traditional contact sensors, there is no longer a requirement to install sensors for extended durations in hard-to-reach offshore wind turbines. Furthermore, this approach eliminates the challenges associated with repairing faults in such remote locations. Therefore, fault diagnosis techniques based on IRT are deemed capable of precisely evaluating the performance and reliability of diverse machine components in a manner unaffected by signal noises. Currently, research on the application of IRT in motor fault detection and diagnosis is scarce, and the potential for effectively implementing the IRT technique remains to be substantiated.
Traditional fault diagnosis methods based on machine learning extract features from original signals (vibration, current, etc.), and perform classification and diagnosis using machine learning methods [28,29], including fuzzy theory, backpropagation (BP) neural networks, support vector machines, artificial neural networks (ANN), etc. Recently, convolutional neural networks (CNNs) have emerged as the mainstream option for fault diagnosis due to their exceptional feature-extraction capability [30,31,32,33,34]. For example, Lee [35] proposed a method of learning from multiple types of sensor signals to accurately identify gearbox faults. The sensor signals from current and vibration were transformed into time–frequency distributions (TFD) using wavelet transform and subsequently input into a deep convolutional neural network for feature learning. Nevertheless, these methods have the inherent drawback of producing correlated time and frequency resolutions, and the wavelet transform is prone to energy leakage and requires enhanced robustness. To enhance the intelligent detection of electrical equipment faults, the amalgamation of IRT images and CNN has found extensive applications in environments where electrical equipment necessitates prolonged operation, including the construction, residential, and power-generation sectors. This approach facilitates the identification of specific faults by comparing the hotspot regions between healthy equipment images (reference images) and those of faulty equipment (fault images) [36,37,38]. The majority of IRT image fault diagnosis methods employing CNNs are based on image-segmentation techniques, with a heavy reliance on threshold processing. A substantial amount of research employs grayscale images in image-segmentation methods but often overlooks the constraints associated with grayscale image conversion [39]. Utilizing the temperature numerical features from IRT images for detection can lead to substantial reductions in the labor and computational costs associated with processing the training data samples and feature parameters of the model. This method is seldom employed for motor fault diagnosis, and there are few reports exploring its reliability and accuracy.
It is reasonable to anticipate that with a substantial volume of training data, the CNN-based detection method can effectively carry out fault diagnosis for the same motor. However, certain motors possess only a limited amount of fault data in reality, making it challenging to establish an effective training dataset for machine learning, consequently diminishing the ability to detect faults. Additionally, extreme cases of fault types occur infrequently (as low as one or a small number of samples per fault type), which results in the issue of class imbalance within fault data. One solution is to employ few-shot learning, which involves adding a small number of new samples to the source task dataset to dramatically enhance performance on extreme datasets [40,41]. In application scenarios with a limited number of samples, deep learning approaches often fall short, as deep learning typically demands an extensive dataset. To assess the data sensitivity of deep learning methods in the face of limited data, experiments across varying sample sizes of fault types and different types of motor data are conducted. The training phase of few-shot learning involves the extraction of numerous features from the source domain data, while the target task is executed within a few-sample scenario. This implies that the model is trained to learn from a limited number of instances. This approach makes a substantial contribution to enhancing model performance, particularly when the amount of data available for the target task is limited or data are challenging to acquire. Furthermore, fewer iterations are necessary to achieve convergence, which can enhance the generalization ability of the model and mitigate the risk of over-fitting. Building upon the aforementioned advantages, this paper seeks to deploy the trained system for the fault diagnosis of various motor types using the few-shot learning approach.
In summary, to solve the issues of the migration from artificial data to natural data in the intelligent diagnosis of motors, a fault diagnosis system (FDS) for infrared thermography is proposed based on a CNN and few-shot learning. The FDS utilizes IRT images and temperature features to automatically detect and identify motor faults with high accuracy across RGB (red, green and blue color model) color variations. This system is more robust due to its excellent features, such as being non-contact, non-invasive, non-destructive and rapid, and having large-area detection. The trained FDS is also designed to accommodate various types of motors for the fault diagnosis using the few-shot learning method, which provides a benchmark for the intelligent diagnosis of motors with different sample sizes and is crucial for practical applications in industrial production. This paper is organized as follows: Section 2 introduces the proposed fault diagnosis framework and related techniques. Section 3 describes the experimental setup and data collection. Section 4 discusses the experimental results, and Section 5 summarizes the paper’s contributions and outlines the potential future research directions.

2. Fault Diagnosis Framework and Related Techniques

The proposed fault diagnosis system comprises three main components: infrared thermal image pre-processing, a CNN model, and a few-shot learning model. The system was tested using data from motors of the same type, and a small set of real-world fault data from different types of motors (uncommon motors) was incorporated for few-shot learning testing. The core operation of the FDS is outlined as follows:

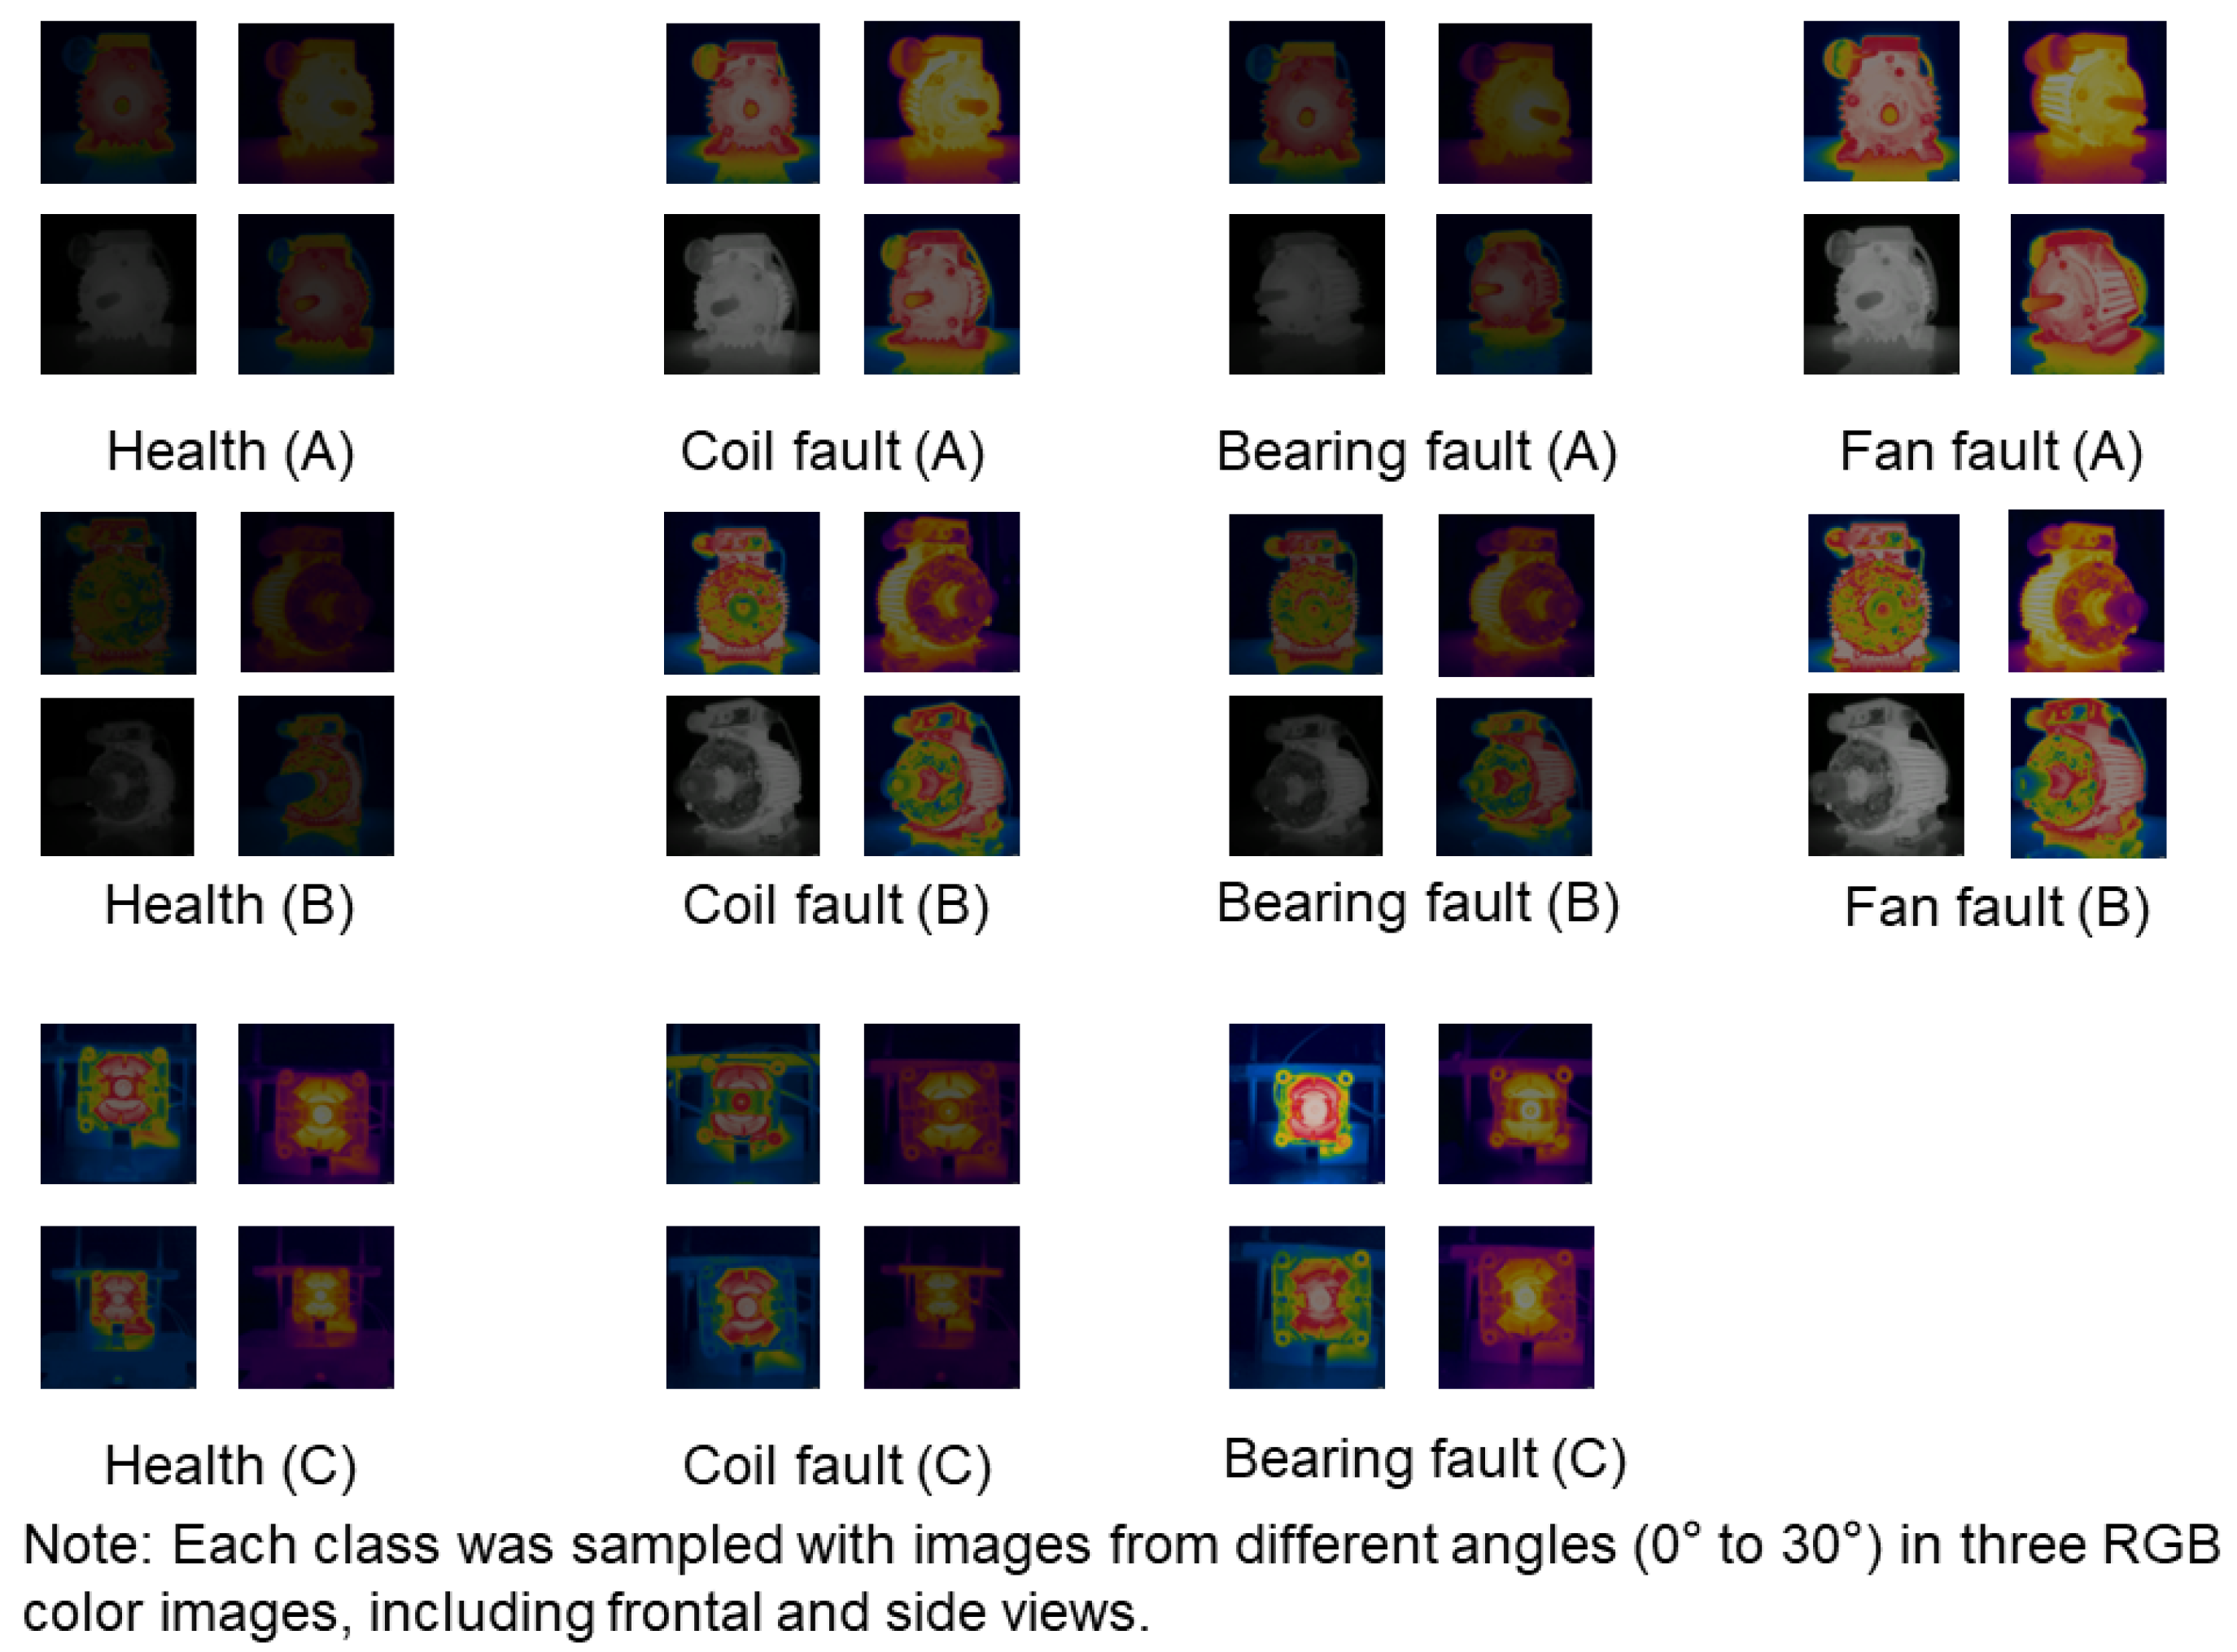
2.1. Pre-Processing of Temperature Images

During the data pre-processing stage, infrared thermal images were captured with an infrared imager, focusing on the water pump motor (induction motor) used for initial training. Consistent with the laboratory’s ambient temperature, all images maintained a uniform minimum temperature. Notably, the maximum temperature varied across individual images. The experimental normalization applied the min–max method to guarantee that identical temperatures corresponded to the same RGB values for each image as the minimum temperature remained constant as the ambient temperature of 20 °C (Figure 1). To ensure the accuracy of the FDS in practical applications, consistent temperature values corresponding to the same RGB color are essential in all images. EasyOCR was created using Python and the Pytorch deep learning library. The easy optical character recognition (EasyOCR) implementation utilized an application programming interface (API) for text extraction, the Resnet network for feature extraction, long short-term memory (LSTM) for sequence labeling, and connectionist temporal classification (CTC) for decoding (Figure 1). EasyOCR was employed to extract temperature values from the images, and subsequently, the images were normalized according to the extracted temperature values before being fed into the model.

2.2. Convolutional Neural Network (CNN)

Four different types of a water pump motor’s (motor A) infrared thermal image data were collected, namely health, fan fault, bearing fault and coil fault data were used as the training set for the CNN model, as shown in Figure 2. The collected infrared thermal image data of the A pump motor were pre-processed numerically for temperature. The normalized images were then fed into the convolutional neural network for training, aiming to distinguish the four fault types needed for the experiment.
The convolutional neural network is a multi-layer neural network in deep learning, mainly composed of convolution layers, pooling layers and fully connected layers [42]. In the convolutional layer, the input data are directly convolved with the convolutional kernel in the convolutional layer using the weight-sharing operation to generate new feature maps. Overfitting caused by too many network parameters can be avoided by weight sharing, which can also speed up network convergence. The mathematical-specific function for the convolution process is displayed:
x j l = f i M j x i l 1 · w i j l + b j i
where M j   is the input feature vector, l is the l layer of the network, w is the convolution kernel, b is the bias value of the network, x j l is the output of the l layer, x i l 1 is the output of the previous layer, i and j stand for the two connected neurons and f is the RELU function. It is an activation function that improves the nonlinear expressiveness of the network, and it is mathematically shown:
f x = m a x 0 , x
The pooling layer reduces the parameters of the network in the model by down-sampling the feature maps from the convolution of the previous layers. The maximum pooling method was chosen, and the mathematical expression for the maximum pooling method is shown:
P i l + 1 j = max j 1 W + 1 t jW q i l t
where q i l t is the value of the t neuron in the i feature vector of the l layer, t j 1 w + 1 , j w , W is the width of the pooled region, and P i l + 1 j is the value corresponding to the neuron in the l + 1 layer.
The fully connected layer conducts a tiling operation on the resulting feature map, transforming it into a one-dimensional feature vector, and subsequently, it engages in either classification or regression tasks. The forward propagation expression within the fully connected layer is shown:
z i l + 1 = f j = 1 n W j i l z i l + b i l
In this equation, W j i l is the weight between the i neuron in the l layer and the j neuron in the l + 1 layer, z i l + 1 is the output value of the i neuron in the l + 1 layer, b i l is the bias value, and f is the nonlinear activation function.
The classifier refers to the final fully connected layer that uses the softmax function as the activation function to convert the input neurons into a probability distribution summing to 1 to obtain the label distribution of the input data. The softmax function is shown:
s o f t m a x z i = e z i i = 1 c e z i
where z   = [ z 1 , z 2 , …, z c ] represents the final output. The value of subscript c is the number of neurons in the last layer and is also the number of classification labels of the classifier. Forward propagation advances the input data layer by layer to obtain the output, and backpropagation uses the loss function to calculate the error between the predicted value and the true value. The loss function used is the cross-entropy function, and the function is shown:
L W , e = i = 1 K j = 1 C l y i = j ln p i j
where l y i = j represents an indicative function in which the value in brackets is 1 when it is a true value and 0 when it is a false value. K is the overall number of training samples, C is the number of categories in the training samples, y i refers to the true value of the i training sample, and p i j refers to the predicted probability that the i training sample is the j category. The training process with error backpropagation utilizes the gradient descent method to minimize the loss function L W , e , which enables the update of parameters W and e for each layer.

2.3. Few-Shot Learning

Few-shot learning, a paradigmatic representation of meta-learning algorithms, draws inspiration from human learning processes where individuals adeptly recognize new objects or grasp novel concepts with just one or a few instances. Leveraging relevant data and transferring them to the target domain remains the most instinctive solution in few-shot learning. In the context of transfer learning, both source and target domain data are involved, wherein knowledge acquired from the source domain is applied to diagnose issues in the target domain [43,44,45]. Within the target domain, there exist N types, each with K instances. For brevity, we refer to the target domain’s training data as N-way × K-shot. In this experiment, few-shot learning encompasses three categories (C motor fault types) with 100 data entries per category (where N is 3 and K is 100). In meta-learning, data from the source domain or target domain are partitioned into a support set and a query set, serving as labeled samples to generate prototype features for the model. The query set is then utilized as training samples to update the model. Within this system, 15 samples from the query set (C motor) are chosen as training samples for model updating. The direct training method stands out as the representative approach for small sample learning, allowing direct categorization of the target category without pre-training or employing a strategy with fewer samples. While unfair for comparison against methods learning features from the source domain, it is crucial to note that this simple and swift method establishes a minimum benchmark for few-shot learning. The direct training process employed in this system involves training the feature encoder and classifier directly with target-domain data (consisting of both A and C motors), as illustrated in Figure 3. An optimizer using Adam with a learning rate of 0.001 is utilized. All 3-way × 15-shot data were segmented into smaller batches and trained over 30 epochs. The conclusive results confirm the method’s speed, efficiency, and notably high reliability and accuracy.

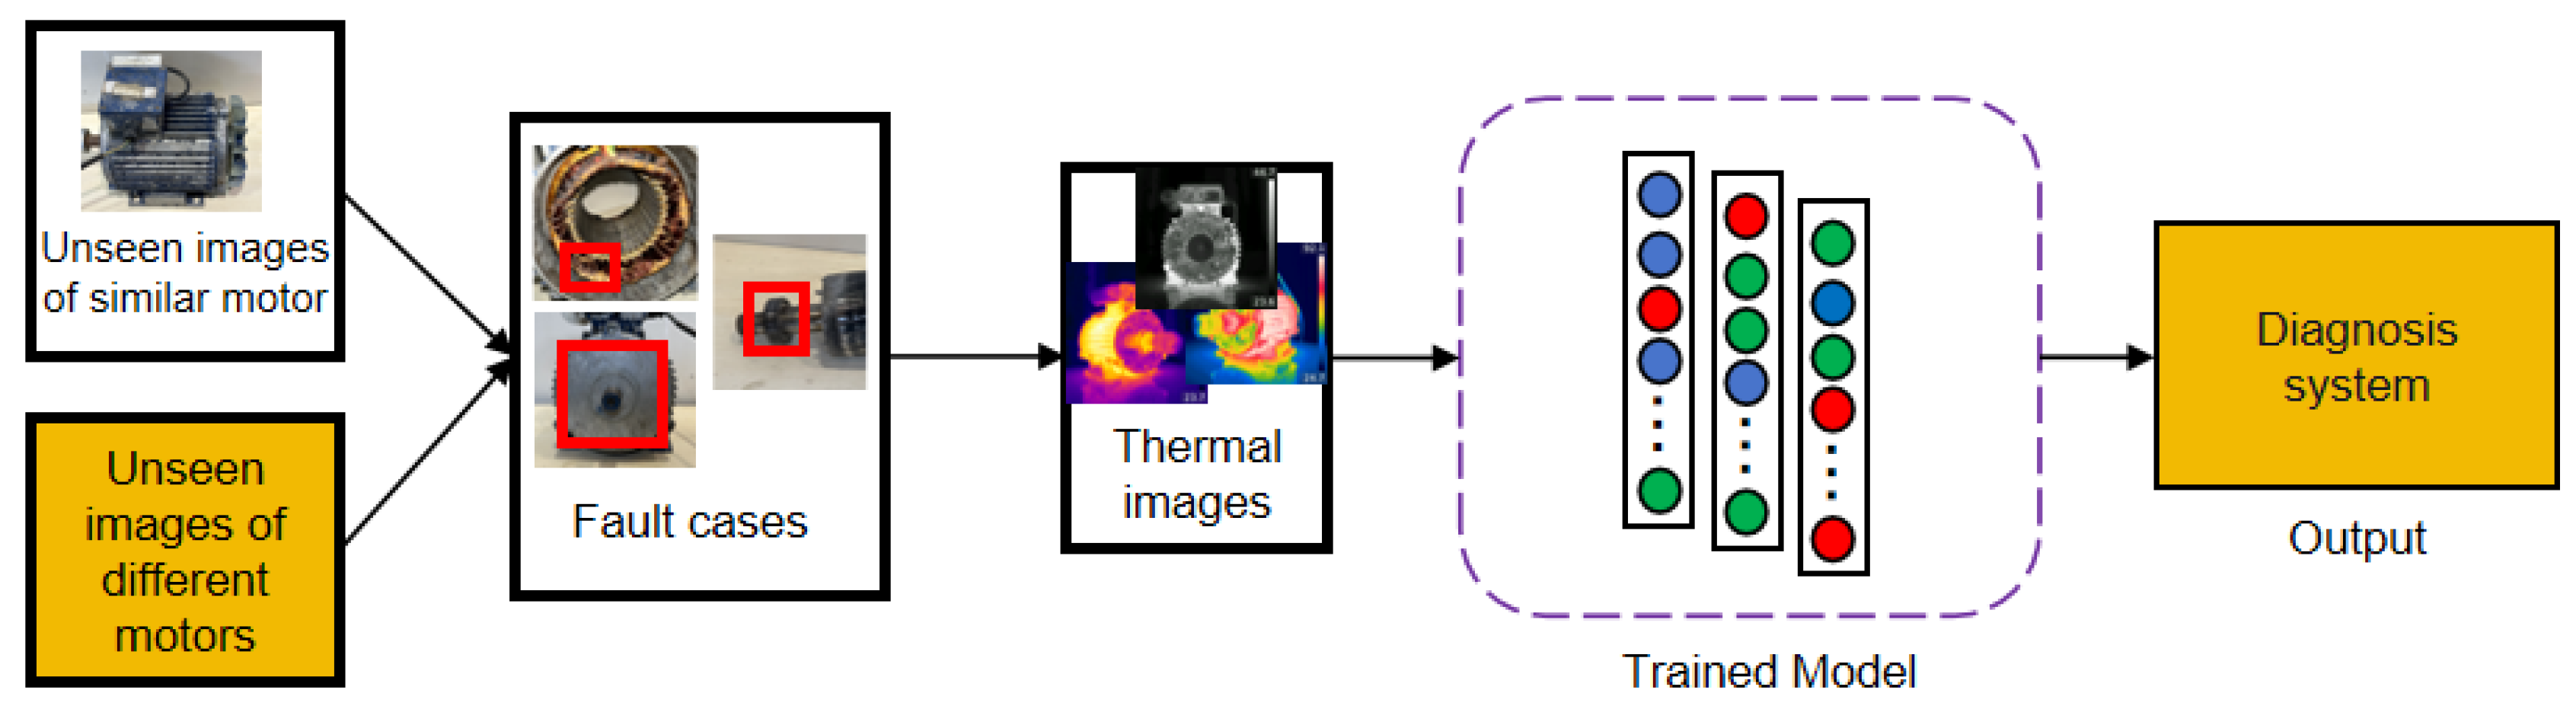
2.4. Deep Learning-Based Automatic Motor Diagnosis System

To confirm the model’s reliability, we extracted the trained diagnosis model, which includes both color normalization and the feature extraction network. We then employed untrained data from a similar water pump, motor B of the same type, to validate the deep learning-based automatic motor diagnosis system presented in this paper, as shown in Figure 4. Additionally, a graphical user interface (GUI) was developed using Python to seamlessly integrate the diagnostic system and model, allowing users to diagnose motor faults efficiently and intuitively.

3. Experimental Setup and Data Collection

The experimental data of motor A in this experiment were acquired in the Vehicle Engineering Laboratory of the University of Macau. To ensure the collection of representative data samples for pre-processing and to validate the proposed framework effectiveness, the experimental data of motor B were also gathered in the Vehicle Engineering Laboratory of the University of Macau. Additionally, the data for motor C were sourced from Guangdong KEHN Motor Co., Ltd. in Foshan City, Guangdong Province, China.

3.1. Experimental Setup

The test rig for the motor fault diagnosis is illustrated in Figure 5. The experimental motors were positioned on the test rig and assessed under a consistent room temperature of around 23 °C. Two distinct types of experimental motors were employed: motors A and B were water pump motors, while motor C was a series-excited motor designed for household appliances (Table 1). In order to capture thermal image data for testing, the experiment used a professional infrared thermal imager UTi260B as the shooting equipment (Table 2). Among all the parameters, the most crucial one is the emissivity, which is significantly affected by the surface temperature and roughness of the object. Broadly, thermal imaging cameras need to adjust the emissivity value based on various environmental factors such as the relative humidity, ambient temperature, reflective temperature, and testing distance to achieve accurate and clear images. Hence, under the conditions of this experiment, we set the emissivity to 1, which yielded the best image data. Additionally, the shooting distance of the tester in the real-world engineering application was restored as closely as possible, namely approximately 30 cm.

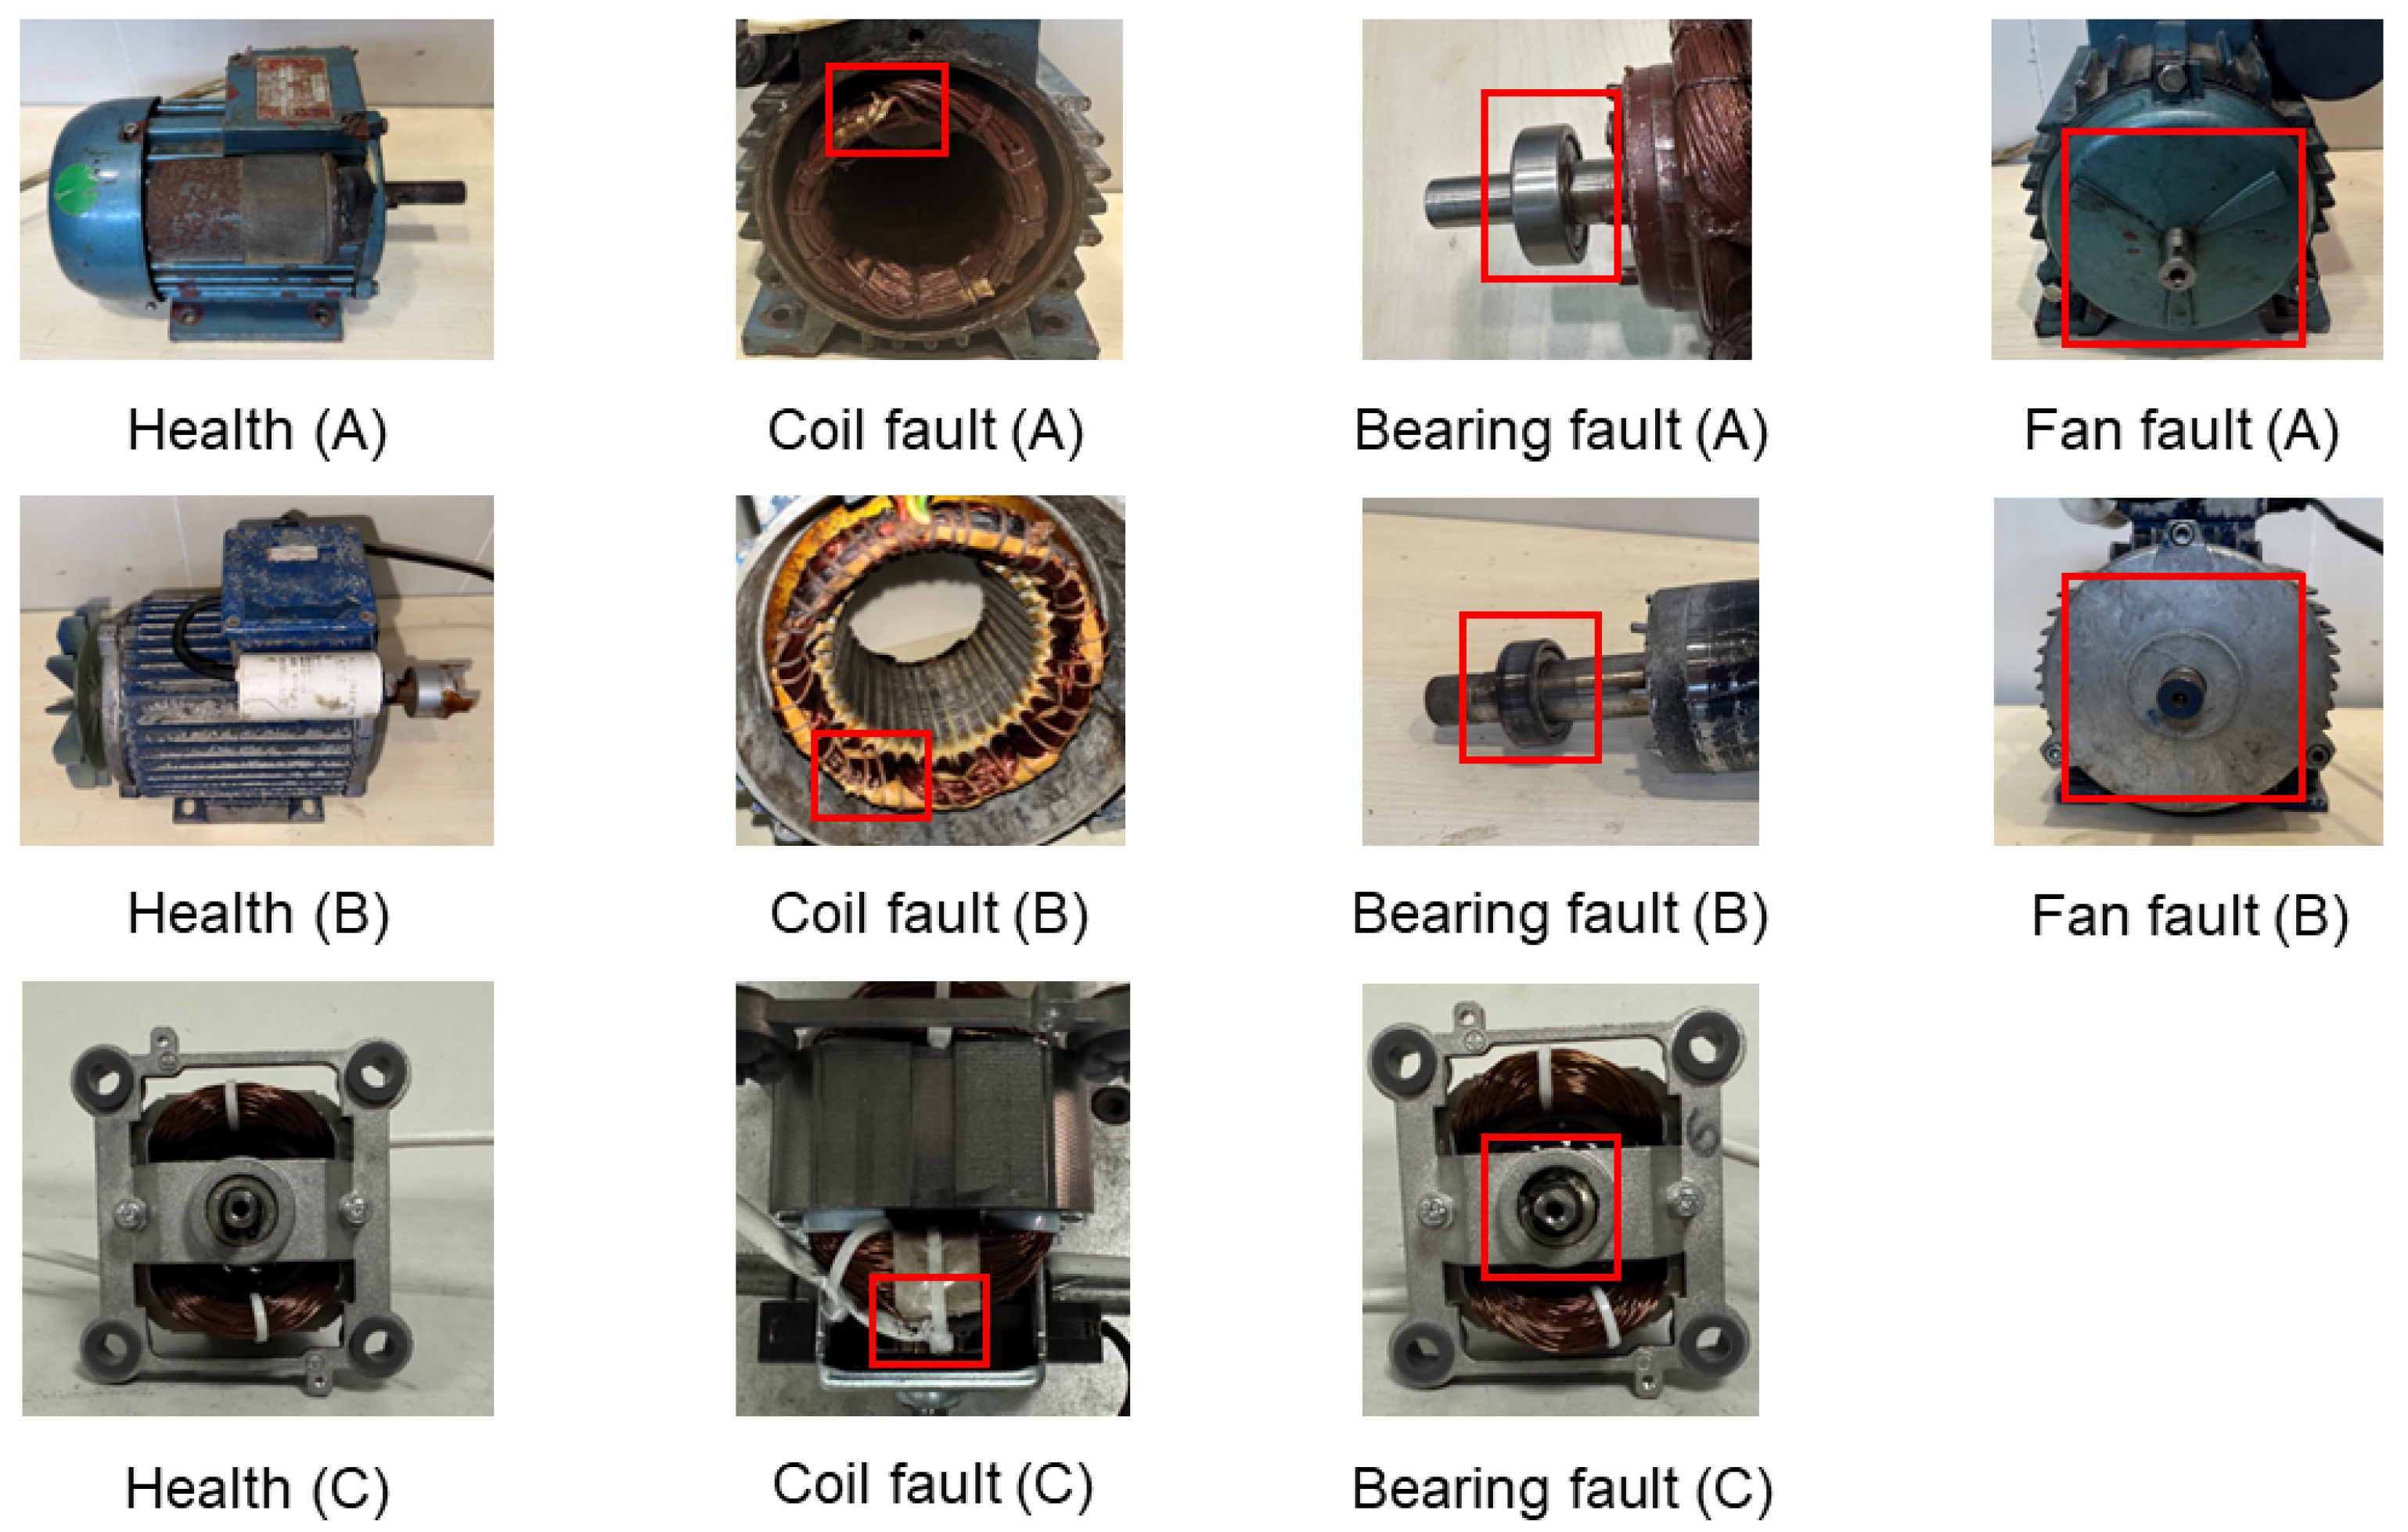
3.2. Data Collection

Typical faults of motors encompass phase imbalance, short circuits, mechanical imbalance, rotor bending, bearing defects and damage [46,47]. To create a realistic dataset for the diagnostic system, each fault was simulated through deliberate destruction. Figure 6 displays images of the three motors in their healthy states and eight types of faults induced by human operations. As faults in series-excited motors from the factory are rare, the experiment concentrated on two of the most common fault types: short coil (damaged) and bearing damage.
Figure 7 shows a range of images after normalization using three different color bars, captured following the motor’s stable operation for 15 min. To guarantee the experiment’s reliability and maintain a consistent 30 cm distance between the motor and the infrared imager under each condition, images were captured from seven angles: front, left 10°, left 20°, left 30°, right 10°, right 20°, and right 30°. This experiment aimed to replicate the angle deviation monitored by engineering inspectors while detecting motor faults using handheld infrared imagers in real-life production scenarios. Inspectors cannot ensure that the detection angle is consistently 0° during each inspection; they strive to maintain a certain distance from the motor while keeping it as frontal as possible, but there might be slight deviations in angle (typically 0° to 30°). The final experimental results indicate that the data detected within a range of 30° to the left and right had no impact on the classification results. Subsequently, the temperature values of the color bars were extracted and normalized to generate the images. The experimental process aimed to mimic the real-world angle deviation observed by engineering inspectors to validate the authenticity of the results. For each state and angle, three distinct types of RGB photos were captured using an infrared imager, showcasing iron-red, grayscale and vivid-colored hues. This approach ensures that various infrared imagers can function with this system while capturing images with different color variations. The ultimate results are shown in Table 3. In the end, 1680 data sheets were acquired for motor A, 840 for motor B, and 300 for motor C. For the universality of the thermal imaging color in the fault diagnosis system, RGB image data in three different colors were collected for the three types of motors. Data from motor A were utilized as training data for machine learning, while motor B data served as validation data to access the accuracy and reliability of fault diagnosis in the same type of motor, and motor C data acted as test verification data for few-shot learning. The final validation results are presented in the conclusions section.

4. Experimental Setup and Data Collection

This system was experimented with and tested in Python 3.7.16 and run on a personal computer with an i9-13900kf core, 3.0 GHz, 32 GB RAM and 4070Ti GPU.

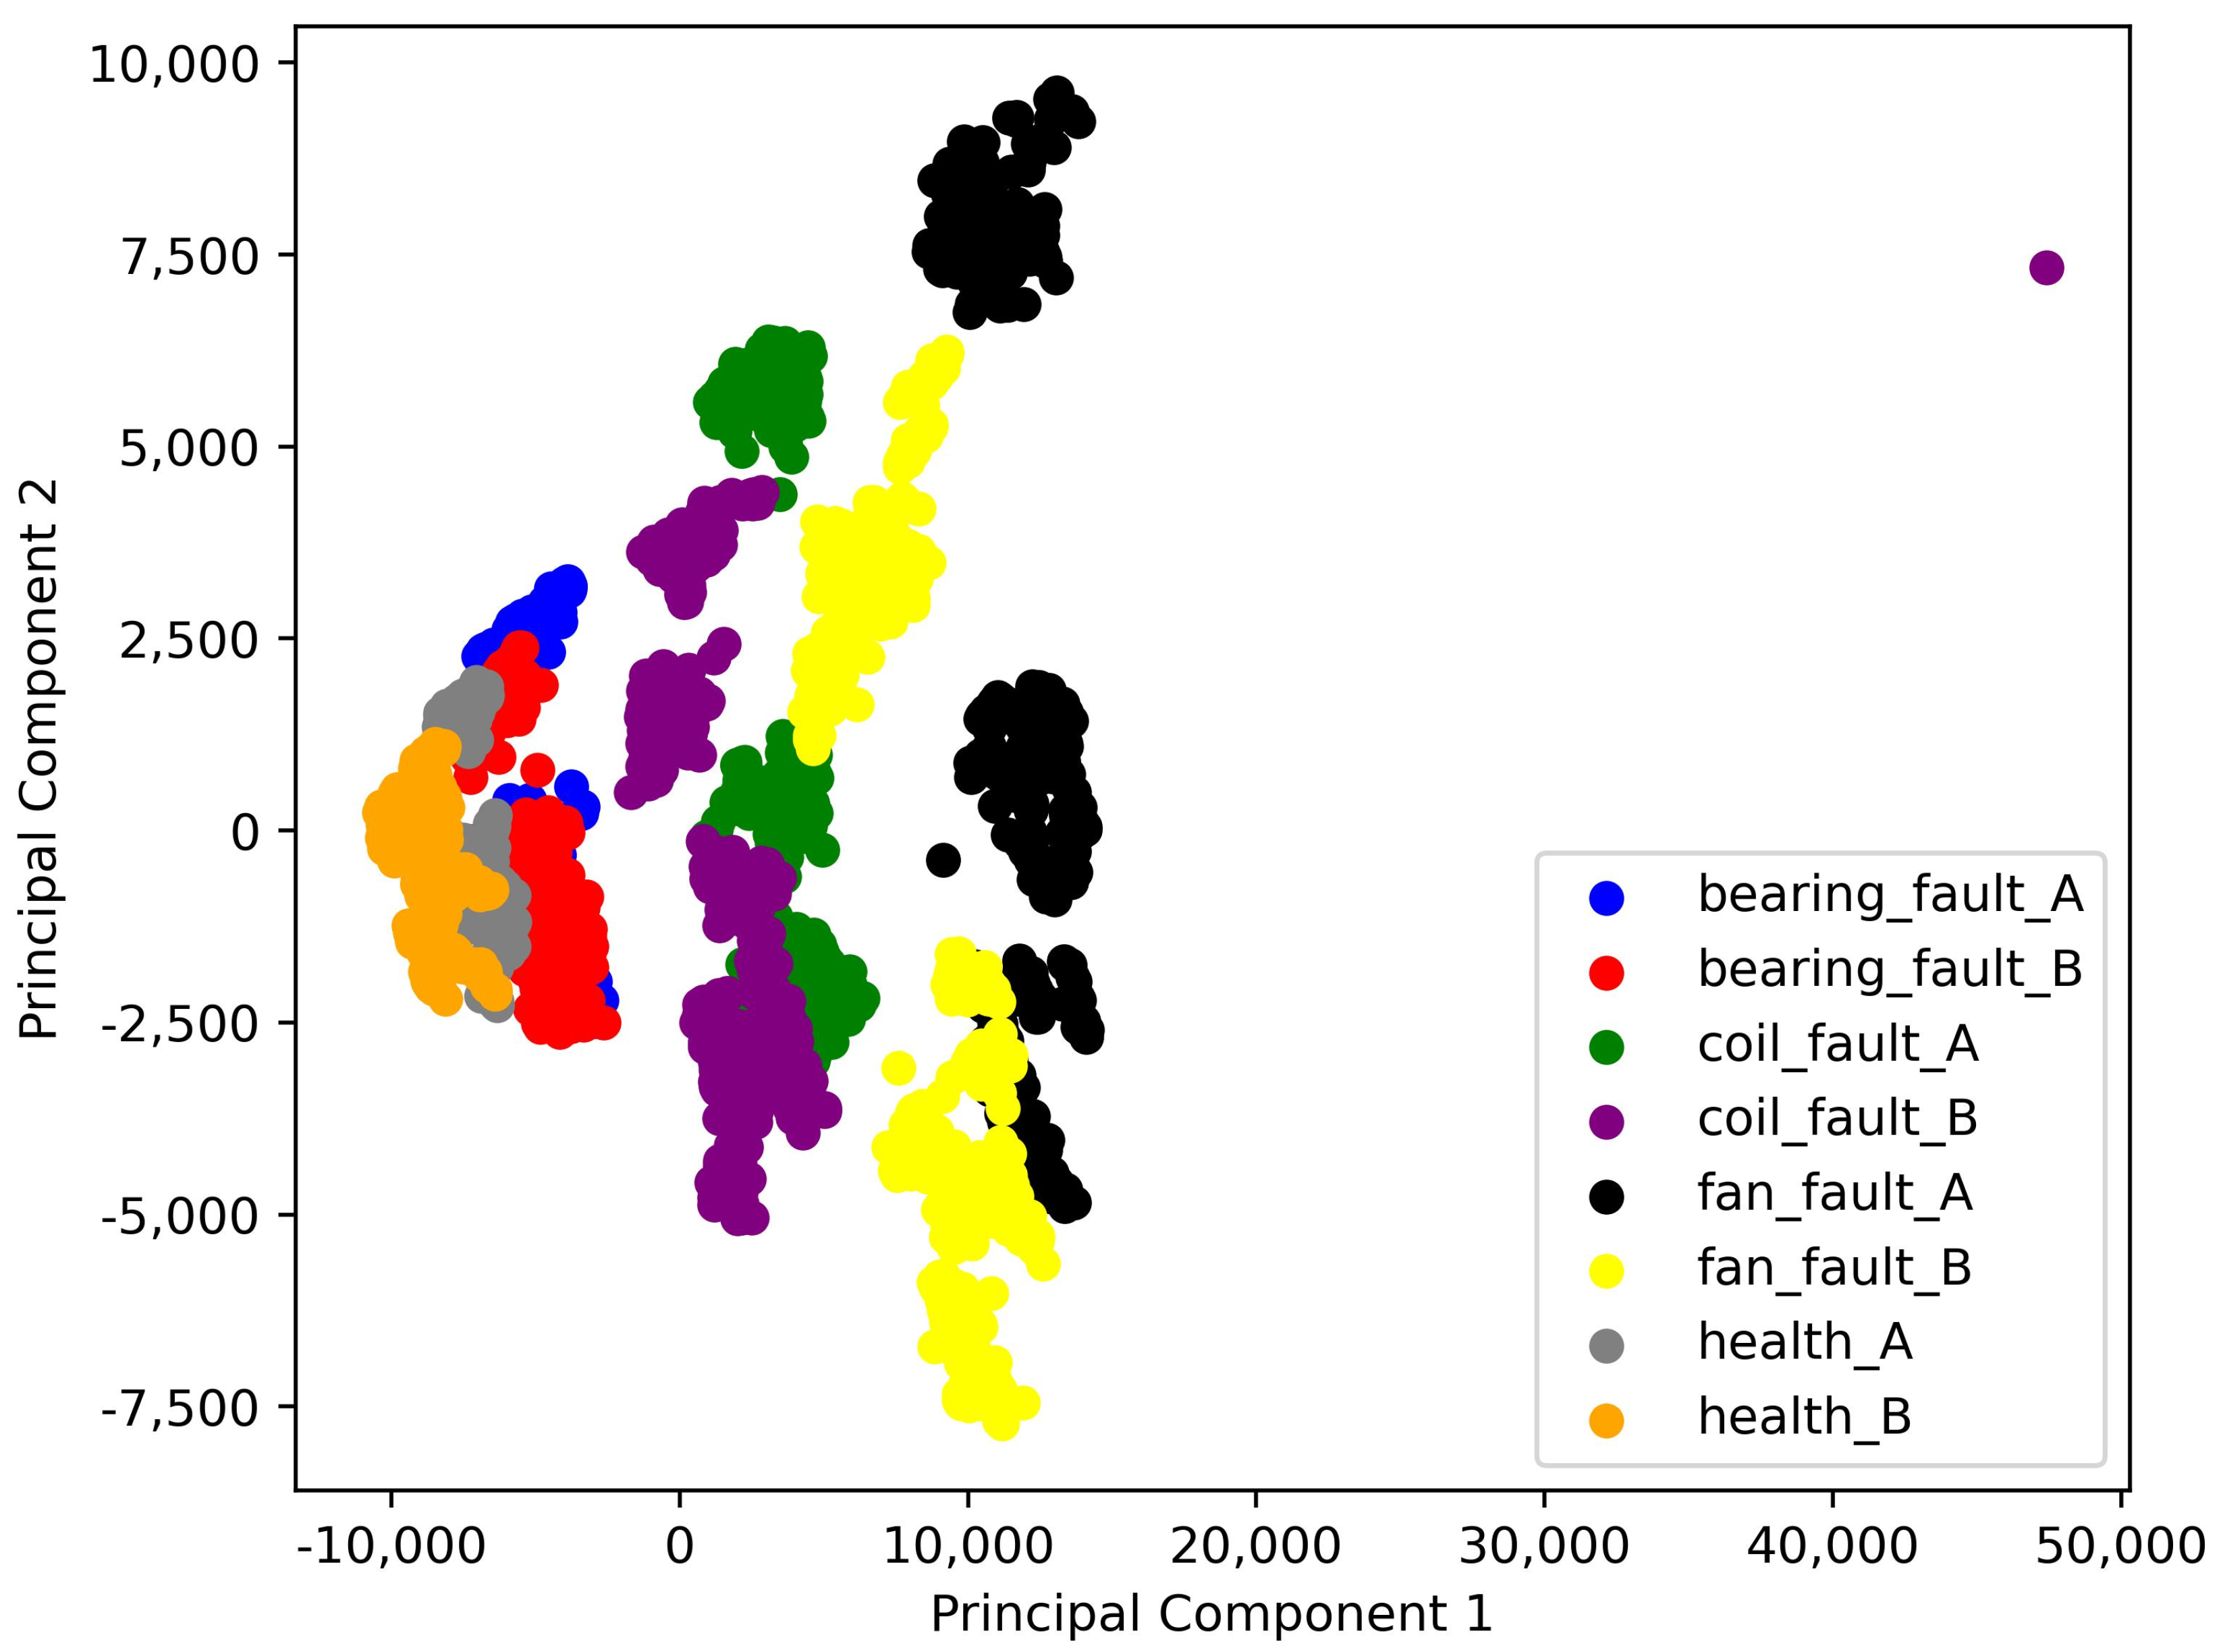
4.1. Variations in Data Set Feature Distribution

Principal component analysis (PCA) is typically utilized to reduce dataset dimensionality and retain essential low-order features, especially when dealing with substantial data volumes. This helps in examining the correlation between data variables, thus enabling an effective assessment of the experimental outcomes and verification of the system’s reliability [48]. Figure 8 and Figure 9 depict a comparison of raw data features among datasets A, B, and C through PCA graphs. The raw data were acquired directly from the imaging process and were not color-normalized. In these graphs, a wider dispersion of data points signifies greater disparities in the data. Significant distinctions are evident within the same type of fault across various motor types such as the AC motor with the same bearing fault, which is represented by the red and blue clusters in Figure 9, illustrating relatively distant positions and significant differences in characteristics. Despite these differences in fault characteristics, the FDS in the experiment could still achieve excellent detection results.

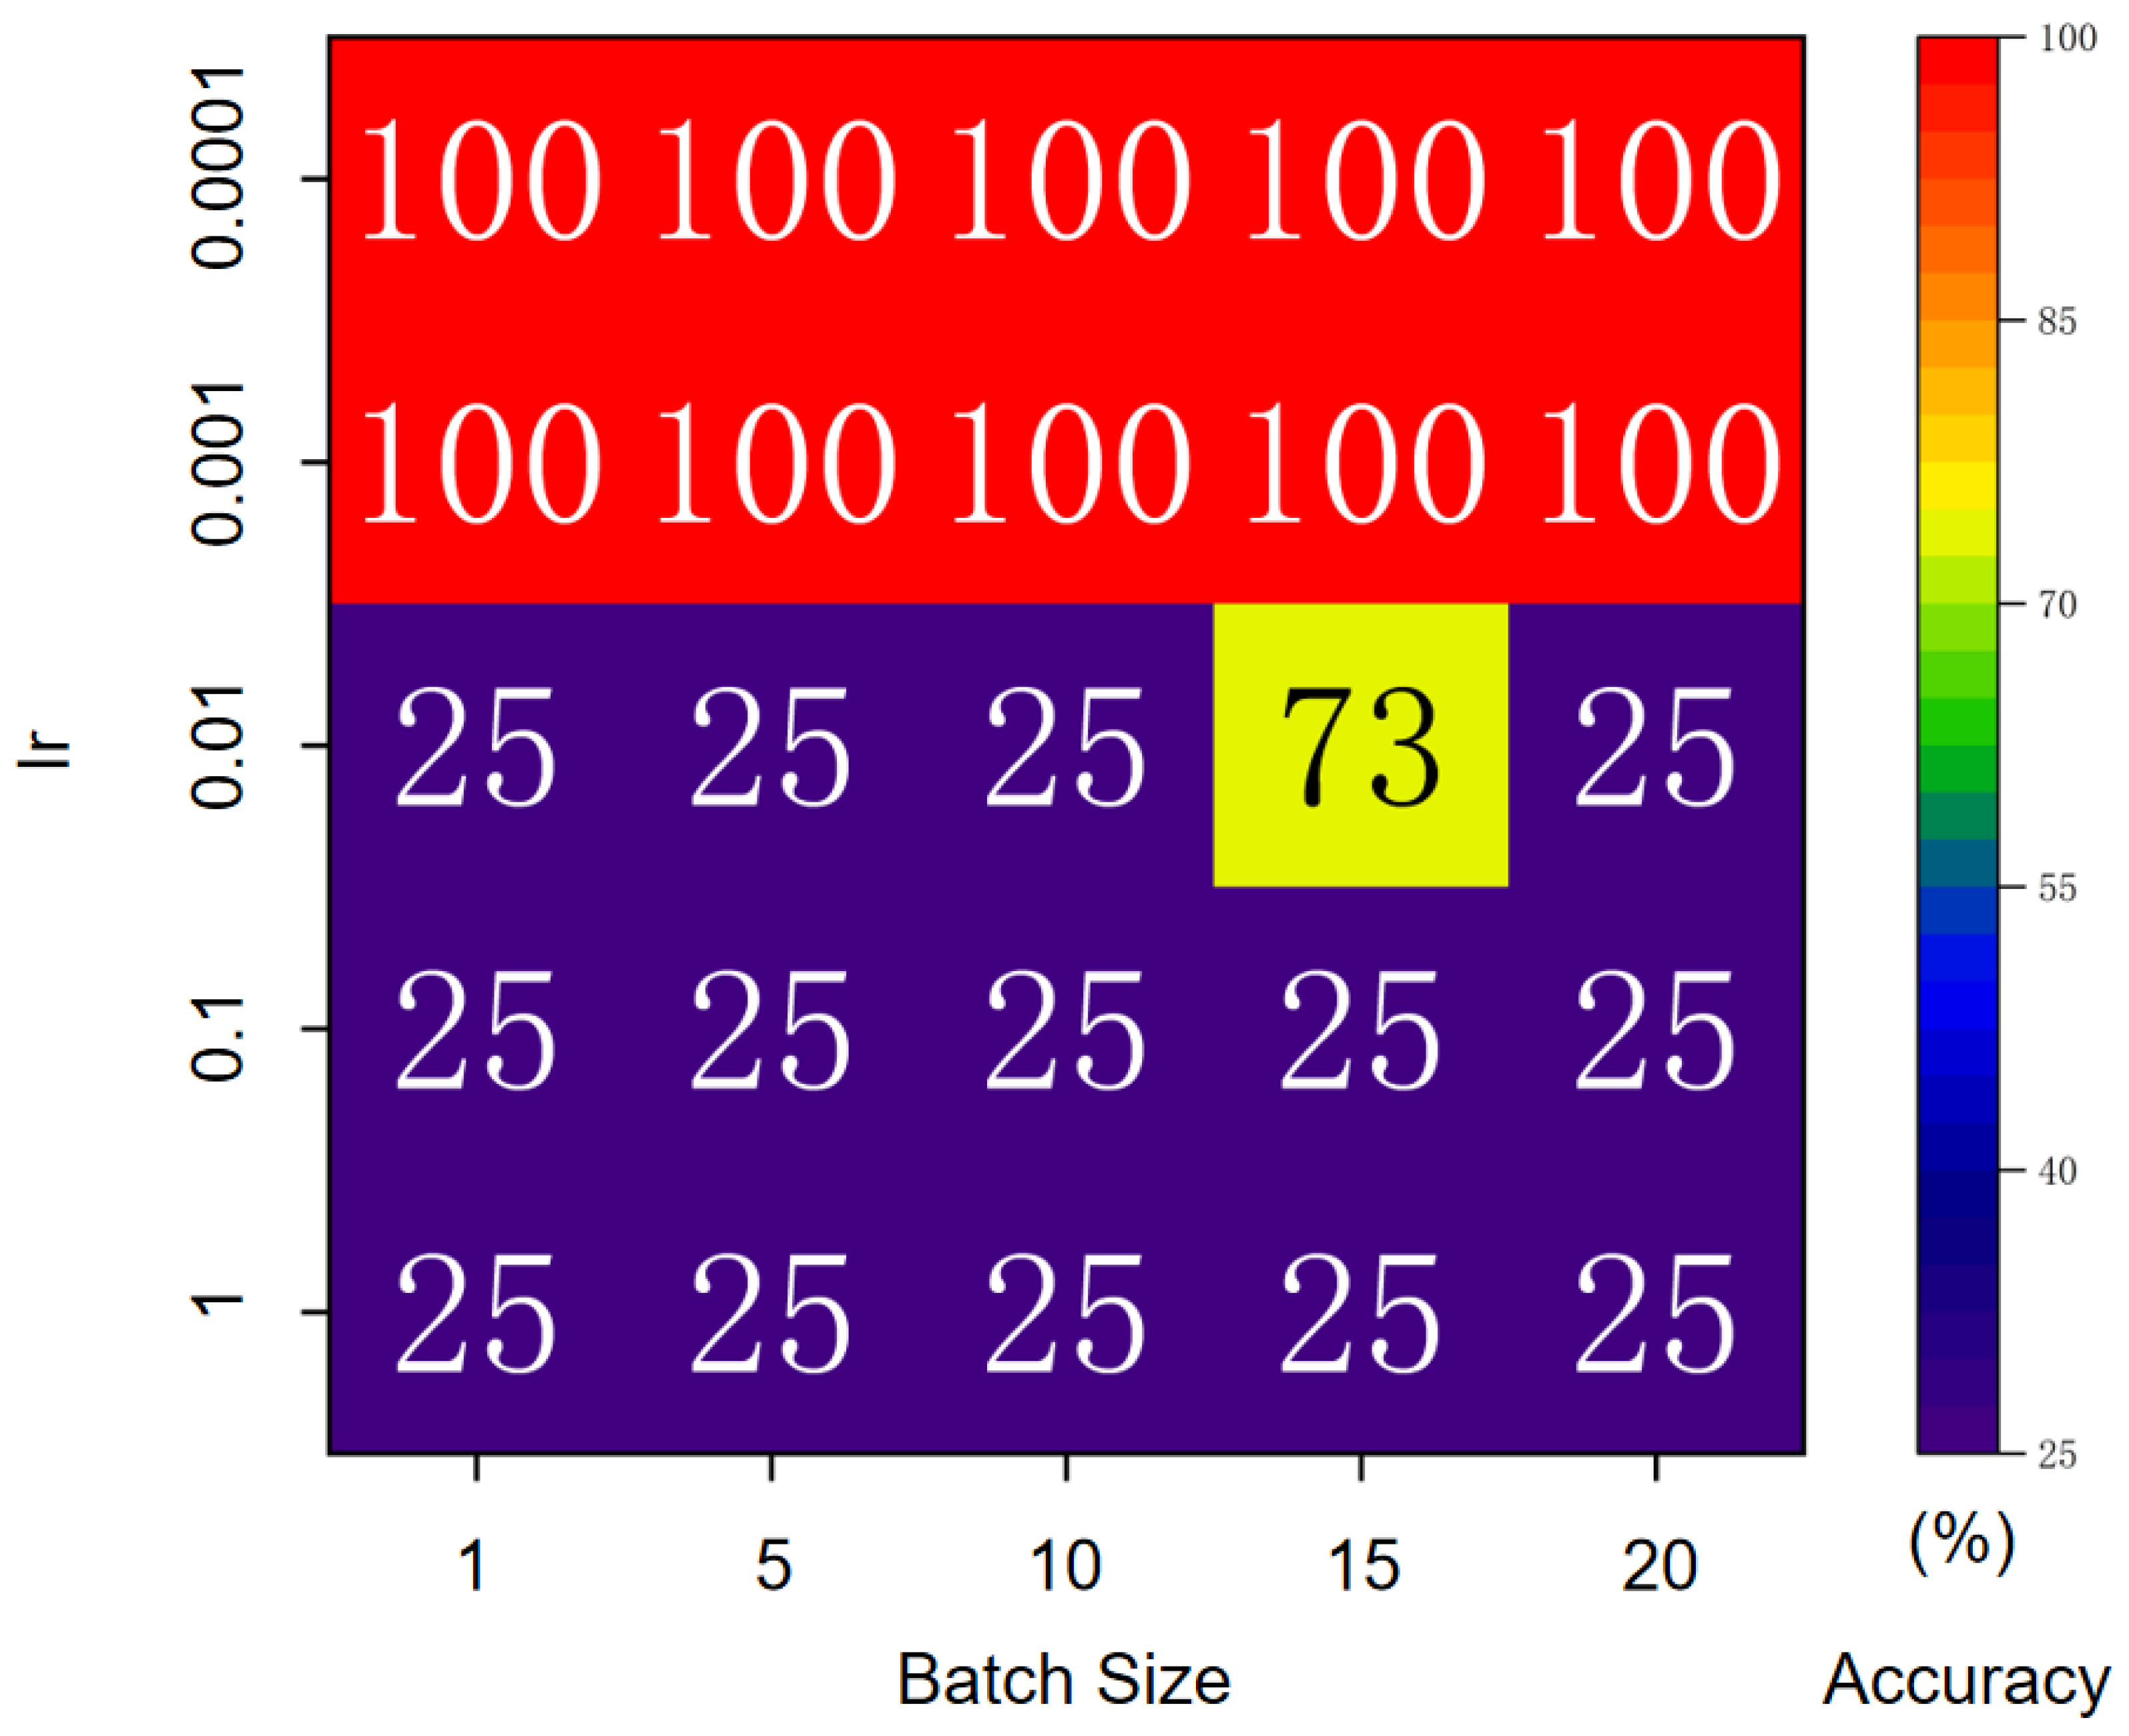
4.2. Hyperparameter Calibration

In general, the selection of different hyperparameters has a decisive impact on the ultimate training outcomes [49]. Hence, multiple ablation experiments were conducted during the training of motor A, with a minimum epoch number of 30. The accuracy could reach 100% when the learning rate (lr) of the CNN model was set to 0.001 or 0.0001 (Figure 10). During practical testing, a lower learning rate led to only a 2–3 s difference in training duration (with larger lr values resulting in longer training times). Therefore, to enhance the training efficiency and achieve the best training outcomes, we opted for a lr of 0.001 and a batch size of 10 for training.

4.3. Validation of the Detection System

To evaluate the importance of color bar-based normalization, the non-normalized data of motor A were trained directly (Figure 11), resulting in a testing accuracy of only 54.7% when using motor B. Nonetheless, following normalization, the overall accuracy of the predictions for motor B increased to 98.9%, with both coil faults and fan faults achieving a 100% accuracy rate (Figure 12). In the healthy class, nine images were erroneously detected as fan faults, and in the bearing fault class, two images were mistakenly classified as coil faults. The above issue might be attributed to deviations in the viewing angle during detection and the presence of similar RGB colors in the images, resulting in a high degree of feature similarity between individual fault-type data [50]. The comparative experiments clearly demonstrate the importance of temperature-based normalization, as it enhances the distinctiveness of the data features. Overall, the fault diagnosis system exhibited a high level of accuracy in diagnosing faults for similar motors.

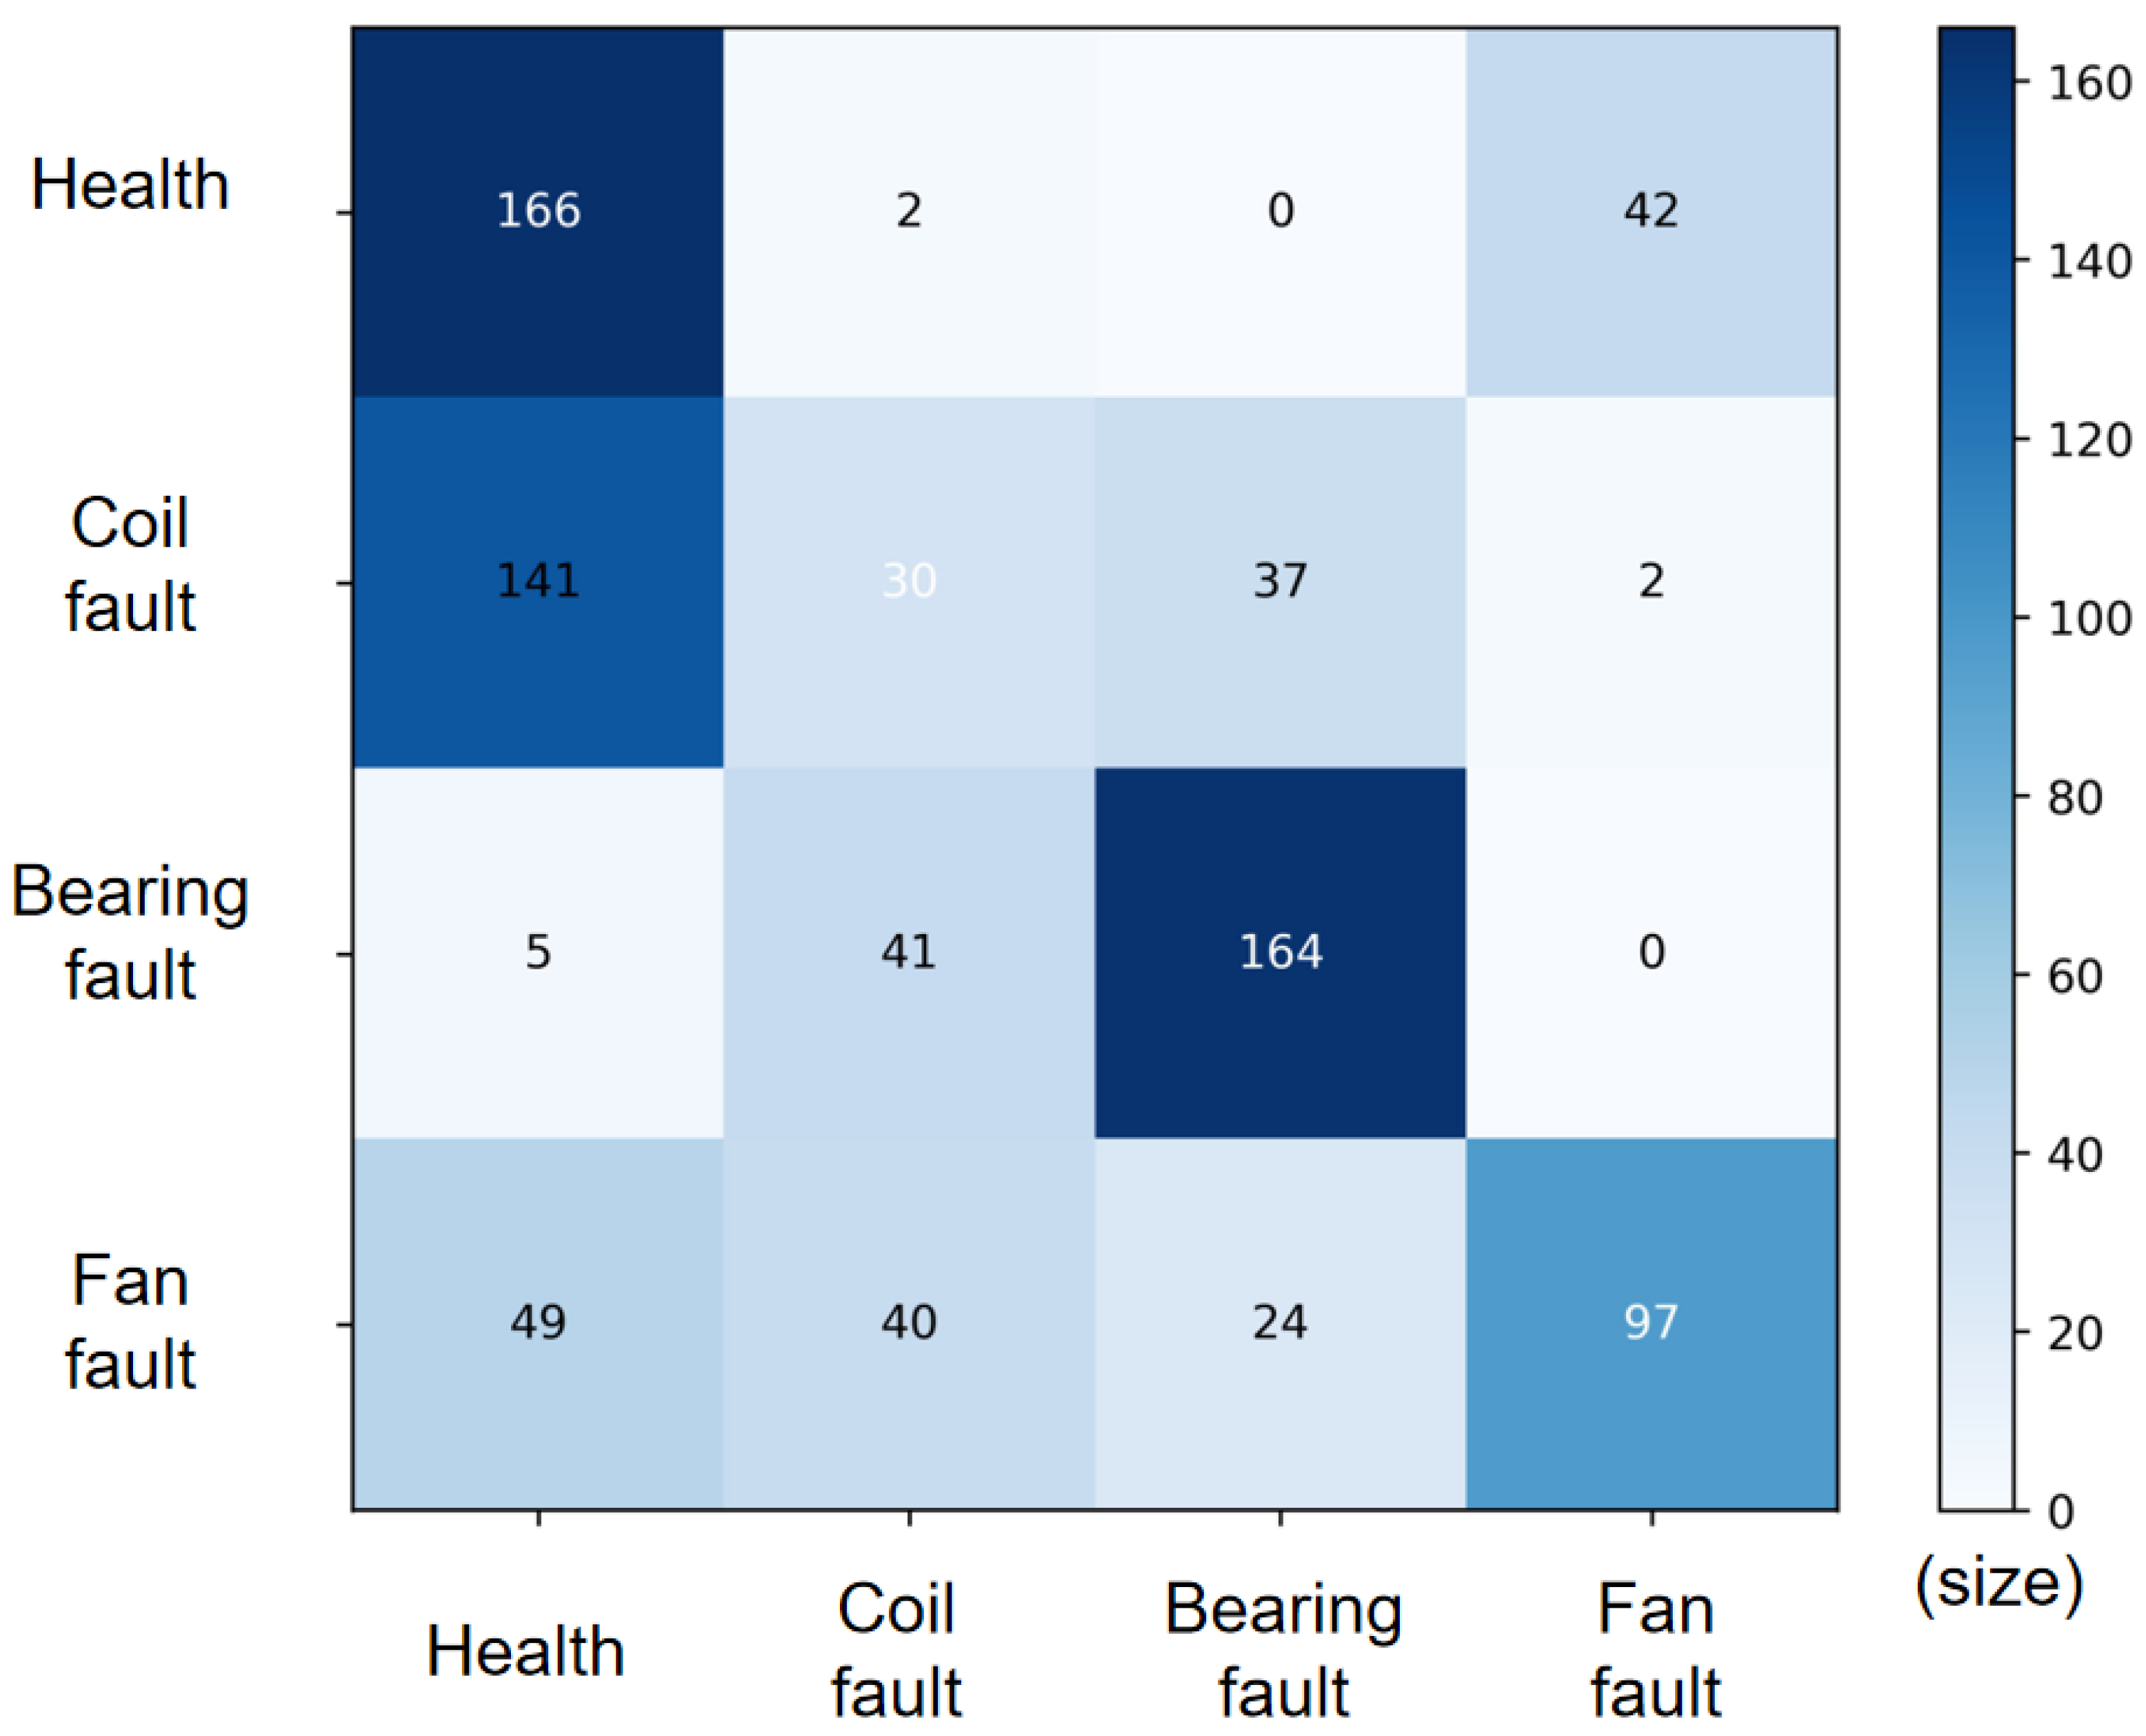
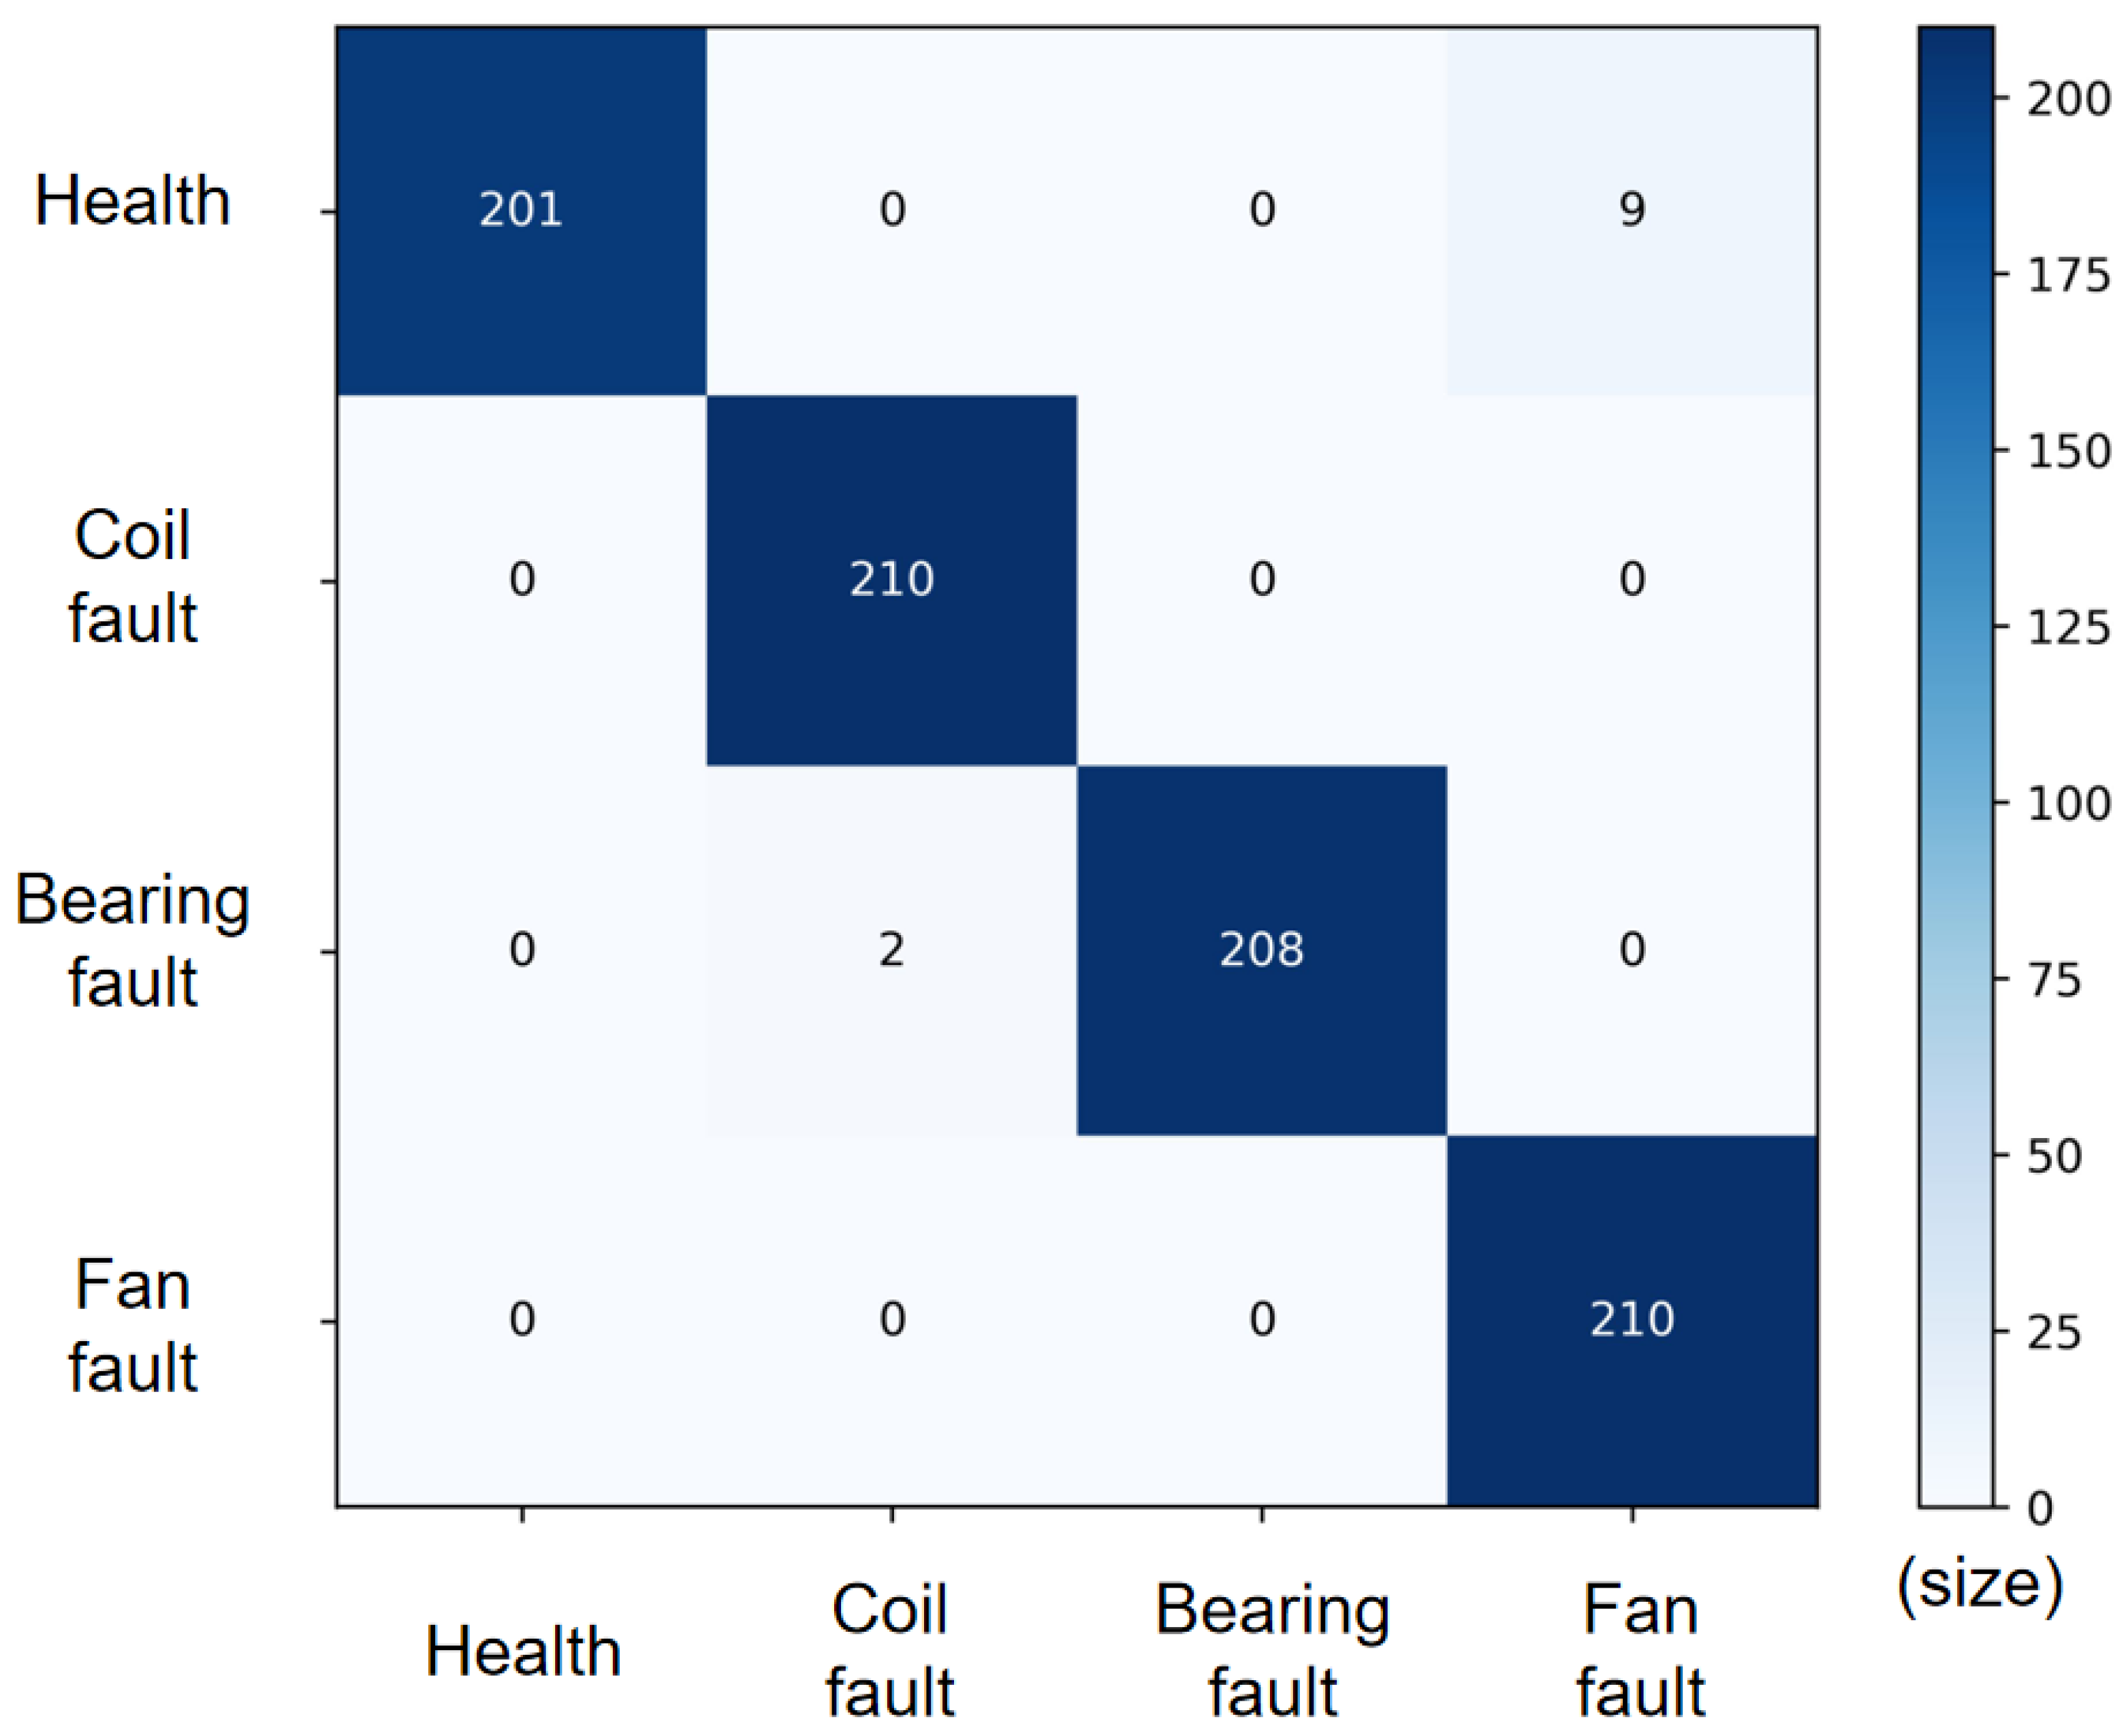
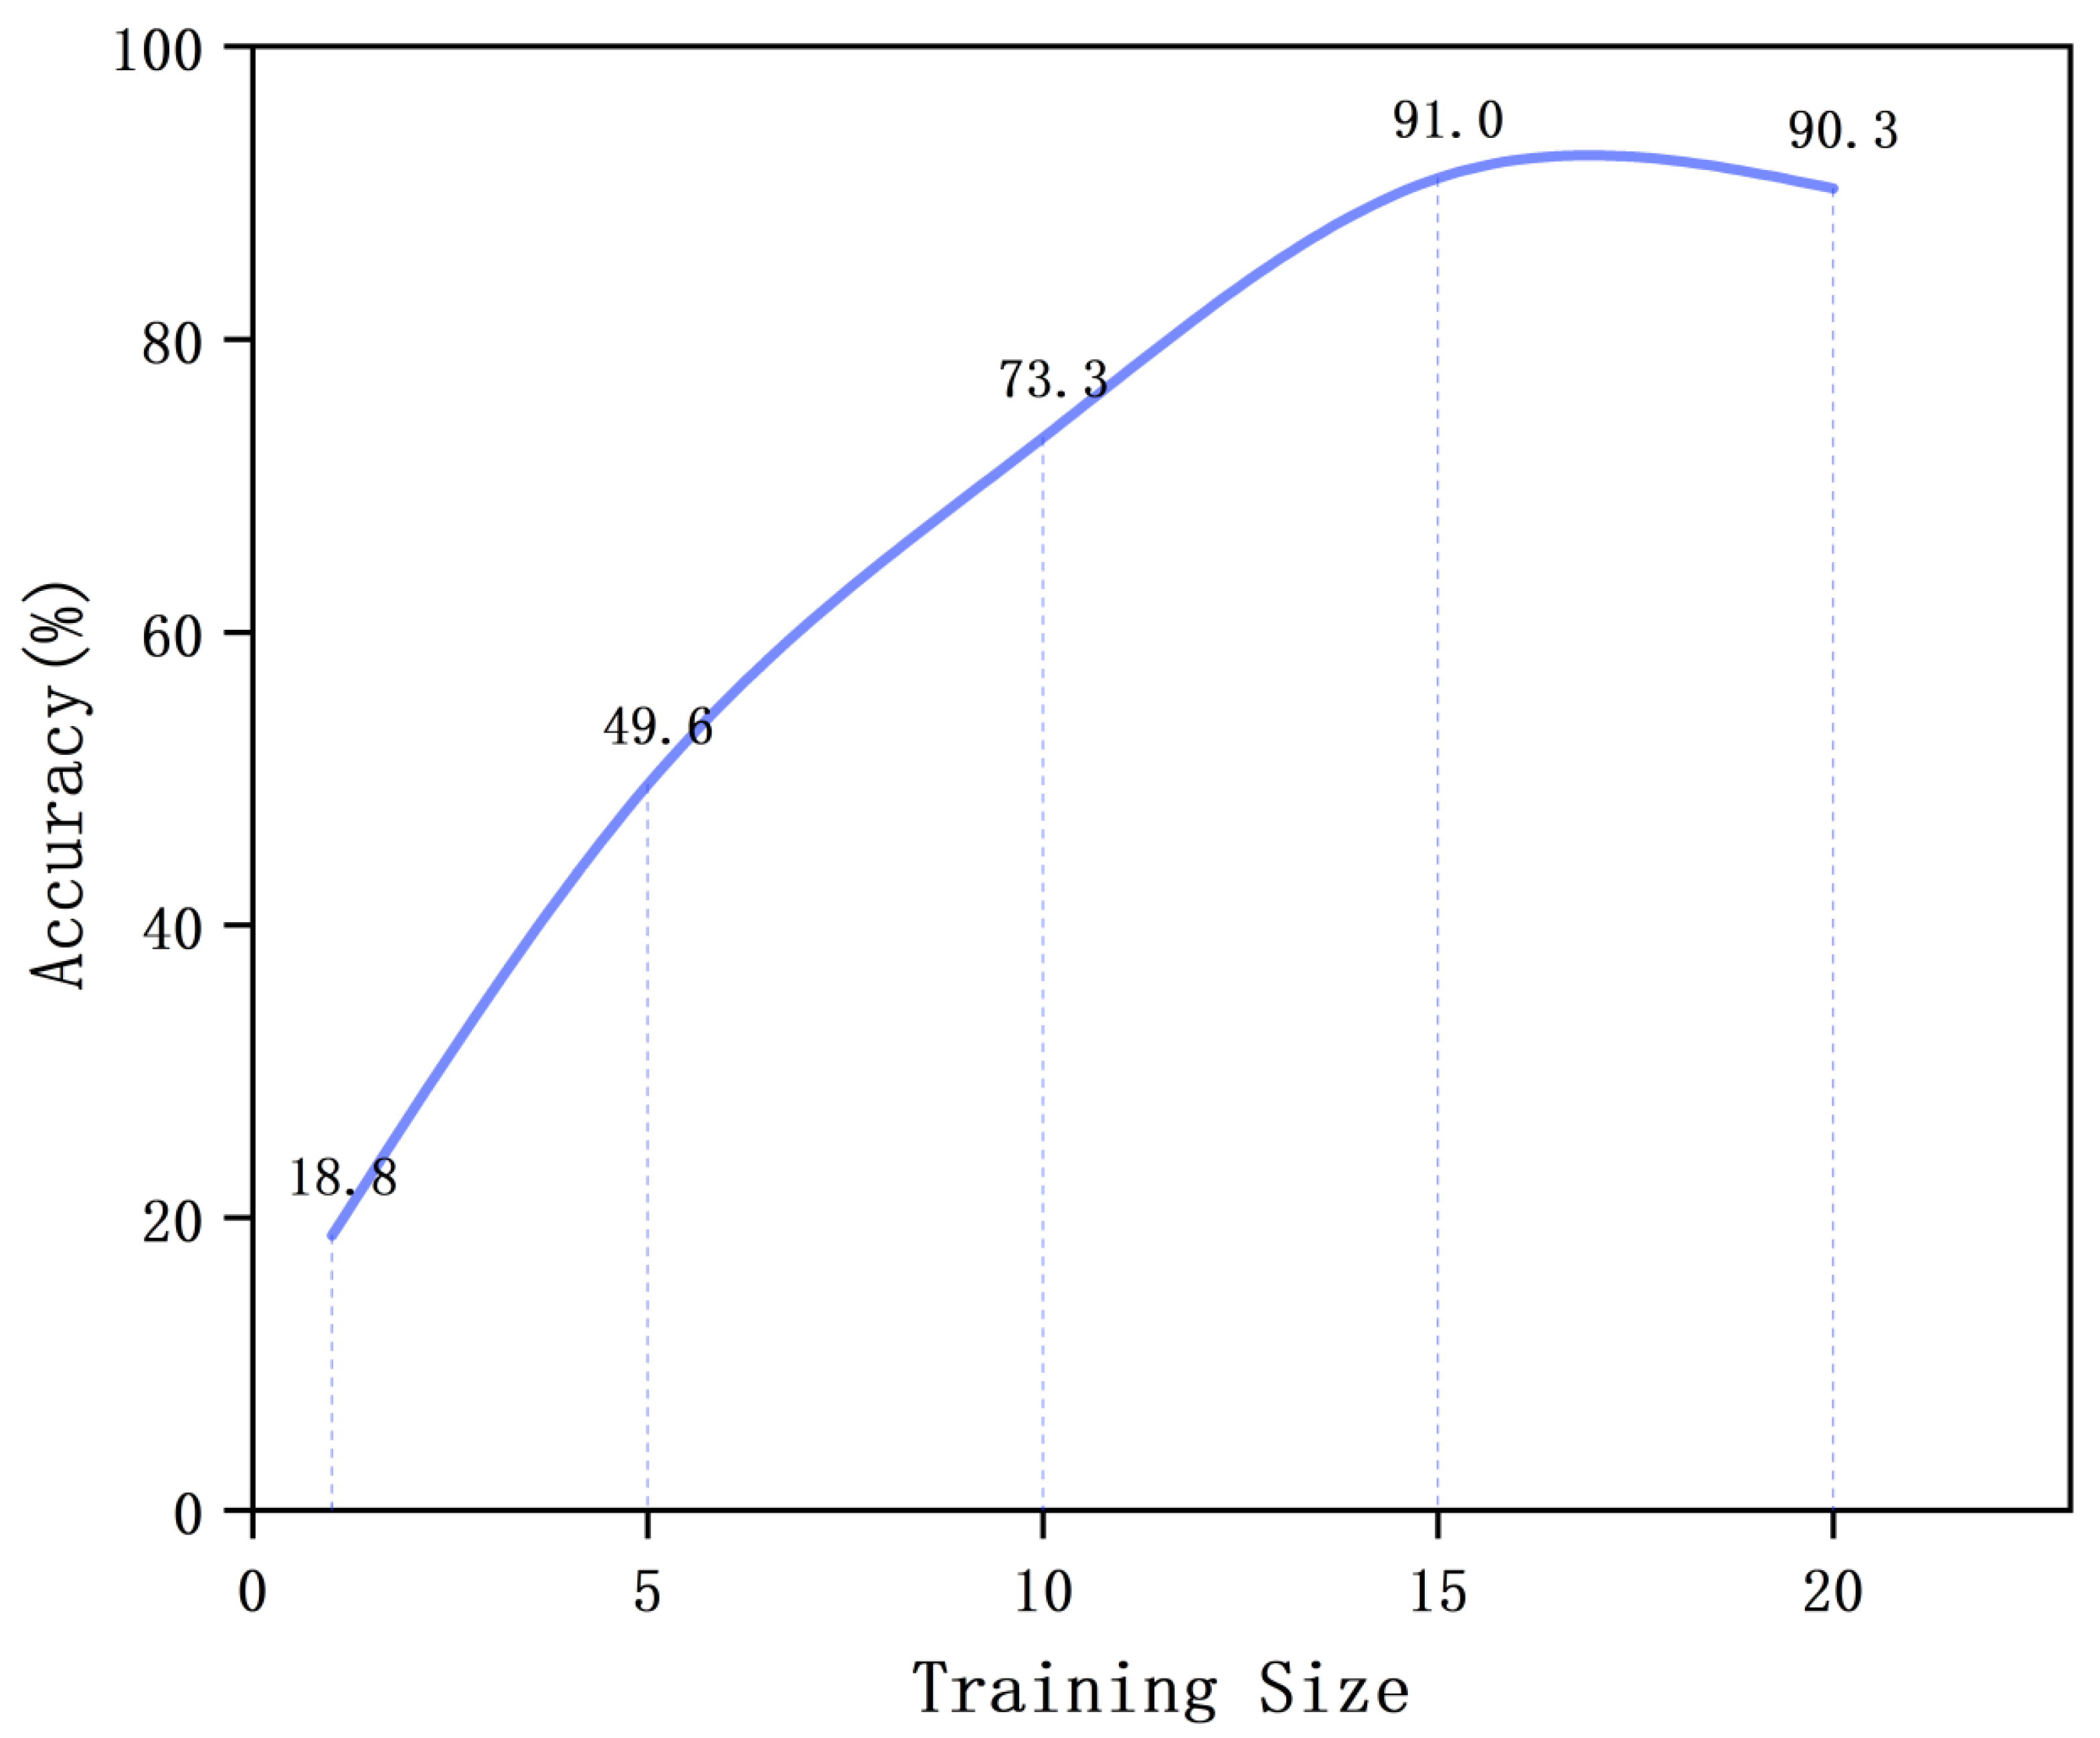
4.4. Tests of Different Motors’ Fault Identification Based on Few-Shot Learning

To validate the practicality of our innovative diagnostic method for various motor types, experiments were conducted to test the accuracy of the system under different conditions ranging from 1 shot to 20 shots. Data dependency analysis was proposed to study the effect of the sample size on diagnostic accuracy [51]. The aim of transferability analysis is to investigate how the model capacity for fine-tuning influences the transferability of methods in scenarios with limited sample sizes [52]. Task plasticity analysis involves altering the relationship between the source domain and the target domain to determine the level of difficulty, which can help in choosing suitable methods for different migration scenarios. Figure 13 illustrates the accuracies achieved by randomly selecting 1 shot, 5 shots, 10 shots, 15 shots, and 20 shots of data from motor C for training purposes. The result for each instance in Figure 13 is the average of five experiments. Notably, the accuracy reached a plateau after training with 15 images, which demonstrated no significant improvement despite the inclusion of extra data. Therefore, a random selection was made from the 15 images of motor C for testing. To assess the model’s performance and eliminate potential bias from selecting C motor data, we conducted 20 rounds of random sampling of C motor data, extracting 15 images each time to be included in the training set. Each training and validation round underwent five experiments, and the outcome was derived from the average of these five experiments per round, as depicted in Figure 14. The best result among these 20 rounds of final testing is illustrated in Figure 15. The accuracy rates in the healthy state, bearing fault state and coil fault state were 86.4%, 95.0% and 94.3%, respectively. The overall accuracy rate reached 91.0%, highlighting its remarkable capability in diagnosing previously unseen motor types.

5. Conclusions

The paper proposed an automatic motor fault diagnosis system that utilizes infrared thermography (IRT) images and leverages CNNs along with few-shot learning. The approach began with the collection of experimental fault training data and the extraction of temperature values from IRT images for normalization, rendering the dataset ready for system training. Furthermore, we tested the few-shot learning method for transferring knowledge across varying data volumes, ensuring accurate fault diagnosis across different motor types. The primary training data used in the experiments were acquired through practical measurements. To evaluate the system’s universality and reliability, we conducted a case study using real-world fault data from industrial applications. The experimental results demonstrated an impressive accuracy rate of 98.9% when tested on unseen datasets featuring similar motors. In experiments involving few-shot learning and previously unseen motor types, ablation testing on the training dataset size revealed optimal results when using 15 samples, yielding an accuracy rate of 91.8%. The proposed system demonstrated a capacity for accurately identifying motor faults based on distinct IRT signatures and application scenarios. It also offers promise for enhancing real-world model generalization by utilizing insights from lab datasets and exploring deep learning for proactive fault detection strategies.
However, the current system has certain limitations. This experiment lacks the capability to pinpoint the exact location of a specific fault for fault localization. Furthermore, extreme environmental conditions, such as detecting machine faults in extreme temperatures (arctic or desert heat) and fault detection under heavy load conditions were not considered in this study. These limitations will be further investigated in subsequent studies. Currently, our diagnostic system, founded on experimental data, focuses on pinpointing a singular fault within a motor consistently. Our subsequent experiments will aim to address scenarios where multiple faults occur simultaneously in a motor. This involves constructing the necessary dataset, making minor system adjustments, and ultimately pushing our future research in this promising direction!

Author Contributions

Conceptualization, Q.-Y.L. and P.-K.W.; methodology, Q.-Y.L., P.-K.W., C.-M.V. and K.F.; software, Q.-Y.L.; validation, Q.-Y.L. and P.-K.W.; formal analysis, Q.-Y.L.; resources, Q.-Y.L.; data curation, Q.-Y.L.; writing—original draft preparation, Q.-Y.L.; writing—review and editing, Q.-Y.L., P.-K.W., K.F. and I.-N.C.; visualization, Q.-Y.L.; supervision, P.-K.W.; project administration, P.-K.W.; funding acquisition, P.-K.W. All authors have read and agreed to the published version of the manuscript.

Funding

This research was funded by the Science and Technology Development Fund, Macau S.A.R (Nos. 0026/2022/A and 0091/2023/AMJ), and the Guangdong Basic and Applied Basic Research Fund, Shenzhen Joint Fund (Guangdong–Shenzhen Joint Fund) Guangdong–Hong Kong-Macau Research Team Project (No. 2021B1515130003).

Data Availability Statement

Data and code will be made available upon request.

Conflicts of Interest

The authors declare that they have no known competing financial interests or personal relationships that could have appeared to influence the work reported in this paper.

References

  1. Glowacz, A. Fault diagnosis of single-phase induction motor based on acoustic signals. Mech. Syst. Signal Process. 2019, 117, 65–80. [Google Scholar] [CrossRef]
  2. Shao, S.; Yan, R.; Lu, Y.; Wang, P.; Gao, R.X. DCNN-based multi-signal induction motor fault diagnosis. IEEE Trans. Instrum. Meas. 2019, 69, 2658–2669. [Google Scholar] [CrossRef]
  3. Wang, H.; Liu, Z.; Peng, D.; Yang, M.; Qin, Y. Feature-level attention-guided multitask CNN for fault diagnosis and working conditions identification of rolling bearing. IEEE Trans. Neural Netw. Learn. Syst. 2021, 33, 4757–4769. [Google Scholar] [CrossRef] [PubMed]
  4. Wang, W.; Song, X.; Liu, G.; Chen, Q.; Zhao, W.; Zhu, H. Induction motor broken rotor bar fault diagnosis based on third-order energy operator demodulated current signal. IEEE Trans. Energy Convers. 2021, 37, 1052–1059. [Google Scholar] [CrossRef]
  5. AlShorman, O.; Alkahatni, F.; Masadeh, M.; Irfan, M.; Glowacz, A.; Althobiani, F.; Kozik, J.; Glowacz, W. Sounds and acoustic emission-based early fault diagnosis of induction motor: A review study. Adv. Mech. Eng. 2021, 13, 1687814021996915. [Google Scholar] [CrossRef]
  6. Zurita-Millán, D.; Delgado-Prieto, M.; Saucedo-Dorantes, J.J.; Cariño-Corrales, J.A.; Osornio-Rios, R.A.; Ortega-Redondo, J.A.; Romero-Troncoso, R.d.J. Vibration signal forecasting on rotating machinery by means of signal decomposition and neurofuzzy modeling. Shock Vib. 2016, 2016, 2683269. [Google Scholar] [CrossRef]
  7. Saucedo-Dorantes, J.J.; Delgado-Prieto, M.; Ortega-Redondo, J.A.; Osornio-Rios, R.A.; Romero-Troncoso, R.d.J. Multiple-fault detection methodology based on vibration and current analysis applied to bearings in induction motors and gearboxes on the kinematic chain. Shock Vib. 2016, 2016, 5467643. [Google Scholar] [CrossRef]
  8. Cariño-Corrales, J.A.; Saucedo-Dorantes, J.J.; Zurita-Millan, D.; Delgado-Prieto, M.; Ortega-Redondo, J.A.; Alfredo Osornio-Rios, R.; de Jesus Romero-Troncoso, R. Vibration-based adaptive novelty detection method for monitoring faults in a kinematic chain. Shock Vib. 2016, 2016, 2417856. [Google Scholar] [CrossRef]
  9. Yu, X.; Dong, F.; Ding, E.; Wu, S.; Fan, C. Rolling bearing fault diagnosis using modified LFDA and EMD with sensitive feature selection. IEEE Access 2017, 6, 3715–3730. [Google Scholar] [CrossRef]
  10. Stief, A.; Ottewill, J.R.; Orkisz, M.; Baranowski, J. Two stage data fusion of acoustic, electric and vibration signals for diagnosing faults in induction motors. Elektron. Elektrotechnika 2017, 23, 19–24. [Google Scholar] [CrossRef]
  11. Wang, W.-J.; Cui, L.-L.; Chen, D.-Y. Multi-scale morphology analysis of acoustic emission signal and quantitative diagnosis for bearing fault. Acta Mech. Sin. 2016, 32, 265–272. [Google Scholar] [CrossRef]
  12. Ali, M.Z.; Shabbir, M.N.S.K.; Liang, X.; Zhang, Y.; Hu, T. Machine learning-based fault diagnosis for single-and multi-faults in induction motors using measured stator currents and vibration signals. IEEE Trans. Ind. Appl. 2019, 55, 2378–2391. [Google Scholar] [CrossRef]
  13. Deng, W.; Zhang, S.; Zhao, H.; Yang, X. A novel fault diagnosis method based on integrating empirical wavelet transform and fuzzy entropy for motor bearing. IEEE Access 2018, 6, 35042–35056. [Google Scholar] [CrossRef]
  14. Glowacz, A.; Tadeusiewicz, R.; Legutko, S.; Caesarendra, W.; Irfan, M.; Liu, H.; Brumercik, F.; Gutten, M.; Sulowicz, M.; Daviu, J.A.A. Fault diagnosis of angle grinders and electric impact drills using acoustic signals. Appl. Acoust. 2021, 179, 108070. [Google Scholar] [CrossRef]
  15. Yang, T.; Pen, H.; Wang, Z.; Chang, C.S. Feature knowledge based fault detection of induction motors through the analysis of stator current data. IEEE Trans. Instrum. Meas. 2016, 65, 549–558. [Google Scholar] [CrossRef]
  16. Gutten, M.; KorenciAK, D.; KucerA, M.; SeboK, M.; Opielak, M.; Zukowski, P.; Koltunowicz, T.N. Maintenance diagnostics of transformers considering the influence of short-circuit currents during operation. Eksploat. Niezawodn. 2017, 19, 459–466. [Google Scholar] [CrossRef]
  17. Son, J.-D.; Niu, G.; Yang, B.-S.; Hwang, D.-H.; Kang, D.-S. Development of smart sensors system for machine fault diagnosis. Expert Syst. Appl. 2009, 36, 11981–11991. [Google Scholar] [CrossRef]
  18. Sangeetha, P.; Hemamalini, S. Dyadic wavelet transform-based acoustic signal analysis for torque prediction of a three-phase induction motor. IET Signal Process. 2017, 11, 604–612. [Google Scholar] [CrossRef]
  19. Uekita, M.; Takaya, Y. Tool condition monitoring for form milling of large parts by combining spindle motor current and acoustic emission signals. Int. J. Adv. Manuf. Technol. 2017, 89, 65–75. [Google Scholar] [CrossRef]
  20. Singh, G.; Kumar, T.C.A.; Naikan, V. Induction motor inter turn fault detection using infrared thermographic analysis. Infrared Phys. Technol. 2016, 77, 277–282. [Google Scholar] [CrossRef]
  21. Lopez-Perez, D.; Antonino-Daviu, J. Application of infrared thermography to failure detection in industrial induction motors: Case stories. IEEE Trans. Ind. Appl. 2017, 53, 1901–1908. [Google Scholar] [CrossRef]
  22. Janssens, O.; Schulz, R.; Slavkovikj, V.; Stockman, K.; Loccufier, M.; Van de Walle, R.; Van Hoecke, S. Thermal image based fault diagnosis for rotating machinery. Infrared Phys. Technol. 2015, 73, 78–87. [Google Scholar] [CrossRef]
  23. Bagavathiappan, S.; Lahiri, B.B.; Saravanan, T.; Philip, J.; Jayakumar, T. Infrared thermography for condition monitoring–A review. Infrared Phys. Technol. 2013, 60, 35–55. [Google Scholar] [CrossRef]
  24. Tsanakas, J.A.; Ha, L.; Buerhop, C. Faults and infrared thermographic diagnosis in operating c-Si photovoltaic modules: A review of research and future challenges. Renew. Sust. Energ. Rev. 2016, 62, 695–709. [Google Scholar] [CrossRef]
  25. Guan, H.; Xiao, T.; Luo, W.; Gu, J.; He, R.; Xu, P. Automatic fault diagnosis algorithm for hot water pipes based on infrared thermal images. Build. Environ. 2022, 218, 109111. [Google Scholar] [CrossRef]
  26. Glowacz, A. Ventilation diagnosis of angle grinder using thermal imaging. Sensors 2021, 21, 2853. [Google Scholar] [CrossRef]
  27. Attallah, O.; Ibrahim, R.A.; Zakzouk, N.E. CAD system for inter-turn fault diagnosis of offshore wind turbines via multi-CNNs & feature selection. Renew. Energy 2023, 203, 870–880. [Google Scholar]
  28. Hu, Q.; He, Z.; Zhang, Z.; Zi, Y. Fault diagnosis of rotating machinery based on improved wavelet package transform and SVMs ensemble. Mech. Syst. Signal Process. 2007, 21, 688–705. [Google Scholar] [CrossRef]
  29. Azamfar, M.; Singh, J.; Bravo-Imaz, I.; Lee, J. Multisensor data fusion for gearbox fault diagnosis using 2-D convolutional neural network and motor current signature analysis. Mech. Syst. Signal Process. 2020, 144, 106861. [Google Scholar] [CrossRef]
  30. Jafari, H.; Poshtan, J.; Sadeghi, H. Application of fuzzy data fusion theory in fault diagnosis of rotating machinery. Proc. Inst. Mech. Eng. Part I J. Syst. Control Eng. 2018, 232, 1015–1024. [Google Scholar] [CrossRef]
  31. Geng, Z.; Ding, N.; Han, Y. Fault diagnosis of converter based on wavelet decomposition and BP neural network. In Proceedings of the 2019 Chinese Automation Congress (CAC), Hangzhou, China, 22–24 November 2019; pp. 1273–1276. [Google Scholar]
  32. Sun, W.; Zhao, R.; Yan, R.; Shao, S.; Chen, X. Convolutional discriminative feature learning for induction motor fault diagnosis. IEEE Trans. Ind. Inform. 2017, 13, 1350–1359. [Google Scholar] [CrossRef]
  33. Chine, W.; Mellit, A.; Lughi, V.; Malek, A.; Sulligoi, G.; Pavan, A.M. A novel fault diagnosis technique for photovoltaic systems based on artificial neural networks. Renew. Energy 2016, 90, 501–512. [Google Scholar] [CrossRef]
  34. Hoang, D.T.; Kang, H.J. A motor current signal-based bearing fault diagnosis using deep learning and information fusion. IEEE Trans. Instrum. Meas. 2019, 69, 3325–3333. [Google Scholar] [CrossRef]
  35. Lee, I. Fault diagnosis system development of induction motors using discrete wavelet transform and neural network. J. KIIT 2011, 9, 56–61. [Google Scholar]
  36. Huang, Y.-C.; Wu, W.-B.; Kuo, C.-C. Application of Fault Overlay Method and CNN in Infrared Image of Detecting Inter-Turn Short-Circuit in Dry-Type Transformer. Electronics 2022, 12, 181. [Google Scholar] [CrossRef]
  37. Kim, J.S.; Choi, K.N.; Kang, S.W. Infrared thermal image-based sustainable fault detection for electrical facilities. Sustainability 2021, 13, 557. [Google Scholar] [CrossRef]
  38. Nasiri, A.; Taheri-Garavand, A.; Omid, M.; Carlomagno, G.M. Intelligent fault diagnosis of cooling radiator based on deep learning analysis of infrared thermal images. Appl. Therm. Eng. 2019, 163, 114410. [Google Scholar] [CrossRef]
  39. Pal, N.R.; Pal, S.K. A review on image segmentation techniques. Pattern Recogn. 1993, 26, 1277–1294. [Google Scholar] [CrossRef]
  40. Guo, J.; Guan, J. Classification of marine plankton based on few-shot learning. Arab. J. Sci. Eng. 2021, 46, 9253–9262. [Google Scholar] [CrossRef]
  41. Fu, S.; Liu, B.; Liu, W.; Zou, B.; You, X.; Peng, Q.; Jing, X.-Y. Adaptive multi-scale transductive information propagation for few-shot learning. Knowl.-Based Syst. 2022, 249, 108979. [Google Scholar] [CrossRef]
  42. Krizhevsky, A.; Sutskever, I.; Hinton, G.E. Imagenet classification with deep convolutional neural networks. Adv. Neural Inf. Process. Syst. 2017, 60, 84–90. [Google Scholar] [CrossRef]
  43. Han, T.; Liu, C.; Yang, W.; Jiang, D. Deep transfer network with joint distribution adaptation: A new intelligent fault diagnosis framework for industry application. ISA Trans. 2020, 97, 269–281. [Google Scholar] [CrossRef] [PubMed]
  44. Wang, Y.; Liu, M.; Yang, Y.; Li, Z.; Du, Q.; Chen, Y.; Li, F.; Yang, H. Heterogeneous few-shot learning for hyperspectral image classification. IEEE Geosci. Remote Sens. Lett. 2021, 19, 5510405. [Google Scholar] [CrossRef]
  45. Zhang, A.; Li, S.; Cui, Y.; Yang, W.; Dong, R.; Hu, J. Limited data rolling bearing fault diagnosis with few-shot learning. IEEE Access 2019, 7, 110895–110904. [Google Scholar] [CrossRef]
  46. Chen, P.-Y.; Chao, K.-H.; Tseng, Y.-C. A motor fault diagnosis system based on cerebellar model articulation controller. IEEE Access 2019, 7, 120326–120336. [Google Scholar] [CrossRef]
  47. Qian, L.; Li, B.; Chen, L. CNN-Based Feature Fusion Motor Fault Diagnosis. Electronics 2022, 11, 2746. [Google Scholar] [CrossRef]
  48. Liang, X.; Tang, Z.; Huang, Z.; Zhang, X.; Zhang, S. Efficient hashing method using 2D-2D PCA for image copy detection. IEEE Trans. Knowl. Data Eng. 2021, 35, 3765–3778. [Google Scholar] [CrossRef]
  49. Obayya, M.; Maashi, M.S.; Nemri, N.; Mohsen, H.; Motwakel, A.; Osman, A.E.; Alneil, A.A.; Alsaid, M.I. Hyperparameter optimizer with deep learning-based decision-support systems for histopathological breast cancer diagnosis. Cancers 2023, 15, 885. [Google Scholar] [CrossRef]
  50. Ge, D.-y.; Yao, X.-f.; Xiang, W.-j.; Liu, E.-c.; Xu, Z.-b. Feature similarity measurement of cross-age face images based on a deep learning algorithm. Int. J. Biom. 2021, 13, 272–288. [Google Scholar] [CrossRef]
  51. Ji, Z.; Zou, X.; Huang, T.; Wu, S. Unsupervised few-shot feature learning via self-supervised training. Front. Comput. Neurosci. 2020, 14, 83. [Google Scholar] [CrossRef]
  52. Zhuang, F.; Qi, Z.; Duan, K.; Xi, D.; Zhu, Y.; Zhu, H.; Xiong, H.; He, Q. A comprehensive survey on transfer learning. Proc. IEEE 2020, 109, 43–76. [Google Scholar] [CrossRef]
Figure 1. Normalized model and toolbox function.
Electronics 13 00108 g001
Figure 2. Convolutional neural network-based training framework.
Electronics 13 00108 g002
Figure 3. The universal testing framework based on the training model.
Electronics 13 00108 g003
Figure 4. Motor fault diagnosis system (FDS).
Electronics 13 00108 g004
Figure 5. Test rig (from left to right: motor, ruler, infrared thermal imager).
Electronics 13 00108 g005
Figure 6. Eight fault types of water pump motors (motor A and motor B) and universal motor (motor C) (A, B and C represent three types of motors).
Electronics 13 00108 g006
Figure 7. Infrared thermal images of 8 fault types for water pump motors (motor A and motor B) and universal motor (motor C) (normalized).
Electronics 13 00108 g007
Figure 8. Principal component analysis of motors A and B.
Electronics 13 00108 g008
Figure 9. Principal component analysis of motors A and C.
Electronics 13 00108 g009
Figure 10. Analysis of the hyperparameters of the CNN training model.
Electronics 13 00108 g010
Figure 11. Confusion matrix of motor B without color bar normalization.
Electronics 13 00108 g011
Figure 12. Confusion matrix of motor B based on the color bar normalization.
Electronics 13 00108 g012
Figure 13. Hyperparameter analysis diagram based on few-shot learning.
Electronics 13 00108 g013
Figure 14. Test results of few-shot learning.
Electronics 13 00108 g014
Figure 15. Confusion matrix of motor C.
Electronics 13 00108 g015
Table 1. Rated parameters of three types of motors.
Motor ModelClean Water Pump (A)Clean Water Pump (B)Universal Motor (C)
Rated power340 W370 W380 W
Rated voltage220 V220 V220 V
Rated current2 A3.5 A2.3 A
Rated speed800 r/min920 r/min40,000 r/min
TypeACACDC
Table 2. Infrared thermal imager parameters.
ItemOperational Parameters
UTi260B−20 °C to 550 °C temperature measurement range
Thermal resolution of 256 × 192 pixels
Solid object material and surface treatments exhibit emissivity ranging
from approximately 0.01 to 1
Operating environment of 0 °C to 50 °C
Thermal sensitivity < 50 mk
Table 3. Number of data images of each motor.
Data SetFault Type Train Test Total
HealthCoilBearingFan
Motor ALeft (0° to 30°)18018018018011765041680
Front60606060
Right (0° to 30°)180180180180
Motor BLeft (0° to 30°)909090900840840
Front30303030
Right (0° to 30°)90909090
Motor CFront100100100 45255300
Disclaimer/Publisher’s Note: The statements, opinions and data contained in all publications are solely those of the individual author(s) and contributor(s) and not of MDPI and/or the editor(s). MDPI and/or the editor(s) disclaim responsibility for any injury to people or property resulting from any ideas, methods, instructions or products referred to in the content.

