

Wavelet Analysis to Detect Ground Faults in Electrical Power Systems with Full Penetration of Converter Interface Generation


Abstract
:1. Introduction
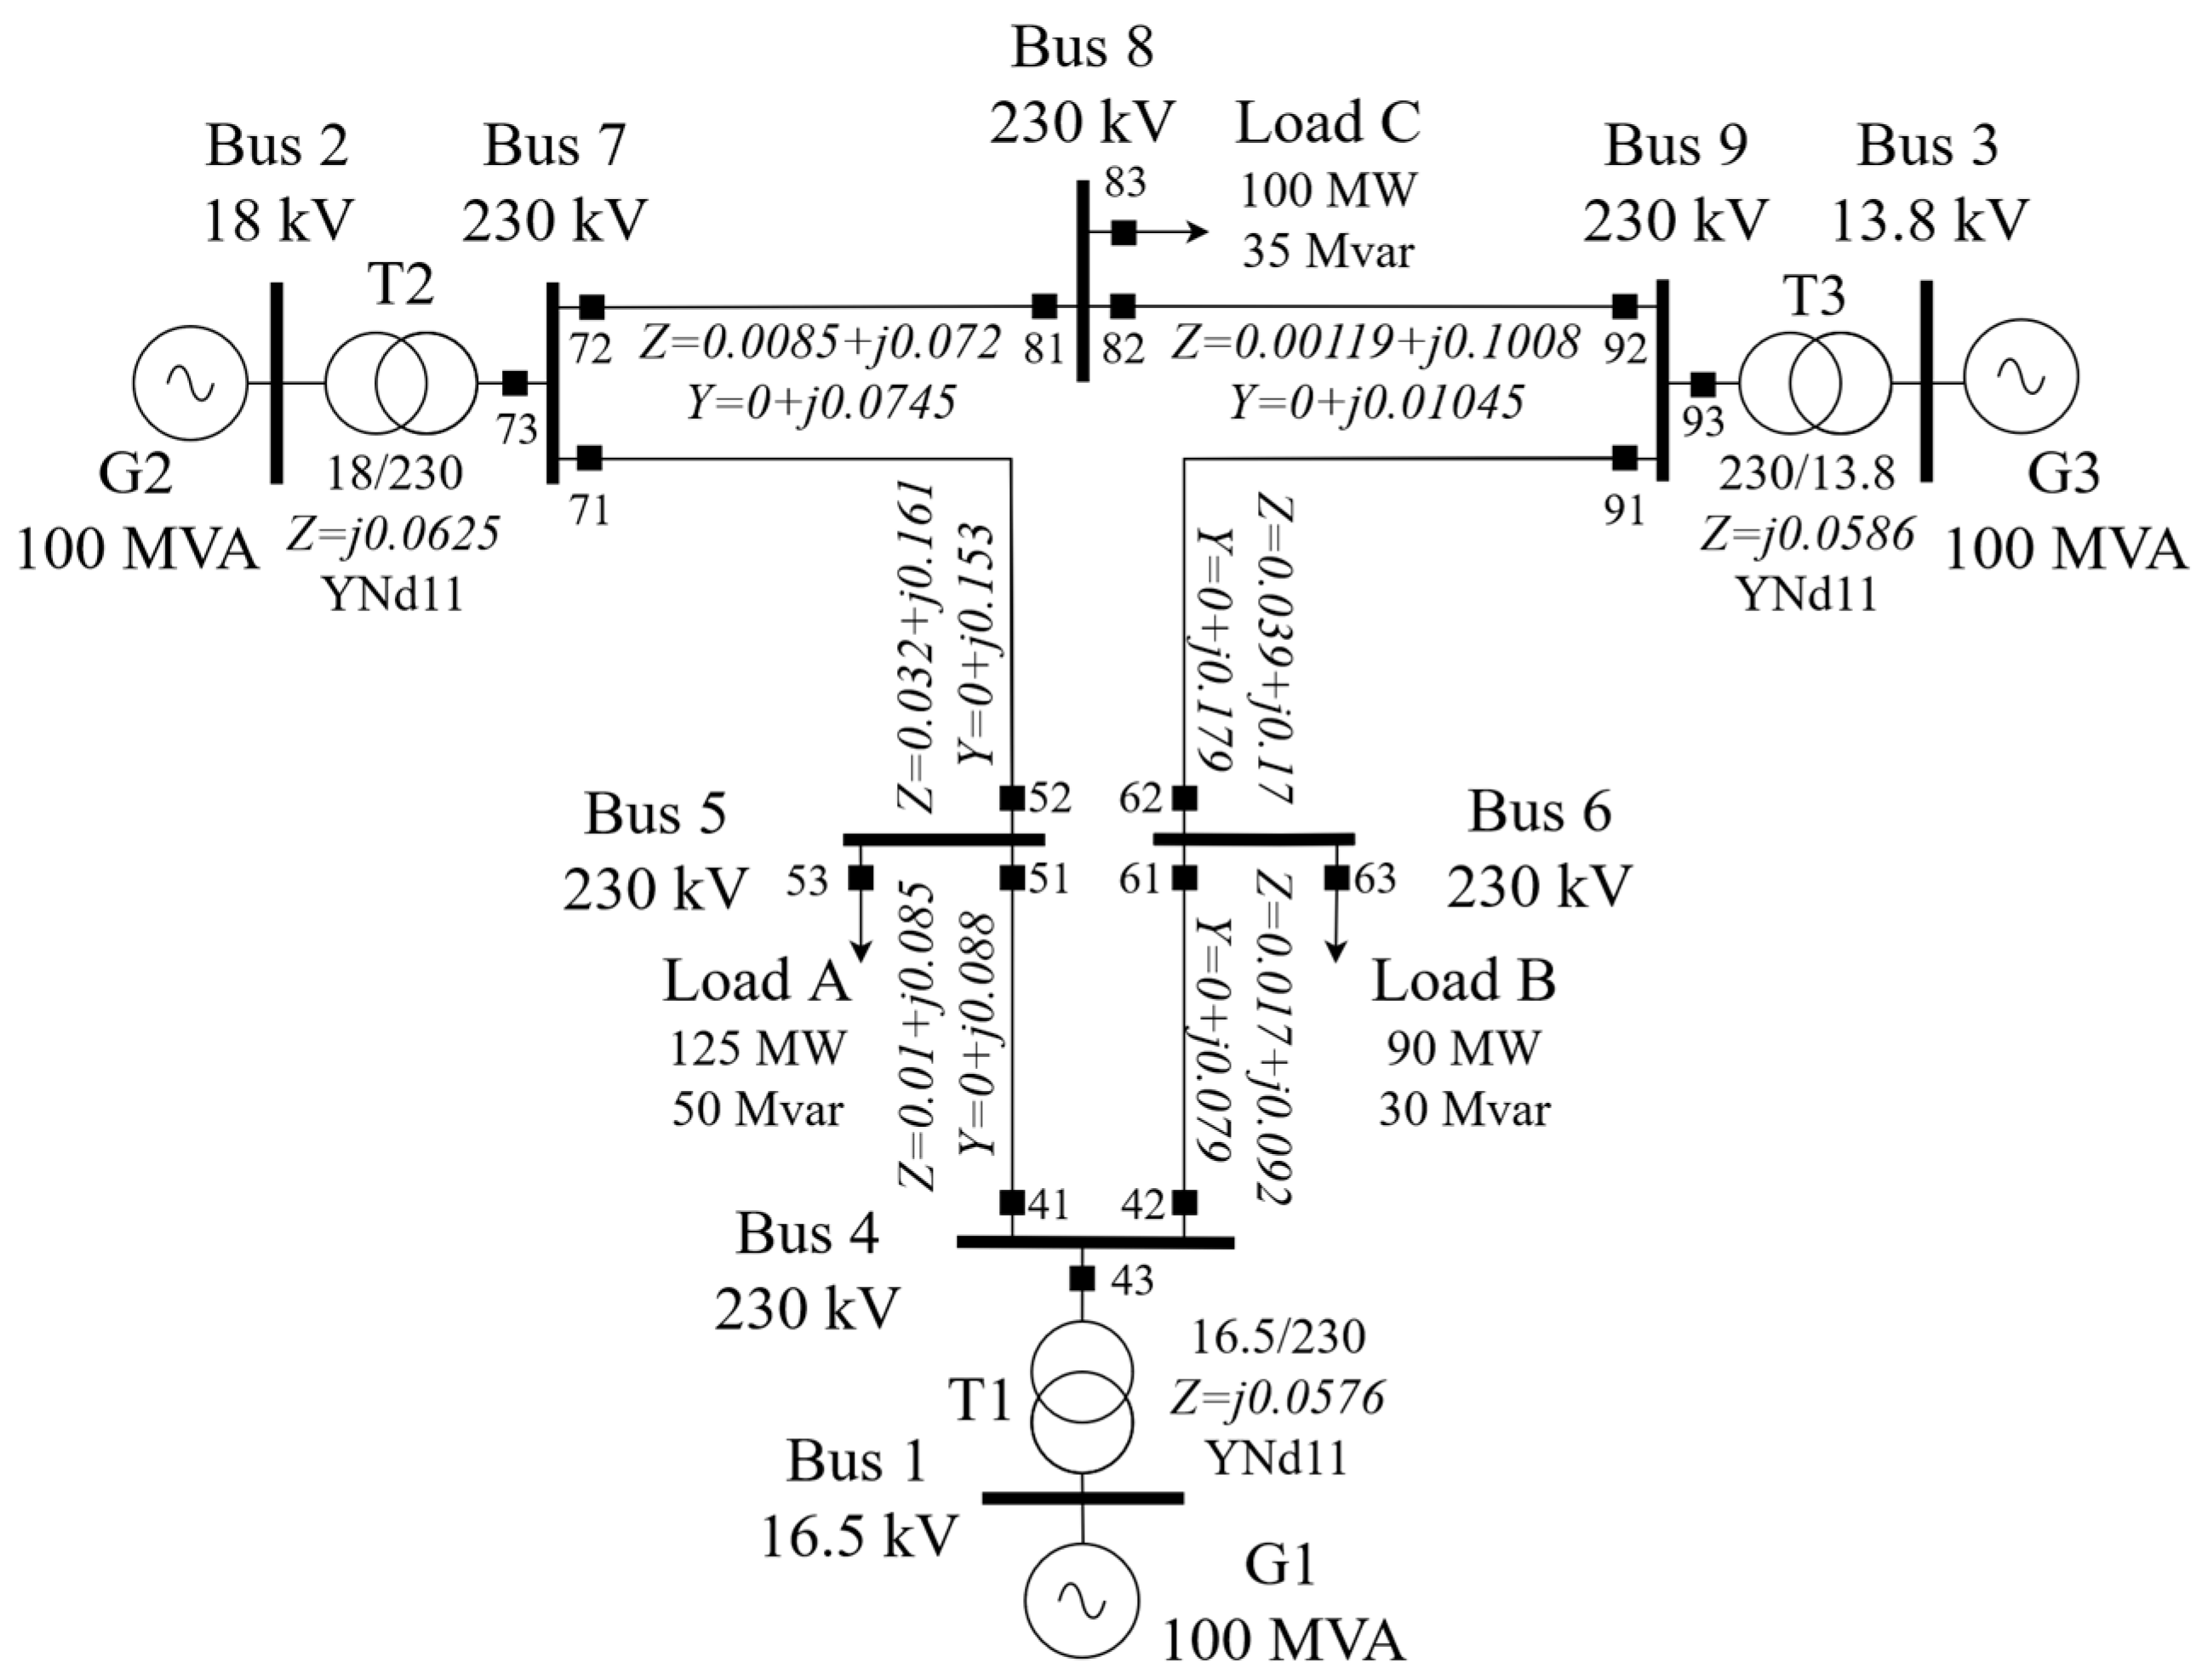
2. Grid Model
3. Grid-Forming VSC Control
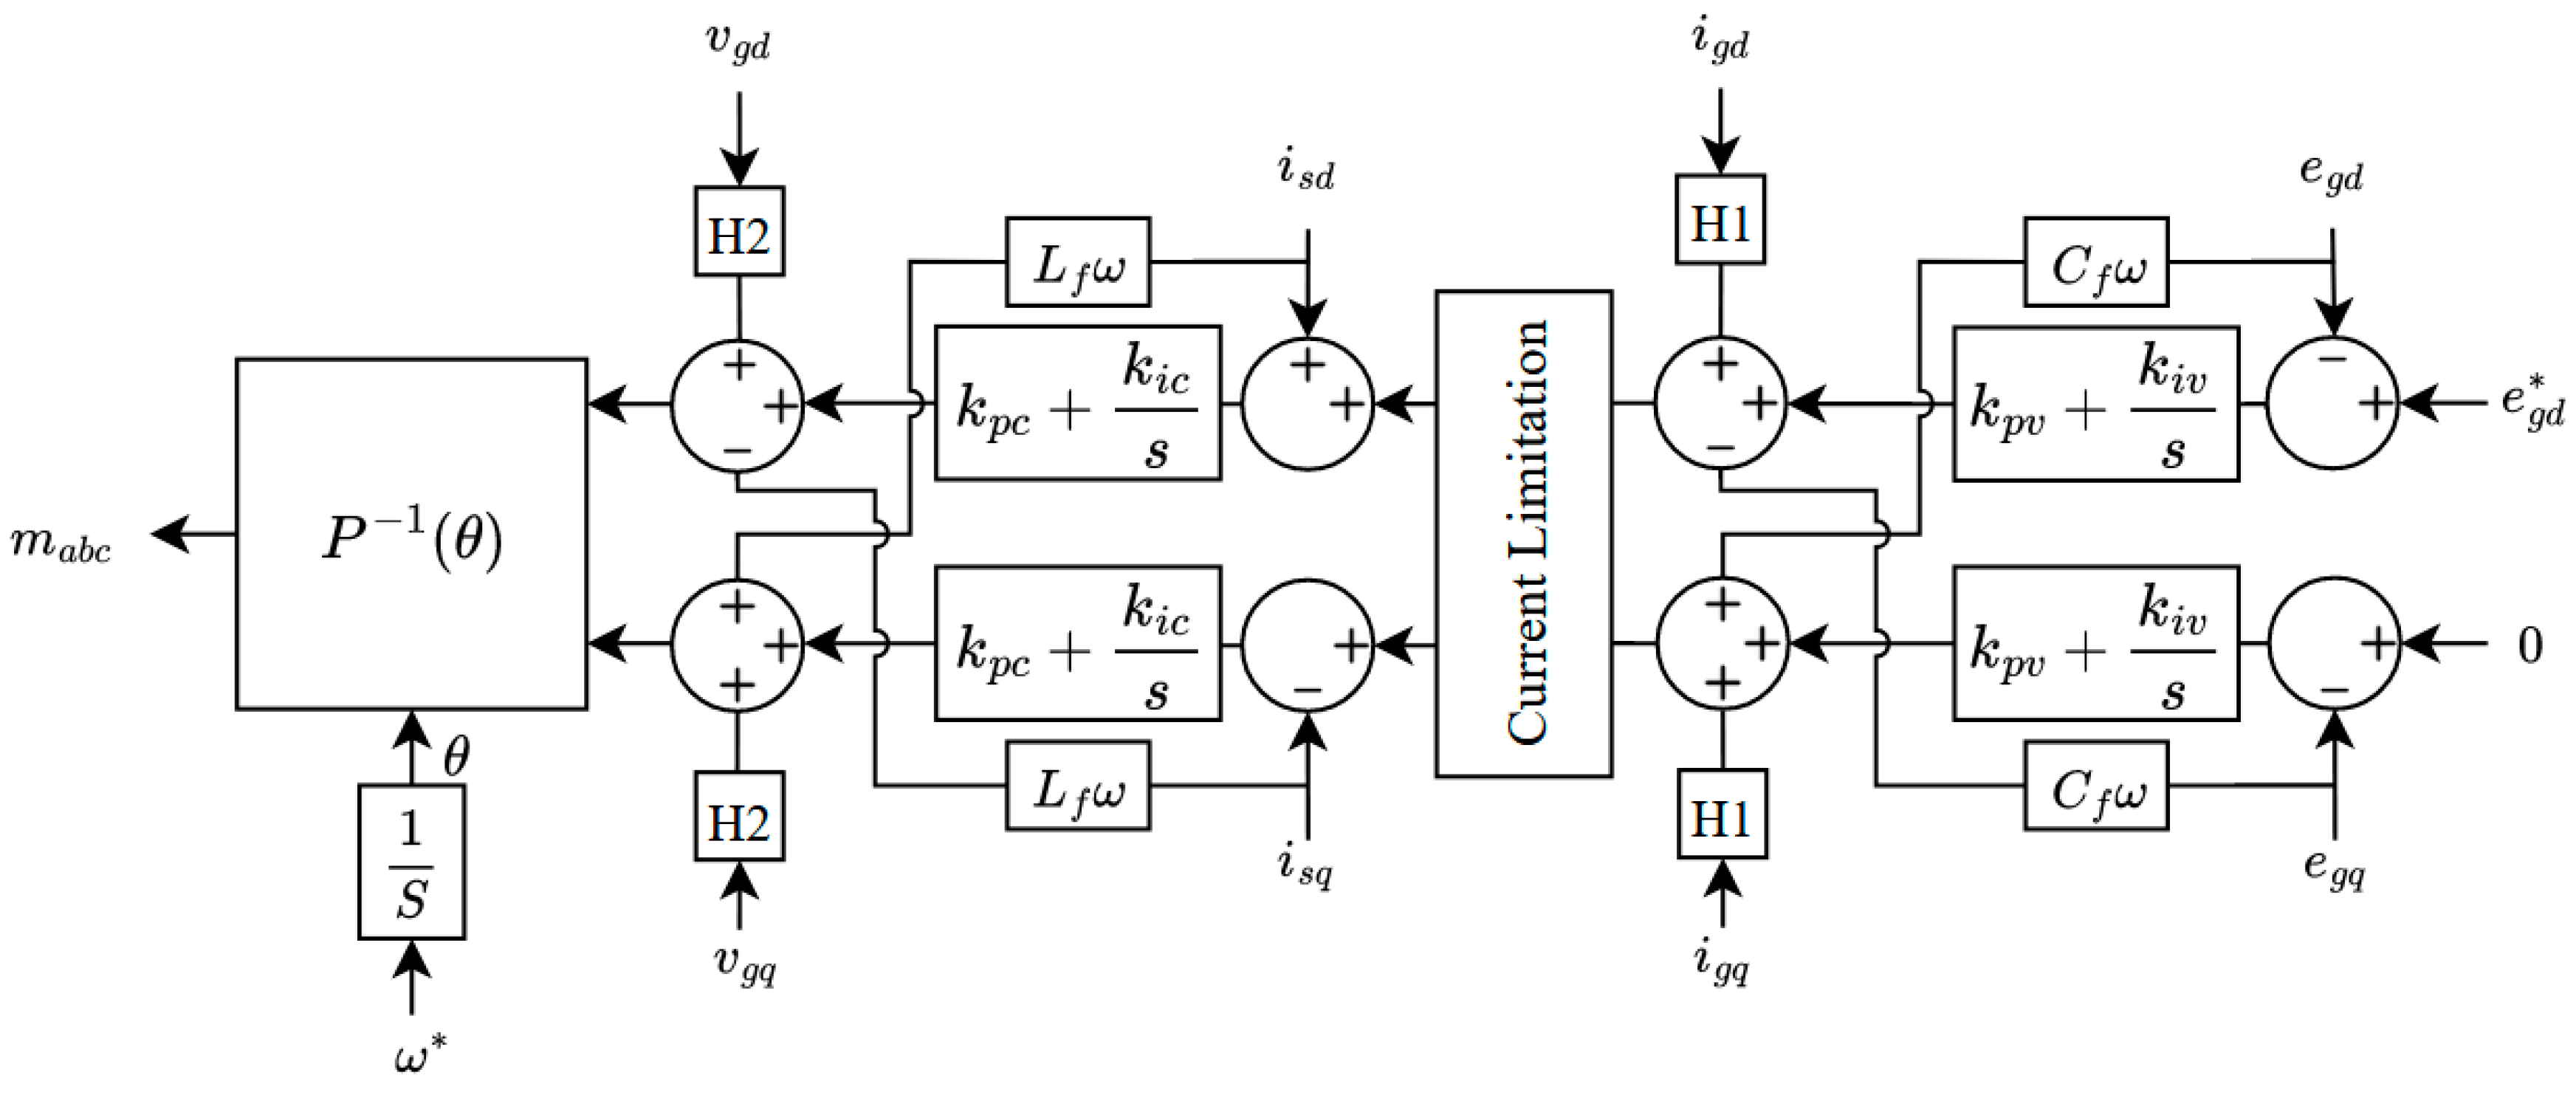
3.1. Grid-Forming VSC Cascaded Control Scheme
3.2. Current Limit Strategy
4. Arc Grounding Fault Model
4.1. Physical Models
4.2. Black Box Models
4.3. Parameter Models
5. Wavelet Transform Analysis
6. Protection Relay Algorithm
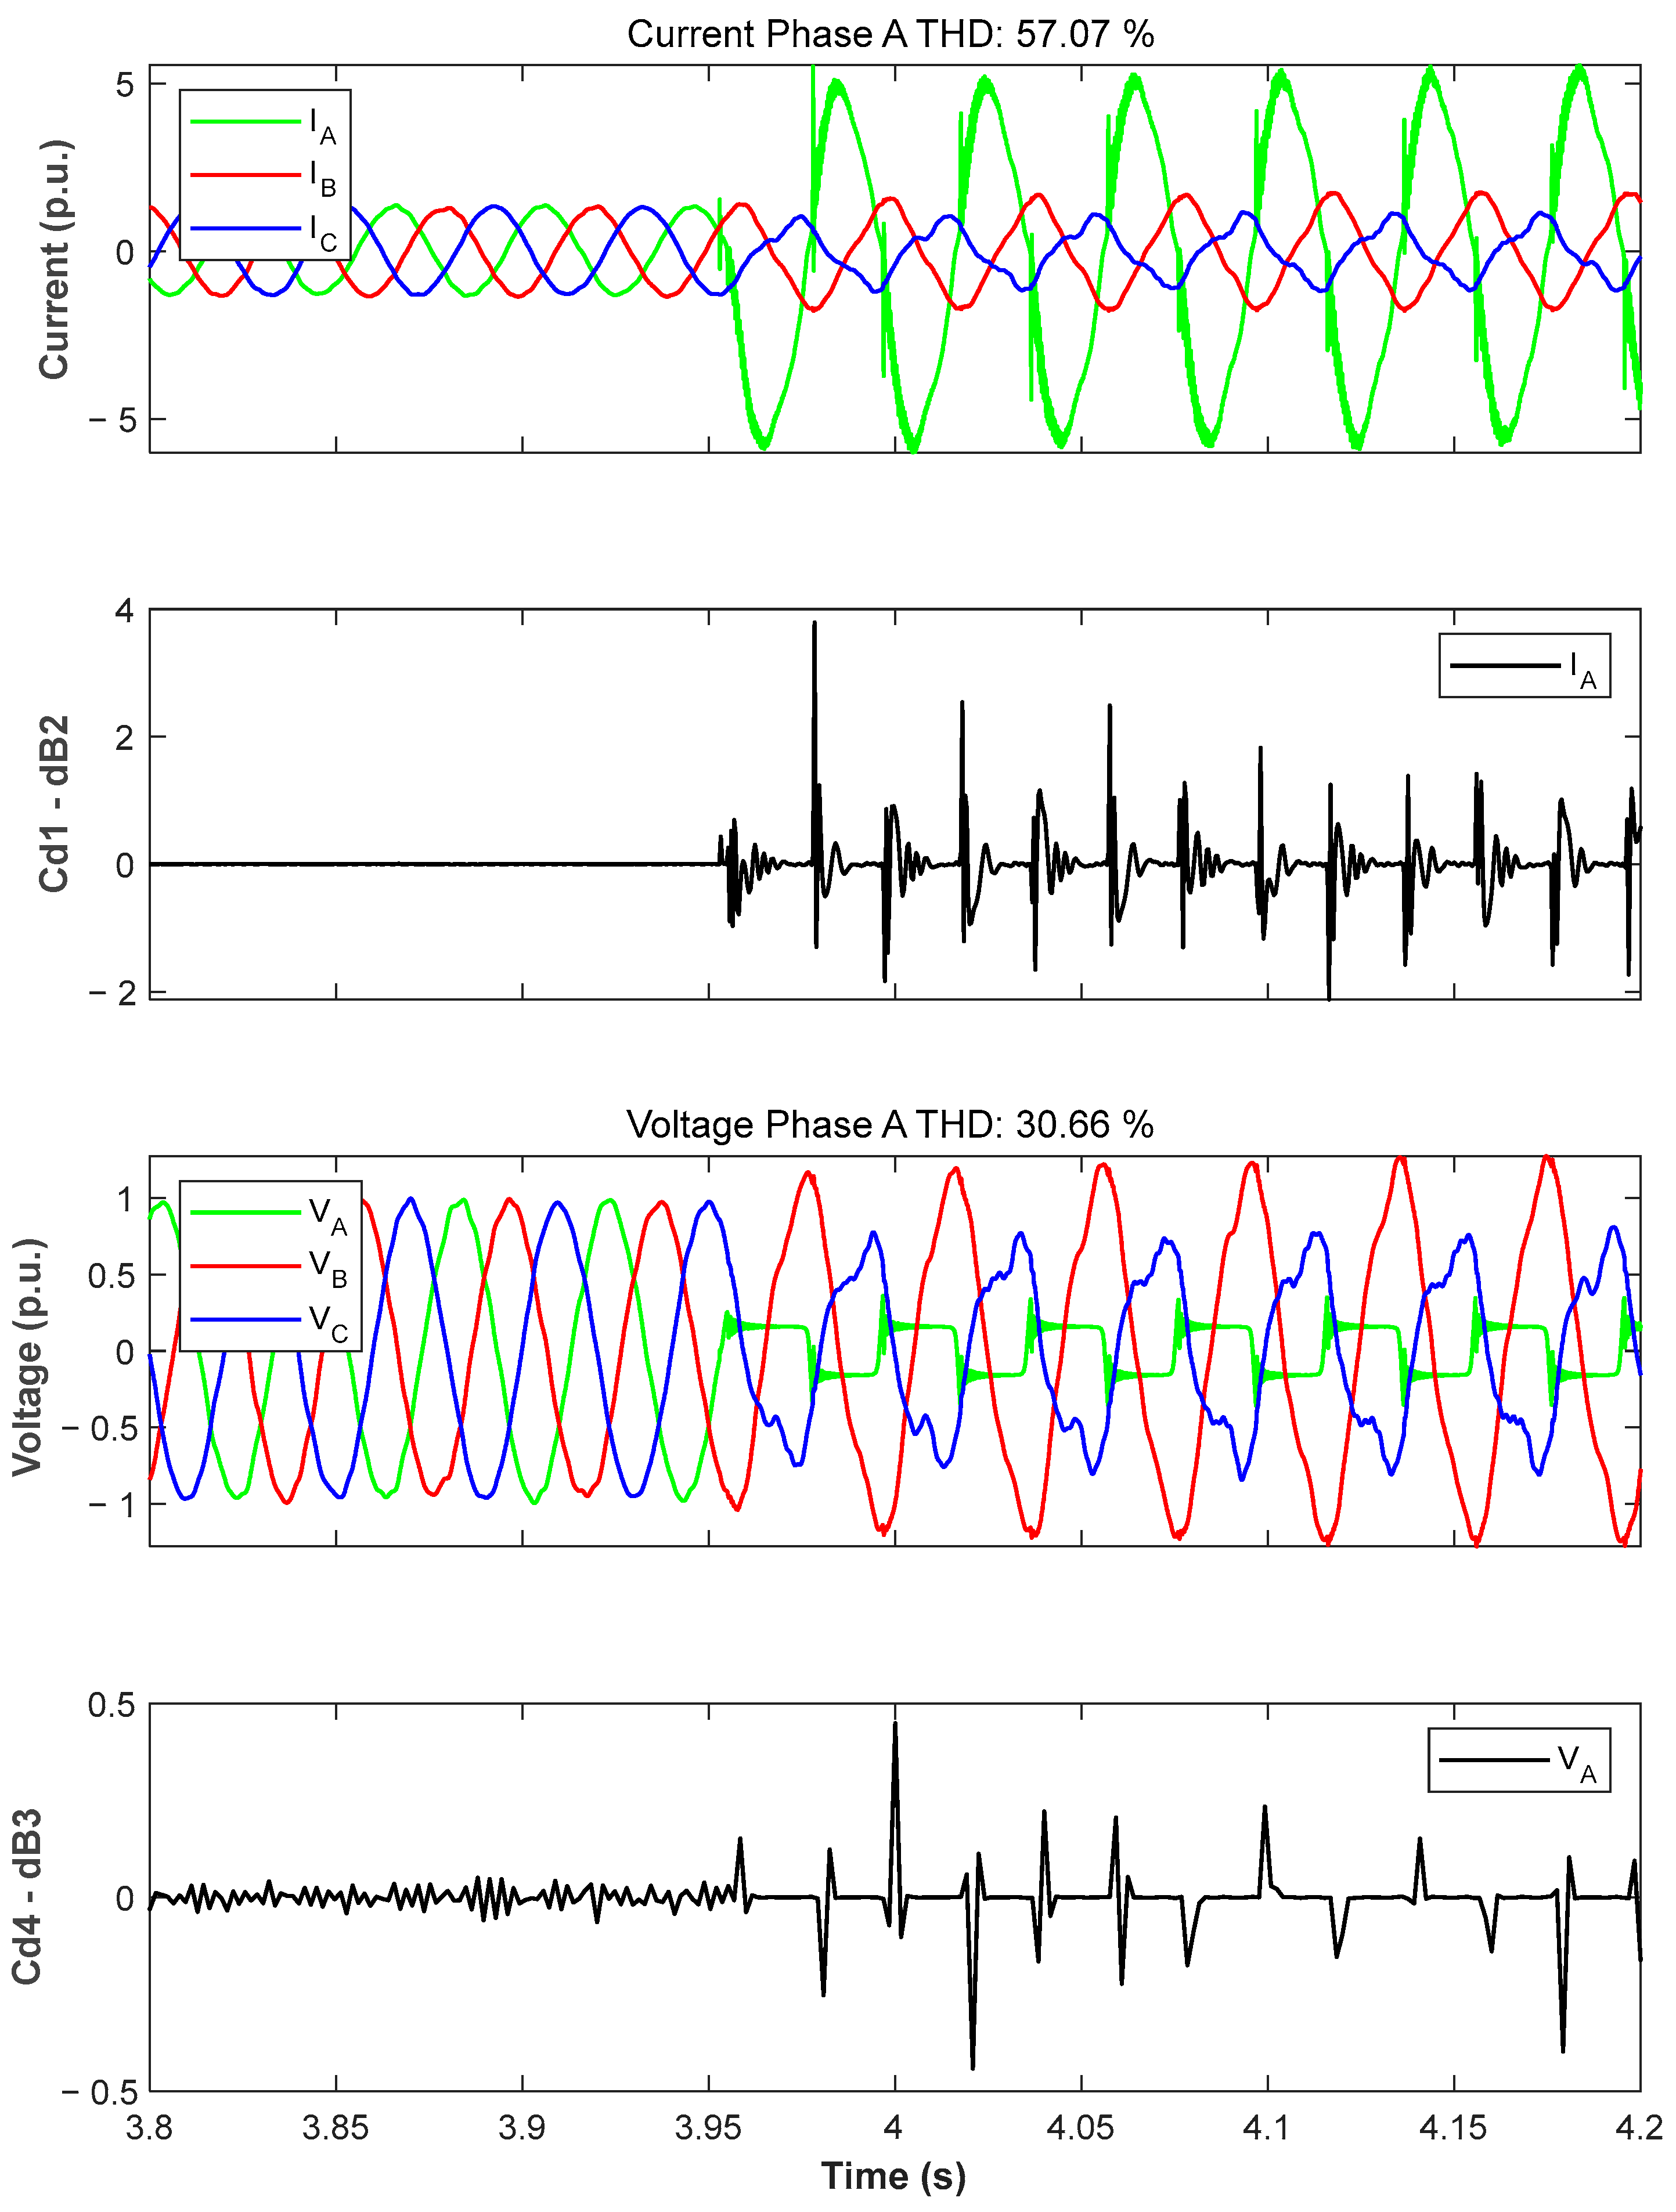
- Step 1: measure the three-phase voltage waveform for bus i and the current waveform for a feeder m coupled to bus i, and calculate their voltage and current detail coefficients by applying the wavelet transform.
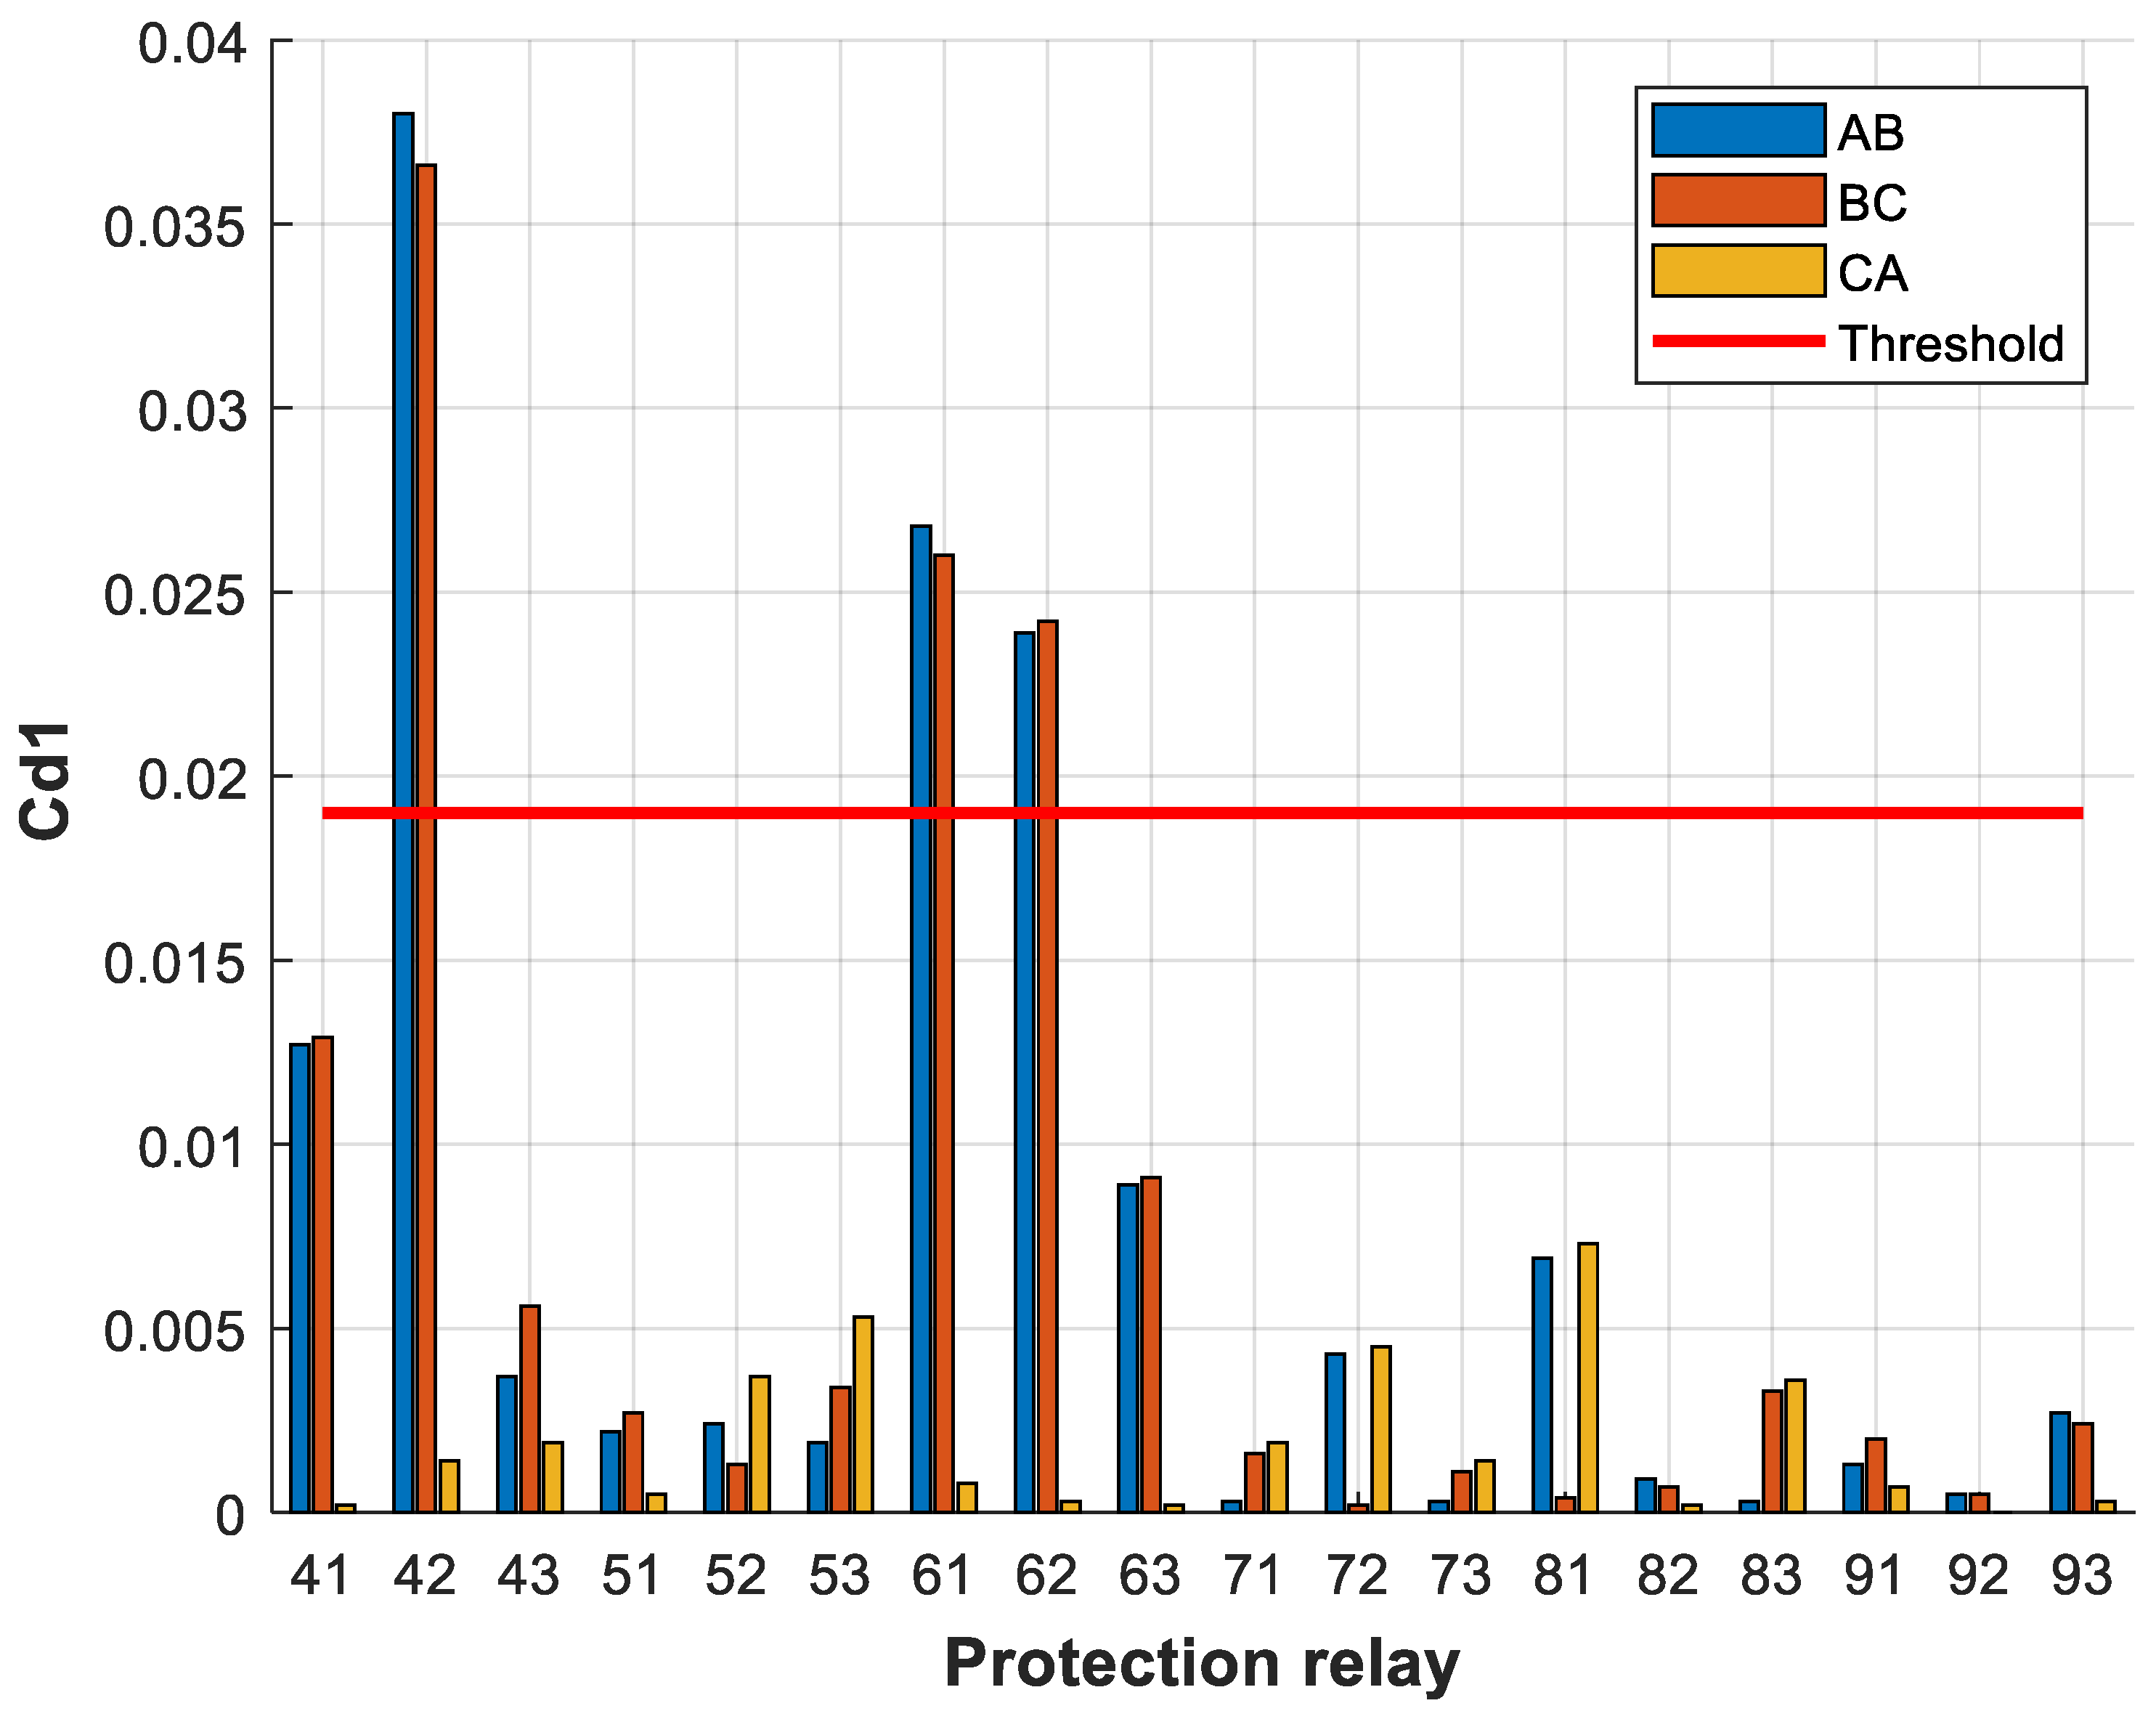
- Step 2: calculate the values Uab,i, Ubc,i and Uca,i as the differences between the voltage detail coefficients, i.e., as Uab,i = Ua,i − Ub,i, Ubc,i = Ub,i − Uc,i and Uca,i = Uc,i − Ua,i, and calculate the values Iab,i,m, Ibc,i,m and Ica,i,m as the differences between the current detail coefficients, i.e., as Iab,i,m = Ia,i,m − Ib,i,m, Ibc,i,m = Ib,i,m − Ic,i,m and Ica,i,m = Ic,i,m − Ia,i,m.
- Step 3: Check whether the differences between the voltage detail coefficients and current detail coefficients obtained in Step 2 are higher than the voltage threshold value and the current threshold value, respectively. Such thresholds are taken as half of the maximum values of the detail coefficient for voltages and currents.
- Step 4: check whether the maximum differences between the voltage detail coefficients and current detail coefficients that have exceeded their established thresholds have the same phase sub-index x and y, i.e., Uab,i and Iab,i,m, Ubc,i and Ibc,i,m, or Uca,i and Ica,i,m.
- Step 5: Trip feeder m coupled to bus i.
7. Results
7.1. Fault at Load A
7.2. Fault on Transmission Line from Bus 4 to Bus 6
7.3. Fault at Transmission Line from Bus 8 to Bus 9
8. Conclusions
Author Contributions
Funding
Data Availability Statement
Conflicts of Interest
References
- Plet, C.A.; Graovac, M.; Green, T.C.; Iravani, R. Fault response of grid-connected inverter dominated networks. In Proceedings of the IEEE PES General Meeting, Minneapolis, MN, USA, 25–29 July 2010; pp. 1–8. [Google Scholar] [CrossRef] [Green Version]
- Dolado, J.; Amenedo, J.L.R.; Arnaltes, S.; Eloy-Garcia, J. Improving the Inertial Response of a Grid-Forming Voltage Source Converter. Electronics 2022, 11, 2303. [Google Scholar] [CrossRef]
- Jia, J.; Yang, G.; Nielsen, A.H. A Review on Grid-Connected Converter Control for Short-Circuit Power Provision under Grid Unbalanced Faults. IEEE Trans. Power Deliv. 2018, 33, 649–661. [Google Scholar] [CrossRef] [Green Version]
- Manson, S.; McCullough, E. Practical Microgrid Protection Solutions: Promises and Challenges. IEEE Power Energy Mag. 2021, 19, 58–69. [Google Scholar] [CrossRef]
- Reno, M.J.; Brahma, S.; Bidram, A.; Ropp, M.E. Influence of Inverter-Based Resources on Microgrid Protection: Part 1: Microgrids in Radial Distribution Systems. IEEE Power Energy Mag. 2021, 19, 36–46. [Google Scholar] [CrossRef]
- Vegunta, S.C.; Higginson, M.J.; Kenarangui, Y.E.; Li, G.T.; Zabel, D.W.; Tasdighi, M.; Shadman, A. AC Microgrid Protection System Design Challenges—A Practical Experience. Energies 2021, 14, 2016. [Google Scholar] [CrossRef]
- Brahma, S.M.; Girgis, A.A. Development of Adaptive Protection Scheme for Distribution Systems With High Penetration of Distributed Generation. IEEE Trans. Power Deliv. 2004, 19, 56–63. [Google Scholar] [CrossRef]
- Brucoli, M.; Green, T.C.; McDonald, J.D.F. Modelling and analysis of fault behaviour of inverter microgrids to aid future fault detection. In Proceedings of the 2007 IEEE International Conference on System of Systems Engineering, San Antonio, TX, USA, 16–18 April 2007. [Google Scholar] [CrossRef]
- Brucoli, M. Fault Behaviour and Fault Detection in Islanded Inverter-Only Microgrids; Imperial College London: London, UK, 2008. [Google Scholar]
- Zamani, M.A.; Sidhu, T.S.; Yazdani, A. A protection strategy and microprocessor-based relay for low-voltage microgrids. IEEE Trans. Power Deliv. 2011, 26, 1873–1883. [Google Scholar] [CrossRef]
- Mohamed, N.A.; Salama, M.M.A. A review on the proposed solutions to microgrid protection problems. In Proceedings of the 2016 IEEE Canadian Conference on Electrical and Computer Engineering (CCECE), Vancouver, BC, Canada, 15–18 May 2016; Volume 2016, pp. 1–5. [Google Scholar] [CrossRef]
- Mirsaeidi, S.; Said, D.M.; Mustafa, M.W.; Habibuddin, M.H.; Miveh, M.R. A comprehensive overview of different protection schemes in micro-grids. Int. J. Emerg. Electr. Power Syst. 2013, 14, 327–332. [Google Scholar] [CrossRef]
- Chen, Z.; Pei, X.; Yang, M.; Peng, L.; Shi, P. A Novel Protection Scheme for Inverter-Interfaced Microgrid (IIM) Operated in Islanded Mode. IEEE Trans. Power Electron. 2018, 33, 7684–7697. [Google Scholar] [CrossRef]
- Oureilidis, K.O.; Demoulias, C.S. A Fault Clearing Method in Converter-Dominated Microgrids with Conventional Protection Means. IEEE Trans. Power Electron. 2016, 31, 4628–4640. [Google Scholar] [CrossRef]
- Sortomme, E.; Venkata, S.S.; Mitra, J. Microgrid protection using communication-assisted digital relays. IEEE Trans. Power Deliv. 2010, 25, 2789–2796. [Google Scholar] [CrossRef]
- Huang, W.; Nengling, T.; Zheng, X.; Fan, C.; Yang, X.; Kirby, B.J. An impedance protection scheme for feeders of active distribution networks. IEEE Trans. Power Deliv. 2014, 29, 1591–1602. [Google Scholar] [CrossRef]
- Yabe, K. Power differential method for discrimination between fault and magnetizing inrush current in transformers. IEEE Trans. Power Deliv. 1997, 12, 1109–1115. [Google Scholar] [CrossRef]
- Gilany, M.; Al-Kandari, A.M.; Madouh, J.Y. A new strategy for determining fault zones in distance relays. IEEE Trans. Power Deliv. 2008, 23, 1857–1863. [Google Scholar] [CrossRef]
- Farkhani, J.S.; Zareein, M.; Najafi, A.; Melicio, R. The Power System and Microgrid Protection—A Review. Appl. Sci. 2020, 10, 8271. [Google Scholar] [CrossRef]
- Arrabé, R.G. New Methods and Protection Systems for AC and DC Power Networks; Universidad Politécnica de Madrid: Madrid, Spain, 2018. [Google Scholar]
- Qoria, T.; Gruson, F.; Colas, F.; Kestelyn, X.; Guillaud, X. Current limiting algorithms and transient stability analysis of grid-forming VSCs. Electr. Power Syst. Res. 2020, 189, 106726. [Google Scholar] [CrossRef]
- Huang, L.; Xin, H.; Wang, Z.; Zhang, L.; Wu, K.; Hu, J. Transient Stability Analysis and Control Design of Droop-Controlled Voltage Source Converters Considering Current Limitation. IEEE Trans. Smart Grid 2019, 10, 578–591. [Google Scholar] [CrossRef]
- Gkountaras, A.; Dieckerhoff, S.; Sezi, T. Evaluation of current limiting methods for grid forming inverters in medium voltage microgrids. In Proceedings of the 2015 IEEE Energy Conversion Congress and Exposition (ECCE), Montreal, QC, Canada, 20–24 September 2015; pp. 1223–1230. [Google Scholar] [CrossRef]
- Wu, H.; Li, X.; Stade, D.; Schau, H. Arc fault model for low-voltage AC systems. IEEE Trans. Power Deliv. 2005, 20, 1204–1205. [Google Scholar] [CrossRef]
- Parizad, A.; Baghaee, H.R.; Tavakoli, A.; Jamali, S. Optimization of f Arc Models Parameter s Using Genetic Algorithm. In Proceedings of the 2009 International Conference on Electric Power and Energy Conversion Systems, (EPECS), Sharjah, United Arab Emirates, 10–12 November 2009; pp. 1–7. [Google Scholar]
- CKim, H.; Kim, H.; Ko, Y.H.; Byun, S.H.; Aggarwal, R.K.; Johns, A.T. A novel fault-detection technique of high-impedance arcing faults in transmission lines using the wavelet transform. IEEE Trans. Power Deliv. 2002, 17, 921–929. [Google Scholar] [CrossRef]
- Angrisani, L.; Daponte, P.; D’Apuzzo, M.; Testa, A. A measurement method based on the wavelet transform for power quality analysis. IEEE Trans. Power Deliv. 1998, 13, 990–998. [Google Scholar] [CrossRef]
- Poisson, O.; Rioual, P.; Meunier, M. Detection and measurement of power quality disturbances using wavelet transform. IEEE Trans. Power Deliv. 2000, 15, 1039–1044. [Google Scholar] [CrossRef]
- Reddy, V.M.; Rao, S.S.; Mercede, F.J. On the use of wavelets for the detection and analysis of power system transients. In Proceedings of the IEEE Power Engineering Society, 1999 Winter Meeting, New York, NY, USA, 1 January–4 February 1999; Volume 2, pp. 1293–1299. [Google Scholar] [CrossRef]
- Magnago, F.H.; Abur, A. Fault location using wavelets. IEEE Trans. Power Deliv. 1998, 13, 1475–1480. [Google Scholar] [CrossRef]
- Bhattacharjee, P.P. Application of wavelets to model short-term power system disturbances. IEEE Trans. Power Syst. 1996, 11, 2031–2037. [Google Scholar] [CrossRef]
- Yu, R.; Fu, Z.; Wang, Q.; Sun, S.; Chen, H.; Xu, Q.; Chen, X. Modeling and simulation analysis of single phase arc grounding fault based on MATLAB. In Proceedings of the International Conference on Electronic & Mechanical Engineering & Information Technology, EMEIT, Harbin, China, 12–14 August 2011; Volume 9, pp. 4607–4610. [Google Scholar] [CrossRef]
- Pérez, F.E.; Aguilar, R.; Orduna, E.; Jäger, J.; Guidi, G. High-speed non-unit transmission line protection using single-phase measurements and an adaptive wavelet: Zone detection and fault classification. IET Gener. Transm. Distrib. 2012, 6, 593–604. [Google Scholar] [CrossRef]
- Jung, H.; Park, Y.; Han, M.; Lee, C.; Park, H.; Shin, M. Novel technique for fault location estimation on parallel transmission lines using wavelet. Int. J. Electr. Power Energy Syst. 2007, 29, 76–82. [Google Scholar] [CrossRef]
- Khan, F.A.; Shees, M.M.; Alsharekh, M.F.; Alyahya, S.; Saleem, F.; Baghel, V.; Sarwar, A.; Islam, M.; Khan, S. Open-circuit fault detection in a multilevel inverter using sub-band wavelet energy. Electronics 2022, 11, 123. [Google Scholar] [CrossRef]
- Meliopoulos, A.P.S.; Lee, C.-H. An alternative method for transient analysis via wavelets. IEEE Trans. Power Deliv. 2000, 15, 114–121. [Google Scholar] [CrossRef]
- Robertson, D.C.; Camps, O.I.; Mayer, J.S.; Gish, W.B. Wavelets and electromagnetic power system transients. IEEE Trans. Power Deliv. 1996, 11, 1050–1056. [Google Scholar] [CrossRef]
- Santoso, S.; Powers, E.J.; Grady, W.M.; Hofmann, P. Power quality assessment via wavelet transform analysis. IEEE Trans. Power Deliv. 1996, 11, 924–930. [Google Scholar] [CrossRef]


| Parameter | Value | Parameter | Value | Parameter | Value |
|---|---|---|---|---|---|
| Lf | 0.2 | Rf | 0.01 | Cf | 0.2 |
| kic | 160 | kpc | 2 | H1 | 0.75 |
| kiv | 7.8 | kpv | 1 | H2 | 1 |
| Relay No. | Detail Coefficients | |||||
|---|---|---|---|---|---|---|
| Voltage (Cd4–dB3) | Current (Cd1–dB2) | |||||
| Phase A | Phase B | Phase C | Phase A | Phase B | Phase C | |
| 41 | 2.58 × 10⁻¹ | 1.42 × 10⁻¹ | 1.45 × 10⁻¹ | 1.78 × 10⁻² | 1.02 × 10⁻² | 1.26 × 10⁻² |
| 42 | 2.58 × 10⁻¹ | 1.42 × 10⁻¹ | 1.45 × 10⁻¹ | 1.63 × 10⁻² | 9.40 × 10⁻³ | 1.36 × 10⁻² |
| 43 | 2.58 × 10⁻¹ | 1.42 × 10⁻¹ | 1.45 × 10⁻¹ | 8.10 × 10⁻³ | 1.71 × 10⁻² | 8.70 × 10⁻³ |
| 51 | 4.08 × 10⁻¹ | 1.02 × 10⁻¹ | 9.92 × 10⁻² | 1.44 | 8.90 × 10⁻³ | 1.01 × 10⁻² |
| 52 | 4.08 × 10⁻¹ | 1.02 × 10⁻¹ | 9.92 × 10⁻² | 2.41 | 1.73 × 10⁻² | 1.72 × 10⁻² |
| 53 | 4.08 × 10⁻¹ | 1.02 × 10⁻¹ | 9.92 × 10⁻² | 3.78 | 2.76 × 10⁻² | 2.59 × 10⁻² |
| 61 | 1.66 × 10⁻¹ | 1.07 × 10⁻¹ | 9.97 × 10⁻² | 5.50 × 10⁻³ | 3.60 × 10⁻³ | 4.00 × 10⁻³ |
| 62 | 1.66 × 10⁻¹ | 1.07 × 10⁻¹ | 9.97 × 10⁻² | 5.50 × 10⁻³ | 2.70 × 10⁻³ | 5.20 × 10⁻³ |
| 63 | 1.66 × 10⁻¹ | 1.07 × 10⁻¹ | 9.97 × 10⁻² | 1.80 × 10⁻³ | 9.92 × 10⁻⁴ | 8.50 × 10⁻³ |
| 71 | 1.62 × 10⁻¹ | 1.56 × 10⁻¹ | 1.51 × 10⁻¹ | 8.30 × 10⁻³ | 8.30 × 10⁻³ | 1.48 × 10⁻² |
| 72 | 1.62 × 10⁻¹ | 1.56 × 10⁻¹ | 1.51 × 10⁻¹ | 3.40 × 10⁻³ | 2.80 × 10⁻³ | 2.70 × 10⁻³ |
| 73 | 1.62 × 10⁻¹ | 1.56 × 10⁻¹ | 1.51 × 10⁻¹ | 1.64 × 10⁻² | 1.06 × 10⁻² | 1.15 × 10⁻² |
| 81 | 1.56 × 10⁻¹ | 1.28 × 10⁻¹ | 1.89 × 10⁻¹ | 2.50 × 10⁻³ | 5.20 × 10⁻³ | 2.40 × 10⁻³ |
| 82 | 1.56 × 10⁻¹ | 1.28 × 10⁻¹ | 1.89 × 10⁻¹ | 1.06 × 10⁻² | 4.50 × 10⁻³ | 2.20 × 10⁻³ |
| 83 | 1.56 × 10⁻¹ | 1.28 × 10⁻¹ | 1.89 × 10⁻¹ | 2.70 × 10⁻³ | 1.80 × 10⁻³ | 9.20 × 10⁻³ |
| 91 | 1.58 × 10⁻¹ | 1.70 × 10⁻¹ | 1.89 × 10⁻¹ | 3.30 × 10⁻³ | 3.60 × 10⁻³ | 8.10 × 10⁻³ |
| 92 | 1.58 × 10⁻¹ | 1.70 × 10⁻¹ | 1.89 × 10⁻¹ | 2.70 × 10⁻³ | 4.60 × 10⁻³ | 1.60 × 10⁻³ |
| 93 | 1.58 × 10⁻¹ | 1.70 × 10⁻¹ | 1.89 × 10⁻¹ | 6.10 × 10⁻³ | 1.07 × 10⁻² | 4.30 × 10⁻³ |
| Relay No. | Detail Coefficients | |||||
|---|---|---|---|---|---|---|
| Voltage (Cd4–dB3) | Current (Cd1–dB2) | |||||
| Phase A | Phase B | Phase C | Phase A | Phase B | Phase C | |
| 41 | 2.39 × 10⁻¹ | 4.68 × 10⁻¹ | 1.91 × 10⁻¹ | 8.90 × 10⁻³ | 2.16 × 10⁻² | 8.70 × 10⁻³ |
| 42 | 2.39 × 10⁻¹ | 4.68 × 10⁻¹ | 1.91 × 10⁻¹ | 4.50 × 10⁻³ | 4.25 × 10⁻² | 5.90 × 10⁻³ |
| 43 | 2.39 × 10⁻¹ | 4.68 × 10⁻¹ | 1.91 × 10⁻¹ | 1.06 × 10⁻² | 1.43 × 10⁻² | 8.70 × 10⁻³ |
| 51 | 6.42 × 10⁻² | 1.26 × 10⁻¹ | 9.92 × 10⁻² | 3.00 × 10⁻³ | 5.20 × 10⁻³ | 2.50 × 10⁻³ |
| 52 | 6.42 × 10⁻² | 1.26 × 10⁻¹ | 9.92 × 10⁻² | 2.20 × 10⁻³ | 4.60 × 10⁻³ | 5.90 × 10⁻³ |
| 53 | 6.42 × 10⁻² | 1.26 × 10⁻¹ | 9.92 × 10⁻² | 1.80 × 10⁻³ | 3.70 × 10⁻³ | 7.10 × 10⁻³ |
| 61 | 1.01 × 10⁻¹ | 3.75 × 10⁻¹ | 1.50 × 10⁻¹ | 9.70 × 10⁻³ | 3.65 × 10⁻² | 1.05 × 10⁻² |
| 62 | 1.01 × 10⁻¹ | 3.75 × 10⁻¹ | 1.50 × 10⁻¹ | 1.05 × 10⁻² | 3.44 × 10⁻² | 1.02 × 10⁻² |
| 63 | 1.01 × 10⁻¹ | 3.75 × 10⁻¹ | 1.50 × 10⁻¹ | 2.90 × 10⁻³ | 1.18 × 10⁻² | 2.70 × 10⁻³ |
| 71 | 1.62 × 10⁻¹ | 1.56 × 10⁻¹ | 1.51 × 10⁻¹ | 1.02 × 10⁻² | 9.90 × 10⁻³ | 8.30 × 10⁻³ |
| 72 | 1.62 × 10⁻¹ | 1.56 × 10⁻¹ | 1.51 × 10⁻¹ | 7.10 × 10⁻³ | 2.80 × 10⁻³ | 2.60 × 10⁻³ |
| 73 | 1.62 × 10⁻¹ | 1.56 × 10⁻¹ | 1.51 × 10⁻¹ | 1.14 × 10⁻² | 1.11 × 10⁻² | 1.00 × 10⁻² |
| 81 | 1.56 × 10⁻¹ | 1.28 × 10⁻¹ | 1.89 × 10⁻¹ | 9.70 × 10⁻³ | 2.80 × 10⁻³ | 2.40 × 10⁻³ |
| 82 | 1.56 × 10⁻¹ | 1.28 × 10⁻¹ | 1.89 × 10⁻¹ | 2.40 × 10⁻³ | 3.30 × 10⁻³ | 2.60 × 10⁻³ |
| 83 | 1.56 × 10⁻¹ | 1.28 × 10⁻¹ | 1.89 × 10⁻¹ | 2.20 × 10⁻³ | 2.50 × 10⁻³ | 5.80 × 10⁻³ |
| 91 | 1.58 × 10⁻¹ | 1.70 × 10⁻¹ | 1.89 × 10⁻¹ | 4.20 × 10⁻³ | 5.50 × 10⁻³ | 3.50 × 10⁻³ |
| 92 | 1.58 × 10⁻¹ | 1.70 × 10⁻¹ | 1.89 × 10⁻¹ | 1.70 × 10⁻³ | 2.20 × 10⁻³ | 1.70 × 10⁻³ |
| 93 | 1.58 × 10⁻¹ | 1.70 × 10⁻¹ | 1.89 × 10⁻¹ | 4.60 × 10⁻³ | 7.30 × 10⁻³ | 4.90 × 10⁻³ |
| Relay No. | Detail Coefficients | |||||
|---|---|---|---|---|---|---|
| Voltage (Cd4–dB3) | Current (Cd1–dB2) | |||||
| Phase A | Phase B | Phase C | Phase A | Phase B | Phase C | |
| 41 | 1.52 × 10⁻¹ | 1.41 × 10⁻¹ | 1.92 × 10⁻¹ | 5.10 × 10⁻³ | 5.90 × 10⁻³ | 6.40 × 10⁻³ |
| 42 | 1.52 × 10⁻¹ | 1.41 × 10⁻¹ | 1.92 × 10⁻¹ | 4.10 × 10⁻³ | 4.80 × 10⁻³ | 5.30 × 10⁻³ |
| 43 | 1.52 × 10⁻¹ | 1.41 × 10⁻¹ | 1.92 × 10⁻¹ | 8.40 × 10⁻³ | 8.10 × 10⁻³ | 4.80 × 10⁻³ |
| 51 | 7.16 × 10⁻² | 8.61 × 10⁻² | 1.14 × 10⁻¹ | 5.90 × 10⁻³ | 1.80 × 10⁻³ | 2.30 × 10⁻³ |
| 52 | 7.16 × 10⁻² | 8.61 × 10⁻² | 1.14 × 10⁻¹ | 1.70 × 10⁻³ | 1.50 × 10⁻³ | 1.70 × 10⁻³ |
| 53 | 7.16 × 10⁻² | 8.61 × 10⁻² | 1.14 × 10⁻¹ | 1.30 × 10⁻³ | 1.40 × 10⁻³ | 9.40 × 10⁻³ |
| 61 | 1.04 × 10⁻¹ | 1.13 × 10⁻¹ | 9.08 × 10⁻² | 4.80 × 10⁻³ | 2.20 × 10⁻³ | 3.00 × 10⁻³ |
| 62 | 1.04 × 10⁻¹ | 1.13 × 10⁻¹ | 9.08 × 10⁻² | 2.10 × 10⁻³ | 2.00 × 10⁻³ | 2.70 × 10⁻³ |
| 63 | 1.04 × 10⁻¹ | 1.13 × 10⁻¹ | 9.08 × 10⁻² | 1.10 × 10⁻³ | 1.10 × 10⁻³ | 5.30 × 10⁻³ |
| 71 | 1.76 × 10⁻¹ | 2.31 × 10⁻¹ | 2.00 × 10⁻¹ | 1.24 × 10⁻² | 9.80 × 10⁻³ | 1.34 × 10⁻² |
| 72 | 1.76 × 10⁻¹ | 2.31 × 10⁻¹ | 2.00 × 10⁻¹ | 3.50 × 10⁻² | 6.20 × 10⁻³ | 5.70 × 10⁻³ |
| 73 | 1.76 × 10⁻¹ | 2.31 × 10⁻¹ | 2.00 × 10⁻¹ | 1.22 × 10⁻² | 2.35 × 10⁻² | 1.70 × 10⁻² |
| 81 | 1.64 × 10⁻¹ | 2.03 × 10⁻¹ | 3.30 × 10⁻¹ | 1.12 × 10⁻² | 5.80 × 10⁻³ | 2.18 × 10⁻² |
| 82 | 1.64 × 10⁻¹ | 2.03 × 10⁻¹ | 3.30 × 10⁻¹ | 7.00 × 10⁻³ | 6.90 × 10⁻³ | 6.18 × 10⁻² |
| 83 | 1.64 × 10⁻¹ | 2.03 × 10⁻¹ | 3.30 × 10⁻¹ | 4.60 × 10⁻³ | 5.40 × 10⁻³ | 1.38 × 10⁻² |
| 91 | 2.30 × 10⁻¹ | 2.33 × 10⁻¹ | 7.05 × 10⁻¹ | 1.70 × 10⁻³ | 1.70 × 10⁻³ | 9.50 × 10⁻³ |
| 92 | 2.30 × 10⁻¹ | 2.33 × 10⁻¹ | 7.05 × 10⁻¹ | 2.50 × 10⁻³ | 1.80 × 10⁻³ | 1.94 × 10⁻² |
| 93 | 2.30 × 10⁻¹ | 2.33 × 10⁻¹ | 7.05 × 10⁻¹ | 5.50 × 10⁻³ | 2.80 × 10⁻³ | 1.12 × 10⁻² |
Disclaimer/Publisher’s Note: The statements, opinions and data contained in all publications are solely those of the individual author(s) and contributor(s) and not of MDPI and/or the editor(s). MDPI and/or the editor(s) disclaim responsibility for any injury to people or property resulting from any ideas, methods, instructions or products referred to in the content. |
© 2023 by the authors. Licensee MDPI, Basel, Switzerland. This article is an open access article distributed under the terms and conditions of the Creative Commons Attribution (CC BY) license (https://creativecommons.org/licenses/by/4.0/).
Share and Cite
Azuara Grande, L.S.; Granizo, R.; Arnaltes, S. Wavelet Analysis to Detect Ground Faults in Electrical Power Systems with Full Penetration of Converter Interface Generation. Electronics 2023, 12, 1085. https://doi.org/10.3390/electronics12051085
Azuara Grande LS, Granizo R, Arnaltes S. Wavelet Analysis to Detect Ground Faults in Electrical Power Systems with Full Penetration of Converter Interface Generation. Electronics. 2023; 12(5):1085. https://doi.org/10.3390/electronics12051085
Chicago/Turabian StyleAzuara Grande, Luis Santiago, Ricardo Granizo, and Santiago Arnaltes. 2023. "Wavelet Analysis to Detect Ground Faults in Electrical Power Systems with Full Penetration of Converter Interface Generation" Electronics 12, no. 5: 1085. https://doi.org/10.3390/electronics12051085