Article

Investigations of the Wireless M-Bus System Resilience under Challenging Propagation Conditions

Faculty of Information and Communication Technology, Wroclaw University of Science and Technology, 50-370 Wroclaw, Poland
*
Author to whom correspondence should be addressed.
Electronics 2023, 12(4), 907; https://doi.org/10.3390/electronics12040907
Submission received: 5 January 2023 / Revised: 31 January 2023 / Accepted: 7 February 2023 / Published: 10 February 2023

Abstract

:
Wireless M-Bus is a short-range wireless telemetry system that plays a vital role in the capillary sector of the Internet of Things (IoT) ecosystem. Similar to any other IoT technology, it is meant to operate in harsh environmental conditions such as production plants, cellars, or other under-ground or indoor metering installations. This paper describes the methodology and outcomes of a carefully designed measurement campaign targeted at investigating this system’s immunity to jamming and extremely fading channels. The former was carried out in an anechoic chamber and the latter in a reverberation chamber, both specifically adapted for these types of measurements. The presented methodology allows for reproducible research. The article demonstrates PER measurements results as a function of CNIR for all throughput modes offered by the tested devices (ranging from 4.8 kb/s to 100 kb/s). The threshold CNIR values are universal and may prove useful in an IoT network design that is based on the Wireless M-Bus technology.

1. Introduction

In the era of Internet maturity, it was noticed that sensors, meters, and detectors also create a specific network “community” participating in network traffic and generating data of no less importance than those produced by man. They are often strategic for maintaining the quality of life, controlling industrial processes, or monitoring the state of the natural environment. These devices, or, more generally—objects—can communicate either with a human (an operator) or with other devices. In the latter case, they are also sometimes referred to in the literature by the acronym MTD (machine-type device), i.e., devices that do not require human intervention to exchange data with each other. The very process of communication between them is referred to as M2M (machine-to-machine) or MTC (machine-type communications) and is one of the paradigms of the so-called Internet of Things (IoT) [1,2]. It is a branch of our global network in which MTD devices are equal partners to their “human” counterparts when it comes to the importance of the telecommunication traffic they generate, which is more and more necessary to maintain the efficient functioning of our technical civilization.
The main purpose of narrowband Internet of Things (IoT) systems is to transfer traffic (mainly) from a large number of end devices connected to utility probes, sensors, detectors, gauges, etc. According to the IoT traffic model documented in [3], when IoT systems become fully promiscuous, the prospective number of these sensory devices is expected to be 40 per household. Within the range of a single IoT base station (BS), the number of houses is assumed to be 4275. This arrangement, while economically justified, creates a significant single point of failure when the BS is exposed to intense interference or jamming, thus, disrupting the entire IoT network. The situation can be seen as a form of electromagnetic cyberattack. Figure 1 illustrates this case by showing a scenario where readings from multiple sensors (represented by blue arrows carrying the desired carrier signal power C) are emitted towards the base station, which, at the same time, is experiencing interference (I) from the in-band jammer, causing the carrier-to-noise ratio (CNIR) received by the BS to fall below the threshold necessary for correct uplink (UL) reception.
Since the motivation for this paper is deeply embedded in a broad context of electromagnetic interference in IoT networks, a separate section (i.e., Chapter 4) has been dedicated for this purpose. The paper presents a high-precision methodology for investigating the performance of wireless systems in various propagation environments, taking Wireless M-Bus as a hardware platform. The proposed approach allows us to carry out repeatable measurements that can be universally used in the process of designing and configuring reliable wireless sensor networks in an arbitrary propagation environment.
The conclusions and analyses presented in this publication:
  • Provide the minimum CNIR values (and, thus, sensitivity), separately for each throughput mode, which may lend themselves to serving as reference figures at a wireless sensor network (WSN) radio-planning stage, based on the WM-Bus technology.
  • Allow us to select the most appropriate operational mode (in terms of the modulation and the throughput) to best-fit propagation conditions encountered on the WSN deployment site.
  • Demonstrate Wireless M-Bus performance under propagation conditions of variable adversity at the two different frequency bands.
The work has been divided into chapters. In the next, second chapter, the characteristics of IoT systems and capillary networks are presented. The third chapter contains an overview of interference sources (both intentional and unintentional) and possible attacks on WSN’s, along with solutions to reduce or completely eliminate the effects of these interferences or defend against attacks. The next two chapters describe the purpose and scope of the conducted research. The last part of the work contains the results of the research along with conclusions and planned work for the future.

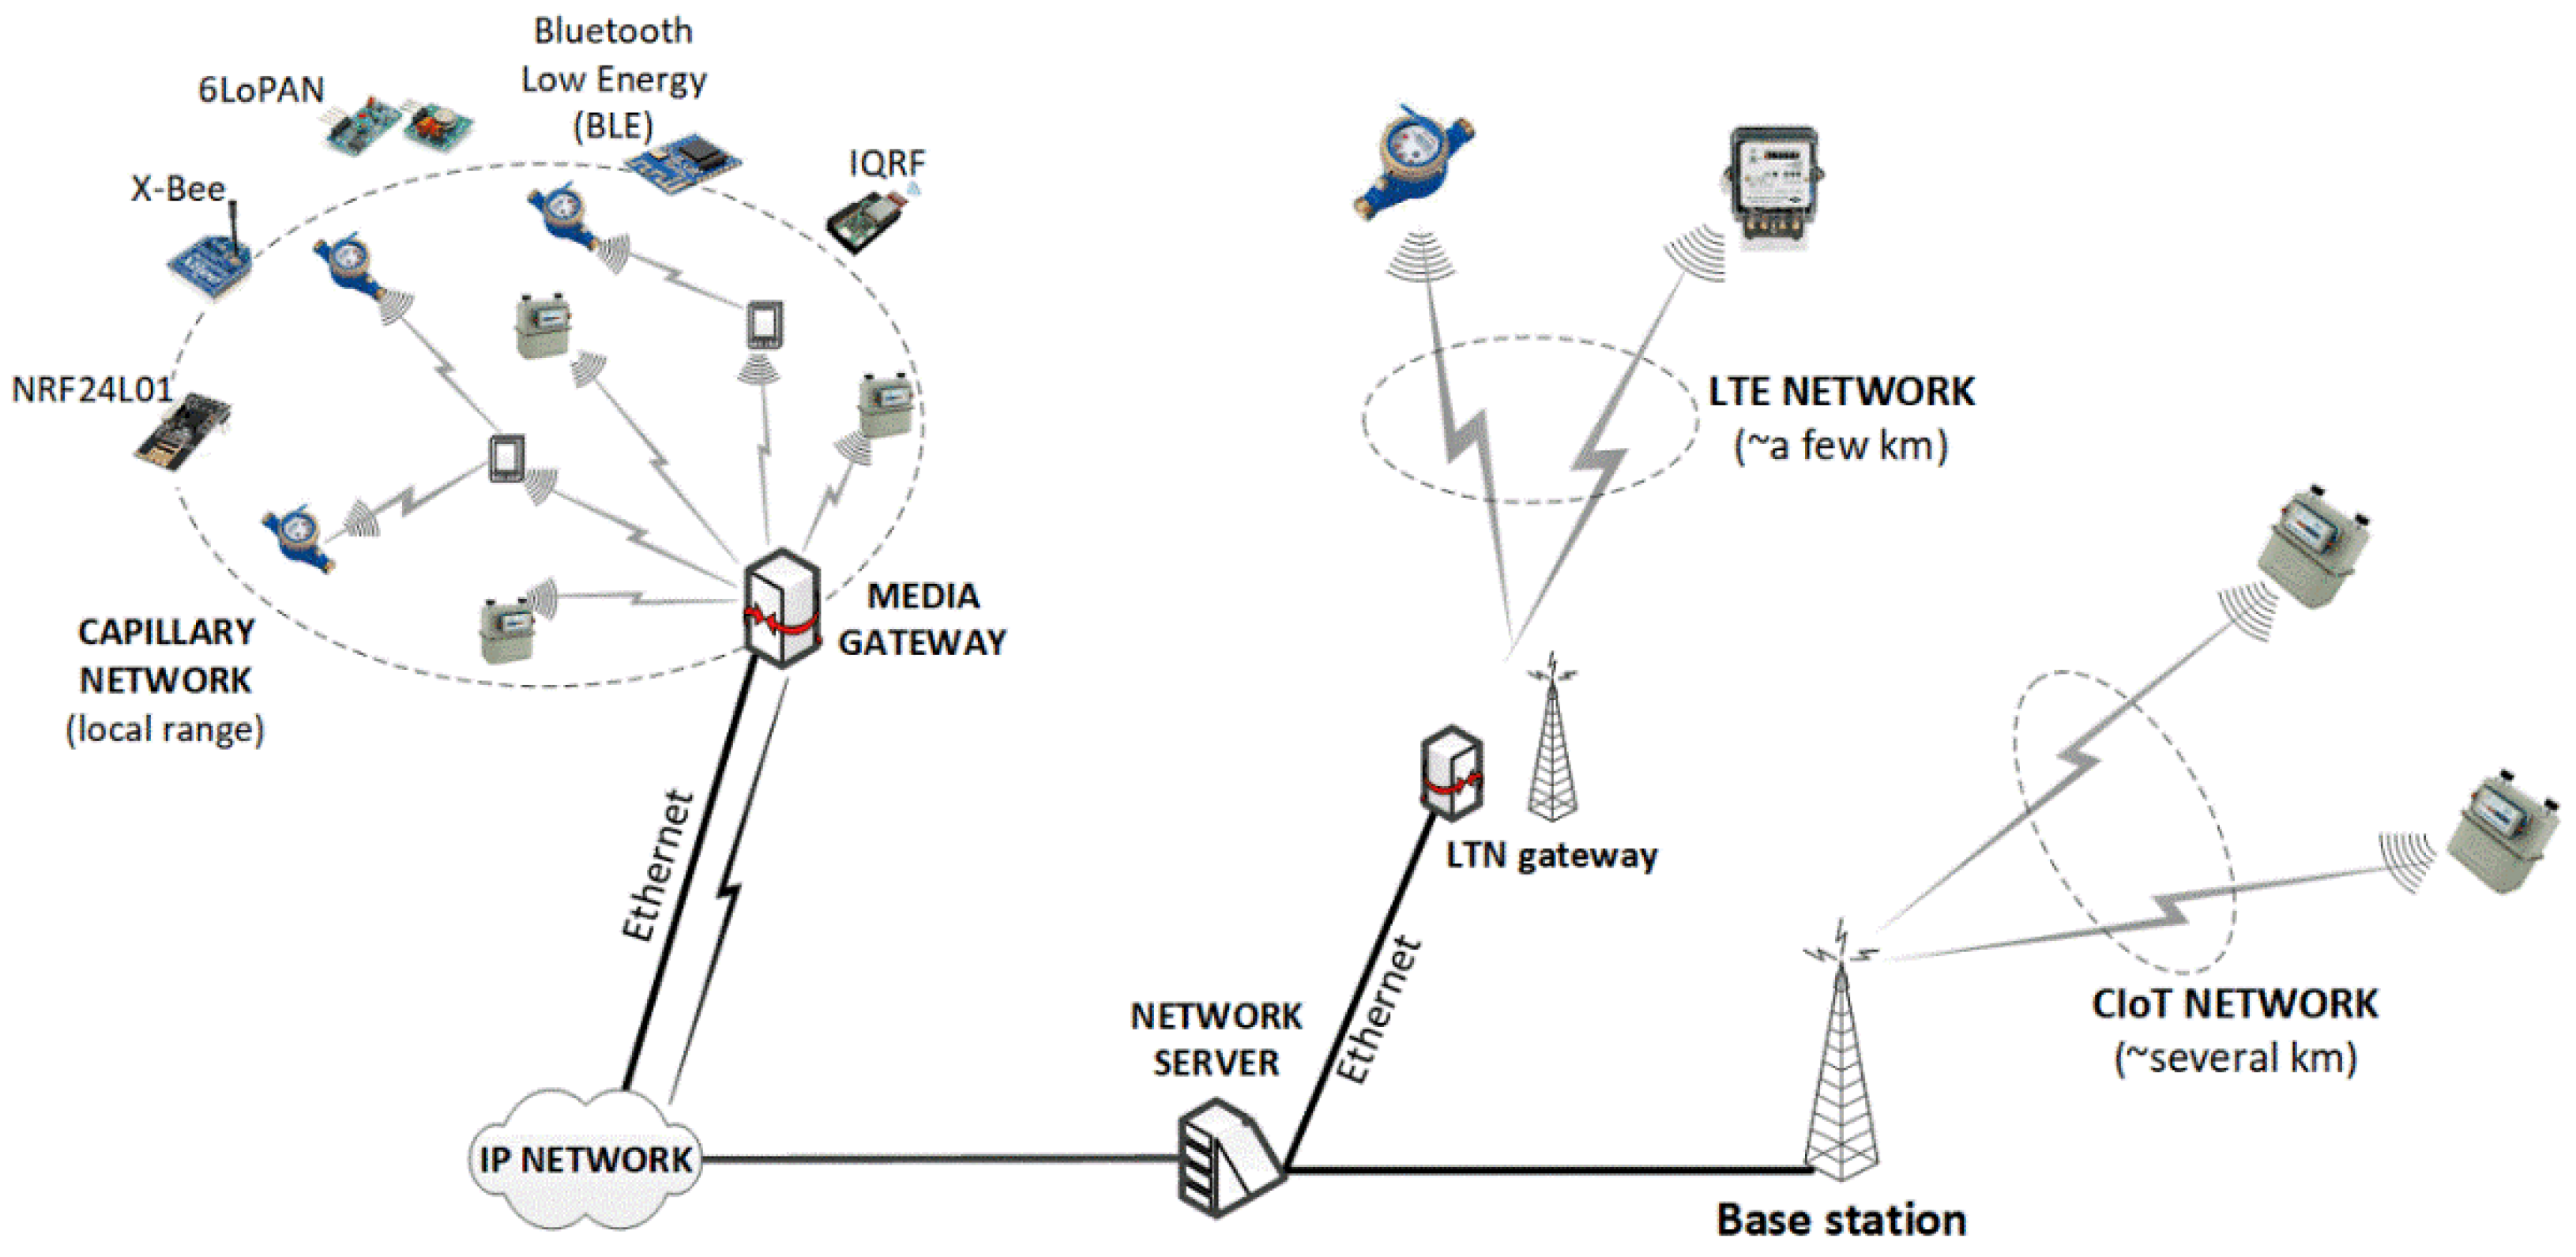
2. On the Internet of Things Systems and Capillary Networks

The term ‘Internet of Things’ was first coined by Kevin Ashton during one of the company’s presentations for Procter & Gamble in 1999 [1], although the author himself now promotes the name ‘Internet for Things’ [2]. Initially, it was anticipated that the technology used to implement the IoT assumptions would be RFID (radio frequency identification), which was meant to be an executive tool for various tasks commissioned by computers to objects (things), such as actuators, meters, controllers, etc. [4,5,6,7,8]. The informal date of the “creation” of the Internet of Things as a fact can be considered the turn of 2008/2009, when (according to Cisco’s own research described in [9]) the quotient of network communication “objects” to people exceeded the value of ‘1’ amounting to 1.84 in 2010, while in 2003 it was estimated at merely 0.08.
This idea was presented in Figure 2, allowing for the division of the Internet of Things systems into CIoT (cellular IoT) and non-cellular solutions, cumulatively referenced as LTN (low throughput network). A common area of data inflow, whether from traditional systems (cellular, broadband Internet access, etc.) or from systems in which information is generated by sensors, meters, and probes, is the cloud in which both network and database services are provided. However, the advent of the Internet of Things resulted in modifications also in this area, e.g., leading to the evolution of concepts such as ‘fog computing’, more efficient from an energy and transmission point of view and in terms of cybersecurity than cloud computing, as well as other concepts such as ‘the edge computing’, ‘ambient intelligence’, etc.
The concept of capillary networks results from the general division of the IoT network into architectural segments: long-distance and short-range. The latter, analogous to the capillaries transporting blood to and from the ends of the nervous system, is called ‘the capillary network’, as shown in Figure 3, where all three major groups (namely, capillary, LTN, and CIoT) have been depicted.
Despite the fact that one of the main goals set for IoT systems is to obtain the largest possible ranges by significantly increasing the sensitivity with respect to traditional radio systems (e.g., cellular), there is a group of applications in which direct signal transmission from the place of its origination (e.g., from a meter) is not needed, in fact—not even recommended. These applications include all kinds of measurements aimed at creating a certain overview in which the practical value is only of the final report based on a large amount of collected data, instead of information sent from individual sensors. An example may be, e.g., the development of thermal maps for buildings, which requires the deployment of a large number of sensors in its representative locations. In this situation, the transmission of individual readings to a remote network server would require that each sensor be equipped with a separate radio module. Due to the presence of many similar signal sources, this modem would be exposed to increased interference or collisions (due to simultaneous transmissions), which, in turn, would reduce the level of reliability of data delivery. Moreover, each reading would have to be logged independently in the database. Avoiding such situations was a motivator for the development of the concept of capillary networks, in which relatively cheap and simple battery-powered devices communicate with a concentrating device—the so-called media gateway—in the star topology (put in the simplest terms) or other configurations, including mesh arrangement. The market currently abounds in solutions suitable for this segment, offering numerous systems that allow transmission from a few meters (e.g., Bluetooth BLE, FS1000A operating in the star topology) to more complex ones, allowing for transmissions at distances from several to several dozen meters in buildings (e.g., IQRF, ZigBee, or NRF24L01).
An interesting approach to the problem of anomaly detection and malicious IoT network traffic was presented in works [10,11,12,13]. The authors used their Machine Learning (ML) techniques for blocking flows of harmful traffic by proposing a new algorithm called CorrAUC, based on the wrapper technique, to filter features accurately and select effective features for the selected ML algorithm by using the area under the curve (AUC) metric. The outcomes achieved from the analyses are quite promising, with accuracy oscillating at 95%. However, mere detection and blocking of pernicious traffic may still not be enough, hence, research still continues towards inventing methods for securing intelligent operations in the network, particularly intelligent metering. Authors in [14] even proposed the new security profile “W” that covers multiple security aspects of the Wireless M-Bus protocol within the Open Metering System suite of standards.

3. On Jamming in WSN and the Internet of Things Systems—A Review

The problem of possible electromagnetic disturbances in IoT networks sending the signal in the access segment between the sensor layer and base stations has already been noticed and described in ETSI TR 102 691 [15]. The document deals with the subject in general, presenting the potential goals and consequences that disruption or jamming may have in the operation of the M2M system as well as some basic mechanisms for preventing them. It identified two main groups of perturbations: intentional and unintentional. The purpose of intentional attacks is usually to either gain access to the transmitted telemetry data or to modify them. Non-intentional disturbances, in turn, associated with negative electromagnetic interactions, may lead to loss of communication between IoT devices and base stations. The properly planned deployment of base stations in a given area should significantly reduce the likelihood of such an event. More specific studies included in [16] and [17] concerned only the 868.0–868.6 MHz ISM (quite popular with IoT LTN systems) band measured in Aalborg (Denmark). It was observed there that 22% of the collected samples should be qualified as the high level (i.e., above −105 dBm), including numerous samples with power of up to −65 dBm. The most appropriate model for such a probability density profile was the Generalized Extreme Value Distribution (GEV), traditionally used to describe extreme phenomena, most often used in meteorology and hydrology.
Effective recovery of the intentionally disturbed signal, from the devices of the ZigBee system (based on the IEEE 802.15.4 specification), was dealt with in [18] using a three-phase signal regeneration method: 1. filter bank, 2. spectrum spreading by IEEE 802.15.4 devices, and 3. FEC correction coding (forward error correction). Packet loss statistics collected from relay nodes used to detect jamming were also used in [19] to classify nodes in multi-hop networks as: non-interfering, suspicious, and interfering, resulting in a change in the operating channel in the network. The authors in [20] proposed a modular blockchain structure for the WSN network, in which in the event of a drastic reduction in the CNIR (carrier-noise and interference) value in one of the set of communication channels predefined for the network, its coordinator broadcasts an IDS agent (intrusion detection system) on another channel from this set to all nodes, informing about the change in the working channel, simultaneously starting the continuous transmission of the signal on the corrupt channel to distract the jamming node. Another proposal to proactively combat jamming sources was presented in [21] by using spread spectrum transmission. This allocated a unique, randomly generated spreading sequence for each pair of nodes to counteract broadband interference and combat jamming from both BBN (broadband noise) sources as well as from compromised nodes belonging to the attacked network. A similar idea was proposed in [22], by postulating that a jamming device jammed by frequent emissions of radio ‘flares’ emitted by the sensor network nodes in the form of empty packets, thus, forcing the device to work continuously until the jammer’s energy resources are exhausted. In [23] the Nash equilibrium, an algorithm was used to detect the interfering node, observing the CNIR in the network and the changes in the probability of successful packet delivery between nodes. A cognate approach was demonstrated in [24], where the legal nodes (the so-called leaders) and the disruptor itself (reactive, the so-called follower) were modeled as adversaries in a hierarchical game. Both groups of players have opposite interests, however, and aim to achieve a balance: leaders seek a compromise between the CNIR and the transmitting power (which at the same time expose their transmissions), and the imitator, in turn, optimizes the threshold of the transmission detection power and adjusts the interference power in order to use it optimally and to avoid too quick depletion of its own battery resources. The idea of a continuous controlled emission reference was also used in [25], where it was proposed that one of the nodes with well-known radio signal characteristics (including CNIR and impulse response, measured before the network start-up) would serve as a reference signal source needed both for detection jamming and corrections of already jammed transmissions.

4. The Purpose of the Investigations

The major setback of the previous research presented in chapter 3 is that they cover a vast range of aspects related to jamming detection or jamming avoidance in general terms—either theoretical or simulation-based at best. This kind of approach, however, is seldom applicable in practice in real-life engineering when it comes to actually deploying a real-life wireless network, such as one of those which the authors have successfully deployed in various environments, ranging from coal and copper mines, automotive production plants, and various indoor environments, to even a city that launched their DAB+ SFN network in 2017 using multiple wireless technologies. It is even less applicable when the design is to be made by means of a specific system, with its own characteristic operational parameters (modulation, coding, spreading, repetitions, etc.), where the key to deploy a jamming-immune system consists of knowing precisely its CNIR constraints. However, unlike with cellular systems that have their parameters clearly described in 3GPP or ETSI documents, other systems, such as those for WSN or IoT, need to be investigated otherwise through precise measuring in EM-controlled environments similar to these presented in this paper. Thus, the major contribution of this paper is to fill up this knowledge gap to help designers plan their WSN in a manner inherently resistant (from scratch) to a great deal of interference, both originating from jammers (intentional or not) or from the environmental geometry (fading). As has been demonstrated—it is possible to achieve a quite resistant network operation by means of a careful selection of operational parameters (typical to Wireless M-Bus) at the very physical layer, in compliance with a well-known engineering practice that claims that most issues and risks can be avoided by properly selecting a system’s operational settings at the very beginning of a network planning. Thus, the uniqueness of our research consists of providing reliable CNIR figures as well as planning recommendations for achieving a robust-by-design Wireless M-Bus network. The uniqueness is also manifested in the measurement testbeds used in the investigations. A fundamental advantage of testing systems under controlled conditions in shielded chambers consists of the ability to be isolated from external factors. The 85 dB of EM isolation guaranteed by our facilities (within the range 200 MHz–18 GHz) allow us to investigate the response of radiocom systems with full certainty that no interference will affect measurements, providing, at the same time, an extremely high repeatability: in the deterministic sense (inside the anechoic chamber) and in the statistical sense (inside the rev. chamber). The suitability of applying these labs to reproduce statistical propagation conditions present in real environments was deeply investigated and documented by the authors some years ago [26]. Some later publications successfully demonstrated that this approach proved useful in investigating a wide swath of radiocommunication systems, such as ZigBee, WLAN, and IoT (LoRaWan [27], Weightless, SigFox, NB-IoT [28]). With the aid of these two chambers, practically any propagation conditions can be fairly easily recreated, i.e., from the pure AWGN channel or through the Ricean and Rayleigh channel in the reverberation channel. The anechoic chamber, in turn, assures the lack of multipath echoes, provides researchers with pristine noise-limited conditions for precisely investigating a system response to the gradually degrading SNR, thus, allowing us to quite accurately assess performance at boundary operating conditions for any combination of parameters (such as the bandwidth, modulation-coding scheme, spreading factor, number of repetitions, MIMO, etc.).
The topical system to be investigated was Wireless M-Bus by Embit, operating in two ISM (industrial, scientific, medical) bands: 169 and 868 MHz. The setup consists of two EMB-EVB evaluation boards equipped with swappable radio modules: EMB-WMB169PA (169 MHz) and EMB-WMB868 (868 MHz) with helical quarter-wavelength antennas. The system’s fundamental parameters have been presented in Table 1 and Table 2.

5. Measurements of Wireless M-Bus Resilience to Interference and Multipath

Due to the growing popularity of IoT systems, the attention of scientists is focused on the revision of existing propagation models and approaches to the channel modeling [30]. Researchers conduct propagation attenuation measurements for IoT devices in typical environments and assess the convergence of the results with available propagation models. New empirical models are being created (such as [31]) and compared with theoretical ones. The values from the theoretical models differ from the results of the proposed deterministic model presented in [32] by up to 40%, which confirms the need for further research in this matter. An example may be the packet error rate PER measurements of the LoRa system [33]. At the same time, research is underway on the use of Massive MIMO to reduce the energy consumed by transmission devices [34]. Admittedly, determining the propagation attenuation with high accuracy is essential, but it is equally important to determine the CNIR values for which the system achieves a certain PER value. Such testing, in turn, can only be performed in a controlled environment (as written in depth in chapter).
In the experiment, the influence of two factors on the packet error rate was evaluated:
  • ▪ Electromagnetic (EM) disturbances of variable power, with additive white gaussian characteristic (AWGN). For this purpose, investigations were carried out in an anechoic chamber, as shown in Section 6.
  • ▪ Extremely multipath propagation, emulated with the use of a reverberation chamber, as shown in Section 7.

6. WMBus Performance under Controlled Radio Jamming

The measurement setup was assembled in an anechoic chamber located on the premises of the Laboratory of Electromagnetic Compatibility (LEC) at the Wroclaw University of Science and Technology. The chamber has a minimum shielding effectiveness of 85 dB, which makes it an EM-isolated environment for investigating communication systems void of interfering signals.

6.1. The Measurement Environment and Procedures

Communication with radio modules mounted on Embit boards takes places via a serial Embit Binary Interface [35] port. In order to carry out investigations, specialized software for controlling the Wireless M-Bus system was developed, allowing us to configure the modules (e.g., the channel number and the output power) and perform transmission tests consisting by a certain number of packets (a generic structure of which is shown in Figure 4) of a given length, sending them and calculating the packet error rate (PER). Each test would entail generating and sending 1000 B-type 242-byte long frames (in fact, the longest possible frames enabled in the system [35]). The control software was installed in nodeMCU v3 Wemos modules that were communicated with the investigated system via a serial port. These modules are characterized by the clock frequency of 80 MHz or 160 MHz and 4 MB of flash memory, which makes them redundantly fit for the system in question.
In order to determine the influence of CNIR (carrier to noise and interference ratio) on PER, the background noise was generated by a Tektronix AWG 700002 arbitrary signal generator. A 500 kHz-wide AWGN was generated that completely overlapped the operational working channel. The noise level was regulated with the use of a set of software-controlled LDA-602 Vaunix attenuators enabling a 0.5 dB step variable attenuation in the range from 0 to 63 dB. These changes in the generated noise level were used to emulate the effect of interference on Wireless M-Bus operation.
The system, along with the noise generator and laptops, was located outside the chamber in a control room. Inside the chamber were three antennas mounted on dielectric tripods. As for Wireless M-Bus devices, rod antennas included in the evaluation kit were used, whereas the generator was equipped with an external directional antenna. The entire measurement setup was presented in Figure 5 and Figure 6.
The next step in assembling the measurement setup consisted in configuring the system and its calibration. Investigations were carried out using unidirectional transmission, with one module operating in the transmit mode (Tx) and the other in the receive mode (Rx). The noise generator antenna, serving as a source of interference, was placed at a distance of 2 m from the Rx module antenna. Both the generator’s and the transmitter’s output power levels were adjusted with the controlled attenuator as to enable the transition between extreme PER states, namely, from 0% to 100%.

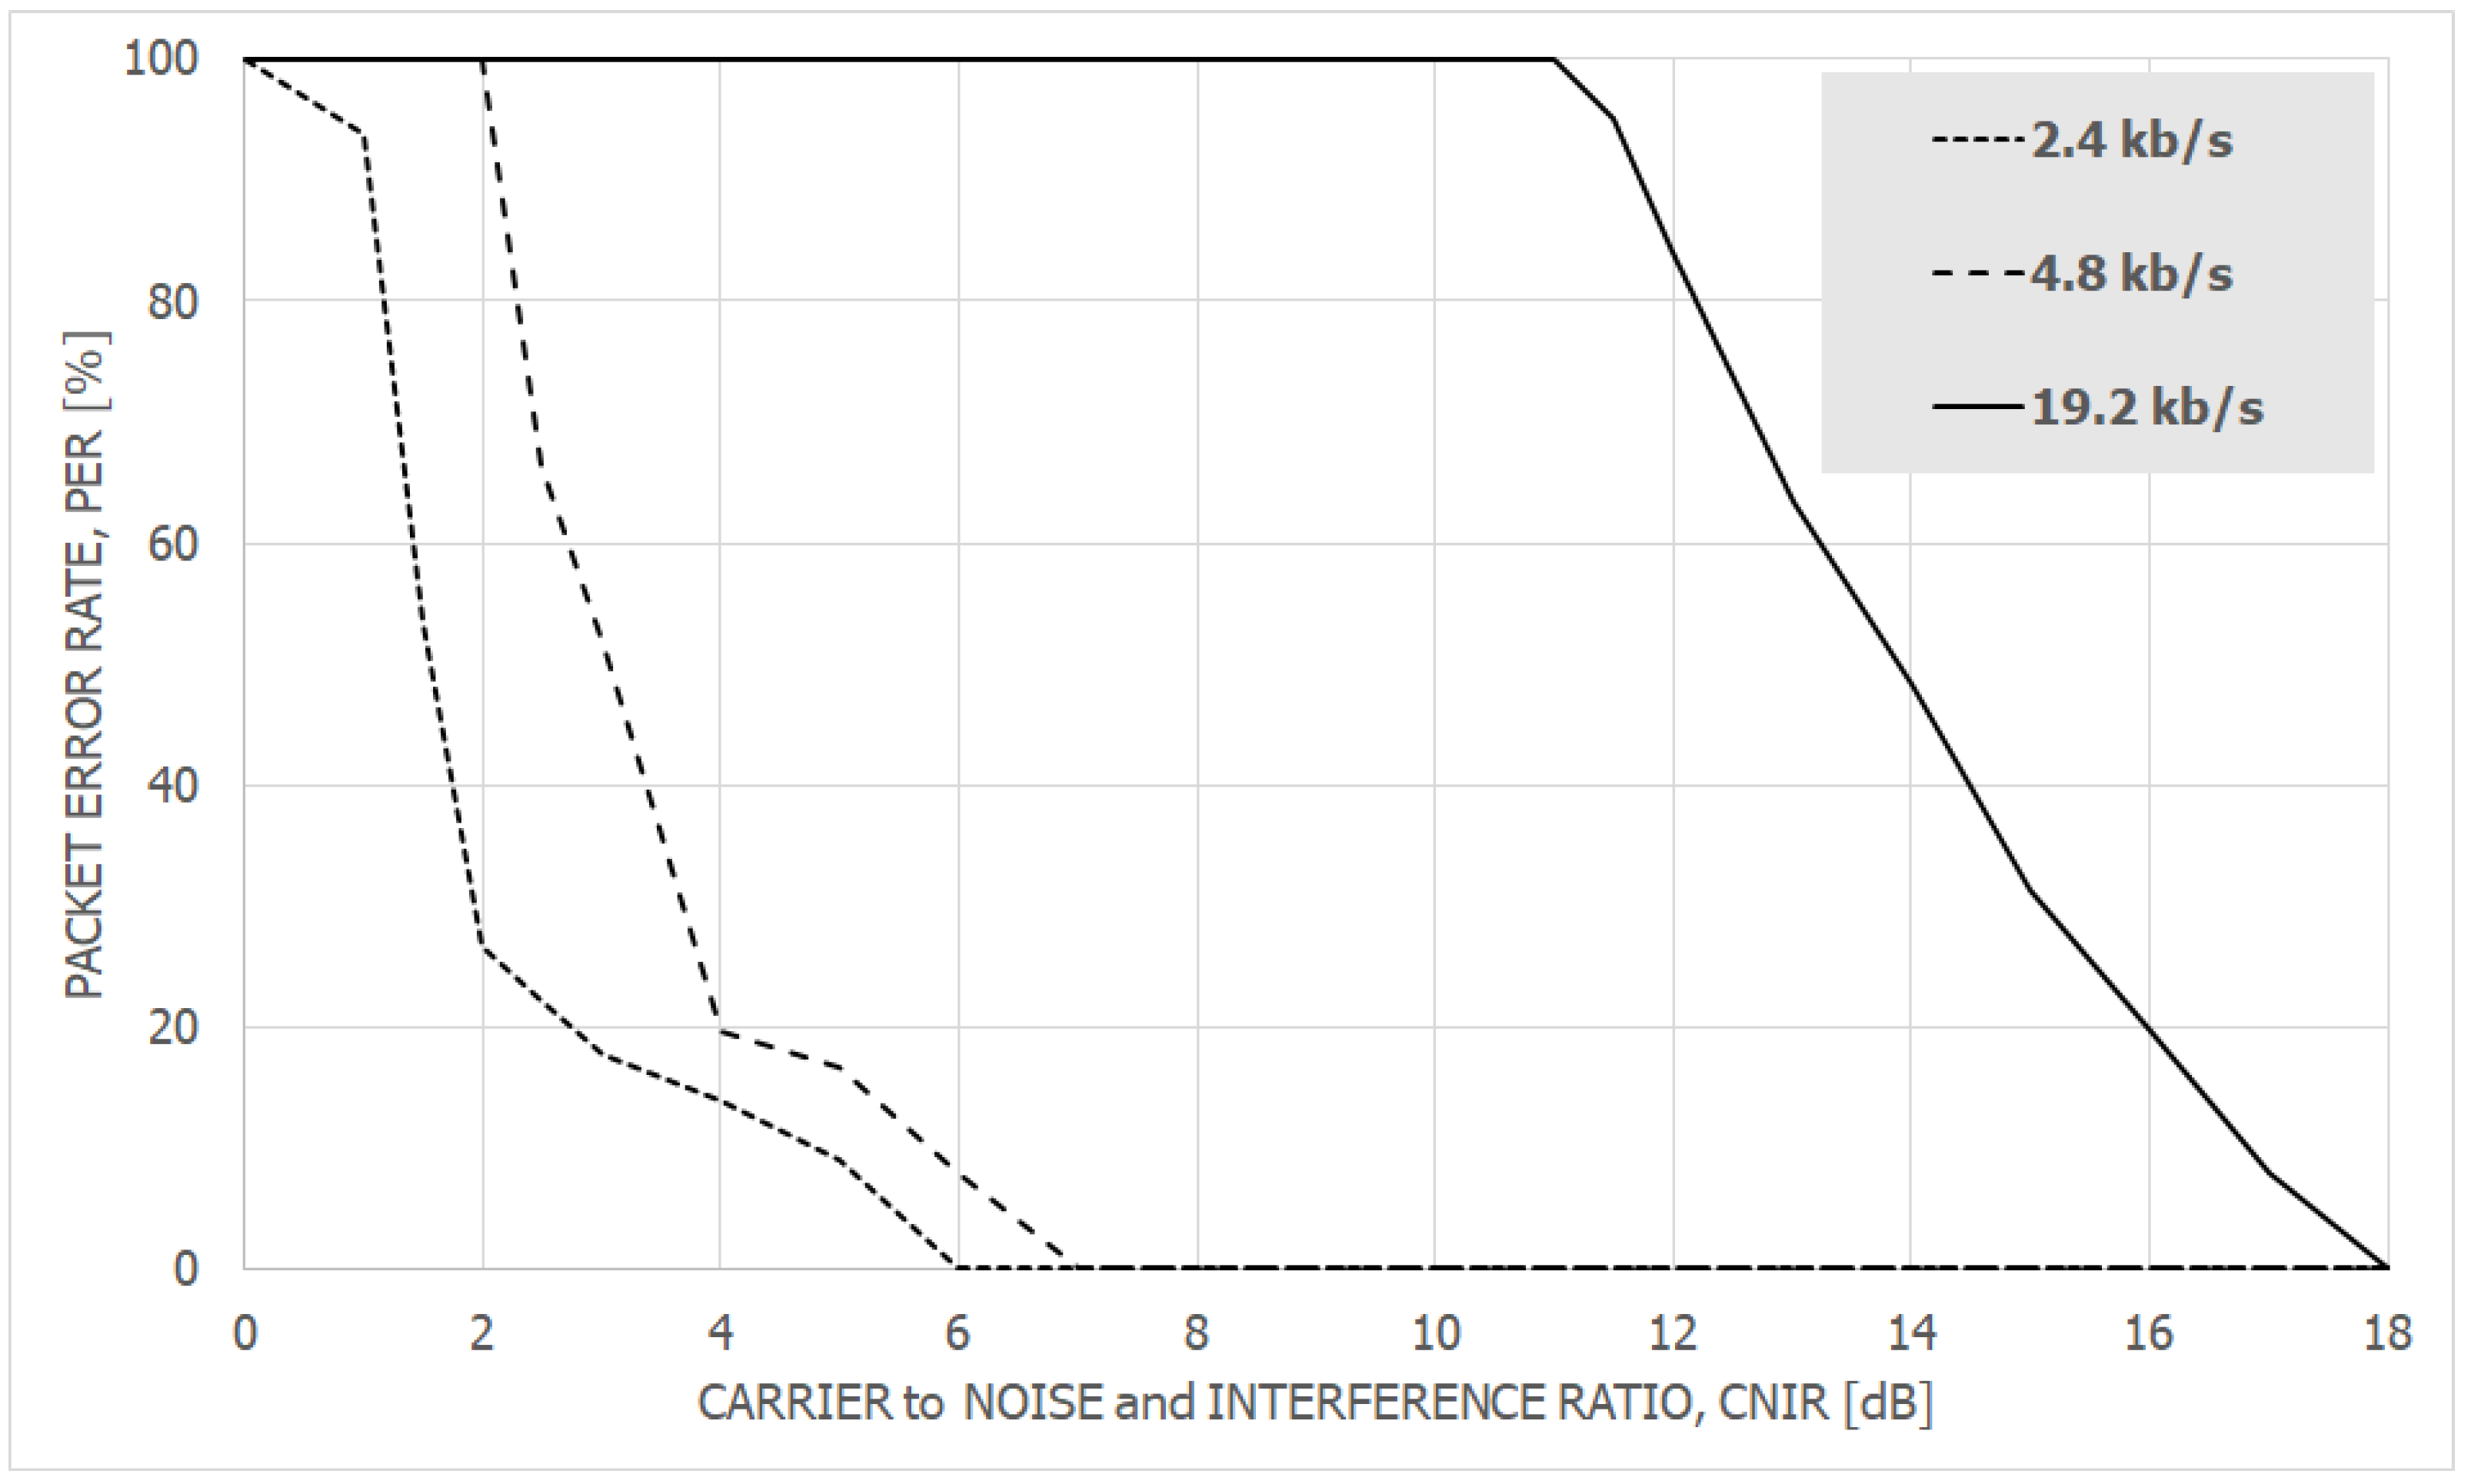
6.2. The Results and Discussion

Measurements were performed for all available throughput settings, i.e., in the case of modules operating at 169 MHz: 2.4, 4.8, and 19.2 kb/s, whereas the 868 MHz modules operated at 4.8, 16.384 (corresponding to a short and a long preamble, respectively), 50, and 100 kb/s. Details concerning the investigated throughput modes are presented in Table 3, with the measured outcomes demonstrated in Figure 7 and Figure 8.
Conclusion No. 1: Quite foreseeably, the system turned out to be the most resistant to interference when operating at 2.4 and 4.8 kb/s throughput modes, both in the 169 and 868 MHz bands. Boundary CNIR values, at which PER started to rise above zero were: 6 dB for 2.4 kb/s, 7 dB for 4.8 kb/s (at 169 MHz band), and 4 dB for 4.8 kb/s (at 868 MHz band). It is worth noting that GFSK modulation is used in the lower transmission band, whereas FSK is used in the higher. The use of FSK, however, leads to lower CNIR, when comparing the performance at both bands, when set to 4.8 kb/s mode in each. The FSK modulation is characterized by a high level of spurious emissions (multiples of the symbol rate) and a relatively high level of side lobes [36]. The signal spectral features can be improved by means of applying a Gaussian filter prior to modulation, which causes the bandwidth to decrease at the cost of shortening the distance between symbols. In the discussed case, the CNIR for FSK was lowered by 3 dB compared to GFSK. Operation at higher throughput levels, i.e., 19.2 kb/s at 169 MHz and 16, 50, 100 kb/s at 868 MHz, requires CNIR higher by c.a. 10 dB compared to 2.4 kb/s and 4.8 kb/s modes. This 10 dB depletion in the link budget may result in a few times shorter operational range.
Conclusion No. 2: In the 868 MHz band, the influence of the short and the long preamble on the required CNIR values was also investigated when operating in 16.384 kb/s throughput mode. As turned out, the application of the long preamble (576 chips) with respect to the short preamble (48 chips) alleviated CNIR requirements by 3dB, which was not a spectacular outcome considering remarkable differences in the preamble lengths.
Conclusion No. 3: The required CNIR operating at the lowest throughput ranges (i.e., 2.4 and 4.8 kb/s), even at the level of a few decibels allowed to uphold communication, indicates significant resilience to in-band interference to the system.

7. Investigations of Wireless M-Bus Susceptibility to the Multipath Propagation

As is well known, any emitted signal will propagate by interacting with the surrounding environment, which involves reflections from objects, transmissions through obstacles, diffraction on edges, and scattering from rough surfaces. Thus, the signal arriving at the receiver will not come in a single fringe, but as a bundle of signals with different amplitudes, phases, angles of arrival, and short time delays, being delayed copies of the original signal. Once collected within a certain time interval at a receiver, they sum up in a vector fashion, accounting for their relative phase differences, which causes some copies to overlap constructively if both are in phase or cancel out otherwise. Such behavior leads to small-scale fading, which is a typical propagation effect, especially in indoor and urban environments. Hence, the radio channel can be mathematically represented at any point in a three-dimensional space as a linear, time-variant filter of an impulse response given by equation (1) or as a Power Delay Profile (PDP) defined by Equation (2) [37]. In the formula, h(t,τ) is the radio channel impulse response, Nmultipath is the number of multipath components, θi(t) and Ei(t) are, respectively, the time varying phase and electric field amplitude of each echo, while τi its delay. The time variance τ appears here due to the temporal changes in real propagation environments, such as the motion of people, relocation of objects, etc. It should be included to reflect the fact that in usual circumstances, with a non-stationary channel, a given PDP will vary over time even when measured at exactly the same location but, e.g., at different hours of the day.
h ( t , τ ) = i = 0 N ( τ ) 1 E i δ ( t τ i , τ ) e j θ i ( t , τ )
P D P ( t , τ ) = i = 0 N ( τ ) 1 P i δ ( t τ i , τ )
τ R M S = i ( τ i τ m ) 2 · P ( τ i ) i P ( τ i )
τ m = i τ i · P ( τ i ) i P ( τ i )
A common statistical measure of the channel dispersiveness is the excess time delay spread τrms having a sense of the second central moment of the PDP, as in Equation (3), and determining the maximum symbol rate achievable by a communication system without occurrence of the inter-symbol interference (ISI). The harshest propagation environments, in terms of the multipath propagation, are those characterized by the greater values of τrms (above 1 µs) such as hilly or mountainous terrains, suburban/urban macrocells, whereas indoor and microcellular spaces usually possess τrms on the order of tens (indoor) up to hundreds (microcells) of nanoseconds [38].

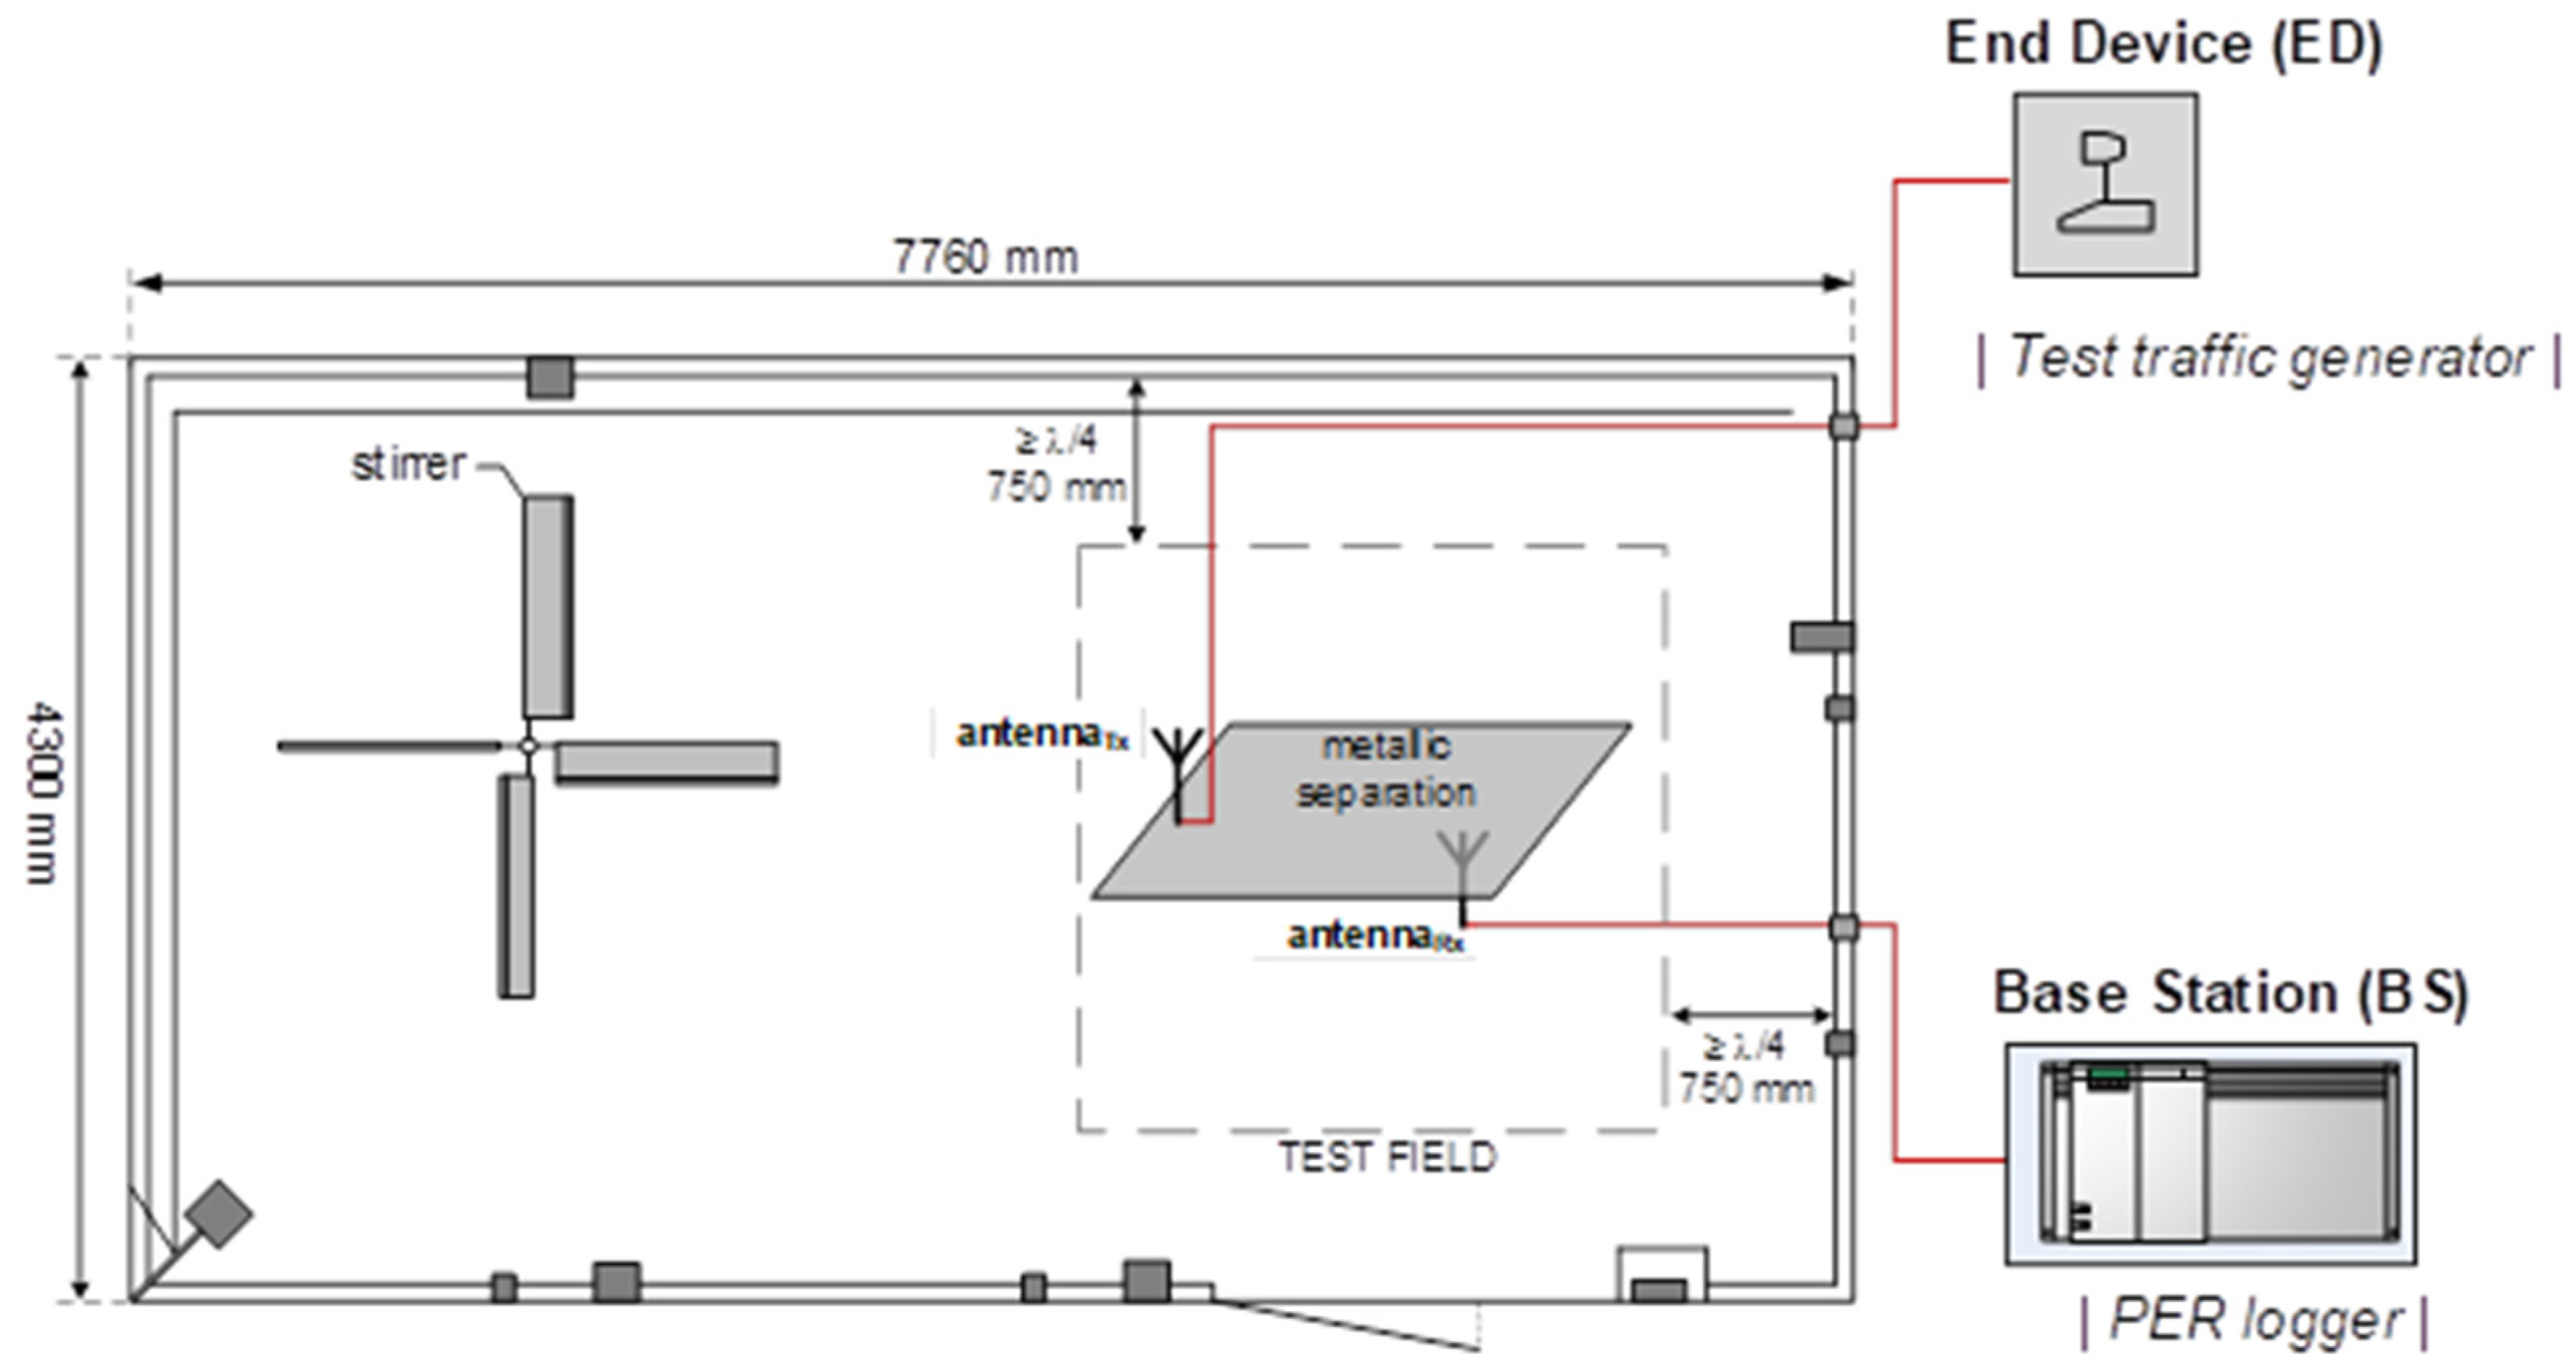
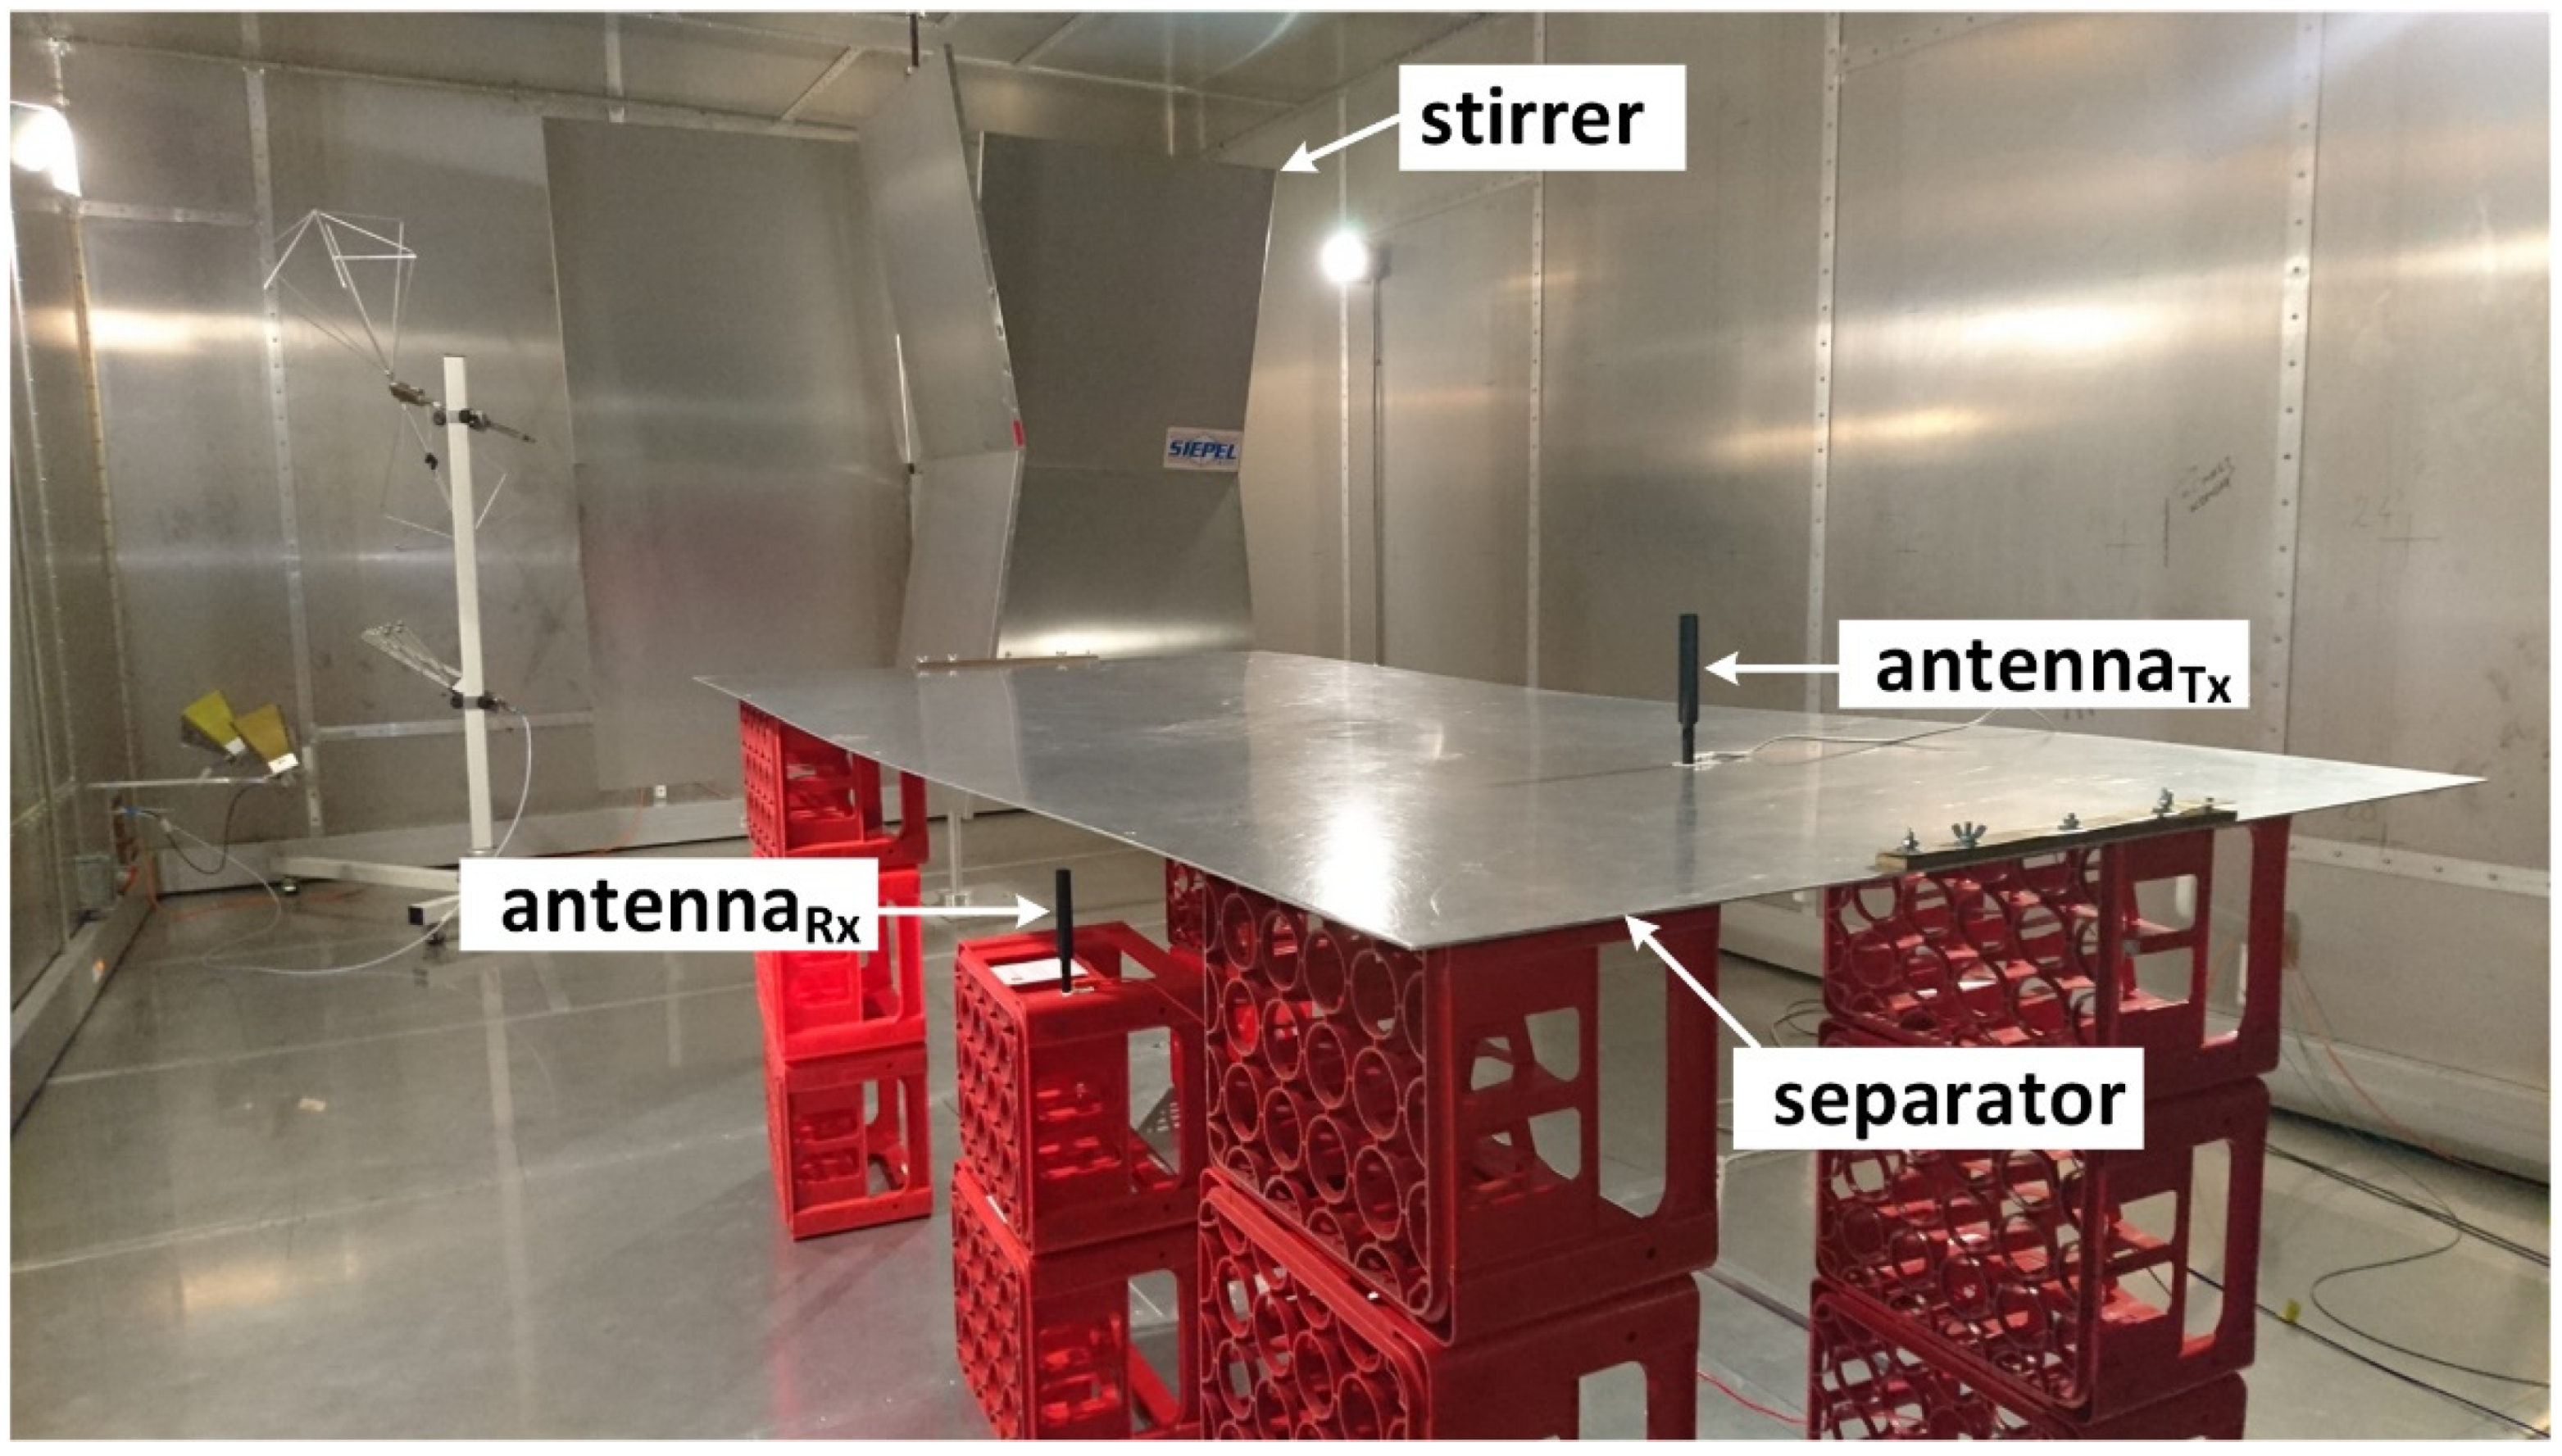
7.1. The Measurement Environment and Procedures

Multipath propagation conditions can be easily emulated in a reverberation chamber, such as one schematically presented in Figure 9, wherein τrms is controlled by means of adding or subtracting absorbing panels within a wide range of values. In the chamber of interest (LKE, WUST), this range spanned from 1.55 µs in case of an unloaded chamber, i.e., void of absorbers, down to 0.2 µs with 12 absorbers on the chamber walls. In the experiment carried out in a configuration presented in Figure 9, the chamber was unloaded (thus, τrms = 1.55 µs) for testing M-Bus performance under extreme multipath conditions, such as those typically encountered in urban/suburban environments, which, at the same time, are the target deployment locations for IoT systems. The Wireless M-Bus receiver and transmitter antennas were placed in the test field, defined as an area away from the chamber walls by at least λmax/4, where λmax is the longest wavelength to be propagated inside the cavity (here: λmax = 3 m, which corresponds to the lowest operational frequency fL equal to 100 MHz).
While arranging the measurement setup in the reverberation chamber, the following rules were observed:
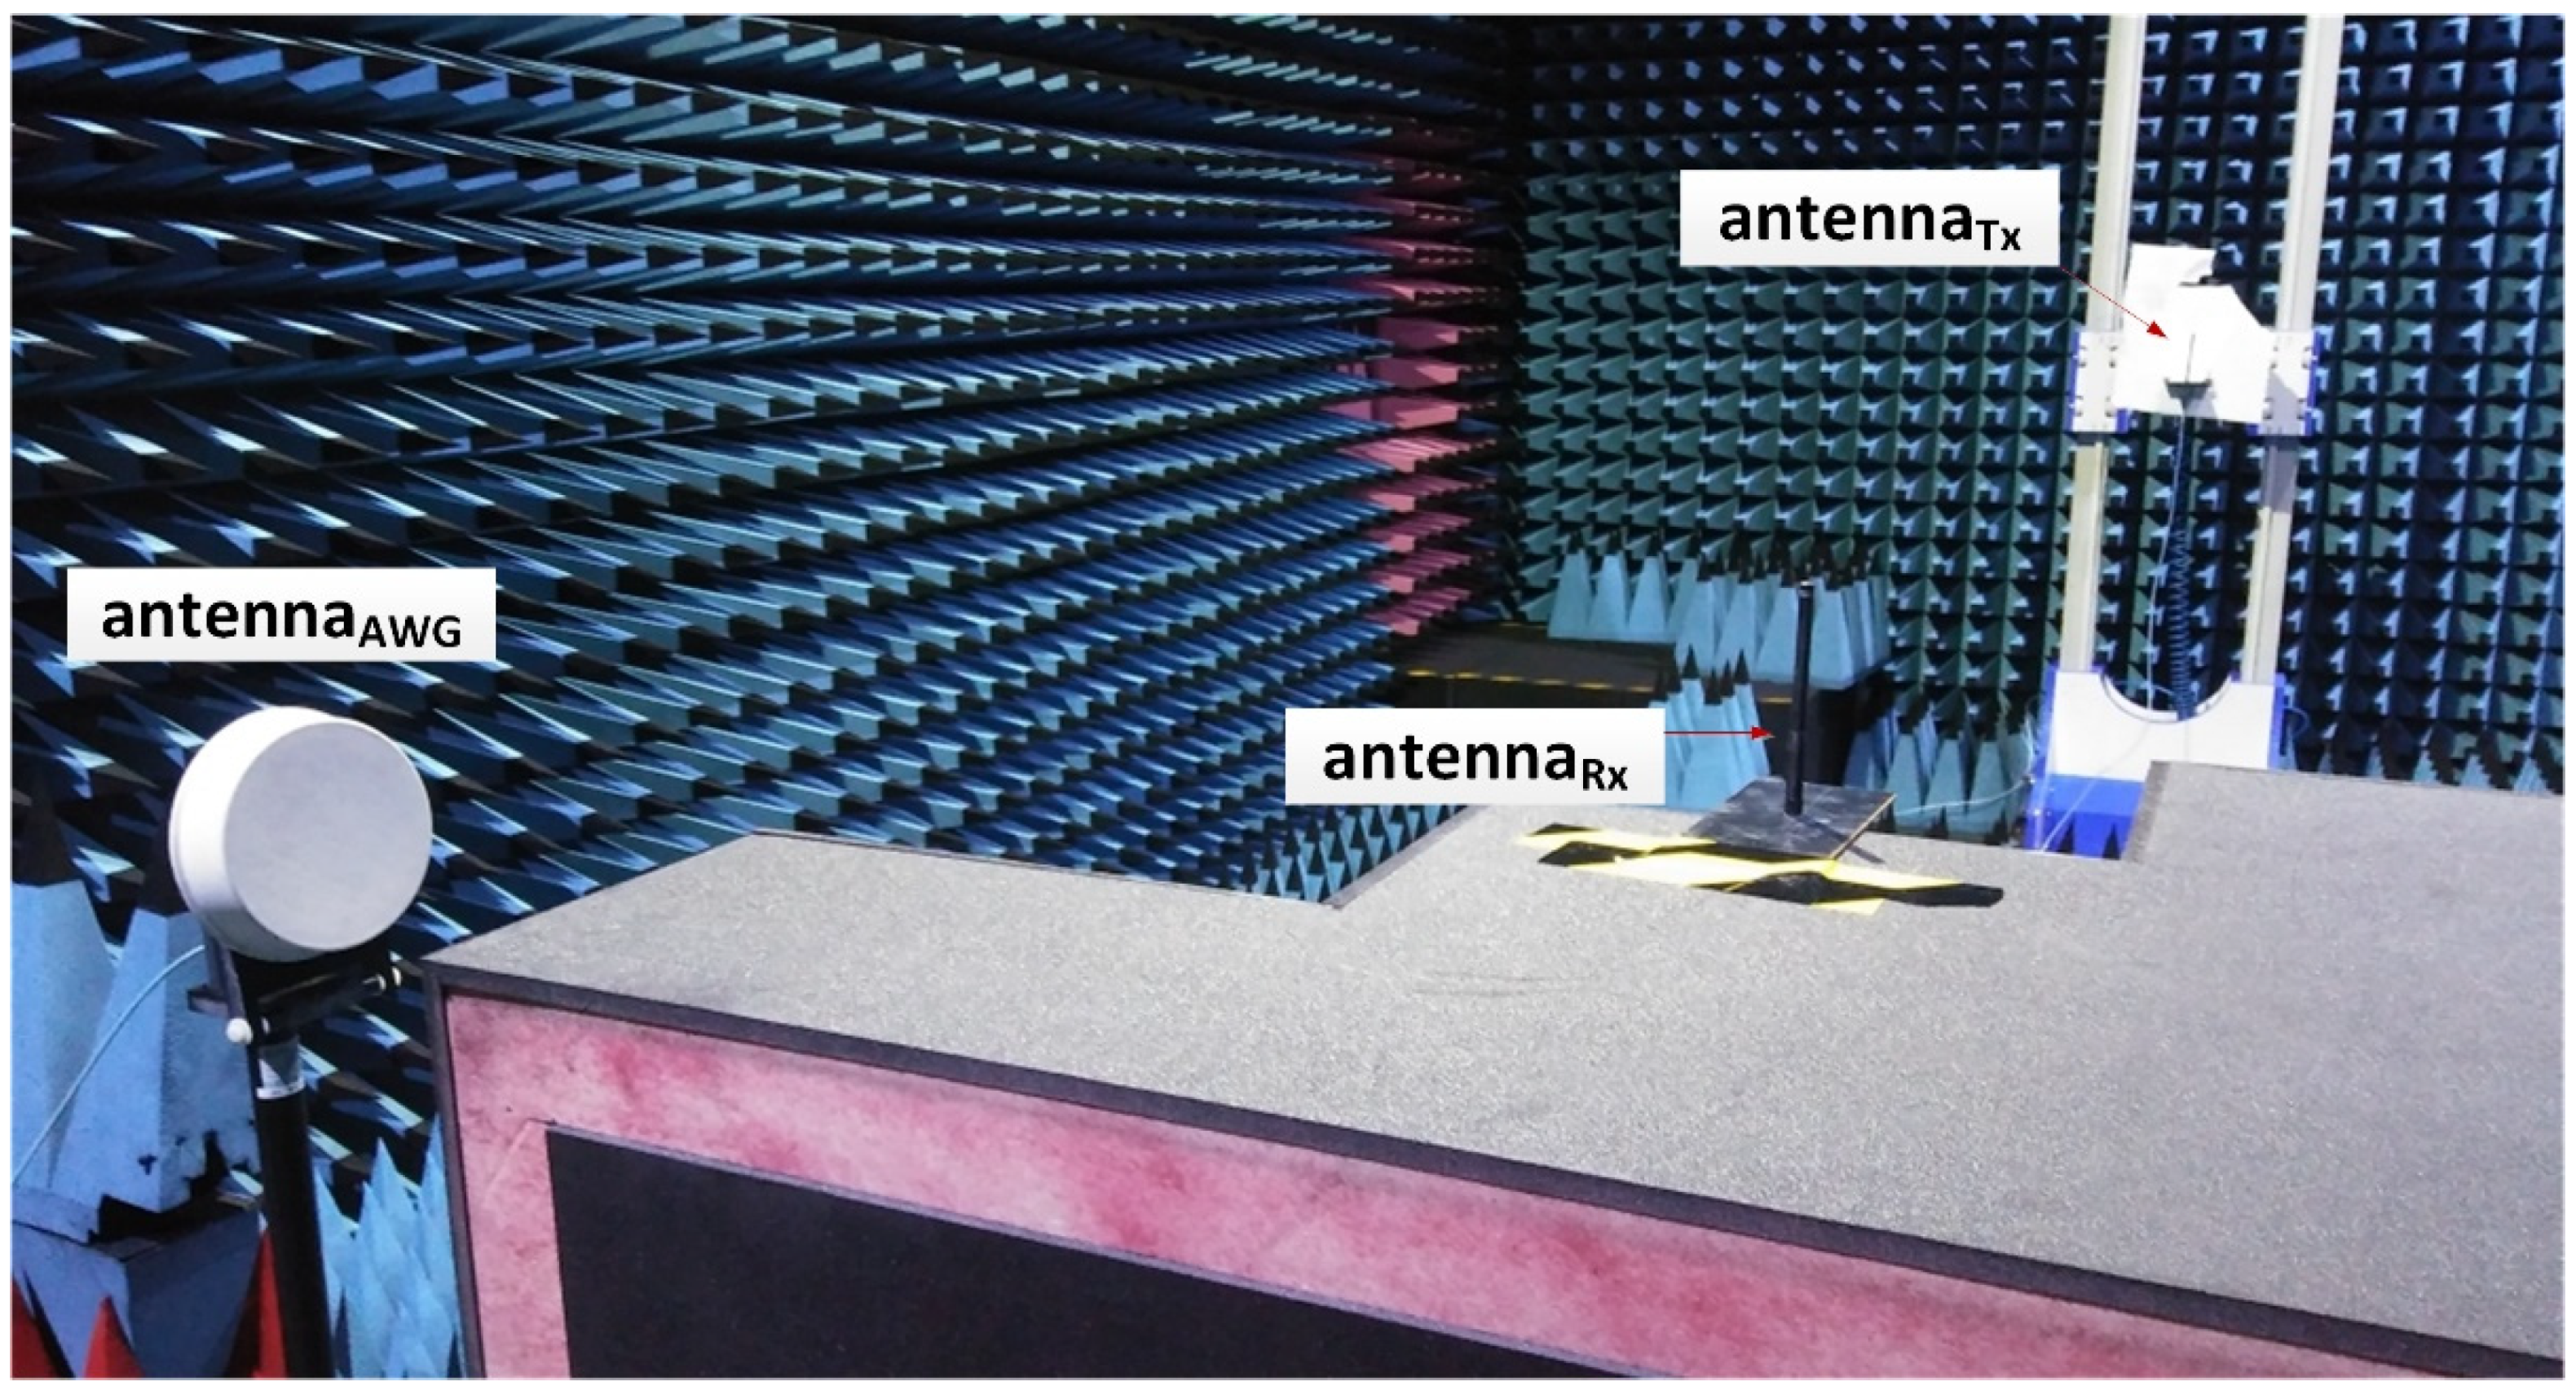
  • In order to eliminate the influence of the tested DUT devices, e.g., by their undesirable energy radiation from on-board electronics, only antennas of these devices were placed in the chamber, marked in Figure 10 as ‘antennaTx’ and ‘antennaRx’, attached to their respective modems (placed outside the chamber) by means of low-loss cables with the minimum length required to operate the equipment outside the chamber during measurements. These cables were drawn outside the chamber through well-shielded feedthroughs in the chamber wall.
  • In order to eliminate the direct component, both antennas during PER measurements were separated by a conductive separator (e.g., a metal plane), which created the signal reception conditions characteristic of the Rayleigh channel (desirable and typical for resonance cavities acc. to [39]), i.e., one in which the arriving components are solely due to reflections and diffractions.
  • During the preparatory stage, the transmitter (ED in Figure 9) and the receiver (BS in Figure 9) were electromagnetically isolated from each other, e.g., by placing them in shielded casings.
  • The reverberation chamber was equipped with a stirrer that facilitated a homogeneous distribution of the electric field in its interior during measurements.
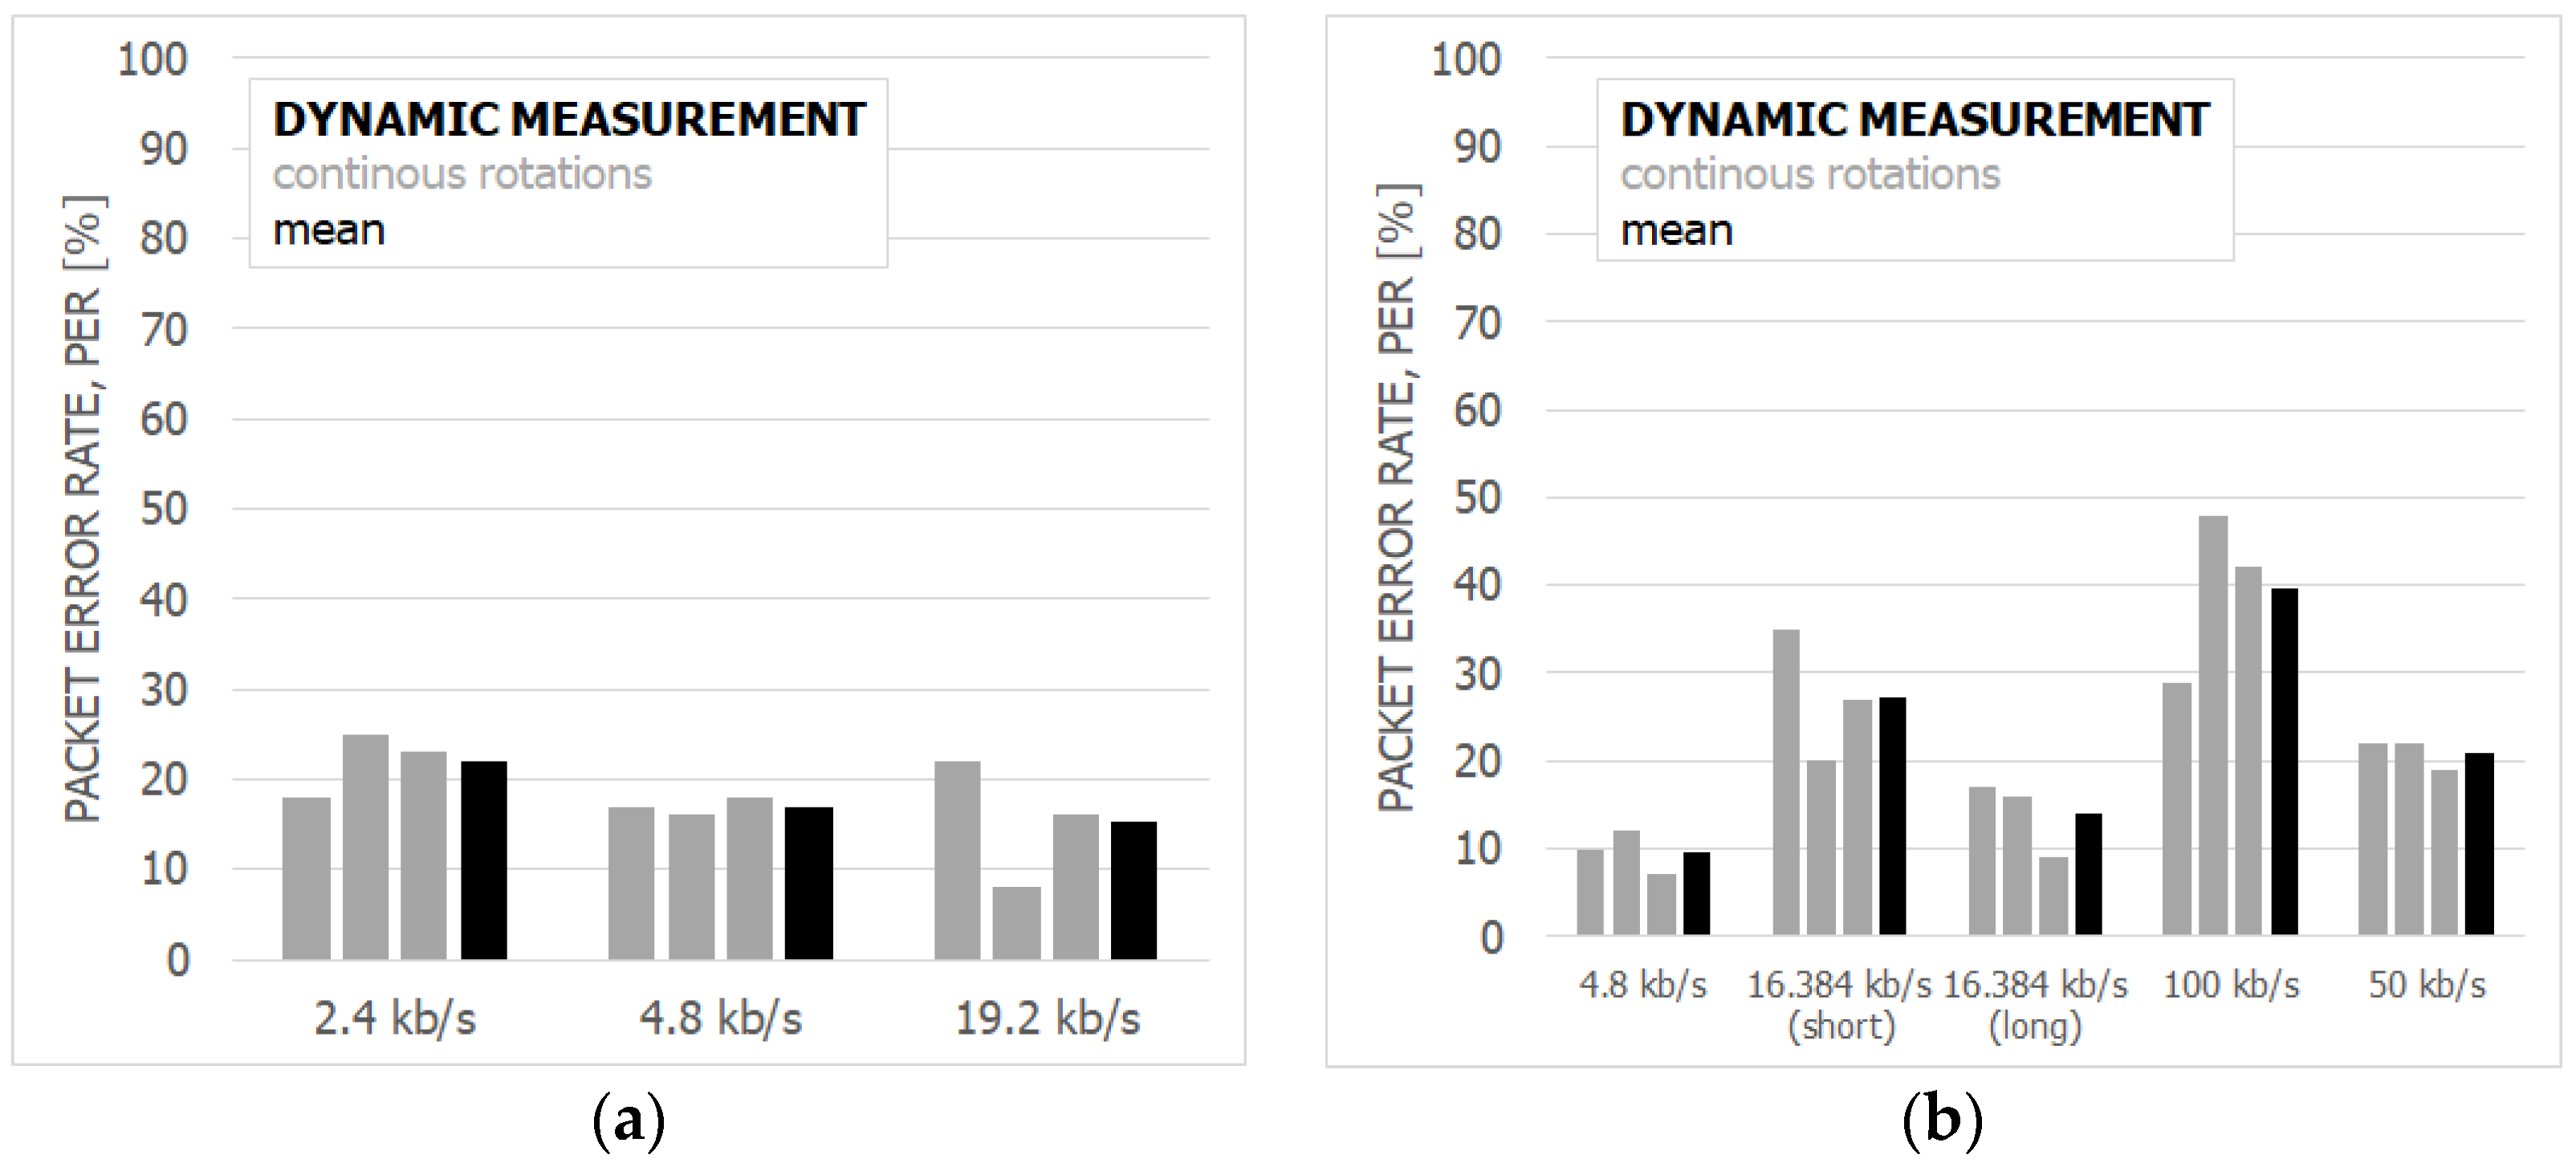
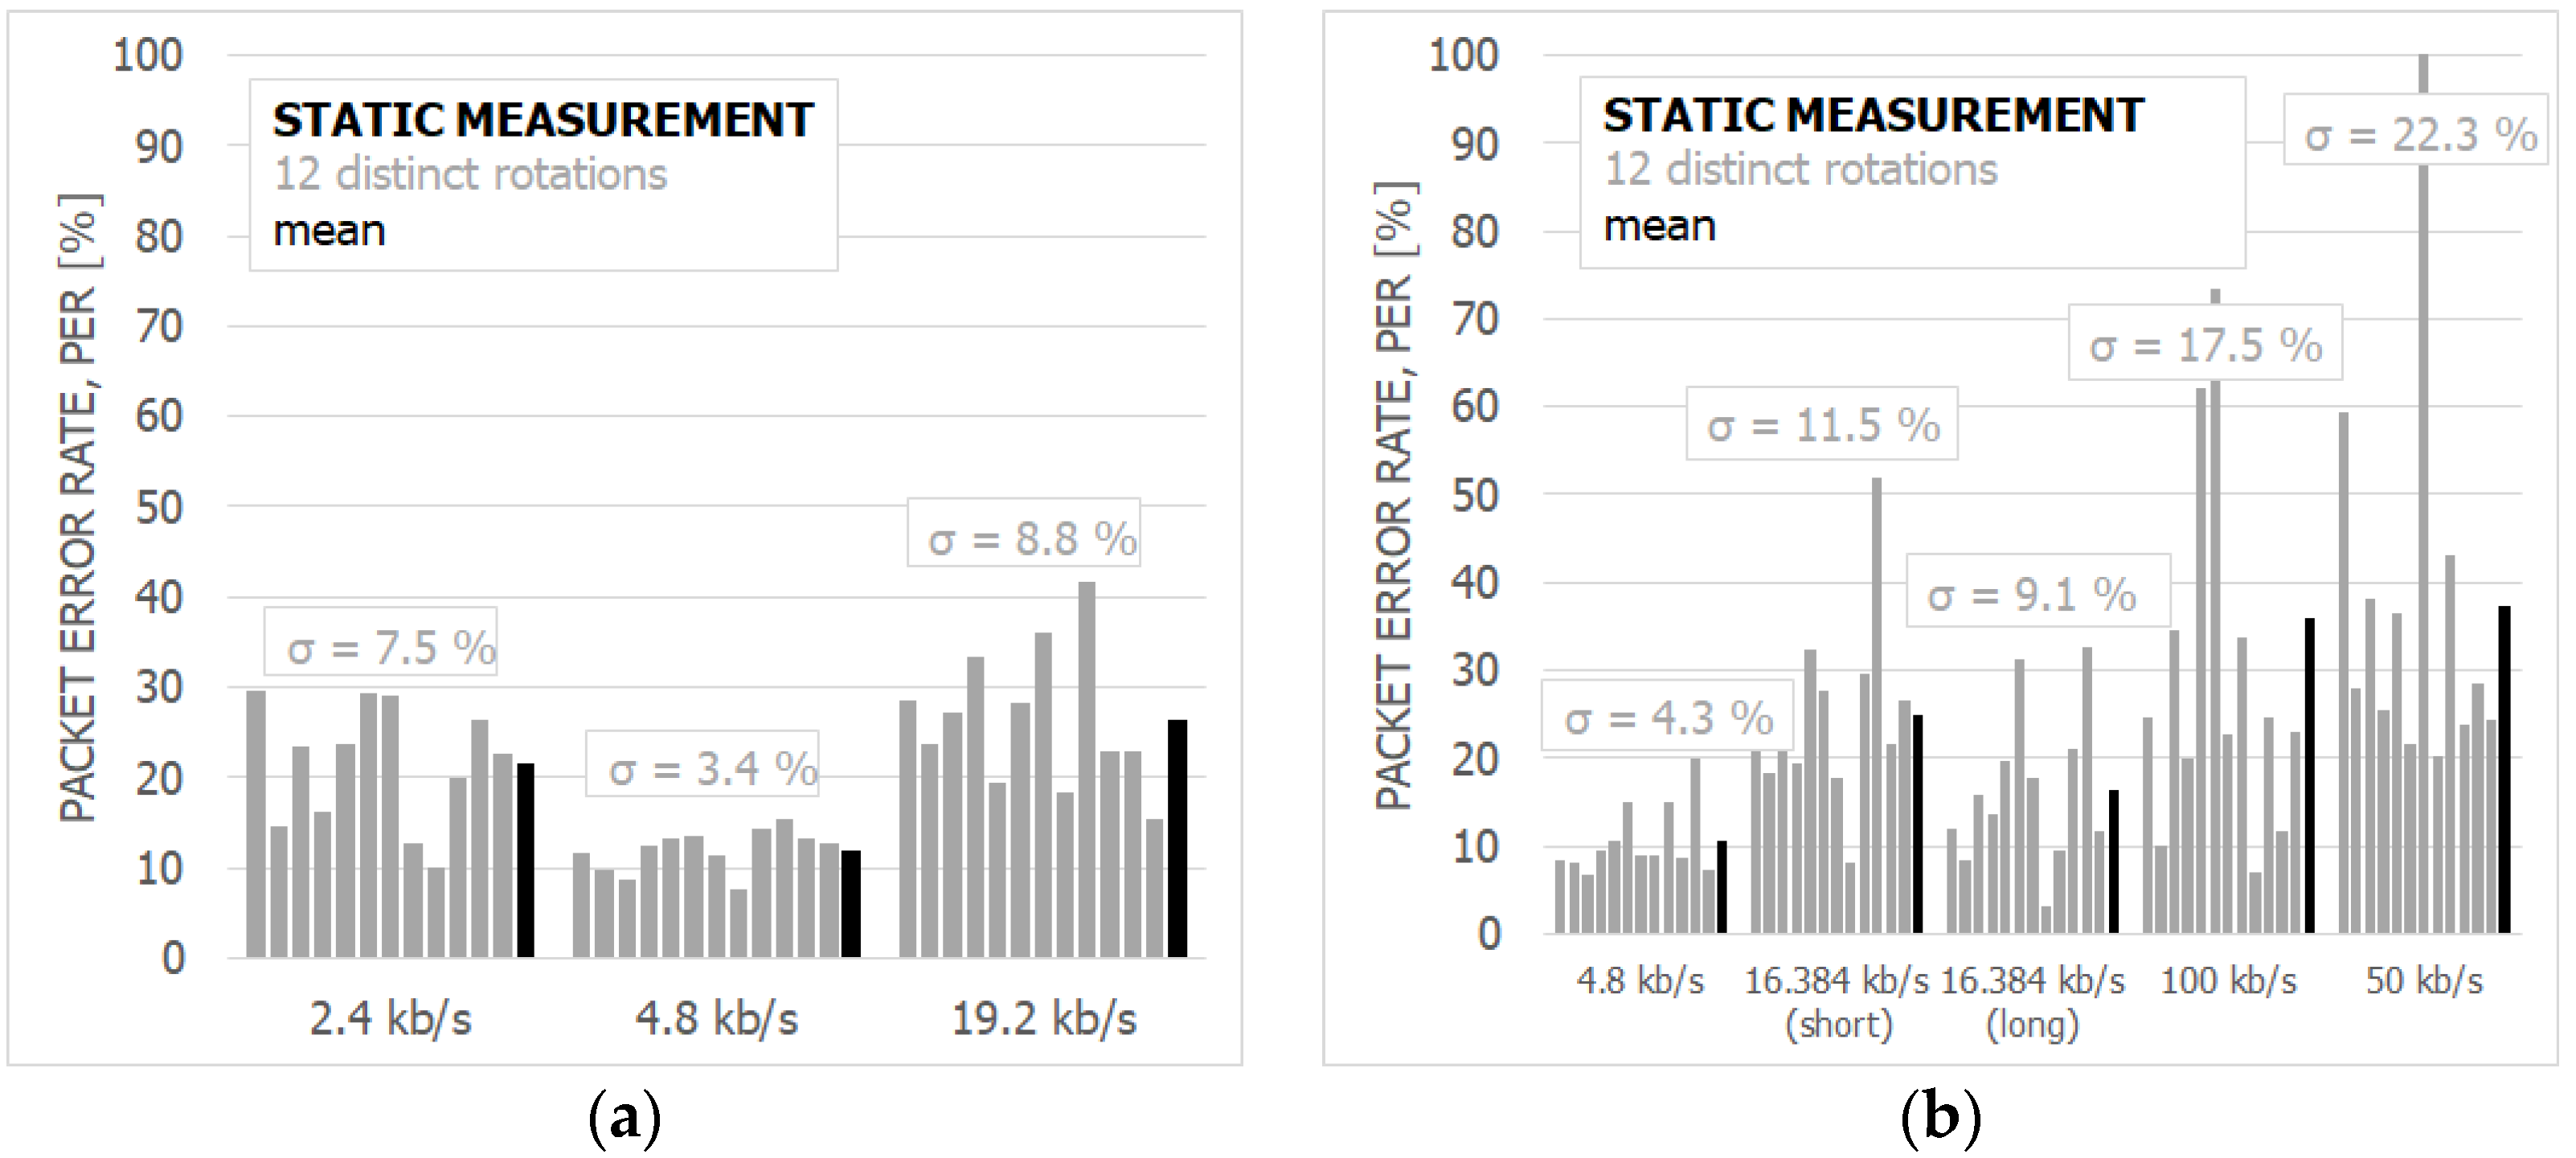
  • The chamber control system enabled the stirrer to work in both a fixed and continuous rotation mode, with a user-defined angular rotation speed (degrees/second).

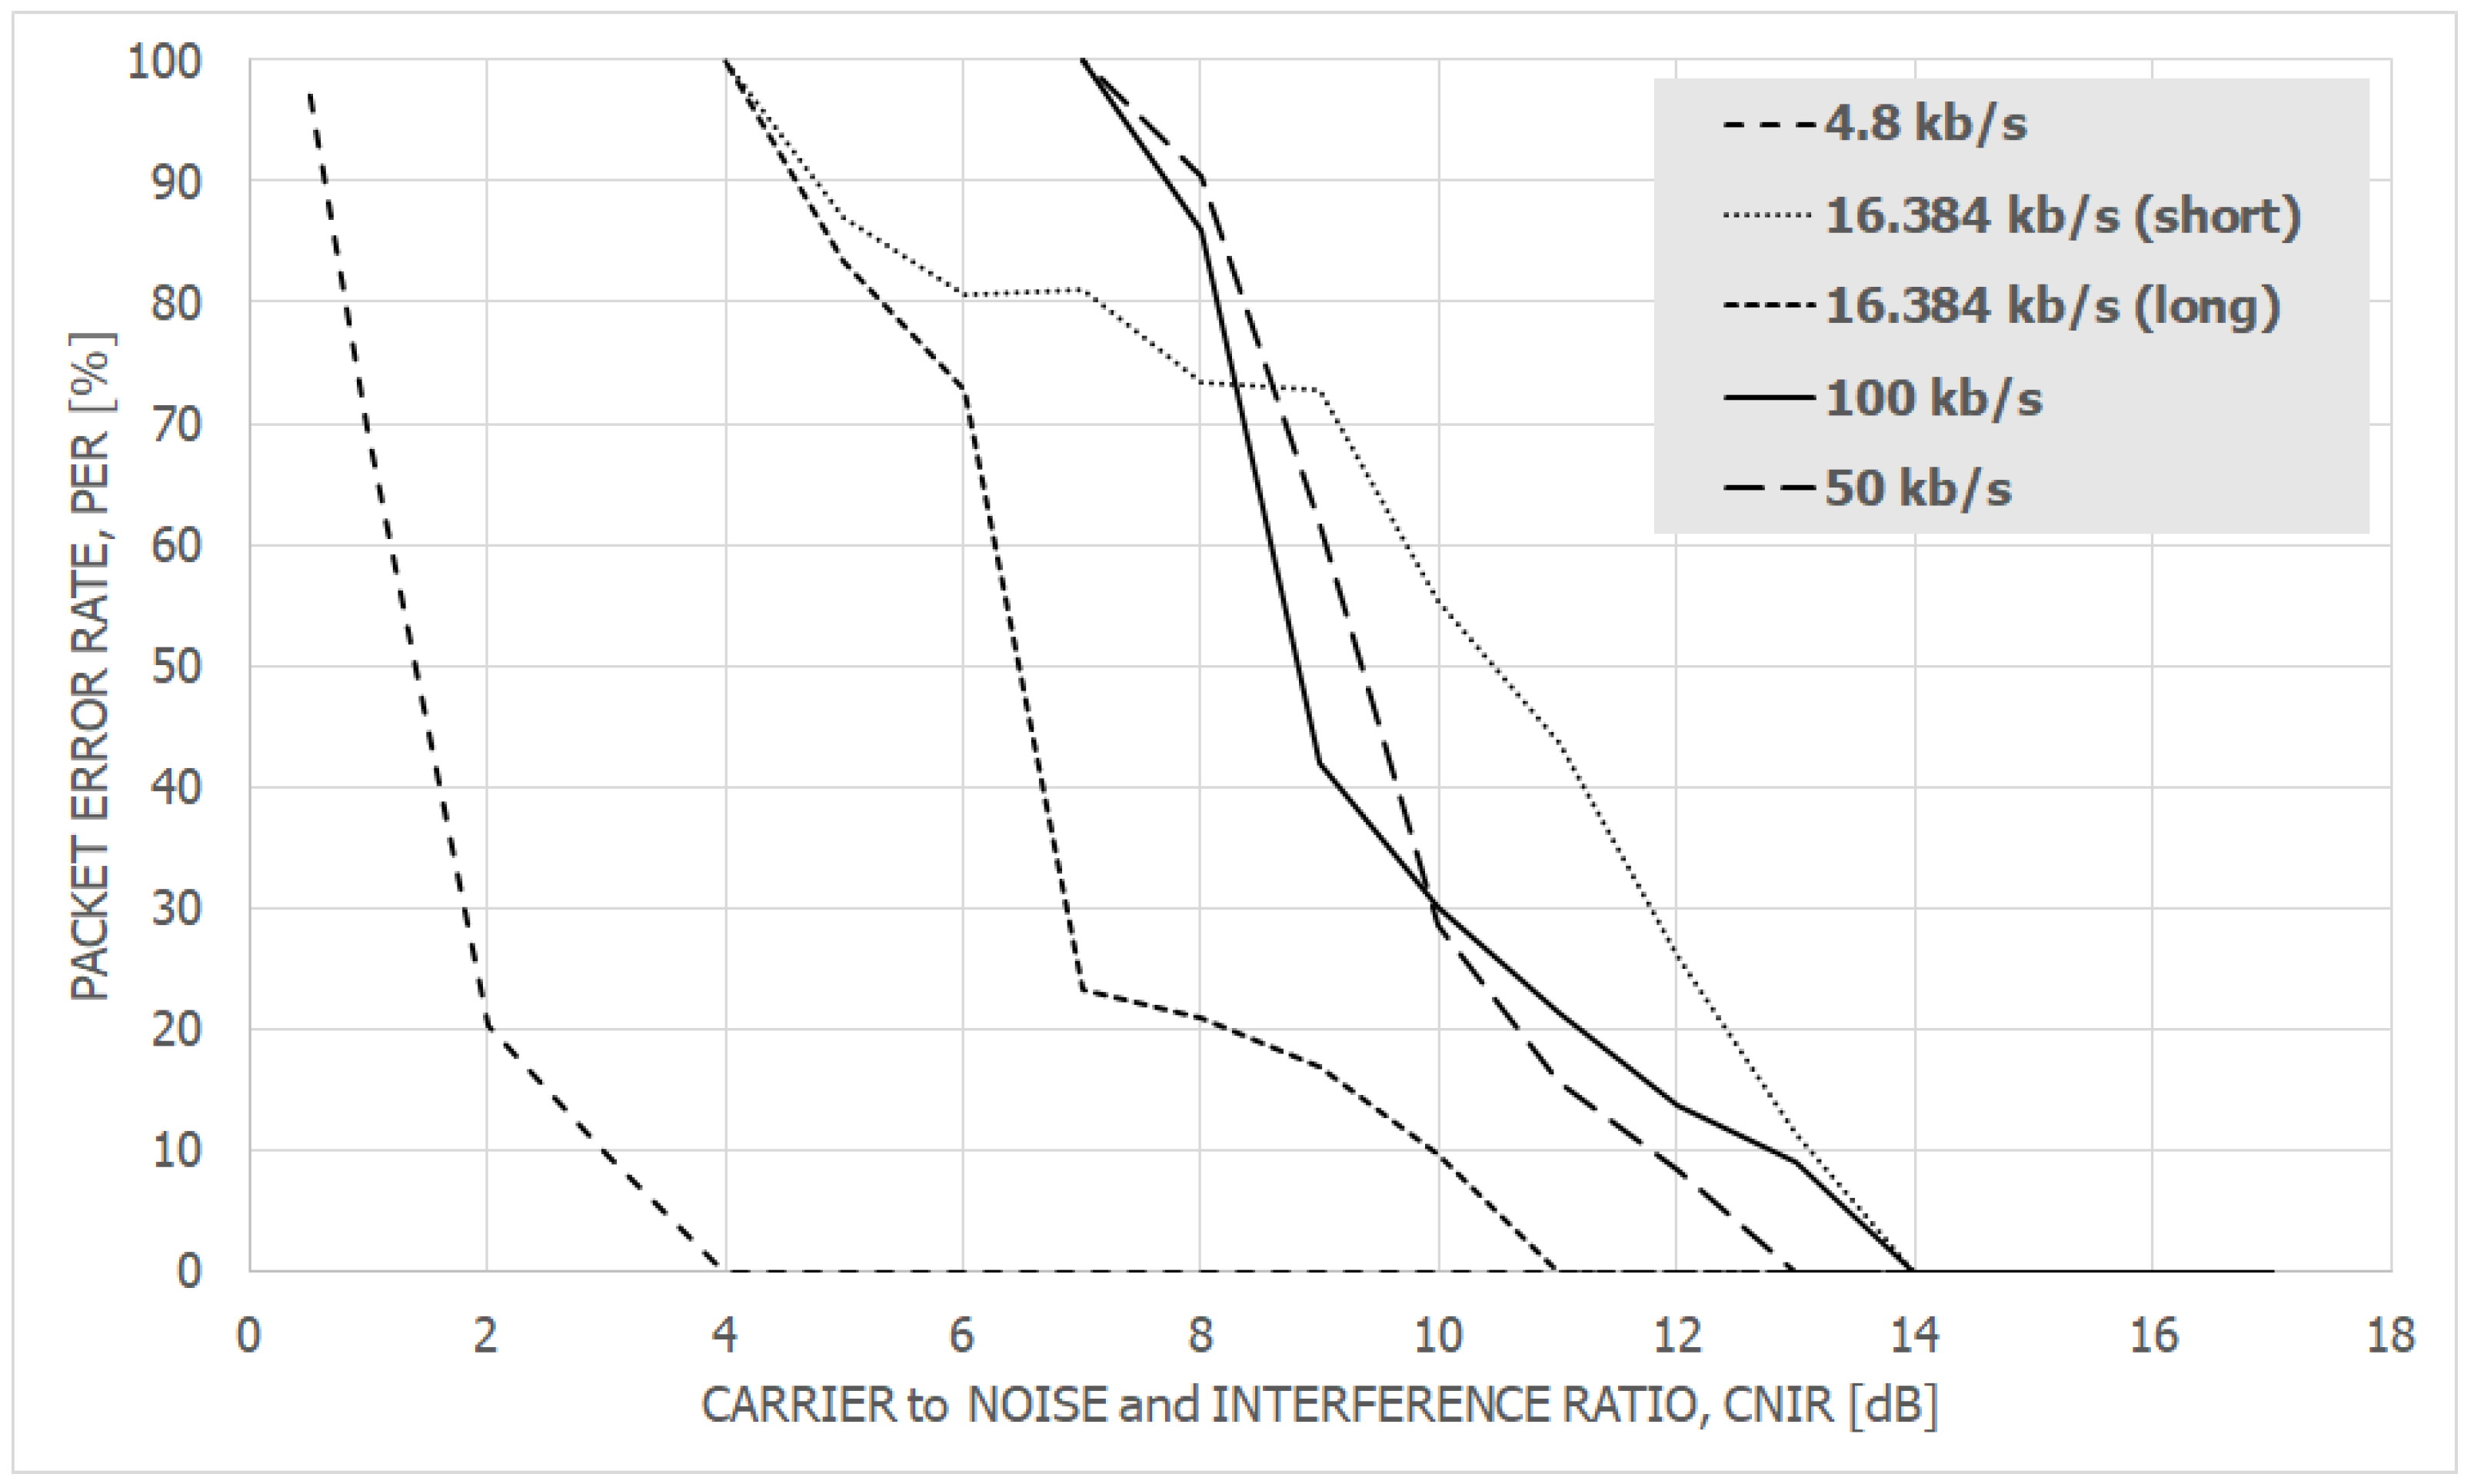
7.2. The Results and Discussion

Similarly to the interference susceptibility measurements described in chapter 6, the Wireless M-Bus devices were again tested for all eight modes in the anechoic chamber. Moreover, in order to comply with IEC 61000-4-21 Part: 4 norm [40], the measurement of each mode was carried out twelve times, i.e., once per every stirrer position, changed in steps of 30°, thus, eventually covering the full stirrer rotation. According to [40], such a number of positions guarantees measurement uncertainty at a 95% confidence level and is applicable to the frequency range 6fL–10fL, which in the case of the WUST LKE reverberation chamber is equivalent to 600–1000 MHz, a range containing the center frequency used in the tests (fc = 863.1 MHz). Analogous measurements were carried out for the stirrer continuous rotation during testing, a mode referred to as a ‘dynamic measurement’ (Figure 11), as opposed to the former called a ‘static measurement’ (with 12 distinct positions, Figure 12). In the dynamic measurement, each data rate mode was repeated three times. In Figure 11 and Figure 12, solid bars represent the measured samples (twelve in each bit rate mode for the static and three for the dynamic measurements), whereas the rightmost hollow bars represent the averages of their corresponding bit rate groups.
Analysis of results leads, therefore, to the following takeaways:
Conclusion no. 1: The investigated system, Wireless M-Bus, demonstrated a high immunity to harsh propagation conditions caused by extreme multipath propagation. During transmission under both static (i.e., measured at fixed stirrer positions) and dynamic conditions, the system maintained connectivity, with the average PER below 40%. The connection was severely degraded and lost only for this single stirrer position.
Conclusion no. 2: PER values reported by the system when operating at lower data rates (2.4, 4.8, and 19.2 kb/s) were lower by at least 10% compared to the higher rates (16.384, 100, and 50 kb/s). Such behavior is attributed to the bandwidth utilized for transmission—higher data rates imply higher deviations that lead to a broader signal BW. Considering the dispersion of the reported PER values for various stirrer positions, in the case of narrowband transmission modes it appeared to be rather limited (with the standard deviation σ lying between 3 and 7). PER oscillated around its average without any major deviations from its average for all stirrer positions. In the wideband transmission modes, however, the dispersion was quite pronounced, with σ lying between 9 and 22.
Conclusion no. 3: Similarly to measurements in the anechoic chamber, the application of the long preamble improved the system immunity. For extremely adverse conditions, i.e., those generated in the unloaded reverberation chamber, the use of the long preamble diminished PER almost twice (from 25% to 16%), compared to the short preamble, which validated this feature as quite an effective means of combating the multipath effects, which cannot be said about preventing wideband interference effects (as stated in Conclusion no. 2, in Section 6), where toggling from the short to the long preamble did not significantly improve the PER performance.

8. General Conclusions and Further Research

The paper presents outcomes of measurements in which Wireless M-Bus system resilience was tested in two disparate propagation environments. All transmission modes offered by the investigated modules operated at the two most popular frequency bands used in the IoT. The results achieved in the anechoic chamber confirmed that simple throughput modes (utilizing well-known FSK modulations and their derivatives) were capable of operating even at single-dB CNIR values, which makes them fit for use in Internet of Things systems. The system also revealed its robust characteristics under extremely adverse fading conditions (during highly multipath propagation), namely, the connectivity incurred severe degradation throughout the measurements. This extends the system applicability to high-rise urban environments or manufacturing plants that pose a challenging environment to many radiocommunication systems. Thus, another step in investigations should consist of performing measurements with the use of a fading emulator that allows for a full control over the multipath characteristics. Namely, particular tapped channel models can be arbitrarily generated as opposed to the reverberation chamber in which the multipath effect can only be controlled statistically by inserting physical absorbers into the facility.

Author Contributions

Conceptualization, M.K. and K.S.; methodology, M.K.; software, M.K.; validation, M.K. and K.S.; formal analysis, M.K.; investigation, M.K.; resources, M.K.; data curation, M.K.; writing—original draft preparation, M.K.; writing—review and editing, M.K. and K.S.; visualization, M.K.; supervision, K.S. All authors have read and agreed to the published version of the manuscript.

Funding

This research was supported by the Wroclaw University of Science and Technology statutory grant no. 82 111 04 160.

Data Availability Statement

The data presented in this study are available on request from the corresponding author.

Conflicts of Interest

The authors declare no conflict of interest.

Abbreviation

A list of acronyms most commonly used in the text:
AWGNAdditive White Gaussian Noise
BBNBroadband Noise
CIoTCellular IoT
CNIRCarrier to Noise and Interference Ratio
DUTDevice Under Test
EMElectromagnetic
FSKFrequency-shift keying
GEVGeneralized Extreme Value Distribution
GFSKGaussian Frequency-shift keying
IDSIntrusion Detection System
IoTInternet of Things
ISMIndustrial, Scientific, Medical
LECLaboratory of Electromagnetic Compatibility (LEC)
LTNLow Throughput Network
M2MMachine-to-machine
MIMOMultiple Input Multiple Output
MLMachine Learning
MTCMachine-type Communication)
MTDMachine-type device
PDPPower Delay Profile
PERPacket Error Rate
RFIDRadio Frequency Identification
SNRSignal to Noise Ratio
WM-BusWireless M-Bus
WSNWireless Sensor Network

References

  1. Ashton, K. That ‘Internet of Things’ Thing. In the real world, things matter more than ideas. RFiD J. 2009, 22, 97–114. [Google Scholar]
  2. Peter Day’s World of Business, BBC World Service (BBC). Available online: http://downloads.bbc.co.uk/podcasts/radio/worldbiz/worldbiz_20150319-0730a.mp3 (accessed on 25 June 2022).
  3. TR 45.820 V2.1.0; Cellular System Support for Ultra Low Complexity and Low Throughput Internet of Things; The 3rd Generation Partnership Project; 3GPP Organizational Partners: Valbonne, France, 2015.
  4. Huvio, E.; Grönvall, J.; Främling, K. Tracking and tracing parcels using a distributed computing approach. In Proceedings of the 14th Annual Conference for Nordic Researchers in Logistics (NOFOMA’2002), Trondheim, Norway, 12–14 June 2002; pp. 29–43. [Google Scholar]
  5. Magrassi, P. Why a Universal RFID Infrastructure Would Be a Good Thing. Technology 2002, 16, 0038. [Google Scholar]
  6. Magrassi, P.; Berg, T. A World of Smart Objects, Gartner Research Report R-17-2243. 2002. Available online: https://www.gartner.com/en/documents/366151 (accessed on 4 January 2023).
  7. Internet of Things—An Action Plan for Europe; COM(2009) 278 final; Commission of the European Communities: Brussels, Belgium, 2009.
  8. Wood, A. The Internet of Things Is Revolutionizing Our Lives, but Standards Are a Must. The Guardian. 2015. Available online: https://www.theguardian.com/media-network/2015/mar/31/the-internet-of-things-is-revolutionising-our-lives-but-standards-are-a-must (accessed on 4 January 2023).
  9. Evans, D. The Internet of Things: How the Next Evolution of the Internet Is Changing Everything. Cisco White Pap. 2011, 1, 1–11. [Google Scholar]
  10. Shafiq, M.; Tian, Z.; Bashir, A.K.; Du, X.; Guizani, M. CorrAUC: A Malicious Bot-IoT Traffic Detection Method in IoT Network Using Machine-Learning Techniques. IEEE Internet Things J. 2021, 8, 3242–3254. [Google Scholar] [CrossRef]
  11. Shafiq, M.; Tian, Z.; Bashir, A.K.; Du, X.; Guizani, M. IoT malicious traffic identification using wrapper-based feature selection mechanisms. Comput. Secur. 2020, 94, 101863. [Google Scholar] [CrossRef]
  12. Shafiq, M.; Tian, Z.; Bashir, A.K.; Jolfaei, A.; Yu, X. Data mining and machine learning methods for sustainable smart cities traffic classification: A survey. Sustain. Cities Soc. 2020, 60, 102177. [Google Scholar] [CrossRef]
  13. Shafiq, M.; Tian, Z.; Sun, Y.; Du, X.; Guizani, M. Selection of effective machine learning algorithm and Bot-IoT attacks traffic identification for internet of things in smart city. Future Gener. Comput. Syst. 2020, 107, 433–442. [Google Scholar] [CrossRef]
  14. Anani, W.; Ouda, A. Wireless Meter Bus: Secure Remote Metering within the IoT Smart Grid. In Proceedings of the 2022 International Symposium on Networks, Computers and Communications (ISNCC), Shenzhen, China, 19–22 July 2022; pp. 1–6. [Google Scholar] [CrossRef]
  15. Machine-to-Machine Communications (M2M); Smart Metering Use Cases. ETSI TR 102 691 V1.1.1 (2010-05). Available online: https://www.etsi.org/deliver/etsi_tr/102600_102699/102691/01.01.01_60/tr_102691v010101p.pdf (accessed on 4 January 2023).
  16. Vejlgaard, B.; Lauridsen, M.; Nguyen, H.C.; Kovács, I.; Mogensen, P.E.; Sørensen, M. Interference Impact on Coverage and Capacity for Low Power Wide Area IoT Networks. In Proceedings of the 2017 IEEE Wireless Communications and Networking Conference, San Francisco, CA, USA, 19–22 March 2017. [Google Scholar]
  17. Lauridsen, M.; Vejlgaard, B.; Kovacs, I.Z.; Nguyen, H.; Mogensen, P. Interference Measurements in the European 868 MHz ISM Band with Focus on LoRa and SigFox. In Proceedings of the 2017 IEEE Wireless Communications and Networking Conference (WCNC), San Francisco, CA, USA, 19–22 March 2017; pp. 1–6. [Google Scholar] [CrossRef]
  18. Chi, Z.; Li, Y.; Liu, X.; Wang, W.; Yao, Y.; Zhu, T.; Zhang, Y. Countering cross-technology jamming attack. In Proceedings of the 13th ACM Conference on Security and Privacy in Wireless and Mobile Networks (WiSec ‘20), Association for Computing Machinery, New York, NY, USA, 8–10 July 2020; pp. 99–110. [Google Scholar] [CrossRef]
  19. Singh, J.; Woungang, I.; Dhurandher, S.K.; Khalid, K. A jamming attack detection technique for opportunistic networks. Internet Things 2022, 17, 100464. [Google Scholar] [CrossRef]
  20. Mbarek, B.; Ge, M.; Pitner, T. An adaptive anti-jamming system in HyperLedger-based wireless sensor networks. Wirel. Netw. 2022, 28, 691–703. [Google Scholar] [CrossRef]
  21. Navas, R.E.; Cuppens, F.; Cuppens, N.B.; Toutain, L.; Papadopoulos, G.Z. Physical resilience to insider attacks in IoT networks: Independent cryptographically secure sequences for DSSS anti-jamming. Comput. Netw. 2021, 187, 107751. [Google Scholar] [CrossRef]
  22. Sciancalepore, S.; Oligeri, G.; Di Pietro, R. Strength of Crowd (SOC)—Defeating a Reactive Jammer in IoT with Decoy Messages. Sensors 2018, 18, 3492. [Google Scholar] [CrossRef]
  23. Manikandan, C.; Alamelumangai, V. Performance Analysis of Nash Algorithm to Detect the Jamming Attack in IoT Network. Compliance Eng. J. 2020, 11, 7–13. [Google Scholar]
  24. Tang, X.; Ren, P.; Han, Z. Jamming Mitigation via Hierarchical Security Game for IoT Communications. IEEE Access 2018, 6, 5766–5779. [Google Scholar] [CrossRef]
  25. Zhang, P.; Sun, S. One Node to Guard All: Jamming-Resistant and Low-Latency Communication for IoT. In Proceedings of the 2018 IEEE Global Communications Conference (GLOBECOM), Abu Dhabi, United Arab Emirates, 9–13 December 2018; pp. 1–6. [Google Scholar] [CrossRef]
  26. Pomianek, A.J.; Staniec, K.; Joskiewicz, Z. Practical remarks on measurement and simulation methods to emulate the wireless channel in the reverberation chamber. Prog. Electromagn. Res. PIER 2010, 105, 49–69. [Google Scholar] [CrossRef]
  27. Staniec, K.; Kowal, M. LoRa performance under variable interference and heavy-multipath conditions. Wirel. Commun. Mob. Comput. 2018, 2018, 6931083. [Google Scholar] [CrossRef]
  28. Staniec, K.; Kucharzak, M.; Jóskiewicz, Z.; Chowański, B. Measurement-Based Investigations of the NB-IoT Downlink Performance in Fading Channels. IEEE Wirel. Commun. Lett. 2021, 10, 1780–1784. [Google Scholar] [CrossRef]
  29. Embit EMB-WMB169PA, EMB-WMB868 Datasheet, Embit; Revision 1.9; Italy, 2014. Available online: http://www.embit.eu/wp-content/datasheets/EMB-WMB-datasheet-latest.pdf (accessed on 4 January 2023).
  30. Alobaidy, H.A.; Singh, M.J.; Behjati, M.; Nordin, R.; Abdullah, N.F. Wireless Transmissions, Propagation and Channel Modelling for IoT Technologies: Applications and Challenges. IEEE Access 2022, 10, 24095–24131. [Google Scholar] [CrossRef]
  31. European Telecommunications Standards Institute. LTE, 5G., Study on Channel Model for Frequency Spectrum above 6 GHz (3GPP TR 38.900 Version 14.3.1 Release 14). European Telecommunications Standards Institute, ETSI TR 138 900 V14.3.1 (2017-08). 2017. Available online: http://www.etsi.org. (accessed on 28 November 2022).
  32. Olasupo, T.O. Propagation Modeling of IoT Devices for Deployment in Multi-level Hilly Urban Environments. In Proceedings of the 2018 IEEE 9th Annual Information Technology, Electronics and Mobile Communication Conference (IEMCON), Vancouver, BC, Canada, 1–3 November 2018; pp. 346–352. [Google Scholar] [CrossRef]
  33. Callebaut, G.; Van der Perre, L. Characterization of LoRa Point-to-Point Path Loss: Measurement Campaigns and Modeling Considering Censored Data. IEEE Internet Things J. 2020, 7, 1910–1918. [Google Scholar] [CrossRef]
  34. Callebaut, G.; Gunnarsson, S.; Guevara, A.P.; Johansson, A.J.; Van Der Perre, L.; Tufvesson, F. Experimental Exploration of Unlicensed Sub-GHz Massive MIMO for Massive Internet-of-Things. IEEE Open J. Commun. Soc. 2021, 2, 2195–2204. [Google Scholar] [CrossRef]
  35. Embit Binary Interface-WMBus Specific Documentation. Revision 2.2; Embit s.r.l.: Modena, Italy, 2014.
  36. Moher, M.; Haykin, S. Communication Systems, 5th ed.; Wiley: Hoboken, NJ, USA, 2009; p. 448. ISBN 9780471697909. [Google Scholar]
  37. ITU. ITU-R P.1407-1; Multipath Propagation and Parameterization of Its Characteristics. Available online: https://www.itu.int/rec/T-REC-X.1407-202201-I (accessed on 4 January 2023).
  38. Saunders, S.R.; Aragón-Zavala, A. Antennas and Propagation for Wireless Communications Systems, 2nd ed.; John Wiley & Sons Ltd.: New York, NY, USA, 2007. [Google Scholar]
  39. Hill, D.A. Electromagnetic Fields in Cavities: Deterministic and Statistical Theories. In The IEEE Press Series on Electromagnetic Wave Theory; John Wiley & Sons Inc.: Hoboken, NJ, USA, 2009. [Google Scholar]
  40. IEC 61000-4-21; Electromagnetic Compatibility (EMC) Part 4: Testing and Measurement Techniques Reverberation Chamber Test Methods; Section 21: Reverberation Chamber Test Methods. International Standard: Geneva, Switzerland, 2011.
Figure 1. An Internet of Things (IoT) network exposed to intentional jamming.
Electronics 12 00907 g001
Figure 2. Schematic of a macro division of the IoT systems.
Electronics 12 00907 g002
Figure 3. Illustration of the concept of capillaries and long-distance LTN/CIoT networks.
Electronics 12 00907 g003
Figure 4. Generic packet format for EBI packets [35].
Electronics 12 00907 g004
Figure 5. A schematic of the set-up used for measuring the Wireless M-Bus system in the LEC (WUST) anechoic chamber.
Electronics 12 00907 g005
Figure 6. DUT devices in anechoic chamber.
Electronics 12 00907 g006
Figure 7. Packet Error Rate (PER) response to interference (jamming) expressed by carrier to interference and noise (CNIR) obtained in the LKE (WUST) anechoic chamber (169 MHz).
Electronics 12 00907 g007
Figure 8. Packet Error Rate (PER) response to interference (jamming) expressed by carrier to interference and noise (CNIR) obtained in the LKE (WUST) anechoic chamber (868 MHz).
Electronics 12 00907 g008
Figure 9. A schematic of the set-up used for measuring the Wireless M-Bus system in the LKE (WUST) reverberation chamber.
Electronics 12 00907 g009
Figure 10. DUT devices in reverberation chamber.
Electronics 12 00907 g010
Figure 11. Packet Error Rate measurements for Wireless M-Bus obtained in the LKE (WUST) reverberation chamber: (a) dynamic measurements at 169 MHz, (b) dynamic measurements at 868 MHz.
Electronics 12 00907 g011
Figure 12. Packet Error Rate measurements for Wireless M-Bus obtained in the LKE (WUST) reverberation chamber: (a) static measurements at 169 MHz, (b) static measurements at 868 MHz.
Electronics 12 00907 g012
Table 1. EMB-WMB169PA RF Characteristics (Vcc = 3.3 V 25 °C) [29].
MinTyp.MaxUnitNote
RF Frequency Range169.400 169.475MHz
Frequency Tolerance 3.5ppmExcluding ageing typ. ±1 ppm/year
RF Data Rate0 200kbps
Programmable Output Power Range−7 +27dBmStd. Conditions: 3.3 V 25 °C
Rx Bandwidth (BW)8 200kHz
Receiver Sensitivity
4.8 kbps GFSK
−117 dBm
RF Input Saturation +10 dBm
Blocking As specified in EN 300 220
±2 MHz78dB
±10 MHz81dB
Table 2. EMB-WMB868 RF Characteristics (Vcc = 3.3 V 25 °C) [29].
MinTyp.MaxUnitNote
RF Frequency Range868.000 869.650MHzsubband g1, g2, g3
Frequency Tolerance 15 ppm±15 ppm over temperature range
RF Data Rate0 200kbps
Programmable Output Power Range−7 +15dBmStd. Conditions: 3.3 V 25 °C
Rx Bandwidth (BW)8 200kHz
Receiver Sensitivity
4.8 kbps GFSK
−117 dBm
RF Input Saturation +10 dBm
Blocking As specified in
ETSI EN 300 220
±2 MHzTBDTBD
±10 MHzTBDTBD
Table 3. The transmission modes used during tests.
CH
no.
WMBus ModeWMBus ch. NameCenter Freq. [MHz]ModulationData Rate [kbps]FSK Deviation [kHz]
3NN1c, N2c (CEPT 2a)169.4313GFSK2.4±2.4
1NN1a, N2a (CEPT 1a)169.4063GFSK4.8±2.4
7NN2g
(CEPT 0)
169.43754-GFSK19.2−7.2, −2.4 +2.4, +7.2
18reservedR2868.33FSK4.8±6
23S (short preamble)S868.3FSK16.384±50
24S (long preamble)S868.3FSK16.384±50
37COther channel868.95FSK100±45
38COther channel869.525GFSK50±25
Disclaimer/Publisher’s Note: The statements, opinions and data contained in all publications are solely those of the individual author(s) and contributor(s) and not of MDPI and/or the editor(s). MDPI and/or the editor(s) disclaim responsibility for any injury to people or property resulting from any ideas, methods, instructions or products referred to in the content.

