
An Unmanned Aerial Vehicle (UAV) System for Disaster and Crisis Management in Smart Cities

1
Department of Information Technology, College of Computer, Qassim University, Buraydah 51921, Saudi Arabia
2
Department of Information Technology, Community College of Qatar, Doha 7344, Qatar
3
Équipe de Sciences de l’information et Modélisation, Polydisciplinary Faculty of Sidi Bennour, Chouaib Doukkali University, El Jadida 24000, Morocco
*
Author to whom correspondence should be addressed.
Electronics 2023, 12(4), 1051; https://doi.org/10.3390/electronics12041051
Submission received: 25 January 2023
/
Revised: 13 February 2023
/
Accepted: 14 February 2023
/
Published: 20 February 2023
(This article belongs to the Section Artificial Intelligence)
Abstract
:Over the course of the last decade, the unmanned aerial vehicle (UAV) research community has received a significant amount of attention. Emergency response operations, such as those that follow a natural disaster, are one of the civil applications that could benefit from the use of UAVs in disaster and crisis management. In the event of a catastrophic event, it would be extremely beneficial for both victims and first responders to have access to a UAV network that is capable of deploying independently and offering communication services. However, when working with complicated situations, one of the most difficult things is coming up with exploratory paths for the networks involved. A crisis and disaster management system using a swarm optimization algorithm (SOA) is proposed to assist in disaster and crisis management. In this system, the UAV search and rescue team follows the strategy called the delay tolerant network, which has the ability to explore. The proposed approach is able to find the global maximum in the search space without ever settling for a suboptimal solution. This work has two primary objectives: the first is to investigate a potential disaster zone, and the second is to direct the UAV to a number of victim groups that were found during the investigation phase. For the purpose of performing a characterization, performance metrics such as delay, throughput, performance rate, and path loss have been analyzed. The results show the superiority of the performance over the existing work.
1. Introduction
In recent times, digital technology and the Internet of Things (IoT) have spread over the online platform, producing large data sources to use with multiple technologies, where thousands of moving and IoT systems are linked to the Internet [1]. A subgroup of those applications that involve the different programming of IoT operating systems is to carry out a task differently. The IoT is a key framework that has launched an effective and convenient entrance to the marketing of a wide variety of issues [2]. IoT devices can recognize, process, and interact [3]. The IoT intends to provide ideal interconnection for the tracking, control, and communication of dependable access privileges [4]. Unmanned aerial vehicles (UAVs) could be used to expand the exposure and enhance the surface IoT network access. UAVs could be used as an access point for floor IoT connectivity [5]. UAVs can offer interconnection in regions where the technology is affected or the communications infrastructure does not exist compared to standard cellular networks [6]. Thus, in a location with few or no facilities, UAVs can suggest an alternative for collecting floor IoT data [7]. The whole implementation of UAVs and surface IoT can increase the capacity to estimate, view effectively, and react to wildfires [8]. It would often greatly decrease disaster response time, saving people’s lives in the surrounding areas [9]. UAVs are accessible or dependable in many telecommunications facilities in disaster and crisis management [10]. Disaster situations typically affect the telecommunications infrastructure so they are unable to offer additional standard telecommunications services [11]. Contact among rescue crews is essential as an effective rescue attempt is often recognized as a first response [12]. First responders face one of the main obstacles of setting up a crisis zone ad hoc network [13]. The UAV has been created as an innovation that promises crisis assistance with aid delivery and the compilation of data, irregular interaction, and search and recovery assistance [14].
First response services in human-made or natural disaster situations were successfully utilized in the past. Drones can play a significant role in the IoT in the current environment and respond as individuals that can encourage, enhance, and optimize current relief processes and activities [15]. More widely, independent and largely autonomous drones, including those used in manufacturing inspections to promote military operations, would then certainly strive to support people in other duties [16]. A drone system could be used to collect large amounts of data, which could then be posted for high digital transmission to edge devices where machine learning techniques are accessible for use [17].
In the constraints provided by motivated systems, including a natural tragedy situation, there can be an obstacle to maintain the proper operating of IoT machines even though there are slowdowns and interference-resistant procedures in disaster and crisis management [18]. UAVs provide interconnection, while drones’ dynamic properties are designed to achieve a high quality of services with an intensive error [19]. There should be a continuous and responsive option offered for centralized and dispersed methods, which enable the edge system of an IoT device, and drones and machines in particular. UAVs can migrate in a short period to certain places without any barrier. One of UAV mesh nodes’ principal capacities is their massive flexibility, enabling the network architecture to adapt to scenarios to improve the intended goals. Well-established agencies such as the security, border agent, and marine officers’ forces and healthcare services are responsible for public security, aiming to meet citizens’ needs. We are of the opinion that the work carried out by emergency response teams would unquestionably benefit from the existence of a UAV network with the capabilities outlined above. This is because the UAVs would be able to investigate the situation even before the first responders arrive at the scene of the disaster. The main contributions of the work are as follows:
- To reduce the risk levels in a disaster scenario and to forecast a disaster risk status. The UAV network manager monitoring mechanism uses the SOA.
- To optimize the path of UAVs that contributes to lower energy use. In assessing the health risk using the tree classification algorithm, disasters are used to test UAV data derived from the critical signs of people.
- To propose an approach which is able to find the global maximum in the search space without ever settling for a suboptimal solution.
- The experimental results obtained achieve the highest performance in terms of delay, throughput, performance rate, and path loss when compared to other existing methods.
Therefore, the purpose of this article is to decrease the risk level in a catastrophe scenario and predict the risk status of the victims using IoT technologies. In order to follow the UAV network team, the proposed method uses the swarm optimization algorithm (SOA). The key objective is to optimize the UAV route, leading to reduced energy usage. In assessing health risk status using the tree classification technique, UAV data collected from people’s critical indicators are altered by disasters.
The remainder of the paper is organized as follows: Section 2 discusses various background studies related to disaster and crisis management based on UAVs. Section 3 explains the proposed model to reduce the risk levels in a disaster scenario and forecast a disaster risk status. Section 4 presents the results that verify the performance with existing work. Finally, a conclusion with future directions is presented in Section 5.
2. Background and Related Work
Zhenyu Na et al. [20] developed joint trajectory and power optimization (JT-PO). A multi-user data transfer UAV relay modeling approach is developed using JT-PO. When the interaction is disrupted between the client and the base station (BS), the BS first transmits data to the UAV. The UAV serves as an intermediary to transmit the information to consumers. The experimental results reveal that the improved adaptive method can enhance the data transmission value similar to the benchmarking strategies, optimizing the UAV path.
Kosei Miyano et al. [21] introduced utility-based scheduling (UBS). A potential approach for finding and rescuing missing people who vanish during disasters, such as natural calamities, uses small- and medium-scale UAVs. UBS introduces a functionality-centered methodology that guarantees the knowledge is continually updated with probable data in a certain amount of time. The computation results show that the suggested control strategy maximizes usefulness and conducts user-centered performance measures better than a standard scheduling technique.
Tallha Akram et al. [22] proposed base station placement (BSP). BSP has double significance: the first is to define locations with high densities for lower latency and static clients with an effective computer vision method. It is accomplished through a cross procedure, including acquiring an image, categorization, and group concentration prediction. Next, a computational method for jointly optimizing drone base stations’ positioning and user tasks is used. Several realistic network models’ performance characteristics show that the suggested method attains an efficiency equivalent to the objective function.
Nan Zhao et al. [23] discussed UAV-assisted emergency networks (UAV-AENs). A UAV-AEN is developed for a UAV-aided emergency grid in crises. First, UAVs’ journey and programming are jointly optimized such that wireless services maintain surface equipment that can be provided. Then, the UAV transmitter and the multi-hop floor device-to-device interaction are designed to strengthen the UAV connectivity protection. In an attempt to exchange data among disastrous areas outside the multi-hop, UAV transmission is often introduced via the optimization of UAV floating locations.
Francesco Malandrino et al. [24] introduced the UAV activities model (UAV-AM). The UAV-AM analyzes the wireless performance of the conventional infrastructure for communications. However, UAVs in a disaster situation are necessary because it is possible to use small and mobile base stations quickly and easily if needed. The specialization problem identifies the best UAV exposure that optimizes user efficiency while preserving fairness around the disaster-affected geographic area’s various regions.
Kirtan Gopal Panda et al. [25] discussed the UAV-aided post-disaster emergency network (UAV-APDE). The UAV-APDE aims to speed up rescue activities by leading victims to the closest evacuation campsite through a wireless emergency UAV-assisted system. Here, Raspberry Pi’s system architecture is installed on a UAV and is regarded as a Wi-Fi system over the catastrophe area. The study demonstrates that the prototype’s overall hop range is 280 m and 290 m for Wi-Fi adopting IEEE 802.11n and IEEE 802.11ac standards.
Based on a survey, an SOA-based is implemented to reduce the risk level in a disaster situation, and the network team monitoring mechanism uses SOA that contributes to lower energy use. In assessing their health risk status using a tree classification algorithm, UAV data from people’s vital signs are affected by disasters.
3. Proposed SOA-Based Disaster and Crisis Management Control System
In combination with UAVs and the IoT, the effects of emergency response programs will be dramatically enhanced. UAVs can use 5G networks to gather large-scale heterogeneous data from disaster-affected regions. This information can be analyzed to acquire the first responders’ information, such as the affected region’s boundaries and blocked road infrastructures, to predict residents’ health status in that region. Hence, in this paper, an SOA-based algorithm is proposed to reduce the risk level of a disaster scenario and predict the disaster risk status. UAVs’ key signs for people living in crisis zones are analyzed, and their health risk status is established using a decision tree classification algorithm. The danger status allows the first responders to determine the places that require urgent assistance. The results of the simulation equate the efficacy of our suggested scheduling with the conventional data collection approach. The UAVs need to be set up in our suggested manner before analyzing information. Precise UAV operations and a good routing path reduce energy consumption and delay dramatically. Low latency is extremely crucial since regulators need to make decisions in a high-speed crisis rapidly.
Figure 1 shows the disaster monitoring scenario based on UAVs. In the swarm, each particle shares its local attractions with another particle. The global best term of the equation is the best in the whole search area. This paper describes a different approach to the algorithm suggested in this document due to UAVs’ contact restrictions. Accordingly, the method in which is established as the swarm topology for particles is used. In our case, is the UAV community that shares its own local best knowledge with . The UAV group that belongs to topology produces the best UAV at time . For this particular category of UAVs which belong to the topology , this best neighbor is the global best solution. In our situation, the global best is not special; however, it is the best of many neighbors.
The roles of the pieces and fundamental components of the system are underlined. The operator may operate the complete fleet for the training of drones under difficult network settings such as missions to respond to natural disasters. In these circumstances, the performance of failed activities usually involves robust structures. On the other side, the IoT-based administration layer guarantees a resilient distributed network structure, by tracking and estimating failures for each network segment.
In each experience, data shared by UAVs are the following tuple: (i) maximum value found by the victims and (ii) the place where the maximum value has been achieved. Every UAV saves data about its local best and the number of UAVs it has encountered. Three UAVs, j, i, and , meet, will make the UAV’s local best according to the UAV’s meetings. would have a neighbor greater than the nearby best of the UAVs, with whom it has direct meetings, measured according to this method. According to their meetings with one another, can have another neighbor superior to .
A new rectilinear trajectory is arbitrarily determined as a UAV crosses a scenario boundary. The UAV will follow the current direction before the new frontier hits, or the best phases start at local or neighboring areas. The second step is the local best in the region. Each UAV is drawn to its local best during this process. The local best result in the weight of inertia is minimized. The weight of inertia and the best local weight must be equal to one. The third step reflects the best influence of the neighbor. Each UAV is directed to its neighbors by their superior solution candidates. Each UAV will know its best in the field and the best local UAVs caught at any point in the simulation. Due to the better neighbor effect, the weight of inertia is minimized. The added weights of the strongest results on inertia, local and neighboring, must be 1.
As mentioned, the original SOA has several versions. The inertia weight coefficient is included in the SOA. The candidate solution to the optimization problem [26,27,28] lies in any particle location. All particles of the swarm optimization update their location given the one-dimensional search area in Equation (1):
As shown in Equation (1), a one-dimensional search area has been determined. is a current iteration of the algorithm. (s) is a current position of the particle. is a velocity vector with the th particle at time s. The vector of the particle speed normally has three parts defined by Equation (2).
As deliberated in Equation (2) and Figure 2, the particle velocity is calculated, where is a new velocity, are the power of a particle’s desirability, called a local best and global best. and denote the random values and component of diversity in this algorithm which have a uniform distribution within range [0, 1]. explores the local best particle and is the global best at particle .
Before the new frontier is struck, the UAV will follow the existing route or the better phases will start locally or in the vicinity. The second phase is the best locally in the area. The best local outcome is minimized in the weight of inertia. The inertia weight and best local weight must be the same. The third stage shows the neighbor’s finest impact. Each UAV shall be guided by its best solution candidates to its neighbors throughout this procedure. Every UAV knows best about the field and the best local UAVs caught in the simulation at every moment.
Figure 3 illustrates the disaster position analysis. The SOA algorithm sees any UAV of the network as an algorithm member. The equation explains the motions of the UAV within the network as shown in Equation (3). The velocity vectors for every UAV at time , which is , are described according to Equation (3), by adding three vectors: (i) the velocity vectors for the respective UAV , (ii) a vector directing towards the local best place for the UAV, that is defined by , and (iii) a vector directing towards the neighboring vector best location . The following parameters are respectively weighted for these three vectors: representing the intensity of a particle attraction in the direction of its best locality and representing the intensity of a particle attraction on the road to its best neighbor. The maximum speed of the UAV calculates the maximum vector amplitude, a geometry parameter determined per simulation. A fourth variable in Equation (3) is which is the random path to the borders of the scenario followed by the UAV.
The term on the left represents every particle’s inertia component. A second element is often referred to as the cognitive element, and a third element is a social feature. The value of this instrument is lowered over time, as defined by the inertia coefficients. The particles present more important exploratory capabilities at the start of the simulation phase as they take greater values to investigate these search spaces thoroughly. If time goes by and the coefficient of efficiency has lower values, the particles begin to use their best local and global solutions to manipulate space regions. The global best is often decided on supposing that each particle shares the best part of the algorithm locally. The original SOA uses the best global component if a particular particle knows the best local particles. However, as UAVs have short-range wireless networking capabilities, UAVs cannot exchange information with other UAVs because of their communication constraints. As discussed in the paper above, a UAV exchanges information with other UAVs via an IoT network approach. These changes define the particle vector of the proposed algorithm in Equation (3):
As obtained in the modification of Equation (3), the particle vector is found, where is a new velocity, μ is a weight of the inertia component, is a local best and is a global best, is a random value, and the direction of the UAV follows. is a local best particle at , is a particle of the jth best neighbor.
The parameters used to characterize an algorithm include, respectively, and . These are referred to as inertia weight, best local weight, and the best neighbor weight. Inertia weight might be requested, and the best local and neighbor, as a simplification in some sections.
The proposed SOA provides advantages over other heuristics such as the genetic algorithm [29]: (i) easier implementation, since small parameters are present, (ii) reduced costs in estimation, and (iii) quicker convergence. The SOA is an excellent candidate for the problem’s complexity and scalability.
The search area considered is consistent with the UAV scenario. The scenario, having two dimensions, consists of all potential locations within the scenario for UAVs. The Cartesian coordinates in the arrangement (), in which and Y agree in all dimensions, reflect these locations. The bottom-left corner is taken as the source of the coordinates without any lack of generality. The scenario’s size is determined by the maximum values of the and coordinates by the and values. The search area is specified according to these definitions in Equation (4):
As inferred in Equation (4), the search area is evaluated. An optimization algorithm typically uses a fitness function to determine the accuracy. The fitness feature is described by several ground nodes identified at . The best way is to associate a UAV with the most ground nodes in the SOA. This development of the SOA is presented in (5).
As calculated in Equation (5), the optimization algorithm is described. To solve optimized issues, the SOA is the optimal solution to maximize the location-defined fitness functions in the shape of X and Y coordinates when the above deployment-defined algorithm has been pursued for a longer period (6).
Figure 4 demonstrates the UAV node operation. The job migration schema’s target node is selected by modeling the network as a network of queues. A task can move from the source node’s queue to the target node’s queue. With a handful of drones, this statistic is used to explain relocation and workflow. After an estimation period of the overhead migration delay measured according to the model outlined in the diagram, the probability is calculated to provide productivity in the discharge process. Figure 4 demonstrates the three agents’ task plan. Each drone receives several tasks and shifts the mission from one place to the next. To match the overall load, the agent migrates its initial and tasks to drone and to .
Figure 5 depicts the IoT-based disaster monitoring. UAV routing and the deployment route are used for acquiring data from the network of the ground sensor. Optimum IoT system clusters and optimal UAV deployment are defined to reduce energy use subject to a minimal bit error rate restriction. UAV deployments in the healthcare industry from the viewpoint of emergency response provide a wide variety of solutions, including data transmission, transportation, and samples of blood. Consider an IoT disaster management platform using UAVs, which consists of clusters with an IoT system, UAV UAVs, and network size . As seen in Figure 5, adopting IoT architecture is based on UAVs. Ground IoT devices are believed to be energy consuming. The monitoring center allocates UAV tasks to collect and submit data from cluster heads to be analyzed, as seen in Figure 5. The monitoring facility will query the UAV for many activities. It is assumed that is the number of UAV assignments. The data gathered by UAVs are analyzed in the monitoring center to conserve UAV resources for computationally costly data analysis. Simultaneously, different forms of data can be gathered by UAVs, including disaster-affected area border labeling, losses to facilities evaluation, road blocking, and disaster-affected population health statistics.
This paper considers a disaster management IoT platform with UAVs consisting of clusters with IoT units, UAVs, and network size . Ground IoT devices are assumed to be clustered by UAV coverage; cluster heads are selected by residual energy. Cluster heads will communicate information about their locations, and UAVs will share data collection capabilities. The UAV can then be ordered by the monitoring center to collect data from cluster heads and send them for analysis, as shown in Figure 5. This takes the data into account, and the monitoring center can ask the UAV for several tasks. It is believed that UAV L can carry out a number of tasks. is supposed to be the number of tasks attributed to UAV . The UAV can gather information for task from cluster heads to carry out this task in the form residual energy and area overage. This can be represented by the following (6):
As initialized in Equation (6), residual energy is found. The UAV’s energy depends upon its direction to secure both cluster heads and the features of radiation propagation; coordination is the coverage of the cluster head distance. The loss of the path can be modeled as (7):
As found in Equation (7), Figure 6 shows the path loss that is evaluated. is a path loss from a reference place, is the distance between UAV and a cluster head, is the exponent of path loss, and is the Gaussian random exponent representing shadowed effects [30].
The UAV coverage with which it is possible to connect with the cluster head in the ground IoT network can be determined as (8):
As deliberated in Equation (8), the coverage range is formulated, where is the UAV ’s height above the land, and the flight time for UAV must be as follows. Then, UAV ’s energy consumption can be described as in Equation (9):
As shown in Equation (9), the energy consumption of the UAV is computed, where UAV ’s RF module and hardware circuit power are consumed, respectively, and and are used.
UAV data concerning the key signs for people in a disaster will be forwarded for analysis to the monitoring center [30]. The collected data can include various risk status classes based on UAV-based health data, including heart rate, breathing rates, blood oxygen saturation, etc. Each risk status class , namely: (i) HR, (ii) , and (iii) NBP, shall carry the following vital signs. For illustration purposes, consider limited signs of vital health conditions of individuals. The data from the IoT devices are required for statistical analysis. The can take the following values: “none”, “low”, “low medium”, and “high” for vital signs. Then, the proposed measure between each group of the cluster risk factor is as in Equation (10):
The UAV risk factor is calculated in Equation (10). The UAVs must be configured even before the analysis of information in our proposed method. Exact UAV functions and the optimum routing trajectory significantly decrease their energy consumption and latency. Low latency is highly necessary because regulatory officials have to make decisions quickly in a high-speed crisis.
The data collection center can ask for a control system and send a request packet for the task . The device then calculates , the functionality for collecting data using Equation (1) for all UAVs to define each UAV’s ability. is the task in its coverage area, and UAV will be scheduled for data gathering. A binary variable defines the scheduling of UAV L as in Equation (11) [30]:
A binary variable is formulated in Equation (11). Our goal is to minimize UAV energy use by optimizing the data gathering route. UAV coverage and radius are guaranteed. The problem of optimization can be described as in Equation (12):
The Cartesian coordinates for UAV at a particular height are . determines if UAV may collect cluster head data as shown in Equation (11).
Figure 7 shows the proposed SOA-based disaster and crisis management control system. The access management component, inspired by the vast majority of connected networks, runs a network discovery protocol and a heartbeat monitoring mechanism for monitoring live connections. Each agent can belong to several authentications and is required in front of the contact facility. This part is responsible for managing agent identification over multiple overlay networks and ensuring stable communication via the transport layer safety (TLS) protocol. This component processes the replicated portion of the database while preserving network conditions. This depends on the connection status, network setup, and conditions. The state cache is often used as a registry for saving programs, such as battery use of IoT computers. It is more powerful than other text-based notation languages to specify our object models and apply the logic of message delimitation, serialization, and deserialization. The functions of parts and the core components of the system are highlighted. An operator can operate the entire fleet to train drones in challenging network conditions such as natural disaster response missions. In these cases, resilient mission structures are often needed to perform failure activities. Through tracking and estimating failures for each network part, on the other hand, the IoT-based management layer ensures a robust distributed network framework. If a malfunction happens, a new agent is allocated to tasks running or queued at the node, and the updated and expected results are reported to the customer. Audio processing is required for disaster response; however, edge computing applications that can benefit from this processing are not limited to the application presented.
In the emergency response, UAV applications in the healthcare system provide a wide range of options including data transfer, transportation, and blood samples.
This information may be analyzed to obtain first responder information to forecast the health of people of that region, such as the identification of the territory’s boundaries and obstructed road infrastructure. The SOA-based disaster and crisis management control system has been suggested in this work to lower the risk level for an emergency scenario and to anticipate the state of a catastrophe risk. The primary data of UAVs are analyzed for individuals living in crisis zones and the method for decision tree classification establishes their position as a health concern. The risk rating allows the first responders to decide where immediate assistance is needed. The findings of the simulation show the effectiveness of our proposed programming.
The proposed system improves disaster management and reduces the disaster risk based on average performance rate, delay throughput, and path loss.
4. Results and Discussion
Average reaction time (ART), latency, throughput, and path loss were used to assess the performance of the proposed disaster management system. The network has been modeled and simulated in this work using OPTNET 17.5. It features an intuitive GUI, module import by drag-and-drop, and eye-catching effects. The simulation parameters are presented in Table 1.
Performance metrics: in this section, we present all the metrics which were used to assess the performance.
Average performance rate: this can be measured as the ratio of total delay to total time taken. The total delay includes propagation and transmission delays. represents the propagation delay while represents transmission delay. is the time consumed in transmission while denotes the total number of nodes. The average performance rate can be expressed by as shown in Equation (13).
Delay: delay is the time it takes for a signal to go from the UAV to the rescue center through the network. When evaluating the effectiveness of a communication network, delay is a key indicator of quality. The idea is to shorten the time needed for the UAV to reach the rescue center by establishing direct communication between the two. The processing, queuing, and transmission delays of a network link are all included in the end-to-end delay which is based on the processing or computing , transmission delays , and propagation delay . Therefore, we can find the end-to-end delay () for nodes as shown in Equation (14):
Throughput: Throughput refers to the number of successful transmissions in a communication channel per unit of time. This can be expressed as the proportion of data received by the receiver node from the sender node within a specific time interval. The purpose of any network is to increase throughput. The network’s average throughput evaluated based on the proposed disaster management system can be derived as shown in Equation (15).
Path loss: an attenuation of the signal in the space. There are many variables to consider, including range, wavelength, and output power. The amount of path loss (PLoss) is proportional to both the distance and the wavelength. The path loss can be computed as shown in Equation (16).
where is the carrier frequency, λ is the speed of light, is the distance between the transmitter and receiver.
Figure 8 shows the relationship between the total number of devices with respect to average response time measured in seconds. The total number of devices varied from 10 to 100.
The behavior of the UAV system can vary, focusing on the meanings allocated to each variable. The feature executed can be described as a ground-grain type, although distinct component model parameters are required. The proposed SOA evaluates the performance of the parameters. The performance of the proposed SOA is better than that of existing work [30] as shown in Figure 8.
As can be seen in Figure 9, the performance of the throughput network appears to depend on the number of devices or UAVs. It has been shown that placing UAVs inside a coverage area of 100 m x 100 m results in a large improvement in throughput, which in turn leads to an improvement in the performance of the network as compared to existing work [31].
The throughput can be increased by increasing the number of UAVs that are connected to the network. Increasing the size of the packets that are sent across all of the nodes is one way to obtain a higher throughput.
As shown in Figure 10, across all numbers of devices, the delay of the proposed work [31] is affected by the number of nodes. The delay increases with the number of devices from 2 s to 5.8 s. However, in our work the delay is mostly fixed, from 1.5 s to 2 s, due to the dynamic nature of proposed algorithm.
The impact of path loss propagation on UAV and rescue center performance is another important consideration. Due to the higher route loss and lower transmitting power of the rescue center, interference caused by the rescue center to the UAV is negligible if the distance between the rescue and UAV is greater than the UAV coverage. Figure 11 shows, for instance, how the route loss grows as UAVs are moved various distances. In the proposed SOA, the path loss is from 32 dB to 59 dB at 1000 m while in the existing method [31] the path loss is reported to be from 44 dB to 69 dB, which is higher.
The collected responses show that disaster and crisis management in a real-time process exceeds the given time in a disaster and crisis management event. Moreover, the peculiar capability of redundancy in the edge devices is the main downside of the conventional framework beyond the incredible success of the SOA.
From a technological point of view, the existing IoT networking paradigms need to be updated so that enhanced UAV sensing, actuation, storage, computing, and reasoning capabilities may be taken into consideration directly. UAV integration into the IoT might be simplified by using the network virtualization function and software-determined networking opportunities.
The findings indicate that the SOA-based mechanism that is proposed performs better than the conventional architecture that is used in a crisis situation [30]. In addition, the explanation for this astounding performance of the SOA-based emergency management system is the utilization of dynamic inertia values that fall somewhere within the range of [0.1, 0.7]. There is no information provided regarding the values of the algorithm’s local or global best parameters, and there is also no characterization of the procedure executed. Additionally, anywhere from ten to one hundred unmanned aerial vehicles (UAVs) will be put to service.
5. Conclusions
This paper presents an SOA-based disaster and crisis management control system to decrease the degree of risk in a disaster situation and to estimate the disaster risk status with the IoT. The primary objective of the proposed model is to optimize the UAV route leading to lower energy utilization. Emergency services civilian applications with greater capacity for UAV and IoT channels. Crisis management is valuable for victims and disaster responders to provide an independent UAV network to provide disaster data. Data of the vital signs of people collected by a UAV are influenced by disasters. In order to carry out a characterization, various performance measures have been examined, including delay, throughput, performance rate, and path loss. The findings demonstrate that the performance is superior to the work that has been carried out previously.
Author Contributions
Conceptualization: W.A., Data curation: W.A., Formal analysis: N.B.H., Funding acquisition: W.A., Investigation, Methodology; Project administration: W.A., Resources, Software, Supervision, Validation: L.A., Visualization, Roles/Writing—original draft: L.A., Writing—Review and editing: L.A. All authors have read and agreed to the published version of the manuscript.
Funding
Deanship of Scientific Research, Qassim University, Saudi Arabia.
Data Availability Statement
Not applicable.
Acknowledgments
Researchers would like to thank the Deanship of Scientific Research, Qassim University for funding publication of this project.
Conflicts of Interest
The authors declare no conflict of interest.
References
- Niu, H.; Lin, Z.; Chu, Z.; Zhu, Z.; Xiao, P.; Nguyen, H.X.; Lee, I.; Al-Dhahir, N. Joint Beamforming Design for Secure RIS-Assisted IoT Networks. IEEE Internet Things J. 2023, 10, 1628–1641. [Google Scholar] [CrossRef]
- Sun, R.; Wang, J.; Cheng, Q.; Mao, Y.; Ochieng, W.Y. A new IMU-aided multiple GNSS fault detection and exclusion algorithm for integrated navigation in urban environments. GPS Solut. 2021, 25, 1–17. [Google Scholar] [CrossRef]
- Abdel-Basset, M.; Mohamed, R.; Elhoseny, M.; Chang, V. Evaluation framework for smart disaster response sys-tems in uncertainty environment. Mech. Syst. Signal Process. 2020, 145, 106941. [Google Scholar] [CrossRef]
- Fu, Y.; Li, C.; Yu, F.R.; Luan, T.H.; Zhao, P.; Liu, S. A Survey of Blockchain and Intelligent Networking for the Metaverse. IEEE Internet Things J. 2023, 10, 3587–3610. [Google Scholar] [CrossRef]
- Shakeel, P.M.; Baskar, S.; Fouad, H.; Manogaran, G.; Saravanan, V.; Xin, Q. Creating Collision-Free Communication in IoT with 6G Using Multiple Machine Access Learning Collision Avoidance Protocol. Mob. Networks Appl. 2020, 26, 969–980. [Google Scholar] [CrossRef]
- Nguyen, N.-T.; Liu, B.-H.; Wang, S.-Y. Network Under Limited Mobile Sensors: New Techniques for Weighted Target Coverage and Sensor Connectivity. In Proceedings of the 2017 IEEE 42nd Conference on Local Computer Networks (LCN), Singapore, 9–12 October 2017; pp. 471–479. [Google Scholar] [CrossRef]
- Yang, Z.; Yu, X.; Dedman, S.; Rosso, M.; Zhu, J.; Yang, J.; Xia, Y.; Tian, Y.; Zhang, G.; Wang, J. UAV remote sensing applications in marine monitoring: Knowledge visualization and review. Sci. Total. Environ. 2022, 838, 155939. [Google Scholar] [CrossRef]
- Sudhakar, S.; Vijayakumar, V.; Kumar, C.S.; Priya, V.; Ravi, L.; Subramaniyaswamy, V. Unmanned Aerial Vehicle (UAV) based Forest Fire Detection and monitoring for reducing false alarms in forest-fires. Comput. Commun. 2020, 149, 1–16. [Google Scholar] [CrossRef]
- Zhang, X.; Wen, S.; Yan, L.; Feng, J.; Xia, Y. A Hybrid-Convolution Spatial–Temporal Recurrent Network For Traffic Flow Prediction. Comput. J. 2022, bxac171. [Google Scholar] [CrossRef]
- Alsamhi, S.; Ma, O.; Ansari, M.; Gupta, S. Collaboration of Drone and Internet of Public Safety Things in Smart Cities: An Overview of QoS and Network Performance Optimization. Drones 2019, 3, 13. [Google Scholar] [CrossRef] [Green Version]
- Andreassen, N.; Borch, O.J.; Sydnes, A.K. Information sharing and emergency response coordination. Saf. Sci. 2020, 130, 104895. [Google Scholar] [CrossRef]
- Mukherjee, A.; Goswami, P.; Khan, M.A.; Manman, L.; Yang, L.; Pillai, P. Energy-Efficient Resource Allocation Strategy in Massive IoT for Industrial 6G Applications. IEEE Internet Things J. 2021, 8, 5194–5201. [Google Scholar] [CrossRef]
- Munusamy, A.; Adhikari, M.; Khan, M.A.; Menon, V.G.; Srirama, S.N.; Alex, L.T.; Khosravi, M.R. Edge-Centric Secure Service Provisioning in IoT-Enabled Maritime Transportation Systems. IEEE Trans. Intell. Transp. Syst. 2023, 24, 2568–2577. [Google Scholar] [CrossRef]
- Froehlich, A.; Tăiatu, C.M. Practical Use of Satellite Data in Support of Human Rights. In Space in Support of Human Rights; Springer: Cham, Switzerland, 2020; pp. 49–124. [Google Scholar] [CrossRef]
- Mohamed, N.; Al-Jaroodi, J.; Jawhar, I.; Idries, A.; Mohammed, F. Unmanned aerial vehicles applications in future smart cities. Technol. Forecast. Soc. Chang. 2020, 153, 119293. [Google Scholar] [CrossRef]
- Melenbrink, N.; Werfel, J.; Menges, A. On-site autonomous construction robots: Towards unsupervised building. Autom. Constr. 2020, 119, 103312. [Google Scholar] [CrossRef]
- Sun, A.Y.; Scanlon, B.R. How can Big Data and machine learning benefit environment and water management: A survey of methods, applications, and future directions. Environ. Res. Lett. 2019, 14, 073001. [Google Scholar] [CrossRef]
- Cui, F. Deployment and integration of smart sensors with IoT devices detecting fire disasters in huge forest envi-ronment. Comput. Commun. 2020, 150, 818–827. [Google Scholar] [CrossRef]
- Yang, P.; Cao, X.; Xi, X.; Du, W.; Xiao, Z.; Wu, D.O. Three-Dimensional Continuous Movement Control of Drone Cells for Energy-Efficient Communication Coverage. IEEE Trans. Veh. Technol. 2019, 68, 6535–6546. [Google Scholar] [CrossRef]
- Na, Z.; Mao, B.; Shi, J.; Wang, J.; Gao, Z.; Xiong, M. Joint trajectory and power optimization for UAV-relay-assisted Internet of Things in an emergency. Phys. Commun. 2020, 41, 101100. [Google Scholar] [CrossRef]
- Miyano, K.; Shinkuma, R.; Mandayam, N.B.; Sato, T.; Oki, E. Utility-based scheduling for multi-UAV search systems in disaster-hit areas. IEEE Access 2019, 7, 26810–26820. [Google Scholar] [CrossRef]
- Akram, T.; Awais, M.; Naqvi, R.; Ahmed, A.; Naeem, M. Multicriteria UAV Base Stations Placement for Disaster Management. IEEE Syst. J. 2020, 14, 3475–3482. [Google Scholar] [CrossRef]
- Zhao, N.; Lu, W.; Sheng, M.; Chen, Y.; Tang, J.; Yu, F.R.; Wong, K.K. UAV-assisted emergency networks in dis-asters. IEEE Wirel. Commun. 2019, 26, 45–51. [Google Scholar] [CrossRef] [Green Version]
- Malandrino, F.; Chiasserini, C.-F.; Casetti, C.; Chiaraviglio, L.; Senacheribbe, A. Planning UAV activities for efficient user coverage in disaster areas. Ad Hoc Networks 2019, 89, 177–185. [Google Scholar] [CrossRef] [Green Version]
- Panda, K.G.; Das, S.; Sen, D.; Arif, W. Design and Deployment of UAV-Aided Post-Disaster Emergency Network. IEEE Access 2019, 7, 102985–102999. [Google Scholar] [CrossRef]
- Lin, Z.; Niu, H.; An, K.; Wang, Y.; Zheng, G.; Chatzinotas, S.; Hu, Y. Refracting RIS-Aided Hybrid Satellite-Terrestrial Relay Networks: Joint Beamforming Design and Optimization. IEEE Trans. Aerosp. Electron. Syst. 2022, 58, 3717–3724. [Google Scholar] [CrossRef]
- Lin, Z.; An, K.; Niu, H.; Hu, Y.; Chatzinotas, S.; Zheng, G.; Wang, J. SLNR-based Secure Energy Efficient Beamforming in Multibeam Satellite Systems. IEEE Trans. Aerosp. Electron. Syst. 2022, PP, 1–4. [Google Scholar] [CrossRef]
- Cao, B.; Li, M.; Liu, X.; Zhao, J.; Cao, W.; Lv, Z. Many-Objective Deployment Optimization for a Drone-Assisted Camera Network. IEEE Trans. Netw. Sci. Eng. 2021, 8, 2756–2764. [Google Scholar] [CrossRef]
- Shi, W.; Li, J.; Xu, W.; Zhou, H.; Zhang, N.; Zhang, S.; Shen, X. Multiple Drone-Cell Deployment Analyses and Optimization in Drone Assisted Radio Access Networks. IEEE Access 2018, 6, 12518–12529. [Google Scholar] [CrossRef]
- Ejaz, W.; Ahmed, A.; Mushtaq, A.; Ibnkahla, M. Energy-efficient task scheduling and physiological assessment in disaster management using UAV-assisted networks. Comput. Commun. 2020, 155, 150–157. [Google Scholar] [CrossRef]
- Alsamhi, S.H.; Shvetsov, A.V.; Kumar, S.; Shvetsova, S.V.; Alhartomi, M.A.; Hawbani, A.; Rajput, N.S.; Srivastava, S.; Saif, A.; Nyangaresi, V.O. UAV Computing-Assisted Search and Rescue Mission Framework for Disaster and Harsh Environment Mitigation. Drones 2022, 6, 154. [Google Scholar] [CrossRef]
Figure 1.
Disaster Monitoring Scenario based on UAV.

Figure 2.
Particle Velocity.

Figure 3.
Disaster position analysis.

Figure 4.
UAV Node Operation.

Figure 5.
IoT-based Disaster Monitoring System.

Figure 6.
Path loss.

Figure 7.
Proposed SOA-based disaster and crisis management system.
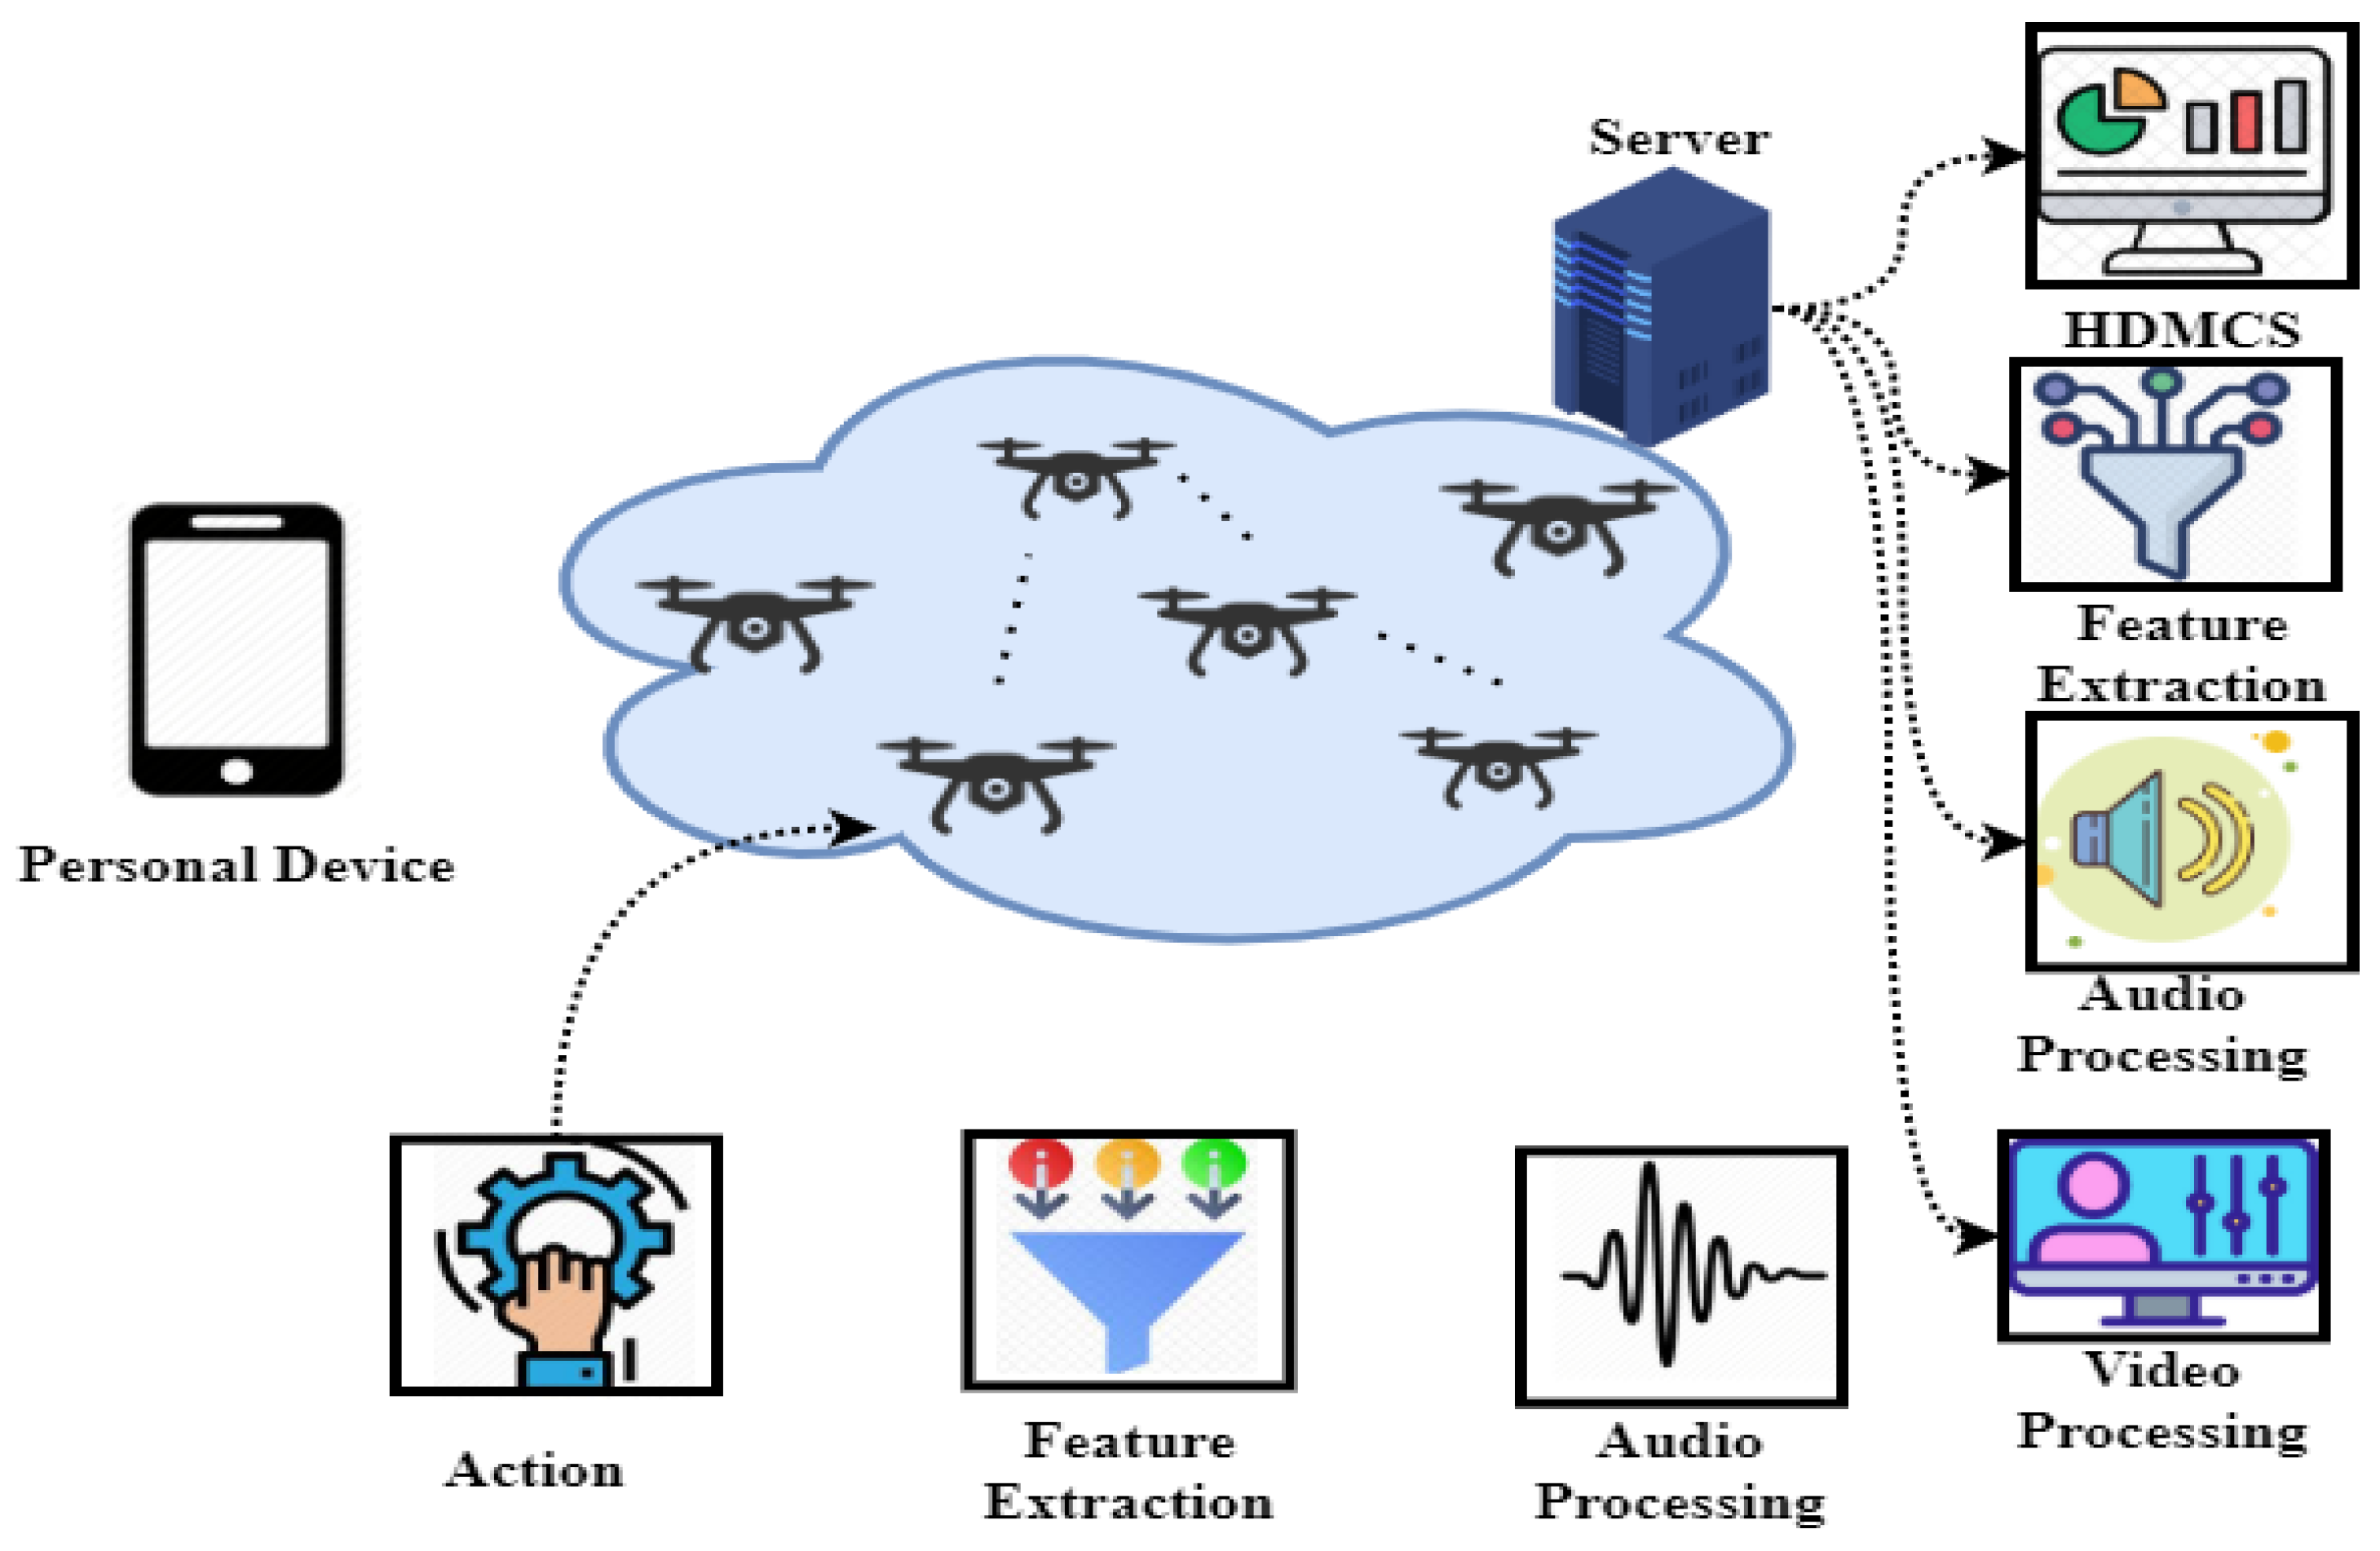
Figure 8.
Comparative analysis of average performance rate.

Figure 9.
Comparative analysis of throughput.

Figure 10.
Comparative analysis of delay.

Figure 11.
Comparative analysis of path loss.


Table 1.
Simulation parameters.
| Parameter | Value |
|---|---|
| Simulation area | 100 m × 100 m |
| Routing algorithm | AODV |
| Size of packet | 1024 bytes |
| Data transmission rate | 100 mbps |
| Radio propagation mode | Standard |
| Model behavior | Mobile |
| Speed of vehicle | 300 m/s |
| Number of nodes | 100 |
Disclaimer/Publisher’s Note: The statements, opinions and data contained in all publications are solely those of the individual author(s) and contributor(s) and not of MDPI and/or the editor(s). MDPI and/or the editor(s) disclaim responsibility for any injury to people or property resulting from any ideas, methods, instructions or products referred to in the content. |
© 2023 by the authors. Licensee MDPI, Basel, Switzerland. This article is an open access article distributed under the terms and conditions of the Creative Commons Attribution (CC BY) license (https://creativecommons.org/licenses/by/4.0/).
Share and Cite
MDPI and ACS Style
Alawad, W.; Halima, N.B.; Aziz, L. An Unmanned Aerial Vehicle (UAV) System for Disaster and Crisis Management in Smart Cities. Electronics 2023, 12, 1051. https://doi.org/10.3390/electronics12041051
AMA Style
Alawad W, Halima NB, Aziz L. An Unmanned Aerial Vehicle (UAV) System for Disaster and Crisis Management in Smart Cities. Electronics. 2023; 12(4):1051. https://doi.org/10.3390/electronics12041051
Chicago/Turabian StyleAlawad, Wedad, Nadhir Ben Halima, and Layla Aziz. 2023. "An Unmanned Aerial Vehicle (UAV) System for Disaster and Crisis Management in Smart Cities" Electronics 12, no. 4: 1051. https://doi.org/10.3390/electronics12041051
Note that from the first issue of 2016, this journal uses article numbers instead of page numbers. See further details here.