
Rulers2023: An Annotated Dataset of Synthetic and Real Images for Ruler Detection Using Deep Learning

Department of Electronic Systems, Vilnius Gediminas Technical University (VILNIUS TECH), 10105 Vilnius, Lithuania
Electronics 2023, 12(24), 4924; https://doi.org/10.3390/electronics12244924
Submission received: 12 November 2023
/
Revised: 5 December 2023
/
Accepted: 5 December 2023
/
Published: 7 December 2023
(This article belongs to the Special Issue Convolutional Neural Networks and Vision Applications - Volume III)
Abstract
:This research investigates the usefulness and efficacy of synthetic ruler images for the development of a deep learning-based ruler detection algorithm. Synthetic images offer a compelling alternative to real-world images as data sources in the development and advancement of computer vision systems. This research aims to answer whether using a synthetic dataset of ruler images is sufficient for training an effective ruler detector and to what extent such a detector could benefit from including synthetic images as a data source. The article presents the procedural method for generating synthetic ruler images, describes the methodology for evaluating the synthetic dataset using trained convolutional neural network (CNN)-based ruler detectors, and shares the compiled synthetic and real ruler image datasets. It was found that the synthetic dataset yielded superior results in training the ruler detectors compared with the real image dataset. The results support the utility of synthetic datasets as a viable and advantageous approach to training deep learning models, especially when real-world data collection presents significant logistical challenges. The evidence presented here strongly supports the idea that when carefully generated and used, synthetic data can effectively replace real images in the development of CNN-based detection systems.
1. Introduction
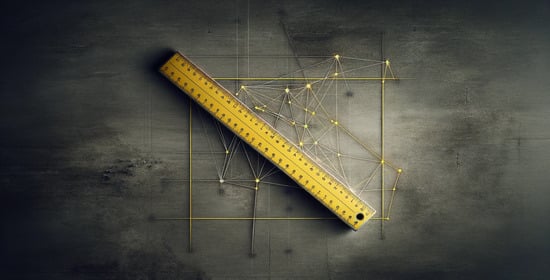
In the domain of computer vision, the ability to detect and analyze specific objects within images is central to a multitude of applications, from augmented reality systems to quality control in manufacturing processes [1,2,3,4,5,6,7,8,9]. One of the seemingly simple but critical objects that demand accurate detection is the measurement ruler. Algorithms for ruler detection, recognition, and interpretation are central to the accuracy and efficacy of systems, facilitating automated, high-precision measurements in fields such as aquaculture [10,11,12,13], environmental monitoring [14,15,16,17,18,19,20], medical diagnostics [21,22,23,24,25,26,27,28,29,30,31,32], forensics [33,34], industry [35,36,37,38], museums [39]. However, the task of detecting rulers in images presents challenges that have not been extensively explored in current research (Figure 1).
One of the steps towards improved ruler detection may be the adoption of synthetic ruler images into the training set. Synthetic images offer a compelling alternative to real-world images as data sources in the development and advancement of deep learning-based computer vision systems [40,41,42,43,44]. Their ability to be generated quickly, in large quantities, and under controlled conditions makes them a highly valuable asset in the rapidly evolving landscape of AI and machine learning [45,46,47,48,49].
1.1. Ruler Detection in Images
Deep learning and computer vision techniques have paved the way for innovative applications related to rulers and measurement, improving accuracy and automation in several domains [35,36,37,38]. In aquaculture, determining the dimensions of fish is vital for effective management [10,11,13]. Traditional methods, which rely on manual measurements using rulers or tapes, are labor-intensive and often subjective [12]. Leveraging deep learning, studies have proposed automated systems that use convolutional neural networks (CNNs) to detect specific regions on a fish’s body to be used as landmarks for fish measurement. By using images of fish alongside rulers or color plates of known dimensions, these systems can automatically calculate the length of the fish. Such systems not only streamline processes in fisheries but also ensure more consistent and accurate data for marine resource management.
Forensics is another domain benefiting from vision system advancements. Traditionally, forensic images required manual calibration using rulers placed within the frame to determine the resolution for accurate measurements. This method, although functional, is prone to errors, especially when the ruler gradations are unclear due to low-contrast or -resolution issues. Contemporary methods now utilize image analysis to automatically detect and estimate ruler directions and gradation spacing in forensic images [33,34]. Museums cataloging ancient coins or artifacts have adopted similar automated methods, utilizing Fourier analysis to determine the scale from a ruler’s characteristic pattern, thus expediting the cataloging process [39].
Automated vision-based measurements are used for urban flooding monitoring and water level dynamics [16,17,19]. Utilizing innovative methods such as surveillance cameras paired with intentionally designed rulers, researchers have proposed ways to measure the depth of urban flooding. These methods, such as binocular and subruler methods, rely on deep learning object detection models to determine the pixel position of floating rulers [14]. As the results indicate, these techniques offer a low-cost solution to monitor urban flooding, especially in areas susceptible to deep-water accumulation. Another notable application is in monitoring water levels in catchment-scale rivers [15]. Although accurate, traditional manual measurements are inefficient, and automatic sensors come with their own challenges. However, leveraging digital image processing tools combined with CNNs makes it possible to batch-process source images and eventually calculate water levels. The proposed methods have been validated, demonstrating their potential as cost-effective and efficient tools for hydrology research and water resource management [18,20].
In the medical field, deep learning has changed the way physicians approach diagnostics [30,31,32], particularly in dermatology and oral health. Photographs of oral lesions, often accompanied by rulers for scale, can be automatically analyzed by algorithms to reduce subjectivity in human assessments [21,22]. Deep learning networks have been developed to identify ruler images in these contexts effectively. Another challenge in dermatology is represented by the dermoscopic images that contain artifacts such as ruler markers, hair, and gel bubbles, which complicate the segmentation of skin lesions. Neural networks that employ encoder–decoder structures to detect such anomalies in skin lesion images, as well as techniques combining deep learning models with traditional image analysis methods, have been proposed to tackle these challenges [23,24,25,26,27,28,29].
Although these studies cover quite diverse applications of rulers for solving various problems, there is a lack of deeper analysis on ruler detection in more complex environments, under strong geometric distortions, as well as a lack of publicly available datasets.
1.2. Synthetic Image Generation for Deep Learning
Synthetic images have several important advantages as training data in the development of deep learning vision systems [50,51,52,53]:
- Data availability and scalability. Traditional methods for collecting real-world images are both time-consuming and expensive. Moreover, the acquisition of high-quality labeled data often requires additional human labor. Synthetic images, on the other hand, can be generated in large quantities with automated labeling, offering a scalable solution for data collection [54].
- Controlled experimental conditions. Among the challenges in using real-world data are the inherent variability and noise, which can introduce confounding factors into experiments. Synthetic images can be generated under controlled conditions, allowing for greater experimental rigor [55].
- Ethical and privacy concerns. Real-world images, especially those involving human subjects, often come with ethical and privacy concerns, including the need for informed consent. Synthetic images, being artificial constructs, bypass these issues, allowing for broader applicability in research [56,57].
There are several key deep learning-based techniques employed in the generation of synthetic image data: generative adversarial networks (GANs), diffusion models (DMs), variational autoencoders (VAEs).
One of the most prevalent techniques for generating synthetic image data is the use of GANs [45,66,67]. These networks consist of two neural network models, the generator and the discriminator [68]. The generator aims to produce synthetic images that closely resemble real-world photographs, while the discriminator’s role is to distinguish between real and generated images. Through a competitive adversarial process, the generator iteratively refines its synthetic images, attempting to fool the discriminator into misclassifying them as real. GANs have been widely adopted for their ability to produce high-quality synthetic images and have applications ranging from art generation to medical imaging.
Another technique that is gaining traction in the generation of synthetic images is the use of diffusion models (DMs) [69,70,71]. Unlike GANs, which generate images in a single forward pass, DMs work through a series of iterative steps to transform an initial noise pattern into a coherent image. This iterative process provides more control over the generation of synthetic data, allowing for a high degree of detail and complexity in the resulting images. DMs have proven effective in tasks requiring gradual image formation and are increasingly being employed in various computer vision applications.
In addition to GANs and DMs, other generative models, such as variational autoencoders (VAEs), autoregressive models, and flow models, are also used to generate synthetic images [72,73,74]. VAEs are particularly effective in scenarios where the generated images must adhere to specific statistical properties. Autoregressive models excel at capturing temporal dependencies in sequential data and are often used in video generation tasks. Flow models are adept at transforming simple probability distributions into complex ones, which makes them helpful in generating intricate synthetic images.
AI-based synthetic image generation techniques, while potent and transformative, are not without limitations. The following key challenges and constraints are associated with these techniques: computational cost, data bias, and ethical concerns, mode collapse, lack of interpretability, difficulty in ensuring quality, and temporal and spatial coherence.
Computational cost is one of the most significant constraints. Training generative models often requires large datasets and substantial computational power. Specialized hardware is usually necessary to facilitate the training process, thereby increasing the barrier to entry for researchers and organizations with limited computational resources.
As a result, the generated synthetic images can perpetuate and even amplify these biases, posing ethical dilemmas. Adding to these challenges is the issue of mode collapse, especially in the context of GANs. Mode collapse occurs when the generator produces a limited variety of images, failing to capture the diversity inherent in the training dataset. This limitation impacts the utility of the generated synthetic images, as they may not be representative of real-world scenarios.
Furthermore, generative models are often criticized for their lack of interpretability. The “black-box” nature of these deep learning-based methods makes it difficult to understand how they arrive at specific outputs, a particularly problematic limitation in fields requiring explainability, such as medical imaging and autonomous driving. Ensuring consistent quality of the generated images is another challenge. Minor changes in model parameters or input data can lead to significant deviations in the quality of the generated images. Lastly, maintaining temporal and spatial coherence in synthetic images is a complex task, especially in applications involving sequential data or multiple object interactions, such as video generation and multiobject tracking.
To address some of these limitations, different non-AI approaches that are based on traditional computer graphics methods may be employed. Synthetic images can be rendered from various angles and under various lighting conditions using 3D models and textures [49,75,76,77,78,79,80,81]. Images can also be generated using algorithms and rules. Some hybrid synthetic image generation approaches include domain adaptation, which enables the transformation of images from one domain to another, combinations of real-world data with synthetic data, and image generation in a simulated environment and adaptation to resemble real-world images.
The landscape of synthetic image generation is diverse, with multiple techniques offering distinct advantages and limitations. The integration of synthetic images into the data pipeline has the potential to revolutionize the field of AI by mitigating many of the limitations associated with real-world data. However, it also cautions that the quality of synthetic images and their ability to faithfully represent real-world complexities are critical factors that need further investigation.
1.3. The Novelty and Contributions of This Work
Advancements in deep learning and computer vision have contributed significantly to the automation and accuracy of measurements across multiple fields, such as aquaculture, forensics, urban flooding monitoring, medical diagnostics, and industry. These developments have replaced or augmented traditional methods, offering more efficient and objective alternatives. However, it should be noted that current research exhibits several gaps. Specifically, there is a lack of in-depth analysis concerning ruler detection against complex backgrounds and under high perspective distortions. Furthermore, no publicly available datasets are tailored for the development of ruler detection algorithms, hindering progress in this subfield. Lastly, the potential of utilizing synthetic data for the development of ruler detection systems remains an unexplored area. These gaps present compelling directions for further research.
To fill these gaps, this research tackles the challenge of rule detection in diverse and complex environments. Ruler detection is the initial step for decoding ruler gradations. With the detection results of ruler markings, the metric scale data can be transferred to the objects being measured.
Developing an accurate and reliable ruler detector that utilizes deep learning algorithms requires a large and diverse training dataset. Achieving an adequately representative dataset that encompasses the many different situations in which rulers are found presents a significant challenge. This research aims to investigate whether using a synthetic dataset of ruler images is sufficient for training an effective ruler detector and to what extent ruler detector development could benefit from using synthetic images as a data source.
The novelty and contributions of this work can be summarized as follows:
- Proposing a method to generate a dataset consisting of synthetic ruler image samples of high fidelity;
- Publicly providing the synthetic ruler image training dataset generated according to the presented method;
- Publicly providing the real ruler image training and test datasets;
- Presenting ruler detection benchmark results using six different CNN architectures;
- Experimentally showing that the created synthetic ruler image dataset is effective, sufficient, and superior to the real image dataset for the development of ruler detectors.
The motivation and challenges for ruler detection in images are summarized in Figure 1.
The paper is organized as follows: In Materials and Methods (Section 2), the proposed method for generating synthetic ruler image data is described; the methodology for evaluating the synthetic dataset is presented; data collection and software tools used in the research are reported. Results and Discussion (Section 3) gives experimental evaluation results of the usefulness and efficacy of synthetic ruler images to develop a deep learning-based ruler detection algorithm and provides an interpretation of the findings and practical implications. Finally, Section 4 gives the conclusions of this work.
2. Materials and Methods
This section details the method for generating synthetic ruler image data and outlining the requirements for synthetic ruler images. In addition, it presents the methodology for evaluating the synthetic dataset using trained convolutional neural network (CNN)-based ruler detectors and describes the process for collecting experimental data.
2.1. Generation of Synthetic Ruler Image Dataset
AI-based synthetic image generation techniques offer significant capabilities but come with inherent limitations. To mitigate these limitations, alternative approaches based on traditional computer graphics methods or hybrid techniques can be employed. These methods utilize 3D models, textures, and algorithms to render synthetic images from various perspectives and under various lighting conditions. Hybrid approaches may further enhance versatility by combining real-world and synthetic data.
This section addresses the creation of a synthetic dataset for training deep learning models in the task of ruler detection within images. Essential requirements for such a dataset are delineated, encompassing aspects such as variability, diversity, image quality, realism, and adherence to legal considerations. These prerequisites guide the generation process to ensure that the synthetic images are both representative of real-world scenarios and conducive to effective model training.
2.1.1. Requirements for Synthetic Ruler Images
When formulating requirements for a synthetic ruler image dataset to train deep learning models, several criteria should be considered to ensure the dataset’s effectiveness and relevance to the intended application. Here are some key requirements to be considered when choosing implementation approaches:
- Variability and diversity: The dataset should include rulers of various lengths, colors, materials (e.g., plastic, metal, wood), and units of measurement (e.g., inches, centimeters). It should also cover a wide range of backgrounds, lighting conditions, and occlusions to mimic real-world scenarios:
- Ruler appearance: Generating rulers of different shapes, colors, materials. Ruler appearance can be simulated by randomly selecting width, height, color, transparency, and gradation marking type and placement from the predefined range of parameter values;
- Perspective and orientation: The dataset should represent rulers from multiple angles and perspectives, including top-down views and side views with varying degrees of perspective distortion. This can be achieved by randomly applying geometric transformations. Transformations (rotation, scaling, perspective distortions) can be introduced during dataset construction and at the time of training as data augmentation procedures;
- Contextual variety: Rulers should be placed in a variety of relevant contexts, such as on different surfaces, alongside common objects of measurement, and within complex scenes, to train the model for practical applications. Contexts can be simulated by using natural images as backgrounds;
- Occlusions: Including images where the ruler is partially obscured or interacting with other objects to simulate realistic use cases where the ruler is not always fully visible. Occlusions can be simulated during the training phase as a data augmentation procedure.
- Balanced image quality and resolution: High-resolution images are necessary to ensure that the measurement markings on the rulers are clear and discernible. On the other hand, unnecessarily large images would waste memory; moreover, image preprocessing for passing to neural networks would consume more time. The chosen input size of the neural network should be considered. Therefore, the resolution of images should be tuned while keeping in mind the maximum input size of the neural network and by leaving enough freedom for various augmentation transformations that enlarge the image regions.
- Realism: While synthetic images need to be diverse and comprehensive, they also need to be realistic enough not to introduce a domain gap when the model is applied to real-world images. The visual evaluation and performance of a ruler detector that is trained on a synthetic dataset provide feedback on realism.
- Consistency in synthetic generation parameters: Ensuring consistent application of synthetic image generation parameters such as lighting, textures, and noise models across the dataset to avoid biases in the training process. Controlled parameter sampling allows for the implementation of this requirement.
- Dataset size and balance: The size of the dataset must be large enough to train deep learning models effectively and should be balanced in terms of the variety of ruler types and scenarios presented.
- Legal considerations: The dataset creation process must adhere to intellectual property laws. It is especially relevant when selecting real background images for the dataset generation process; e.g., the COCO dataset [82] is licensed under a Creative Commons Attribution 4.0 license.
2.1.2. Method for Generating Synthetic Ruler Image Dataset
The method for generating a synthetic ruler image involves the utilization of natural images as backgrounds, onto which a synthetic ruler is superimposed, followed by the simulation of geometric distortions (Figure 2).
Natural background images were sourced from the COCO dataset [82], which is licensed under a Creative Commons Attribution 4.0 license, which allows free distribution, modification, and use of copyrighted work, as long as the original creator is credited for the original creation. To generate image background variability, the original COCO image was randomly cropped. Employing a natural image as a background simulates ruler usage in various complex natural environments. Detecting a ruler in complex environments necessitates the ruler detector’s ability to extract robust and relevant features and to use these features to discriminate the ruler object from the other various non-ruler objects.
Synthetic rulers were superimposed on these background images. Their appearance was characterized by randomly determined parameters within certain ranges. To imitate various situations of possible different camera angles while capturing rulers in complex scenes, geometric distortions were applied to the generated images. A representative subset of synthetic ruler images from the training set is shown in Figure A2.
The detailed steps for generating the synthetic ruler image are outlined in Figure 2 and are as follows:
- Background preparation. The real image from the COCO dataset was randomly cropped and resized to px image size. The crop box was defined by randomly shifting the corner coordinates of the original image () by a maximum of 20% of the width/height of the image.
- Definition of the ruler area. The location of the ruler was designated in the pixel background area and centered. The length of the ruler, which is the longer dimension, was randomly chosen to be between 70% and 95% of the background width, while the width of the ruler, which is the shorter dimension, was randomly selected to be between 4% and 20% of the background height.
- Setup of the appearance of the rule. A set of random parameters that determined the visual attributes of the ruler was generated. The color of the ruler was defined in the HSV color space, where a triplet of values within the ranges of , , and was drawn randomly. The transparency level was established by selecting a "face alpha" value from the interval . The curvature at the corners of the ruler was set by choosing a value for the curvature parameter of the rectangle from the range . The areas for measurement markings, or gradations, were specified to be between 85% and 100% of the ruler’s length, with the width set at 30% to 45% for double-sided rulers or 40% to 60% for single-sided rulers. The decision to use a single-sided or double-sided ruler was made at random. The positions of the gradation areas were also randomly adjusted, with a shift of % from the edge of the ruler. The length of the ruler scale was chosen to fall within the range of measurement units. Subdivisions of the ruler scale, indicating tick positions, were selected from sets of , , or . For rulers with three-level subdivisions, the tick lengths were set to % of the width of the gradation area. For those with two-level subdivisions, tick lengths were determined to be %, %, or % of the width of the gradation area.
- Adding geometric distortions. The perspective transformation was simulated by randomly selecting ruler corner shifts and fitting the geometric transformation to those corner coordinate shifts. Each corner coordinate of the ruler was randomly shifted up/down by up to 20% of the ruler width and right/left by up to 10% of the ruler length. In addition, one of the ends of the ruler was widened by a value corresponding to the length up to the initial width of the ruler.
2.2. Synthetic Data Evaluation
The evaluation of the synthetic ruler dataset was a key part of this research. Central to the investigation was the determination of whether a synthetic dataset of ruler images suffices for the training of an effective ruler detection algorithm and to what extent the development of such a detector could benefit from the inclusion of synthetic images.
To address these questions, three training configurations were used: training using a synthetic image dataset (referred to as “synthetic-train” dataset), training using a dataset composed of real images (denoted “real-train”), and training using a mixed dataset containing both synthetic and real images. CNN-based ruler detection algorithms were then developed using these datasets. The performance of these detectors was subsequently compared by employing a real image test set (“real-test”), alongside a selected performance metric. The overall block diagram of the experiment is depicted in Figure 3.
The metric chosen for this evaluation was Intersection over Union (IoU). IoU is particularly relevant for measuring object detection accuracy, as it measures the extent of overlap between the predicted and actual locations of rulers within images. To avoid the intricacies and potential biases that hyperparameter tuning for each model could introduce, the progression of the validation IoU score was monitored throughout the training period.
A range of CNN architectures was trained to gain a comprehensive understanding of performance across different network structures. Six distinct CNN models, each with varying complexities and capabilities (a summary of the backbones used is presented in Table 1), were subjected to a series of experimental scenarios. These scenarios were designed to investigate the impact of different data combinations and training durations on the models’ ability to detect rulers in images.
The designed experimental scenarios (benchmarks) were the following:
- Training MobileNetV2 for 200 epochs using transfer learning or “from scratch”;
- Training MobileNetV2 for 200 epochs using transfer learning or “from scratch” with 5-fold cross-validation.
The initial scenario applied transfer learning, harnessing pre-trained model weights to expedite convergence on task-specific features. Keras pre-trained deep learning models were used in transfer learning (https://keras.io/api/applications/ (accessed on 21 August 2023)). Subsequent scenarios involved the extended training of the MobileNetV2 model, both using transfer learning and training from scratch, to gain insight into the benefits of extended training and the importance of initial weight configurations.
The number of training epochs was determined empirically based on initial experiments aimed at balancing computational efficiency and achieving near convergence in the validation curves. For transfer learning applications, a duration of 100 epochs was set, while models trained from scratch were trained for 200 epochs to facilitate comprehensive learning. All experiments used epochs of 500 steps and a batch size of 64.
To ensure the reliability of the results, each model underwent five training iterations. This repetition was essential to reducing anomalies resulting from randomness within the model initialization and training process and to establish a strong statistical foundation for subsequent analysis and discussion.
The training workflow involved the same image augmentations regardless of the training dataset used. The augmentation pipeline was built using the following transformations from the Albumentations package: (a) one of: ChannelShuffle, ColorJitter, Sharpen, RandomBrightnessContrast; (b) RandomSunFlare; (c) ShiftScaleRotate; (d) Perspective; (e) Cutout.
The loss function used was the mean squared error (MSE). It evaluated the difference between the six output values of the CNN and the ground-truth values. The CNN output encoded the position of the rotated bounding box (BBox): the normalized center coordinates ( and ) of the BBox; the normalized width and height of the horizontally aligned BBox; and the rotation of the BBox, represented as and , where is the rotation of the BBox.
All CNNs used had the same regression head attached, which consisted of three Dense layers. Two of these hidden layers consisted of 64 neurons, followed by Batch Normalization and Swish activation layers. The output Dense layer had six linear neurons.
Other training hyperparameters were the following: Optimizer: Adam; learning rate schedule: linearly decreasing from to ; input size: ; batch size: 64; steps per epoch: 500. The original preprocessing functions provided by Keras for each model were used to normalize the input image.
2.3. Data Collection
For the experimental evaluation of the proposed method for generating artificial ruler images (Section 2.1.2), three datasets were compiled: one comprised synthetic images (called “synthetic-train”), and the other two, real ones (“real-train” and “real-test”) (Table 2). Synthetic ruler images (“synthetic-train”) were generated according to the suggested method and were used as the training dataset for developing ruler detectors based on CNN models. Additionally, a real ruler image training set (“real-train”) was gathered to train the same models. Throughout the training process, the real ruler test/validation dataset (“real-test”) was utilized for monitoring and evaluating the performance of the models.
A collection of the datasets used in the current research is summarized in Table 2.
To establish a robust dataset for training and testing ruler detection algorithms, the objective of collecting a representative, unbiased, and varied set of real images was raised. A compiled robust real image test dataset (“real-test”) was needed as a benchmark to evaluate the synthetic ruler image dataset’s (“synthetic-train”) effectiveness in training the algorithm by comparing it to baseline ruler detector models trained on the real image training set. Model comparisons address the research questions of whether synthetic data are sufficient for training a ruler detection algorithm and how training using synthetic data compares to training using real image data.
The real ruler datasets included a wide range of rulers, ensuring diversity in color, material, and gradation markings (Figure 4). The images capture these rulers against a multitude of simple and complex backgrounds, simulating a spectrum of real-world scenarios. The rulers were photographed under diverse lighting conditions to test the algorithm’s resilience to illumination variations. Additionally, the rulers and camera were positioned at different orientations and angles to ensure that the algorithm could recognize rulers irrespective of geometric (perspective) distortions and rulers’ alignment in an image. To further mimic real-world conditions, there were images with partial rulers—rulers cropped by the camera frame. When collecting images for the training dataset, the ruler was moved after each shot to ensure there was no relationship between the background pattern and the ruler position. A representative subset of images of real rulers from the training/test sets are shown in Figure A1.
Photographs were acquired using the smartphone Samsung Galaxy S10 standard Camera App. The abovementioned smartphone has three rear cameras: a main 12 MP ( pixels) wide-angle lens (77°) with dual aperture and dual-pixel focus, a 12 MP ( pixels) telephoto lens (45°) with zoom, and a 16 MP ( pixels) ultra-wide-angle lens (123°). The main camera was used for the most part, although the other cameras also contributed some images to the dataset. The camera settings were left to be automatically configured.
Each image within the datasets features labels indicating key points at the ruler corners and/or at the intersections of the ruler edges with the image borders.
The created ruler image datasets are fully and openly available and can be found at Zenodo: https://doi.org/10.5281/zenodo.10276322 (accessed on 5 December 2023).
2.4. Software Used
The software tools and programming languages used in this research are as follows:
- MATLAB programming and numeric computing platform (version R2022a; The Mathworks Inc., Natick, MA, USA) for the synthetic dataset creation workflow;
- Python (version 3.10.12) (https://www.python.org) (accessed on 21 August 2023) [88], an interpreted, high-level, general-purpose programming language. Used for machine learning applications and for data analysis and visualization;
- TensorFlow with Keras (version 2.10.1) (https://www.tensorflow.org (accessed on 21 August 2023)) [89], an open-source platform for machine learning. Used for the online data augmentation stage of the synthetic dataset creation workflow and for the training/testing of deep learning models;
- Albumentations (version 1.3.1) (https://albumentations.ai (accessed on 21 August 2023)) [90], a Python library for fast and flexible image augmentation. Used for the image augmentations during deep learning model training;
- OpenCV (version 4.8.0) (https://opencv.org/ (accessed on 21 August 2023)) [91], an open-source computer vision library. Used for image input/output and manipulations.
3. Results and Discussion
The aim of this research was to assess the usefulness and efficacy of synthetic ruler images for the development of a deep learning-based ruler detection algorithm. The objective was to determine whether synthetic images alone could be employed within a training dataset or whether real ones should be used. An investigation was conducted to determine the comparison between a dataset consisting entirely of synthetic images and those made up of real rulers, as well as a combination of both.
Three datasets were compiled for this evaluation: a synthetic ruler image dataset (“synthetic-train”) and two datasets of real images, “real-train” for training and “real-test” for validation purposes. The “synthetic-train” images were generated according to the methodology proposed in this article and were used for training CNN model-based ruler detectors. Further, the “real-train” mixed dataset was employed to train the same detection models. The “real-test” dataset was used as a benchmark to evaluate the training effectiveness using different training datasets.
Several experimental scenarios were drafted to compare the training datasets. The first setup was to train six different CNN architectures (MobileNetV2 (alpha = 0.5), MobileNetV2 (alpha = 0.75), MobileNet, NASNetMobile, ResNet50, EfficientNetB0) for 100 epochs using transfer learning. The second scenario was to train the MobileNetV2 model for 200 epochs using transfer learning and from scratch. The third benchmark, which was an extension of the second setup, was to train the MobileNetV2 model for 200 epochs in a five-fold cross-validation (CV) manner, using transfer learning and from scratch. The results of all benchmarks are presented in Figure 5, Figure 6 and Figure 7 and summarized in Table 3.
The validation IoU score was used as a metric to compare the performance of the models trained in different scenarios. To eliminate the need to find optimal hyperparameters for each model, the evolution of the validation IoU score was tracked throughout the training process. The comparison of models at single points (fully trained models) would have required that each model had individually tuned optimal hyperparameters. The reliable discovery of optimal hyperparameters would have had to be separate research and was out of scope of the current research.
The training of each model was repeated five times to smooth out the variations in the curves and gather statistics on training results. The graphs in Figure 5, Figure 6 and Figure 7 present the means and 95% confidence intervals depicted by translucent error bands.
The main message from all the graphs is that the synthetic dataset is consistently superior to the real dataset. Figure 5 presents the results of the first experimental scenario. The graphs are the validation IoU scores of six CNN models during training.
Figure 6 shows the results of the second experimental scenario in the second and third plots. This scenario tested how training evolves during transfer learning and training from scratch. The first plot is from Figure 5 and is presented as a reference for a more convenient comparison of the training of 100 vs. 200 epochs.
Lastly, Figure 7 presents the results of the training models in a five-fold cross-validation (CV) manner (third experimental scenario). The results of regular training were added to the graphs for comparison purposes. As can be seen in the CV experiments, there is a difference between the validation performance of the models trained on CV folds when tested on subsets of the training set and on the test set. Essentially, this indicates that the model’s inability to perform adequately on “real-test” is not due to the flawed training setup but rather due to the model’s adaptation to the background and its inability to function with a changed background. During the CV experiment, when data from the same “real-train” set were used for both training and validation, the model was able to achieve the performance of models trained on “synthetic-train” data. This means that the “synthetic-train” data were able to simulate the data statistics from the “real-test” dataset. It is worth noting that “real-train” and “real-test” differ only in backgrounds.
The differences between the “synthetic-train” and mixed training sets are insignificant and inconsistent. Longer training is needed to highlight the differences, if any. However, if even small improvements are valuable, the current results suggest that mixed datasets could provide a small increase in detector performance if the hyperparameters are carefully tuned.
Although the graphs can be used to draw initial conclusions about the performance of different models in the ruler detection task or to compare the influence of some hyperparameters (number of epochs, MobileNetV2 model size, and model initialization type) on the models’ performance, these results should be treated as initial (exploratory) results, because it is unclear what the optimal hyperparameters should be, i.e., the models’ performance is not compared with their optimal hyperparameters. The most promising hyperparameters to check would be number of epochs (increase), learning rate schedule (tuning), input image size (increase), data augmentation pipeline (tuning).
Further research could explore the conditions under which synthetic and mixed data can be optimized to enhance ruler detector performance. Potential strategies for improving synthetic image generation include enhancing the realism of synthetic images using hybrid methods that combine real and synthetic data and exploring advanced generative techniques like generative adversarial networks and variational autoencoders. Additional investigations may also examine the scalability of these findings in other areas of object detection, expanding the use of synthetic data in machine learning. Yet another research direction could be comparing the performance of handcrafted features and deep representations in ruler detection, especially in out-of-distribution conditions [92,93,94,95,96].
4. Conclusions
The aim of this research was to evaluate the usefulness and efficacy of synthetic ruler images for the development of a deep learning-based ruler detection algorithm. The research utilized three datasets: a synthetic one (“synthetic-train”) and two real ones (“real-train” for training and “real-test” for validation). The synthetic dataset was generated using the proposed method. The real ruler datasets included a comprehensive range of rulers, ensuring diversity in color, material, and a variety of simple and complex backgrounds. All datasets have been made publicly available.
The experimental designs were diverse and included the training of six CNN architectures using transfer learning and training from scratch. It was found that the synthetic dataset yielded superior results in training the CNN models compared with the real image dataset. The use of a mixed dataset, integrating both synthetic and real images, did not provide significant and consistent performance improvements beyond what was achieved with the synthetic dataset alone. This result underscores the potential of high-quality synthetic data to be sufficient as the sole training material for this specific application, eliminating the need for costly and time-consuming real-world data collection.
The results support the utility of synthetic datasets as a viable and advantageous approach to training deep learning models, especially when real-world data collection presents significant logistical challenges. The evidence presented here strongly supports the notion that synthetic data, when carefully generated and used, can effectively replace real images in the development of CNN-based detection systems.
Funding
This research received no external funding.
Institutional Review Board Statement
Not applicable.
Informed Consent Statement
Not applicable.
Data Availability Statement
The created ruler image datasets are fully and openly available and can be found at Zenodo: (https://doi.org/10.5281/zenodo.10276322) (accessed on 5 December 2023).
Conflicts of Interest
The author declares no conflict of interest.
Abbreviations
The following abbreviations are used in this manuscript:
| ML | Machine learning |
| DL | Deep learning |
| AI | Artificial intelligence |
| ANN | Artificial neural network |
| CNN | Convolutional neural network |
| DNN | Deep neural network |
| GAN | Generative adversarial network |
| DM | Diffusion model |
| VAE | Variational autoencoder |
| LR | Learning rate |
| MSE | Mean squared error |
| BBox | Bounding box |
Appendix A
Figure A1.
A representative subset of real ruler images.


Figure A2.
A representative subset of synthetic ruler images.

References
- Deng, J.; Xuan, X.; Wang, W.; Li, Z.; Yao, H.; Wang, Z. A review of research on object detection based on deep learning. Proc. J. Phys. Conf. Ser. Iop Publ. 2020, 1684, 012028. [Google Scholar] [CrossRef]
- Diwan, T.; Anirudh, G.; Tembhurne, J.V. Object detection using YOLO: Challenges, architectural successors, datasets and applications. Multimed. Tools Appl. 2023, 82, 9243–9275. [Google Scholar] [CrossRef] [PubMed]
- Tamulionis, M.; Sledevič, T.; Abromavičius, V.; Kurpytė-Lipnickė, D.; Navakauskas, D.; Serackis, A.; Matuzevičius, D. Finding the Least Motion-Blurred Image by Reusing Early Features of Object Detection Network. Appl. Sci. 2023, 13, 1264. [Google Scholar] [CrossRef]
- Pathak, A.R.; Pandey, M.; Rautaray, S. Application of deep learning for object detection. Procedia Comput. Sci. 2018, 132, 1706–1717. [Google Scholar] [CrossRef]
- Plonis, D.; Katkevičius, A.; Mališauskas, V.; Serackis, A.; Matuzevičius, D. Investigation of New Algorithms for Estimation of Losses in Microwave Devices Based on a Waveguide or a Meander Line. Acta Phys. Pol. A 2016, 129, 414–424. [Google Scholar] [CrossRef]
- Žuraulis, V.; Matuzevičius, D.; Serackis, A. A method for automatic image rectification and stitching for vehicle yaw marks trajectory estimation. Promet-Traffic Transp. 2016, 28, 23–30. [Google Scholar] [CrossRef]
- Xiao, Y.; Tian, Z.; Yu, J.; Zhang, Y.; Liu, S.; Du, S.; Lan, X. A review of object detection based on deep learning. Multimed. Tools Appl. 2020, 79, 23729–23791. [Google Scholar] [CrossRef]
- Varna, D.; Abromavičius, V. A System for a Real-Time Electronic Component Detection and Classification on a Conveyor Belt. Appl. Sci. 2022, 12, 5608. [Google Scholar] [CrossRef]
- Sledevič, T.; Serackis, A.; Plonis, D. FPGA Implementation of a Convolutional Neural Network and Its Application for Pollen Detection upon Entrance to the Beehive. Agriculture 2022, 12, 1849. [Google Scholar] [CrossRef]
- Sharaff, A.; Ukey, K.S.; Choure, R.; Couradiya, A.; Sinha, G. Automatic dimension detection of fish images. In Proceedings of the Data Driven Approach Towards Disruptive Technologies: Proceedings of MIDAS 2020, Dehradun, India, 4–5 September 2020; Springer: Berlin/Heidelberg, Germany, 2021; pp. 49–59. [Google Scholar]
- Konovalov, D.A.; Saleh, A.; Efremova, D.B.; Domingos, J.A.; Jerry, D.R. Automatic weight estimation of harvested fish from images. In Proceedings of the 2019 Digital Image Computing: Techniques and Applications (DICTA), Perth, Australia, 2–4 December 2019; pp. 1–7. [Google Scholar]
- Tseng, C.H.; Hsieh, C.L.; Kuo, Y.F. Automatic measurement of the body length of harvested fish using convolutional neural networks. Biosyst. Eng. 2020, 189, 36–47. [Google Scholar] [CrossRef]
- Konovalov, D.; Domingos, J.; Bajema, C.; White, R.; Jerry, D. Ruler detection for automatic scaling of fish images. In Proceedings of the International Conference on Advances in Image Processing, Bangkok, Thailand, 25–27 August 2017; pp. 90–95. [Google Scholar]
- Liu, S.; Zheng, W.; Wang, X.; Xiong, H.; Cheng, J.; Yong, C.; Zhang, W.; Zou, X. A novel depth measurement method for urban flooding based on surveillance video images and a floating ruler. Natural Hazards 2023, 1–23. [Google Scholar] [CrossRef]
- Dou, G.; Chen, R.; Han, C.; Liu, Z.; Liu, J. Research on water-level recognition method based on image processing and convolutional neural networks. Water 2022, 14, 1890. [Google Scholar] [CrossRef]
- Qiu, R.; Cai, Z.; Chang, Z.; Liu, S.; Tu, G. A two-stage image process for water level recognition via dual-attention CornerNet and CTransformer. Vis. Comput. 2023, 39, 2933–2952. [Google Scholar] [CrossRef]
- Bai, G.; Hou, J.; Zhang, Y.; Li, B.; Han, H.; Wang, T.; Hinkelmann, R.; Zhang, D.; Guo, L. An intelligent water level monitoring method based on SSD algorithm. Measurement 2021, 185, 110047. [Google Scholar] [CrossRef]
- Lin, Y.T.; Lin, Y.C.; Han, J.Y. Automatic water-level detection using single-camera images with varied poses. Measurement 2018, 127, 167–174. [Google Scholar] [CrossRef]
- Zhang, Z.; Zhou, Y.; Liu, H.; Gao, H. In-situ water level measurement using NIR-imaging video camera. Flow Meas. Instrum. 2019, 67, 95–106. [Google Scholar] [CrossRef]
- Chen, G.; Bai, K.; Lin, Z.; Liao, X.; Liu, S.; Lin, Z.; Zhang, Q.; Jia, X. Method on water level ruler reading recognition based on image processing. Signal Image Video Process. 2021, 15, 33–41. [Google Scholar] [CrossRef]
- Xue, Z.; Yu, K.; Pearlman, P.C.; Pal, A.; Chen, T.C.; Hua, C.H.; Kang, C.J.; Chien, C.Y.; Tsai, M.H.; Wang, C.P.; et al. Automatic detection of oral lesion measurement ruler toward computer-aided image-based oral cancer screening. In Proceedings of the 2022 44th Annual International Conference of the IEEE Engineering in Medicine & Biology Society (EMBC), Glasgow, PA, USA, 21–29 May 2022; pp. 3218–3221. [Google Scholar]
- Xue, Z.; Yu, K.; Pearlman, P.; Chen, T.C.; Hua, C.H.; Kang, C.J.; Chien, C.Y.; Tsai, M.H.; Wang, C.P.; Chaturvedi, A.; et al. Extraction of Ruler Markings For Estimating Physical Size of Oral Lesions. In Proceedings of the 2022 26th International Conference on Pattern Recognition (ICPR), Montreal, QC, Canada, 21–25 August 2022; pp. 4241–4247. [Google Scholar]
- Lama, N.; Kasmi, R.; Hagerty, J.R.; Stanley, R.J.; Young, R.; Miinch, J.; Nepal, J.; Nambisan, A.; Stoecker, W.V. ChimeraNet: U-Net for hair detection in dermoscopic skin lesion images. J. Digit. Imaging 2023, 36, 526–535. [Google Scholar] [CrossRef]
- Kasmi, R.; Hagerty, J.; Young, R.; Lama, N.; Nepal, J.; Miinch, J.; Stoecker, W.; Stanley, R.J. SharpRazor: Automatic removal of hair and ruler marks from dermoscopy images. Ski. Res. Technol. 2023, 29, e13203. [Google Scholar] [CrossRef]
- Ünver, H.M.; Ayan, E. Skin lesion segmentation in dermoscopic images with combination of YOLO and grabcut algorithm. Diagnostics 2019, 9, 72. [Google Scholar] [CrossRef]
- Abbas, Q.; Fondón, I.; Rashid, M. Unsupervised skin lesions border detection via two-dimensional image analysis. Comput. Methods Programs Biomed. 2011, 104, e1–e15. [Google Scholar] [CrossRef] [PubMed]
- Jaisakthi, S.M.; Mirunalini, P.; Aravindan, C. Automated skin lesion segmentation of dermoscopic images using GrabCut and k-means algorithms. IET Comput. Vis. 2018, 12, 1088–1095. [Google Scholar] [CrossRef]
- Öztürk, Ş.; Özkaya, U. Skin lesion segmentation with improved convolutional neural network. J. Digit. Imaging 2020, 33, 958–970. [Google Scholar] [CrossRef] [PubMed]
- Hameed, A.; Umer, M.; Hafeez, U.; Mustafa, H.; Sohaib, A.; Siddique, M.A.; Madni, H.A. Skin lesion classification in dermoscopic images using stacked Convolutional Neural Network. J. Ambient. Intell. Humaniz. Comput. 2021, 14, 3551–3565. [Google Scholar] [CrossRef]
- Chen, C.; Kojcev, R.; Haschtmann, D.; Fekete, T.; Nolte, L.; Zheng, G. Ruler based automatic C-arm image stitching without overlapping constraint. J. Digit. Imaging 2015, 28, 474–480. [Google Scholar] [CrossRef] [PubMed]
- Gooßen, A.; Schlüter, M.; Hensel, M.; Pralow, T.; Grigat, R.R. Ruler-based automatic stitching of spatially overlapping radiographs. In Proceedings of the Bildverarbeitung für die Medizin 2008: Algorithmen—Systeme—Anwendungen Proceedings des Workshops vom 6. bis 8. April 2008 in Berlin; Springer: Berlin/Heidelberg, Germany, 2008; pp. 192–196. [Google Scholar]
- Jaworski, N.; Farmaha, I.; Marikutsa, U.; Farmaha, T.; Savchyn, V. Implementation features of wounds visual comparison subsystem. In Proceedings of the 2018 XIV-th International Conference on Perspective Technologies and Methods in MEMS Design (MEMSTECH), Lviv, Ukraine, 18–22 April 2018; pp. 114–117. [Google Scholar]
- Gertsovich, I.; Nilsson, M.; Bartunek, J.; Claesson, I. Automatic estimation of a scale resolution in forensic images. Forensic Sci. Int. 2018, 283, 58–71. [Google Scholar] [CrossRef]
- Bhalerao, A.; Reynolds, G. Ruler detection for autoscaling forensic images. Int. J. Digit. Crime Forensics (IJDCF) 2014, 6, 9–27. [Google Scholar] [CrossRef]
- Tian, F.; Zhao, Y.; Che, X.; Zhao, Y.; Xin, D. Concrete crack identification and image mosaic based on image processing. Appl. Sci. 2019, 9, 4826. [Google Scholar] [CrossRef]
- Lukashchuk, B. Method of automatic identification of ruler scales on images to solve the problem of estimating the geometric dimensions of certain objects. In Proceedings of the 2022 IEEE 3rd KhPI Week on Advanced Technology (KhPIWeek), Kharkiv, Ukraine, 3–7 October 2022; pp. 1–4. [Google Scholar]
- Jun, S. Research on Image Measuring method based on monocular camera and Ruler. In Proceedings of the 2015 Conference on Informatization in Education, Management and Business (IEMB-15), Guangzhou, China, 12–13 September 2015; Atlantis Press: Amsterdam, The Netherlands, 2015; pp. 150–155. [Google Scholar]
- Telahun, M.; Sierra-Sossa, D.; Elmaghraby, A.S. Heuristic Analysis for In-Plane Non-Contact Calibration of Rulers Using Mask R-CNN. Information 2020, 11, 259. [Google Scholar] [CrossRef]
- Herrmann, M.; Zambanini, S.; Kampel, M. Image based measurement of ancient coins. In Proceedings of the VAST, Washington, DC, USA, 30 October–1 November 2007; Volume 7, pp. 55–62. [Google Scholar]
- Dunn, K.W.; Fu, C.; Ho, D.J.; Lee, S.; Han, S.; Salama, P.; Delp, E.J. DeepSynth: Three-dimensional nuclear segmentation of biological images using neural networks trained with synthetic data. Sci. Rep. 2019, 9, 18295. [Google Scholar] [CrossRef]
- Kriese, J.; Hoeser, T.; Asam, S.; Kacic, P.; Da Ponte, E.; Gessner, U. Deep Learning on Synthetic Data Enables the Automatic Identification of Deficient Forested Windbreaks in the Paraguayan Chaco. Remote Sens. 2022, 14, 4327. [Google Scholar] [CrossRef]
- Ge, N.; Liu, Y.; Xu, X.; Zhang, X.; Jiang, M. A Fast Generative Adversarial Network for High-Fidelity Optical Coherence Tomography Image Synthesis. Photonics 2022, 9, 944. [Google Scholar] [CrossRef]
- Matuzevičius, D. Synthetic Data Generation for the Development of 2D Gel Electrophoresis Protein Spot Models. Appl. Sci. 2022, 12, 4393. [Google Scholar] [CrossRef]
- Sa, I.; Lim, J.Y.; Ahn, H.S.; MacDonald, B. deepNIR: Datasets for generating synthetic NIR images and improved fruit detection system using deep learning techniques. Sensors 2022, 22, 4721. [Google Scholar] [CrossRef] [PubMed]
- Park, S.W.; Ko, J.S.; Huh, J.H.; Kim, J.C. Review on generative adversarial networks: Focusing on computer vision and its applications. Electronics 2021, 10, 1216. [Google Scholar] [CrossRef]
- Figueira, A.; Vaz, B. Survey on synthetic data generation, evaluation methods and GANs. Mathematics 2022, 10, 2733. [Google Scholar] [CrossRef]
- Joshi, I.; Grimmer, M.; Rathgeb, C.; Busch, C.; Bremond, F.; Dantcheva, A. Synthetic data in human analysis: A survey. arXiv 2022, arXiv:2208.09191. [Google Scholar]
- Lu, Y.; Wang, H.; Wei, W. Machine Learning for Synthetic Data Generation: A Review. arXiv 2023, arXiv:2302.04062. [Google Scholar]
- Rasmussen, I.; Kvalsvik, S.; Andersen, P.A.; Aune, T.N.; Hagen, D. Development of a Novel Object Detection System Based on Synthetic Data Generated from Unreal Game Engine. Appl. Sci. 2022, 12, 8534. [Google Scholar] [CrossRef]
- El Emam, K.; Mosquera, L.; Hoptroff, R. Practical Synthetic Data Generation: Balancing Privacy and the Broad Availability of Data; O’Reilly Media: Sebastopol, CA, USA, 2020. [Google Scholar]
- Man, K.; Chahl, J. A Review of Synthetic Image Data and Its Use in Computer Vision. J. Imaging 2022, 8, 310. [Google Scholar] [CrossRef]
- Abufadda, M.; Mansour, K. A survey of synthetic data generation for machine learning. In Proceedings of the 2021 22nd International arab Conference on Information Technology (ACIT), Muscat, Oman, 21–23 December 2021; pp. 1–7. [Google Scholar]
- Yang, Z.; Zhan, F.; Liu, K.; Xu, M.; Lu, S. AI-Generated Images as Data Source: The Dawn of Synthetic Era. arXiv 2023, arXiv:2310.01830. [Google Scholar]
- Ding, K.; Zhou, M.; Wang, H.; Gevaert, O.; Metaxas, D.; Zhang, S. A large-scale synthetic pathological dataset for deep learning-enabled segmentation of breast cancer. Sci. Data 2023, 10, 231. [Google Scholar] [CrossRef] [PubMed]
- Sapkota, B.B.; Popescu, S.; Rajan, N.; Leon, R.G.; Reberg-Horton, C.; Mirsky, S.; Bagavathiannan, M.V. Use of synthetic images for training a deep learning model for weed detection and biomass estimation in cotton. Sci. Rep. 2022, 12, 19580. [Google Scholar] [CrossRef] [PubMed]
- Makrushin, A.; Mannam, V.S.; Dittmann, J. Privacy-Friendly Datasets of Synthetic Fingerprints for Evaluation of Biometric Algorithms. Appl. Sci. 2023, 13, 10000. [Google Scholar] [CrossRef]
- Grande-Barreto, J.; Polanco-Castro, E.; Peregrina-Barreto, H.; Rosas-Mialma, E.; Puig-Mar, C. Generation of Synthetic Images of Trabecular Bone Based on Micro-CT Scans. Information 2023, 14, 375. [Google Scholar] [CrossRef]
- Hartley, Z.K.; French, A.P. Domain adaptation of synthetic images for wheat head detection. Plants 2021, 10, 2633. [Google Scholar] [CrossRef] [PubMed]
- Atapour-Abarghouei, A.; Breckon, T.P. Real-time monocular depth estimation using synthetic data with domain adaptation via image style transfer. In Proceedings of the IEEE Conference on Computer Vision and Pattern Recognition, Salt Lake City, UT, USA, 18–23 June 2018; pp. 2800–2810. [Google Scholar]
- Chatterjee, S.; Hazra, D.; Byun, Y.C.; Kim, Y.W. Enhancement of Image Classification Using Transfer Learning and GAN-Based Synthetic Data Augmentation. Mathematics 2022, 10, 1541. [Google Scholar] [CrossRef]
- Nie, X.; Xu, Z.; Zhang, W.; Dong, X.; Liu, N.; Chen, Y. Foggy lane dataset synthesized from monocular images for lane detection algorithms. Sensors 2022, 22, 5210. [Google Scholar] [CrossRef]
- Ivanovs, M.; Ozols, K.; Dobrajs, A.; Kadikis, R. Improving semantic segmentation of urban scenes for self-driving cars with synthetic images. Sensors 2022, 22, 2252. [Google Scholar] [CrossRef]
- Dunphy, K.; Fekri, M.N.; Grolinger, K.; Sadhu, A. Data augmentation for deep-learning-based multiclass structural damage detection using limited information. Sensors 2022, 22, 6193. [Google Scholar] [CrossRef]
- Zhou, J.; Li, G.; Wang, R.; Chen, R.; Luo, S. A Novel Contrastive Self-Supervised Learning Framework for Solving Data Imbalance in Solder Joint Defect Detection. Entropy 2023, 25, 268. [Google Scholar] [CrossRef]
- Wu, X.; Liang, L.; Shi, Y.; Fomel, S. FaultSeg3D: Using synthetic data sets to train an end-to-end convolutional neural network for 3D seismic fault segmentation. Geophysics 2019, 84, IM35–IM45. [Google Scholar] [CrossRef]
- Rosado, P.; Fernández, R.; Reverter, F. GANs and artificial facial expressions in synthetic portraits. Big Data Cogn. Comput. 2021, 5, 63. [Google Scholar] [CrossRef]
- Aljohani, A.; Alharbe, N. Generating synthetic images for healthcare with novel deep pix2pix gan. Electronics 2022, 11, 3470. [Google Scholar] [CrossRef]
- Pan, Z.; Yu, W.; Yi, X.; Khan, A.; Yuan, F.; Zheng, Y. Recent progress on generative adversarial networks (GANs): A survey. IEEE Access 2019, 7, 36322–36333. [Google Scholar] [CrossRef]
- Pavez, V.; Hermosilla, G.; Silva, M.; Farias, G. Advanced Deep Learning Techniques for High-Quality Synthetic Thermal Image Generation. Mathematics 2023, 11, 4446. [Google Scholar] [CrossRef]
- Wu, W.; Zhao, Y.; Chen, H.; Gu, Y.; Zhao, R.; He, Y.; Zhou, H.; Shou, M.Z.; Shen, C. Datasetdm: Synthesizing data with perception annotations using diffusion models. arXiv 2023, arXiv:2308.06160. [Google Scholar]
- Katakis, S.; Barotsis, N.; Kakotaritis, A.; Tsiganos, P.; Economou, G.; Panagiotopoulos, E.; Panayiotakis, G. Generation of Musculoskeletal Ultrasound Images with Diffusion Models. BioMedInformatics 2023, 3, 405–421. [Google Scholar] [CrossRef]
- Elbattah, M.; Loughnane, C.; Guérin, J.L.; Carette, R.; Cilia, F.; Dequen, G. Variational autoencoder for image-based augmentation of eye-tracking data. J. Imaging 2021, 7, 83. [Google Scholar] [CrossRef]
- Han, Y.J.; Yu, H.J. Fabric defect detection system using stacked convolutional denoising auto-encoders trained with synthetic defect data. Appl. Sci. 2020, 10, 2511. [Google Scholar] [CrossRef]
- Kim, K.; Myung, H. Autoencoder-combined generative adversarial networks for synthetic image data generation and detection of jellyfish swarm. IEEE Access 2018, 6, 54207–54214. [Google Scholar] [CrossRef]
- Matuzevičius, D.; Serackis, A. Three-Dimensional Human Head Reconstruction Using Smartphone-Based Close-Range Video Photogrammetry. Appl. Sci. 2021, 12, 229. [Google Scholar] [CrossRef]
- Zou, Z.; Shi, T.; Li, W.; Zhang, Z.; Shi, Z. Do game data generalize well for remote sensing image segmentation? Remote Sens. 2020, 12, 275. [Google Scholar] [CrossRef]
- Matuzevičius, D.; Serackis, A.; Navakauskas, D. Mathematical models of oversaturated protein spots. Elektron. Elektrotechnika 2007, 73, 63–68. [Google Scholar]
- Berenguel-Baeta, B.; Bermudez-Cameo, J.; Guerrero, J.J. Omniscv: An omnidirectional synthetic image generator for computer vision. Sensors 2020, 20, 2066. [Google Scholar] [CrossRef] [PubMed]
- Li, X.; Wang, K.; Gu, X.; Deng, F.; Wang, F.Y. ParallelEye Pipeline: An Effective Method to Synthesize Images for Improving the Visual Intelligence of Intelligent Vehicles. IEEE Trans. Syst. Man Cybern. Syst. 2023, 53, 5545–5556. [Google Scholar] [CrossRef]
- Zdziebko, P.; Holak, K. Synthetic image generation using the finite element method and blender graphics program for modeling of vision-based measurement systems. Sensors 2021, 21, 6046. [Google Scholar] [CrossRef] [PubMed]
- Seong, H.; Baik, S.; Lee, Y.; Lee, S.; Kim, E. Content swapping: A new image synthesis for construction sign detection in autonomous vehicles. Sensors 2022, 22, 3494. [Google Scholar] [CrossRef] [PubMed]
- Lin, T.; Maire, M.; Belongie, S.J.; Bourdev, L.D.; Girshick, R.B.; Hays, J.; Perona, P.; Ramanan, D.; Doll’a r, P.; Zitnick, C.L. Microsoft COCO: Common Objects in Context. arXiv 2014, arXiv:1405.0312. [Google Scholar]
- Sandler, M.; Howard, A.; Zhu, M.; Zhmoginov, A.; Chen, L.C. Mobilenetv2: Inverted residuals and linear bottlenecks. In Proceedings of the IEEE Conference on Computer Vision and Pattern Recognition, Salt Lake City, UT, USA, 18–23 June 2018; pp. 4510–4520. [Google Scholar]
- Howard, A.G.; Zhu, M.; Chen, B.; Kalenichenko, D.; Wang, W.; Weyand, T.; Andreetto, M.; Adam, H. MobileNets: Efficient Convolutional Neural Networks for Mobile Vision Applications. arXiv 2017, arXiv:1704.04861. [Google Scholar]
- Zoph, B.; Vasudevan, V.; Shlens, J.; Le, Q.V. Learning transferable architectures for scalable image recognition. In Proceedings of the IEEE Conference on Computer Vision and Pattern Recognition, Salt Lake City, UT, USA, 18–23 June 2018; pp. 8697–8710. [Google Scholar]
- He, K.; Zhang, X.; Ren, S.; Sun, J. Deep residual learning for image recognition. In Proceedings of the IEEE Conference on Computer Vision and Pattern Recognition, Las Vegas, NV, USA, 27–30 June 2016; pp. 770–778. [Google Scholar]
- Tan, M.; Le, Q. Efficientnet: Rethinking model scaling for convolutional neural networks. In Proceedings of the International Conference on Machine Learning. PMLR, Long Beach, CA, USA, 9–15 June 2019; pp. 6105–6114. [Google Scholar]
- Van Rossum, G.; Drake, F.L. Python 3 Reference Manual; CreateSpace: Scotts Valley, CA, USA, 2009. [Google Scholar]
- Abadi, M.; Agarwal, A.; Barham, P.; Brevdo, E.; Chen, Z.; Citro, C.; Corrado, G.S.; Davis, A.; Dean, J.; Devin, M.; et al. TensorFlow: Large-Scale Machine Learning on Heterogeneous Systems. 2015. Available online: tensorflow.org (accessed on 21 August 2023).
- Buslaev, A.; Iglovikov, V.I.; Khvedchenya, E.; Parinov, A.; Druzhinin, M.; Kalinin, A.A. Albumentations: Fast and Flexible Image Augmentations. Information 2020, 11, 125. [Google Scholar] [CrossRef]
- Bradski, G. The OpenCV Library. Dr. Dobb’S J. Softw. Tools 2000, 120, 122–125. [Google Scholar]
- Bento, N.; Rebelo, J.; Barandas, M.; Carreiro, A.V.; Campagner, A.; Cabitza, F.; Gamboa, H. Comparing handcrafted features and deep neural representations for domain generalization in human activity recognition. Sensors 2022, 22, 7324. [Google Scholar] [CrossRef] [PubMed]
- El-Gayar, M.; Soliman, H.; Meky, N. A comparative study of image low level feature extraction algorithms. Egypt. Inform. J. 2013, 14, 175–181. [Google Scholar] [CrossRef]
- Alshazly, H.; Linse, C.; Barth, E.; Martinetz, T. Handcrafted versus CNN features for ear recognition. Symmetry 2019, 11, 1493. [Google Scholar] [CrossRef]
- Tsalera, E.; Papadakis, A.; Samarakou, M.; Voyiatzis, I. Feature extraction with handcrafted methods and convolutional neural networks for facial emotion recognition. Appl. Sci. 2022, 12, 8455. [Google Scholar] [CrossRef]
- Hamdi, M.; Senan, E.M.; Jadhav, M.E.; Olayah, F.; Awaji, B.; Alalayah, K.M. Hybrid Models Based on Fusion Features of a CNN and Handcrafted Features for Accurate Histopathological Image Analysis for Diagnosing Malignant Lymphomas. Diagnostics 2023, 13, 2258. [Google Scholar] [CrossRef]
Figure 1.
Illustrated motivation and challenges in ruler detection within images. Rulers, commonly employed as measurement standards, are presented amidst various objects being measured utilizing computer vision (a,b). The presented three cases (a–c) have varying degrees of perspective distortions in images that complicate accurate ruler localization.

Figure 2.
Synthetic ruler image generation method.

Figure 3.
Overall block diagram of the experiment.

Figure 4.
A set of straight-edge rulers used for compilation of real image dataset. This collection showcases all the rulers used to gather a real-world dataset after placing them against varied backgrounds and under different perspective conditions. The set comprises transparent and semi-transparent rulers (a–h), metallic/steel rulers (i–k), and a wooden ruler (l).

Figure 5.
Results of experimental comparison of synthetic, real, and mixed datasets for the development of ruler detectors. The graphs show the dynamics of validation IoU score during the training of 6 different CNN architectures (MobileNetV2 (alpha = 0.5), MobileNetV2 (alpha = 0.75), MobileNet, NASNetMobile, ResNet50, EfficientNetB0). Training lasted for 100 epochs with 500 steps per epoch; batch size: 64. Transfer learning was used here. Each training run was repeated five times; therefore, the graphs present the means and 95% confidence intervals depicted by translucent error bands.

Figure 6.
Results of experimental comparison of synthetic, real, and mixed datasets for the development of ruler detectors. Graphs show the dynamics of the validation IoU score during the training of the MobileNetV2 (alpha = 0.5) CNN. Training lasted for 100 epochs (a) or 200 epochs (b,c) with 500 steps per epoch; batch size: 64. Transfer learning (a) or training from scratch (b,c) was used here. Each training run was repeated five times; therefore, the graphs present the means and 95% confidence intervals depicted by translucent error bands.

Figure 7.
Results of experimental comparison of synthetic and real datasets for the development of ruler detectors. The graphs show the dynamics of the validation IoU score during the training of the MobileNetV2 (alpha = 0.5) CNN. Training lasted for 200 epochs with 500 steps per epoch; batch size: 64. Transfer learning (a) or training from scratch (b) was used here. Each training run was repeated five times in a regular or 5-fold cross-validated (CV) arrangement. The legend points to the curves that are related to CV experiments. The curve “5-fold CV (Train)” denotes the common way of performing CV when the model is trained and tested on the data folds generated from the training set. The curve “5-fold CV (Val)” shows the validation IoU scores acquired by testing the same 5-fold CV models on the test set. The graphs present the means and 95% confidence intervals depicted by translucent error bands.


Table 1.
Summary of the backbones.
| Backbone | Parameters 1 | Depth 2 | Size (MB) 3 | Time (ms) CPU 4 | Time (ms) GPU 4 |
|---|---|---|---|---|---|
| MobileNetV2 (0.5) 5 | 706,224 | 52 | 3.06 | 233.6 | 15.5 |
| MobileNetV2 (0.75) 5 | 1,382,064 | 52 | 5.64 | 363.2 | 19.2 |
| MobileNet (0.5) 5 | 829,536 | 27 | 3.36 | 178.1 | 12.1 |
| NASNetMobile | 4,269,716 | 196 | 17.9 | 585.4 | 44.1 |
| ResNet50 | 23,587,712 | 53 | 90.3 | 1171 | 44.3 |
| EfficientNetB0 | 4,049,571 | 81 | 15.9 | 729.6 | 32.5 |
Number of backbone’s parameters; number of convolutional layers; size of the weights file; time per inference step on CPU/GPU evaluated by averaging 30 batches of size 32, and 10 repetitions (CPU: AMD Ryzen 5 3600 6-Core Processor at 3.59 GHz; RAM: 32 GB; GPU: NVIDIA GeForce RTC 2080 Ti); in parentheses: MobileNet/MobileNetV2 models’ alpha parameter, which controls the width of the network.
Table 2.
Summary of the datasets developed and used in the current research.
| Dataset | No. of Samples | Resolution(s) |
|---|---|---|
| Synthetic-train | 5000 | |
| Real-train | 1901 | |
| Real-test | 810 |
Table 3.
Results of the synthetic, real, and mixed dataset comparison using different scenarios (benchmarks). The table summarizes the results presented in Figure 5 and Figure 6. The results are presented as means of five training repetitions with 95% confidence intervals (CIs). The mean values presented here are the maximum values of the average curves of five 3rd-order polynomials, which are approximations of original validation IoU curves.
| Synthetic-Train | Real-Train | Mixed (All) | ||||
|---|---|---|---|---|---|---|
| Experimental Scenarios | Mean | 95% CI | Mean | 95% CI | Mean | 95% CI |
| MobileNetV2 (0.5), TL, E100 | 0.77 | 0.76–0.79 | 0.66 | 0.62–0.70 | 0.82 | 0.81–0.84 |
| MobileNetV2 (0.75), TL, E100 | 0.77 | 0.76–0.78 | 0.74 | 0.70–0.78 | 0.84 | 0.83–0.86 |
| MobileNet, TL, E100 | 0.83 | 0.81–0.84 | 0.68 | 0.67–0.70 | 0.86 | 0.84–0.87 |
| NASNetMobile, TL, E100 | 0.82 | 0.80–0.83 | 0.67 | 0.63–0.72 | 0.78 | 0.76–0.80 |
| ResNet50, TL, E100 | 0.81 | 0.80–0.82 | 0.61 | 0.57–0.65 | 0.84 | 0.81–0.86 |
| EfficientNetB0, TL, E100 | 0.83 | 0.81–0.85 | 0.73 | 0.71–0.75 | 0.85 | 0.84–0.87 |
| MobileNetV2 (0.5), TL, E200 | 0.84 | 0.83–0.84 | 0.72 | 0.68–0.75 | 0.86 | 0.85–0.88 |
| MobileNetV2 (0.5), FS, E200 | 0.82 | 0.81–0.83 | 0.64 | 0.62–0.66 | 0.80 | 0.79–0.82 |
TL—transfer learning; FS—training from scratch; E100/E200—training for 100/200 epochs; in parentheses: MobileNet/MobileNetV2 models’ alpha parameter, which controls the width of the network.
Disclaimer/Publisher’s Note: The statements, opinions and data contained in all publications are solely those of the individual author(s) and contributor(s) and not of MDPI and/or the editor(s). MDPI and/or the editor(s) disclaim responsibility for any injury to people or property resulting from any ideas, methods, instructions or products referred to in the content. |
© 2023 by the author. Licensee MDPI, Basel, Switzerland. This article is an open access article distributed under the terms and conditions of the Creative Commons Attribution (CC BY) license (https://creativecommons.org/licenses/by/4.0/).
Share and Cite
MDPI and ACS Style
Matuzevičius, D. Rulers2023: An Annotated Dataset of Synthetic and Real Images for Ruler Detection Using Deep Learning. Electronics 2023, 12, 4924. https://doi.org/10.3390/electronics12244924
AMA Style
Matuzevičius D. Rulers2023: An Annotated Dataset of Synthetic and Real Images for Ruler Detection Using Deep Learning. Electronics. 2023; 12(24):4924. https://doi.org/10.3390/electronics12244924
Chicago/Turabian StyleMatuzevičius, Dalius. 2023. "Rulers2023: An Annotated Dataset of Synthetic and Real Images for Ruler Detection Using Deep Learning" Electronics 12, no. 24: 4924. https://doi.org/10.3390/electronics12244924
Note that from the first issue of 2016, this journal uses article numbers instead of page numbers. See further details here.