

AI-Based Aortic Stenosis Classification in MRI Scans
by
 , , and
Luís B. Elvas
1,2,*,
Pedro Águas
1,
Joao C. Ferreira
1,2 ,
,
João Pedro Oliveira
1,3,
Miguel Sales Dias
1 and
and
Luís Brás Rosário
4 1
ISTAR, Instituto Universitário de Lisboa (ISCTE-IUL), 1649-026 Lisbon, Portugal
2
Inov Inesc Inovação—Instituto de Novas Tecnologias, 1000-029 Lisbon, Portugal
3
Instituto de Telecomunicações, 1049-001 Lisbon, Portugal
4
Faculty of Medicine, Lisbon University, Hospital Santa Maria/CHULN, CCUL, 1649-028 Lisbon, Portugal
*
Author to whom correspondence should be addressed.
Electronics 2023, 12(23), 4835; https://doi.org/10.3390/electronics12234835
Submission received: 19 October 2023
/
Revised: 27 November 2023
/
Accepted: 28 November 2023
/
Published: 30 November 2023
(This article belongs to the Special Issue Selected Papers from Young Researchers in AI for Computer Vision)
Abstract
:Aortic stenosis (AS) is a critical cardiovascular condition that necessitates precise diagnosis for effective patient care. Despite a limited dataset comprising only 202 images, our study employs transfer learning to investigate the efficacy of five convolutional neural network (CNN) models, coupled with advanced computer vision techniques, in accurately classifying AS. The VGG16 model stands out among the tested models, achieving 95% recall and F1-score. To fortify the model’s robustness and generalization, we implement various data augmentation techniques, including translation, rotation, flip, and brightness adjustment. These techniques aim to capture real-world image variations encountered in clinical settings. Validation, conducted using authentic data from Hospital Santa Maria, not only affirms the clinical applicability of our model but also highlights the potential to develop robust models with a limited number of images. The models undergo training after the images undergo a series of computer vision and data augmentation techniques, as detailed in this paper. These techniques augment the size of our dataset, contributing to improved model performance. In conclusion, our study illuminates the potential of AI-driven AS detection in MRI scans. The integration of transfer learning, CNN models, and data augmentation yields high accuracy rates, even with a small dataset, as validated in real clinical cases.
1. Introduction
Aortic stenosis (AS) looms as a formidable challenge within the realm of cardiovascular diseases, imposing significant burdens on patients, healthcare systems, and economies worldwide. This progressive condition, characterized by the narrowing and calcification of the aortic valve, impedes the smooth flow of blood from the left ventricle to the aorta. As the valve becomes thickened and rigid, it obstructs blood flow, leading to a cascade of adverse outcomes, including heart failure, strokes, and life-threatening arrhythmias. AS poses a particularly grave threat to the elderly population, with prevalence rates ranging from 6% to 12.4% among older individuals [1,2].
The prevalence of AS is further compounded by the repercussions of the ongoing COVID-19 pandemic, which has reverberated across healthcare systems globally. The pandemic has not only strained healthcare resources but also curtailed access to vital cardiovascular care, resulting in reduced diagnostic rates for AS and other cardiovascular conditions. Paradoxically, while routine diagnoses declined, the pandemic ushered in an unforeseen upsurge in cases of myocardial damage, including the acceleration of AS [3]. Throughout the years of the pandemic, individuals suffering from AS emerged as a population at heightened risk of severe outcomes [4].
In response to this multifaceted challenge, the convergence of cutting-edge medical technologies offers a beacon of hope. Leveraging the capabilities of artificial intelligence (AI) and advanced imaging techniques, such as magnetic resonance imaging (MRI), holds the promise of transformative improvements in AS detection, diagnosis, and treatment. MRI, distinguished for its superior accuracy and reproducibility over conventional methods, has emerged as a reference technique in assessing changes in left ventricular dimensions and function [5].
The transformative potential of AI-powered MRI analysis in AS diagnosis is not limited solely to clinical accuracy. It extends to the liberation of physicians from the shackles of repetitive and time-consuming tasks, allowing them to refocus their expertise on more intricate and intellectually demanding aspects of patient care [5]. The automation of routine tasks through AI-driven analysis alleviates the burden on clinicians, enabling them to invest their time and knowledge in tasks that demand complex decision making and personalized patient management [5]. Convolution neural networks (CNN) were introduced as deep learning algorithms, allowing accurate and fully automated image analysis. These AI-based analyses are considered feasible, reproducible, and demonstrate valuable prognostics in patients with AS disease, saving time and making the clinical routine easier [5]. The fundamental benefit of CNNs over more traditional machine learning (ML) algorithms is that, during training, feature extraction is handled automatically without the need for pre-existing notions about what features to extract. This means, if you have an ML algorithm to train, it needs the images classified with the different features [6]. On the other hand, a deep learning (DL) algorithm will learn the features automatically without any a priori definition [6].
Consequently, this study aims to identify a robust CNN model combined with computer vision techniques for the classification of AS in MRI, utilizing a limited dataset of 99 images, which was later augmented to 202. This scenario gives rise to the research question (RQ): ‘How can we effectively utilize AI to automatically classify MRI scans from patients suffering from AS, given the constraint of a shortage in data?’.
Derived from our RQ, our primary focus is on addressing the challenge of creating a robust CNN model with a limited volume of data. According to the European Parliamentary Research Service, one of the main challenges is the lack of access to vast amounts of data [7]. In response, we introduce a set of data augmentation techniques and computer vision methods. These strategies empower the training of algorithms, enabling them to deliver robust and promising results despite the constraint of limited data.
In summary, AS’s far-reaching impact on both human health and global economies underscores the urgency of innovative solutions. In the ever-evolving landscape of healthcare and medical research, the collaboration between academic institutions and hospitals plays an important role in advancing our understanding of complex medical phenomena, improving patient care, and driving innovation in the field [8]. This paper represents the culmination of a collaborative effort with Hospital Santa Maria (HSM), aimed at contributing to the forefront of healthcare research.
2. State of the Art
Based on the PRISMA (Preferred Reporting Items for Systematic Reviews and Meta-Analyses) approach, this systematic review statement was developed to assist authors in better reporting systematic reviews and meta-analyses [9]. Although PRISMA can also be used as a foundation for presenting systematic reviews of other forms of research, and notable evaluations of therapies, it has been mostly used to report randomized trials. PRISMA might help evaluate published systematic reviews critically.
The search was completed in Scopus and Web of Science Core Collection (WoSCC) databases in October 2022. To conduct this search, a query was created with an interception between the columns with a limitation, only journal papers, articles, and reviews from the last 5 years, and written in English.
After applying the query to both WoS and Scopus databases, 63 documents were found. However, by removing duplicates and excluding some articles without the information needed, only 19 papers were used in this research study. These steps are shown in Figure 1.
With the increasing adoption of AI in medical care, a notable trend in this literature review is the growing number of studies conducted by researchers each year. Upon reviewing the selected articles and analyzing their content, it becomes evident that aortic disease, MRI, and AI are the predominant themes. The majority of the articles focus on MRI as the primary imaging technique, followed by CT scans and echocardiography.
Knowing that the main objective of this research work is to identify aortic stenosis disease by applying AI on cardiac images, a table with a description of the main areas addressed in the papers is summarized in Table 1.
In the field of cardiovascular imaging, the application of AI has led to significant advancements, fundamentally changing the way cardiac diseases are detected and diagnosed [3,6,13,14,18,20,26,32,36,38,42,43,44]. This literature review provides a comprehensive overview of key developments in this dynamic domain.
AI has proven effective in the classification of aortic calcification using MRI, consistently achieving remarkable accuracy rates ranging from 90% to 93% [14]. However, these authors, when discussing the outcomes of applying AI to aortic calcification, do not emphasize the metric of recall, which is particularly crucial in health cases. For instance, if we have 100 cases and aim to identify those with a specific condition, such as cancer, a scenario where the algorithm classifies everyone as healthy could result in an accuracy of 99%. However, the recall in this case would be 0%, highlighting the importance of considering recall in medical contexts.
AI applications, as discussed in [36], hold substantial promise for early detection of cardiovascular risk factors and timely interventions. Extensive literature searches, as evidenced in [18], have unearthed a growing body of studies leveraging AI across MRI and CT modalities. These studies encompass diverse applications, from coronary calcium scoring to prognostic assessments for coronary artery disease, signifying AI’s potential to transform cardiac imaging for screening and monitoring. In this study, the researchers discuss the scarcity of datasets and medical images for AI applications but overlook the potential of data augmentation in addressing this issue. Failure to explore data augmentation may limit the model’s ability to generalize from training data to real-world environments.
Furthermore, review [3] confirms an increase in research in this area, particularly the application of artificial intelligence in imaging patients with valvular heart disease. This method of operation would allow for systematic screening for coronary artery disease as well as continued monitoring of patients who have been diagnosed with coronary artery disease [43].
According to [20], ML techniques, particularly U-Net architectures, have rapidly advanced the evaluation of aortic diseases, revolutionizing aortic segmentation and showing promise in monitoring aortic aneurysm sizes. As mentioned in this article [14], it is underscored how deep learning applied to MRI enhances image quality, automates analysis, and enhances disease detection and prognosis [6]. Moreover, [45] proposes a deep convolutional neural network (DCNN) based on ResNet50 and uses fine-tuning to train the model for object identification.
The authors of [41] developed a densely connected convolutional network (ASTRO-X) to diagnose cardioembolic stroke using chest radiographs, with a good and plausible classification performance of 91% classified as non-cardiac stroke, demonstrating that transfer learning is an effective strategy. Another paper [35] used the Chan–Vese algorithm, with extra techniques providing more emphasis on the illumination of region of interest (ROI), obtaining accurate detection of the LV chamber to diagnose the volume variations for aortic stenosis and detection of heart failure cases. Motion correction was used to obtain better results and image quality in [11]. Reference [38] proposed a fully automatic RV segmentation method that combines the FC-DenseNet and the level set method (FCDL), making per-pixel semantic inference with ground truth, for smoothing and converging contours to improve accuracy. This research faces a data limitation, comprising only 45 cases. To overcome this constraint, the researchers employed data augmentation techniques to enrich their dataset. Furthermore, the same research indicates that the FCDL method outperforms the U-Net + level set (UL), indicating that the FCDL method is an efficient and suitable solution to RV segmentation. In [30], a three-dimensional ResNet with noise reduction was implemented for MRI, achieving 92% F1-score and 97% recall.
Following the research from [1], echocardiography was the primary technique for evaluating aortic disease. However, due to image quality limitations and valve geometry deviations, MRI has gained prominence. To address these challenges, [46] introduces a fully automated machine learning approach, eliminating the need for manual border delineation.
In conclusion, our comprehensive literature review reveals a scarcity of articles and research dedicated to the application of AI in the context of MRI. This lack of prior studies highlights the promising nature of our research in this field. AI integration into cardiovascular imaging represents a transformative era characterized by heightened accuracy, early disease detection, and advanced image analysis capabilities [44]. Moreover, a common challenge among researchers is the acknowledgment of limited data access. To address this issue, some studies overcome the challenge by employing strategies such as data augmentation and transfer learning. These innovations hold immense promise for the diagnosis and monitoring of a broad spectrum of cardiovascular conditions [44].
3. Methods
This research work focuses on the classification of heart MRI scans by identifying aortic valve calcification. We employ the CRISP-DM (Cross-Industry Standard Process for Data Mining) methodology [48] as our guiding framework. CRISP-DM provides a structured and systematic approach for addressing complex issues in the field of computer vision, facilitating a comprehensive and effective analysis of data and its attributes. This methodology spans the entire data mining process, following its specific steps, making it particularly suitable for computer vision applications [49]. These steps encompass problem definition, data collection and understanding, data preparation, cleaning, model development, validation, and utilization to address the research problem at hand. In the subsequent sections, we will delve deeper into each step of the CRISP-DM framework, and the paper is organized to follow this structured approach.
3.1. Business and Data Understanding
In this section, we dive into the foundational aspects of our data to better understand the data we are working with. The data utilized were sourced from Hospital Santa Maria (HSM) and predominantly comprised medical images. Our access to this extensive dataset, containing data from 512,764 patients, was facilitated through our collaboration with the AimHealth project [50]. Furthermore, we ensured the requisite documentation was in place. This included a comprehensive data dictionary, authorization from the CHULN services spanning Cardiology, Intensive Care Medicine, and the Respiratory Intensive Care Unit. Additionally, we acquired the Curriculum Vitae of the respective physicians overseeing the data. In a commitment to data integrity and security, all personnel with access to the data signed a declaration of honor, affirming their adherence to General Data Protection Regulation (GDPR) regulations. These regulations encompassed safeguarding sensitive information, specifying authorized personnel, defining data retention periods, establishing data disposal procedures, and preventing unauthorized utilization in other research contexts without explicit consent, adhering to the principles outlined in both the Declaration of Helsinki and the Oviedo Convention [51].
Upon successfully navigating the bureaucratic tasks, we received access to two data repositories, where (1) a structured database contained an abundance of reports, patient information, medical procedures, medication records, precautions, schedules, as well as other pertinent data, and (2) a vast repository of medical images capturing various diseases, including aortic stenosis, COVID-19, pneumonias, prosthesis-related cases, and fractures. Regrettably, none of these images were labeled. Given our research focus on evaluating MRIs of AS patients, we needed to separate what was relevant from what would be considered useless for our research objectives. This division allowed us to correlate the database with our dataset, making it easier to retrieve relevant information for our study.
In the course of analyzing the medical images supplied by HSM, we observed that they were stored as DICOM files [52]. These files contain essential image metadata, including details such as size, dimensions, bit depth, modality, and parameters related to image capture equipment. Each piece of information is represented by a specific tag, enabling us to apply filters based on patient ID, image type (MRI, CT-Scan, Echo), orientation, and other relevant criteria.
Furthermore, we established a crucial association between the “Patient” and “Diagnoses” tables within the structured database. This association was established through a unique “ID” linked to each diagnosis, which corresponded to the “Patient ID.” This strategic linkage allowed us to selectively acquire data pertaining to patients directly relevant to our research, streamlining the process of filtering the MRIs essential for our investigation.
3.2. Data Preparation
In our quest to access a diverse range of medical images, our aim was to analyze only MRIs of patients suffering from aortic stenosis.
Our first task was to go through the large image pool and isolate those that were relevant to our research. To accomplish this, we conducted a filtering process on each image in the dataset, selecting only MRI scans that show the heart. This filtering was conducted based on the metadata contained within each DICOM file, which offers important information about the image data. In our initial filtering step, we selected images that (1) had the ‘MRI’ image type, represented by the tag (0008,0060) since this tag stores the type of the data originally acquired (for example, CT-scans, MRIs, Audio…) and by (2) the images associated with “heart” examinations using the tag (0018, 0015) representing the “Body Part examined”. This selection was necessary as our study primarily focused on heart MRIs. After filtering, we obtained 20,167 heart MRIs, but with multiple diseases outside of the scope of this work. Given the wide variety of diseases, the selected images (MRIs) still went through another filter, whereby, using an SQL query, we filtered only by the patients that were diagnosed with AS from the database HSM provided for us. To achieve this filtering, we had to obtain the IDs of each patient from the selected MRIs to receive the diagnosis associated with each image. After this complex task, we ended up with 9787 MRIs from 24 patients that were diagnosed with AS. However, our endeavor to obtain images specifically related to aortic stenosis proved to be challenging due to both the complexity of medical knowledge required and the sheer volume of images involved.
To obtain the final MRIs that are relevant to the final dataset, we had two aspects: first, a considerable portion of the acquired images could not be employed due to their inability to reveal the aortic valve, as demonstrated in Figure 2.
To meet this challenge, numerous meetings and discussions were held with the cardiology specialist. These meetings were dedicated to imparting knowledge and carefully analyzing each image to determine if it was suitable for our study. Regrettably, this meticulous selection process culminated in a significantly reduced dataset, with only 91 images with AS of the 9787 MRIs from the last selection, alongside 8 images that were diagnosed without AS. To emphasize the gravity of the situation, it is critical to recognize that a significant amount of time and effort was put into the selection process. Dreadfully, a mere 1% of the initially acquired images found utility in our research. Furthermore, this selection process inadvertently resulted in an imbalanced dataset, adding yet another layer of complexity to our research endeavor. This issue extends beyond our research, potentially affecting others navigating similar paths in the pursuit of medical image analysis.
To compensate for the fact that our dataset was too unbalanced, preventing our model from achieving its full potential and producing the expected outcomes, we introduced a new benchmark dataset, which was also used by the authors in [53]. Subsequently, after finishing and adding the new images to the dataset, the cardiology specialist verified the images to ensure the dataset’s reliability.
This way, our data preparation was completed, having 111 MRI images without aortic stenosis and 91 MRI images with aortic stenosis. In Figure 3, we can see some examples of MRI images with and without aortic stenosis.
With a small dataset of 202 images, including 91 images of AS and 111 images without AS, it is clear that the limitations of the dataset size may prevent this study from achieving the intended research results.
Recognizing the limitations of our small dataset, and to improve its resilience, we used data augmentation. With this method, we employed four augmentation procedures, each of which aims to create more diverse images without compromising realism in order to improve the final results, where
- We used rotational augmentation to rotate photos at 90-, 180-, and 270-degree angles, depicted in Figure 4. This geometric modification not only increased the size of our dataset by 3 times but also created useful variations in orientation, increasing the information available to our models. We only intended to spin the MRIs at four angles because rotating an MRI to a random degree between those mentioned above would not be realistic because the patient is not in a 15 degree position during the exam, for example. This creates 606 new MRIs out of the original dataset.
- 2.
- We executed translation along the x-axis (Figure 5) while meticulously ensuring that the aortic valve remained within the frame; with this, we created 202 more MRIs out of the original dataset.
- 3.
- We applied horizontal flipping (Figure 6), further diversifying our dataset by creating mirrored counterparts of existing images. With this process, we created 202 more MRIs and also introduced new perspectives for our models to learn from.
- 4.
- Recognizing by the cardiology specialist the occasional presence of underexposed images, we addressed this issue by enhancing brightness in the images (Figure 7). By compensating for the darker images, we ensured that our dataset covered a wider spectrum of lighting conditions, thus reinforcing the adaptability of our models. With this technique, we created 404 more MRIs.
In summary, these data augmentation strategies helped us overcome the limitations imposed by our initial dataset size. By injecting diversity, variability, and completeness into our dataset, we equipped our models with the necessary ingredients to extract nuanced insights, leading to the refinement and improvement of our research outcomes. With our dataset for each test, we obtained
- 1st test (without data augmentation)—202 images, 91 with calcification and 111 without calcification.
- 2nd test (rotation, flip, and translation)—1212 images, 546 with calcification and 666 without calcification.
- 3rd test (rotation, flip, translation, and brightness)—1616 pictures, 729 with calcification and 888 without calcification.
The entire data preparation process is summarized in Figure 8.
3.3. Modeling
In this section, we strike at the core of our research, utilizing CNNs for the classification of MRI scans to detect AS.
CNNs are an important component of deep learning, achieving excellence in image-related tasks due to their innate ability to learn hierarchical features from input data [54]. Their distinctive architecture, characterized by convolutional layers applying filters to input data for automatic feature extraction, makes CNNs highly effective in capturing subtle patterns and feature hierarchies. These attributes render them ideal for intricate image classification tasks like AS detection.
For this experiment, we developed and implemented our own CNN model, conducting multiple experiments to achieve optimal results. To address the inherent limitations of our dataset, stemming from both the results obtained and the restricted dataset access, we employed CNNs in conjunction with transfer learning and data augmentation techniques. As demonstrated in the literature review, and by previous studies, transfer learning is often employed to overcome the challenge of limited labeled data in medical image analysis [55]. In our experiment, we utilized pre-trained weights from the publicly available ‘ImageNet’ dataset [56], which covers a wide range of classes. Specifically, we selected the VGG16 [57], ResNet-50 [58], and Xception [59] models based on established research findings [45,60,61,62]. In a comprehensive review [63], the authors identified these models as suitable for medical image classification. Additionally, other works, including [61,62], highlight ResNet50 as a suitable algorithm for MRI classification, and [61] not only confirms the efficacy of ResNet50 but also demonstrates the implementation of VGG16.
All the pre-trained models utilized in our investigation required robust feature extraction to distinguish various regions within MRI scans and identify the aortic valve for precise classification. To meet this objective, we augmented each model with four additional dense layers, simplifying training with our data. These adjustments produced promising results, aligning closely with the specific feature requirements of our study.
Nonetheless, certain refinements were deemed necessary to fully use the potential of these models. Given our binary classification task, the model’s output layer featured a single neuron with sigmoid activation. We implemented a five-fold cross-validation strategy to enhance model performance and mitigate overfitting concerns. This process involved randomizing the dataset and training the model five times, ensuring robustness and generalization.
Additionally, we explored the use of fine-tuning, as suggested in the literature review. This technique involves retraining the last layers of the model while keeping the upper layers untrainable, harnessing the pre-trained model’s knowledge and feature extraction capabilities to efficiently adapt it to our specific task—classifying aortic stenosis. This not only enhances model performance but also optimizes time and computing resources.
For modelling, we split our data in the proportion of 80% for training and 20% test to train and test the models [64].
4. Evaluation and Discussion
In this section, we evaluate and compare the results and performance of a newly developed CNN model, and also the results of the three pre-trained CNN models. These tests utilize the dataset created with images from Hospital Santa Maria and from the benchmark dataset [53].
Evaluation of the Models
To evaluate the models and data augmentation techniques, three tests were incrementally conducted on every model, each introducing different types of image augmentation to the previously tested model. This approach aims to demonstrate that these modifications act as add-ons, contributing to improved results in our models. The models in each test remained unmodified and were defined with the following parameters:
- Input shape was defined based on the architecture of each model, where on VGG16 and ResNet50 was (224, 224, 3) and for the Xception was (299, 299, 3).
- The number of batches was set to 32 based on the following Formula (1), where N is the number of samples divided with B the batch size multiplied by E number of epochs [65].
- The number of epochs was set to 30 based on a considerable number of tests. Initially, we began with 10 epochs, but, through experimentation, we observed that the model could be effectively trained for additional epochs without compromising the results. As we increased the number of epochs, we found that not a single test could reach 30 epochs. This was due to the implementation of the early stopping function, indicating that the models were reaching their full capacity. Our early stopping function was defined with a ‘patience’ parameter set to 4. This means that if, during training, we did not see better results for four consecutive epochs, the model would stop. This approach was implemented to reduce overfitting while preserving model performance, ultimately saving both time and computational resources.
As previously mentioned, the model parameters remained consistent across all tests. We employed a progressive data augmentation approach, where each test included all the augmentation techniques from the previous test. Consequently, the number of images increased with each test due to the incremental application of these techniques. This approach allowed us to systematically explore the impact of various augmentation methods on our model’s performance.
- The first test was with the original dataset (without data augmentation) containing 202 MRIs, 91 with calcification and 111 without calcification.
- In the second test, we applied flip, rotation, and translation techniques, ending up with 1212 MRIs, 546 with calcification and 666 without calcification.
- In the third and final test, we added images to the dataset created in the second test using an extra technique known as brightness. The collection now has 1616 MRIs, 729 with calcification and 888 without calcification.
As we work with MRI classification, we seek to reduce the amount of false negatives (FNs) in order to mitigate patient harm, delayed diagnosis, improve treatment, and eliminate legal and ethical consequences for medical professionals and healthcare institutions if an FN diagnosis harms a patient [66]. So, the recall measure is the one with the most weight when evaluating different models and data augmentation strategies. The remaining performance metrics serve as supplementary criteria, poised to serve as tiebreakers in cases where models exhibit similar recall rates.
At the outset of this study, we developed and implemented our custom CNN model. Due to the limited number of images, our optimal architecture consisted of two convolutional layers, each paired with a pooling layer and a hidden layer with 256 neurons, complemented by a dropout layer of 0.3, as depicted on Figure 9. While we experimented with different architectures, including variations in the number of neurons and an additional hidden layer, the chosen architecture consistently yielded superior results. Attempts to increase model complexity led to decreased performance, highlighting the importance of a simpler architecture for better generalization on the test set.
We conducted tests on this model, employing the three different data augmentation techniques mentioned earlier. The results of these tests are detailed in Table 2.
Table 2 illustrates that the third test yielded the best results, underscoring the positive impact of data augmentation on the model. This outcome also emphasizes the importance of a larger dataset to enhance performance. Figure 10 depicts the performances of the third test for both training and testing. It is noticeable that, while the model continues to learn and achieves seemingly perfect results (100%) on the training set, this level of results does not extend to the testing set. This discrepancy suggests that our model struggles to generalize its training insights to the testing set. The test set is the most important since it simulates real-world implementation conditions.
In light of the observed challenges in model generalization, particularly in real-world testing conditions, we recognized the need for a more robust and adaptable approach. Given the limitations revealed by our initial results, where the algorithm struggled to generalize effectively, we turned our attention to the implementation of transfer learning. This strategic shift aims to take advantage of the pre-trained models and their extensive knowledge to enhance our model’s ability to handle diverse and challenging scenarios as we seek to overcome the limitations encountered in the initial model evaluations. As a pivotal step toward improving generalization and model robustness, the incorporation of transfer learning brings a fresh perspective to our approach in addressing the intricacies of aortic stenosis classification in MRI scans.
Consistent with the data augmentation tests outlined in the experiment in Table 2, we have applied these tests to the selected pre-trained models.
The initial test with the original dataset of 202 images revealed distinct performance patterns among the models. VGG16 demonstrated moderate performance, while fine-tuning notably improved its recall, precision, and F1-score. ResNet50 exhibited decent performance, and fine-tuning led to significant enhancements across all metrics. Xception delivered overall good performance, although fine-tuning showed a decrease in all metrics.
Introducing data augmentation techniques (rotation, flip, and translation) with an expanded dataset of 1212 images resulted in notable improvements. VGG16 consistently showed enhanced performance in all metrics. VGG16 with fine-tuning maintained generally good performance, experiencing a slight decrease in recall. ResNet50 consistently achieved high performance across all metrics, with fine-tuning demonstrating excellent results. Xception consistently displayed good performance, and fine-tuning showed a decrease in recall while maintaining good precision and F1-score.
Extending data augmentation to include brightness, with a larger dataset of 1616 images, further refined model performance. VGG16 demonstrated excellent performance across all metrics. VGG16 with fine-tuning exhibited good precision and F1-score, with a slight decrease in recall. ResNet50 maintained good precision and F1-score, with a slight decrease in recall. ResNet50 with fine-tuning demonstrated excellent performance, with a slight decrease in recall. Xception consistently delivered good performance, and fine-tuning resulted in a decrease in recall while maintaining good precision and F1-score.
From these tests, and as summarized in Table 3, data augmentation significantly contributed to enhancing model performance, while fine-tuning generally improved the results. VGG16 and ResNet50 consistently performed well, offering robust performance. Xception, although displaying good performance, exhibited more variability across the tests. The choice of a model may depend on specific study goals, emphasizing the trade-offs between precision and recall.
5. Conclusions
In conclusion, in this article, we have successfully answered the purposed RQ, achieving its primary objectives, which were implemented, and we tested the best CNN model combined with computer vision techniques for the classification of aortic diseases from MRI data. The model’s ability to accurately classify MRI images into categories representing the presence or absence of aortic diseases has been demonstrated, with promising results regarding recall and precision.
As highlighted in the literature review, the application of AI for MRI classification has been relatively scarce. While this presented challenges due to the limited prior knowledge and references, it also unveiled a significant research gap.
Because we did not have a dataset, a great deal of time was invested to create one; this made us deflect our attention to the main RQ in a way that we could not implement more techniques.
Despite the limited number of images, the results of this study are promising. We achieved a recall of 81% with a model specifically developed for this problem, utilizing data augmentation without the incorporation of transfer learning. Having a noticeable overfitting problem in this model, we used pre-trained models, where we tested them with three data augmentation techniques. We can see that, just by employing rotation, flip, and translation techniques (used in the second test), the results improved by 8%, and, with the addition of another data augmentation technique used in the third test, the results improved by 2%, where, in each test, the dataset is also augmenting its size. As a result, the VGG16 model used with the dataset of the third test is the best in detecting AS in MRI scans, with 95% recall and 96% precision.
The outcomes of this study not only advance the field of medical image analysis but also offer practical implications for healthcare. The CNN model combined with the computer vision techniques used has the potential to be a significant tool for radiologists and clinicians in their daily practice, helping to achieve more sensitive, precise, and quick aortic disease diagnosis. As we can see from the results achieved, this application of computer vision and artificial intelligence can reduce the workload of radiologists and clinicians.
Additionally, it highlights the greater potential of computer vision and artificial intelligence to transform healthcare and improve patient outcomes.
In conclusion, this study represents a significant step forward in the attempt to harness the potential of computer vision for identifying and managing aortic diseases, providing hope for more future effective and efficient healthcare procedures.
Future Work
For future research, further improvements and iterations to the work would be beneficial.
As pointed out in this study, our dataset was very limited and not versatile because of the lack of images with different perspectives, so an improved dataset needs to be the focus. The next dataset should incorporate a greater diversity of images from AS, thereby fortifying the model’s ability to deliver precise and reliable disease diagnoses. By exposing the model to a wider spectrum of images, we intend to elevate its diagnostic sensitivity and the trustworthiness of its outcomes.
The application of image segmentation and object detection techniques to identify the aortic valve (ROI) can refine our model’s diagnostic proficiency. The purpose of this addition is to enable precise localization and identification of pathological regions within medical images. This strategic enhancement promises to elevate the diagnostic precision and furnish clinicians with invaluable insights.
Finally, introducing severity assessment will significantly improve patient care and clinical decision making. This implementation will empower our model to evaluate the stage and severity of diseases. As a result, the models will distinguish advanced disease stages, further reducing the medical workload.
Author Contributions
Conceptualization L.B.E. and J.C.F.; methodology, L.B.E. and P.Á.; Validation, L.B.R., M.S.D., J.P.O. and J.C.F.; formal analysis L.B.E., L.B.R., M.S.D., J.P.O. and J.C.F.; writing—original draft preparation, L.B.E. and P.Á.; writing—review and editing, L.B.E., J.C.F., M.S.D. and L.B.R.; supervision, L.B.E., J.C.F. and J.P.O. All authors have read and agreed to the published version of the manuscript.
Funding
This work is partially funded by national funds through FCT—Fundação para a Ciência e Tecnologia, I.P., under the projects FCT UIDB/04466/2020 and FCT DSAIPA/AI/0122/2020 AIMHealth—Mobile Applications Based on Artificial Intelligence. During the development of this work, Luís Elvas was a PhD grant holder, funded by FCT with UI/BD/151494/2021.
Data Availability Statement
The data presented in this study are available in this article.
Conflicts of Interest
The authors declare no conflict of interest.
References
- Da Silveira, J.S.; Smyke, M.; Rich, A.V.; Liu, Y.; Jin, N.; Scandling, D.; Dickerson, J.A.; Rochitte, C.E.; Raman, S.V.; Potter, L.C.; et al. Quantification of aortic stenosis diagnostic parameters: Comparison of fast 3 direction and 1 direction phase contrast CMR and transthoracic echocardiography. J. Cardiovasc. Magn. Reson. 2017, 19, 35. [Google Scholar] [CrossRef]
- Zhang, C.; Liu, J.; Qin, S. Prognostic value of cardiac magnetic resonance in patients with aortic stenosis: A systematic review and meta-analysis. PLoS ONE 2022, 17, e0263378. [Google Scholar] [CrossRef] [PubMed]
- Bucciarelli-Ducci, C.; Ajmone-Marsan, N.; Di Carli, M.; Nicol, E. The year in cardiovascular medicine 2021: Imaging. Eur. Heart J. 2022, 43, 1288–1295. [Google Scholar] [CrossRef] [PubMed]
- Level of the SARS-CoV-2 Receptor ACE2 Activity Is Highly Elevated in Old-Aged Patients with Aortic Stenosis: Implications for ACE2 as a Biomarker for the Severity of COVID-19—PMC. Available online: https://www.ncbi.nlm.nih.gov/pmc/articles/PMC7815502/ (accessed on 1 December 2022).
- Evertz, R.; Lange, T.; Backhaus, S.J.; Schulz, A.; Beuthner, B.E.; Topci, R.; Toischer, K.; Puls, M.; Kowallick, J.T.; Hasenfuß, G.; et al. Artificial Intelligence Enabled Fully Automated CMR Function Quantification for Optimized Risk Stratification in Patients Undergoing Transcatheter Aortic Valve Replacement. J. Intervent. Cardiol. 2022, 2022, 1368878. [Google Scholar] [CrossRef] [PubMed]
- Lauzier, P.T.; Avram, R.; Dey, D.; Slomka, P.; Afilalo, J.; Chow, B.J. The Evolving Role of Artificial Intelligence in Cardiac Image Analysis. Can. J. Cardiol. 2022, 38, 214–224. [Google Scholar] [CrossRef]
- European Parliament. Directorate General for Parliamentary Research Services. Artificial Intelligence in Healthcare: Applications, Risks, and Ethical and Societal Impacts; EU Publications Office: Gare, Luxembourg, 2022; Available online: https://data.europa.eu/doi/10.2861/568473 (accessed on 31 May 2022).
- Sakly, H.; Said, M.; Radhouane, S.; Tagina, M. Medical decision making for 5D cardiac model: Template matching technique and simulation of the fifth dimension. Comput. Methods Programs Biomed. 2020, 191, 105382. [Google Scholar] [CrossRef]
- Moher, D.; Liberati, A.; Tetzlaff, J.; Altman, D.G.; the PRISMA Group. Preferred reporting items for systematic reviews and meta-analyses: The PRISMA statement. BMJ 2009, 339, b2535. [Google Scholar] [CrossRef]
- Catapano, F.; Pambianchi, G.; Cundari, G.; Rebelo, J.; Cilia, F.; Carbone, I.; Catalano, C.; Francone, M.; Galea, N. 4D flow imaging of the thoracic aorta: Is there an added clinical value? Cardiovasc. Diagn. Ther. 2020, 10, 1068–1089. [Google Scholar] [CrossRef]
- Doris, M.K.; Rubeaux, M.; Pawade, T.; Otaki, Y.; Xie, Y.; Li, D.; Tamarappoo, B.K.; Newby, D.E.; Berman, D.S.; Dweck, M.R.; et al. Motion-corrected imaging of the aortic valve with18F-NaF PET/CT and PET/MRI: A feasibility study. J. Nucl. Med. 2017, 58, 1811–1814. [Google Scholar] [CrossRef]
- Vadher, A.B.; Shaw, M.; Pandey, N.N.; Sharma, A.; Kumar, S. Stenotic lesions of pulmonary arteries: Imaging evaluation using multidetector computed tomography angiography. Clin. Imaging 2021, 69, 17–26. [Google Scholar] [CrossRef]
- Battineni, G.; Hossain, M.A.; Chintalapudi, N.; Amenta, F. A Survey on the Role of Artificial Intelligence in Biobanking Studies. Diagnostics 2022, 12, 1179. [Google Scholar] [CrossRef] [PubMed]
- Yang, D.H. Application of artificial intelligence to cardiovascular computed tomography. Korean J. Radiol. 2021, 22, 1597–1608. [Google Scholar] [CrossRef] [PubMed]
- Garcia, J.; Barker, A.J.; Collins, J.D.; Carr, J.C.; Markl, M. Volumetric quantification of absolute local normalized helicity in patients with bicuspid aortic valve and aortic dilatation. Magn. Reson. Med. 2017, 78, 689–701. [Google Scholar] [CrossRef] [PubMed]
- Brüning, J.; Hellmeier, F.; Yevtushenko, P.; Kühne, T.; Goubergrits, L. Uncertainty Quantification for Non-invasive Assessment of Pressure Drop Across a Coarctation of the Aorta Using CFD. Cardiovasc. Eng. Technol. 2018, 9, 582–596. [Google Scholar] [CrossRef] [PubMed]
- Bachman, N.P.; Terwoord, J.D.; Richards, J.C.; Braun, B.; Green, C.P.; Luckasen, G.J.; Dinenno, F.A. Comprehensive assessment of cardiovascular structure and function and disease risk in middle-aged ultra-endurance athletes. Atherosclerosis 2021, 320, 105–111. [Google Scholar] [CrossRef]
- Jiang, B.; Guo, N.; Ge, Y.; Zhang, L.; Oudkerk, M.; Xie, X. Development and application of artificial intelligence in cardiac imaging. Br. J. Radiol. 2020, 93, 20190812. [Google Scholar] [CrossRef]
- Mordini, F.E.; Hynes, C.F.; Amdur, R.L.; Panting, J.; Emerson, D.A.; Morrissette, J.; Goheen-Thomas, E.; Greenberg, M.D.; Trachiotis, G.D. Multi-parametric approach to predict prosthetic valve size using CMR and clinical data: Insights from SAVR. Int. J. Cardiovasc. Imaging 2021, 37, 2269–2276. [Google Scholar] [CrossRef]
- Hahn, L.D.; Baeumler, K.; Hsiao, A. Artificial intelligence and machine learning in aortic disease. Curr. Opin. Cardiol. 2021, 36, 695–703. [Google Scholar] [CrossRef]
- Rudzinski, P.N.; Leipsic, J.A.; Schoepf, U.J.; Dudek, D.; Schwarz, F.; Andreas, M.; Zlahoda-Huzior, A.; Thilo, C.; Renker, M.; Burt, J.R.; et al. CT in Transcatheter-delivered Treatment of Valvular Heart Disease. Radiology 2022, 304, 4–17. [Google Scholar] [CrossRef]
- Messroghli, D.R.; Moon, J.C.; Ferreira, V.M.; Grosse-Wortmann, L.; He, T.; Kellman, P.; Mascherbauer, J.; Nezafat, R.; Salerno, M.; Schelbert, E.B.; et al. Clinical recommendations for cardiovascular magnetic resonance mapping of T1, T2, T2 and extracellular volume: A consensus statement by the Society for Cardiovascular Magnetic Resonance (SCMR) endorsed by the European Association for Cardiovascular Imaging (EACVI). J. Cardiovasc. Magn. Reson. 2017, 19, 75. [Google Scholar] [CrossRef]
- Higashikawa, T.; Ichikawa, Y.; Ishida, M.; Kitagawa, K.; Hirano, T.; Sakuma, H. Assessment of coronary flow velocity reserve with phase-contrast cine magnetic resonance imaging in patients with heavy coronary calcification. Int. J. Cardiovasc. Imaging. 2019, 35, 897–905. [Google Scholar] [CrossRef] [PubMed]
- Peterson, P.G.; Berge, M.; Lichtenberger, J.P.; Hood, M.N.; Ho, V.B. Cardiac Imaging Modalities and Appropriate Use. Prim. Care Clin. Off. Pract. 2018, 45, 155–168. [Google Scholar] [CrossRef] [PubMed]
- Hsu, L.-Y.; Jacobs, M.; Benovoy, M.; Ta, A.D.; Conn, H.M.; Winkler, S.; Greve, A.M.; Chen, M.Y.; Shanbhag, S.M.; Bandettini, W.P.; et al. Diagnostic Performance of Fully Automated Pixel-Wise Quantitative Myocardial Perfusion Imaging by Cardiovascular Magnetic Resonance. JACC-Cardiovasc. Imaging 2018, 11, 697–707. [Google Scholar] [CrossRef] [PubMed]
- Oechtering, T.H.; Roberts, G.S.; Panagiotopoulos, N.; Wieben, O.; Roldán-Alzate, A.; Reeder, S.B. Abdominal applications of quantitative 4D flow MRI. Abdom. Radiol. 2022, 47, 3229–3250. [Google Scholar] [CrossRef]
- Sagmeister, F.; Weininger, M.; Herrmann, S.; Bernhardt, P.; Rasche, V.; Bauernschmitt, R.; Liebold, A.; Köstler, H.; Weidemann, F.; Beer, M. Extent of size, shape and systolic variability of the left ventricular outflow tract in aortic stenosis determined by phase-contrast MRI. Magn. Reson. Imaging 2018, 45, 58–65. [Google Scholar] [CrossRef] [PubMed]
- Goubergrits, L.; Hellmeier, F.; Neumann, D.; Mihalef, V.; Gulsun, M.A.; Chinali, M.; Secinaro, A.; Runte, K.; Schubert, S.; Berger, F.; et al. Patient-specific requirements and clinical validation of MRI-based pressure mapping: A two-center study in patients with aortic coarctation. J. Magn. Reson. Imaging 2019, 49, 81–89. [Google Scholar] [CrossRef]
- Lee, E.; Richards, B.; Lu, J.C.; Mahani, M.G.; Dorfman, A.L.; Balasubramanian, S.; Agarwal, P.P. Phase-Contrast Magnetic Resonance Quantification of Aortic Regurgitation in Patients with Turbulent Aortic Flow. J. Comput. Assist. Tomogr. 2019, 43, 317–322. [Google Scholar] [CrossRef]
- Budai, A.; Suhai, F.I.; Csorba, K.; Dohy, Z.; Szabo, L.; Merkely, B.; Vago, H. Automated Classification of Left Ventricular Hypertrophy on Cardiac MRI. Appl. Sci. 2022, 12, 4151. [Google Scholar] [CrossRef]
- Hassanabad, A.F.; Burns, F.; Bristow, M.S.; Lydell, C.; Howarth, A.G.; Heydari, B.; Gao, X.; Fedak, P.W.; White, J.A.; Garcia, J. Pressure drop mapping using 4D flow MRI in patients with bicuspid aortic valve disease: A novel marker of valvular obstruction. Magn. Reson. Imaging 2020, 65, 175–182. [Google Scholar] [CrossRef]
- Tarkin, J.M.; Ćorović, A.; Wall, C.; Gopalan, D.; Rudd, J.H. Rudd, Positron emission tomography imaging in cardiovascular disease. Heart 2020, 106, 1712–1718. [Google Scholar] [CrossRef]
- Ha, H.; Kvitting, J.E.; Dyverfeldt, P.; Ebbers, T. Validation of pressure drop assessment using 4D flow MRI-based turbulence production in various shapes of aortic stenoses. Magn. Reson. Med. 2019, 81, 893–906. [Google Scholar] [CrossRef]
- Celi, S.; Martini, N.; Pastormerlo, L.E.; Positano, V.; Berti, S. Multimodality imaging for interventional cardiology. Curr. Pharm. Des. 2017, 23, 3285–3300. [Google Scholar] [CrossRef]
- Chandrasekhar, S.; Laxminarayana, G.; Chakrapani, Y. Novel hybrid segmentation techniques for cardiac image processing in remote health care monitoring systems. J. Med. Imaging Health Inform. 2017, 7, 1153–1159. [Google Scholar] [CrossRef]
- Chen, H.; Ouyang, D.; Baykaner, T.; Jamal, F.; Cheng, P.; Rhee, J.-W. Artificial intelligence applications in cardio-oncology: Leveraging high dimensional cardiovascular data. Front. Cardiovasc. Med. 2022, 9, 941148. [Google Scholar] [CrossRef]
- Chen, Y.-C.; Wei, X.-E.; Lu, J.; Qiao, R.-H.; Shen, X.-F.; Li, Y.-H. Correlation between intracranial arterial calcification and imaging of cerebral small vessel disease. Front. Neurol. 2019, 10, 426. [Google Scholar] [CrossRef]
- Luo, Y.; Xu, L.; Qi, L. A cascaded FC-DenseNet and level set method (FCDL) for fully automatic segmentation of the right ventricle in cardiac MRI. Med. Biol. Eng. Comput. 2021, 59, 561–574. [Google Scholar] [CrossRef]
- Qiu, D.; Peng, L.; Ghista, D.N.; Wong, K.K.L. Left Atrial Remodeling Mechanisms Associated with Atrial Fibrillation. Cardiovasc. Eng. Technol. 2021, 12, 361–372. [Google Scholar] [CrossRef]
- Jiang, S.; Cao, T.; Yan, Y.; Yang, T.; Yuan, Y.; Deng, Q.; Wu, T.; Sun, J.; Wu, S.; Hao, Z.-L.; et al. Lenticulostriate artery combined with neuroimaging markers of cerebral small vessel disease differentiate the pathogenesis of recent subcortical infarction. J. Cereb. Blood Flow Metab. 2021, 41, 2105–2115. [Google Scholar] [CrossRef]
- Jeong, H.-G.; Kim, B.J.; Kim, T.; Kang, J.; Kim, J.Y.; Kim, J.; Kim, J.-T.; Park, J.-M.; Kim, J.G.; Hong, J.-H.; et al. Classification of cardioembolic stroke based on a deep neural network using chest radiographs. EBioMedicine 2021, 69, 103466. [Google Scholar] [CrossRef]
- Kagiyama, N.; Shrestha, S.; Farjo, P.D.; Sengupta, P.P. Artificial intelligence: Practical primer for clinical research in cardiovascular disease. J. Am. Heart Assoc. 2019, 8, e012788. [Google Scholar] [CrossRef]
- Pasteur-Rousseau, A.; Paul, J.-F. Artificial Intelligence and teleradiology in cardiovascular imaging by CT-Scan and MRI. Ann. Cardiol. Angeiol. 2021, 70, 339–347. [Google Scholar] [CrossRef]
- Simões, M.V.; Fernandes, F.; Marcondes-Braga, F.G.; Scheinberg, P.; Correia, E.d.B.; Rohde, L.E.P.; Bacal, F.; Alves, S.M.M.; Mangini, S.; Biolo, A.; et al. Position statement on diagnosis and treatment of cardiac amyloidosis—2021. Arq. Bras. Cardiol. 2021, 117, 561–598. [Google Scholar] [CrossRef]
- Zahisham, Z.; Lee, C.P.; Lim, K.M. Food Recognition with ResNet-50. In Proceedings of the 2020 IEEE 2nd International Conference on Artificial Intelligence in Engineering and Technology (IICAIET), Kota Kinabalu, Malaysia, 26–27 September 2020; pp. 1–5. [Google Scholar] [CrossRef]
- Gropler, R.J. In This Issue of the Journal. Circ. Cardiovasc. Imaging 2019, 12, e009851. [Google Scholar] [CrossRef]
- Nath, R.; Callahan, S.; Singam, N.; Stoddard, M.; Amini, A. IEEE, Accelerated Phase Contrast Magnetic Resonance Imaging via Deep Learning. In Proceedings of the 2020 IEEE 17th International Symposium on Biomedical Imaging (ISBI 2020), Iowa City, IA, USA, 3–7 April 2020; pp. 834–838. [Google Scholar]
- Wirth, R.; Hipp, J. CRISP-DM: Towards a standard process model for data mining. In Proceedings of the 4th International Conference on the Practical Applications of Knowledge Discovery and Data Mining, Manchester, UK, 11–13 April 2000; pp. 29–39. [Google Scholar]
- Dåderman, A.; Rosander, S. Evaluating Frameworks for Implementing Machine Learning in Signal Processing: A Comparative Study of CRISP-DM, SEMMA and KDD, Student Thesis, 2018. Available online: http://urn.kb.se/resolve?urn=urn:nbn:se:kth:diva-235408 (accessed on 25 September 2018).
- Detalhes do Projeto—Ciência-IUL—ISCTE-IUL. Available online: https://ciencia.iscte-iul.pt/projects/aplicacoes-moveis-baseadas-em-inteligencia-artificial-para-resposta-de-saude-publica/1567 (accessed on 6 October 2023).
- Andorno, R. The Oviedo Convention: A European Legal Framework at the Intersection of Human Rights and Health Law. J. Int. Biotechnol. Law 2005, 2, 133–143. [Google Scholar] [CrossRef]
- Varma, D.R. Managing DICOM images: Tips and tricks for the radiologist. Indian J. Radiol. Imaging 2012, 22, 4–13. [Google Scholar] [CrossRef]
- Khozeimeh, F.; Sharifrazi, D.; Izadi, N.H.; Joloudari, J.H.; Shoeibi, A.; Alizadehsani, R.; Tartibi, M.; Hussain, S.; Sani, Z.A.; Khodatars, M.; et al. RF-CNN-F: Random forest with convolutional neural network features for coronary artery disease diagnosis based on cardiac magnetic resonance. Sci. Rep. 2022, 12, 11178. [Google Scholar] [CrossRef]
- Maashi, M.; Alamro, H.; Mohsen, H.; Negm, N.; Mohammed, G.P.; Ahmed, N.A.; Ibrahim, S.S.; Alsaid, M.I. Modeling of Reptile Search Algorithm with Deep Learning Approach for Copy Move Image Forgery Detection. IEEE Access 2023, 11, 87297–87304. [Google Scholar] [CrossRef]
- Wang, R.; Lei, T.; Cui, R.; Zhang, B.; Meng, H.; Nandi, A.K. Medical image segmentation using deep learning: A survey. IET Image Process. 2022, 16, 1243–1267. [Google Scholar] [CrossRef]
- Deng, J.; Dong, W.; Socher, R.; Li, L.-J.; Li, K.; Fei-Fei, L. ImageNet: A large-scale hierarchical image database. In Proceedings of the 2009 IEEE Conference on Computer Vision and Pattern Recognition, Miami, FL, USA, 20–25 June 2009; pp. 248–255. [Google Scholar] [CrossRef]
- Sharma, S.; Guleria, K.; Tiwari, S.; Kumar, S. A deep learning based convolutional neural network model with VGG16 feature extractor for the detection of Alzheimer Disease using MRI scans. Meas. Sens. 2022, 24, 100506. [Google Scholar] [CrossRef]
- Divya, S.; Suresh, L.P.; John, A. A Deep Transfer Learning framework for Multi Class Brain Tumor Classification using MRI. In Proceedings of the 2020 2nd International Conference on Advances in Computing, Communication Control and Networking (ICACCCN), Bengaluru, India, 18–19 December 2020; pp. 283–290. [Google Scholar] [CrossRef]
- Gülmez, B. A novel deep neural network model based Xception and genetic algorithm for detection of COVID-19 from X-ray images. Ann. Oper. Res. 2023, 328, 617–641. [Google Scholar] [CrossRef]
- Rismiyati; Endah, S.N.; Khadijah; Shiddiq, I.N. Xception Architecture Transfer Learning for Garbage Classification. In Proceedings of the 2020 4th International Conference on Informatics and Computational Sciences (ICICoS), Semarang, Indonesia, 10–11 November 2020; pp. 1–4. [Google Scholar] [CrossRef]
- Mascarenhas, S.; Agarwal, M. A comparison between VGG16, VGG19 and ResNet50 architecture frameworks for Image Classification. In Proceedings of the 2021 International Conference on Disruptive Technologies for Multi-Disciplinary Research and Applications (CENTCON), Bengaluru, India, 19–21 November 2021; pp. 96–99. [Google Scholar] [CrossRef]
- Zhang, Y.; Liu, Y.-L.; Nie, K.; Zhou, J.; Chen, Z.; Chen, J.-H.; Wang, X.; Kim, B.; Parajuli, R.; Mehta, R.S.; et al. Deep Learning-based Automatic Diagnosis of Breast Cancer on MRI Using Mask R-CNN for Detection Followed by ResNet50 for Classification. Spec. Issue Womens Imaging Focus 2023, 30, S161–S171. [Google Scholar] [CrossRef] [PubMed]
- Kim, H.E.; Cosa-Linan, A.; Santhanam, N.; Jannesari, M.; Maros, M.E.; Ganslandt, T. Transfer learning for medical image classification: A literature review. BMC Med. Imaging 2022, 22, 69. [Google Scholar] [CrossRef]
- Gholamy, A.; Kreinovich, V.; Kosheleva, O. Why 70/30 or 80/20 Relation between Training and Testing Sets: A Pedagogical Explanation, 2018. Available online: https://scholarworks.utep.edu/cs_techrep/1209 (accessed on 6 October 2023).
- Calculating The Batch Size in Keras—Modeladvisor.com. Available online: https://www.modeladvisor.com/calculating-the-batch-size-in-keras/ (accessed on 12 October 2023).
- Chiang, C.-H.; Weng, C.-L.; Chiu, H.-W. Automatic classification of medical image modality and anatomical location using convolutional neural network. PLoS ONE 2021, 16, e0253205. [Google Scholar] [CrossRef]
Figure 1.
PRISMA workflow diagram.
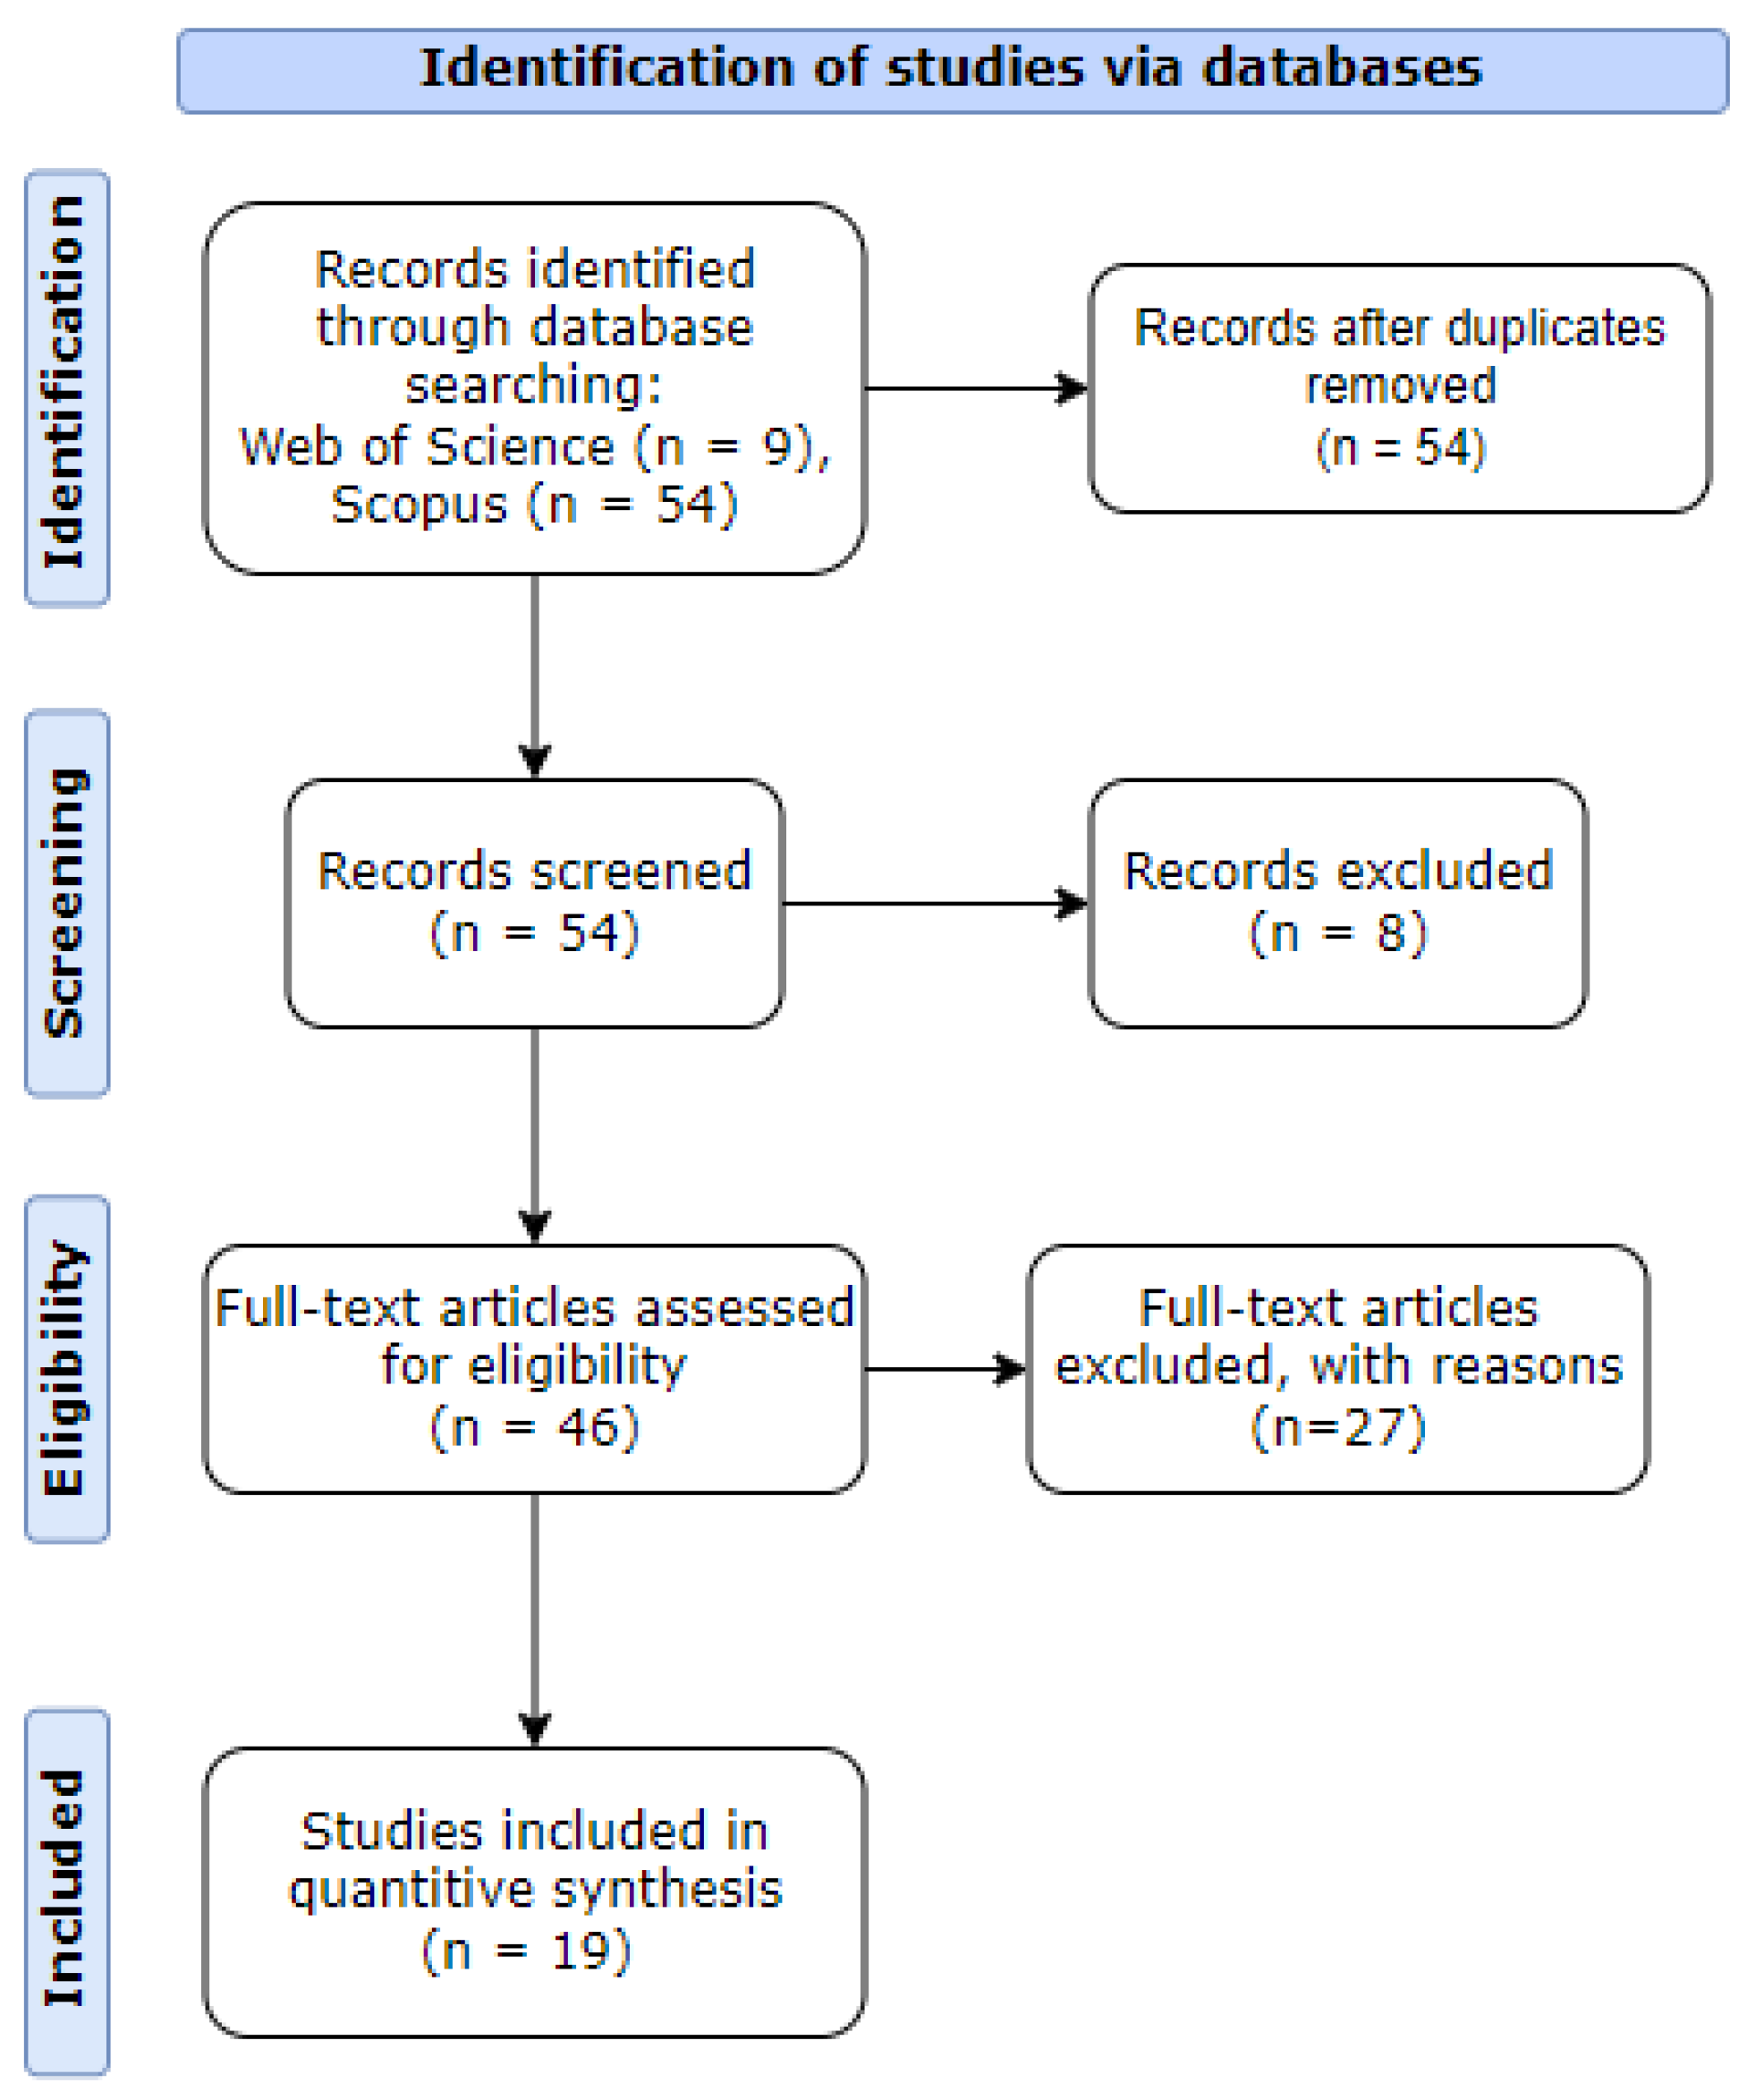
Figure 2.
MRI images without the aortic valve.

Figure 3.
MRI of the aortic valve, where the column of images (a) represents the images without AS and column (b) represents the images that have AS.
Figure 3.
MRI of the aortic valve, where the column of images (a) represents the images without AS and column (b) represents the images that have AS.

Figure 4.
Representation of the rotation technique applied at the default MRI, where (a) represents the default MRI and (b) represents the MRI with 90, 180, and 270 rotation degrees, respectively.
Figure 4.
Representation of the rotation technique applied at the default MRI, where (a) represents the default MRI and (b) represents the MRI with 90, 180, and 270 rotation degrees, respectively.

Figure 5.
Representation of the translation technique applied at the default MRI, where (a) represents the default MRI and (b) represents vertical translation.
Figure 5.
Representation of the translation technique applied at the default MRI, where (a) represents the default MRI and (b) represents vertical translation.

Figure 6.
Representation of the flip technique applied at the default MRI, where (a) represents the default MRI and (b) represents the flipped MRIs.
Figure 6.
Representation of the flip technique applied at the default MRI, where (a) represents the default MRI and (b) represents the flipped MRIs.

Figure 7.
Representation of the brightness technique applied at the default MRI, where (a) represents the default MRI and (b) represents the brighter MRIs.
Figure 7.
Representation of the brightness technique applied at the default MRI, where (a) represents the default MRI and (b) represents the brighter MRIs.

Figure 8.
Summarization of the data preparation.

Figure 9.
Developed CNN architecture.
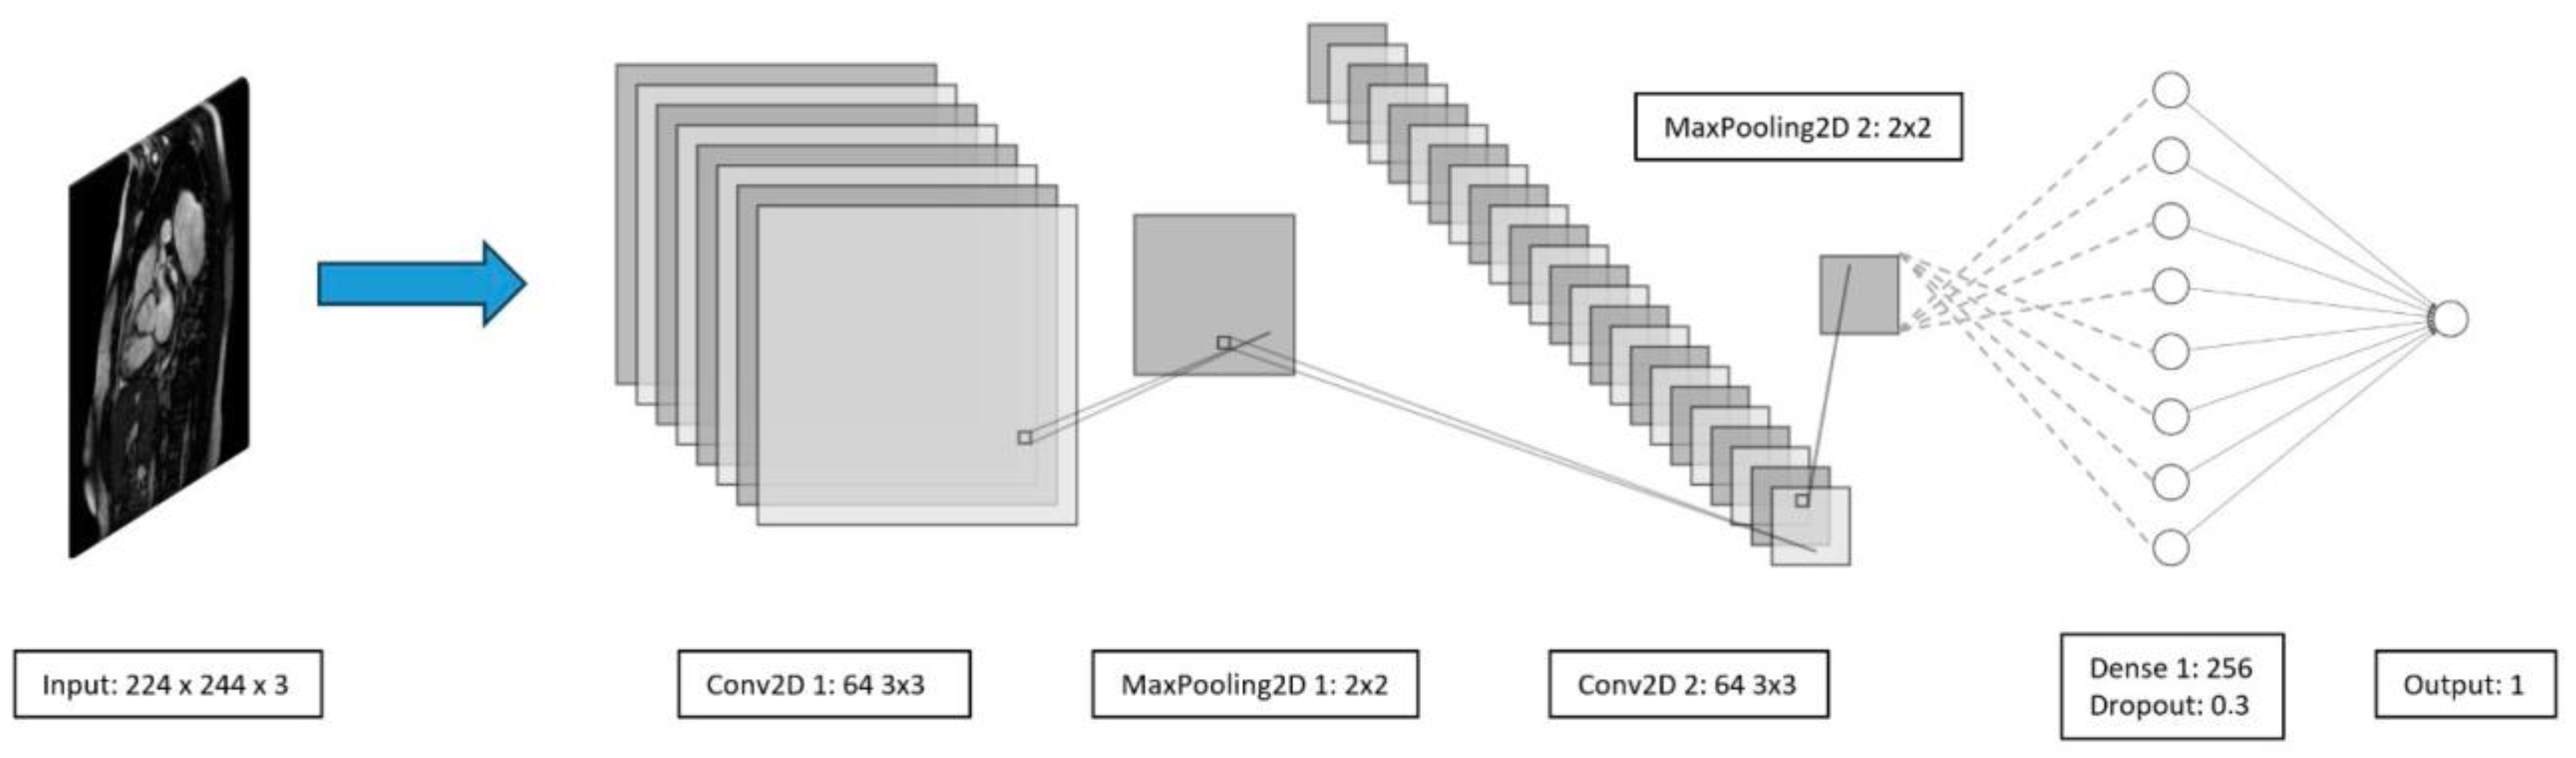
Figure 10.
Model performance: training vs testing.


Table 1.
Articles by topic.
| Topic | References | # Doc | % Doc |
|---|---|---|---|
| Aortic Disease/Aortic Stenosis | [1,2,3,5,6,8,10,11,12,13,14,15,16,17,18,19,20,21,22,23,24,25,26,27,28,29,30,31,32,33,34,35] | 32 | 21% |
| MRI | [1,2,3,6,8,10,11,15,16,17,18,19,20,21,22,23,24,25,26,27,28,29,30,31,32,33,36,37,38,39,40] | 31 | 20% |
| Artificial Intelligence | [1,3,6,11,13,14,18,20,26,30,32,35,36,38,41,42,43,44,45,46] | 20 | 13% |
| Tomography Scan | [6,11,12,14,17,18,21,23,24,34,36,37,39,41] | 14 | 9% |
| Echocardiography | [1,6,21,27,34,35,36,39] | 8 | 5% |
| Early Detection/Prevention | [5,10,13,19,20,36,47] | 7 | 4% |
Table 2.
Results of the model with different datasets.
| Test | Accuracy | Recall | Precision | F1-Score |
|---|---|---|---|---|
| 0.77 | 0.77 | 0.77 | 0.77 |
| 0.78 | 0.78 | 0.78 | 0.78 |
| 0.81 | 0.81 | 0.81 | 0.81 |
Table 3.
Results of the models with different datasets.
| Test | Models | Recall | Precision | F1-Score |
|---|---|---|---|---|
| 1. Original Dataset | VGG16 | 0.5 | 0.5 | 0.65 |
| VGG16-FT | 0.75 | 0.88 | 0.81 | |
| ResNet50 | 0.6 | 0.86 | 0.71 | |
| ResNet50-FT | 0.8 | 0.94 | 0.86 | |
| Xception | 0.85 | 0.85 | 0.85 | |
| Xception-FT | 0.546 | 0.586 | 0.565 | |
| 2. Rotation, Flip, and Translation | VGG16 | 0.9 | 0.92 | 0.91 |
| VGG16-FT | 0.85 | 0.96 | 0.9 | |
| ResNet50 | 0.88 | 0.97 | 0.93 | |
| ResNet50-FT | 0.93 | 1 | 0.96 | |
| Xception | 0.86 | 0.86 | 0.86 | |
| Xception-FT | 0.73 | 0.87 | 0.8 | |
| 3. Rotation, Flip, Translation, and Brightness | VGG16 | 0.95 | 0.96 | 0.95 |
| VGG16-FT | 0.85 | 0.98 | 0.91 | |
| ResNet50 | 0.82 | 0.95 | 0.88 | |
| ResNet50-FT | 0.89 | 0.96 | 0.92 | |
| Xception | 0.86 | 0.86 | 0.86 | |
| Xception-FT | 0.64 | 0.87 | 0.74 |
Disclaimer/Publisher’s Note: The statements, opinions and data contained in all publications are solely those of the individual author(s) and contributor(s) and not of MDPI and/or the editor(s). MDPI and/or the editor(s) disclaim responsibility for any injury to people or property resulting from any ideas, methods, instructions or products referred to in the content. |
© 2023 by the authors. Licensee MDPI, Basel, Switzerland. This article is an open access article distributed under the terms and conditions of the Creative Commons Attribution (CC BY) license (https://creativecommons.org/licenses/by/4.0/).
Share and Cite
MDPI and ACS Style
Elvas, L.B.; Águas, P.; Ferreira, J.C.; Oliveira, J.P.; Dias, M.S.; Rosário, L.B. AI-Based Aortic Stenosis Classification in MRI Scans. Electronics 2023, 12, 4835. https://doi.org/10.3390/electronics12234835
AMA Style
Elvas LB, Águas P, Ferreira JC, Oliveira JP, Dias MS, Rosário LB. AI-Based Aortic Stenosis Classification in MRI Scans. Electronics. 2023; 12(23):4835. https://doi.org/10.3390/electronics12234835
Chicago/Turabian StyleElvas, Luís B., Pedro Águas, Joao C. Ferreira, João Pedro Oliveira, Miguel Sales Dias, and Luís Brás Rosário. 2023. "AI-Based Aortic Stenosis Classification in MRI Scans" Electronics 12, no. 23: 4835. https://doi.org/10.3390/electronics12234835
Note that from the first issue of 2016, this journal uses article numbers instead of page numbers. See further details here.