Abstract
Pedestrian safety is a major concern in urban areas, and crosswalks are one of the most critical locations where accidents can occur. This research introduces an intelligent crosswalk, employing sensor fusion and machine learning techniques to distinguish the presence of pedestrians and drivers. Upon detecting a pedestrian, the system proactively activates a warning light signal. This approach aims to quickly alert nearby people and mitigate potential dangers, thereby strengthening pedestrian safety. The system integrates data from radio detection and ranging sensors and a magnetic field sensor, using a hierarchical classifier. The One-Class support vector machine algorithm is used to classify objects in the radio detection and ranging data, while fuzzy logic is used to filter out targets from the magnetic field sensor. Additionally, this work presents a novel method for the manufacture of the road signaling system, using mixtures of resins, aggregates, and reinforcing fibers that are cold-injected into an aluminum mold. The mechanical, optical, and electrical characteristics were subjected to standardized tests, validating its autonomous operation in real-world conditions. The results revealed the system’s effectiveness in detecting pedestrians with a 99.11% accuracy and a 0.0% false-positive rate, marking a substantial improvement over the previous fuzzy logic-based system with an 81.33% accuracy. Attitude testing revealed a significant 33.33% reduction in pedestrian erratic behavior and a substantial decrease in driver speed (32.83% during the day and 70.6% during the night) compared to conventional crossings. Consequently, this comprehensive work offers a unique solution to pedestrian safety at crosswalks by showcasing the potential of machine learning techniques, particularly the One-Class support vector machine algorithm, in advancing road safety through precise and reliable pattern recognition.
1. Introduction
On roads—whether part of the State Highway Network or urban streets—certain points require increased attention and reduced speed to prevent traffic accidents [1]. There are very different concepts for this aim in terms of the installation, size, and availability of road signaling systems. At the international level, there are various solutions, such as a sensor barrier that detects pedestrians at a crosswalk entrance/exit and flashes lights to alert drivers [2]; a sidewalk system with a camera that captures and processes images, visually alerting drivers when it identifies pedestrians on the crosswalk [3]; a system that alerts pedestrians to silent electric vehicles approaching the zebra crossing [4]; a device that displays a speeding sign and detects crossing pedestrians by using proximity sensors [5], a solar-powered crosswalk warning system with wireless communication between sidewalks and manually activated flashing lights [6]; or a system made up of devices with passive lighting without detection sensors [7].
In Spain, proposals include illuminated canopies with spotlights aimed at the crosswalk pavement to enhance pedestrian visibility [8], portable crosswalks with acoustic warnings triggered by vehicle and pedestrian detectors [9], zebra crossing indicator posts activated by optical sensors [10,11], tiles with interior lighting controlled by pressure sensors, passive infrared (PIR) and ambient light [12], or built-in security systems for crosswalks with manually controlled light-emitting diode (LED) lighting [13].
Spanish road sign regulations resemble those of neighboring countries. The specifications align with the European directive 2008/96/EC on road infrastructure safety management. Regarding smart road systems, the recent directive 2019/1936 suggests a common approach for the deployment of connected and automated mobility systems, indicating unexplored potential [14]. A review of the new road safety scenarios to which the presence of autonomous vehicles and pedestrians leads, as well as their relationship with Smart Cities, can be found in [15].
Studies show that more severe traffic-calming measures provide greater speed reductions and, therefore, fewer accidents [16]. Light signaling with intelligent active control, coupled with speed reduction, ensures necessary attention at these critical points. Apart from road signs, speed bumps can help to achieve these objectives [17]. These elements can be of two types, namely trapezoidal (e.g., raised pedestrian walkway) and as a speed bump, and can be either cast in place or precast from rubber [18]. This applies to speed bumps featuring trapezoidal reliefs, which incorporate passive lighting elements like LEDs adjusting brightness through ambient light sensors [19] or activating in response to pedestrian presence in pressure zones at access points [20]. However, prefabricated speed bumps as the one proposed in this research are better for housing electronic systems than raised cement or concrete reliefs due to their lower impact and cost in civil works.
1.1. Theoretical Context
The present paper puts the emphasis on road systems that detect both pedestrians and vehicles. This solution integrates road safety, incorporating inorganic chemistry as the key technology. The classification according to the United Nations Educational, Scientific and Cultural Organization (UNESCO) nomenclature includes codes 3327 (Transportation Systems Technology), 3329 (Urban Planning), and 3303 (Chemical Engineering and Technology).
Despite the variety of solutions available in the state-of-the-art, mainly identified in Invenes, Espacenet, and Google Patent, the disadvantages detected are as follows:
- -
- Most consist of concepts that are not yet commercially available;
- -
- They generally require supports, electrical infrastructure, and civil works for their installation (i.e., vulnerable to surges in the electrical system);
- -
- They lack intelligence, usually being the detection of the “all/nothing” type depending on whether “there is/is not” an object (i.e., they do not discern between pedestrians or vehicles to avoid false positives);
- -
- They lack an architecture to integrate all the actors (i.e., pedestrian, vehicle, and environment).
From the study, it was found the most used and seen solutions today for the signaling of zebra crossings continue to be reflectors, illuminated canopies, rubber speed bumps and trapezoidal concrete/cement reliefs.
Table 1 shows a comparison with the distinctive characteristics of the solutions described in the state-of-the-art and the one presented in this manuscript. Its main advantages are that it is (i) low in cost due to its morphology, type of installation, and operating strategy based on nodes with embedded sensors; (ii) intelligent, as it conducts selective detection of targets on the road, discriminating between pedestrians and vehicles to enhance the rate of true and false positives; (iii) autonomous, as it does not require external power infrastructure and is not exposed to surges from the grid; and (iv) installed on the road itself, without the need for public works, and it is reusable when resurfacing of the road is required.

Table 1.
Comparison of the state-of-the-art solutions against the proposed solution.
1.2. Objectives and Research Hypothesis
The contributions pursued by this work are the following:
- -
- To develop an intelligent crosswalk system that integrates data from radio detection and ranging (RADAR) sensors and a magnetic field sensor, using a hierarchical classifier;
- -
- To use sensor fusion and machine learning (ML) techniques to distinguish the presence of pedestrians and drivers;
- -
- To proactively activate a warning light signal upon detecting a pedestrian to quickly alert nearby people and mitigate potential dangers, thereby strengthening road safety;
- -
- To validate the mechanical, optical, and electrical characteristics of the system through standardized tests;
- -
- To assess the feasibility of an intelligent signaling system to influence the attitude of users in a way that improves road safety for pedestrians.
Therefore, the proposed working hypothesis are as follows: (i) We aimed to discover whether a novel construction method based on resins, aggregates, and reinforcing fibers cold-injected on an aluminum mold can be used to create a road signaling system. This system aims for autonomous operation with mechanical, optical, and electrical characteristics suitable for real-world environments. (ii) We aimed to discover whether it is possible to examine the feasibility of an intelligent crosswalk, combining speed bumps and light signaling to influence the behavior of vehicles and pedestrians. The goal was to enhance pedestrian safety by improving perceived safety, regulating traditional pedestrian crossings, and assessing viability for real-world implementation. To test these hypotheses, standardized tests were conducted to validate the mechanical, optical, and functional properties of the system. The results of these tests were used to evaluate the feasibility of the intelligent crosswalk and its potential implications for road safety.
To this end, this manuscript is structured as follows: Section 2 presents the works related to fuzzy logic and ML algorithms in the context of pedestrian detection. Section 3 describes the intelligent road signaling system. Section 4 shows the materials and methods used in the manufacture of the speed bump. Section 5 discusses the mechanical, electrical, and integrity tests of the speed bump. Section 6 presents the experimentation carried out with the intelligent crosswalk. Finally, this manuscript presents the conclusions and future works.
2. Related Work
Pedestrian detection through artificial intelligence (AI) algorithms is a continually evolving field with profound implications for road safety. The accuracy and robustness of these systems are crucial to save lives as we progress towards an increasingly automated future [21].
Fuzzy logic integration within pedestrian detection algorithms has shown promise in addressing the ambiguity and imprecision linked to pedestrian appearances, especially in challenging scenarios. For instance, a fuzzy inference model was developed for pedestrian flow and density analysis in traffic areas, demonstrating the effectiveness of this approach in detecting pedestrians in transportation systems [22]. Fuzzy logic has also been successfully applied in other similar scenarios to model the underlying cognitions and behavioral patterns of pedestrians inferred from field observations [23]; to estimate pedestrian walk through frequency and length steps, utilizing an inertial measurement unit (IMU) [24]; or to control traffic lights in pedestrian crossings by computing vehicle and pedestrian density with genetic algorithms [25]. Nevertheless, fuzzy logic-based pedestrian detection may have computational demands that impact the real-time performance. This drawback may lead to sensitivity to uncommon scenarios, potentially resulting in inconsistent decisions.
In pedestrian detection, the One-Class support vector machine (SVM) algorithm has shown notable success, often achieving high detection rates, especially in scenarios where pedestrians are a minority class. For example, a work carried out a monocular pedestrian detection system based on single-frame classification from video scenes that achieved a detection accuracy of 93.5%, resulting in a notable reduction in false positives [26]. Furthermore, a framework combining dynamic mode decomposition (DMD) with One-Class SVM was proposed for pedestrian behavior anomaly detection. The proposed framework attained an accuracy of 81% in discerning anomalous human behavior with a limited dataset [27]. It can be noted that the efficacy of One-Class learning fluctuates depending on the characterization of anomalies and the training data’s quality.
One of the pivotal advancements in pedestrian detection lies in Convolutional Neural Networks (CNNs), with Faster R-CNN introduced in 2016. This architecture has paved the way for faster detection times and enhanced accuracy [28]. In this sense, “you only look once” (YOLO) has gained prominence by enabling real-time detection and evolving with versions like YOLOv5 [29]. As main drawbacks, CNN-based Faster R-CNN models exhibit high computational demands, require substantial annotated data, and may struggle with occlusions and generalization, posing challenges in resource-constrained scenarios.
Progressive studies have investigated the potential of graph neural networks (GNNs) to detect objects in crowded scenarios. This is the case of a GNN designed for 3D object detection (i.e., vehicles, people, and cyclists) from a LiDAR point cloud [30]. These GNN-based approaches have demonstrated promising results in improving the accuracy of multi-pedestrian detection. Nevertheless, GNN-based pedestrian detection may entail a complex design, data structure requirements, and computational demands, while also exhibiting limited effectiveness in unstructured scenarios and challenging interpretability. The effectiveness of light detection and ranging (LiDAR)-based 3D object detection can be enhanced by integrating semantic information from cameras. This introduces a new multi-modal approach for pedestrian detection, achieved through the fusion of point clouds and image features [31]. Likewise, this approach continues to suffer from computational complexity, data requirements, and interpretation of results.
Recent research has highlighted the significance of adversarial training techniques to enhance model robustness. Additionally, the fusion of multi-modal data, including visible–thermal imaging, has been explored to improve pedestrian detection [32]. Adversarial training techniques and visible–thermal feature fusion present drawbacks, including increased computational complexity, challenges in data collection and labeling, potential vulnerability to adversarial attacks, diminished interpretability, and limited generalization across diverse environmental conditions. Pedestrian identification is also an area of interest in video surveillance data mining. Hither, the spatiotemporal relationship has been exploited to obtain the pedestrian signature from the gait and appearance of the upper and lower parts of a person’s silhouette, using k-means clustering [33]. Nevertheless, it has several limitations, including sensitivity to silhouette quality, lighting, background, and occlusion, as well as challenges related to scalability. These limitations may impact its performance in real-world video surveillance scenarios. Continued research efforts have also been directed towards developing efficient lightweight models that are suitable for edge devices, ensuring real-time pedestrian detection in resource-constrained environments [34].
This paper aligns with related works, employing AI techniques such as fuzzy logic and One-Class SVM for pedestrian detection. Nonetheless, it stands out by emphasizing a practical hardware implementation focus and introducing innovative materials and manufacturing methods for crosswalks. It offers a unique solution that integrates sensor fusion, ML, and novel materials for road signaling. While related AI-based methods prioritize accuracy and robustness, this manuscript focuses on the development of a resource-constrained embedded hardware-based system for pedestrian detection. This system is supported by a microcontroller, RADAR, and magnetic field sensors. It achieves a notable accuracy improvement compared to a prior fuzzy logic-based system, validating its performance in real operating environments. The paper presents a holistic solution to pedestrian safety by combining AI techniques with innovative hardware. These distinctions collectively underscore its practicality, real-world applicability, and effectiveness in enhancing pedestrian safety, setting it apart from algorithm-focused studies.
3. System Description
This paper presents an intelligent speed bump based on a network of autonomous nodes that recognize objects independently and work in a coordinated manner. In summary, the speed bump, employing AI techniques, can discern objects, synchronize via a wireless network, and activate an LED barrier upon detecting pedestrians. This is perceived by drivers as a warning light signal [35,36].
The system is made up of a variable set of nodes that can cover the entire width of the road. The division into independent nodes constitutes a series of advantages. On the one hand, if an element is out of service, the rest of the nodes can continue working. On the other hand, the number of nodes can be optimized so that the system can be generalized to any zebra crossing (e.g., one-way or two-way lanes). The speed bump does not need trench for cables or public works machines for its installation, as it has sufficient anchoring elements, such as anti-theft devices that also minimize attacks due to vandalism. Large infrastructures above the road or sidewalk that impact pedestrians and/or vehicles are not necessary either (e.g., light panels, posts, or pressure zones). The proposed speed bump could be applied at garage entrances and exits to alert drivers about pedestrians crossing the sidewalk. It can also be used at low-visibility intersections to warn of approaching vehicles.
The intelligent pedestrian signaling system has a maturity equivalent to technology readiness level (TRL) 8. That is, it is a complete and qualified system [37]. It has autonomy of up to 8 days, with a theoretical maximum consumption of 22.63 Wh/day, making it unnecessary to connect the system to the power grid and thus providing energy sustainability. There are two types of nodes in the system: simple and intelligent. The simple nodes are solid, while the intelligent ones comprise a set of sensors facing the interior and exterior of the crosswalk to classify targets. They also incorporate lights facing outside the zebra crossing to alert drivers of the presence of pedestrians and towards the zebra crossing to warn pedestrians of crossing on a road with vehicles (Figure 1).
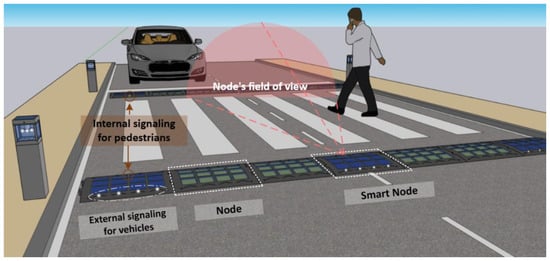
Figure 1.
Intelligent crosswalk overview.
3.1. Hardware
Each intelligent node is composed of control, wireless communication, sensing, signaling, and power units. The control unit, powered by a Teensy 4.1® microcontroller (Princeton Joint Research Center, Oregon, OR, USA), collects data from the detection unit, analyzes patterns corresponding to targets, and activates the signaling unit upon detecting a pedestrian on the crosswalk. The detection unit is made up of two RADAR devices, one oriented towards the exterior of the crosswalk to detect the approach of vehicles and cyclists, and another towards the interior to detect the presence of pedestrians. The detection unit incorporates a magnetic field sensor to distinguish whether a vehicle has parked or stopped on the crosswalk. Upon detecting pedestrians, the control unit sends an alert message to the rest of the system nodes. The wireless communication unit is formed by a microcontroller based on the IEEE 802.15.4 standard [38]. The signaling unit consists of four high-brightness white LEDs and one amber LED. Finally, the power unit is made up of a solar charger, a set of solar panels (2 W, 6 V, and 0.333 A), and a set of lithium polymer (Li-Po) batteries. The details of each of the units are shown in Table 2.
Table 2.
Features of the system’s hardware.
3.2. Software
The software designed for the intelligent crosswalk aims to discern between the presence of pedestrians and vehicles on a zebra crossing. This goal was accomplished through a sensor fusion process that collaboratively integrates information from different sensors and redundantly processes data from sensors of the same type. This type of fusion corresponds to the third level of abstraction of Dasarathy’s model [39]. The sensor fusion process employs a hierarchical classifier, taking input from AI techniques applied to data from RADAR sensors and a magnetic field sensor, as described in [40]. The AI techniques are based on pattern recognition, using One-Class SVM as a basis for the RADAR sensors and fuzzy logic for the magnetic field sensor. The processing of the information from each RADAR sensor is performed independently, as shown in Figure 2.
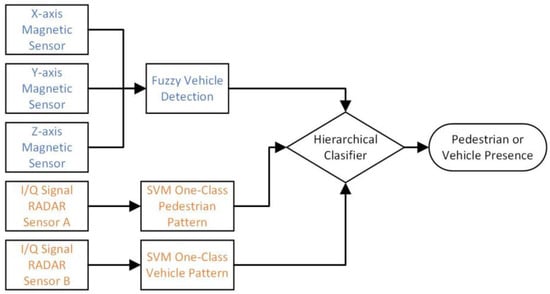
Figure 2.
Sensor fusion process of the system.
Information extraction from each RADAR sensor relies on the Doppler effect, enabling the acquisition of an in-phase and quadrature (I/Q) signal in the 24 GHz band. This signal contains information about the speed and patterns of targets based on the reflected frequency of each target. The I/Q signal is captured, normalized, and stored in RAM by the control unit in periods of 0.5 s. This signal is then analyzed using the short-time Fourier transform (STFT) technique, which allows for a spectral analysis of the signal to extract patterns related to human walking and vehicle displacement [41]. Subsequently, a feature extraction process of this spectral analysis is performed, with the main extracted features being the mean and standard deviation of the points that make up the spectral analysis, as well as the kurtosis and skewness, among others. These features are normalized, being the inputs to the One-Class SVM applied to recognize the patterns of human walking or vehicle approach (each RADAR has its own independently trained One-Class SVM). The main advantage of One-Class SVM training is that it is an unsupervised learning algorithm which can be used to recognize and filter out anomalies (i.e., outliers) by training with only one target class [42]. In the present work, the target class can be pedestrian or vehicle depending on the position of the RADAR used. As previously proven, the One-Class SVM was the best-performing ML technique for pattern recognition compared to other techniques. Figure 3 shows the entire transformation process, from the capture of the RADAR data to obtainment of the result of the analyzed pattern.
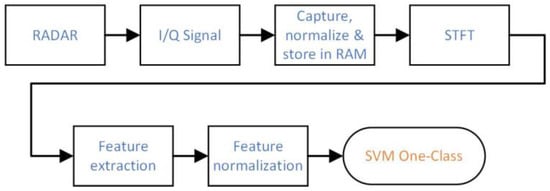
Figure 3.
Signal processing process and output for each One-Class SVM.
Moreover, fuzzy logic is used to analyze the information from the magnetic field sensor in charge of recording the magnetic field disturbances around the pedestrian crossing. In this case, the system identifies the presence of a moving, stopped, or parked vehicle near the crosswalk by analyzing the variation in the magnetic field and the corresponding time intervals. This analysis is based on a set of rules proposed by an expert. It should be noted that the operators used in the fuzzy logic process are the minimum T-norm [43] as a conjunction and implication operator. The defuzzification process is carried out using the “first infer, then aggregate” (FITA) method, which is more consistent than the “first aggregate, then infer” (FATI) method [44]. In this process, the maximum value point (MVP) weighting method is also used as a result [45].
Once the high-level information is obtained from each and every sensor (i.e., information generated from the data), the sensor fusion is performed using the hierarchical classifier. The hierarchical classifier uses the following logic to determine whether targets are present on the zebra crossing. First, the result of the One-Class SVM (i.e., to determine the presence of pedestrians) is evaluated. If the targets are present, the result of the fuzzy logic of the magnetic field sensor is evaluated to determine whether there is no presence of vehicles and that there is the presence of a pedestrian on the zebra crossing. As it can be seen in Table 3, as long as the RADAR sensor for pedestrians is active and the magnetic field variation sensor is not activated, the result will be the presence of pedestrians regardless of the value of the vehicle-oriented RADAR. Thus, priority is given to activate the system when there is a pedestrian on the crosswalk in front of an approaching vehicle. Finally, the output provided by the vehicle-oriented RADAR is evaluated, which can inhibit the activation of the intelligent crosswalk for a certain time if it detects the presence of a vehicle approaching or passing the pedestrian crossing. Table 3 shows the logic used to determine the presence of pedestrians or vehicles on the crosswalk.
Table 3.
Logic used to determine the presence of targets on the zebra crossing.
4. Materials and Methods
Section 4.1 describes the design of a speed bump with an arched shape, distinguishing between smart and simple nodes connected by a dovetail system. In Section 4.2, the materials used are highlighted, including isophthalic–orthophthalic polyester resin for single nodes and epoxy–marble composite for smart nodes. The electronic layout and protective layer for solar panels are explained. Section 4.3 details methods, starting with preliminary tests on resin mixtures and progressing to tensile, compression, and hardness tests. The selected resin ratios, reinforced with carbon fiber and fiberglass, are discussed based on test outcomes.
4.1. Design
According to current regulations, a speed bump must have a cross-section of a circular segment with a maximum height of 70 mm and a depth of 600–1200 mm for roads limited to 50 km/h [18]. As a proposal, a curved surface (cross-section of a circular segment) was conceived using an arched shape with a maximum height of 40 mm and a minimum height of 5 mm on a 600 mm × 720 mm ground plan. Both smart and simple nodes have the same shape when placed on the roadway. The difference between them is in the electronics: the smart nodes contain the circuitry inside, along with twelve solar panels, while the simple ones have catadioptric stickers on top. To link each element of the speed bump to the next, a dovetail-type tongue and groove system was implemented (Figure 4).
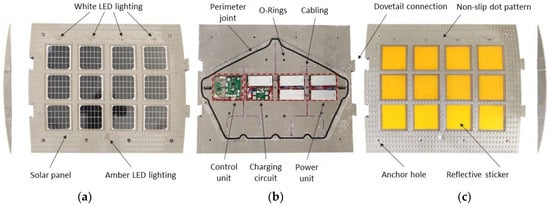
Figure 4.
Representation of the road signaling system: (a) profile/top view of an intelligent node, (b) interior layout of an intelligent node, and (c) profile/top view of a simple node.
4.2. Materials
For the manufacture of the single nodes, isophthalic–orthophthalic (ISO-ORTO) polyester resin was used, to which a calcium carbonate load (10 µm) was added in a 1:1 ratio (9.5 kg of resin and 9.5 kg of aggregate). Specifically, the resin is Cronolita 3015/2009-22 EL TIX (unsaturated polyester resin with 22% ISO and 78% ORTO). This resin is semi-flexible, is light stabilized, and has medium thixotropic reactivity. Its main application is the production of industrial parts requiring flexibility and high mechanical performance. Table 4 shows the properties of the unreinforced polymerized resin. In the single nodes, Cronolite mixed with marble aggregates was reinforced by a 300 g/m2 glass fiber Roving fabric coated with a silane coupling agent. Specifically, the characteristics are defined in Table 5.
Table 4.
Properties of the unreinforced polymerized resin.
Table 5.
Specifications of Roving fabric.
The smart nodes were designed to internally support the system electronics. To include the circuitry, four 120 mm × 130 mm cavities were defined, interconnected by 10 mm wide channels through which the wiring flows. The cavities used to fulfil this function cause a reduction in the overall resistance, and this reduction is necessary to distribute them to prevent the part from sinking when vehicles pass through. Due to the greater restrictions of these nodes, a composite of epoxy resin mixed with marble aggregates in equal proportions was used. Although the reinforcement of the whole part could be performed by including a fiber mesh, this would interfere with the sensors of the system. Therefore, it was decided to reinforce the most stressed part (i.e., the part where a vehicle comes into contact) with a 10 cm strip of 160 g/m2 taffeta carbon fiber from the leading edge.
Figure 4b shows the layout of the electronic system as placed in the cavities of a smart node. The cavities were placed in the central part of the bump’s back, aiming to have a horizontal partition above them with the maximum possible height (i.e., 8 mm). A recess houses the control unit, together with a Raspberry Pi Zero W board. The battery modules are grouped in pairs, separated by an insulating sheet of vulcanized fiber with a thickness of only 0.4 mm. Two pairs of battery modules are placed in two of the recesses, and a third recess, together with the charger, houses the fifth pair of batteries.
The final solution to protect both the solar panels and the reflectors of the nodes consisted of a layer of transparent epoxy resin with a 110 mm × 120 mm optical brightener anti-UVA filter. Specifically, Resoltech WWA/B resin was used.
4.3. Methods
Based on the functionality requirements of the smart nodes, a set of preliminary laboratory tests were carried out, looking for a material that would find a balance between the mechanical properties and production cost of the speed bump. Thus, different ratios of infused and flexible epoxy resin were mixed: 60–40%, 50–50%, 25–75%, and 100–0%. Specifically, Resoltech 1050 and Castropox 4307 FLEX resins were used, both suitable for cold injection on aluminum molds to manufacture high-performance parts with reinforcement fibers and a certain elasticity. Three types of initial tests were carried out to characterize the mixtures: tensile, compression, and Shore A/D hardness.
To determine the tensile strength properties, a test was initially applied with a 20 kN CODEIN multi-test machine and precision greater than 1%. In addition, the following tensile tests—and also compression tests—were carried out with a Servosis ME 403/200 kN universal test unit, following the prescriptions of the UNE-EN ISO 527-1:2019 [46], UNE-EN ISO 527-2:2012 [47], and UNE-EN ISO 604:2002 [48]. The first test was carried out by an external company to characterize the samples that they themselves prepared, while the rest of the tests were carried out by the authors in their own research laboratories to characterize our own mixtures.
The samples for the initial tensile test were prepared by grinding them and then carrying out the test at 20 °C, with a humidity of 50% and a speed of 10 mm/min. In this test, 5 samples with a 0–100% ratio of 160 mm long by 20 mm wide, thickness between 5.1 and 7.3 mm, and section between 101.8 and 146.6 mm2 were used. For additional tensile tests, standardized samples of 170 mm in length were employed, with a 115 mm gap between jaws, a 75 mm reference length (L0), a 10 × 10 mm section, and a constant speed of 0.02 mm/s. These tests adhered to the UNE standards, conducted under conditions of 22 °C and 58% humidity. Six samples of each mixture type underwent additional tensile tests, with the measurement showing the highest deviation discarded. Due to the unavailability of extensometers, the modulus of elasticity was approximated from the slope of the regression line in tensile tests spanning 8–30% deformations. The strain value was set in each test based on the stress–strain curve obtained, always with small variations in these values. After setting the deformation percentages, the test equipment software automatically determined the modulus of elasticity. The deformation percentage could be adjusted based on the stress–strain graph obtained after the test. Moreover, in the compression tests, samples of 10 mm × 10 mm × 50 mm were used with same speed.
The Shore test made it possible to determine the hardness from the elastic reaction of the material when an object was dropped on it. To do this, we prepared the test material to present a flat, clean, polished surface perpendicular to the instrument. Four tests were carried out in different places since the shock produces local hardening of the surface that affects the result, although it leaves practically no trace in the material. Initially, a hardness tester was used to determine the Shore A hardness. Subsequently, the Kern HDD 100–1 equipment (Kern & Sohn GmbH, Balingen-Frommern, Germany) was used to determine the Shore D hardness of the rest of the samples following the UNE-EN ISO 868:2003 standard [49]. For this, 12 samples were used for each mixture of 4 mm thickness. Subsequently, the two extreme values, both the upper and the lower, were eliminated. The authors understand that, due to the type of resin used, the Shore D test is more suitable for its characteristics, although it is possible to make an equivalence between the Shore A and Shore D tests, as performed in the following sections.
Based on the initial results, the mixture with a 0–100% ratio was discarded. Subsequently, the 60–40% ratio was waived to minimize costs. Therefore, the compression tests were focused on six samples of the 50–50% and 25–75% mixtures. Once the tests were carried out with the different series as described, two mixtures with a proportion of 25–75% reinforced with carbon fiber and fiberglass were manufactured to analyze the improvement of this solution, testing them with traction at constant speed.
5. Mechanical Analysis
Section 5.1 examines the structural assessment of an intelligent node supporting electronic circuitry within a speed bump. The study involves stress analysis, material considerations, and load studies, ensuring safety margins. Section 5.2 focuses on the optical characterization of solar panels within smart nodes, comparing protection materials and highlighting the choice of epoxy resin for durability and cost-effectiveness. Section 5.3 details mechanical tests on composite materials, guiding the selection of an optimal mixture for the speed bump. Section 5.4 covers additional tests, including stain resistance and IP68 tightness, ensuring functionality and protection against dust and liquids. Section 5.5 discusses the material choices and cost considerations, emphasizing practicality and performance in the development of intelligent speed bumps.
5.1. Structural Assessment
In this section, the stress study of an intelligent node is described, as it is the one that supports the electronic circuitry inside. To perform the model and calculation, two different elements were initially proposed: base material with epoxy resin and tempered glass that is 7 mm thick on the surface. The latter would be attached to the solar panels by means of a Dow Corning 7091 sealing adhesive. The edges of the speed bump perpendicular to the direction of approach of the vehicles were reinforced by a 10 cm band of carbon fiber.
The structural analysis of a constitutive element of the previous speed bump was carried out by using the SolidWorks simulation tools package (SolidWorks 2017) from its computer-aided design (CAD) model, using a mesh of 3D tetrahedral elements. Table 6 summarizes the properties of the applied materials according to the manufacturer.
Table 6.
Mechanical properties of materials.
For the load study, the weight of a wheel with a value of 12,500 N was considered, equivalent to a vehicle of 50 kN distributed on the surface and applied in six different load states: four on rectangular glass elements and two on the material composed of epoxy resin with carbon fibers (Figure 5). Of course, it could be a vehicle with several wheel axles and a higher total weight. For comparative purposes, the simple nodes allow for the transit of vehicles of up to 120 kN. It must be taken into account that the piece has double symmetry, with the exception of the tongue and groove. Regarding the restrictions applied to the model, sliding elements were used horizontally to the entire base, and ball joints were used in the four holes that the model presents to anchor it to the road.
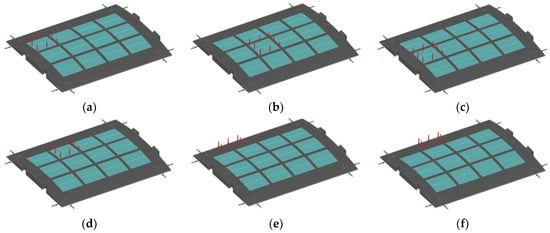
Figure 5.
Load patterns: (a) state I, (b) state II, (c) state III, (d) state IV, (e) state V, and (f) state VI.
Regarding the results of the mechanical model, it should be noted that none of the load states analyzed exceeded the breaking stress of the materials, reaching global safety coefficients greater than 1.30. As an example, the stress states (Figure 6a) and deformation (Figure 6b) of the model corresponding to load state II of Figure 5 above are represented. Thus, in Figure 6a, it can be seen that the maximum combined stress, applying the Von Mises criterion, reaches a value of 15.3 MPa, whilst the maximum deformation for the same load state is only 0.08 mm (Figure 6b). Table 7 summarizes the results for all load states.
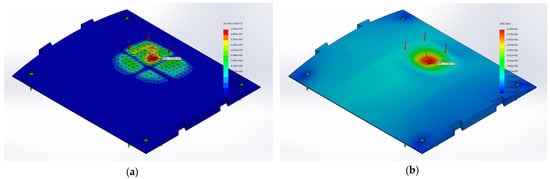
Figure 6.
(a) Von Mises stresses (N/m2). (b) Deformed state (mm) at 300:1 scale.
Table 7.
Summary of load combination.
A dynamic model of the speed bump with six vibration frequencies was made at the same time as the static model, obtaining higher stresses than those of the static calculation. Specifically, in load state III, deformations of 0.13 mm and stresses of 37.8 MPa were obtained, higher than the tensile strength of tempered glass. For this reason, it was decided to change the tempered glass by using Resoltech WWA/B epoxy resin, which provides higher tensile strength values (31 MPa).
5.2. Optical Characterization
The smart nodes of the speed bump consist of a set of solar panels that provide energy for its operation. To know the influence of the protective material used in the solar panels, a characterization process was carried out by measuring the typical properties of the panels in three situations under standard test conditions. The first situation allowed us to determine the performance of the solar panel without any type of protection; with the second, the performance of the solar panel protected by 7 mm of tempered glass with a transmittance of 88–92% was obtained; and the third determined the usefulness of the solar panel protected with 7 mm epoxy resin with high transparency and stability against UV radiation.
The characterization methodology consisted in protecting three different panels of the speed bump with the above elements and comparing both the average and the standard deviation of the values obtained. The characterization obtained in the case of unprotected solar panels provided the best results (see Table 8). These values were taken to calculate the losses in each of the situations described (Table 9).
Table 8.
Absolute measurements of solar panels under standard test conditions.
Table 9.
Loss of performance, depending on the protection used on the solar panels.
5.3. Mechanical Characterization
A total of 18 tests were carried out on three mixtures of six samples each, obtaining the following average values (Table 10).
Table 10.
Average values obtained in tensile tests.
To better assess the different manufactured mixtures, Figure 7 presents the most representative results obtained in the tensile tests for the three series. Table 11 presents the values obtained in the tensile tests for mixtures with a ratio of 25–75% reinforced with carbon fiber (CF) and glass-reinforced plastic (GRP) for comparative purposes.
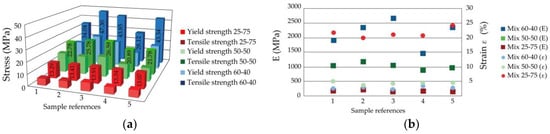
Figure 7.
Parameters obtained in tensile tests for unreinforced mixes: (a) yield and tensile strength and (b) modulus of elasticity and strain.
Table 11.
Average values of tensile tests on samples with carbon fiber and fiberglass reinforcements.
Figure 8 shows the Shore D hardness for different mix ratios. It should be said that the hardness for the 0–100% mixture found an average value of 97 on the Shore A scale, which is equivalent to 51 on the Shore D scale. This value is consistent with the results found for the Shore D hardness tests later.
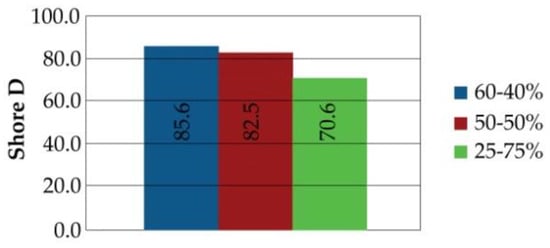
Figure 8.
Average values obtained in the Shore D hardness test.
5.4. Additional Qualification Tests
The usefulness of the speed bump profile for both simple and intelligent nodes—since they are located on the road—requires that a demanding functionality be achieved. Different stain-resistance tests were utilized to assess the speed bumps. In addition, the protection degree against solids and liquids of the smart nodes was marked as ingress protection (IP) 68.
The stain-resistance test is interpreted as the difficulty of removing any substance or product in contact with the surface without reacting with it (which would constitute a chemical attack). Hence, a greater stain resistance means easier cleaning (usually using only water). On the contrary, a lower stain resistance means greater difficulty in removing stains (without the use of solvent, which would constitute a chemical attack). This test contemplates different types of staining agents (i.e., those that leave a trace or produce an overlay) and different cleaner agents (e.g., hot water, soft products with a neutral pH, and abrasive products with a high pH). Also, the normative beheld four cleaning procedures (i.e., water jet, manual, mechanical, and solvent-based).
Finally, the smart nodes passed a tightness test to ensure the protection of the electronics contained in the interior. The protection grade IP68 is the maximum level of protection achieved against particles such as dust and liquid (e.g., sand and water). The degree of protection is regulated by the IEC 60529 international standard [50], which corresponds to UNE-EN 60529:2018 [51] according to the Spanish Association for Standardization and Certification (AENOR). In that way, «IP» stands for the grade of protection, «6» indicates the degree of protection against solids (which is the maximum degree) and «8» indicates the degree of protection against liquids (which indicates continuous complete immersion in water, with «9» being the top degree protection).
A smart node was tested for IP68 protection degree by following the UNE-EN 60529:2018+A1:2018+A2:2018 standard [52], which is the official Spanish version of the Europe normative EN 60529:1991+A1:2000+A2:2013 [53]. The test equipment used was the following:
- -
- Flexometer (trademark/model) ESLON SEKISUI/2 m;
- -
- Stopwatch (trademark/model) STOP WATCH/RS PRO;
- -
- Dust camera (trademark/model) INELTEC/CEP 1000;
- -
- Auxiliary equipment consisting of a water container.
Before the tests, the shape integrity was checked to identify possible deterioration, and we observed a satisfactory condition after transporting the piece to the laboratory. Concerning the dust test, the envelope of category 1 (i.e., under pressure) was considered. For this purpose, the internal volume of the electronics compartment casing was calculated to obtain the number of air renewal cycles of that volume. Next, the internal pressure of the equipment was reduced by using a vacuum pump.
Due to the nature and special features of the sample, the air changes obtained with the mathematical calculations could not be carried out. Therefore, the highest period of exposure to dust required by the standard was considered. Thus, the envelope was measured by varying the internal pressure of the speed bump in a vacuum chamber and tested for 8 h of operation (Figure 9a).
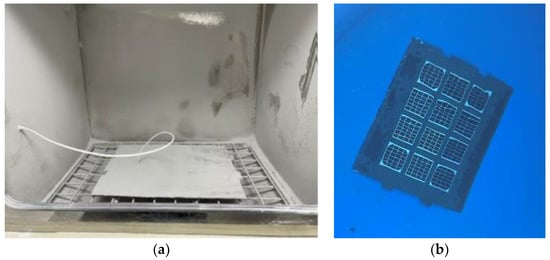
Figure 9.
Sample during IP68 test: (a) dust camera and (b) water container.
At the end of the test, the sample was taken from the test chamber. The dust deposited on the envelope outside was eliminated to prevent the entry of particles inside the equipment. When the envelope was opened, it was observed that no dust was deposited inside.
Regarding the test of the second characteristic of IP X8, an immersion was carried out at a depth of 1 m for 24 h (Figure 9b). In order to verify this characteristic, the envelope outside was cleaned to prevent water from entering inside the sample. Once cleaned, the envelope interior was inspected to check for possible water deposits.
5.5. Discussion on Materials and Methods
In terms of the mechanical and optical properties, the tests revealed that the solar panel protected with tempered glass exhibited the best performance, while protection with epoxy resin resulted in lower efficiency. Despite this, protection with epoxy resin was prioritized due to its greater tensile and compression resistance than glass, as these characteristics give it a longer useful life. In addition, the resin offers the advantage of having a lower manufacturing cost and greater adherence to the passage of vehicles.
Concerning the composite material with resins for the speed bump, the tests determined a significant reduction in resistance, as the percentage of infusion epoxy resin was reduced. In addition, an important decrease in the elasticity modulus was observed and, consequently, a very significant increase in the deformations in the mixture with a 25–75% proportion was achieved. For this proportion, the tensile strength was reduced by approximately 66% compared to the 60–40% mixture, so it was discarded in future tests.
From the results obtained, it can be affirmed that a tensile strength of slightly less than 50% of the compressive strength was observed in the mixtures studied. The resistance and deformation values confirmed that the mixture with a 25–75% proportion should be discarded, as it presents low resistance and high deformations. In view of the results, it was verified that the mixture with fiberglass significantly improved the properties compared to those without reinforcement.
Regarding the Shore D hardness, the tests found a decreasing trend for the 60–40%, 50–50% and 25–75% mixtures. The hardness decreased slightly between the 60–40% and 50–50% mixtures (less than 4%), while the decrease was much more noticeable in the 25–75% mixture, reaching a value of 70.6. This value represents a reduction of almost 18% with respect to the 60–40% mixture. In any case, the hardness achieved in the three mixtures was much higher than the minimum Shore D 40 required by the UNE ISO 868/98 for traffic regulations.
Considering the results and a cost ratio of 1:2 between flexible and infusion resin, the chosen option was a 50–50% mix—as it demonstrates a significantly higher mechanical performance than the mix with a 25–75%—that we reinforced with fiber. Therefore, the economic estimate of the material consumption to manufacture a simple speed bump was EUR 112.67, while the material consumption to manufacture an intelligent node for the speed bump was EUR 334.08. As a reference, a pedestrian crosswalk on a standard two-way street with 12 simple nodes and 6 smart nodes would cost EUR 3356.52. Moreover, it is necessary to include an additional cost of EUR 404.98 for each node due to the electronics.
From another perspective, the stain-resistance tests carried out obtained a classification of 5 when applying type 1 agents (i.e., a green agent that leaves traces). This result indicates that the stain can be removed with warm water at room temperature. A classification of 4 was obtained for the type 3 agents, such as diesel, synthetic oil, and tire rubber, demonstrating that the stain can be removed with a soft active cleaning agent. Lastly, a classification of 1 for silicone was achieved, thus resulting in a persistent stain.
In the watertightness test, a degree of protection corresponding to IP 6X was determined (i.e., no accumulation of dust inside the speed bump). Furthermore, the results indicated sufficient protection for the IP X8 protection grade.
6. Experimentation
Several tests were carried out on a real scenario located on the University Campus of La Rábida, Huelva (37.2 N, −6.92 W). This environment accommodates around 3600 people—between students and staff—and there are different administrative units (e.g., classrooms, offices, and car parks) and a residential area. The location of a pedestrian crossing was chosen while considering the lighting criteria, high influx of both people and vehicles, and poor conservation/signposting of the crosswalk. The road is located at the confluence of two straight sections of 60 and 90 m, respectively, with a speed limit of 30 km/h (Figure 10).
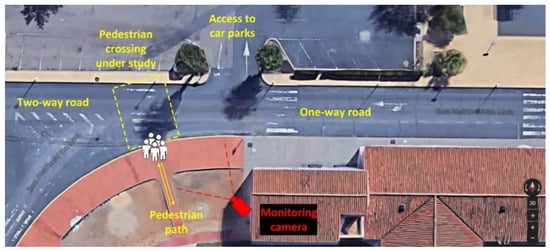
Figure 10.
Location of the scenario under study.
6.1. System Performance Assessment
The experimentation carried out with the previous prototype found an average accuracy of 94.64%, which, according to the receiver operating characteristic (ROC) analysis, corresponds to a very good test accuracy = [0.9, 0.97) and a precision of 100% because no false positives were obtained (Table 12). Observing the different case studies, we found that the best results were obtained in the detection of vehicles in the direction of the road, as well as bicycles, baby carriages, and groups of people in the direction of the zebra crossing. On the contrary, we found worse results both in the detection of one person and of several people crossing simultaneously in the opposite direction. On the one hand, this suggests that the prototype is more efficient the larger the volume of objects to be detected (e.g., bicycles or baby carriages vs. a person). This was found to be due to the placement of the sensors at the level of the asphalt, which reduces the effectiveness when detecting lower extremities in front of the torso or other larger parts. On the other hand, the study suggests that the passage of bicycles and motorcycles was not a problem for the type of RADAR sensors used, such as ultrasound.
Table 12.
ROC analysis of the previous prototype system based on fuzzy logic.
The current proposed system was tested in real traffic situations for 15 days for comparative purposes. The experimentation found a success rate dependent on the shape and speed of the targets. For this reason, the data were separated into persons and vehicles with speed ranges of 0–10 km/h, 10–20 km/h, 20–30 km/h, 30–40 km/h, and more than 40 km/h (Table 13). Specifically, an excellent success rate was obtained when the target was a person. In the case of vehicles, we found that the success rate improves the higher the speed. This suggests that the proposed AI algorithm differentiates the targets well because of their different speed (i.e., persons vs. cars). This represents a significant improvement in the TPR when comparing the proposed ML algorithm with the previous fuzzy logic. Conversely, it does not differentiate targets so well when the speed is more even (i.e., cars driving at human speeds). Nevertheless, the results obtained in real environments differ greatly from those obtained in training, testing, and validation in the laboratory, with an average accuracy of 91.20%. This difference suggests that the One-Class SVM model might be running in an environment that has changed compared to the environment used to train. Although the total result of the system is moderate, this opens a research line to improve the ML algorithm in low-speed scenarios, providing more data for a more robust model or different techniques, such as Random Forest or Tree Bagger, as they led to good results in the lab validation and testing [40].
Table 13.
ROC analysis of the proposed system based on the ML algorithm.
6.2. Impact on Pedestrian Behavior
To validate the proposed system, a comparison was carried out on the behavior of pedestrians and vehicles between a traditional zebra crossing and the intelligent crosswalk. Figure 11 shows a photogrammetric analysis of 294 video sequences taken over a classic pedestrian crossing. The processing of 1.12 GB of data resulted in a total of 104 pedestrians and 125 vehicles (i.e., cars, trucks, motorcycles, and others). On the one hand, we found a large dispersion between the trajectories followed by people when crossing the crosswalk (62.31% erratic). On the other hand, we observed an average speed of 30.94 ± 4.41 km/h and 38.04 ± 4.98 km/h in vehicles during daytime and nighttime hours, respectively (Δ = 22.95%). These results reflect a low awareness of road safety on the part of pedestrians and drivers, respectively. Among the most notable incidents found, it is worth highlighting a car parked in the yellow zone just before the pedestrian crossing, a car passing the crosswalk without stopping in front of two pedestrians, a car driving in reverse, four cars parked on the zebra crossing, a motorcycle traveling at 68.10 km/h, and two people crossing while handling their mobile phone.
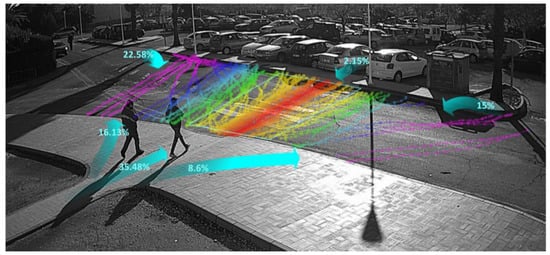
Figure 11.
Pedestrian trajectories on a classic zebra crossing.
Figure 12 shows a photogrammetric analysis of 393 video sequences taken over an intelligent crosswalk for comparative purposes. The processing of 1.69 GB of data determined a total of 21 pedestrians whose trajectories were narrower and less erratic than in the classic crosswalk (66.6% centered vs. 33.33% erratic). This suggests that the presence of the intelligent signaling system influences how pedestrians cross the road, improving the trajectory of users within the safe limit of a zebra crossing by 46.5%. An analysis of 162 vehicles driving on the intelligent crosswalk determined an average speed of 20.78 ± 8.36 km/h during the day and 11.16 ± 8.02 km/h at night (Δ = −46.29%). We also found a decrease of 32.83% in speed during the day and 70.6% at night when comparing the average speed of the vehicles with a classic zebra crossing. This suggests that the presence of the intelligent road signaling system decreased the speed of cars significantly, considering that the speed is higher in situations of greater lighting contrast (i.e., at night).
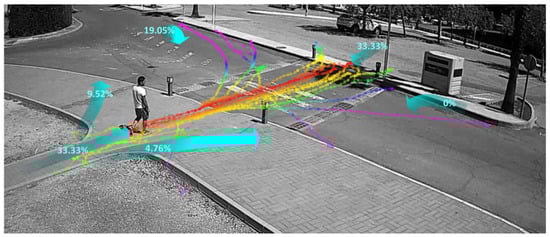
Figure 12.
Pedestrian trajectories on the intelligent crosswalk under study.
6.3. Discussion on Safety Improvement
The advantages of using active signaling through smart devices would reduce the accident rate in relation two lines of action: (i) road condition as the cause and (ii) driver as the cause. Regarding the state of the road, according to official statistics [54], it can be inferred that the signaling of pedestrian crossings at night would prevent 26.26% of injuries and 35.4% of deaths. It would also prevent 9.68% of injuries and 14.28% of deaths by improving the lack of visibility due to climatic causes, and 41.18% of injuries and 0.81% of deaths would be prevented by improving perception of obstacles (e.g., urban buses). Regarding the driver as the cause of the accident, there is a 2% reduction in accidents with injuries and a 4% reduction in fatal collisions for every 1% decrease in average speed according to Nilsson’s model [55]. By applying this model, it can be inferred that the intelligent pedestrian crossing could lead to a speed adjustment on roads, preventing 6.07% of injuries and 12.15% of deaths during the day, and 42.46% of injuries and 84.52% of deaths at night compared to conventional zebra crossings. The advantage of active signaling is therefore significant, although it is greater in high-contrast situations (e.g., at night, sunrise, and sunset).
7. Conclusions
Certain points on the road demand special attention, requiring reduced driving speeds. Road signs and speed bumps aid these goals. Nevertheless, many existing solutions lack commercial availability, require costly infrastructure, lack intelligence, or overlook all road users. This study introduces an innovative solution to address these concerns—an affordable, TRL8 maturity-level speed bump that is adaptable to various road types, including one-way and two-way streets. Additionally, its applications extend to garage entrances/exits and low-visibility intersections.
This novel speed bump system comprises independent nodes featuring an embedded electronic system with sensors and wireless communication capabilities. Leveraging AI, the smart system identifies pedestrians on zebra crossings and alerts drivers through light signals. It operates autonomously for 8 days, consuming 22.63 Wh/day, eliminating the need for an electrical connection, and promoting energy efficiency. Preliminary tests, which were conducted over 15 days with a traffic volume of 155 vehicles/day under sun exposure, demonstrated the system’s capacity for autonomous operation and protection of internal electronics.
A notable aspect of the proposed system is the use of resin, aggregates, and reinforcing fibers for cold infusion in an aluminum mold. The intelligent nodes exhibit the ability to bear loads equivalent to 5 Tm vehicles, while simpler nodes can handle up to 12 Tm vehicles. The ratio of epoxy resins significantly influences the smart nodes’ tensile strength and deformation, with the 50–50% fiberglass-reinforced mixture identified as the optimal choice due to superior mechanical properties and cost-effectiveness. The optical characterization reveals a 20.58% performance loss of solar panels due to epoxy resin compared to tempered glass, though the latter offers superior mechanical properties.
The results demonstrate the system’s effectiveness in classifying pedestrians with an accuracy of 99.11% and a false-positive rate of 0.0%, a substantial improvement over the previous fuzzy logic-based system with an accuracy of 81.33%. This underscores the potential of machine learning techniques, particularly the One-Class SVM algorithm, in enhancing road safety through precise and reliable pattern recognition.
In terms of the real-world impact on road safety, user attitude tests reveal reduced pedestrian erratic behavior (33.33% with intelligent crosswalk vs. 62.31% with a conventional crossing) and decreased driver speed (32.83% during the day and 70.6% at night). The models suggest that night signaling could prevent injuries and deaths, estimating that the system has the potential to reduce injuries and fatalities during both day and night, particularly among individuals over 55 years of age.
Our future work will focus on examining the feasibility of using more cost-effective cold infusion materials, such as rubber, polyurethane, or acrylic resins, while preserving the mechanical characteristics established in this study. Other initiatives will focus on evaluating slip resistance in wet conditions and evaluating the long-term wear of the material. To further improve and optimize the system, we propose to further incorporate alternative sensors and machine learning algorithms to increase accuracy and reliability. Finally, the system’s performance in low-speed scenarios requires further investigation and testing in diverse environments to evaluate its effectiveness in different urban scenarios.
Author Contributions
Conceptualization, T.d.J.M.S.; methodology, T.d.J.M.S., J.M.L.D., M.J.R.G., and J.M.D.M.; software, J.M.L.D.; validation, T.d.J.M.S.; formal analysis, J.M.D.M.; investigation, T.d.J.M.S.; resources, T.d.J.M.S.; writing—original draft preparation, T.d.J.M.S., J.M.L.D., M.J.R.G., and J.M.D.M.; writing—review and editing, T.d.J.M.S. and J.M.D.M.; visualization, T.d.J.M.S. and J.M.D.M.; supervision, T.d.J.M.S.; project administration, T.d.J.M.S. All authors have read and agreed to the published version of the manuscript.
Funding
This work was financed by the General Secretariat of Universities, Research and Technology within the scope of the Andalusian Research, Development and Innovation Plan (PAIDI 2020) and the European Regional Development Fund.
Data Availability Statement
Data are contained within the article.
Acknowledgments
We would also like to express our very great appreciation for J.M. Corralejo Mora for his valuable and constructive work that helped to improve this research.
Conflicts of Interest
The authors declare no conflict of interest.
References
- Godavarthy, R.P.; Russell, E.R.; Mirzazadeh, B. Speed Reduction Mitigation Strategies on Rural Highways at Two-Way Stop Control Intersections and Curves. J. Transp. Technol. 2017, 7, 423–437. [Google Scholar] [CrossRef][Green Version]
- Siuru, B. A Super-safe Smart Crosswalk. Electron. Now 1999, 70, 48–86. [Google Scholar]
- Matrella, G.; Marani, D. An Embedded Video Sensor for Smart Traffic Light. In Proceedings of the 2011 14th Euromicro Conference on Digital System Design, Oulu, Finland, 31 August–2 September 2011; pp. 769–776. [Google Scholar] [CrossRef]
- Ballestín, A.A. Philips Crea un Paso de Peatones LED que Avisa de la Presencia de Vehículos Silenciosos. Technical Report. 2010. Available online: https://www.diariomotor.com/2010/03/30/pasos-de-cebra-con-leds-en-el-suelo-otra-idea-innovadora-mas/ (accessed on 17 November 2023).
- Rtb Gmbh & Co., Kg. Device for Protecting Pedestrian Crossing. Germany Patent DE202004006444, 23 April 2004. [Google Scholar]
- Robin Green, D.; Ward, J.; Wyper, N. Solar-Powered Wireless Crosswalk Warning System. U.S. Patent 7317405-B2, 8 January 2008. [Google Scholar]
- Harrison, M.A. System of Lights That Are Embedded in the Roadway at Crosswalks. U.S. Patent 6384742-B1, 7 May 2002. [Google Scholar]
- Ortiz Carranza, J. Señalizador para Paso de Cebra. Spain Patent ES1034252U, 29 May 1996. [Google Scholar]
- Hernández González, A.M.; Camarasa Gómez, S. Paso de Peatones con Detector y Avisador de Presencia. Spain Patent ES2310120, 27 March 2007. [Google Scholar]
- Pelayo Sanchez, J.M. Illuminated Signalling Device for Pedestrian Crossings. Spain Patent ES1067629-U, 4 April 2008. [Google Scholar]
- Pozo Macho, A. Dispositivo luminoso que alerta a los conductores de peatones cruzando por pasos de cebra. Spain Patent ES2311398, 3 April 2007. [Google Scholar]
- Ruiz Cuenca, J.C. Dispositivo luminoso de señalización. Spain Patent ES1076871, 12 April 2012. [Google Scholar]
- Afonso Cabrera, Á. Sistema de Seguridad de Iluminación Empotrada para Pasos de Peatones. Spain Patent ES2388535, 20 October 2009. [Google Scholar]
- European Parliament. Directive (EU) 2019/1936 amending Directive 2008/96/EC on road infrastructure safety management. Off. J. Eur. Union 2019, L305, 1–16. Available online: https://eur-lex.europa.eu/legal-content/EN/TXT/PDF/?uri=CELEX:32019L1936&from=LV (accessed on 13 November 2023).
- Lozano Domínguez, J.M.; Mateo Sanguino, T.J. Review on V2X, I2X, and P2X Communications and Their Applications: Comprehensive Analysis over Time. Sensors 2019, 19, 2759. [Google Scholar] [CrossRef]
- Boulter, P.G.; Hickman-Davis, J.M.; Latham, S.; Davison, P.; Whiteman, P. The Impacts of Traffic Calming Measures on Vehicle Exhaust Emissions; Transport Research Laboratory: London, UK, 2001; Volume 482, Available online: https://trl.co.uk/uploads/trl/documents/TRL482.pdf (accessed on 13 November 2023).
- Infante Francés, M.; Mateo Sanguino, T.J. Method for Characterizing Traffic Calming Measures to Evaluate their Impact on Pollution. DYNA 2022, 97, 392–397. [Google Scholar] [CrossRef] [PubMed]
- Ministerio de Fomento. Instrucción Técnica para la instalación de reductores de velocidad y bandas transversales de alerta en carreteras de la Red de Carreteras del Estado. Centro de Publicaciones, Orden FOM/3053/2008. 2008. Available online: https://www.mitma.gob.es/recursos_mfom/1160101.pdf (accessed on 13 November 2023).
- Bonallach Aguado, J.; Casanovas Viladomiu, I. Disposición de Señalización para Tramos de Vía Pública. OEPM, ES1060684U, 2005. [Google Scholar]
- Figueras, C. Paso de Peatones con Señalización Luminosa. OEPM, ES2321794U, 2009. [Google Scholar]
- Htike, K.K.; Hogg, D. Adapting pedestrian detectors to new domains: A comprehensive review. Eng. Appl. Artif. Intell. 2016, 50, 142–158. [Google Scholar] [CrossRef]
- Ibrahim, M.A. Development of Fuzzy Inference Systems for Accurate Pedestrians Detection in Traffic Areas. Comput. Sci. 2020. Available online: https://api.semanticscholar.org/CorpusID:237012260 (accessed on 13 November 2023).
- Chai, C.; Shi, X.; Wong, Y.D.; Er, M.J.; Gwee, E.T.M. Fuzzy logic-based observation and evaluation of pedestrians’ behavioral patterns by age and gender. Transp. Res. Part F Traffic Psychol. Behav. 2016, 40, 104–118. [Google Scholar] [CrossRef]
- Ibarra-Bonilla, M.N.; Escamilla-Ambrosio, P.J.; Ramirez-Cortes, J.M.; Vianchada, C. Pedestrian dead reckoning with attitude estimation using a fuzzy logic tuned adaptive kalman filter. In Proceedings of the 2013 IEEE 4th Latin American Symposium on Circuits and Systems (LASCAS), Cusco, Peru, 27 February–1 March 2013; pp. 1–4. [Google Scholar] [CrossRef]
- Turky, A.M.; Ahmad, M.S.; Yusoff, M.Z.M.; Sabar, N.R. Fuzzy logic application for pedestrian crossing. In Proceedings of the 2008 International Symposium on Information Technology, Kuala Lumpur, Malaysia, 26–28 August 2008; pp. 1–6. [Google Scholar] [CrossRef]
- Shashua, A.; Gdalyahu, Y.; Hayun, G. Pedestrian detection for driving assistance systems: Single-frame classification and system level performance. In Proceedings of the IEEE Intelligent Vehicles Symposium, Parma, Italy, 14–17 June 2004; pp. 1–6. [Google Scholar] [CrossRef]
- Zhang, W.; Dong, S.; Zou, K.; Li, W. Pedestrian Behavior Anomaly Detection Based on Dynamic Mode Decomposition and One-Class SVM. In Proceedings of the 4th International Conference on Image and Graphics Processing (ICIGP ’21), Sanya, China, 1–3 January 2021; pp. 7–12. [Google Scholar] [CrossRef]
- Ren, S.; He, K.; Girshick, R.; Sun, J. Faster R-CNN: Towards Real-Time OBJECT Detection with Region Proposal Networks. Advances in Neural Information Processing Systems. 2016. Available online: https://proceedings.neurips.cc/paper_files/paper/2015/file/14bfa6bb14875e45bba028a21ed38046-Paper.pdf (accessed on 13 November 2023).
- Sukkar, M.; Kumar, D.; Sindha, J. Real-Time Pedestrians Detection by YOLOv5. In Proceedings of the 2021 12th International Conference on Computing Communication and Networking Technologies (ICCCNT), Kharagpur, India, 6–8 July 2021; pp. 1–6. [Google Scholar] [CrossRef]
- Shi, W.; Rajkumar, R. Point-GNN: Graph Neural Network for 3D Object Detection in a Point Cloud. In Proceedings of the IEEE/CVF Conference on Computer Vision and Pattern Recognition (CVPR), Seattle, WA, USA, 13–19 June 2020; pp. 1708–1716. Available online: https://openaccess.thecvf.com/content_CVPR_2020/papers/Shi_Point-GNN_Graph_Neural_Network_for_3D_Object_Detection_in_a_CVPR_2020_paper.pdf (accessed on 13 November 2023).
- Wang, K.; Zhou, T.; Zhang, Z.; Chen, T.; Chen, J. PVF-DectNet: Multi-modal 3D detection network based on Perspective-Voxel fusion. Eng. Appl. Artif. Intell. 2023, 120, 105951. [Google Scholar] [CrossRef]
- Zhou, G.; Qin, P.; Tang, C.; Li, Q.; Wei, Y.; Zhang, J. An anchor-free pedestrian detection algorithm based on visible-thermal feature fusion. In Proceedings of the International Conference on Image, Signal Processing, and Pattern Recognition (ISPP 2023), Sydney, Australia, 23–24 December 2023; p. 1270749. [Google Scholar] [CrossRef]
- Hadjkacem, B.; Ayedi, W.; Ayed, M.B.; Alshaya, S.A.; Abid, M. A novel Gait-Appearance-based Multi-Scale Video Covariance Approach for pedestrian (re)-identification. Eng. Appl. Artif. Intell. 2020, 91, 103566. [Google Scholar] [CrossRef]
- Zeng, W.; Gao, Y.; Pan, F.; Yan, Y.; Yu, L.; Li, Z. Towards Real-time Object Detection on Edge Devices for Vehicle and Pedestrian Interaction Scenarios. In Proceedings of the 2022 41st Chinese Control Conference (CCC), Hefei, China, 25–27 July 2022. [Google Scholar] [CrossRef]
- Mateo Sanguino, T.J.; Rodríguez Román, M.A.; Lozano Domínguez, J.M. System and Autonomous Device for Road Signage and Detection. WO Patent 2018/050945, 22 March 2018. Available online: https://patentimages.storage.googleapis.com/e3/e9/ee/b22f948863c725/WO2018050945A1.pdf (accessed on 13 November 2023).
- Lozano Domínguez, J.M.; Mateo Sanguino, T.J. Design, Modelling, and Implementation of a Fuzzy Controller for an Intelligent Road Signaling System. Complexity 2018, 2018, 1849527. [Google Scholar] [CrossRef]
- Mateo Sanguino, T.J.; Davila Martin, J.M.; Redondo González, M.J.; Lozano Domínguez, J.M.; Corralejo Mora, J.M. Fabricación y Caracterización de un Paso de Peatones Inteligente para Mejora de la Seguridad Vial. DYNA 2023, 98, 341–345. [Google Scholar] [CrossRef] [PubMed]
- Lozano Domínguez, J.M.; Mateo Sanguino, T.J.; Redondo González, M.; Fernández de Viana González, I.J. Over-the-Air Programming System for IoT Devices with a Non-native Wireless Update Service. In Proceedings of the 2nd International Symposium on Automation, Information and Computing (ISAIC), Beijing, China, 3–6 December 2021. [Google Scholar] [CrossRef]
- Dasarathy, B.V. Sensor fusion potential exploitation-innovative architectures and illustrative applications. Proc. IEEE 1997, 85, 24–38. [Google Scholar] [CrossRef]
- Lozano Domínguez, J.M.; Corralejo Mora, J.M.; Fernández de Viana González, I.J.; Mateo Sanguino, T.J.; Redondo González, M.J. Performance Analysis of an Embedded System for Target Detection in Smart Crosswalks Using Machine Learning. In Proceedings of the 17th International Conference on Software Technologies (ICSOFT), Lisbon, Portugal, 11–13 July 2022; in press. Available online: https://www.scitepress.org/PublishedPapers/2022/111427/111427.pdf (accessed on 13 November 2023).
- Lozano Domínguez, J.M.; Mateo Sanguino, T.J.; Véliz, D.M.; Fernández de Viana González, I.J. Multi-Objective Decision Support System for Intelligent Road Signaling. In Proceedings of the 15th Iberian Conference on Information Systems and Technologies (CISTI), Seville, Spain, 24–27 June 2020; pp. 1–6. [Google Scholar] [CrossRef]
- Amer, M.; Goldstein, M.; Abdennadher, S. Enhancing one-class support vector machines for unsupervised anomaly detection. In Proceedings of the ACM SIGKDD Workshop on Outlier Detection and Description; Association for Computing Machinery: New York, NY, USA, 2013; pp. 8–15. [Google Scholar] [CrossRef]
- Aliev, R.A. Fuzzy sets and fuzzy logic. In Fundamentals of the Fuzzy Logic-Based Generalized Theory of Decisions; Studies in Fuzziness and Soft Computing; Prentice Hall: Hoboken, NJ, USA, 2013; Volume 293, pp. 1–64. [Google Scholar] [CrossRef]
- Ibraim, A.M. Embedded fuzzy applications. In Fuzzy Logic for Embedded System Applications; Elsevier Inc.: Burlington, MA, USA, 2004; pp. 69–98. [Google Scholar]
- Buckley, J.J.; Hayashi, Y. Can approximate reasoning be consistent? Fuzzy Sets Syst. 1994, 65, 13–18. [Google Scholar] [CrossRef]
- ISO 527-1:2019; Plastics - Determination of Tensile Properties - Part 1: General Principles. Available online: https://www.iso.org/standard/75824.html (accessed on 15 November 2023).
- ISO 527-2:2012; Plastics - Determination of Tensile Properties - Part 2: Test Conditions for Moulding and Extrusion Plastics. Available online: https://www.iso.org/standard/56046.html (accessed on 15 November 2023).
- ISO 604:2002; Plastics - Determination of Compressive Properties. Available online: https://www.iso.org/standard/31261.html (accessed on 15 November 2023).
- ISO 868:2003; Plastics and Ebonite - Determination of Indentation Hardness by Means of a Durometer (Shore Hardness). Available online: https://www.iso.org/standard/34804.html (accessed on 15 November 2023).
- IEC 60529; Degrees of Protection Provided by Enclosures (IP Code). Available online: https://www.wewontech.com/IEC60529-%20IP-Standard.pdf (accessed on 15 November 2023).
- UNE EN 60529:2018; Degrees of Protection Provided by Enclosures (IP Code). Available online: https://www.en-standard.eu/une-en-60529-2018-degrees-of-protection-provided-by-enclosures-ip-code/ (accessed on 15 November 2023).
- UNE-EN 60529:2013+A1:2018+A2:2018; Degrees of Protection Provided by Enclosures (IP Code). Available online: https://www.en-standard.eu/une-en-60529-2018-a1-2018-degrees-of-protection-provided-by-enclosures-ip-code/ (accessed on 15 November 2023).
- EN 60529:1991+A1:2000+A2:2013; Degrees of Protection Provided by Enclosures (IP Code). Available online: https://standards.iteh.ai/catalog/standards/clc/e2b77354-0f19-4f3c-b5e4-d1fe9b954e0c/en-60529-1991-a1-2000 (accessed on 15 November 2023).
- Menéndez, J.M. Velocidad, 20 preguntas y respuestas. Tráfico Segur. Vial 2015, 230, 18–23. [Google Scholar]
- Nilsson, G. Traffic Safety Dimensions and the Power Model to Describe the Effect of Speed on Safety; Bulletin 221; Lund Institute of Technology: Lund, Sweden, 2004; Available online: https://lucris.lub.lu.se/ws/portalfiles/portal/4394446/1693353.pdf (accessed on 13 November 2023).
Disclaimer/Publisher’s Note: The statements, opinions and data contained in all publications are solely those of the individual author(s) and contributor(s) and not of MDPI and/or the editor(s). MDPI and/or the editor(s) disclaim responsibility for any injury to people or property resulting from any ideas, methods, instructions or products referred to in the content. |
© 2023 by the authors. Licensee MDPI, Basel, Switzerland. This article is an open access article distributed under the terms and conditions of the Creative Commons Attribution (CC BY) license (https://creativecommons.org/licenses/by/4.0/).