
Real-Time Defect Detection Model in Industrial Environment Based on Lightweight Deep Learning Network
School of Mechanical Engineering, Yonsei University, Seoul 03722, Republic of Korea
*
Author to whom correspondence should be addressed.
Electronics 2023, 12(21), 4388; https://doi.org/10.3390/electronics12214388
Submission received: 5 September 2023
/
Revised: 17 October 2023
/
Accepted: 20 October 2023
/
Published: 24 October 2023
(This article belongs to the Special Issue Convolutional Neural Networks and Vision Applications - Volume III)
Abstract
:Surface defect detection in industrial environments is crucial for quality management and has significant research value. General detection networks, such as the YOLO series, have proven effective in various dataset detections. However, due to the complex and varied surface defects of industrial products, many defects occupy a small proportion of the surface and fall into the category of typical small target detection problems. Moreover, the complexity of general detection network architectures relies on high-tech hardware, making it difficult to deploy on devices without GPUs or on edge computing and mobile devices. To meet the practical needs of industrial product defect inspection applications, this paper proposes a lightweight network specifically designed for defect detection in industrial fields. This network is composed of four parts: a backbone network, a multiscale feature aggregation network, a residual enhancement network, and an attention enhancement network. The network includes a backbone network that integrates attention layers for feature extraction, a multiscale feature aggregation network for semantic information, a residual enhancement network for spatial focus, and an attention enhancement network for global–local feature interaction. These components enhance detection performance for diverse defects while maintaining low hardware requirements. Experimental results show that this network outperforms the latest and most popular YOLOv5n and YOLOv8n models in the five indicators P, R, F1, [email protected], and GFLOPS when used on four public datasets. It even approaches or surpasses the YOLOv8s and YOLOv5s models with several times the GFLOPS computation. It balances the requirements of lightweight real-time and accuracy in the scenario of industrial product surface defect detection.
1. Introduction
Surface defect detection is a critical research topic in the field of machine vision. It utilizes machine vision equipment to acquire images and determine whether there are defects in the captured images. The quality inspection of the appearance of industrial products is a key step in ensuring product quality. Often, in the consumer’s mind, the appearance of industrial products is synonymous with product quality, making appearance defect detection a crucial aspect of quality control.
Currently, the majority of enterprises rely on manual inspection for quality control, which brings about issues such as subjectivity, difficulties in standardization, and accuracy and efficiency heavily reliant on the inspector’s experience. In recent years, with the application of deep learning models represented by convolution neural networks (CNNs) in the field of computer vision, significant breakthroughs have been achieved in defect detection technology based on machine vision. Nowadays, using deep learning technology to address detection and segmentation in the industrial field has become a mainstream task. Overall, general-purpose detectors are divided into one-stage, two-stage, and anchor-free types. References [1,2] are one-stage general-purpose detectors and optimizations for one-stage object detectors. References [3,4] are two-stage general-purpose detectors. Reference [5] is an anchor-free general-purpose detector. The abovementioned general-purpose detectors are mainly trained in natural scenes and often cannot be directly transplanted to industrial scenes.
In the field of industrial surface defect detection, References [6,7] focused on global context semantic information for surface defect detection of steel strip and sewer pipe. References [8,9] designed a surface defect detection method based on deep learning. The network built in Reference [10] utilizes context information integrated with multiple pieces of information and applies attention mechanisms to optimize the extraction of rich information on steel plate defects, achieving excellent detection results. Reference [11] proposed a method called the triple-attention semantic segmentation network for small surface defect detection. The classical SENet [12] can be arbitrarily inserted into the classification network, thus enhancing the feature extraction effect of the classification network without adding too many parameters. The convolutional block attention module (CBAM) [13], which pays attention to different dimensions of feature information in both channels and space, has been widely applied to various classification or detection networks. Coordinate attention [14] can be arbitrarily inserted into classification or detection models, capturing cross-channel information as well as direction-sensitive and location-sensitive information to help the model locate and identify targets of interest more precisely. The global attention mechanism (GAM) [15] can amplify global dimensional interaction features while reducing information diffusion.
The aforementioned defect detection methods in the industrial field either have excellent detection performance or meet the requirements of being lightweight, but they do not cater to both. This makes them infeasible for deployment in industrial scenarios where devices without a GPU or edge computing and mobile devices are used. This paper addresses the dual requirements of defect detection accuracy and speed in industrial scenarios and proposes a lightweight object detection network. The network is divided into four parts: a backbone network, multiscale feature aggregation network, residual enhancement network, and attention enhancement network. The model introduces a convolutional block attention module (CBAM) to reduce model capacity and enrich feature information. It carries out information interaction between global features and local features and then fuses the information extracted using residual attention and attention enhancement in the multiscale feature aggregation network. Finally, it reduces the number of convolution kernels in the feature fusion layer to achieve further model compression and a lightweight attention mechanism.
In the rapidly evolving world of industrial manufacturing and quality assurance, the pursuit of efficient yet high-performance defect detection solutions has become paramount. Central to this research endeavor is the development of a cutting-edge model that champions both lightweight construction and superior performance in defect detection. While the overarching idea of defect detection is not novel, the need for a solution that harmoniously combines efficiency with efficacy is more pressing than ever. The modern industrial ecosystem, brimming with an array of complex devices, often presents challenges in terms of compatibility, especially for equipment devoid of a GPU. The sheer diversity in machinery, from high-power workstations to low-consumption embedded terminals, necessitates a flexible solution that can be seamlessly integrated without compromising on performance. Recognizing this, our research’s primary ambition is to architect a model that is intrinsically lightweight yet does not sacrifice on its defect detection capabilities.
Through rigorous experimentation and validation processes, we aspire to demonstrate that our model is not just theoretically sound but is practically deployable even in the most resource-constrained environments. The promise of being able to deploy such a robust yet efficient model in devices without a GPU, as well as in low-power embedded systems, stands as a testament to our commitment to bridging the gap between innovation and real-world application.
2. Network Architecture
The industrial surface defect detection network proposed in this paper is divided into four parts: a backbone network, multiscale feature aggregation network, residual enhancement network, and attention enhancement network, as seen in Figure 1 and Figure 2. Firstly, a lightweight residual structure is used as the backbone network, and the attention mechanism is adopted to enhance feature extraction of the residual block. Secondly, a feature pyramid network is used to aggregate multiscale feature maps, endowing the model’s features with multiscale semantic information. Thirdly, a fusion network based on the residual module and attention enhancement module is designed to strengthen feature extraction, thereby achieving better surface defect detection results.
In this paper, the network is designed with five feature extraction parts, using 3 × 3 convolution with a stride of 2 for downsampling. Specifically, let the feature map input into a single feature extraction part be represented as FM, and the feature map generated after a single feature extraction part be represented as FM′. Then, the generation process of FM′ is as follows:
stands for sigmoid linear unit [15], BN is batch normalization, is a 3 × 3 convolution with a stride of 2, is a 1 × 1 convolution with a stride of 1, is a 3 × 3 convolution with a stride of 1, is the channel attention layer, and is the coordinate attention layer. The channel attention Ach is represented as:
Sigmoid refers to the sigmoid activation function [16], represents global max pooling, signifies global average pooling, and stands for concatenation of feature maps along the channel dimension. MLP stands for:
stands for rectified linear [17], W0 channels are 2C/r, where r is the reduction rate, and W0 channels are C. Finally, the channel attention Ach is multiplied with the input feature map to obtain the final generated feature. Moreover, this paper also introduces a coordinate attention layer (CoAL) into each feature extraction part to further enhance the network’s feature representation capability. Structurally, is composed of coordinate attentions, which decompose channel attention into two one-dimensional feature encoding processes, aggregating features along two spatial directions, respectively. The coordinate attention steps can be formalized as:
is the 1 × 1 convolution with channel number C, represents attention in the height direction, and denotes attention in the width direction. The steps for and can be formalized as follows:
represents the split operation, is the global average pooling that compresses along the height direction, and is the global average pooling that compresses along the width direction. They compress the feature map into and in size, respectively. The steps for can be formalized as:
is the 1 × 1 convolution with channel number C/r, where r is the reduction rate, and stands for batch normalization. Finally, and are multiplied with the input feature map to generate the final feature. The backbone network in this paper is primarily designed for the detection of industrial surface defects and can be composed of just five feature extraction parts. The single feature extraction part of the backbone network is shown in Figure 3.
2.1. Multiscale Feature Aggregation Network
The multiscale feature aggregation network proposed in this paper uses three feature aggregation groups, as seen in Figure 4. The first group directly uses the features from the backbone network, while the latter two aggregations are derived from deeper semantic features, i.e., the information after residual attention and attention enhancement.
Specifically, for the input image , the output features of the last three feature extraction parts of the backbone network are represented as:
The outputs of the multiscale feature aggregation network, the residual enhancement network, and the attention enhancement network are, respectively, represented as:
Then, in the multi-scale feature aggregation network can be formalized as:
refers to the 1 × 1 convolution, is the 3 × 3 convolution, stands for the SPPF module, and is the output from the feature extraction part 5 of the backbone network. in the multiscale feature aggregation network can be formalized as:
refers to the output from the feature extraction part 4 of the backbone network, is the output from attention module 1 of the attention enhancement network, and Up represents the up sampling operation. in the multiscale feature aggregation network can be formalized as:
Here, refers to the output from the feature extraction part 3 of the backbone network, and Attention4 is the output from attention module 2 of the attention enhancement network.
2.2. Residual Enhancement Network
To enable the multiscale feature aggregation network to aggregate deeper semantic feature information, a residual enhancement network is attached after the multiscale feature aggregation network. This network consists of three residual modules and a single residual module, as seen in Figure 5. Unlike the backbone network, each residual module in the residual enhancement network does not need to downsample and only uses two convolution groups, namely 1 × 1 and 3 × 3. Each residual module is designed with the same attention residual edge to achieve attention to the spatial focus. Let the feature map of a single residual module be represented as ; the steps of a single residual module can be formalized as:
where and are 3 × 3 and 1 × 1 convolution groups, respectively, takes the input feature map and performs global max pooling and global average pooling, respectively, obtaining two feature maps of the same size. Subsequently, these two feature maps are added, and then passed through a 3 × 3 convolution to generate a residual edge with information attention capability, which can be formalized as follows:
where is a 3 × 3 convolution with a stride of 1 and padding of 1, is the global max pooling, and is the global average pooling.
2.3. Attention Enhancement Network
This paper designs an attention enhancement network to utilize deeper semantic information, thereby improving the feature extraction capability of the lightweight industrial surface defect detection network. This network is very convenient and can be used as needed. The attention enhancement network has two parts: one part is the global semantic information, and the other part is the local semantic information. The attention enhancement network fuses the two. The attention enhancement network consists of three attention enhancement modules. The steps of the single attention enhancement module shown in Figure 6, , can be formalized as:
can be formalized as:
Here, represents a 1 × 1 convolution with C channels, and represents a 1 × 1 convolution with channels (r is the reduction rate). Here, can be formalized as:
can be formalized as:
3. Experiments and Results
3.1. Datasets
The experimental datasets in this paper include PCB [18], NEU-DET [19], Tianchi fabric [20], and Tianchi ceramic tile [21]. PCB dataset: This dataset consists of 1500 PCB images, covering six types of PCB defects. In this study, 1230 images were selected as the training set, and 270 images were used as the test set, as seen in Figure 7.
NEU-DET dataset: A defect classification dataset for hot-rolled steel plates. It includes six types of defect, including cracks, inclusions, patches, pitted surfaces, rolled-in scales, and scratches. The dataset contains 1800 images, with 300 images for each defect type. For this study, 1260 images were selected as the training set, and 540 images were used as the test set, as seen in Figure 8.
Tianchi fabric dataset: This dataset covers 20 different types of fabric defects, including ColorFly, Singeing, Knot, Warp Loosening, ColorOut, Warper’s Knot, Hole, and Coarse, among others. It consists of a total of 4775 images. For this study, 3500 images were selected as the training set, and 1200 images were used as the test set, as seen in Figure 9.
Tianchi ceramic tile dataset: This dataset includes three major categories of defect: edge chipping, hole, and line, with a total of 941 images. For this study, 658 images were selected as the training set, and 187 images were used as the test set. It is worth noting that the Tianchi ceramic tile dataset contains a large number of small target defects, with the smallest defect pixel size being only 8 pixels, as seen in Figure 10.
3.2. Experimental Parameters
The experiments in this paper were conducted in an environment with an Ubuntu 20.04 operating system and PyTorch 2.0.1. The hardware units used were an Intel Core i9-7980XE CPU, 96 GB of memory, and an NVIDIA TITAN RTX GPU 24 G. To verify the deployability and applicability of lightweight models, we prepared a desktop computer equipped only with an i5 12400 CPU, without a GPU, and two embedded devices, the RaspberryPi 4B and FriendlayArm Neo2.
The Raspberry Pi 4B is the latest addition to the renowned Raspberry Pi series, known for providing affordable computing capabilities in a compact form. At the heart of the Raspberry Pi 4B lies the Broadcom BCM2711 SoC, which houses a quad-core ARM Cortex-A72 CPU. This CPU is clocked at up to 1.5 GHz.
FriendlyARM’s NanoPi NEO2 is a compact and highly affordable single-board computer. Central to the NanoPi NEO2 is the Allwinner H5 SoC, which incorporates a quad-core ARM Cortex-A53 CPU. This CPU operates at up to 1.5 GHz.
The training images were resized to 640 × 640, and the batch size was set to 8. All models were trained for 300 epochs without using pretrained weights. The initial learning rate was set to 0.01, and the optimizer used was SGD.
3.3. Model Evaluation Metrics and Results Comparison
To evaluate the performance of the proposed model, eight metrics [22] were used in this study. They are precision (P), recall®, F1 score, [email protected], [email protected], parameters, GFLOPS, and speed.
This paper evaluates the defect detection performance of the proposed model on industrial surface defect datasets including PCB, NEU-DET, Tianchi fabric, and Tianchi ceramic tile. A comparison was made with the widely used MobileNetV3-L [23], SSD-512 [24], YOLOv5 [25], and the latest YOLOv8 [1] series object detection models. Table 1, Table 2, Table 3 and Table 4 present the experimental results of different models used on the four datasets.
Similarly, we evaluated and compared the performance of four lightweight models: YOLOv5n, YOLOv8n, SSD-512, MobileNet-L, and KPD, on a CPU-only device and embedded devices. Their speed values are documented in Table 5, Table 6, Table 7 and Table 8.
The performance of the KPD model used on four types of dataset is shown in four tables. Compared to lightweight models with the same level of parameters, the four metrics P, R, F1, and [email protected] of KPD are superior to those of YOLOv5n and YOLOv8n. In particular, the performance of the KPD model at 300 epochs [email protected] is relatively excellent, as seen in Figure 11, Figure 12, Figure 13 and Figure 14. Compared with the YOLOv5s, YOLOv8s SSD-512 models, which have 5~10 times the parameters of our own model, the four metrics P, R, F1, and [email protected] of KPD reach or even surpass those of YOLOv5s and YOLOv8s on the PCB, NEU-DET, and Tianchi fabric datasets. However, the performance of [email protected] on the Tianchi ceramic tile dataset is not prominent.
From the perspective of deployment without GPUs and on embedded devices, although the speed performance of KPD on CPU devices and embedded devices falls between YOLOv5n and YOLOv8n; as evidenced by Table 5, Table 6, Table 7 and Table 8, the detection accuracy of KPD greatly surpasses that of MobileNetV3-L, YOLOv5n, and YOLOv8n. The author believes that the KPD model is worth deploying in an embedded device.
The authors believe that in considering the compression and light weighting of the KPD model’s five feature extraction parts, using a 3 × 3 convolution with a stride of 2 for downsampling to replace max pooling can greatly reduce the size of the feature map and thus greatly reduce the computational load from an engineering perspective. However, max pooling [26] has the function of suppressing noise. Both YOLOv5s and YOLOv8s have the ability of max pooling in the main network.
It can be inferred that the KPD model cannot accurately identify some subtle defect features in the defect detection process with only a few pixel sizes due to noise interference. In addition, due to the inability to suppress noise, the performance of the KPD model on the [email protected] indicator is relatively poor.
It should be noted that in the scenario of defect detection, if a product defect is detected, perform a second confirmation is performed for reinspection. Therefore, instead of accurately pointing out where the defect is, there is greater concern regarding whether deep learning can replace human eye detection to detect whether there are defects on a surface. That is, in industrial inspection application scenarios, the model’s performance regarding the [email protected] indicator often receives more attention than that of the [email protected] indicator.
3.4. Results of Ablation Experiments
In the series of ablation experiments presented in this paper, various components of the proposed model were systematically removed to analyze their respective contributions to the overall performance. For clarity, we introduced the following abbreviations:
- -
- BS: backbone network (without attention);
- -
- ChCo: backbone network (incorporating CHAL and COAL structures);
- -
- MF: multiscale feature aggregation network;
- -
- RE: residual enhancement network;
- -
- AE: attention enhancement network.
Four datasets served as the experimental battlegrounds for verifying the importance of each component. The experimental results, as encapsulated in Table 9, showed significant insights. Using the full-fledged BS + ChCo + MF + RE + AE (KPD) configuration as our reference point, we observed that upon the removal of the ChCo attention mechanism from the backbone, there was a decline in P, R, F1, and [email protected] metrics by 0.002, 0.007, and 0.006, respectively. This alone emphasizes the value ChCo adds to the model’s efficacy.
Taking it a step further, when the attention enhancement network (AE) was excluded, the F1 and [email protected] of BS + MF + RE faced reductions by 0.007, 0.028, 0.007, and 0.003 in sequence. To push the boundaries of this evaluation, the residual enhancement network (RE) was also eliminated, leading to declines in the F1 and [email protected] metrics of BS + MF by 0.004, 0.001, 0.002, and 0.011. These successive degradations in performance with the removal of each module underscore their collective and individual significance in the proposed algorithmic model. Furthermore, this is not just an isolated case. The model’s ablation results across three other datasets, as detailed in Table 10, Table 11 and Table 12, consistently reinforce this observation, affirming the critical roles played by the attention mechanism in the backbone network, the attention enhancement network, and the residual enhancement network. The evidence is clear: each component, especially when integrated, substantially elevates the model’s performance.
4. Conclusions
For industrial product surface defect detection, this paper proposed a novel network structure based on full-process attention enhancement. This network uses a lightweight residual structure as the main network and uses an attention mechanism to enhance the feature extraction of the residual block, forming a feature extraction module with strong extraction capability. This structure is stacked to form the main network. At the same time, this network uses a feature pyramid network to aggregate feature maps with multiscale and multidepth semantics, providing the model’s features with multiscale information and allowing it to pay attention to more features. Finally, this paper combined a residual module and an attention enhancement module to enhance the feature extraction of the feature map output by the multiscale feature aggregation network, thus achieving better surface defect detection results.
Although the lightweight KPD model uses a 3 × 3 convolution with a stride of 2 for downsampling to replace max pooling, it loses some ability to suppress noise, which results in a less ideal [email protected] indicator. However, the KPD model, with good [email protected] performance, does not affect its application in industrial scenarios.
5. Future Work
In the future, the authors will focus on small defects in industrial products, design lightweight optimization methods, implement lightweight small defect detection networks that can meet real-time and accuracy requirements, and research portable intelligent detection devices that can provide technical support for surface defect detection and related visual sensing industries. Building upon our aspirations, it is our hope that the KPD model derived from our research can be extensively applied across a myriad of embedded and wearable devices. For instance, factory workers could don AR glasses to patrol production lines, leveraging our model to inspect product quality in real time. Similarly, quality assurance personnel could easily load our model onto their smartphones, using it as a reliable aid at inspection stations to assist in evaluating product quality.
Author Contributions
Conceptualization and methodology, J.L.; writing—original draft preparation, J.L.; formal analysis, S.-H.L.; writing—review and editing, S.-H.L. and J.L. All authors have read and agreed to the published version of the manuscript.
Funding
This research received no external funding.
Data Availability Statement
The data are unavailable due to privacy.
Conflicts of Interest
The authors declare no conflict of interest.
References
- Aboah, A.; Wang, B.; Bagci, U.; Adu-Gyamfi, Y. Real-time multi-class helmet violation detection using fewshot data sampling technique and yolov8. In Proceedings of the IEEE/CVF Conference on Computer Vision and Pattern Recognition, Vancouver, BC, Canada, 17–24 June 2023; pp. 5349–5357. [Google Scholar]
- Kumar, A.; Zhang, Z.J.; Lyu, H. Object detection in real time based on improved single shot multi-box detector algorithm. EURASIP J. Wirel. Commun. Netw. 2020, 2020, 204. [Google Scholar] [CrossRef]
- Zhang, S.; Yu, Z.; Liu, L.; Wang, X.; Zhou, A.; Chen, K. Group R-CNN for weakly semi-supervised object detection with points. In Proceedings of the IEEE/CVF Conference on Computer Vision and Pattern Recognition, New Orleans, LA, USA, 18–24 June 2022; pp. 9417–9426. [Google Scholar]
- Wan, S.; Goudos, S. Faster R-CNN for multi-class fruit detection using a robotic vision system. Comput. Netw. 2020, 168, 107036. [Google Scholar] [CrossRef]
- Cheng, G.; Wang, J.; Li, K.; Xie, X.; Lang, C.; Yao, Y.; Han, J. Anchor-free oriented proposal generator for object detection. IEEE Trans. Geosci. Remote Sens. 2022, 60, 5625411. [Google Scholar] [CrossRef]
- Sun, Y.J.; Shi, D.W.; Guo, J. Steel surface defect detection based on global context block. J. Phys. Conf. Ser. 2023, 2476, 012016. [Google Scholar] [CrossRef]
- Li, D.; Xie, Q.; Yu, Z.; Wu, Q.; Zhou, J.; Wang, J. Sewer pipe defect detection via deep learning with local and global feature fusion. Autom. Constr. 2021, 129, 103823. [Google Scholar] [CrossRef]
- Wang, J.; Song, K.; Zhang, D.; Niu, M.; Yan, Y. Collaborative learning attention network based on RGB image and depth image for surface defect inspection of no-service rail. IEEE/ASME Trans. Mechatron. 2022, 27, 4874–4884. [Google Scholar] [CrossRef]
- Huang, H.; Tang, X.; Wen, F.; Jin, X. Small object detection method with shallow feature fusion network for chip surface defect detection. Sci. Rep. 2022, 12, 3914. [Google Scholar] [CrossRef] [PubMed]
- Zhang, C.; Cui, J.; Wu, J.; Zhang, X. Attention mechanism and texture contextual information for steel plate defects detection. J. Intell. Manuf. 2023, 1–22. [Google Scholar] [CrossRef]
- Liu, T.; He, Z. TAS 2-Net: Triple-Attention Semantic Segmentation Network for Small Surface Defect Detection. IEEE Trans. Instrum. Meas. 2022, 71, 5004512. [Google Scholar]
- Li, X.; Wu, J.; Lin, Z.; Liu, H.; Zha, H. Recurrent squeeze-and-excitation context aggregation net for single image deraining. Comput. Vis. Pattern Recognit. 2018, 1807, 254–269. [Google Scholar]
- Woo, S.; Park, J.; Lee, J.Y.; Kweon, I.S. Cbam: Convolutional block attention module. Lect. Notes Comput. Sci. 2018, 1807, 06521. [Google Scholar]
- Hou, Q.; Zhou, D.; Feng, J. Coordinate attention for efficient mobile network design. In Proceedings of the IEEE/CVF Conference on Computer Vision and Pattern Recognition, Nashville, TN, USA, 20–25 June 2021; pp. 13708–13717. [Google Scholar]
- Liu, Z.; Li, L.; Fang, X.; Qi, W.; Shen, J.; Zhou, H.; Zhang, Y. Hard-rock tunnel lithology prediction with TBM construction big data using a global-attention-mechanism-based LSTM network. Autom. Constr. 2021, 125, 103647. [Google Scholar] [CrossRef]
- Szandała, T. Review and comparison of commonly used activation functions for deep neural networks. Mach. Learn. 2020, 2010, 09458. [Google Scholar]
- Elfwing, S.; Uchibe, E.; Doya, K. Sigmoid-weighted linear units for neural network function approximation in reinforcement learning. Neural Netw. 2018, 107, 3–11. [Google Scholar] [CrossRef] [PubMed]
- Wu, X.; Ge, Y.; Zhang, Q.; Zhang, D. PCB defect detection using deep learning methods. In Proceedings of the 2021 IEEE 24th International Conference on Computer Supported Cooperative Work in Design (CSCWD), Dalian, China, 5–7 May 2021; IEEE: New York, NY, USA; pp. 873–876. [Google Scholar]
- He, Y.; Song, K.; Meng, Q.; Yan, Y. An end-to-end steel surface defect detection approach via fusing multiple hierarchical features. IEEE Trans. Instrum. Meas. 2019, 69, 1493–1504. [Google Scholar] [CrossRef]
- Lu, Z.; Zhang, Y.; Xu, H.; Chen, H. Fabric defect detection via a spatial cloze strategy. Text. Res. J. 2023, 93, 1612–1627. [Google Scholar] [CrossRef]
- Wan, G.; Fang, H.; Wang, D.; Yan, J.; Xie, B. Ceramic tile surface defect detection based on deep learning. Ceram. Int. 2022, 48, 11085–11093. [Google Scholar] [CrossRef]
- Padilla, R.; Netto, S.L.; Da Silva, E.A.B. A survey on performance metrics for object-detection algorithms. In Proceedings of the 2020 International Conference on Systems, Signals and Image Processing (IWSSIP), Niterói, Brazil, 1–3 July 2020; IEEE: New York, NY, USA; pp. 237–242. [Google Scholar]
- Koonce, B. MobileNetV3. In Convolutional Neural Networks with Swift for Tensorflow: Image Recognition and Dataset Categorization; Apress: Berkeley, CA, USA, 2021; pp. 125–144. [Google Scholar]
- Liu, W.; Anguelov, D.; Erhan, D.; Szegedy, C.; Reed, S.; Fu, C.Y.; Berg, A.C. Ssd: Single shot multibox detector. In Computer Vision–ECCV 2016: 14th European Conference, Amsterdam, The Netherlands, October 11–14, 2016, Proceedings, Part I 14; Springer International Publishing: Cham, Switzerland, 2016; pp. 21–37. [Google Scholar]
- Zhu, X.; Lyu, S.; Wang, X.; Zhao, Q. TPH-YOLOv5: Improved YOLOv5 based on transformer prediction head for object detection on drone-captured scenarios. In Proceedings of the IEEE/CVF International Conference on Computer Vision, Montreal, BC, Canada, 11–17 October 2021; pp. 2778–2788. [Google Scholar]
- Graham, B. Fractional max-pooling. arXiv 2014, arXiv:1412.6071. [Google Scholar]
Figure 1.
Real-time surface defect detection model—KPD 2.1 backbone network.

Figure 2.
Detailed diagrams of KPD model.

Figure 3.
Structure of the individual feature extraction section.

Figure 4.
Multiscale feature aggregation network structure.

Figure 5.
Structure of a single residual module.

Figure 6.
Single attention enhancement module structure module.

Figure 7.
PCB dataset and labels.
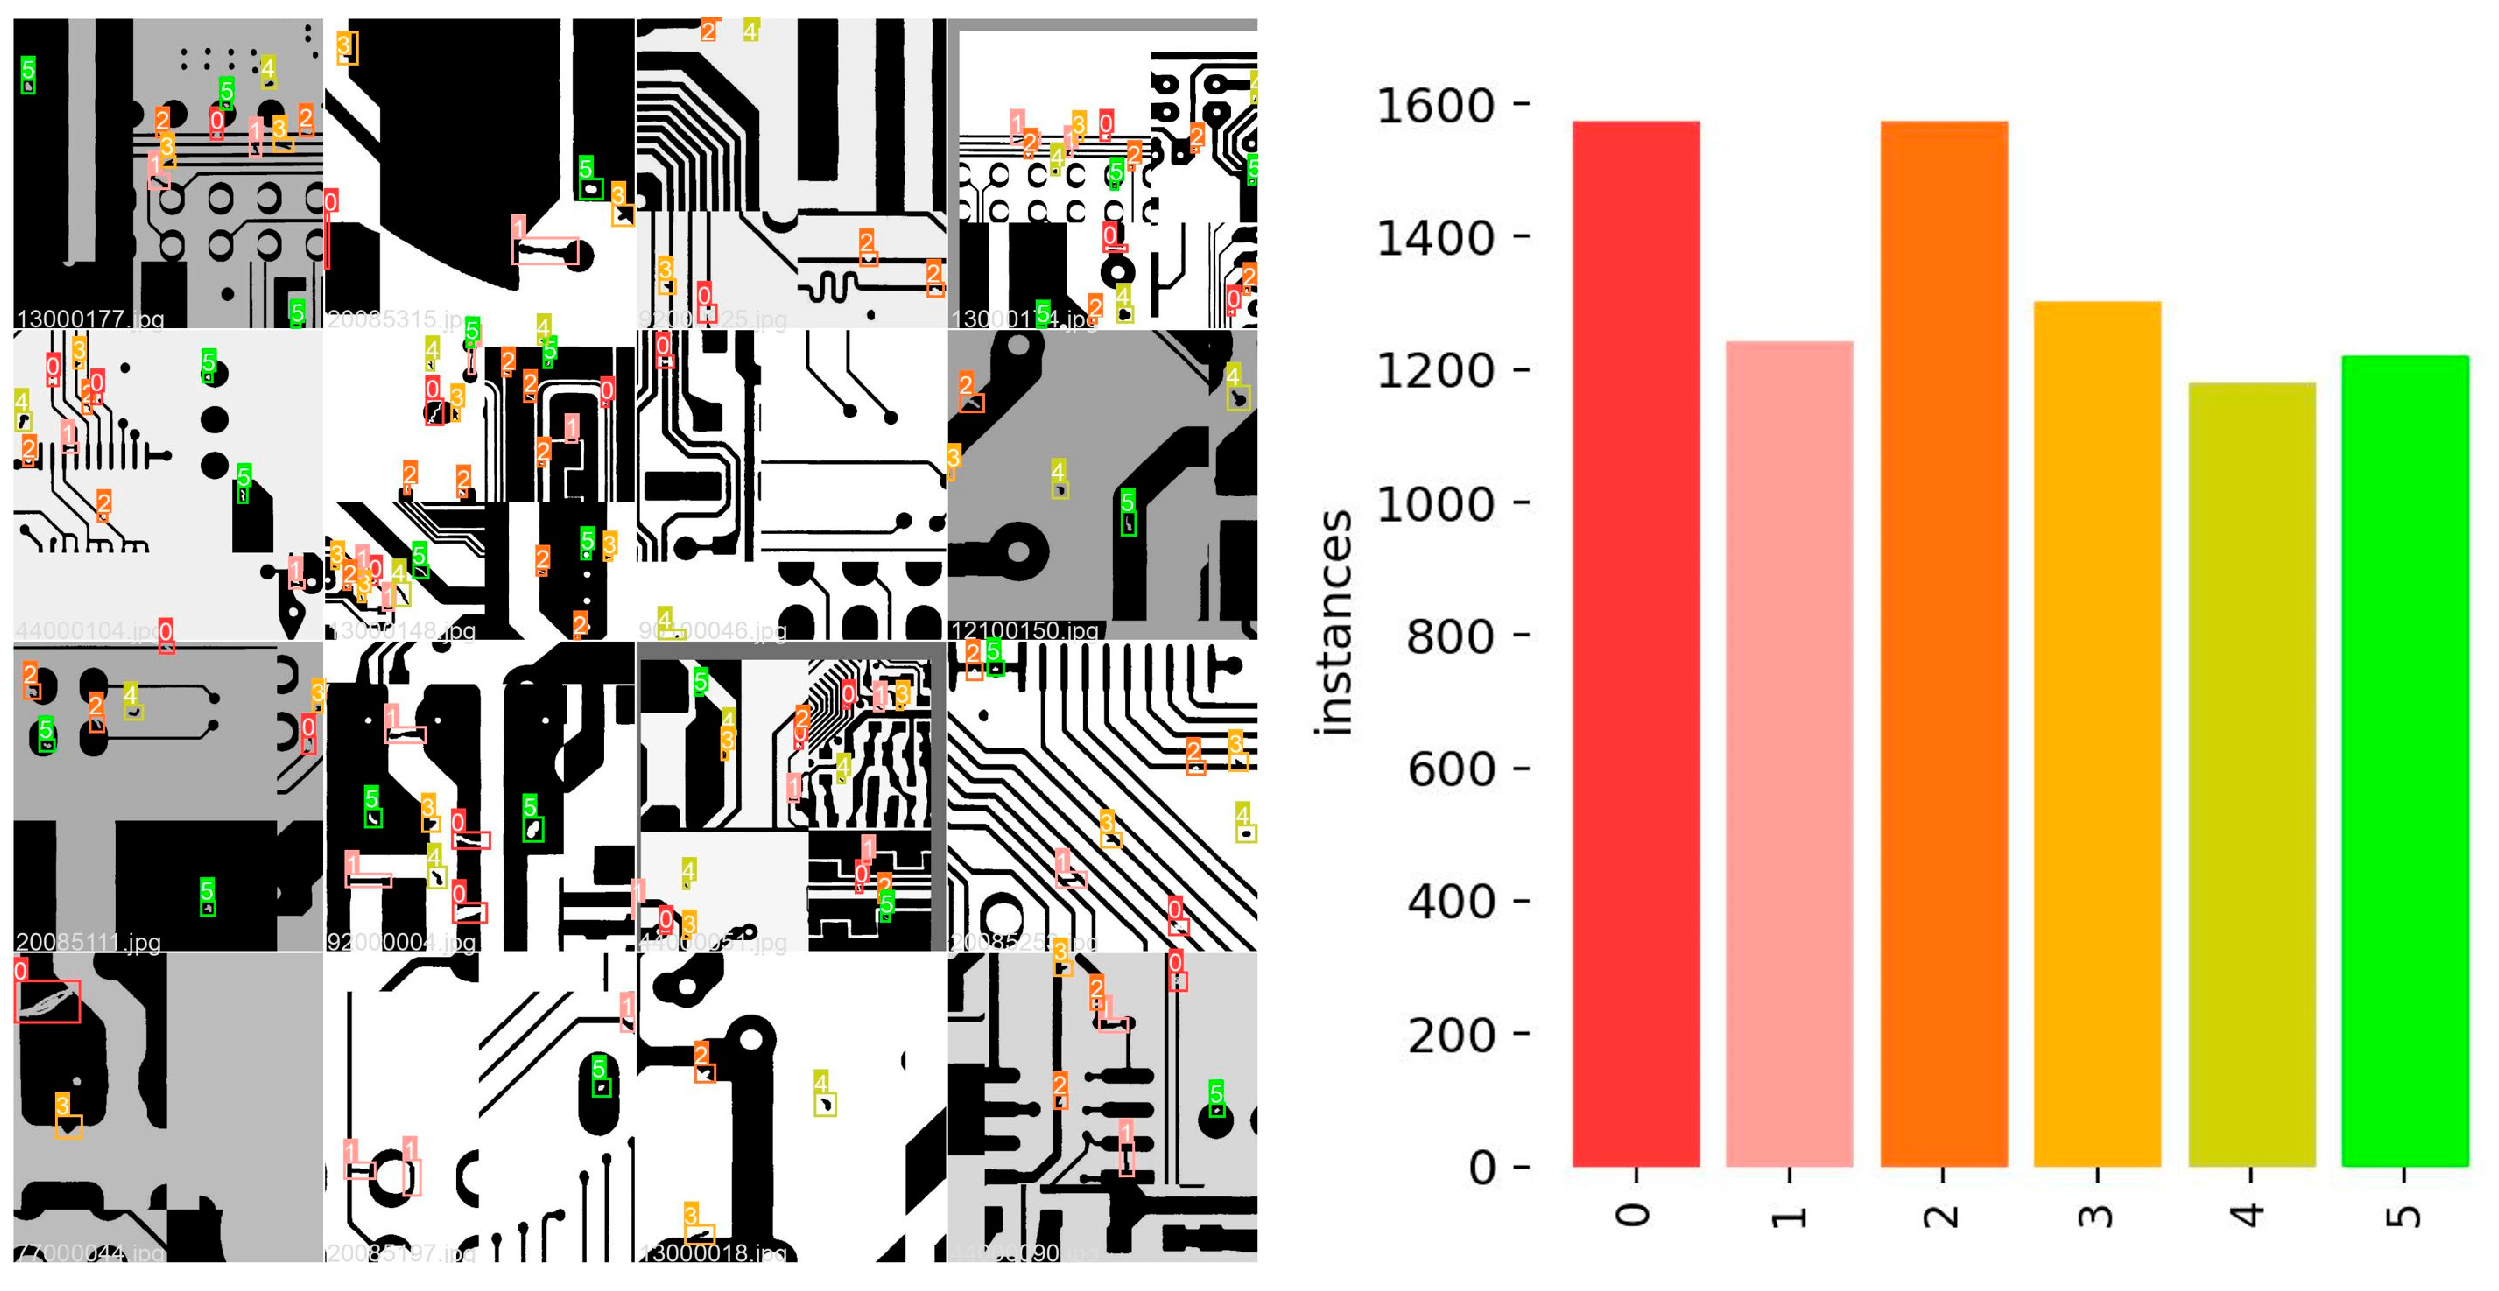
Figure 8.
NEU-DET dataset and labels.
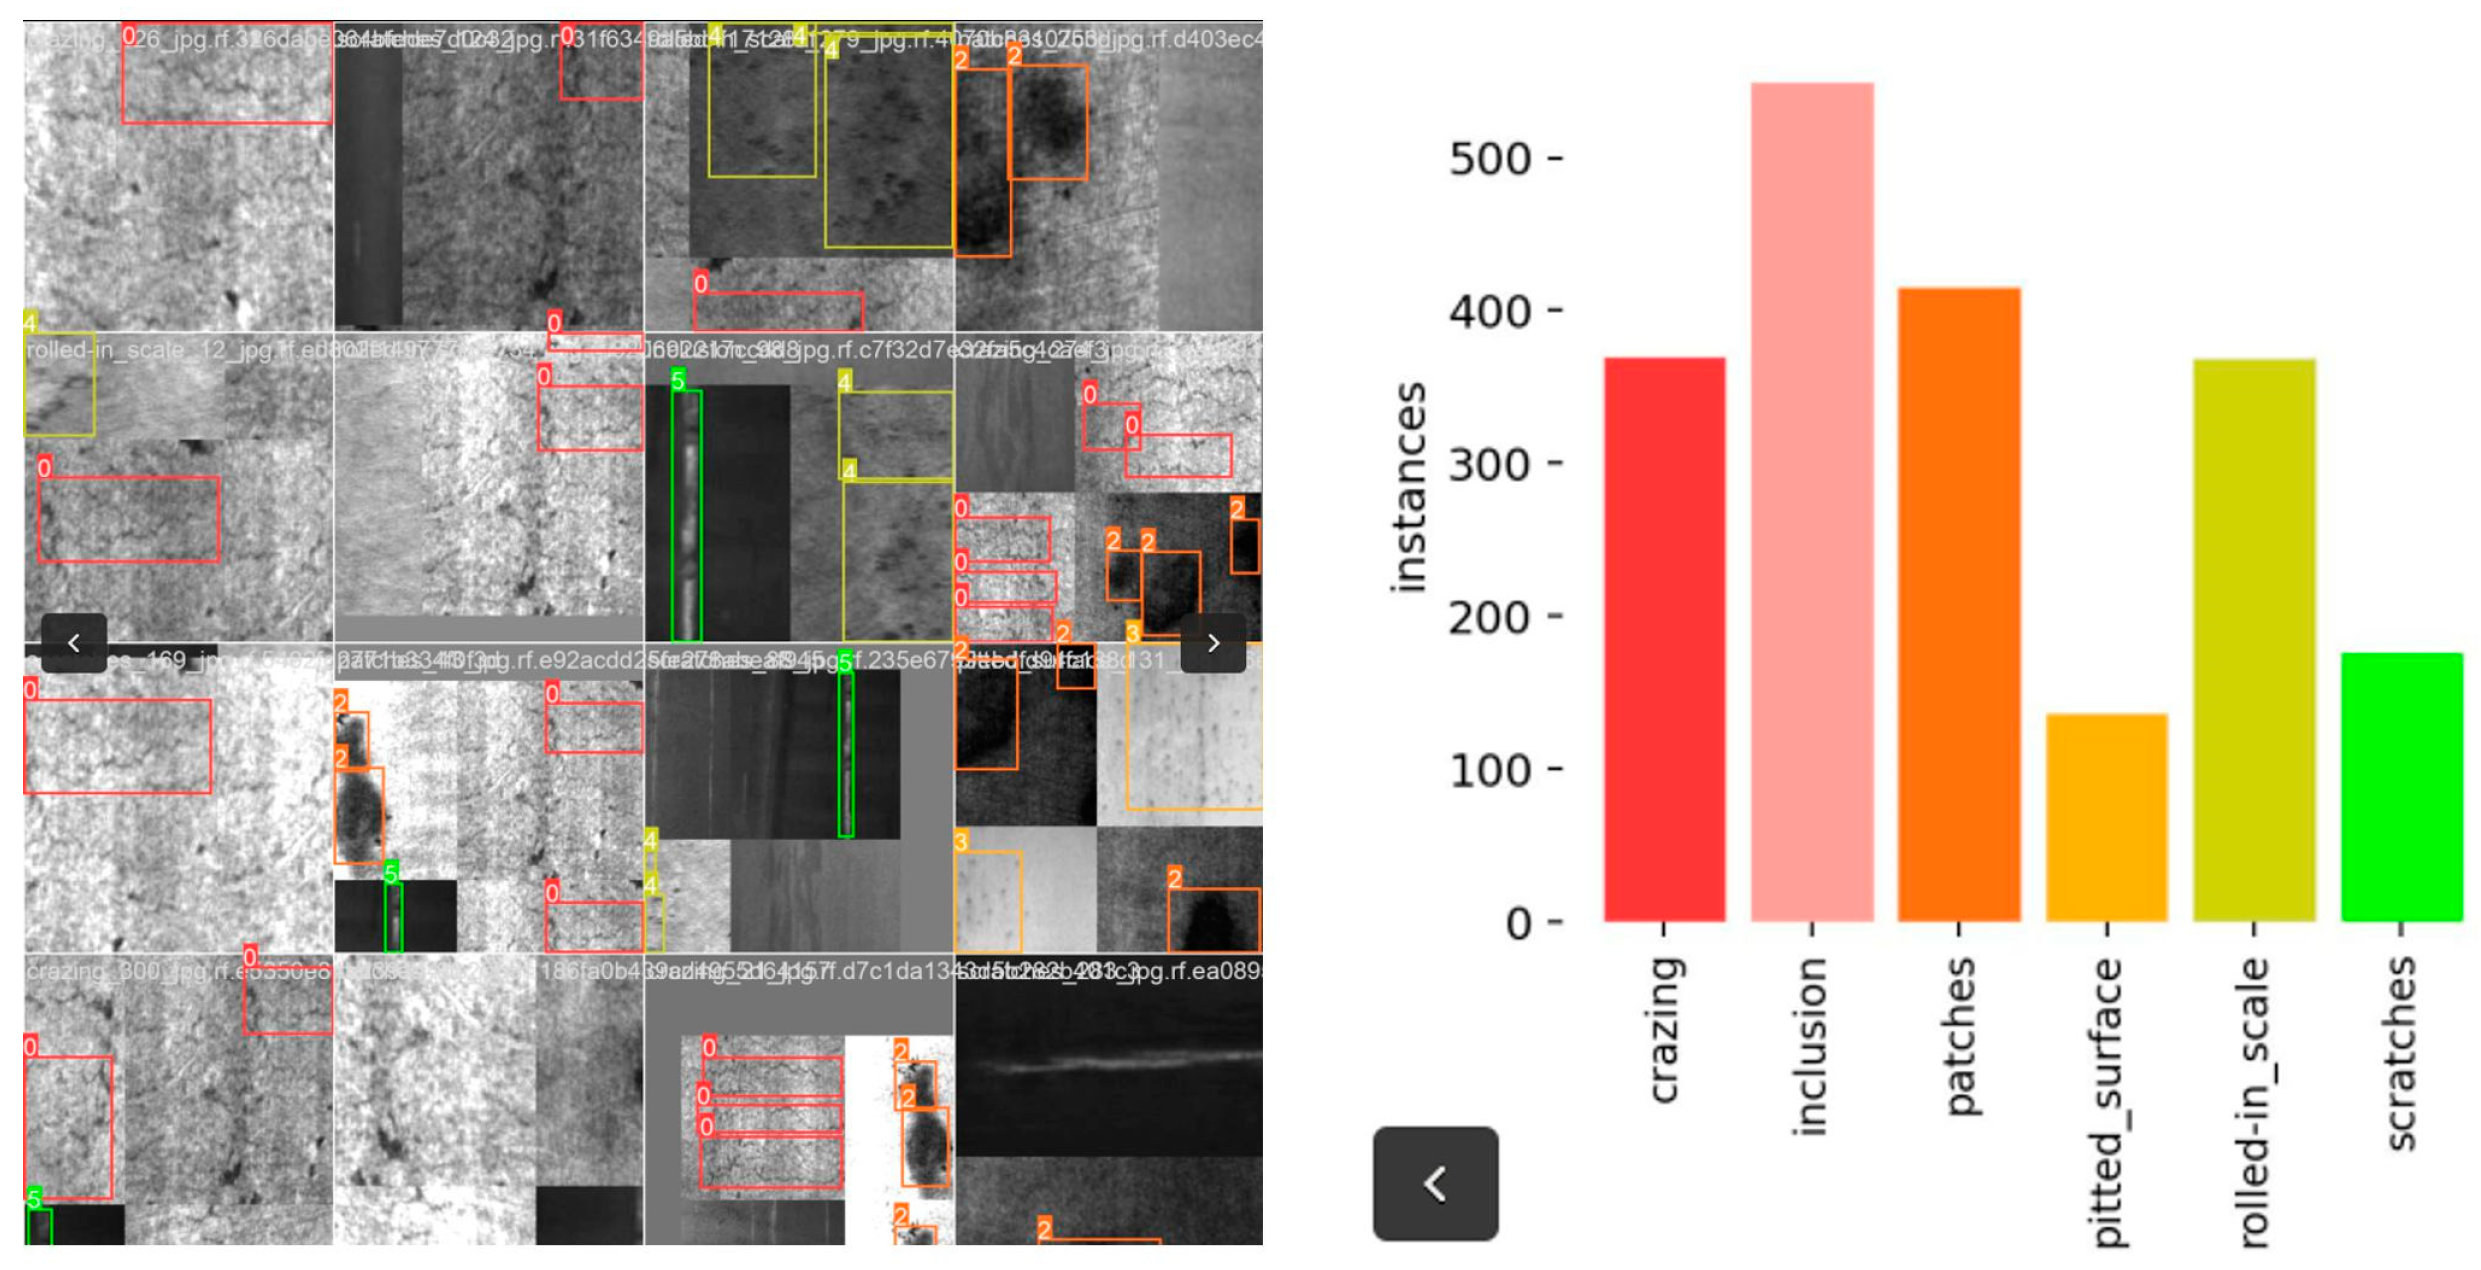
Figure 9.
Tianchi fabric dataset and labels.

Figure 10.
Tianchi ceramic tile dataset and labels.

Figure 11.
PCB dataset training results.

Figure 12.
NEU-DET surface defect dataset training results.

Figure 13.
Tianchi ceramic tile defect dataset training results.

Figure 14.
Tianchi ceramic tile defect dataset training results.


Table 1.
Experimental result comparison using PCB dataset.
| Model Name | P | R | F1 | [email protected] | [email protected] | Parameters | GFLOPS |
|---|---|---|---|---|---|---|---|
| MobileNetV3-L | 0.876 | 0.842 | 0.857 | 0.809 | 0.337 | 5.5M | 0.2 |
| SSD-512 | 0.955 | 0.960 | 0.956 | 0.982 | 0.743 | 27.2M | 180 |
| YOLOv5n | 0.932 | 0.901 | 0.916 | 0.958 | 0.593 | 1.9M | 4.5 |
| YOLOv5s | 0.939 | 0.914 | 0.940 | 0.963 | 0.638 | 7.03M | 16.0 |
| YOLOv8n | 0.946 | 0.948 | 0.947 | 0.980 | 0.751 | 3.2M | 8.9 |
| YOLOv8s | 0.953 | 0.959 | 0.956 | 0.982 | 0.731 | 11.17M | 28.8 |
| KPD | 0.955 | 0.961 | 0.958 | 0.984 | 0.731 | 2.3M | 8.8 |
Table 2.
Experimental result comparison using NEU-DET dataset.
| Model Name | P | R | F1 | [email protected] | [email protected] | Parameters | GFLOPS |
|---|---|---|---|---|---|---|---|
| MobileNetV3-L | 0.407 | 0.525 | 0.457 | 0.500 | 0.159 | 5.5M | 0.2 |
| SSD-512 | 0.528 | 0.640 | 0.579 | 0.603 | 0.321 | 27.2M | 180 |
| YOLOv5n | 0.411 | 0.534 | 0.464 | 0.518 | 0.221 | 1.9M | 4.5 |
| YOLOv5s | 0.488 | 0.592 | 0.534 | 0.558 | 0.264 | 7.03M | 16.0 |
| YOLOv8n | 0.509 | 0.643 | 0.568 | 0.586 | 0.284 | 3.2M | 8.9 |
| YOLOv8s | 0.526 | 0.622 | 0.570 | 0.596 | 0.301 | 11.17M | 28.8 |
| KPD | 0.522 | 0.644 | 0.574 | 0.606 | 0.269 | 2.3M | 8.8 |
Table 3.
Experimental result comparison using Tianchi fabric dataset.
| Model Name | P | R | F1 | [email protected] | [email protected] | Parameters | GFLOPS |
|---|---|---|---|---|---|---|---|
| MobileNetV3-L | 0.466 | 0.400 | 0.400 | 0.401 | 0.141 | 5.5M | 0.2 |
| SSD-512 | 0.494 | 0.441 | 0.441 | 0.419 | 0.266 | 27.2M | 180 |
| YOLOv5n | 0.491 | 0.408 | 0.446 | 0.404 | 0.180 | 1.9M | 4.5 |
| YOLOv5s | 0.493 | 0.437 | 0.463 | 0.416 | 0.187 | 7.03M | 16.0 |
| YOLOv8n | 0.441 | 0.414 | 0.427 | 0.389 | 0.189 | 3.2M | 8.9 |
| YOLOv8s | 0.495 | 0.435 | 0.463 | 0.418 | 0.205 | 11.17M | 28.8 |
| KPD | 0.496 | 0.442 | 0.470 | 0.421 | 0.180 | 2.3M | 8.8 |
Table 4.
Experimental result comparison using Tianchi ceramic tile dataset.
| Model Name | P | R | F1 | [email protected] | [email protected] | Parameters | GFLOPS |
|---|---|---|---|---|---|---|---|
| MobileNetV3-L | 0.425 | 0.421 | 0.421 | 0.392 | 0.155 | 5.5M | 0.2 |
| SSD-512 | 0.590 | 0.558 | 0.572 | 0.526 | 0.288 | 27.2M | 180 |
| YOLOv5n | 0.544 | 0.535 | 0.540 | 0.500 | 0.237 | 1.9M | 4.5 |
| YOLOv5s | 0.588 | 0.551 | 0.527 | 0.521 | 0.259 | 7.03M | 16.0 |
| YOLOv8n | 0.569 | 0.476 | 0.518 | 0.432 | 0.222 | 3.2M | 8.9 |
| YOLOv8s | 0.567 | 0.434 | 0.491 | 0.446 | 0.238 | 11.17M | 28.8 |
| KPD | 0.579 | 0.538 | 0.558 | 0.501 | 0.189 | 2.3M | 8.8 |
Table 5.
Experimental results of PCB dataset comparison in low-performance configuration.
| Model and Parameter Size | PCB Data | |||||||
|---|---|---|---|---|---|---|---|---|
| Model Name | Parameters | GFLOPS | CPU i5 12400 Speed (ms) | CPU i5 12400 mAP-0.5 | RaspberryPi 4B Speed (ms) | RaspberryPi 4B mAP-0.5 | FriendlyArm Neo2 Speed (ms) | FriendlyArm Neo2 mAP-0.5 |
| MobileNetV3-L | 5.5M | 0.2 | 24 | 0.808 | 120 | 0.802 | 55 | 0.806 |
| YOLOv5n | 1.9M | 4.5 | 80 | 0.956 | 880 | 0.957 | 425 | 0.955 |
| YOLOv8n | 3.2M | 8.9 | 154 | 0.982 | 1255 | 0.981 | 597 | 0.979 |
| KPD | 2.3M | 8.8 | 148 | 0.983 | 1025 | 0.983 | 487 | 0.980 |
Table 6.
Experimental results of NEU-DET dataset comparison in low-performance configuration.
| Model and Parameter Size | PCB Data | |||||||
|---|---|---|---|---|---|---|---|---|
| Model Name | Parameters | GFLOPS | CPU i5 12400 Speed (ms) | CPU i5 12400 mAP-0.5 | RaspberryPi 4B Speed (ms) | RaspberryPi 4B mAP-0.5 | FriendlyArm Neo2 Speed (ms) | FriendlyArm Neo2 mAP-0.5 |
| MobileNetV3-L | 5.5M | 0.2 | 31 | 0.500 | 144 | 0.496 | 66 | 0.501 |
| YOLOv5n | 1.9M | 4.5 | 95 | 0.518 | 1144 | 0.520 | 551 | 0.516 |
| YOLOv8n | 3.2M | 8.9 | 200 | 0.586 | 1565 | 0.582 | 764 | 0.586 |
| KPD | 2.3M | 8.8 | 170 | 0.604 | 1412 | 0.603 | 560 | 0.605 |
Table 7.
Experimental results of Tianchi fabric dataset comparison in low-performance configuration.
Table 7.
Experimental results of Tianchi fabric dataset comparison in low-performance configuration.
| Model and Parameter Size | PCB Data | |||||||
|---|---|---|---|---|---|---|---|---|
| Model Name | Parameters | GFLOPS | CPU i5 12400 Speed (ms) | CPU i5 12400 mAP-0.5 | RaspberryPi 4B Speed (ms) | RaspberryPi 4B mAP-0.5 | FriendlyArm Neo2 Speed (ms) | FriendlyArm Neo2 mAP-0.5 |
| MobileNetV3-L | 5.5M | 0.2 | 39 | 0.398 | 188 | 0.388 | 82 | 0.399 |
| YOLOv5n | 1.9M | 4.5 | 114 | 0.402 | 1430 | 0.405 | 661 | 0.406 |
| YOLOv8n | 3.2M | 8.9 | 286 | 0.388 | 1800 | 0.387 | 994 | 0.389 |
| KPD | 2.3M | 8.8 | 195 | 0.420 | 1694 | 0.421 | 644 | 0.417 |
Table 8.
Experimental results of Tianchi ceramic tile dataset comparison in low-performance configuration.
Table 8.
Experimental results of Tianchi ceramic tile dataset comparison in low-performance configuration.
| Model and Parameter Size | PCB Data | |||||||
|---|---|---|---|---|---|---|---|---|
| Model Name | Parameters | GFLOPS | CPU i5 12400 Speed (ms) | CPU i5 12400 mAP-0.5 | RaspberryPi 4B Speed (ms) | RaspberryPi 4B mAP-0.5 | FriendlyArm Neo2 Speed (ms) | FriendlyArm Neo2 mAP-0.5 |
| MobileNetV3-L | 5.5M | 0.2 | 36 | 0.3392 | 120 | 0.390 | 87 | 0.388 |
| YOLOv5n | 1.9M | 4.5 | 124 | 0.502 | 880 | 0.501 | 688 | 0.499 |
| YOLOv8n | 3.2M | 8.9 | 251 | 0.432 | 1255 | 0.435 | 949 | 0.435 |
| KPD | 2.3M | 8.8 | 247 | 0.502 | 1025 | 0.505 | 803 | 0.500 |
Table 9.
Results of ablation experiments on the PCB dataset.
| Method | P | R | F1 | [email protected] |
|---|---|---|---|---|
| BS + ChCo +MF + RE + AE | 0.955 | 0.961 | 0.958 | 0.984 |
| BS +MF +RE +AE | 0.953 | 0.954 | 0.948 | 0.978 |
| BS + MF + RE | 0.946 | 0.926 | 0.941 | 0.975 |
| BS + MF | 0.942 | 0.925 | 0.939 | 0.964 |
Table 10.
Results of ablation experiments on the NEU-DET dataset.
| Method | P | R | F1 | [email protected] |
|---|---|---|---|---|
| BS + ChCo + MF + RE + AE | 0.522 | 0.644 | 0.574 | 0.606 |
| BS + MF + RE + AE | 0.521 | 0.611 | 0.561 | 0.561 |
| BS + MF + RE | 0.477 | 0.552 | 0.552 | 0.510 |
| BS + MF | 0.456 | 0.540 | 0.495 | 0.519 |
Table 11.
Results of ablation experiments on the Tianchi fabric dataset.
| Method | P | R | F1 | [email protected] |
|---|---|---|---|---|
| BS + ChCo + MF + RE + AE | 0.496 | 0.442 | 0.470 | 0.421 |
| BS + MF + RE + AE | 0.491 | 0.438 | 0.463 | 0.418 |
| BS + MF + RE | 0.462 | 0.422 | 0.441 | 0.411 |
| BS + MF | 0.445 | 0.411 | 0.426 | 0.402 |
Table 12.
Results of ablation experiments on the Tianchi ceramic tile dataset.
| Method | P | R | F1 | [email protected] |
|---|---|---|---|---|
| BS + ChCo + MF + RE + AE | 0.579 | 0.538 | 0.558 | 0.501 |
| BS + MF + RE + AE | 0.576 | 0.532 | 0.553 | 0.497 |
| BS + MF + RE | 0.569 | 0.528 | 0.549 | 0.494 |
| BS + MF | 0.559 | 0.511 | 0.535 | 0.486 |
Disclaimer/Publisher’s Note: The statements, opinions and data contained in all publications are solely those of the individual author(s) and contributor(s) and not of MDPI and/or the editor(s). MDPI and/or the editor(s) disclaim responsibility for any injury to people or property resulting from any ideas, methods, instructions or products referred to in the content. |
© 2023 by the authors. Licensee MDPI, Basel, Switzerland. This article is an open access article distributed under the terms and conditions of the Creative Commons Attribution (CC BY) license (https://creativecommons.org/licenses/by/4.0/).
Share and Cite
MDPI and ACS Style
Lu, J.; Lee, S.-H. Real-Time Defect Detection Model in Industrial Environment Based on Lightweight Deep Learning Network. Electronics 2023, 12, 4388. https://doi.org/10.3390/electronics12214388
AMA Style
Lu J, Lee S-H. Real-Time Defect Detection Model in Industrial Environment Based on Lightweight Deep Learning Network. Electronics. 2023; 12(21):4388. https://doi.org/10.3390/electronics12214388
Chicago/Turabian StyleLu, Jiaqi, and Soo-Hong Lee. 2023. "Real-Time Defect Detection Model in Industrial Environment Based on Lightweight Deep Learning Network" Electronics 12, no. 21: 4388. https://doi.org/10.3390/electronics12214388
Note that from the first issue of 2016, this journal uses article numbers instead of page numbers. See further details here.