
HEBCS: A High-Efficiency Binary Code Search Method
1
School of Cyber Science and Engineering, Zhengzhou University, Zhengzhou 450002, China
2
School of Cyber Science and Engineering, PLA Information Engineering University, Zhengzhou 450001, China
*
Author to whom correspondence should be addressed.
Electronics 2023, 12(16), 3464; https://doi.org/10.3390/electronics12163464
Submission received: 3 July 2023
/
Revised: 5 August 2023
/
Accepted: 9 August 2023
/
Published: 16 August 2023
Abstract
:Binary code search is a technique that involves finding code with similarity to a given code within a code database. It finds extensive application in scenarios such as vulnerability queries and code defect analysis. While many existing methods employ advanced machine learning models for similarity analysis, their lack of interpretability and low efficiency in dealing with large-scale functions still remain challenges. To address these issues, we propose a high-efficiency binary code search method called HEBCS. It employs an interpretable approach to extract function-level features and transforms each feature into a locality-sensitive hash representation. Then, the hashes of these features are combined to form the hash of the function. By leveraging the pigeonhole principle, HEBCS enables efficient storage and retrieval of functions, ensuring high execution efficiency even in the presence of large-scale data. Furthermore, we compare HEBCS with a classic method and a state-of-the-art method, demonstrating that HEBCS achieves significantly higher search efficiency while maintaining a comparable accuracy, recall and F1-score. In real-world vulnerability query applications, HEBCS demonstrated promising results. Its effectiveness in large-scale binary function searches suggests significant potential for practical applications.
1. Introduction
Internet technology has grown by leaps and bounds and an increasing amount of code is being generated and disseminated online. Code reuse is a common practice in software development to improve efficiency. In order to protect developers’ intellectual property rights and software system security, most software developers will not release their source code but package it into executable files, often in binary form. Binary code similarity techniques have significant value in the security field. They can help developers and security researchers quickly and accurately identify similarities and differences between different versions of software or code from different sources, thereby improving the efficiency and accuracy of software analysis. Binary code search is the process of using similarity techniques to search for code in code repositories that is similar to a given code snippet [1]. It has wide-ranging applications in scenarios such as identifying the propagation of open-source component libraries, detecting code plagiarism, analyzing security patches and discovering vulnerabilities.
During the compilation process, program information, such as function names, variable names, code comments and data structure definitions, are lost [2]. The same source code will use different compilers and different compilation optimizations and have different target architectures during the compilation process. Although these binaries significantly change after compilation, they are still considered similar, which increases the difficulty of identifying similar binaries. The widespread reuse of code can lead to the widespread propagation of vulnerabilities [3], and the complexity of binary files makes vulnerability detection a time-consuming task. This highlights the significant role of binary code similarity in the detection of existing vulnerabilities [4]. In such cases, given a known vulnerable file, binary code search techniques can identify the presence of the vulnerability in a large code repository without the need for the application of complex vulnerability detection to every code snippet. Searching for suspicious vulnerable code in code repositories through code search techniques plays a crucial role in enhancing the security of software systems.
To compare binary files, it is necessary to first disassemble them using disassembly tools in order to obtain information such as the assembly code and control flow graph (CFG). Currently, most methods rely on processing disassembly information to obtain binary similarity results. The process of binary similarity comparison typically consists of two stages: code representation and similarity matching [5]. Code representation involves several steps, including code preprocessing, feature extraction and model selection. In the preprocessing phase, tools like IDA are utilized to disassemble the code and remove irrelevant information. Next, code features are extracted to obtain intermediate representations, such as the control flow graph [6,7,8,9] and assembly code [10,11,12,13]. Subsequently, different intermediate representations are processed differently, and various models are chosen to generate comparison units. Finally, an appropriate measurement algorithm is applied to assess the similarity of these comparison units and determine the similarity of the binary code [14]. Our method is to represent the code by extracting features related to similarity. Although only extracting a certain feature can represent the meaning of the code to a certain extent, code features are very diverse, and only representing the meaning of the code from a single dimension will always lose code information. Therefore, our method extracts the features of the function from three dimensions that describe the information for the function in terms of different aspects. Moreover, these features are transformed into locality-sensitive hashing for similarity measurement.
Although various detection methods and tools with distinctive features have emerged, in the era of open-source code and large-scale code data, many of these methods are insufficient to effectively address the challenges posed by large-scale code detection. The efficiency of existing methods is not satisfactory when dealing with such a vast amount of software on the Internet. Therefore, this paper presents a locality-sensitive hashing-based high-efficiency binary code search method called HEBCS, specifically designed for large-scale binary code analysis. HEBCS extracts features from various dimensions of binary files and converts functions into hash representations. The similarity is determined using the Hamming distance metric. Furthermore, an efficient storage and retrieval structure is employed to minimize query time even when confronted with massive datasets.
The innovations of this paper are as follows:
- Our method addresses the challenge of cross-architecture binary code comparison, accommodating the diverse types of closed-source binary files. We extract architecture-independent features to enable similarity analysis across multiple architectures;
- Furthermore, we propose a novel approach that accurately represents functions through multi-dimensional feature hashing, making it well suited for analyzing massive amounts of data. By integrating various features, we significantly reduce the storage space required for storing the generated hashes;
- To improve detection accuracy, we assign targeted weights to different features based on their relevance in similarity comparison. This approach enhances the precision of our detection process while efficiently handling functions;
- In terms of storage and querying, we utilize a pigeonhole principle, which optimizes the storage and retrieval of hashes. This strategy minimizes the indexing time of binary files and significantly reduces the time complexity of queries, thereby improving the overall query speed of the system.
2. Related Work
In recent years, various methods have been proposed to address the binary similarity problem. One such method is Gemini [15], introduced in 2017, which utilizes a graph neural network (GNN) model and the Siamese architecture to calculate binary code similarity. Gemini introduces attribute-control flow graphs (ACFGs) by incorporating attributes within and between basic blocks of control flow graphs (CFGs). The ACFG is used as input, and the improved Structure2vec [16] algorithm is employed to calculate graph embeddings. The Siamese architecture is then used to determine function similarity. Although this method supports cross-architecture analysis, using a graph-based approach can lead to low execution efficiency.
In 2019, Google proposed Functionsimsearch [17], which uses fuzzy hashing for binary similarity searching, transforming CFG-based features into hashing for cross-architecture similarity searching. However, due to the limited types of function features extracted, this method cannot distinguish well in some cases where the binary changes are large.
Trex [18], proposed in 2020, uses unsupervised training tasks to automatically learn semantics from the micro-traces of functions. Trex employs a novel transformer [19] that can learn execution semantics from micro-traces during the pretraining phase and, by adjusting the pretrained model, can match semantically similar functions.
In 2022, JTrans [20] introduced a novel approach by embedding control flow information for binary code into a transformer language model. JTrans incorporates the destination address of jump instructions as an embedded location within BERT and adds it to the token embedding to obtain the final embedding. Additionally, JTrans replaces the unsupervised training next sentence prediction (NSP) subtask of BERT with the jump target prediction (JTP) task. Finally, the cosine distance is utilized as the similarity measurement method for the language model.
Previous research has divided similarity methods into graph-based and instruction-based methods based on the different representations of the processed code. With the emergence of new technologies, the latest machine learning methods are continuously being applied to process code representations of similarity, and detection effects are constantly improving. However, processing graphs may result in excessive computer overhead and low processing efficiency [21], making it unsuitable for large-scale processing. Although using assembly instructions for similarity detection has high execution efficiency and robustness [22], it cannot solve cross-architecture problems due to the different instruction sets of different architectures. Therefore, similarity analysis from a single dimension has some limitations [23]. Our method extracts features from multiple dimensions of the code, which can effectively preserve code information while also measuring similarity. In addition, by adopting efficient storage and query structures, high execution efficiency can still be achieved in the face of large-scale data.
3. Background
This section introduces the background knowledge for the methods used in this paper.
Locality-Sensitive Hashing: Locality-sensitive hashing(LSH) [24] is a fast approximate nearest-neighbor search technique for massive high-dimensional data. After two adjacent data points in the original data space are transformed by the same mapping or projection, the probability that the two data points will still be adjacent in the new data space is very large, while the probability that the non-adjacent data points will be mapped to the same bucket is very small.
SimHash: The SimHash [25] algorithm is a fingerprint generation algorithm proposed by Google. It is a kind of LSH and was first used in search engine page deduplication. A SimHash is generated by reducing the dimensions of the text, and the similarity between two texts is judged by comparing the Hamming distance.
The Weisfeiler–Lehman test of isomorphism: The Weisfeiler–Lehman(WL) test of isomorphism [26] is an algorithm used to determine the similarity of graph structures. It is based on the label information for a node and its neighbor nodes and compares the similarity between the two graphs by iteratively updating the label. It is an efficient and extensible graph isomorphism determination algorithm that can handle large-scale graph data with good accuracy and robustness.
Attribute Control Flow Graph: The attribute control flow graph (ACFG) was first proposed in Genius [14]. It is a graphical structure used to represent program code. The code representation is created by adding features to the basic blocks in the CFG. In Gemini ‘s ACFG, the block-level and inter-block attributes are extracted, including string constants, the number of transfer instructions, the number of calls, the number of instructions, the number of arithmetic instructions, the number of offspring and the betweenness.
Pigeonhole Principle: The input is mapped to a specific output range by the hash function. If the number of inputs exceeds the size of the output range, according to the pigeonhole principle, at least two inputs will be mapped to the same output value. It can be determined that there is at least some kind of collision or repetition.
4. Methods
The implementation of HEBCS consists of three main steps. Given an input binary function and a binary code database, the first step is to extract features from them. Our method comprehensively characterizes functions by extracting three different types of features: instruction features, syntax features and structural features. To achieve the representation and storage of large-scale functions, the three types of function features are fused and transformed into feature hashes of functions. These hashes can uniquely represent a function and the hash values of similar binary functions are also similar. Then, the Hamming distance between the given binary function and the hash of each function in the code database is calculated. Finally, if the Hamming distance between the hash in the code database and the hash of the given target is greater than the threshold, this function will be output as a similar function. The overall process of the method is illustrated in Figure 1.
4.1. Feature Selection
As binary forms cannot be directly compared, they must first be processed to extract function features. The quality of feature selection determines the quality of binary function representation, which plays a crucial role in similarity comparison [26]. Similar binary functions are often similar in some way. For example, Figure 2 shows the control flow diagrams of the CWE121 function under X86 architecture and ARM architecture. The CFG diagram structures are similar, so the characteristics of a single dimension can represent the characteristics of the function to judge similarity [27]. However, functions are not only characterized by graph structures, such as CFGs, but are also composed of multidimensional features, such as instruction features, syntax features and character features. A single dimension cannot depict a function stereoscopically [28]. If the binary function changes significantly in some way, it is not always accurate to determine similarity through a single dimension [29].
To improve the accuracy of the method and detect as many similar codes as possible, we extract function features from the three dimensions of assembly instructions, syntax information and function structure. These features are then converted into a unified hash representation for fusion to form a unique hash value for the function. Since many methods assume that semantics should not change across compilers or target architectures, the semantic features of functions are extracted for similarity analysis. However, most methods do not explain the necessity of complex semantic analysis [30,31,32]. Extracting function semantics requires in-depth analysis of the code and mining the meaning of the code, which is usually complex and time-consuming, and semantics are also extracted on the basis of code features. Therefore, this method does not extract the semantic features of the function but uses the multi-dimensional function features to represent the code, which does not require complex code analysis, and the extracted features can achieve accuracy similar to the semantics because the binary files of different architectures not only have similar semantics but also have similarities in some features. Therefore, the characteristics of the three dimensions we selected are sufficient to meet the requirements of binary similarity judgment.
We expand and improve on the characteristics of the existing successful case Gemini and extract numerical counting information from the assembly code. The use of some instruction characteristic values in the ACFG in Gemini is extended from the basic block to the whole function, and other instruction information is added so that the instruction characteristic values can fully represent the overall characteristics of the function. Syntax features reflect part of the information before the function is compiled from the source code dimension. We extract the string constant and function call of the function as syntax features. Generally, the string existing in the function will not change before and after compilation, and the function call, as an important function feature, plays a very important role in similarity judgment. The structure feature extracts the function control flow graph (CFG) and function call graph (CG). The CFG can reflect the information for the control flow between each basic block and the overall structure of the function, which is important for understanding the execution process of the function. A CG diagram represents the calling relationship between functions in the whole program. Similar functions may have similar control calling relationships, so CG-related data can also be used as a feature to judge and evaluate similarity. The three dimensions of instruction characteristics, syntax characteristics and structure characteristics can reflect the information for the target function before and after compilation, as well as its control flow and calls between functions.
This paper employs a comprehensive selection of nine distinct features to effectively represent functions. These features, which are summarized in Table 1, encompass three key dimensions: instruction attributes, syntax attributes and structure attributes. These dimensions are chosen due to their ability to provide valuable insights into the variations observed in binary functions.
In terms of the instruction attribute, we specifically extract four types of information: the total number of instructions, the number of arithmetic instructions, the number of transfer instructions and the number of logical instructions. These metrics shed light on the nature of the instructions present within the functions.
Concerning syntax attributes, we focus on two crucial aspects: the number of call instructions and the presence of string constants within the function. These attributes capture important characteristics related to the function’s invocation and the usage of string data.
The structure attribute is examined by considering three factors: the number of incoming calls to the function, the number of edges in the control flow graph (CFG) and the graph similarity determined through the isomorphism of the CFG. These measures provide insights into the function’s structural properties and its relationship with other parts of the program.
By encompassing these nine features, we aim to provide a comprehensive and multi-dimensional representation of functions that effectively captures the changes and characteristics inherent in binary functions.
4.2. Function Hashing
Among the extracted multidimensional features, there are numerical types, string types and graph types. In order to ensure these features have a unified representation, we convert different types of features into locality-sensitive hash representations so that similar features have similar hash values. Finally, we merge the hash values of different features in the function, and the hash value of the function is the concatenation of the 10 feature hash values of the function. We use this hash to perform similarity queries.
4.2.1. Numerical Hashing
The traditional similarity measurement algorithm is not fully applicable to the similarity between values for the extracted numerical features. To represent numbers in computers, they are usually converted into ASCII code or binary representation for computer processing. However, ASCII and other representations cannot measure the similarity between numbers. The Euclidean distance or cosine similarity may be used to measure the similarity between numbers, but these methods still have drawbacks. For example, the Euclidean distance is not suitable for dealing with high-dimensional data, as the more dimensions the data have, the lower the accuracy of similarity calculation. The cosine similarity does not consider the size of the vector, only its direction. Moreover, due to the varying importance of different numerical values in similarity comparisons, the weights of different feature values are not fully considered. In addition, general distance similarity calculation methods require more complex mathematical operations, which are costly in terms of the underlying computer operations, especially for large-scale numerical calculations with high time complexity. Therefore, this article proposes a new numerical representation and similarity calculation method that can preserve the similarity between values while considering the size of feature weights corresponding to different values and simplifying the similarity calculation process.
Algorithm 1 converts the input value into a hash form, and the hash can measure the similarity between different values. For the numerical value of a certain feature, in order to convert it into a hash value that can be used for similarity measurement, the number of bits N of the hash is also needed. If the input value is less than the maximum value that can be generated by bits, the conversion process begins. Otherwise, the value is directly assigned to all hash bits, making it the default maximum value that can be processed by bits. The conversion process first initializes the hash . When initializing the hash, all hash bits are usually initialized to 1. Then, according to the input number, we need to determine the number of bits that need to be assigned to the hash; the larger the number, the more bits need to be assigned. The assignment process uses the shift operation, and the initialized hash is shifted according to the calculated number of bits . Finally, we get the hash corresponding to a value.
| Algorithm 1 Numerical similarity processing algorithm |
| Input: is the number to be converted, is the number of bits in the hash Output: is the obtained hash if then for to do end for for to do end for else end for return |
The similarity can be calculated based on the differences in values at the same bit of the hash. If the distance between two numerical values is large, the difference in the number of hash bits that need to be shifted after the same operation will also be large. The difference in the number of hash bits that need to be shifted after the same initialization will also be large. and represent the number of bits that need to be shifted. If the distance between numerical values is small, the final hash difference will also be small. The calculation formula is as follows.
Due to the representation of various types of function features as numerical values and their conversion into hash forms, the resulting hash contains information about the functions. The importance of different function information may vary when comparing similarities, and combining different pieces of information in certain proportions may yield higher accuracy in similarity comparisons than relying solely on a single type of information. Based on these assumptions, we introduce weights into the numerical features, allowing assignment of values based on the relative importance of different numerical features in similarity comparisons. The weighting algorithm will be described in detail later in this article. By incorporating weights, we can fully consider the importance of different features in similarity comparisons when calculating the similarity using the Hamming distance between weighted hashes. The calculation formula is as follows.
The numerical similarity processing algorithm transforms numerical values into hash representations, which not only preserve some information about the distance between the values but also allow for measuring their similarity. This is achieved through a process of converting the numerical value into a hash value using a shift operation, followed by calculating the similarity using the Hamming distance. This approach eliminates the need for complex processing steps, reduces the time complexity of calculations, enables efficient operations with computers and converts features into hashes, thereby reducing space complexity. It facilitates the processing of large-scale data and allows for assigning weights to hash values, thus fully considering the importance of different features and their relationships. This hash-based method does not compromise the accuracy of similarity calculations for high-dimensional data when operating with multiple feature values. Consequently, this method offers high accuracy and efficiency.
4.2.2. String Hashing
The compiler typically ignores comments and other irrelevant characters during compilation. However, when it comes to compiling optimization, the compiler usually does not handle strings within functions. Instead, string constants are typically stored in the memory’s constant area and remain unchanged by the compiler and other factors. As a result, the strings present in different binary functions compiled from the same source code will be identical. Based on this observation, we choose to include the strings from the binary file as part of the instruction characteristics for generating hash codes.
In the field of text similarity measurement, vectorization is commonly employed, and several effective character vectorization algorithms have emerged, such as word2vec [33]. These methods excel at capturing the semantic information of a text. However, they may struggle to measure the similarity of text strings with limited semantics, and their application can be more complex for such cases.
Furthermore, the degree of potential change differs across text in different locations. For instance, characters within the “printf” function typically remain unchanged, whereas characters in string-type variables may undergo modifications due to compiler optimizations. This discrepancy indicates that string text in different locations holds varying degrees of importance.
To address the challenge of accurately measuring string similarity and considering strings’ varying importance in different function positions, this study employs the SimHash algorithm for text similarity processing. Unlike traditional hash coding, even minor changes in strings can lead to significant differences in hash values. However, the SimHash algorithm encodes similar texts into similar hash values, thus reflecting their similarity. By encoding characters into fixed-length binary hash strings, the SimHash algorithm ensures that highly similar strings exhibit similar Hamming distances, while dissimilar strings have larger Hamming distances. Consequently, the similarity of string constants within a function can be assessed based on the similarity of their hashes.
A SimHash is a type of locality-sensitive hash (LSH). Compared to traditional hashes that generate distinct hashes for different texts, LSHs generate similar hashes for similar texts. If two texts are similar in the original data space, they will remain highly similar even after the hash function conversion. Conversely, if they are dissimilar, their similarity should not increase significantly after conversion.
The process of converting strings into SimHash, as illustrated in Figure 3, involves five steps: word segmentation, hashing, weighting, merging and dimension reduction.
The specific process is as follows:
- First, we extract all the strings in the binary function and combine them into one string and then segment the string combination to get all the words in the string;
- Then, the hash function is used to convert each word after the first word segmentation into a fixed-length hash value so that each word has a unique hash value;
- The next step involves weighting the words extracted in the first step, assigning different weights to different words based on the position of the string they belong to in the code. Words that exist in print-related statements should be given greater weights. Afterwards, the hash obtained in the second step is weighted, and the weighting process is shown in Formula (3). If the hash value obtained in the second step has a bit value of 1, the weight is multiplied by 1. If the value of a bit is 0, the weight is multiplied by -1, and the weighted hash obtained is replaced by the hash calculated in the second step. This hash is the weighted hash value of different words.
- 4.
- The hash value results of different words in a string are accumulated so that the string sequence of each function has only a unique string of hash values;
- 5.
- Finally, the result of each hash string is judged. All hash bits are traversed, and if the bit is greater than 0, it is set to 1; otherwise, it is set to 0. Finally, the bit stream sequence is the SimHash value of the string.
By extracting character constants from binary files and reducing their dimensionality, they can be transformed into a locality-sensitive hash. The Hamming distance is used to judge the similarity of hashes, and the similarity of strings in different binary programs is judged by comparing the different hash digits. This method does not use the complex training process of deep learning and can also determine the similarity between different strings. The processing steps are simple and suitable for large-scale data processing.
4.2.3. CFG Hashing
CFGs can effectively reflect program structure information and control information and play an important role in binary similarity [34]. Weisfeiler–Lehman (WL) algorithm is one of the classical algorithms used to test graph isomorphism. When comparing CFGs, we first represent the CFG as a labeled undirected graph, where each node represents a basic block and edges represent the jump relationships between different blocks. Then, we employ the WL graph isomorphism algorithm to compare the isomorphism between this CFG and another CFG. If their transformed tag sequences are similar, it indicates that the two CFGs are similar in structure.
In the WL algorithm, each node is marked as a unique tag, and they will be updated and merged continuously during the iteration process and eventually form a unique hash value. For similar graph structures, their hash values will be very similar. This is also compatible with the previous numerical feature hash and character hash, and the similarity is calculated through the Hamming distance.
Specifically, the steps of the WL graph isomorphism algorithm are as follows:
- Initialization: Set each node of the original graph as an independent initial label. Labels can be objects of any type, such as numbers, strings or tuples;
- Iteration: For each iteration, traverse each node in the graph, combine the labels of its neighbors and its own nodes through a hash function and generate a new label;
- Update: Assign the generated new label to the node;
- Judge: Compare whether the label sequences of nodes in two graphs are completely equal after several iterations. If they are equal, the two graphs are isomorphic and vice versa.
By transforming the CFG into a 64-bit hash value, we can compare the similarity of the hash values to judge the similarity of the function structures and take it as a part of the function similarity judgment. The WL graph isomorphism algorithm has high computational efficiency and can convert complex graphs into feature vectors suitable for large-scale comparison.
4.2.4. Feature Weight Assignment
In function similarity comparison, not every feature is equally important. For example, some features are more important than others and should be given greater weight. Alternatively, some features may have a good similarity judgment effect when they are combined with the same proportions. Therefore, weighting the extracted features is of great significance for improving the accuracy of the comparison.
All features are represented in hash form, and the Hamming distance is used to measure the similarity. The Hamming distance is used to judge the similarity between the same features in different functions. Therefore, the Hamming distance between each pair of features in the comparison function should be weighted when weighting. Finally, the Hamming distance for similarity judgment should be the sum of the Hamming distances of all weighted features.
For two functions and , if the Hamming distance between their n features is and the corresponding weights of each feature are , the weighted Hamming distance between the two functions can be calculated using Formula (4).
In our method, the XGBoost algorithm [35] is used to weight features in the training process, which is an efficient gradient-lifting decision tree algorithm. Its core is that it adopts the integration idea to integrate multiple weak learners into a strong learner through a certain method; that is, multiple trees are used to make decisions together. The performance of the model can be gradually improved by iteratively adding decision trees. In order to make better use of the information from different features, the features are weighted in the training process. In addition, XGBoost also uses a variety of regularization techniques and optimization strategies to further improve the efficiency and generalization ability of the algorithm. Regularization techniques such as reduction and parameter adjustment can prevent overfitting.
The XGBoost algorithm automatically calculates the weight of each sample by monitoring the training loss and gradually updates the weight value through iterative steps. The importance score of the feature measures the value of the feature in the construction of the lifting decision tree in the model. The more an attribute is used to build decision trees in the model, the greater its importance is. The calculation method for the feature importance weight is to calculate the sum of the times that each feature of all the tree models is used as a partition and weight it to consider the relative information gain value of each partition. In other words, we can express the importance of each feature in the training process as the cumulative sum of the times it is selected as the segmentation node in all tree models. The specific mathematical expression is shown in Formula (5):
In this formula, indicates the importance of the feature; represents the total number of trees built; represents the number of times the feature is selected as a segmentation node in the tree; and indicates the relative information gain brought about by the splitting.
The XGBoost algorithm automatically obtains the weight values of the different features of each function by monitoring the loss of training data and updates the weight of each function feature through the intermediate iterative steps. Therefore, the XGBoost algorithm can give appropriate weights to different function features, thus improving the classification accuracy. Finally, the algorithm can determine a comprehensive weight value for all features of the whole function and provide more accurate prediction for function similarity problems.
4.3. Similarity Search
Given the hash of two functions, the Hamming distance is used to calculate the similarity. Since the hash is in the form of a 01 hash string, the calculation of the Hamming distance involves calculating the number of different bits with the same hash value among different functions. For a hash string given with M bits, its Hamming distance is calculated as in Formula (6):
and represent the kth binary bits in the ith and the jth hash strings, respectively. If the Hamming distance is greater than the similarity threshold, the two functions are considered not similar; otherwise, they are considered similar. In addition, it is also very important to select the appropriate Hamming distance threshold. If the Hamming distance threshold is larger, two functions with lower similarity will also be considered similar. There will be many dissimilar functions among the functions found, and the accuracy of the method will be low. If the Hamming distance threshold is small, only functions with small differences will be identified as similar functions. Some similar functions will not be screened out, and there will be a certain rate of false negatives. However, due to the large number of hash bits in the function, calculating the Hamming distance directly will reduce the calculation efficiency. In order to carry out a large-scale function search, we utilize an efficient hash storage and query method that enables efficient Hamming distance calculation when the number of hash bits is large.
When the function hash is obtained, it is stored in segments. It is divided into different segments according to the total number of bits in the hash. Each segment stores a portion of the bits in the function hash. When judging similarity using the Hamming distance, the pigeonhole principle is used for calculation. The storage and query process for the function hash has the following steps:
- Set the Hamming distance threshold as N;
- Assuming that the hash value of the function to be compared is M bits, divide it into N + 1 segments and make the hash bits in each segment except the last segment
- 3.
- The hash value is stored in the form of a dictionary. Different stores set the hashes of the segmented segments as Key and the remaining segments as Value; that is, will be indexed N + 1 times according to different segments:
- 4.
- During the similarity comparison, query the hash segment with the same index key as the target function. Since the function has N + 1 indexes, there can be N + 1 queries at most;
- 5.
- If the same index segment is found, the value corresponding to the index segment is traversed to calculate whether the Hamming distance is greater than N. The maximum number of queries required to traverse the value corresponding to the key is .
If the query-based method is used for calculation, the M-bit function hash can exist at most times. If it is necessary to find all functions with a Hamming distance within N, the total number of queries will be . If the pigeonhole principle is used, the number of queries should be the number of times querying the index multiplied by the number of times querying the Hamming distance in the value corresponding to the index; at most, .
Suppose the Hamming distance threshold is set to 3. If the hash of the function is 11001010011, it is first split into four segments when it is stored, and the four segments will be 110, 010, 100 and 11. Then, the hash is stored as a dictionary, each segment is a key, and the other segments are values; that is, {110: 01010011, 010: 11010011, 100: 11001011, 11: 110010100 }. After that, the similarity comparison is performed, and the same segmentation is performed on the new hash. If the same key value is found, the Hamming distance of the query value is less than 3.
Suppose there are functions in a database. There are nearly 1 billion pieces of data, and the number of queries using the query method is 100 million. If the pigeonhole principle is used, the hash of each function segment will usually be 16 bits, so the maximum number of queries will be , which is the 10,000 level. Therefore, when facing large-scale functions, the pigeonhole principle can significantly reduce the number of queries.
5. Experiment Setup
5.1. Dataset
GNU is a collection of a large number of free software packages, including a kernel, compiler, debugger, editor, text processor, graphical user interface and other tools and applications. It can be used as an operating system or combined with other operating systems. An operating system completed with GNU tools has become the mainstream option for the Linux system family.
OpenSSL is a popular open-source encryption library and toolkit for creating and managing SSL/TLS encrypted connections. It provides a series of encryption algorithms and protocol implementations, can be developed and deployed on various platforms and is widely used in network security, encryption technology, Web development and other fields.
The experimental dataset included packages from GNU and all functions in the 1.01f, 1.01u, 1.11a and 1.11b versions of OpenSSL. After being compiled with different architectures (X86, ARM and MIPS), there were 576,379 functions in the datasets. In order to ensure our experiment proceeded smoothly, when evaluating the effectiveness of our method, we selected a2sp, binutils and coreutils from GNU and four versions of OpenSSL. There were a total of 213,364 functions, but when we had to evaluate the processing efficiency of this method in processing large-scale functions, all functions included in the dataset were selected during the experiment. There were 576,379 functions in the code base, and the function hash was segmented according to the selected Hamming distance threshold N; that is, there were (N + 1) ∗ 576,379 key-value entries in the index library.
5.2. Evaluation Metrics
In our experiment, we used the precision, recall and F1-score to measure the effectiveness of the method.
True positive (TP): the number of positive classes predicted as positive classes;
True negative (TN): the number of negative classes predicted as negative classes;
False positive (FP): the number of false positives that predicted a negative class as a positive class;
False negative (FN): the number of false positives that were predicted to be negative.
Precision indicates the ratio of the number of real similar codes detected to the total number of retrieved codes.
Recall indicates the ratio of the number of real similar codes detected to the total number of actual similar codes.
The F1-score is the harmonic average of the accuracy rate and recall rate.
5.3. Baselines
We compared HEBCS with a classical method and a state-of-the-art method. In order to ensure fairness, as HEBCS does not use the GPU, the baselines did not use the GPU for training and evaluation.
Gemini uses a GNN to learn CFG representations by extracting basic block features and learns similarity through a Siamese network. Due to the great significance of this method in the field of similarity detection, almost all similarity methods are compared with it, so this paper also regards it as baseline.
Trex [18] is a cross-architecture binary detection method that can automatically learn semantic information from a program‘s micro-trace and use the learned knowledge to match semantic information. This is also a state-of-the-art method that can detect cross-architecture binary code similarity.
5.4. Supporting Tools
In order to ensure the fairness of the experiment, the disassembly tool used for the baseline, IDA Pro, was used for the disassembly of the code, and it is also the current mainstream disassembly tool. Due to the large scale of the function, this method also employed a batch disassembly script, which integrated function feature extraction, string extraction, CFG building and so on. For firmware extraction, Binwalk [36] was used and improved to support the batch processing of firmware, and the firmware file system could be automatically located and extracted. However, the location of the vulnerability point still had to be confirmed by manually collecting relevant data.
6. Evaluation
6.1. Research Questions
Our evaluation aimed to answer the following questions.
RQ1: Can we distinguish similar and dissimilar functions with these features?
RQ2: How effective is weight training and what is the effect compared with no weight training?
RQ3: What is the most appropriate choice of Hamming distance to effectively distinguish similar and dissimilar features?
RQ4: How effective is our method?
RQ5: How effective is our method in real-world vulnerability detection?
For the fairness of the experiment, we uniformly used IDA Pro to disassemble binary files. All the training and inference were implemented on a Linux server running Ubuntu 18.04 with an Intel(R) Xeon(R) Gold 5120 CPU @ 2.20GHz, 128G RAM.
6.2. RQ1: Effectiveness of Feature Selection
The selected numerical features included eight-dimensional features, such as instruction features and syntax features. First, we selected some functions in the dataset, and we extracted the values of the features selected with this method before they were converted into hashes. We clustered these feature values and classified them into seven categories according to the k-means algorithm. The clustering diagram is shown in Figure 4. Using the clustering diagram, different categories can be roughly analyzed. Since each category had seven different characteristics and different functions can be distinguished according to characteristics, it can be stated that these characteristic values can be used to roughly distinguish different functions.
In order to further illustrate the effectiveness of the method in feature selection and the effect of the method in feature processing, in accordance with the processing steps of the method, we converted the feature vector into a hash, distinguished similar and dissimilar functions according to the function name in the dataset and calculated the Hamming distance for the feature hash between each feature as the new vector of the feature. If the weight of the feature had to be increased, it was necessary to give weight to the Hamming distance with different characteristics. In this process, it was necessary to balance the number of similar functions and dissimilar functions to avoid an impact on the results caused by an excessive number of dissimilar functions.
Then, the k-mean algorithm was used to cluster similar and dissimilar function pairs. The clustering results are shown in Figure 5, which presents the clustering effect after adding feature weights. The dots in Figure 5 represent similar function pairs, and the plus signs represent dissimilar function pairs. Although there was some noise information, similar and dissimilar function pairs could be better distinguished according to these characteristics. Therefore, this not only shows that similar functions could be effectively distinguished in the selection of these features but also demonstrates the effectiveness of this method in distinguishing similar and dissimilar function pairs.
6.3. RQ2: Effectiveness of Weight Training
In order to evaluate the effectiveness of weight training, the curves for each evaluation metric with different Hamming distances after weight training and without weight training were drawn, as shown in Figure 6, Figure 7 and Figure 8. With the same Hamming distance, the trained recall rate is higher than the untrained recall rate, and the curve quickly becomes stable. In terms of the accuracy rate, after weight training the decline is relatively gentle above a certain Hamming distance compared with the situation without weight training. The F1-score curve after weight training is above the curve without weight training. This shows that, after weight training, similar codes can be distinguished better and the range of Hamming distances that can be selected with better effects is relatively wide. This is more suitable for comparison of similar functions.
6.4. RQ3: Selection of Hamming Distance
After the weight of each feature is calculated, the Hamming distance for the similarity definition needs to be determined when searching. Selecting an appropriate Hamming distance judgment threshold is an important factor affecting the search results. If the Hamming distance selected when querying similarity is large, the query results will contain dissimilar functions, and the accuracy rate will decline. If the Hamming distance is small, all similar functions will not be found with the query, and the recall rate will be low. Therefore, it is necessary to select a suitable Hamming distance to achieve better query performance results. Through experiments on the recall rate and accuracy rate of the method detection under different Hamming distance thresholds, the best Hamming distance was obtained.
In order to ensure the universality of the results of the method, multi-architecture datasets were also used for the Hamming distance calculation. Through multiple experiments searching for a variety of different functions, the accuracy and recall data were taken as the average from the experiments, and the curves for the accuracy and precision rates changing with different Hamming distances were obtained, as shown in Figure 9.
As shown in the figure, when the Hamming distance increased from 20 to 90, the recall rate for similar functions that could be found increased until all similar functions could be found. However, when the distance was greater than a certain Hamming distance, the dissimilar functions were regarded as similar functions, and the detection accuracy declined. When the Hamming distance was 58, the F1-score value was the highest at 0.964. Therefore, when the Hamming distance was 58, the effect was the best. At this point, the accuracy rate was 0.943, and the recall rate was 0.938.
6.5. RQ4: Effectiveness of HEBCS
Compared with advanced methods, the feature selection is similar to that of Gemini. However, in contrast to Gemini, it adds more dimensions for the features, features are more abundant and diverse and the features expand from the basic block level to the function level. Therefore, in relation to Gemini, HEBCS further verifies the correctness of feature selection and the performance of the method. In addition, this paper also compares these methods with advanced machine learning methods using previous evaluation indicators and evaluates the execution efficiency of this method with large-scale code sets to illustrate the performance of the method.
Comparing previous methods and our method, Table 2 shows the search efficiency of different methods evaluated by the number of functions that can be searched for per second. According to our experimental results, under the same environment configuration, Gemini can search for 69 functions per second, Trex can search for 764 functions per second and HEBCS can search for 3186 functions per second. HEBCS showed outstanding performance in the baseline experiments.
In order to evaluate the effectiveness of this method in a cross-architecture search, comparative experiments were also designed for a comparison between different architectures. Table 3 shows the evaluation metrics for the different methods. P represents precision, R represents recall and F1 represents the F1-score.
In terms of the accuracy, recall rate and F1 score, our method had a better effect than Gemini, but there was still a certain gap with Trex; however, the effect was not much different. In terms of execution time, our method had significant advantages. Gemini could only execute 69 function queries per second, Trex could execute 734 function queries per second, and our method could execute 3186 function queries per second, which was about 50 times that of Gemini, while Trex achieved a level about 5 times that of Gemini. Therefore, our method can effectively shorten the query time for large-scale data applications.
6.6. RQ5: Real-World Performance
We also carried out relevant experiments on firmware vulnerability discovery through the application of vulnerability discovery to a batch of collected firmware to prove the method’s capacity for vulnerability discovery in the real world. Firstly, the firmware image and file system in the firmware library were extracted by Binwalk, the function was extracted and transformed into a hash by IDA Pro and the hash value was stored in the database by using the pigeonhole principle. When locating vulnerabilities, the binary files and functions that appeared in known vulnerability functions were manually queried. After that, the query was performed in the database, and the existence of the similarity function was verified after the query. Table 4 shows the vulnerability discovered in the real world. Although most of the vulnerabilities could be found, there were still false positives. This may have been because vulnerabilities were repaired but the similarity with the original vulnerability was still high after repair.
7. Conclusions and Future Research
This paper proposes an efficient hash-based search method for similar binary functions. From the extraction of features related to similarity for code representation, it can be seen from previous studies that binary functions of different architectures always have some similar features. Therefore, different types of features, such as instruction features, syntax features and structural features, are extracted for representation, which replaces the complex semantic extraction process and representation but can achieve similar effects as semantic extraction. After that, the hash algorithm and the feature weighting algorithm are used to combine the features, transform the binary function into a locality-sensitive hash and efficiently search the hash value through the drawer principle. Compared with advanced machine learning methods, this method has significant advantages in query efficiency, but there is still a slight gap in the accuracy and recall rate. This shows that this method is suitable for large-scale cross-architecture binary code querying. However, this method still has some defects. When similar functions use different compilers through different compilation optimizations and use different instruction sets, the binary function will change greatly. At the time of writing, the accuracy of the method is not as good as expected. Therefore, in the future, improving the accuracy of the hash-based method when the binary function changes greatly should be studied.
Author Contributions
Conceptualization, X.S. and Y.W.; methodology, X.S.; software, X.S.; validation, X.S. and J.D.; formal analysis, Q.W.; investigation, X.S. and Q.W.; resources, X.S. and Q.W.; data curation, X.S. and J.D.; writing—original draft preparation, X.S.; writing—review and editing, X.S. and Y.W.; visualization, X.S.; supervision, Q.W.; project administration, Q.W. All authors have read and agreed to the published version of the manuscript.
Funding
This research was funded by the National Key R&D Program of China, grant number 2020YFB2010900, and the Program for Innovation Leading Scientists and Technicians of ZhongYuan, grant number 224200510002.
Data Availability Statement
The data that support the findings of this study are available from the corresponding author upon reasonable request.
Acknowledgments
The authors thank the editor and the anonymous reviewers for their constructive feedback and valuable advice.
Conflicts of Interest
The authors declare no conflict of interest.
References
- Yang, J.; Fu, C.; Liu, X.-Y.; Yin, H.; Zhou, P. Codee: A Tensor Embedding Scheme for Binary Code Search. IEEE Trans. Softw. Eng. 2022, 48, 2224–2244. [Google Scholar] [CrossRef]
- Hu, Y.; Zhang, Y.; Li, J.; Wang, H.; Li, B.; Gu, D. BinMatch: A Semantics-Based Hybrid Approach on Binary Code Clone Analysis. In Proceedings of the 2018 IEEE International Conference on Software Maintenance and Evolution (ICSME), Madrid, Spain, 23–29 September 2018; pp. 104–114. [Google Scholar]
- Gao, J.; Yang, X.; Fu, Y.; Jiang, Y.; Sun, J. VulSeeker: A Semantic Learning Based Vulnerability Seeker for Cross-Platform Binary. In Proceedings of the 33rd ACM/IEEE International Conference on Automated Software Engineering, Montpellier, France, 3–7 September 2018; Association for Computing Machinery: New York, NY, USA, 2018; pp. 896–899. [Google Scholar]
- Duan, Y.; Li, X.; Wang, J.; Yin, H. DeepBinDiff: Learning Program-Wide Code Representations for Binary Diffing. In Proceedings of the Proceedings 2020 Network and Distributed System Security Symposium, San Diego, CA, USA, 23–26 February 2020; Internet Society: San Diego, CA, USA, 2020. [Google Scholar]
- Whale, G. Plague: Plagiarism Detection Using Program Structure; University of New South Wales: Sydney, Australia, 1988. [Google Scholar]
- Eschweiler, S.; Yakdan, K.; Gerhards-Padilla, E. DiscovRE: Efficient Cross-Architecture Identification of Bugs in Binary Code. In Proceedings of the Network and Distributed System Security Symposium, San Diego, CA, USA, 21–24 February 2016. [Google Scholar]
- Zuo, F.; Li, X.; Young, P.; Luo, L.; Zeng, Q.; Zhang, Z. Neural Machine Translation Inspired Binary Code Similarity Comparison beyond Function Pairs. In Proceedings of the Proceedings 2019 Network and Distributed System Security Symposium, San Diego, CA, USA, 24–27 February 2019; Internet Society: San Diego, CA, USA, 2019. [Google Scholar]
- Mengin, E.; Rossi, F. Binary Diffing as a Network Alignment Problem via Belief Propagation. In Proceedings of the 2021 36th IEEE/ACM International Conference on Automated Software Engineering (ASE), Melbourne, Australia, 15–19 November 2021; IEEE: Melbourne, Australia, 2021; pp. 967–978. [Google Scholar]
- Ahmadi, M.; Farkhani, R.M.; Williams, R.R.; Lu, L. Finding Bugs Using Your Own Code: Detecting Functionally-Similar yet Inconsistent Code. In Proceedings of the USENIX Security Symposium, Virtual, 11–13 August 2021. [Google Scholar]
- Zhang, X.; Sun, W.; Pang, J.; Liu, F.; Ma, Z. Similarity Metric Method for Binary Basic Blocks of Cross-Instruction Set Architecture. In Proceedings of the P2020 Workshop on Binary Analysis Research, San Diego, CA, USA, 23 February 2020; Internet Society: San Diego, CA, USA, 2020. [Google Scholar]
- Li, X.; Yu, Q.; Yin, H. PalmTree: Learning an Assembly Language Model for Instruction Embedding. In Proceedings of the 2021 ACM SIGSAC Conference on Computer and Communications Security, Virtual Event, 15–19 November 2021; pp. 3236–3251. [Google Scholar]
- Ullah, S.; Oh, H. BinDiffNN: Learning Distributed Representation of Assembly for Robust Binary Diffing Against Semantic Differences. IIEEE Trans. Softw. Eng. 2022, 48, 3442–3466. [Google Scholar] [CrossRef]
- Ahn, S.; Ahn, S.; Koo, H.; Paek, Y. Practical Binary Code Similarity Detection with BERT-Based Transferable Similarity Learning. In Proceedings of the 38th Annual Computer Security Applications Conference, San Juan, PR, USA, 9–13 December 2022; ACM: Austin, TX, USA, 5 December 2022; pp. 361–374. [Google Scholar]
- Feng, Q.; Zhou, R.; Xu, C.; Cheng, Y.; Testa, B.; Yin, H. Scalable Graph-Based Bug Search for Firmware Images. In Proceedings of the 2016 ACM SIGSAC Conference on Computer and Communications Security, Vienna, Austria, 24–28 October 2016. [Google Scholar]
- Xu, X.; Liu, C.; Feng, Q.; Yin, H.; Song, L.; Song, D. Neural Network-Based Graph Embedding for Cross-Platform Binary Code Similarity Detection. In Proceedings of the 2017 ACM SIGSAC Conference on Computer and Communications Security, Dallas, TX, USA, 30 October–3 November 2017; ACM: Dallas, TX, USA, 2017; pp. 363–376. [Google Scholar]
- Dai, H.; Dai, B.; Song, L. Discriminative Embeddings of Latent Variable Models for Structured Data. In Proceedings of the 33rd International Conference on International Conference on Machine Learning, New York, NY, USA, 20–22 June 2016; JMLR.org: New York, NY, USA, 2016; Volume 48, pp. 2702–2711. [Google Scholar]
- FunctionSimSearch 2023. Available online: https://github.com/googleprojectzero/functionsimsearch (accessed on 1 August 2023).
- Pei, K.; Xuan, Z.; Yang, J.; Jana, S.S.; Ray, B. Trex: Learning Execution Semantics from Micro-Traces for Binary Similarity. arXiv 2020, arXiv:2012.08680. [Google Scholar]
- Vaswani, A.; Shazeer, N.; Parmar, N.; Uszkoreit, J.; Jones, L.; Gomez, A.N.; Kaiser, L.; Polosukhin, I. Attention Is All You Need. In Proceedings of the 31st International Conference on Neural Information Processing Systems, Long Beach, CA, USA, 4–9 December 2017; Curran Associates Inc.: Red Hook, NY, USA, 2017; pp. 6000–6010. [Google Scholar]
- Wang, H.; Qu, W.; Katz, G.; Zhu, W.; Gao, Z.; Qiu, H.; Zhuge, J.; Zhang, C. JTrans: Jump-Aware Transformer for Binary Code Similarity Detection. In Proceedings of the 31st ACM SIGSOFT International Symposium on Software Testing and Analysis, Virtual, 18–22 July 2022; Association for Computing Machinery: New York, NY, USA, 2022; pp. 1–13. [Google Scholar]
- Liu, Z. Binary Code Similarity Detection. In Proceedings of the 36th IEEE/ACM International Conference on Automated Software Engineering, Melbourne, Australia, 15–19 November 2021; IEEE Press: Melbourne, Australia, 2022; pp. 1056–1060. [Google Scholar]
- Redmond, K.; Luo, L.; Zeng, Q. A Cross-Architecture Instruction Embedding Model for Natural Language Processing-Inspired Binary Code Analysis. arXiv 2018, arXiv:1812.09652. [Google Scholar]
- Kim, D.; Kim, E.; Cha, S.K.; Son, S.; Kim, Y. Revisiting Binary Code Similarity Analysis Using Interpretable Feature Engineering and Lessons Learned. IEEE Trans. Softw. Eng. 2023, 49, 1661–1682. [Google Scholar] [CrossRef]
- Indyk, P.; Motwani, R. Approximate Nearest Neighbors: Towards Removing the Curse of Dimensionality. In Proceedings of the Thirtieth Annual ACM Symposium on Theory of Computing, Dallas, TX, USA, 24–26 May 1998; Association for Computing Machinery: New York, NY, USA, 1998; pp. 604–613. [Google Scholar]
- Manku, G.S.; Jain, A.; Sarma, A.D. Detecting Near-Duplicates for Web Crawling. In Proceedings of the the Web Conference, Banff, AB, Canada, 8–12 May 2007. [Google Scholar]
- Massarelli, L.; Luna, G.A.D.; Petroni, F.; Querzoni, L.; Baldoni, R. Investigating Graph Embedding Neural Networks with Unsupervised Features Extraction for Binary Analysis. In Proceedings of the 2019 Workshop on Binary Analysis Research, San Diego, CA, USA, 21–24 February 2016. [Google Scholar]
- Massarelli, L.; Luna, G.A.D.; Petroni, F.; Querzoni, L.; Baldoni, R. SAFE: Self-Attentive Function Embeddings for Binary Similarity. arXiv 2018, arXiv:1811.05296. [Google Scholar]
- Yu, Z.; Zheng, W.; Wang, J.; Tang, Q.; Nie, S.; Wu, S. CodeCMR: Cross-Modal Retrieval For Function-Level Binary Source Code Matching. In Proceedings of the Neural Information Processing Systems, Vancouver, BC, Canada, 6–12 December 2020. [Google Scholar]
- Marcelli, A.; Graziano, M.; Ugarte-Pedrero, X.; Fratantonio, Y.; Mansouri, M.; Balzarotti, D. How Machine Learning Is Solving the Binary Function Similarity Problem. In Proceedings of the 31st USENIX Security Symposium (USENIX Security 22), Boston, MA, USA, 10–12 August 2022; USENIX Association: Boston, MA, USA, 2022; pp. 2099–2116. [Google Scholar]
- Marastoni, N.; Giacobazzi, R.; Dalla Preda, M. A Deep Learning Approach to Program Similarity. In Proceedings of the 1st International Workshop on Machine Learning and Software Engineering in Symbiosis, Montpellier, France, 3 September 2018; Association for Computing Machinery: New York, NY, USA, 2018; pp. 26–35. [Google Scholar]
- David, Y.; Partush, N.; Yahav, E. FirmUp: Precise Static Detection of Common Vulnerabilities in Firmware. In Proceedings of the Twenty-Third International Conference on Architectural Support for Programming Languages and Operating Systems, Williamsburg, VA, USA, 24–28 March 2018; Association for Computing Machinery: New York, NY, USA, 2018; pp. 392–404. [Google Scholar]
- Sun, P.; Garcia, L.; Salles-Loustau, G.; Zonouz, S. Hybrid Firmware Analysis for Known Mobile and IoT Security Vulnerabilities. In Proceedings of the 2020 50th Annual IEEE/IFIP International Conference on Dependable Systems and Networks (DSN), Valencia, Spain, 29 June–2 July 2020; pp. 373–384. [Google Scholar]
- Mikolov, T.; Chen, K.; Corrado, G.S.; Dean, J. Efficient Estimation of Word Representations in Vector Space. In Proceedings of the International Conference on Learning Representations, Scottsdale, AZ, USA, 2–4 May 2013. [Google Scholar]
- Li, Y.; Gu, C.; Dullien, T.; Vinyals, O.; Kohli, P. Graph Matching Networks for Learning the Similarity of Graph Structured Objects. In Proceedings of the International Conference on Machine Learning, Long Beach, CA, USA, 9–15 June 2019. [Google Scholar]
- Chen, T.; Guestrin, C. XGBoost: A Scalable Tree Boosting System. In Proceedings of the 22nd ACM SIGKDD International Conference on Knowledge Discovery and Data Mining, San Francisco, CA, USA, 13–17 August 2016. [Google Scholar]
- GitHub—ReFirmLabs/Binwalk: Firmware Analysis Tool. Available online: https://github.com/ReFirmLabs/binwalk (accessed on 5 August 2023).
Figure 1.
The overall process of the method.
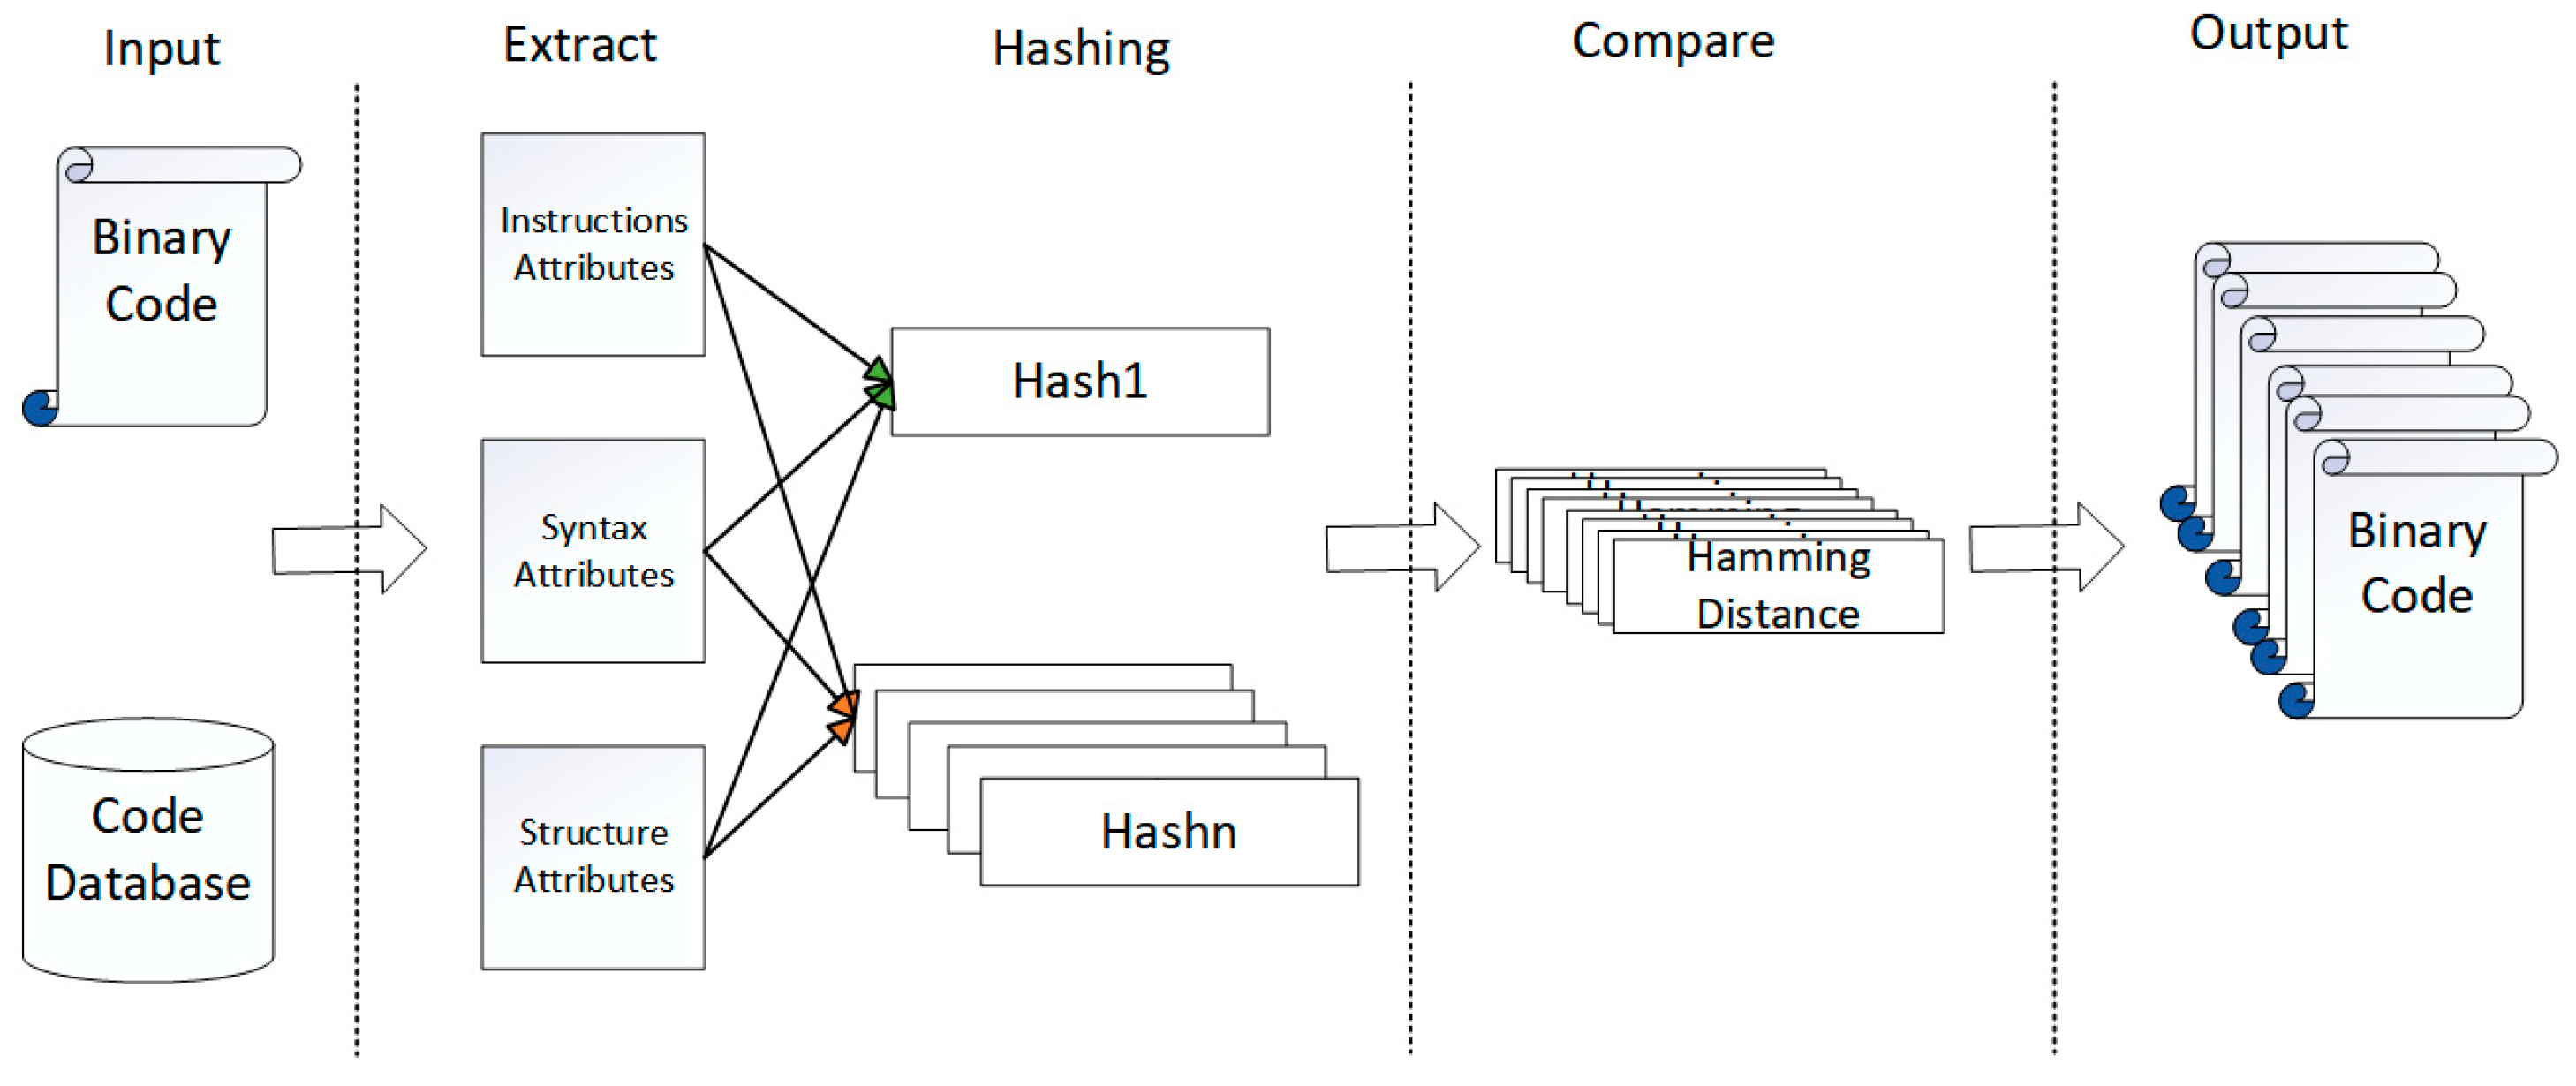
Figure 2.
CFGs under different architectures with the same function. The left figure shows the CFG under an X86 architecture, the right figure is the CFG under an ARM architecture.
Figure 2.
CFGs under different architectures with the same function. The left figure shows the CFG under an X86 architecture, the right figure is the CFG under an ARM architecture.
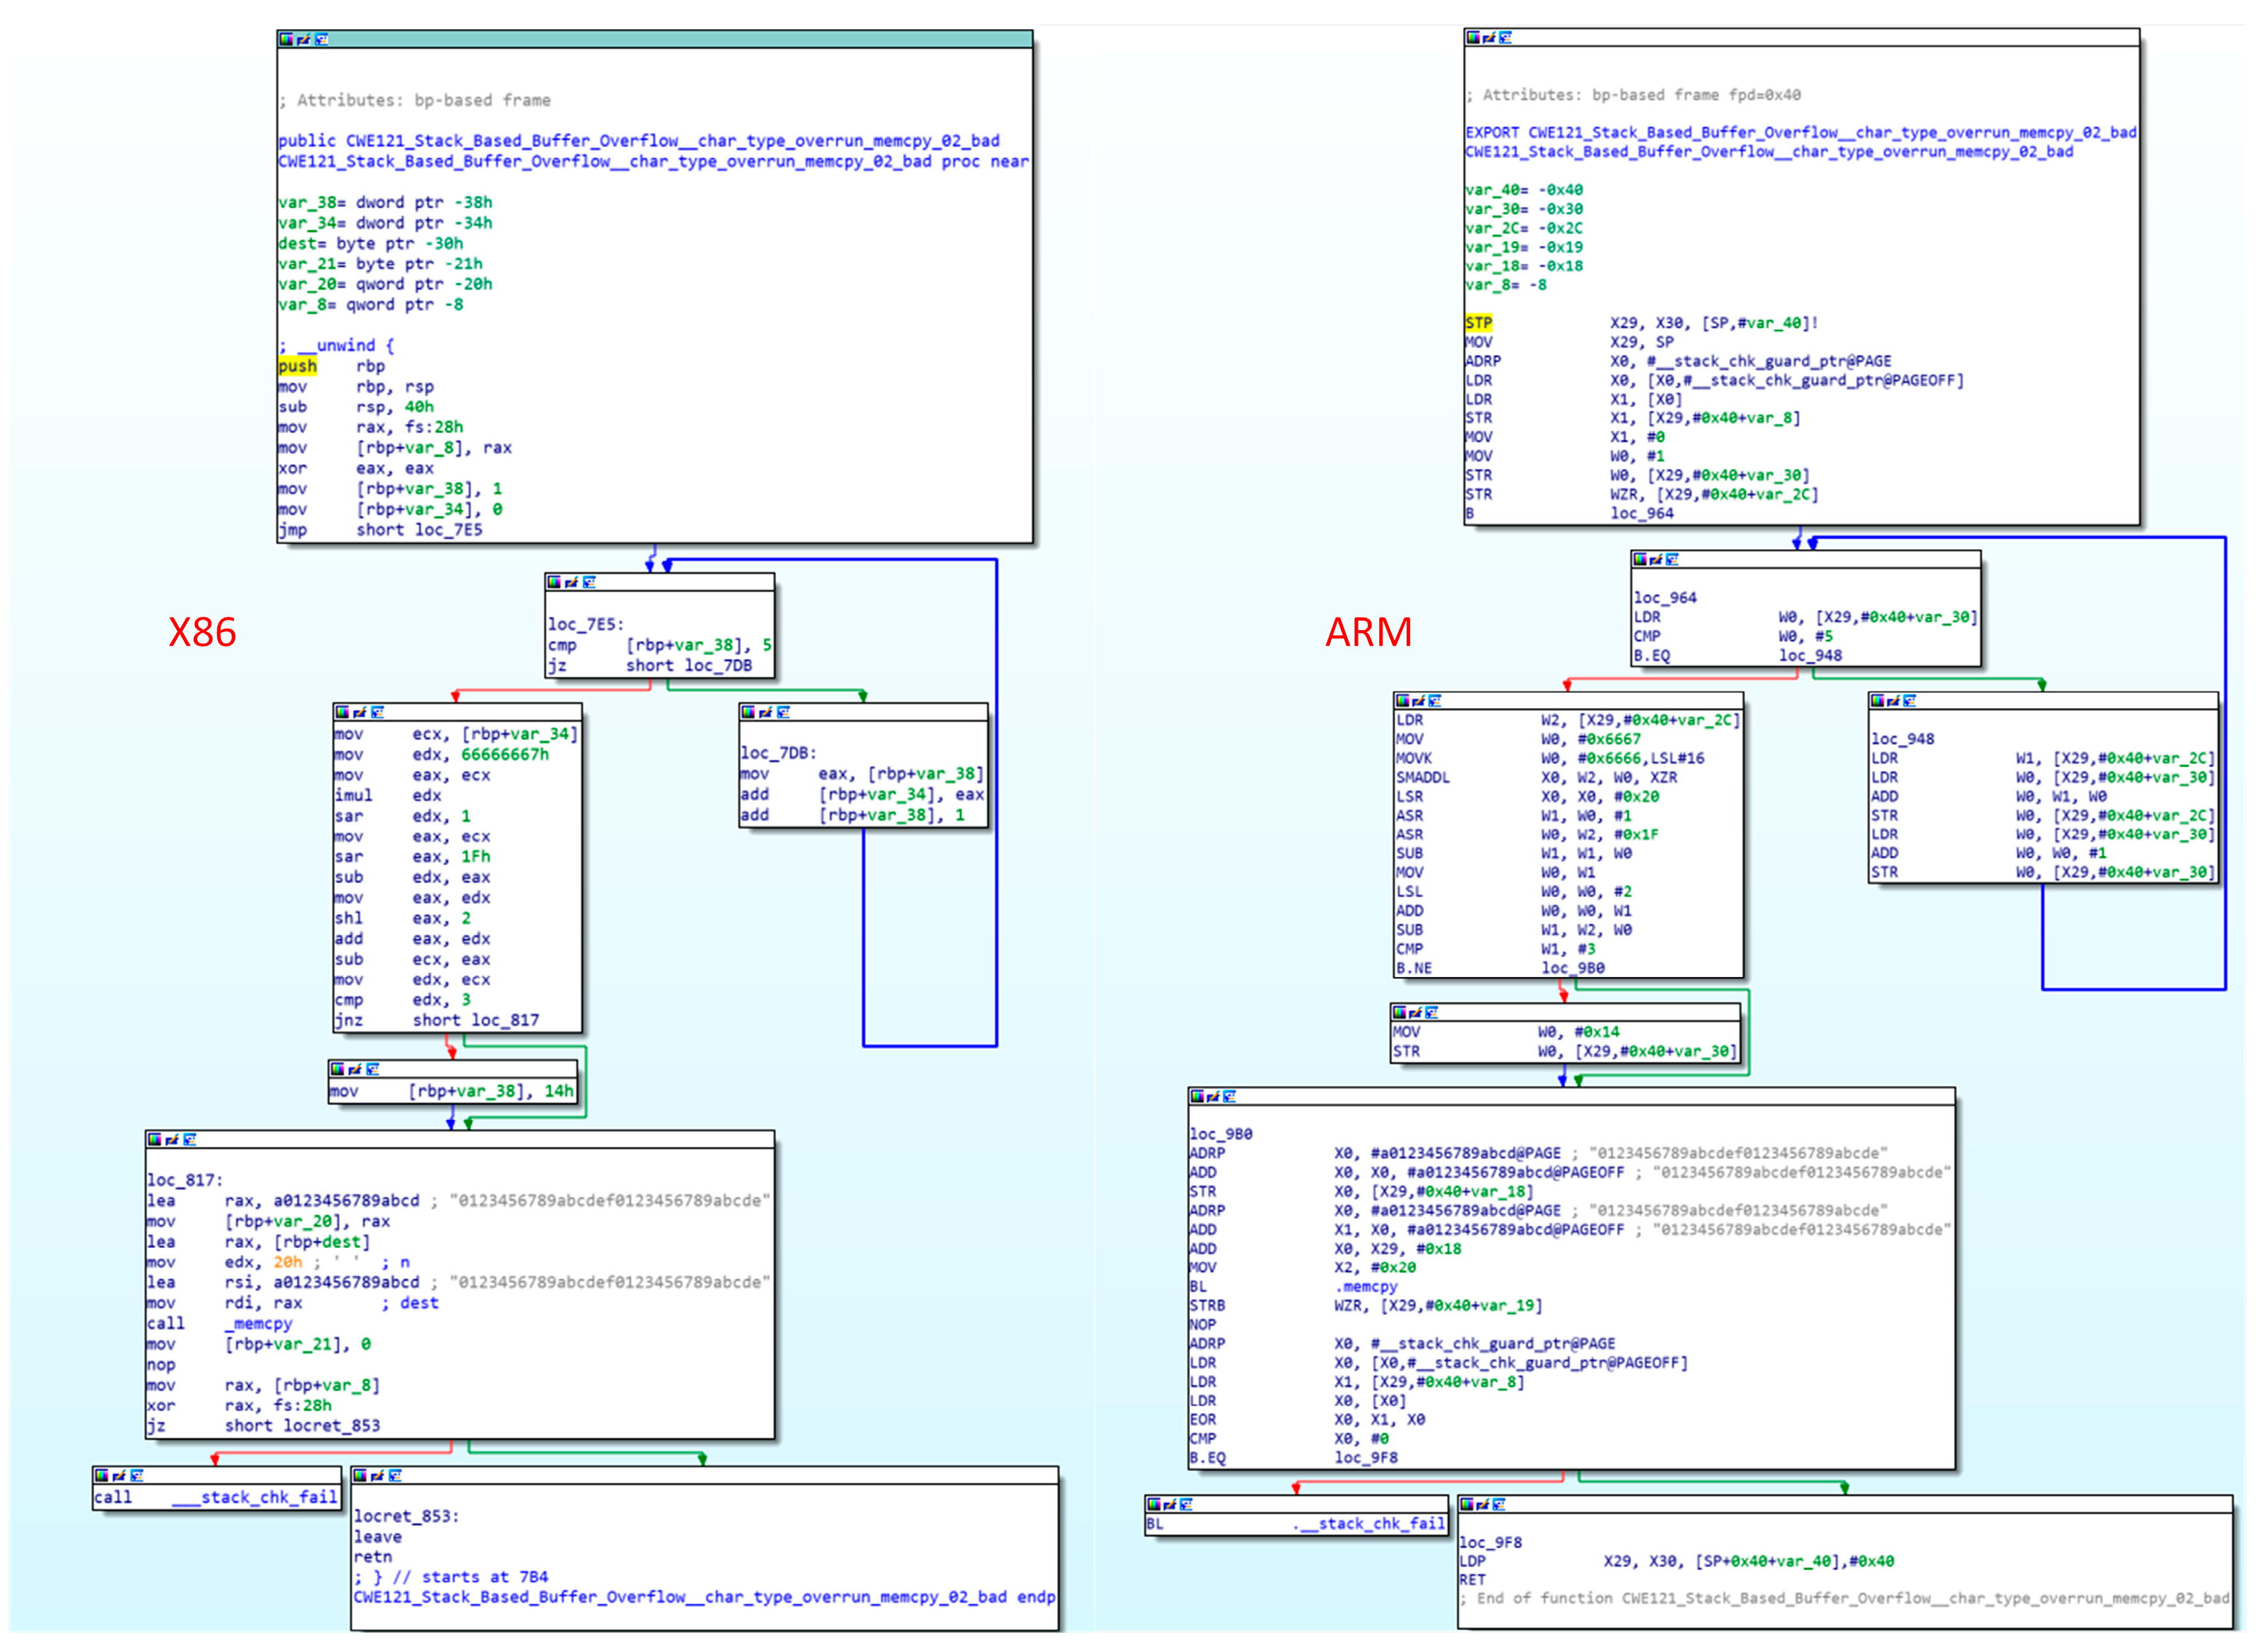
Figure 3.
SimHash generation process.

Figure 4.
Function clustering diagram.

Figure 5.
The clustering of the similar and dissimilar function pairs.

Figure 6.
Trained and untrained recall rates.

Figure 7.
Trained and untrained precision rates.

Figure 8.
Trained and untrained F1-scores.

Figure 9.
Changes in evaluation metrics with different Hamming distances.


Table 1.
Features used in our method.
| Category | Features | Count |
|---|---|---|
| Instruction Attributes | Total number of instructions | 4 |
| Number of arithmetic instructions | ||
| Number of transfer instructions | ||
| Number of logic instructions | ||
| Syntax Attributes | Number of call instructions | 2 |
| String constant | ||
| Structure Attributes | Number of incoming calls | 4 |
| Number of edges in CFG | ||
| Number of basic blocks | ||
| Weisfeiler–Lehman test of isomorphism | ||
| Total | 10 | |
Table 2.
Search efficiency of different methods.
| Method | Time (Functions/Seconds) |
|---|---|
| Gemini | 69 |
| Trex | 734 |
| HEBCS | 3186 |
Table 3.
Evaluation metrics for different methods.
| X86 vs. ARM | ARM vs. MIPS | MIPS vs. X86 | |||||||
|---|---|---|---|---|---|---|---|---|---|
| P | R | F1 | P | R | F1 | P | R | F1 | |
| Gemini | 0.912 | 0.972 | 0.941 | 0.910 | 0.958 | 0.933 | 0.912 | 0.950 | 0.931 |
| Trex | 0.943 | 0.957 | 0.950 | 0.950 | 0.967 | 0.958 | 0.943 | 0.952 | 0.947 |
| HEBCS | 0.928 | 0.949 | 0.938 | 0.939 | 0.936 | 0.958 | 0.947 | 0.945 | 0.945 |
Table 4.
Vulnerability discovery in the real world.
| CVE List | Suspicious Firmware in the Firmware Dataset | Whether There Exists a Real Vulnerability |
|---|---|---|
| CVE-2020-27867 (NETGEAR R6800) | NETGEAR R6080 | Yes |
| NETGEAR R6120 | Yes | |
| NETGEAR R6220 | Yes | |
| NETGEAR R6700V2 | Yes | |
| NETGEAR R7450 | Yes | |
| NETGEAR WNR2020 | Yes | |
| Nighthawk AC2100 | Yes | |
| CVE-2018-16333 (US_AC15V1.0BR_V15.03.05.19_multi_TD01) | Tenda AC7 V15.03.06.44_CN Tenda AC9 V15.03.05.19(6318)_CN | Yes |
| Yes | ||
| Tenda AC10 V15.03.06.23_CN | Yes | |
| Tenda AC15 V15.03.05.19_CN | Yes | |
| Tenda AC18 V15.03.05.19(6318)_CN | Yes | |
| CVE-2021-33514 (NETGEAR GS110TPP_V7.0.1.16) | NETGEAR GC108PP_V1.0.7.2 | Yes |
| NETGEAR GC108PP_V1.0.7.1 | Yes | |
| NETGEAR GS110TPv3_7.0.6.3 | Yes | |
| NETGEAR GS110TUP_1.0.4.3 | Yes | |
| NETGEAR GS710TUP_1.0.4.2 | No | |
| NETGEAR GS710TUP_1.0.4.5 | Yes | |
| NETGEAR GS724TPP_2.0.4.3 | Yes | |
| NETGEAR GS724TPV2_6.0.6.3 | Yes |
Disclaimer/Publisher’s Note: The statements, opinions and data contained in all publications are solely those of the individual author(s) and contributor(s) and not of MDPI and/or the editor(s). MDPI and/or the editor(s) disclaim responsibility for any injury to people or property resulting from any ideas, methods, instructions or products referred to in the content. |
© 2023 by the authors. Licensee MDPI, Basel, Switzerland. This article is an open access article distributed under the terms and conditions of the Creative Commons Attribution (CC BY) license (https://creativecommons.org/licenses/by/4.0/).
Share and Cite
MDPI and ACS Style
Sun, X.; Wei, Q.; Du, J.; Wang, Y. HEBCS: A High-Efficiency Binary Code Search Method. Electronics 2023, 12, 3464. https://doi.org/10.3390/electronics12163464
AMA Style
Sun X, Wei Q, Du J, Wang Y. HEBCS: A High-Efficiency Binary Code Search Method. Electronics. 2023; 12(16):3464. https://doi.org/10.3390/electronics12163464
Chicago/Turabian StyleSun, Xiangjie, Qiang Wei, Jiang Du, and Yisen Wang. 2023. "HEBCS: A High-Efficiency Binary Code Search Method" Electronics 12, no. 16: 3464. https://doi.org/10.3390/electronics12163464
Note that from the first issue of 2016, this journal uses article numbers instead of page numbers. See further details here.