
Color Mura Defect Detection Method Based on Channel Contrast Sensitivity Function Filtering

1
Department of Resources and Environment, University of Electronic Science and Technology of China, Chengdu 611731, China
2
Novel Product R & D Department, Truly Opto-Electronics Co., Ltd., Shanwei 516600, China
*
Author to whom correspondence should be addressed.
Electronics 2023, 12(13), 2965; https://doi.org/10.3390/electronics12132965
Submission received: 1 June 2023
/
Revised: 29 June 2023
/
Accepted: 4 July 2023
/
Published: 5 July 2023
(This article belongs to the Topic Computer Vision and Image Processing)
Abstract
:To address the issue of low detection accuracy caused by low contrast in color Mura defects, this paper proposes a color Mura defect detection method based on channel contrast sensitivity function (CSF) filtering. The RGB image of the captured liquid crystal display (LCD) display is converted to the Lab color space, and the Weber contrast feature maps of the Lab channel images are calculated. Frequency domain filtering is performed using the CSF to obtain visually sensitive Lab feature maps. Color Mura defect detection is achieved by employing adaptive segmentation thresholds based on the fused feature maps of the L channel and ab channels. The color Mura evaluation criterion is utilized to quantitatively assess the defect detection results. Experimental results demonstrate that the proposed method achieves an accuracy rate of 87% in color Mura defect detection, outperforming existing mainstream detection methods.
1. Introduction
Empowered by the 5G information era and continuous breakthroughs in artificial intelligence technology, smartphones have become the most popular consumer electronic product worldwide, serving as the most convenient terminal device. The emergence of new generation flexible and foldable displays, as well as VR and other smart wearable devices, presents new challenges and demands for display technology, which demands technological upgrades in the production of existing displays, using machine vision technology to improve production efficiency and reduce manufacturing costs [1]. In industrial production, automated optical inspection (AOI) equipment is used for display defect detection, where Mura defects exhibit low contrast and don’t have a fixed shape, making it an urgent technological challenge that needs to be addressed [2]. With the widespread use of an LCD display, the demand for Mura defect detection has changed from brightness Mura to color and brightness Mura defect detection.
The representation of color information surpasses the range of brightness information by a significant margin. Consequently, implementing color Mura defect detection using AOI technology presents two key challenges. Firstly, these defects occur sporadically during production, resulting in difficulties in acquiring a substantial volume of defect data and constructing a comprehensive color Mura defect dataset. Secondly, it is difficult to separate the defect features from the gray background level due to the close similarity between the color Mura defect regions and the background.
In the field of machine vision-based defect detection, extensive research has been conducted on Mura defect detection. The methods for detecting Mura defects can be broadly categorized into two main approaches: background reconstruction-based methods [3,4,5,6,7] and deep learning techniques [8,9,10,11,12,13]. Methods based on image background reconstruction are more common. This approach reconstructs the background features of the image and achieves defect detection by separating the background from the defect in the defect image. Currently, there are three main types of background reconstruction methods. The first is frequency domain-based background reconstruction methods, such as those based on discrete cosine transform (DCT) [14]. The second is matrix decomposition-based background reconstruction methods, such as those based on singular value decomposition [15] and PCA [16]. The third is fitting-based background reconstruction methods, such as those based on polynomial fitting [3]. Due to the similarity between Mura defect features and the background and noise, recent research has focused on the challenge of separating defect features from noise after differencing the reconstructed background from the original image. Therefore, segmentation methods need improving. Among these, segmentation methods based on level sets [3,17] have been proposed for accurate defect feature segmentation.
Recently, detection methods based on deep learning have also been gradually developed. For example, Li et al. [8] proposed a mobile screen defect detection model that combines preprocessing operations with U-Net-Faster R-CNN. This model utilizes multi-level feature enhancement modules and clustering algorithms for screen defect detection. Wang et al. [9] proposed a defect detection method based on attention and dual-head mechanisms, using deformable convolution to learn offset in the convolutional attention module, enabling the detection of irregular and small defects. Chen et al. [10] proposed a feature extraction network that combines a residual network with an efficient channel attention mechanism to achieve efficient defect segmentation. Mao et al. [11] proposed an attention relation network with feature extraction and feature measurement modules, applying attention mechanisms to metric learning to directly measure the distance between features for defect detection. Chang et al. [12] proposed a convolutional neural network-based multi-classification model for micro defects in TFT-LCD, enabling the classification of defective pixels on the display panel. Chen et al. [13] improved YOLOv4 [18] by adding spatial pyramid pooling modules and squeeze-and-excitation modules, increasing the network’s receptive field and improving defect detection accuracy. Lin et al. [19] proposed using a deep channel attention classification network as a feature extractor, combined with the adversarial training algorithm of convolutional neural networks, to achieve Mura defect detection under a few-shot scenario. Defect detection methods for displays based on deep learning need to overcome the challenge of limited samples, as a small number of samples can lead to overfitting and hinder practical applications.
This article focuses on the analysis of multi-channel features for color Mura defects in displays, proposing a new method for color Mura defect detection that combines color space separation and filtering based on the contrast sensitivity function (CSF) of the human eye. This method aims to improve the accuracy of detecting color Mura defects with low contrast. The main contributions of this article are as follows:
- (1)
- A new color Mura defect detection method combining color space separation and human eye CSF filtering is proposed, which can effectively improve the accuracy of color Mura defect detection;
- (2)
- The color Mura defects are separated from the background by color space channel separation. The human eye CSF filters the color space spectrum to suppress the influence of noise on Mura defects;
- (3)
- The color defect detection evaluation criteria are established, and the quantitative evaluation method of color Mura defect detection is provided.
The organization of this article is as follows: Section 2 presents the related work; Section 3 describes the proposed color Mura defect detection method based on channel contrast sensitivity function filtering; Section 4 discusses the experimental results; Section 5 concludes the content of this paper.
2. Related Works
In recent years, TFT-LCD display defect detection technology has rapidly developed, focusing on Mura defect detection methods. Ngo et al. [4] pointed out that the effectiveness of background reconstruction methods is correlated with the defect area. For small defect areas such as point defects, the background reconstruction method based on polynomial fitting performs better. However, for larger defect areas such as non-uniform block defects, the background reconstruction method based on discrete cosine transform is more effective. To accommodate the differences in defect morphology, they optimized the algorithm by combining and parallel implementing both methods. Park et al. [20] improved the background reconstruction method based on discrete cosine transform to achieve more accurate defect detection results. They applied discrete wavelet transform to the filtered background image and used a region-growing method to generate the defect image. Finally, the inverse transform was performed to obtain the detected results of the target defects. Chen et al. [21] proposed the application of discrete cosine transform to locate the background and reconstruct a defect-free background for sample images. They also utilized a low-pass filtering method to remove unnecessary noise from the background.
At present, there are few studies on color Mura defect detection. Takagi et al. [22] applied CSF filtering in the XYZ color space to color Mura defects and used subjective evaluation metrics for defect grading. However, their method did not normalize the CSF filtering function, rendering the final evaluation metrics unusable. Lee et al. [23] proposed a background reconstruction method in the XYZ to Lab color space for Mura defect detection. However, their method utilized absolute just noticeable difference (JND) for defect segmentation, resulting in relatively low defect detection accuracy. The method proposed by [24], which utilizes JND evaluation, mainly employs the SSO (similarity-based saliency optimization) approach for JND computation. However, such methods require a stable reference image, which leads to unstable detection accuracy.
3. Methodology
3.1. Algorithm Architecture
As shown in Figure 1, this paper proposes a color Mura defect detection method based on channel CSF filtering.
First, the input image is converted to the Lab color space to obtain the luminance channel, the red–green channel, and the blue–yellow channel. Weber contrast is calculated for the L, a, and b channels to obtain contrast maps. The L channel undergoes luminance CSF filtering to obtain the luminance JND map, which is then segmented to obtain the luminance Mura defect feature map. The contrast maps of the a and b channels are filtered using color CSF, resulting in color JND maps. These maps are fused to obtain the color Mura defect feature map. An adaptive thresholding method is applied to obtain the color Mura defect detection result. Finally, the luminance Mura and color Mura segmentation results are combined using logical OR operation. The Lab-SEMI method calculates the Mura defect level, obtaining the final Mura detection result.
3.2. Color Mura Defect Channel Feature Separation
The color Mura image in RGB space is analyzed as shown in Figure 2.
Conventional Mura detection methods often convert RGB images to grayscale for processing. As shown in Figure 2, the single-channel images of Mura defects don’t preserve their characteristics in the color image. Moreover, when the color image is separated into single-channel images, the human eye can no longer perceive the presence of Mura defects. Therefore, directly converting RGB images to single-channel or grayscale images would result in a loss of Mura defect features, making it more difficult to separate the background from the defect.
Therefore, this paper applies the Lab color space to separate the color and brightness features. The RGB to lab conversion formulas are shown in Equations (1)–(5).
where L is the luminance channel, a is the red–green color channel and b is the blue–yellow color channel, and the result is shown in Figure 3.
As shown in Figure 3, Mura defects are separated into luminance features and color features, where it can be observed that Mura defects can be classified into luminance Mura and color Mura. When detecting color Mura, image processing without channel separation can’t represent Mura defect features effectively under grayscale images.
3.3. Contrast Sensitive Function Filtering
Constructing an accurate contrast sensitivity function is highly complex, involving various factors such as orientation, luminance, image size, and viewing distance. Therefore, based on the specific requirements of practical applications, this paper focuses on modeling contrast sensitivity functions for specific sensitivities. The main focus is on the luminance and color characteristics of the contrast sensitivity function.
Weber contrast indicates that the dynamic range of stimuli a person can perceive under the same stimulus is proportional to the standard stimulus intensity [24]. Weber contrast is defined in Equation (6).
where L(x, y) is the brightness of the image,(x, y) is the background brightness of the image, and (x, y) is the contrast of the image.
To effectively describe the contrast features of the image, Weber contrast is used to calculate the luminance contrast feature map and the color contrast feature map separately. The difficulty in detecting Mura defects is that the results are consistent with human perception. The introduction of the SSO method has provided a way to quantify Mura defects based on human visual perception. Therefore, in this paper, JND is also used as a key factor in Mura defect detection. The computation of JND mainly relies on the CSF. Studies have shown that the luminance CSF can be approximated as a band-pass filter, while the color CSF is divided into two channels, red/green and blue/yellow, and each is processed separately. The color CSF can be approximated as a low-pass filter. In this paper, the luminance CSF and color CSF parameters proposed in the ISO15739 standard [25] are used to filter the contrast maps, achieving background noise suppression and contrast enhancement. The formulae and parameters for the luminance and color of the CSF function are shown in Equations (7)–(9).
where is the brightness filtering function, is the red and green channel filter function, and csfb (f) is the blue-yellow channel filter function.
3.4. Mura Defect Feature Fusion and Segmentation
The unified segmentation of the image JND feature map becomes more important after the color and luminance features are processed separately using a multi-channel mechanism. Through experimental analysis, the complexity of color features exceeds the variation range of luminance features. To segment the color feature map effectively, this paper performs weighted fusion processing for color features to achieve a unified feature evaluation of color features, and the weighted fusion formula is shown in Equation (10).
where Scolor is the color JND feature fusion map, the and denote respectively a, and b channel JND feature map fusion weighting coefficients. The weighting coefficients need to be decided according to the background noise of the acquired image, and the average weighting process is used in this paper.
Finally, the separation of the target and background can be achieved using adaptive thresholding, and the segmentation threshold is shown in Equation (11).
The th is the segmentation threshold, K is the parameter, μ is the mean value of the JND feature map, δ is the standard deviation of the JND feature map, and JND(i,j) is the calculated JND feature map. The segmentation thresholds of the L channel JND feature map and the color JND feature fusion map are calculated respectively to achieve the segmentation of Mura defects.
3.5. Mura Determination Criteria
As an application extension of the performance evaluation of display color defect detection, this paper expands the study of quantitative evaluation of color Mura defects in the actual display color detection performance. Based on the research results of Semiconductor Equipment and Materials International (SEMI) regarding the quantitative evaluation problem of Mura defects, a uniform evaluation of display quality by manufacturers has been standardized [26]. The calculation equations are shown in Equations (14) and (15).
where Cjnd denotes the minimum perceptible difference of Mura defects, which is directly related to the area of Mura defects. Cx represents the contrast characteristics of the Mura defect.
However, in actual production, the existing Mura defects have been extended from luminance defects to color Mura defects, so directly using these criteria to evaluate color Mura defects will be detected as no defects. In this paper, SEMI is extended to Lab-SEMI to realize the evaluation of color Mura. The calculation equation is shown in Equation (16).
4. Experimental Results
4.1. Experimental Setup
Typical Mura defects are shown in Figure 4 below. In this paper, a total of 2800 images from the proposed Mura defect dataset Mura_8 are used for algorithm performance testing. All images are annotated with graphs, and all experiments are conducted on the same computer with Intel Core i7-7700 [email protected], 16 GB RAM, and Windows 7 64-bit operating system.
As shown in Figure 4, the images with obvious contrast are selected for display in this paper, and subjective observation can be observed that the size of the defect and the defect color characteristics are the main reasons affecting human eye perception.
In this paper, the location, area, and color characteristics of Mura defects are used as independent variables. The area of Mura defects is set to 4 levels, and the defect areas are scale 1 (15.17 mm2), scale 2 (75.86 mm2), scale 3 (151.72 mm2) and scale 4 (758.63 mm2). Mura defect colors were used as the base according to red, green, blue, and yellow, and Mura defects were constructed by changing the contrast and saturation, etc. A total of 2800 Mura defect samples were established, as shown in Table 1.
In this paper, TDR and FDR are used for defect performance evaluation. When the defect area is large, and the number of defects is single, true detect rate (TDR) and false detect rate (FDR) are commonly used in display defects to indicate the defect detection accuracy, as shown in Equation (17). TDR is defined as the sum of correctly detected pixels in the test image divided by the sum of true defect pixels. FDR is the ratio of incorrectly detected pixels to total detected pixels [3], as shown in Equation (18).
where S is the threshold split binary map, and GT is the ground truth map.
4.2. Algorithm Performance Analysis
4.2.1. Color Feature Analysis
The existing RGB color space decomposition has a variety of decomposition methods. This paper compares the commonly used color decomposition methods in Mura defects and uses the normalized scanpath saliency (NSS) [27] evaluation criteria to compare and analyze the color decomposition methods. The comparisons are RGB, HSV, Lab, and YUV.
The results of Figure 5 are obtained after an NSS evaluation of the decomposed color channels. It can be seen from Figure 5 that Lab space has the highest NSS results at different scales, and the smaller the defect size, the better the significance of Lab space. So Lab space is chosen as the color decomposition method in this paper.
As shown in Figure 6, Mura defects are almost invisible in RGB space and YUV space, while the defect features do not differ much from the background in HSV space. Luminance and color features can be separated effectively in Lab color space, and effective enhancement of Mura features can be achieved, so Lab space is used as the luminance and color feature decomposition method in this paper.
4.2.2. Analysis of Evaluation Indicators
An effective defect determination method can improve the defect detection accuracy, especially in the case of Mura defects with weak contrast and human eye perception. Therefore, the following experiments are designed to test the Mura defect determination criterion proposed in this paper. In this paper, four scales of brightness Mura defects and four scales of color Mura defects are used to determine the defects. The evaluation results using SEMI and SEMI-Lab are shown in Figure 7.
As shown in Figure 7a, the judgment criteria proposed in this paper are more distinguishable than SEMI. In Figure 7b, the trends of the two judgment methods are consistent for the luminance Mura evaluation results. Therefore, the original Mura judgment criterion can only be evaluated for luminance Mura, but it can’t be evaluated for color Mura. It can be seen that with the scale change, Lab-SEMI evaluation criteria can effectively reflect the area change of Mura defects. Therefore, the evaluation criteria proposed in this paper are effective for color Mura defect detection.
4.2.3. Comparison of Algorithm Detection Effect
The detection results of the algorithm in this paper are shown below, where the DCT-based background reconstruction method is compared separately [14] to the polynomial fitting-based background reconstruction method [20].
As shown in Figure 8, the polynomial fitting method is nearly unable to detect blue–yellow Mura defects, and its detection results can only detect the noise in the image background. The DCT-based method can detect part of the Mura defects, but its detection results often contain a large amount of background noise. The method proposed in this paper not only detects blue–yellow Mura defects but also has a better segmentation effect and background noise suppression ability.
Figure 9 shows the detection results of different methods under red and green Mura defects. The polynomial fitting method still does not detect Mura defects, while the DCT-based background reconstruction method is unable to detect weak yellow Mura defects and has poor background noise suppression, but it has some ability to detect more obvious defects. The method proposed in this paper can effectively detect and accurately segment the target and has better noise suppression.
Figure 10 compares the detection capability of luminance Mura defects. It can be seen that all three methods can detect the luminance Mura defects. Still, the polynomial fitting-based method and the DCT-based background reconstruction method have poorer suppression of background noise, and the method proposed in this paper detects Mura defects more completely.
The comprehensive evaluation of the algorithm is shown in Table 2. The method proposed in this paper is better than the other two methods. The two criteria of the polynomial fitting method are lower for color Mura detection. The DCT-based method can detect part of the Mura defects. However, affected by the changes in the defects themselves, it can’t completely segment the defects, and the suppression of noise is not good. However, the method proposed in this paper can extract the defects completely and separate the noise well.
5. Conclusions
In this paper, we propose a color Mura defect detection method based on channel contrast-sensitive function filtering. Aiming at the detection problem of the low contrast of color Mura defects, the detection of Mura defects under human visual perception is realized by using color channel separation and CSF function filtering. Aiming at the lack of evaluation criteria for color Mura defects, Lab-SMEI quantitative evaluation method is proposed to realize the quantitative criteria parameter evaluation of color Mura defects. The experimental results show that the proposed method can detect the color Mura defects with an accuracy of more than 87%. It can detect the color Mura defects in line with the human eye perception stably and realize the detection of brightness Mura defects and color Mura defects, which shows the effectiveness and generalization of the proposed algorithm. It is difficult to implement the CSF filtering method in practical engineering. Actual industrial production deployment and testing will be required in future work.
Author Contributions
Formal analysis, W.X., Z.W., and H.W.; investigation, W.X. and H.C.; methodology, Z.W.; software, Z.W.; validation, W.X., H.C., and H.W.; resources, Z.W.; writing—original draft preparation, Z.W.; writing—review and editing, W.X., H.C., and Z.W.; visualization, W.X.; supervision, H.C.; project administration, H.C. and Z.W. All authors have read and agreed to the published version of the manuscript.
Funding
This paper is supported by the “Yang Fan” major project in Guangdong Province, China, No. [2020]05.
Data Availability Statement
Not applicable.
Conflicts of Interest
The authors declare no conflict of interest.
References
- Abd, M.; Mousavi, A. A review and analysis of automatic optical inspection and quality monitoring methods in electronics industry. IEEE Access 2020, 8, 183192–183271. [Google Scholar]
- Ming, W.; Shen, F.; Li, X.; Zhang, Z.; Du, J.; Chen, Z.; Cao, Y. A comprehensive review of defect detection in 3C glass components. Measurement 2020, 158, 107722. [Google Scholar] [CrossRef]
- Yang, H.; Song, K.; Mei, S.; Yin, Z. An accurate Mura defect vision inspection method using outlier-prejudging-based image background construction and region-gradient-based level set. IEEE Trans. Autom. Sci. Eng. 2018, 15, 1704–1721. [Google Scholar] [CrossRef]
- Ngo, C.; Park, Y.J.; Jung, J.; Hassan, R.U.; Seok, J. A new algorithm on the automatic TFT-LCD Mura defects inspection based on an effective background reconstruction. J. Soc. Inf. Disp. 2017, 25, 737–752. [Google Scholar] [CrossRef]
- Ma, Z.; Gong, J. An automatic detection method of Mura defects for liquid crystal display. In Proceedings of the 2019 Chinese Control Conference (CCC), Guangzhou, China, 27–30 July 2019. [Google Scholar]
- Sun, Y.; Li, X.; Xiao, J. A cascaded Mura defect detection method based on mean shift and level set algorithm for active-matrix OLED display panel. J. Soc. Inf. Disp. 2019, 27, 13–20. [Google Scholar] [CrossRef] [Green Version]
- Sun, Y.; Xiao, J. A Region-Scalable Fitting Model Algorithm Combining Gray Level Difference of Sub-image for AMOLED Defect Detection. In Proceedings of the 2018 IEEE International Conference on Computer and Communication Engineering Technology (CCET), Beijing, China, 18–20 August 2018. [Google Scholar]
- Li, W.; Chen, Z.; Zhang, X.; Zha, Y. PU-Faster R-CNN Based Defect Detection Model for Mobile Phone Screen. Comput. Meas. Control 2023, 11, 9632. [Google Scholar]
- Wang, L.; Huang, X.; Zheng, Z. Surface defect detection method for electronic panels based on attention mechanism and dual detection heads. PLoS ONE 2023, 18, e0280363. [Google Scholar] [CrossRef]
- Chen, M.; Chen, S.; Wang, S.; Cui, Y.; Chen, P. Accurate segmentation of small targets for LCD defects using deep convolutional neural networks. J. Soc. Inf. Disp. 2023, 31, 13–25. [Google Scholar] [CrossRef]
- Mao, J.; Xu, G.; He, L.; Luo, J. Attention-relation network for mobile phone screen defect classification via a few samples. Digit. Commun. Netw. 2023. [Google Scholar] [CrossRef]
- Chang, Y.; Chang, K.; Meng, H.; Chiu, H. A Novel Multicategory Defect Detection Method Based on the Convolutional Neural Network Method for TFT-LCD Panels. Math. Probl. Eng. 2022, 2022, 1–14. [Google Scholar] [CrossRef]
- Chen, M.; Chen, P.; Wang, S.; Cui, Y.; Zhang, Y.; Chen, S. TFT-LCD mura defect visual inspection method in multiple backgrounds. J. Soc. Inf. Disp. 2022, 30, 818–831. [Google Scholar] [CrossRef]
- Jin, S.; Ji, C.; Yan, C.; Xing, J. TFT-LCD mura defect detection using DCT and the dual-γ piecewise exponential transform. Precis. Eng. 2018, 54, 371–378. [Google Scholar] [CrossRef]
- Jian, C.; Wang, H.; Xu, J.; Su, L.; Wang, T. Automatic Surface Defect Detection for OLED Display. Packag. Eng. 2021, 42, 280–287. [Google Scholar]
- Chen, S.; Yang, C. TFT-LCD Mura defects using independent component analysis. J. Adv. Mech. Des. Syst. Manuf. 2009, 3, 115–124. [Google Scholar] [CrossRef] [Green Version]
- Bi, X.; Ding, H. Machine Vision Inspection Method of Mura Defect for TFT-LCD. J. Mech. Eng. 2010, 46, 13–19. [Google Scholar] [CrossRef]
- Bochkovskiy, A.; Wang, C.; Liao, H. Yolov4: Optimal speed and accuracy of object detection. arXiv 2020, arXiv:2004.10934. [Google Scholar]
- Lin, G.; Kong, L.; Liu, T.; Qiu, L.; Chen, X. An antagonistic training algorithm for TFT-LCD module Mura defect detection. Signal Process. Image Commun. 2022, 107, 116791. [Google Scholar] [CrossRef]
- Park, J.; Lee, S. Automatic mura detection for display film using mask filtering in wavelet transform. Ieice Trans. Inf. Syst. 2015, 98, 737–740. [Google Scholar] [CrossRef] [Green Version]
- Chen, L.; Kuo, C. Automatic TFT-LCD Mura defect inspection using discrete cosine transform-based background filtering and ‘just noticeable difference’ quantification strategies. Meas. Sci. Technol. 2007, 19, 015507. [Google Scholar] [CrossRef] [Green Version]
- Takagi, Y.; Asano, T.; Liu, W.; Yao, J. Color uniformity evaluation of electronic displays based on visual sensitivity. In Proceedings of the 2011 17th Korea-Japan Joint Workshop on Frontiers of Computer Vision (FCV), Ulsan, Republic of Korea, 9–11 February 2011. [Google Scholar]
- Lee, M.; Kim, S.; Kim, K.; Shin, W.; Choe, W.; Kwag, J. P-85: A New Method for Color Mura Quantification. SID Symp. Dig. Tech. Pap. 2017, 48, 1573–1575. [Google Scholar] [CrossRef]
- Zhou, J. Mura Defect of TFT-LCD Detection Method Based on Spatial Standard Observer. Master’s Thesis, Donghua University, Shanghai, China, 22 May 2018. [Google Scholar]
- Wueller, D.; Matsui, A.; Katoh, N. Visual noise revision for ISO 15739. Electron. Imaging 2019, 2019, 315-1–315-7. [Google Scholar] [CrossRef]
- SEMI D31-1102; Definition of Measurement Index (SEMI) for Luminance Mura in FPD Image Quality Inspection. Flat Panel Display. SEMI International Standards: Washington, DC, USA, 2002.
- Bylinskii, Z.; Judd, T.; Oliva, A.; Torralba, A.; Durand, F. What do different evaluation metrics tell us about saliency models? IEEE Trans. Pattern Anal. Mach. Intell. 2018, 41, 740–757. [Google Scholar] [CrossRef] [PubMed] [Green Version]
Figure 1.
Block diagram of color Mura defect detection algorithm.

Figure 2.
Color Mura defect image in RGB space. (a) The original image; (b) The R channel image; (c) The G channel image; (d) The B channel image.
Figure 2.
Color Mura defect image in RGB space. (a) The original image; (b) The R channel image; (c) The G channel image; (d) The B channel image.
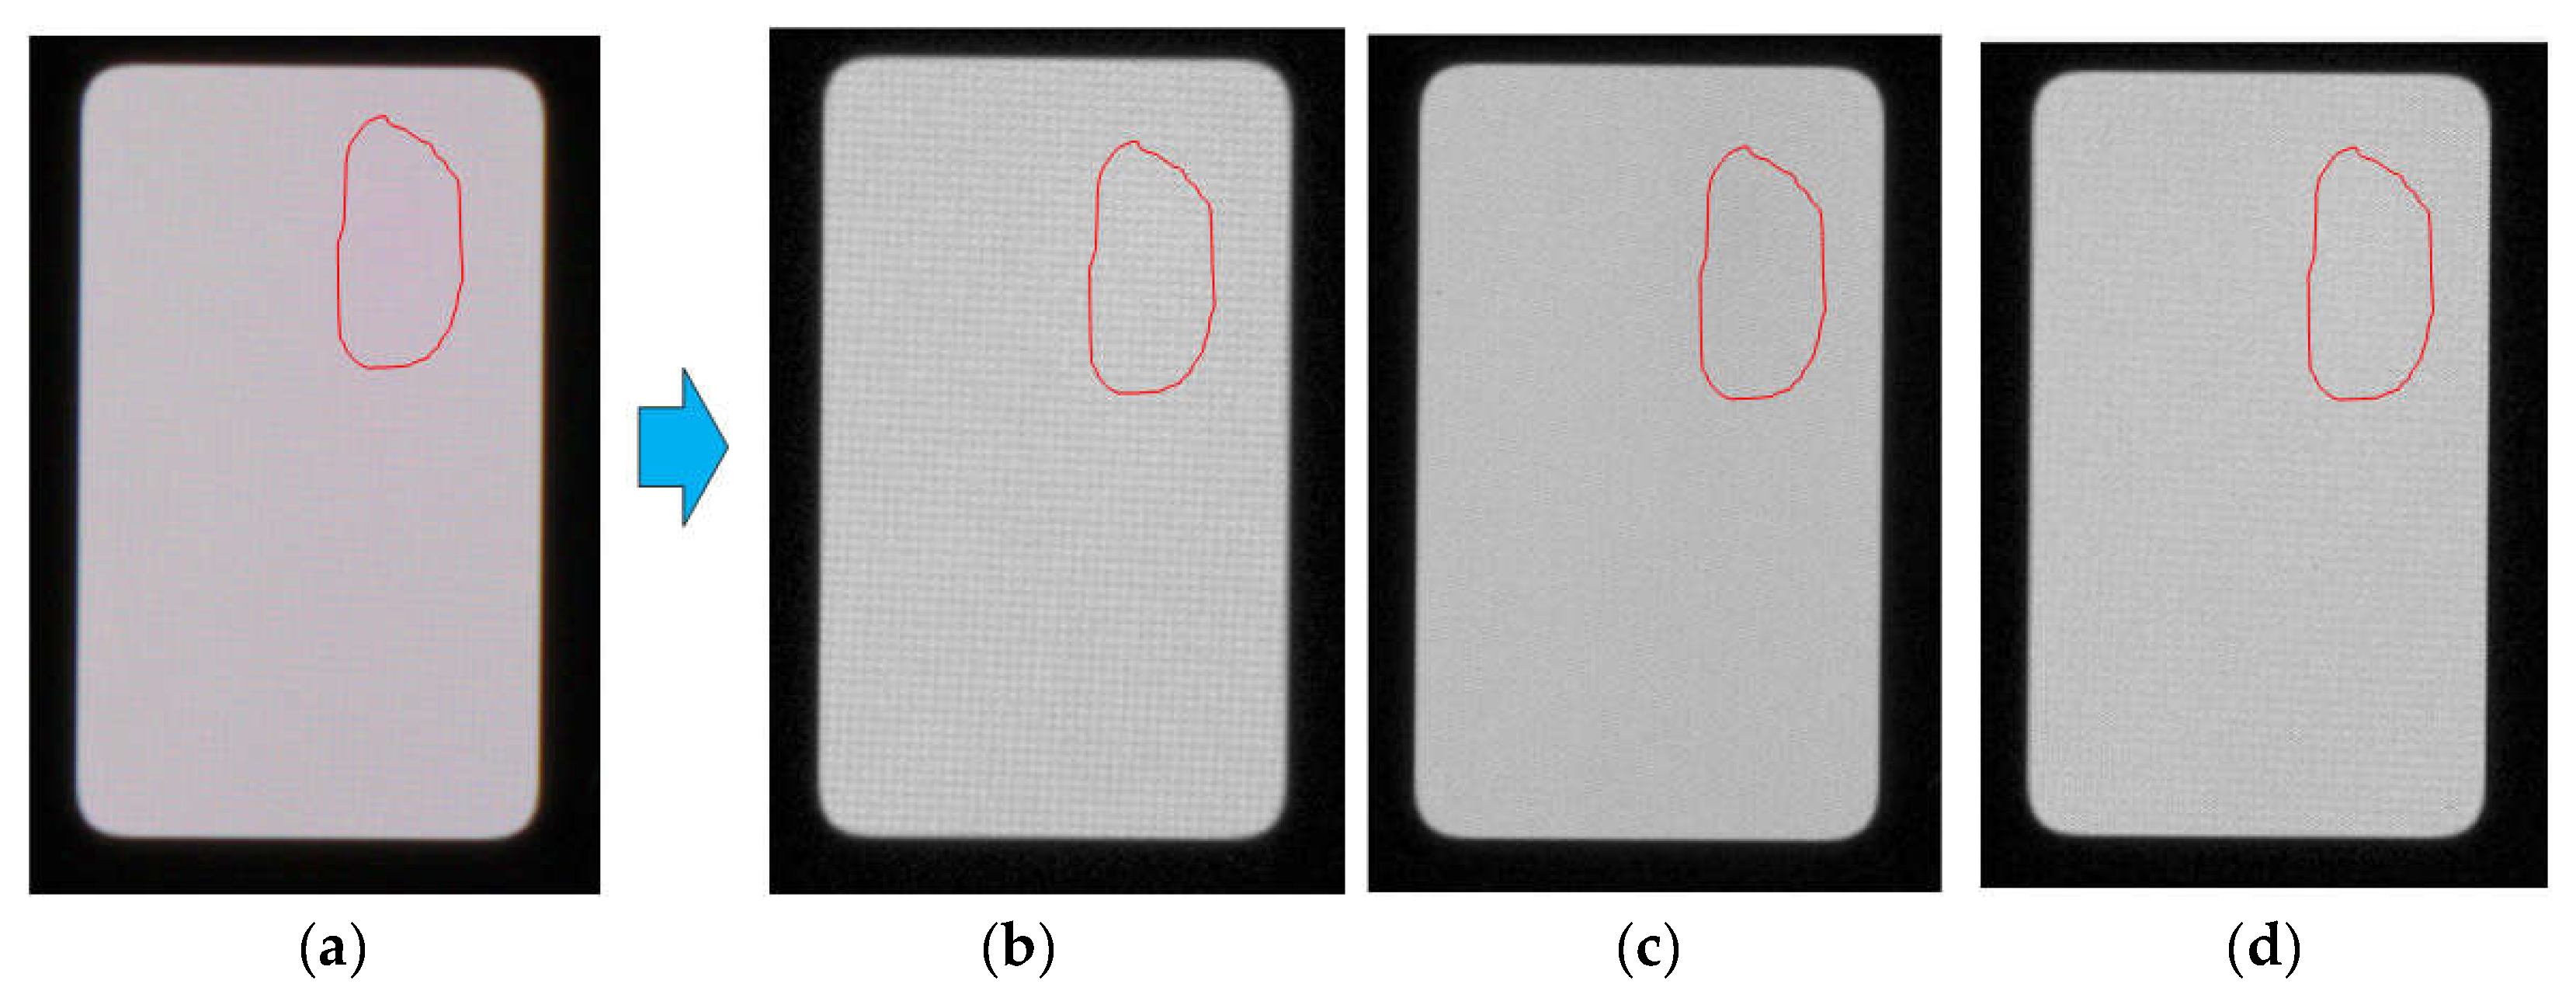
Figure 3.
Color Mura defect images in Lab space. (a) is the original image; (b) is the L channel image, (c) is the channel image; (d) is the b channel image.
Figure 3.
Color Mura defect images in Lab space. (a) is the original image; (b) is the L channel image, (c) is the channel image; (d) is the b channel image.
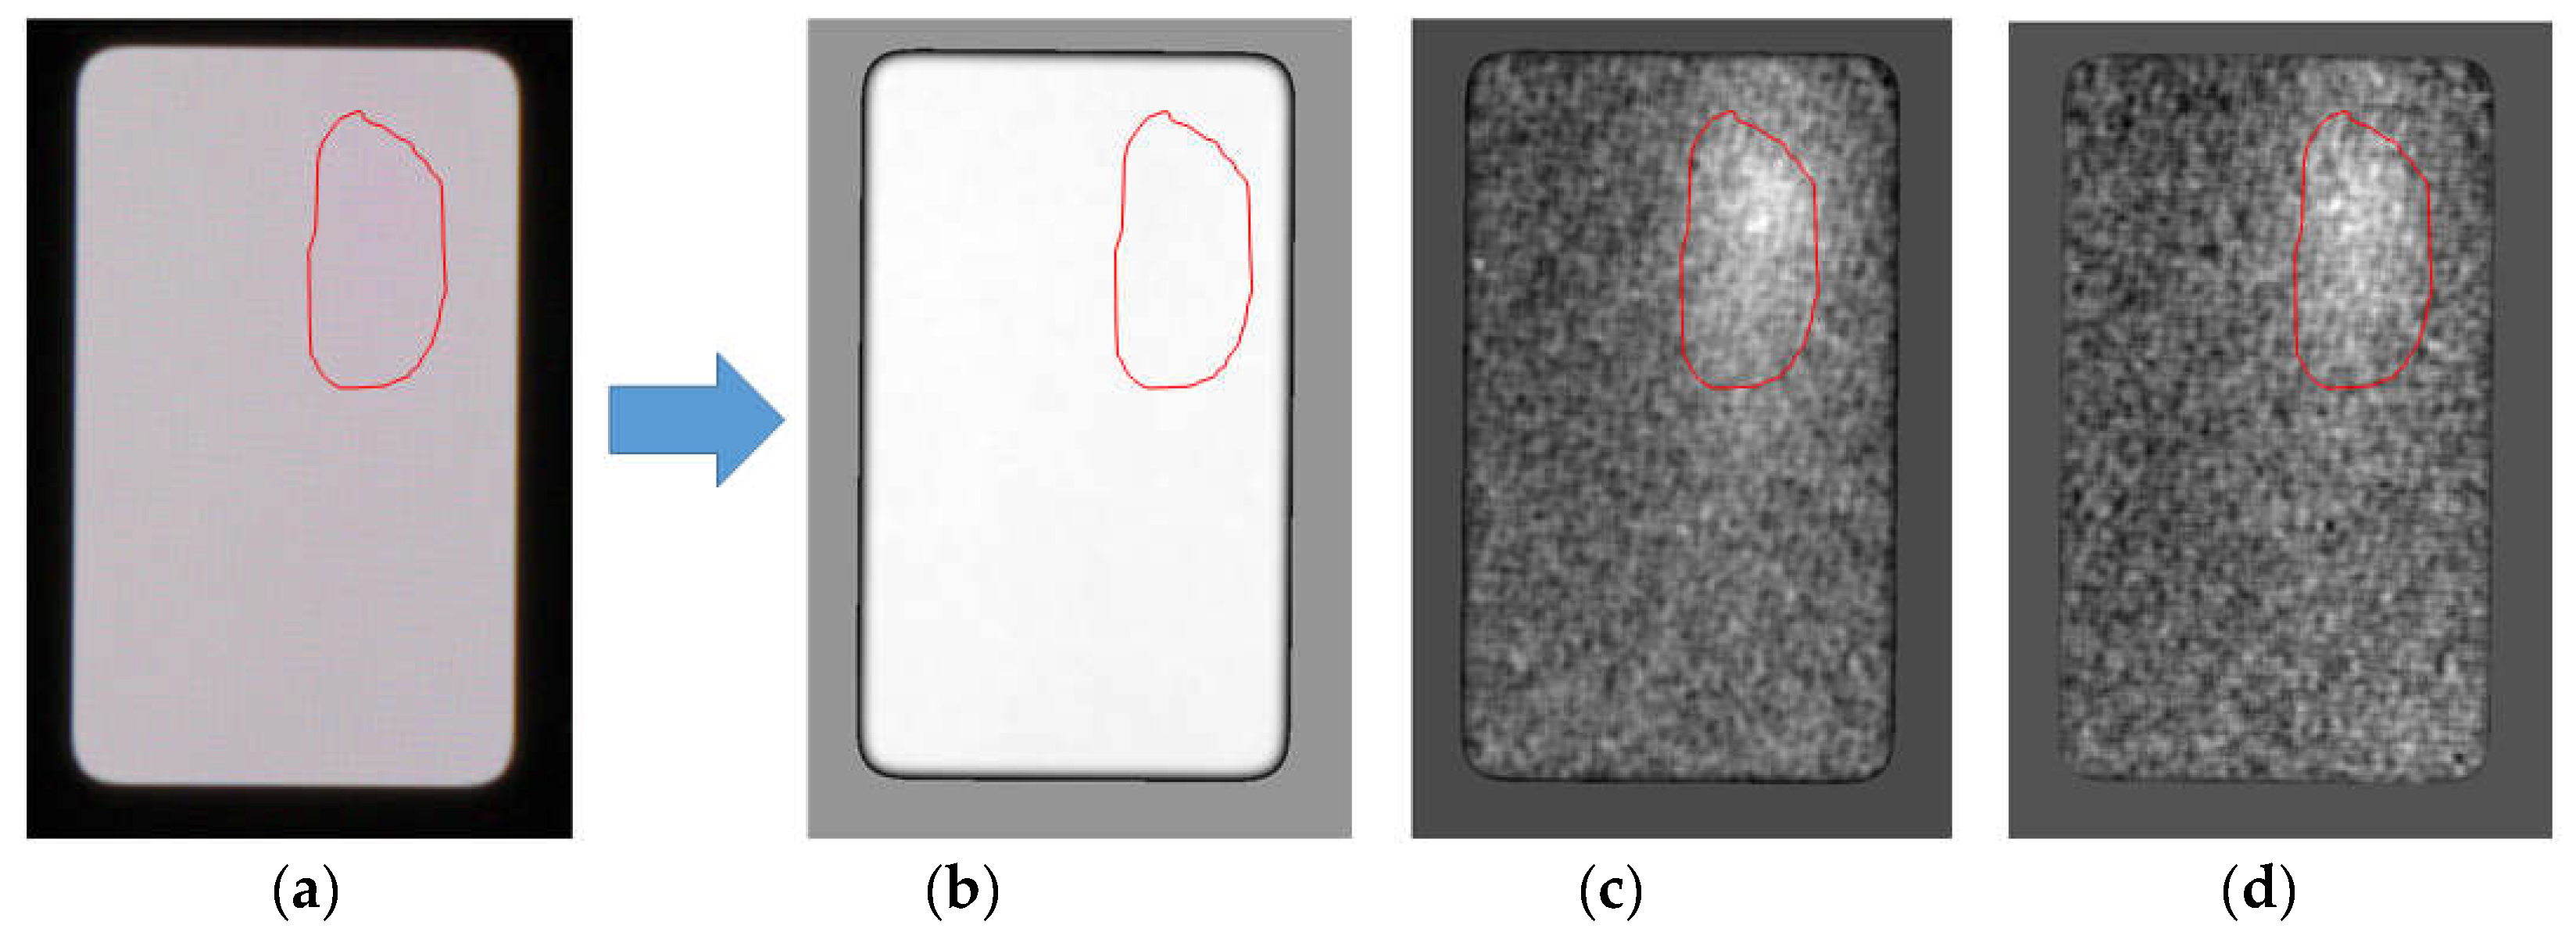
Figure 4.
Schematic diagram of a typical color Mura defect.

Figure 5.
NSS evaluation results of color space decomposition.

Figure 6.
Graphs of the results of different color space decomposition. (a) RGB space; (b) YUV space; (c) HSV space; (d) Lab space.
Figure 6.
Graphs of the results of different color space decomposition. (a) RGB space; (b) YUV space; (c) HSV space; (d) Lab space.
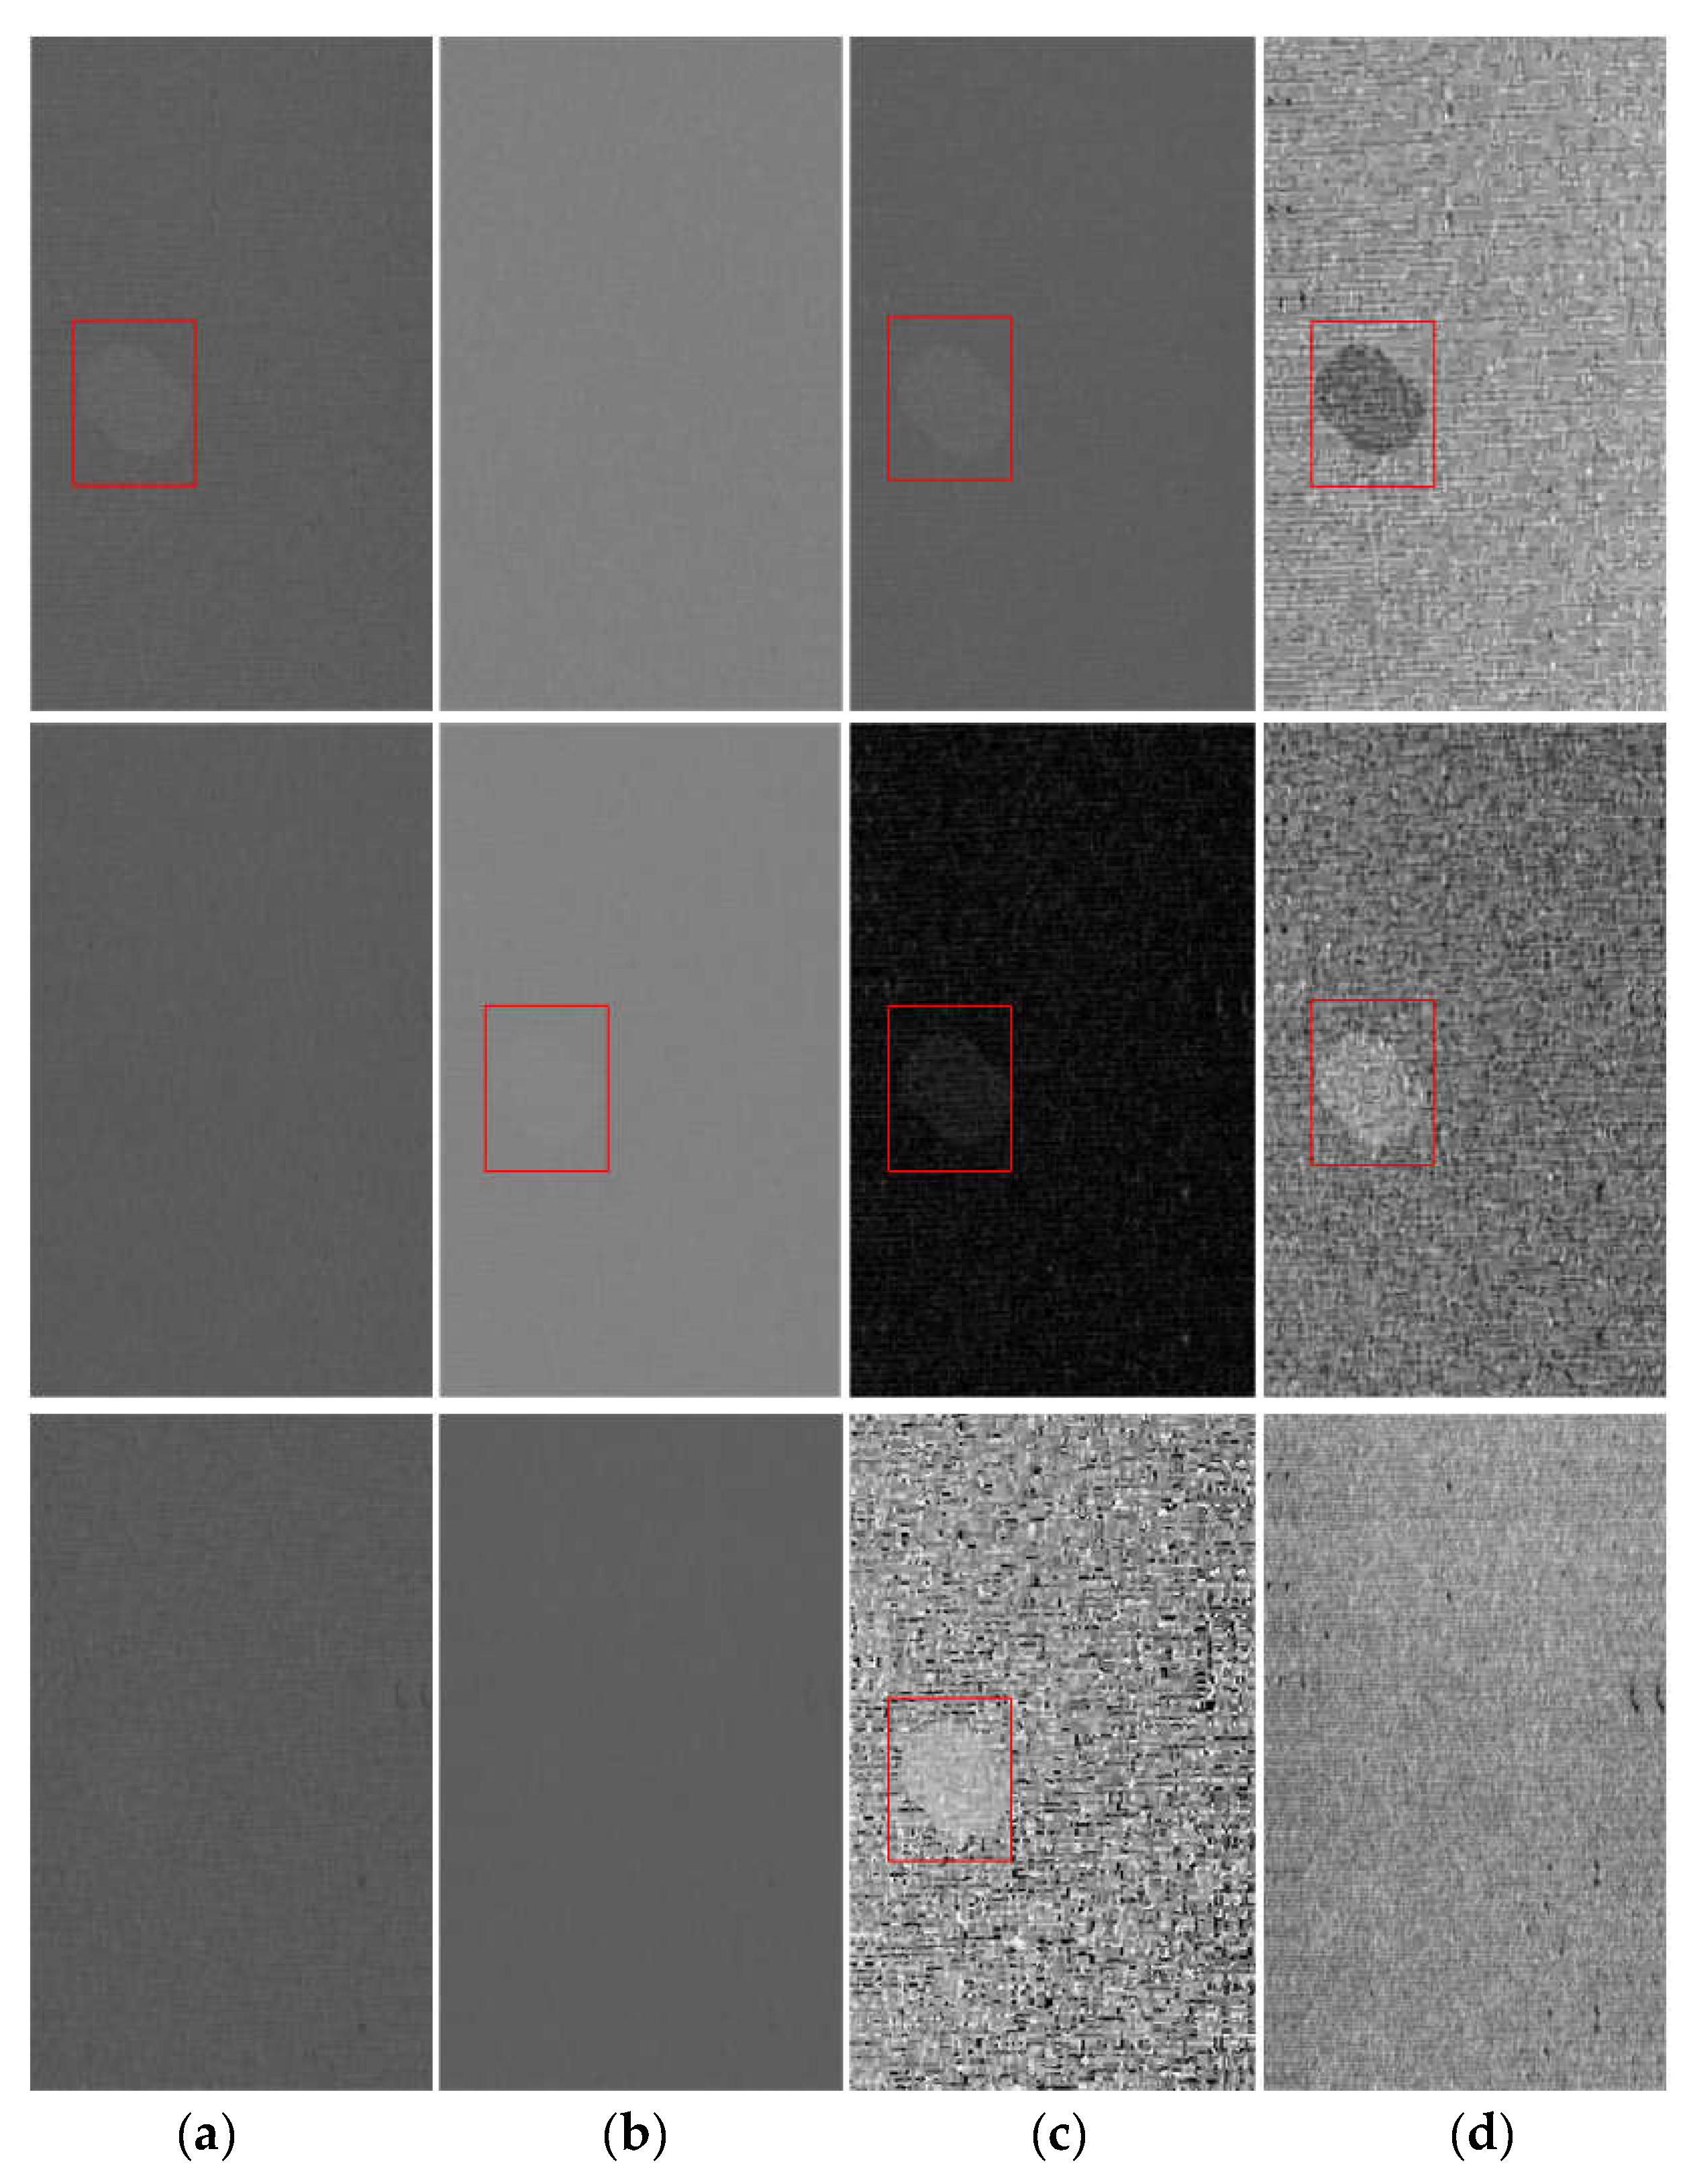
Figure 7.
Comparison of Mura defect evaluation criteria. (a) shows the results of color Mura defect evaluation; (b) shows the results of luminance Mura evaluation.
Figure 7.
Comparison of Mura defect evaluation criteria. (a) shows the results of color Mura defect evaluation; (b) shows the results of luminance Mura evaluation.

Figure 8.
Red and blue Mura defect detection results. (a) is the original image; (b) is the ground truth image; (c) is the polynomial background reconstruction detection result; (d) DCT background reconstruction detection result; (e) detection result of the proposed method in this paper.
Figure 8.
Red and blue Mura defect detection results. (a) is the original image; (b) is the ground truth image; (c) is the polynomial background reconstruction detection result; (d) DCT background reconstruction detection result; (e) detection result of the proposed method in this paper.

Figure 9.
Red-green Mura defect detection results. (a) is the original image; (b) is the ground truth image; (c) is the polynomial background reconstruction detection result; (d) DCT background reconstruction detection result; (e) detection result of the proposed method in this paper.
Figure 9.
Red-green Mura defect detection results. (a) is the original image; (b) is the ground truth image; (c) is the polynomial background reconstruction detection result; (d) DCT background reconstruction detection result; (e) detection result of the proposed method in this paper.

Figure 10.
Brightness Mura defect detection results. (a) is the original image; (b) is the ground truth image; (c) is the polynomial background reconstruction detection result; (d) DCT background reconstruction detection result; (e) detection result of the proposed method in this paper.
Figure 10.
Brightness Mura defect detection results. (a) is the original image; (b) is the ground truth image; (c) is the polynomial background reconstruction detection result; (d) DCT background reconstruction detection result; (e) detection result of the proposed method in this paper.


Table 1.
Table of characteristics of Mura defect dataset.
| Type | Defect Feature | Num | |||
|---|---|---|---|---|---|
| area | scale 1 | scale 2 | scale 3 | scale 4 | 800 |
| color | red | green | blue | yellow | 800 |
| brightness | dark | bright | 400 | ||
| mix | red dark | green dark | blue dark | yellow dark | 400 |
| red bright | green bright | blue bright | yellow bright | 400 | |
Table 2.
Results of algorithm performance evaluation.
| Defect Detection Method | TDR(%) | FDR(%) |
|---|---|---|
| polynomial fitting | 22.48 | 75.27 |
| DCT | 39.58 | 58.12 |
| Ours | 87.39 | 2.47 |
Disclaimer/Publisher’s Note: The statements, opinions and data contained in all publications are solely those of the individual author(s) and contributor(s) and not of MDPI and/or the editor(s). MDPI and/or the editor(s) disclaim responsibility for any injury to people or property resulting from any ideas, methods, instructions or products referred to in the content. |
© 2023 by the authors. Licensee MDPI, Basel, Switzerland. This article is an open access article distributed under the terms and conditions of the Creative Commons Attribution (CC BY) license (https://creativecommons.org/licenses/by/4.0/).
Share and Cite
MDPI and ACS Style
Wang, Z.; Chen, H.; Xie, W.; Wang, H. Color Mura Defect Detection Method Based on Channel Contrast Sensitivity Function Filtering. Electronics 2023, 12, 2965. https://doi.org/10.3390/electronics12132965
AMA Style
Wang Z, Chen H, Xie W, Wang H. Color Mura Defect Detection Method Based on Channel Contrast Sensitivity Function Filtering. Electronics. 2023; 12(13):2965. https://doi.org/10.3390/electronics12132965
Chicago/Turabian StyleWang, Zhixi, Huaixin Chen, Wenqiang Xie, and Haoyu Wang. 2023. "Color Mura Defect Detection Method Based on Channel Contrast Sensitivity Function Filtering" Electronics 12, no. 13: 2965. https://doi.org/10.3390/electronics12132965
Note that from the first issue of 2016, this journal uses article numbers instead of page numbers. See further details here.