
Bidirectional Interleaved DC–DC Converter for Supercapacitor Energy Storage Integration with Reduced Capacitance


Institute of Industrial Electronics and Electrical Engineering, Riga Technical University, 12/1 Azenes Street, 1024 Riga, Latvia
*
Author to whom correspondence should be addressed.
Electronics 2023, 12(1), 126; https://doi.org/10.3390/electronics12010126
Submission received: 10 November 2022
/
Revised: 9 December 2022
/
Accepted: 23 December 2022
/
Published: 28 December 2022
(This article belongs to the Special Issue Innovative Technologies in Power Converters, Volume II)
Abstract
:This paper analyzes the control method of a multiphase interleaved DC–DC converter for supercapacitor energy storage system integration in a DC bus with reduced input and output filter size. A reduction in filter size is achieved by operating only in modes with duty cycles that correspond to smaller output current ripples. This leads to limited control of the charging and discharging process of the supercapacitor energy storage system. Therefore, a detailed analysis of the optimal charging strategy is provided in this paper for interleaved converters with different numbers of phases. The results show that such control can be used, albeit with some percentage loss in efficiency. Experimental results are presented in this paper to verify the theoretical results.
1. Introduction
Today, in many power conversion applications, bidirectional DC–DC converters are used, especially for energy storage integration. DC voltage is being increasingly used in many applications, such as lighting, renewable energy sources, energy storage integration, data centers, and motor drives [1]. For electrical drive systems, even in the case where a three-phase motor is used, interfacing with DC voltage is much easier and reduces conversion stages as an AC–DC converter and filter are not necessary. Moreover, electrical drives that work on the DC microgrid can supply braking energy to other loads, thus improving energy efficiency [2].
If additional energy storage is installed in such a microgrid, the energy efficiency can be further increased due to the additional portion of saved regenerative braking energy. The stored energy can also be used to supply the DC microgrid in cases of shortage or voltage sags. For such an application, a supercapacitor-based energy storage system is an appropriate solution as supercapacitors have low series resistance and an increased charge/discharge cycle lifetime [3]. An example of such a microgrid can be seen in Figure 1. Supercapacitor energy storage increases energy efficiency by storing regenerative braking energy, which then enables energy supply during AC voltage shortages or a safe stop of electric drives during long-term disconnection of the AC grid.
To control energy flow between the DC microgrid and supercapacitor energy storage, a DC–DC converter is required. Since the main advantage of a supercapacitor is that it can store and return a large current without significant losses, several semiconductor devices can be connected in parallel. To increase the benefit of such paralleling, a good idea is to employ interleaved DC–DC converter topology. The possibilities of a reduction in size and an improvement in efficiency of interleaved DC–DC converters in comparison with simple paralleling of semiconductor devices have been shown in many scientific papers (e.g., [4,5,6]). Such converters are employed in many industries. One of the most promising applications for such converters is voltage conversion in hybrid and electric cars [7,8]. A typical schematic of an interleaved boost converter is shown in Figure 2a. The converter consists of bidirectional DC–DC converters connected in parallel, which are controlled using signals that are shifted in phase; therefore, per-phase currents are also shifted in phase, as can be seen in Figure 2b. This allows reducing the summary current ripples, thus enabling a reduction in the filter’s capacitor capacitance, as well as a possible reduction in the per-phase inductor size [9].
As a semiconductor device for interleaved converter IGBTs, MOSFETs or wide-bandgap devices can be used. For low-voltage applications, MOSFETs are the most often used device, as represented in Figure 2a. In the experimental setup, a gallium nitride (GaN) transistor-based interleaved converter is used. If the converter is operated in synchronous mode, there are no significant differences between Si MOSFETs and GaN transistors. The main benefit of GaN transistor application is the possibility to increase the switching frequency, thus increasing the power density of the converter.
A review of bidirectional DC–DC converters was given in [10]; it was concluded that, for high-current applications, interleaved converters are among the best choices. The control methods of interleaved converters were summarized in [11]. Most control methods are complex and not easy to implement. If only the output current or voltage is controlled via feedback loop, then the per-phase currents can become unbalanced, and the continuous conduction mode (CCM) can lead to overcurrent in one of the phases [12]. To prevent this, some solutions should be implemented to maintain equal currents in each phase. To maintain equal currents, current sensors and corresponding regulators are most often implemented in each phase [13,14]. This results in multiphase DC–DC converters becoming more expensive and complex. The efficiency of such converters can be increased if the transistors are turned off shortly after the current has reached zero because, in this case, soft switching without any additional circuits can be realized [15]. These so-called triangular current or critical conduction mode multiphase DC–DC converters are becoming more popular; however, some circuits should be implemented to detect zero current.
This paper analyzes the possibility of using fully or partly open-loop control of interleaved multiphase converters, thus making control system very simple. The application of such a control system for supercapacitor storage application is analyzed; however, the proposed idea can also be used for other applications where accurate current control is not needed. The proposed control method utilizes only those duty cycle regions where the output current ripple is smallest, thus potentially reducing the size of the needed output capacitor. The analysis is based on theoretical equations, simulations, and experiments.
2. Current Ripple of Interleaved Converter and Output Filter Minimization
The current of the interleaved DC–DC converter can be controlled in two modes: continuous conduction mode (CCM) or discontinuous conduction mode (DCM). For CCM, higher inductance values are required, and the current disbalance problem should be solved. The power density of the converter in CCM can be increased by applying integrated magnetics [16,17,18]. Integrated magnetics can also contribute to a reduction in the output filter capacitor size. Therefore, multiple current sensors and closed-loop current regulators can be used per-phase as in [19] to achieve the active balancing of the multiphase currents, complicating the design of such a converter.
When the converter operates in CCM with a high per-phase current ripple or in DCM, a smaller inductance is needed than in CCM. On the other hand, input current and output voltage ripples are increased in the DCM; therefore, the filter capacitor size is larger. Accordingly, it is important to find solutions to reduce these ripples. The cost, weight, and control complexity grow as the number of phases increases if the control loop is implemented in each phase. In this paper, it is proposed to use a partly open-loop control method to avoid complex control algorithms, as well as to use only specific duty cycles to reduce output current ripples.
In a multiphase converter, if the phases share current equally and the phase ripple is proportional to the current that flows in each phase, the phase ripple decreases if the number of phases increases. Depending on the duty cycle, the actual output ripple may be lower due to ripple cancelation between the phases. The following equation describes the output current ripples [20]:
where Vin is the input voltage, f is the switching frequency, L is the per-phase inductance, N is the number of phases, and D is the duty cycle. In Equation (1), the function floor means that the result of (ND) is rounded down, returning the largest integer less than or equal to the result of (ND). To compare current ripples at different numbers of phases, it is more suitable to use relative units (p.u.), while considering the input voltage, inductance, and switching frequency as constant. Therefore, Equation (1) can be rewritten as follows:
From Equation (2), it is possible to draw the graphs shown in the Figure 3 with certain regions where current ripples are lower or theoretically even close to zero. For example, in the case of four phases, zero-output current ripples are at duty cycles equal to 0, 0.25, 0.5, 0.75, and 1. In these graphs, maximum current pulsation occurs in the case of one phase and duty cycle equal to 0.5; in relative units, this ripple corresponds to 1. It can be concluded that, for any number of phases, the zero ripple duty cycles are distributed at even distances from 0 to 1. By increasing the number of phases, the current ripples can be reduced, and the number of zero ripple points increases. However, due to parasitic resistances, capacitances, and inductances, in practice there remain some ripples even at these theoretical zero ripple points, but they are smaller. Since there is symmetry between the duty cycle values of zero oscillation D0n, their numerical values can be calculated according to the following formula:
where N is the number of phases, and n is the pulsation number or an integer that belongs to the interval from 1 to N, with a change step of 1.
The equations and graphs are correct only in cases where the converter works in CCM; however, in this case, the currents should be balanced. In this case, it is considered that the converter works in CCM with a large current ripple or in DCM, but close to CCM. If the converter works in CCM with smaller currents, then a transition to DCM occurs and, therefore, the misbalance ends. Furthermore, the adaptation of individual duty cycles allows equalizing the current since the converter works without feedback. If the converter operates in DCM but close in CCM, the equations approximately describe the current ripples. In these modes, a smaller inductance value is required, thus potentially allowing for a reduction in size of the converter.
The input of the converter is connected to the DC grid. The well-known equation for calculating input capacitor capacitance in boost mode is as follows:
where Cin(min) is the minimum input capacitance, Iin(max) is the maximum input current, D is the duty cycle at the minimum supercapacitor voltage, and f is the switching frequency. Additional input voltage ripples are also caused by the equivalent series resistance (ESR) of the capacitor:
where RESR is the equivalent series resistance of the used input capacitor, and Δiin is the inductor summary ripple current. In [21], it was concluded that input current ripples have almost the same zero ripple duty cycles as output relative current ripples. According to Equations (4) and (5), the current ripples have a negative impact on the required input capacitor and stability of the DC microgrid voltage. This is why a reduction in current ripples is so important.
In this case, the DC–DC converter controls power flow to the charge and discharge supercapacitor (SC) energy storage system. In charging mode, it acts like a buck converter. Hence, the input voltage Vin is higher than Vout, and the power flows from the input to the output, i.e., from the DC microgrid to the SC energy storage system. The output voltage in CCM can be calculated using the following equation by multiplying the duty cycle D0n and input voltage Vin of the DC/DC converter:
If the duty cycle is controlled by selecting only the values of D0n at which the current ripple is close to zero, current spikes occur as the output voltage changes rapidly according to Equation (6). The goal of this paper is to analyze the possibility of using such a control method and its influence on the output current and energy efficiency. As an example, the further analyses assume that the SC circuit consists of 20 series-connected SC Maxwell BCAP0450 P270 S18 cells. According to the SC cell parameter information provided by the manufacturer, it can be clarified that the total capacitance of this SC series connection is C = 22.5 F, and the internal resistance is R = 0.056 Ω. Since the input voltage of the DC–DC converter is Vin = 50 V, the maximum voltage of the SC circuit was chosen to be VCmax = 48 V.
In practice, stationary and mobile SC energy storage systems are usually not fully discharged, but instead discharged to some specified minimum voltage value, which in most cases corresponds to half of the maximum voltage because a lower voltage requires a higher current to charge/discharge, thus reducing the charging/discharging efficiency. Therefore, the initial voltage of the SC circuit in question is assumed to be VC1 = 24 V, and the goal is to charge it to the maximum voltage of VC2 = 48 V using a DC/DC converter, which provides the possibility of ensuring a certain constant voltage value at its output. Furthermore, the charging and discharging efficiencies of the SC circuit are compared at different numbers of phases N of the DC–DC converter using the duty cycles D0n at which the current ripple is zero. Figure 4 shows the numerical values of D0n calculated according to Equation (3) for each variant of the number of phases N from N = 1 to N = 12.
At each of the previously calculated D0n values shown in Figure 4, the corresponding converter output voltages Vout can be calculated according to Equation (6). Figure 5 shows the corresponding Vout values. Since the initial charging stage voltage of the chosen SC circuit connection is 24 V, the Vout must be higher than this value in the charging mode when the SC circuit charges to 48 V. This means that, for a certain number of phases N, all zero-current ripple duty cycles D0n cannot be used. Therefore, Vout at those values of D0n where Vout < 24 V are not shown in Figure 5. When the discharge process takes place and the initial charging state voltage is 48 V, the Vout must be lower than this value in the discharging mode when the SC circuit discharges to 24 V. Therefore, for any number of phases N, the charging process uses certain values of D0n in increasing order, while the discharging process uses the same D0n values but in stepwise decreasing order.
The charging and discharging currents can be calculated using theoretical equations. To do so, several simplifications are necessary; for example, internal losses of the converter are not considered, and a simplified RC model of supercapacitors is used. The analysis is based on calculations using MS Excel and Matlab/Simulink to visualize the results.
3. Supercapacitor Charging and Discharging with Constant Voltage
A DC–DC converter operating without current feedback is equivalent to a voltage source. A discrete change in duty cycles corresponds to a step voltage change. In this section, charging and discharging currents, voltages, and efficiency are calculated using theoretical equations, and simulation results are presented.
3.1. Description of Theoretical Model of Supercapacitor Circuit
To understand how the internal resistance R of the SC circuit influences the charging and discharging processes, we further interpret the SC circuit as a series connection of an ideal capacitor C, whose capacitance corresponds to the total capacitance of the SC circuit, and a resistor R, whose resistance corresponds to the total internal resistance of the SC circuit, as shown in Figure 6. The RC circuit can be considered as a simple model of an SC. Hence, it is not precisely accurate because the electrical processes in a real SC are somewhat different from the electrical processes in a simplified RC circuit due to various electrical, chemical, and thermal factors. Therefore, more advanced models have been developed and introduced within the frameworks of various studies [22,23]. In [24], comparisons of the accuracies of RC, multibranch, and two-branch models with respect to the charging voltage of a real SC circuit were presented, clarifying the RC model variant as the least accurate. However, if these inaccuracies are expressed as a percentage for the RC model, then it can be found that the maximum error is not higher than 6%, which is not considered a critically high error. Therefore, it was decided to use a simplified RC model in this paper. Moreover, the simple RC model is recognized as having good accuracy for fast dynamics, and it is generally used for the sizing of energy storage systems and calculation of approximate system efficiency [25]. In some cases, SC equivalent circuits include another resistor connected in parallel to the capacitor C. imitating self-discharge losses which might be significant over longer time periods. Since the self-discharge losses for comparatively shorter charge/discharge cycles are not that significant, this part of the circuit is not included. When replacing the SC circuit with a simple RC circuit, it must also be assumed that the voltage on SCs is perfectly evenly distributed by voltage balancing circuits, and that each SC cell has the same degree of parameter degradation related to the decrease in capacitance C and increase in internal resistance R during its operation life.
It is important to mention that the internal resistance R of the SC circuit is the internal characteristic of the SC related to charging/discharging losses. During the charging process, the current IC flows to the capacitor C; hence, the directions of the potentials on R and C are the same. This means that the voltmeter V connected in parallel to a real SC circuit does not show the actual SC circuit charging state voltage of VC, but instead the sum of VC and VR, which is equal to Vout. During the discharging process, the current IC flows from the capacitor C; thus, the directions of the potentials on R and C are opposite because, in this case, the capacitor C acts as an energy source. Accordingly, the voltmeter shows the difference between VC and VR, which is equal to Vout.
3.2. Mathematical Calculations of Supercapacitor Charging and Discharging with Constant Voltage
In the Matlab/Simulink model, the DC/DC converter was simulated using a virtual DC voltage source connected in parallel with the RC circuit. During the process of SC charging, the voltage source was set to a certain value of Vout higher than VC; however, during the process of SC discharging, the voltage source was set to a certain value of Vout lower than VC. Corresponding calculations are further described below.
In the case of switching on the converter output voltage Vout when the SC circuit has some initial voltage VC1, which is lower than Vout, the actual SC circuit charging state voltage VC at any moment of time t can be calculated according to the expression below, where t is the time passed since the moment of switching on Vout.
To better clarify the quantitative differences between the constant-voltage charging and discharging processes, let us assume that the previously mentioned SC circuit has an initial charging state voltage VC1 = 24 V, and the charging of this circuit is initialized with a constant voltage Vout = 30 V. Next, the same circuit has the initial charging state voltage VC1 = 30 V, and the discharging is initialized with a constant voltage of Vout = 24 V. Comparative simulation results of these equivalent charging/discharging processes are shown in Figure 7, indicating that, if the output voltage Vout of the converter is constant and higher than the capacitor voltage VC, a transient process occurs, during which VC increases, approaching the value of the Vout.
As mentioned before, during the time of either charging or discharging of a real SC circuit, the actual charging state voltage VC cannot be measured using a voltmeter. Hence, it is impossible to obtain the VC-shaped curve shown in Figure 7, because the voltmeter V, connected in parallel with the SC circuit, shows a value Vout. Hence, in case of a real SC circuit, the voltmeter at each D0n shows only the corresponding constant Vout. Therefore, a mathematical calculation of the charging/discharging operation and result verification using a virtual model before such an experiment are mandatory. Another option could be the use of a virtual model of the SC circuit or a so-called digital twin during the experimental charging of the SC circuit. As a result, the corresponding VC curve will also be visible on the computer screen at each Vout during the experiment. A virtual computer simulation model ensures the possibility of using the capacitor and resistor elements connected in series and measuring voltages on each of them separately.
The charging current IC of the SC circuit, whose initial voltage is VC1, at any moment of time t can be calculated using the expression below.
From Equation (8), it can be understood that, upon switching on Vout, when t = 0, the charging current IC has the maximum peak; thereafter, IC decreases, as visible from Figure 7. Therefore, the SC circuit charging state voltage VC, which can be calculated using Equation (7), increases more quickly at the beginning of charging.
Initially, it might seem that, at some point, the voltage VC should rise to a value equal to Vout, since the curves of VC and Vout in Figure 7 seem to overlap at the end of charging. However, although the value of VC becomes infinitely closer to the value of Vout, it never becomes exactly equal. This can be verified by performing virtual charging simulations or by deriving the calculation expression for the charging time t from Equation (7):
Equation (9) shows that, when VC and Vout are assumed to be equal, the natural logarithm from zero corresponds to infinity.
When the SC charging state voltage increases from the initial value VC1 to the final value VC at a certain time t, the amount of successfully stored energy can be calculated according to a well-known formula:
It is possible to derive a formula for calculating the energy lost during the charging process. First, using the charging current calculation Equation (8), the expression of the lost power can be written as
The expression of the lost energy at time t can be written as the integral of the loss power over time t:
By simplifying Equation (12), we can obtain a formula for calculating the lost energy at time t:
The total efficiency of the whole charging process can be calculated as the successfully stored energy EC divided by the total energy that transmitted to SC, corresponding to the sum of EC and ER:
During the process of SC discharging from VC back to VC1 with constant voltage, the expression of the actual SC circuit charging state voltage VC at any moment of time t is equal to Equation (7). Furthermore, if the output voltage Vout of the converter is constant and lower than the capacitor voltage VC, a transient process occurs, during which the VC decreases, approaching the value of Vout, as can be seen in Figure 7. The discharging current at any time t can be calculated using Equation (8); however, in this case, the result value will be negative since the current flow direction is opposite. Equations (10) and (13) can be used to calculate the discharged energy EC and lost energy ER, respectively.
The total efficiency of the whole discharging process can be calculated as the energy that successfully reached the DC–DC converter, corresponding to the difference of EC and ER divided by the total energy EC discharged from the SC circuit:
If the SC circuit is discharged from VC back to VC1 in the same time t during which the circuit was previously charged from VC1 to VC, there will be the same lost energy ER during both charging and discharging processes. As the purpose of any energy storage element is to store energy until it is needed, the full efficiency of the entire charging/discharging process can be calculated as the ratio between the energy that successfully reached the DC–DC converter during discharging and the total energy transmitted to the SC during charging, according to the following expression:
By inserting the corresponding numbers into Equations (14)–(16), the charging efficiency in this case was 90%, the discharging efficiency was 88.9%, and the full charging/discharging efficiency was approximately 80%. These calculations verify that, although there were equal lost energies of ER in both charging and discharging processes, the total discharging efficiency was always lower than the total charging efficiency to some degree for these equivalent charging/discharging situations. Faster charging leads to higher ER and a greater difference between the charging efficiency and the discharging efficiency.
The difference between the efficiencies of the charging and discharging processes can vary according to the extent to which the charging voltage Vout is higher than the initial voltage VC of the SC, as well as the extent to which Vout is lower than the initial voltage VC of the SC during the discharging process. Figure 8 shows the results of different variants in which the initial voltage of the same SC circuit described above is VC = 24 V, but charging takes place until reaching values starting from 30 V and ending at 46 V. Discharging in all variants takes place until reaching the same initial VC = 24 V from before the start of charging. In Equation (9), during the charging process, the maximum voltage VC was assumed to be 0.001 V lower than Vout, whereas, during the discharging process, it was assumed to be 0.001 V higher. At smaller differences between the initial VC and the charging voltage Vout, the differences in the efficiencies of the charging and discharging processes are smaller, but they gradually increase as the difference between VC and Vout increases.
3.3. Regulation of Switching the Duty Cycles D0n Depending on the Difference between Vout and VC
According to Equation (9), VC cannot reach a value that is completely equal to Vout in a finite time during the charging or discharging processes. Hence, it is proposed for each Vout to choose a certain final value of VC that slightly differs from the actual Vout by a difference ∆Vx. During the charging process, switching to the next D0n with a corresponding Vout happens when the actual Vout is ∆Vx lower than VC. During the discharging process, switching to the next D0n with a corresponding Vout happens when the actual Vout is ∆Vx higher than VC. The described situation is schematically represented in Figure 9 with a five-phase case (N = 5) of charging from 24 V to 48 V and discharging from 48 V to 24 V with ∆Vx = 1 V during both charging and discharging. In the last stage of the charging process with D0n = 1, ∆Vx is not considered because charging with the corresponding Vout takes place until VC reaches 48 V. Similarly, in the last stage of the discharging process with D0n = 0.4, discharging with the corresponding Vout takes place until VC reaches 24 V.
Through calculations and simulations, it was found that the charging and discharging times differed even if these processes occurred with the same ∆Vx. As visible in Figure 9, the discharging process is a little faster compared to the charging process. Figure 10 shows the numerical values of charging and discharging time during each separate charging/discharging stage. The reason for the difference in these durations is because, in both processes, the first and last charge/discharge stages are not symmetrical, as visible in Figure 9, meaning that the VCs are charged/discharged by different amounts. Stage 2 of the charging process is shown in Figure 9, where D0n = 0.8 and Vout = 40 V, which lasts as long as stage 2 of the discharging process, where D0n = 0.6 and Vout = 30 V. Moreover, in the mentioned stages, VC is charged by the same amount as it discharges; hence, there are equal lost energies ER visible in Figure 10. The above scenario applies to any charge/discharge stages between the first and last stage in cases with more than three charging/discharging stages. The full efficiency of the charging process is higher compared to the discharging process; however, the next section shows examples of situations where the efficiency of the discharging process emerges higher compared to the charging process depending on the number of phases N and ∆Vx.
4. Analysis of Supercapacitor Charging and Discharging Efficiency Depending on the Number of Phases
As the maximum peak current of the SC model Maxwell BCAP0450 P270 S18 is 240 A according to the manufacture, cases with N = 1, N = 2, and N = 3 are no longer considered because their peak currents exceed 240 A according to Equation (8).
First, it was assumed that, in each situation depicted in Figure 5, switching to the next Vout stage or D0n occurs when VC charges to a value ∆Vx = 0.1 V lower than the actual Vout. Figure 11 shows the corresponding VC values. The final VC values for each number of phases N are equal to 48 V. Since there are no huge differences between the basic parameters in the charging and discharging processes as concluded in previous section, we visually look at the parameters at separate stages only for the charging process, including the charging state voltage VC, charging time t, the peak current IC, and lost energy ER.
According to Equation (9), the times t at which the values of VC from Figure 11 are reached were calculated, as shown in Figure 12. When the voltage VC increases/decreases by the same amount at different duty cycles of D0n, these increases/decreases in VC occur in equal time durations. The total time of charging is the sum of the duration times of all separate duty cycles of D0n shown in Figure 12. Figure 13 shows the total times of both charging and discharging processes for each number of phases N, whereby the total time of the whole process of charging and discharging for any variant is simply the sum of the two values shown. It is visible that a smaller number of phases N means faster charging/discharging and vice versa. On the other hand, further calculations show that a higher number of phases N results in less loss and higher efficiency.
In Figure 13, it is visible that, with a small number of phases N, the difference between the charging and discharging durations is less than 1 s, whereas, with a larger number of phases N, discharging usually takes less time than charging with a difference of up to 2.5 s if ∆Vx = 0.1 V.
The maximum peak current at each charging stage with corresponding D0n and Vout for all variants of the number of phases N could be calculated using Equation (8) when t = 0, and the results are shown in Figure 14. Excluding the very first D0n, at any number of phases N, the current peaks for each separate charging stage or D0n are equal. As the number of phases N increases, the current peaks decrease more noticeably when comparing the increase in N from four to seven. Furthermore, the current peak decreases less significantly.
Figure 15 shows the stored EC energies calculated using Equation (10) for all used Dn0s for each number of phases N. The total stored energy, which is the sum of the energies stored during operating times of separate Dn0s, is equal to EC = 19,440 J for all variants of N. In the case of discharging, the total discharged energy during operation at separate D0ns also corresponds to 19,440 J.
Figure 16 shows all the lost energies calculated using Equation (13) for each used D0n at all variants of N.
The energy losses of the separate charging stages shown above can be summed up to obtain the full amount of energy lost during the entire charging process. Figure 17 shows the comparison of both charging and discharging losses for each variant of N. A higher number of phases correlates to lower losses during both charging and discharging. It is noticeable that, with a small number of phases, there is less loss during discharging than charging, whereas, with a larger number of phases, there is more loss during charging.
The full energies transmitted to SC during the charging processes, the successfully stored energies (equal to the total discharged energies during the discharging processes), and the successfully discharged energies are shown in Figure 18 for each N.
Figure 19 shows the charging, discharging, and total charging/discharging efficiencies calculated using Equations (14)–(16) for each number of phases N. A higher value of N correlates to a higher total charging/discharging efficiency. It is visible that the difference between the total charging/discharging efficiencies is higher for a lower number of phases N, whereas, for a higher number of phases N, this difference is reduced.
5. Analysis of Supercapacitor Charging Efficiency Depending on Faster Duty Cycle Changes
Previously, sequential switching to voltage Vout corresponding to the next D0n occurred only at that moment when the difference between Vout and VC was ∆Vx = 0.1 V, whether for charging or discharging. In this section, we look at different cases where ∆Vx varies from 0.05 V to 1 V. In the previous section, it was clarified that, at the same ∆Vx, the time durations and efficiencies of charging and discharging processes differed slightly, but did not exceed 3.4% according to Figure 19; the average difference across all phase variants was 1.2%. Calculations showed that the same is true for all cases and strategies discussed in the paper. This means that the efficiencies of the charging and discharging processes can be considered approximately equal. Therefore, in subsequent descriptions of the theoretical calculation and simulation results, only the charging process is considered in order to reduce the volume of displayed parameter diagrams, while logically assuming that there are no significant differences between the results of charging and discharging processes.
Figure 20 shows the graphs of the total charging time durations at different ∆Vx calculated using Equation (9). It can be seen that a lower ∆Vx correlates to longer charging. For sequential low ∆Vx values, the charging times are more significantly different than for sequential higher ∆Vx values. Increasing ∆Vx to some extent can significantly shorten the charging time.
Figure 21 shows the maximum peak currents at different ∆Vx, and it can be seen that, within any number of phases N, the current peak increases insignificantly with ∆Vx. A more significant difference in the current peaks can be seen when comparing smaller numbers of phases such as N = 4, N = 5, N = 6, and N = 7. The mutual current peak differences for higher numbers of phases are less significant.
Figure 22 shows the total charging/discharging efficiency diagrams calculated using Equation (16). As ∆Vx increases within each N, the efficiency decreases to a certain extent. More significant differences in efficiency can be seen when comparing the numbers of phases N. For sequential numbers of phases, e.g., N = 4 and N = 5, the difference is more visible than when comparing, for example, the difference between N = 11 and N = 12.
For further calculation analyses, the six-phase variant N = 6 is considered, the charging and discharging efficiencies of which are both approximately 89%, while the total charging/discharging efficiency is approximately 78% according to Figure 19 with ∆Vx = 0.1 V. Figure 23 shows the curves of current during the charging process at N = 6 with corresponding charging time durations on the x-axis at different ∆Vx. At the lowest ∆Vx = 0.05 V, the charging time is the longest. Upon increasing ∆Vx, the charging time is reduced. The lower part of the figure shows the corresponding curves of the voltages VC of the SC circuit. Figure 24 shows that the charging time can be significantly shortened by increasing ∆Vx to 1 V. Choosing ∆Vx values that exceed 1 V decreases the charging time less significantly. Furthermore, the efficiency diagrams show that increasing ∆Vx has a very negligible impact on the overall charging efficiency. For example, when ∆Vx = 0.6 V, the charging time is almost twice as short compared to the case when ∆Vx = 0.05 V, and the efficiency decreases by less than 1.5%. Therefore, the variant with N = 6 and ∆Vx = 0.6 V is used for further simulations.
Figure 25 shows how the power storage efficiency and energy storage efficiency vary during charging for the variant with N = 6 and ∆Vx = 0.6 V. The value corresponding to the total energy storage efficiency of the entire charging process is that at the very end of charging. During charging, the power storage efficiency drops sharply at any time when the current peak appears, but then gradually increases.
6. Charging and Discharging Utilizing Duty Cycle Regions with Small Current Ripples
Filtering capacitors are usually applied to smooth the output current ripples of DC–DC converters. The size of these filtering capacitors depends on the values of current ripples to be smoothed. Accordingly, smoothing smaller ripples require the use of smaller filtering capacitors. Therefore, the range of applicable duty cycle values can be extended. Current ripples are low for those duty cycles that numerically differ little from the zero-ripple D0n values. This means that, depending on the number of phases N, several ranges of applicable duty cycle D values can be marked on the x-axis. The very center of each range of applicable D values corresponds to the value of a certain D0n. To determine the lengths of the ranges of applicable D values, it is necessary to select a percentage value ∆D0n for which the minimum value Dmin in this range is less than the value of zero-ripple D0n. Dmin can be calculated using the following formula, where n is the current ripple number or an integer number belonging to the interval from 1 to N, and N is the number of phases:
Accordingly, using this same percentage value, the maximum value Dmax of the ∆D0n range is greater than the zero-ripple value D0n, and Dmax can be calculated as follows:
Figure 26 shows an example of a case with a six-phase converter, i.e., N = 6, where ∆Dn = 0.15 or 15% in each range. The corresponding ranges of usable D values are colored red.
One option for determining the permissible D ranges is to choose specific percentage values of ∆I that are slightly higher than zero. Then, the maximum permissible pulsation points are marked on the ∆I line both to the left and to the right of D0n; then the corresponding Dmin and Dmax values can be found on the x-axis. However, the ranges of D to be used in further analysis are determined using Equations (17) and (18).
6.1. Strategy with Utilization of Minimum and Maximum Duty Cycles from Regions with Lowest Current Ripple
An SC charging strategy with the use of only Dmin and Dmax from permissible D ranges is proposed. It can be concluded that, when using Dmin, the SC charging state voltage VC increases more quickly to the value at which the Dmax should be switched. When using Dmax, the SC charging state voltage increases for a longer time to the value at which the next Dmin should be switched. Five cases were compared for the given SC circuit and DC–DC converter with N = 6 and ∆Vx = 0.6 V with the following percentage values of ∆D0: 5%, 10%, 15%, 20%, and 25%. The simulation results are shown in Figure 27. At higher ∆D0, charging takes a little longer as seen in Figure 28; however, according to Figure 29, the efficiency increases by approximately 0.7% as the ∆D0 increases by 5%.
6.2. Strategy of Combining Constant Voltage Charging and Constant Current Charging
In the previous strategy, only Dmin and Dmax values from any range of permissible D values were used. Therefore, a SC charging strategy that uses all D values from any permissible D range is also proposed. The basic idea of the strategy is that, when the voltage corresponding to Dmin is reached, while also considering the difference ∆Vx between Vout and VC, D is gradually increased to Dmax such that there is a constant charging current IC. When Dmax is reached, charging to the voltage corresponding to the next Dmin occurs according to the previously described constant voltage charging algorithm.
The Dmin and Dmax values of any permissible D range are known; hence, it is not a problem to calculate their corresponding Vout. Corresponding voltages of VC are ∆Vx smaller than Vout. If the voltages VC for the parameters Dmin and Dmax are assumed as VCmin and VCmax, then the formula for the constant current with which the SC circuit is charged from VCmin to VCmax in time t can be written as follows, where C is the total capacitance of the SC circuit:
Equation (19) contains two unknowns: the charging current IC and the charging time t. This means that a numerical value for one of these unknown parameters must be chosen in advance. In the first variant, a certain current IC value with which to charge the SC circuit can be chosen, and then the charging time t can be calculated. In the second variant, a certain charging time t can be chosen, and then the charging current can be calculated. In the case of constant current charging, the SC circuit voltage VC increases linearly throughout the charging time, and the voltage VR caused by internal resistance R is constant throughout the charging time. At higher charging currents, the charging is faster, while the internal energy losses are higher. On the other hand, at lower charging currents, the internal energy losses are lower, while the charging time t is longer. Generally, this strategy is a combination of constant-voltage and constant-current charging, and several variants can be combined depending on the set goal, whether it be faster charging, more efficient charging with less loss, or a balance of these factors.
The corresponding stored energy is calculated according to Equation (10), while the lost energy, when the charging current is constant, can be calculated as follows:
It can be expected that the effect of a constant charging current would be more noticeable in cases with larger ranges of allowable D values; therefore, the case with N = 6, ∆Vx = 0.6 V, and ∆D0 = 25% was chosen for further experimental simulations. We perform comparisons by choosing a constant charging current IC instead of charging time t, i.e., variants for which the charging current IC was 40 A, 50 A, 60 A, 70 A, and 80 A. The charging times t between the respective Dmin and Dmax were calculated separately. In the computer model, the SC charging simulation circuit had two power sources, one connected to the SC circuit and the other disconnected depending on the following situations: the voltage source is used when charging with a constant voltage, while the current source is used when charging with a constant current.
Figure 30 shows the characteristic curves of the simulation results. Increasing the constant charging current IC by 10 A slightly accelerates the charging process. According to Figure 31, when increasing IC from 50 A to 60 A, charging duration is reduced by 0.4 s; however, with a further increase in IC, the difference in charging times decreases. According to Figure 32, the charging efficiency decreases very insignificantly each time the current IC is increased by 10 A.
7. Practical Verification of Theoretical Results
To verify the theoretical results, simulations were performed using Matlab Simulink software, and an experimental setup was built, as shown in Figure 33a. The electronic load EA-ELR 91500-30 was used in discharging mode, while the DC power supply EA-PSI 9550-60 was used in charging mode to provide load. Experimental waveforms were obtained using a Yokogawa DLM6054 oscilloscope and TA018 current probe. The experimental prototype of the six-phase interleaved DC–DC converter is shown in Figure 33b. One additional board and two inductors were added to build an eight-phase converter. STM32G474RET6 was used to generate interleaved PWM signals shifted in phase as can be seen in Figure 34. In this case, a B-G474E-DPOW1 Discovery kit or NUCLEO-G474RE development board was used.
To build a multiphase converter, several modified TIDA-00909 three-phase GaN IC-based inverter boards were used. In these boards, the GaN integrated circuit (IC) LMG5200 was used to create a half bridge. There were three half bridges on each board; thus, two boards were needed to build a six-phase converter, while three boards were needed for an eight-phase converter. The experiments were performed mostly in CCM mode but with a high per-phase current ripple. To avoid misbalance of the currents, the PWM duty cycle in different phases was adjusted to equalize the current. The SC energy storage system was built consisting of 20 Maxwell BCAP0450 P270 S18 supercapacitors connected in series, as shown in Figure 35. Table 1 summarizes the parameters of the components used to build the interleaved DC–DC converter. The average efficiency of the converter was approximately 96%. Since there was a supercapacitor energy storage system at the output of the DC–DC converter, there was no need to install a capacitor; only a small ceramic capacitor was used to remove small voltage spikes.
Some examples of the theoretical calculations/simulations of charging and discharging using the same circuit of 20 SC cells were checked experimentally. The first task was to charge the SC circuit from the initial voltage VC1 = 24 V to VC2 = 48 V. To charge the SC circuit, a power source called a “laboratory power supply” was used with a maximum working current of 60 A. Thus, 60 A was also the maximum allowable peak current for SC circuit charging with a constant voltage. Accordingly, it was necessary to calculate the corresponding output voltage of the DC–DC converter Vout when charging the SC circuit such that the current peak Ip = 60 A. The following expression for calculating Vout can be derived from Equation (8) if t = 0:
The corresponding numbers can be inserted into Equation (21) with R = 0.056 Ω and Vout = 27.36 V. This means that, at the beginning of any charging stage, the difference between voltages VC1 and Vout must be 3.36 V, such that the current peak is equal to 60 A. On the basis of the decision that switching to the next constant Vout would occur when the difference between the actual Vout and VC is ∆Vx = 0.3 V, then the voltage VC at the end of the first charging stage would be 27.06 V. According to Equation (9), such a charging stage lasted for approximately 3.04 s. To charge the SC circuit up to 48 V, it could be determined that a total of eight different Vouts with a predetermined increase step of 3.36 V should be used. Using Equation (3), the corresponding duty cycle D value for each Vout could be calculated. In Figure 36, blue dots correspond to the calculated D values for each Vout, whereas red dots correspond to zero-current ripple duty cycles D0n. It can be seen that, in the case of the six-phase converter, most of the Vout-corresponding Ds were located quite far from the zero-current ripple D0ns. A blue dot located in the middle between two red dots indicates the maximum current ripple; hence, the main goal is for these blue dots to be located as close as possible to the red dots. In the case of the eight-phase converter, most of the blue dots were located relatively closer to the red dots. Therefore, the eight-phase converter variant was more suitable for this situation.
The calculations verified that this charging consisting of eight charging stages with respective Vouts lasted 23.15 s in total; the simulation results are shown in Figure 37. The current peak at each stage was equal to 60 A.
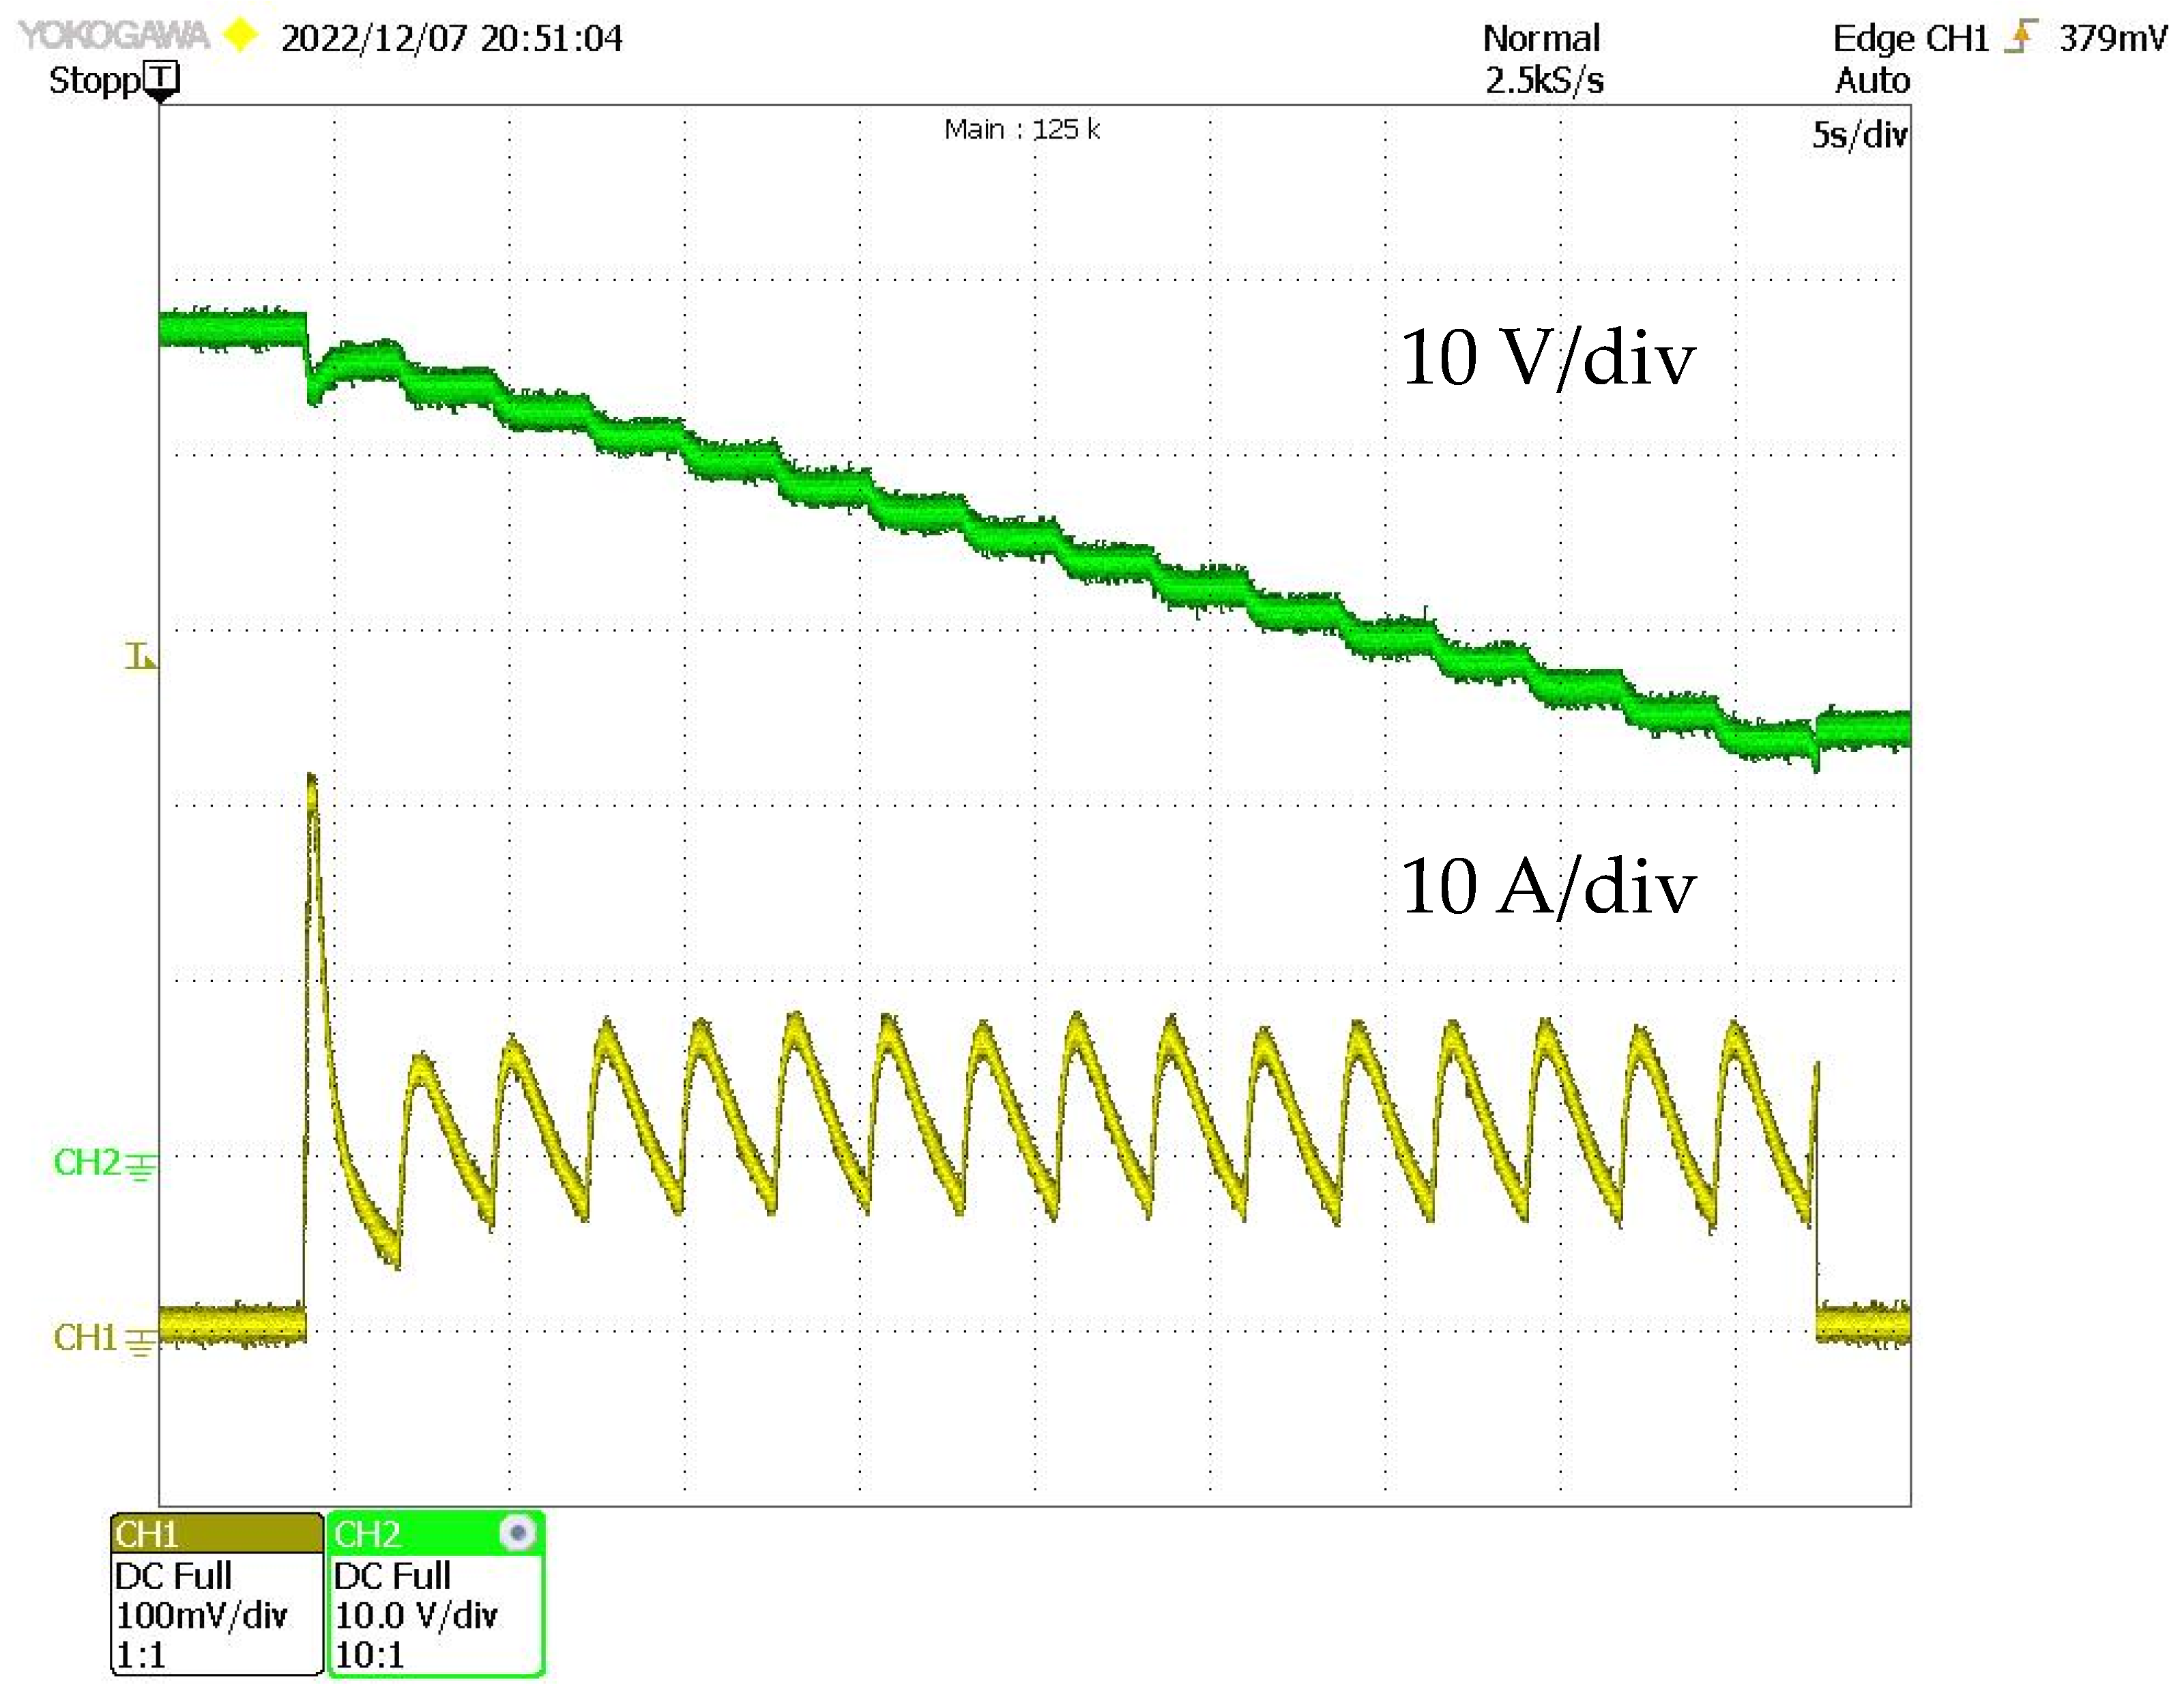
After obtaining simulation results, an equivalent experiment was performed by programming the voltage Vout curve profile shown in Figure 37; Figure 38 shows the experimental results. As can be seen, the experimentally obtained current peaks were approximately 40 A instead of the expected 60 A, and the final voltage of the SC circuit was a little lower than expected.
Certain mismatches are also related to some losses in the DC–DC converter itself. Searching for reasons for such a discrepancy in the results, it was found that the traces of the SC circuit board shown in Figure 39 had relatively significant resistance. The setup for measuring the resistance of the SC circuit board tracks is shown in Figure 40. It was determined that the total resistance of these tracks was 43 mΩ, which needed to be considered in addition to the total internal resistance of the SCs, i.e., 56 mΩ, when performing calculations and simulations.
Figure 41 shows the simulation results after corresponding modifications in the Matlab model; through a comparison with the results of Figure 38, it can be seen that the simulation results were nearly equivalent to experimental results. To determine the experimental charging efficiency, the current values recorded by the oscilloscope were used, which were obtained in the form of an array of numbers using Excel. Each current value had a certain duration, which allowed the power to be calculated as this current squared and multiplied by the sum of SC resistance and board trace resistance. Subsequently, the corresponding energy was calculated as this power multiplied by the corresponding duration.
Through these calculations in Excel, it was determined that the total lost energy was approximately 1176 J while the successfully transferred energy was approximately 18,373 J, when considering a final SC circuit voltage of approximately 47 V not 48 V. Thus, the total charging efficiency was approximately 93.9%. A typical alternative to constant-voltage charging is constant-current charging. Considering that the charging duration was 23.15 s, as shown in Figure 38 and Figure 41, we calculated the efficiency if the charging had taken place with a constant current from the same 24 V to 47 V in 23.15 s for comparison. According to Equation (19), the constant charging current was 22.35 A. In constant-current charging, the lost power is constant; therefore, it could be calculated that the lost energy was 1145 J. Thus, the total charging efficiency was approximately 94.13%, which is nearly equal to the efficiency in the case of constant-voltage charging. Accordingly, the latter had enough voltage change stages to not cause significant current peaks and high losses.
It can also be concluded that SC circuit boards should be designed and constructed to ensure the minimum additional loss in their traces. Therefore, it is necessary to consider the values of currents that would have to flow through the traces of the respective board. This loss reduction can be achieved, for example, by making thicker traces, by soldering several traces in parallel, or by using more board layers. If the goal is to use converter output voltages Vout with the corresponding duty cycles D within certain permissible ranges, then these Vouts must be determined. As demonstrated, the eight-phase converter had eight different (not counting the zeroth D00) D values at which there were no current ripples. It was assumed that, for any range of permissible D values in which the central value corresponded to zero ripple D0n, the minimum Dmin was 40% lower than D0n with respect to the nearest D with a maximum ripple to the left, while the maximum Dmax was 40% higher than D0n with respect to the nearest D with a maximum ripple to the right. Dmin and Dmax were calculated using Equations (17) and (18). Figure 42 shows the ranges of permissible D value ranges with red dots in the centers, limited by the blue dots.
The next task was to charge the existing SC circuit from the same 24 V to 48 V using only the Dmin and Dmax for any usable range of permissible D values. Only those Ds at which the corresponding Vout ranged from 24 V to 50 V were considered, as shown by the blue dots in Figure 42. This time, it was assumed that ∆Vx = 0.1 V, and the corresponding constant voltages Vout were calculated using Equation (21). The simulation results are shown in Figure 43, where the blue color corresponds to the case when only the internal resistance of the SC was considered; the SC charged to 48 V in this case. The red color corresponds to the case when the previously calculated resistance of the SC circuit board tracks was also considered while maintaining the previous conditions of Vout calculations. The simulation diagrams when considering SC circuit board trace resistance correspond relatively well to the diagrams of the experimental results in Figure 44.
The last task was to discharge the existing SC circuit from the initial 48 V to 24 V using an electronic load EA-ELR 91500-30. It should be noted that the maximum operating current of this load was 30 A; accordingly, the discharge of the SC circuit was planned such that the peak current did not exceed 30 A. The discharge simulation results are shown in Figure 45, assuming a positive discharge current. Figure 46 shows the experimental results, where only the very first current peak almost corresponds to the expected result. This indicates that the given load was not able to maintain a perfectly constant voltage on the side of the DC network, due to which the SC voltage did not decrease with a sharp drop but instead with a flat gradient, as shown in Figure 46. Therefore, as a result, the current peaks were lower than expected; however, at the end of the discharge, the voltage of the SC circuit was still approximately equal to the planned 24 V.
8. Discussion
In the case of an SC circuit charging or discharging, the difference between the initial SC voltage and the charging/discharging voltage, i.e., the output voltage of the DC–DC converter, should not be very high. If the goal is to operate the DC–DC converter in modes with low current ripples, there are a limited number of usable output voltages, i.e., charging/discharging voltages. The previously mentioned difference can be reduced by increasing the number of phases of a DC–DC converter, thus increasing the number of duty cycle values at which the current ripple is close to zero. This enables the possibility of using more converter output voltage values. Increasing the number of converter phases increases the overall charging/discharging efficiency, and the difference becomes more noticeable when comparing a small number of phases such as 1–8. Further increasing the number of phases increases the efficiency but less significantly. A high number of phases makes the DC–DC converter more complex, which may not pay off in terms of efficiency; thus, it is optimal to choose smaller numbers of phases if the efficiency difference compared to cases with larger numbers of phases is insignificant.
Considering that, due to the internal resistance of SCs, the voltmeter in charging mode will show a value slightly higher than the actual SC voltage value, and vice versa in discharging mode, before any experiment, it is necessary to conduct theoretical calculations to predict the behavior and variations of the actual SC voltage over charging/discharging time. Therefore, it is convenient to use virtual computer models in which the SC internal resistance can be equivalently replaced by a resistor and the capacitance can be equivalently replaced by an ideal capacitor. Consequently, the corresponding current and voltage diagrams can be obtained before performing experiments, thus ensuring the correctness of theoretical calculations.
Comparing the charging and discharging efficiency in cases where the capacitor is charged by some amount of energy at a certain time and then discharged by the same amount of energy at the same time, the charging efficiency is always higher than the discharging efficiency, and the extent of this difference depends on both the SC internal resistance and the charging/discharging rate or time. This difference increases when the charging voltage is significantly higher than the initial SC voltage.
When planning the charging process for an SC, there can be assumed a certain difference between the SC actual voltage and the charging voltage at which the switching to the next charging voltage corresponding to the zero-current ripple occurs. Similarly, when planning the discharging process, there can be assumed a certain difference between the discharging voltage and the SC actual voltage at which the switching to the next discharging voltage corresponding to the zero-current ripple occurs. If the mentioned differences are very small (on the order of hundredths of a volt), then the efficiency becomes higher at the cost of a longer total charging/discharging time. Moreover, by increasing this difference from 0.6 V to 1 V, the charging time can be reduced by more than twofold, whereas the charging efficiency decreases insignificantly by approximately a few percent. It was found that, when charging and discharging SC by the same amount in equal times with equal mentioned differences between the corresponding voltages, the duration of charging and discharging varies slightly depending on both the number of phases and the duration. However, corresponding theoretical calculations must be conducted in advance such that both the charging voltage values and their operation durations can be programmed on the experimental equipment.
As an example, three different SC charging strategies were considered. In one strategy, charging was performed using only those duty cycle values at which the current ripples were zero. Within the framework of the second strategy, duty cycle values were centered around zero-current ripple duty cycle values, and the minimum and maximum values of these ranges were used to improve the overall charging efficiency by a few percent. Within the framework of the third strategy, complete duty cycle ranges were used, such that a constant charging current was provided at certain stages of the charging process. This was the most efficient strategy, but a more complex control algorithm was required.
By carrying out such preliminary charging efficiency calculations and comparing the results at different numbers of phases, it is possible to plan which converter to use for specific SC energy storage or different applications depending on the set goals, such as reducing the maximum current peak to a certain value or increasing the overall charging efficiency. Both of these goals can be achieved by increasing the number of phases; however, it should also be taken into account that a larger number of phases results in the converter becoming bulkier with a more complex control system, thereby also increasing the development and manufacturing costs. Increasing the number of phases also reduces the amplitude of the current ripple; therefore, in certain situations, a higher number of phases can result in small and insignificant current ripples, whereby literally any value of the duty cycle can be used throughout its definition range from zero to one.
The described SC circuit charging strategies were implemented in a Matlab/Simulink model, obtaining similar results to those when tested on real hardware. The experimental results differed from theoretical ones to a certain extent, as the efficiency of the converter and the voltage drop on wires and connectors were not considered in the model. It was found that SC circuit tracks had relatively high resistance; when this was not considered, the theoretical simulation and experimental results of the peak current measurements differed significantly.
GaN transistors are small and have low thermal capacity; therefore, the current peaks can destroy them. For practical applications, MOSFETs or IGBTs may represent better solutions. The paper provided the methodology for how to calculate the parameters before implementation on real hardware. The presented calculations allow predicting in advance the duration for the actual voltage of the SC circuit to reach the relevant values. The main benefit of the presented control strategy is its simplicity, as it can be implemented without feedback controller design and in some applications where precise control is not necessary.
Author Contributions
Conceptualization, K.K.; Software, Ģ.S.; Validation, K.K.; Formal analysis, Ģ.S.; Investigation, K.K. and Ģ.S.; Data curation, Ģ.S.; Writing—original draft, Ģ.S.; Writing—review & editing, K.K.; Visualization, Ģ.S.; Project administration, K.K.; Funding acquisition, K.K. All authors have read and agreed to the published version of the manuscript.
Funding
This research was funded by the Latvian Council of Science, project “Fast transient response and high-efficiency GaN-based BLDC motor converter with a dual power supply”, project No. lzp-2021/1-0298.
Data Availability Statement
Not applicable.
Conflicts of Interest
The authors declare no conflict of interest. The funders had no role in the design of the study; in the collection, analyses, or interpretation of data; in the writing of the manuscript; or in the decision to publish the results.
References
- Elsayed, A.T.; Mohamed, A.A.; Mohammed, O.A. DC microgrids and distribution systems: An overview. Electr. Power Syst. Res. 2015, 119, 407–417. [Google Scholar] [CrossRef]
- Meike, D.; Pellicciari, M.; Berselli, G. Energy Efficient Use of Multirobot Production Lines in the Automotive Industry: Detailed System Modeling and Optimization. IEEE Trans. Autom. Sci. Eng. 2014, 11, 798–809. [Google Scholar] [CrossRef]
- Khan, M.A.; Zeb, K.; Sathishkumar, P.; Ali, M.U.; Uddin, W.; Hussain, S.; Ishfaq, M.; Khan, I.; Cho, H.-G.; Kim, H.-J. A Novel Supercapacitor/Lithium-Ion Hybrid Energy System with a Fuzzy Logic-Controlled Fast Charging and Intelligent Energy Management System. Electronics 2018, 7, 63. [Google Scholar] [CrossRef] [Green Version]
- Zhou, H.; Duong, T.; Sing, S.T.; Khambadkone, A.M. Interleaved bi-directional Dual Active Bridge DC-DC converter for interfacing ultracapacitor in micro-grid application. In Proceedings of the 2010 IEEE International Symposium on Industrial Electronics, Bari, Italy, 4–7 July 2010; pp. 2229–2234. [Google Scholar] [CrossRef]
- Barati, F.; Ahmadi, B. Current sharing in non-coupled interleaved bi-directional boost converters for supercapacitor applications. In Proceedings of the 2015 IEEE 6th International Symposium on Power Electronics for Distributed Generation Systems (PEDG), Aachen, Germany, 22–25 June 2015; pp. 1–5. [Google Scholar] [CrossRef]
- Rimondi, M.; Mandrioli, R.; Cirimele, V.; Pittala, L.K.; Ricco, M.; Grandi, G. Design of an Integrated, Six-Phase, Interleaved, Synchronous DC/DC Boost Converter on a Fuel-Cell-Powered Sport Catamaran. Designs 2022, 6, 113. [Google Scholar] [CrossRef]
- Waffler, S.; Biela, J.; Kolar, J.W. Output ripple reduction of an automotive multi-phase bi-directional dc-dc converter. In Proceedings of the 2009 IEEE Energy Conversion Congress and Exposition, San Jose, CA, USA, 20–24 September 2009; pp. 2184–2190. [Google Scholar] [CrossRef]
- Schumacher, D.; Magne, P.; Preindl, M.; Bilgin, B.; Emadi, A. Closed loop control of a six phase interleaved bidirectional dc-dc boost converter for an EV/HEV application. In Proceedings of the 2016 IEEE Transportation Electrification Conference and Expo (ITEC), Dearborn, MI, USA, 27–29 June 2016; pp. 1–7. [Google Scholar] [CrossRef]
- Tran, D.; Chakraborty, S.; Lan, Y.; van Mierlo, J.; Hegazy, O. Optimized Multiport DC/DC Converter for Vehicle Drivetrains: Topology and Design Optimization. Appl. Sci. 2018, 8, 1351. [Google Scholar] [CrossRef] [Green Version]
- Gorji, S.A.; Sahebi, H.G.; Ektesabi, M.; Rad, A.B. Topologies and Control Schemes of Bidirectional DC–DC Power Converters: An Overview. IEEE Access 2019, 7, 117997–118019. [Google Scholar] [CrossRef]
- Xu, Q.; Vafamand, N.; Chen, L.; Dragičević, T.; Xie, L.; Blaabjerg, F. Review on Advanced Control Technologies for Bidirectional DC/DC Converters in DC Microgrids. IEEE J. Emerg. Sel. Top. Power Electron. 2021, 9, 1205–1221. [Google Scholar] [CrossRef]
- Chen, C.-J.; Zeng, Z.-Y.; Cheng, C.-H.; Lin, F.-T. Comprehensive Analysis and Design of Current-Balance Loop in Constant On-Time Controlled Multi-Phase Buck Converter. IEEE Access 2020, 8, 184752–184764. [Google Scholar] [CrossRef]
- Abu-Qahouq, J.A. Analysis and Design of N-Phase Current-Sharing Autotuning Controller. IEEE Trans. Power Electron. 2010, 25, 1641–1651. [Google Scholar] [CrossRef]
- Yao, Z.; Lu, S. A Simple Approach to Enhance the Effectiveness of Passive Currents Balancing in an Interleaved Multiphase Bidirectional DC–DC Converter. IEEE Trans. Power Electron. 2019, 34, 7242–7255. [Google Scholar] [CrossRef]
- Konjedic, T.; Korošec, L.; Truntič, M.; Restrepo, C.; Rodič, M.; Milanovič, M. DCM-Based Zero-Voltage Switching Control of a Bidirectional DC–DC Converter With Variable Switching Frequency. IEEE Trans. Power Electron. 2016, 31, 3273–3288. [Google Scholar] [CrossRef]
- Li, J.; Sullivan, C.R.; Schultz, A. Coupled-inductor design optimization for fast-response low-voltage DC-DC converters. In Proceedings of the APEC. Seventeenth Annual IEEE Applied Power Electronics Conference and Exposition, Dallas, TX, USA, 10–14 March 2002; Volume 2, pp. 817–823. [Google Scholar] [CrossRef] [Green Version]
- Forest, F.; Meynard, T.A.; Laboure, E.; Costan, V.; Sarraute, E.; Cuniere, A.; Martire, T. Optimization of the Supply Voltage System in Interleaved Converters Using Intercell Transformers. IEEE Trans. Power Electron. 2007, 22, 934–942. [Google Scholar] [CrossRef]
- Nagaraja, H.N.; Kastha, D.; Petra, A. Design Principles of a Symmetrically Coupled Inductor Structure for Multiphase Synchronous Buck Converters. IEEE Trans. Ind. Electron. 2011, 58, 988–997. [Google Scholar] [CrossRef]
- He, L.; Lin, Z.; Tan, Q.; Lu, F.; Zeng, T. Interleaved High Step-Up Current Sharing Converter with Coupled Inductors. Electronics 2021, 10, 436. [Google Scholar] [CrossRef]
- Zhang, S. Analysis and minimization of the input current ripple of Interleaved Boost Converter. In Proceedings of the 2012 Twenty-Seventh Annual IEEE Applied Power Electronics Conference and Exposition (APEC), Orlando, FL, USA, 5–9 February 2012; pp. 852–856. [Google Scholar] [CrossRef]
- Grbović, P.J. Closed form analysis of N-cell interleaved two-level DC-DC converters: The DC bus capacitor current stress. In Proceedings of the 2013 IEEE ECCE Asia Downunder, Melbourne, VIC, Australia, 3–6 June 2013; pp. 122–129. [Google Scholar] [CrossRef]
- Shi, L.; Crow, M.L. Comparison of ultracapacitor electric circuit models. In Proceedings of the 2008 IEEE Power and Energy Society General Meeting—Conversion and Delivery of Electrical Energy in the 21st Century, Pittsburgh, PA, USA, 20–24 July 2008; pp. 1–6. [Google Scholar] [CrossRef]
- Şahİn, M.E.; Blaabjerg, F.; Sangwongwanİch, A. Modelling of supercapacitors based on simplified equivalent circuit. CPSS Trans. Power Electron. Appl. 2021, 6, 31–39. [Google Scholar] [CrossRef]
- Cabrane, Z.; Lee, S.H. Electrical and Mathematical Modeling of Supercapacitors: Comparison. Energies 2022, 15, 693. [Google Scholar] [CrossRef]
- Berrueta, A.; Ursúa, A.; Martín, I.S.; Eftekhari, A.; Sanchis, P. Supercapacitors: Electrical Characteristics, Modeling, Applications, and Future Trends. IEEE Access 2019, 7, 50869–50896. [Google Scholar] [CrossRef]
Figure 1.
Supercapacitor energy storage integration into a 48 V DC microgrid.
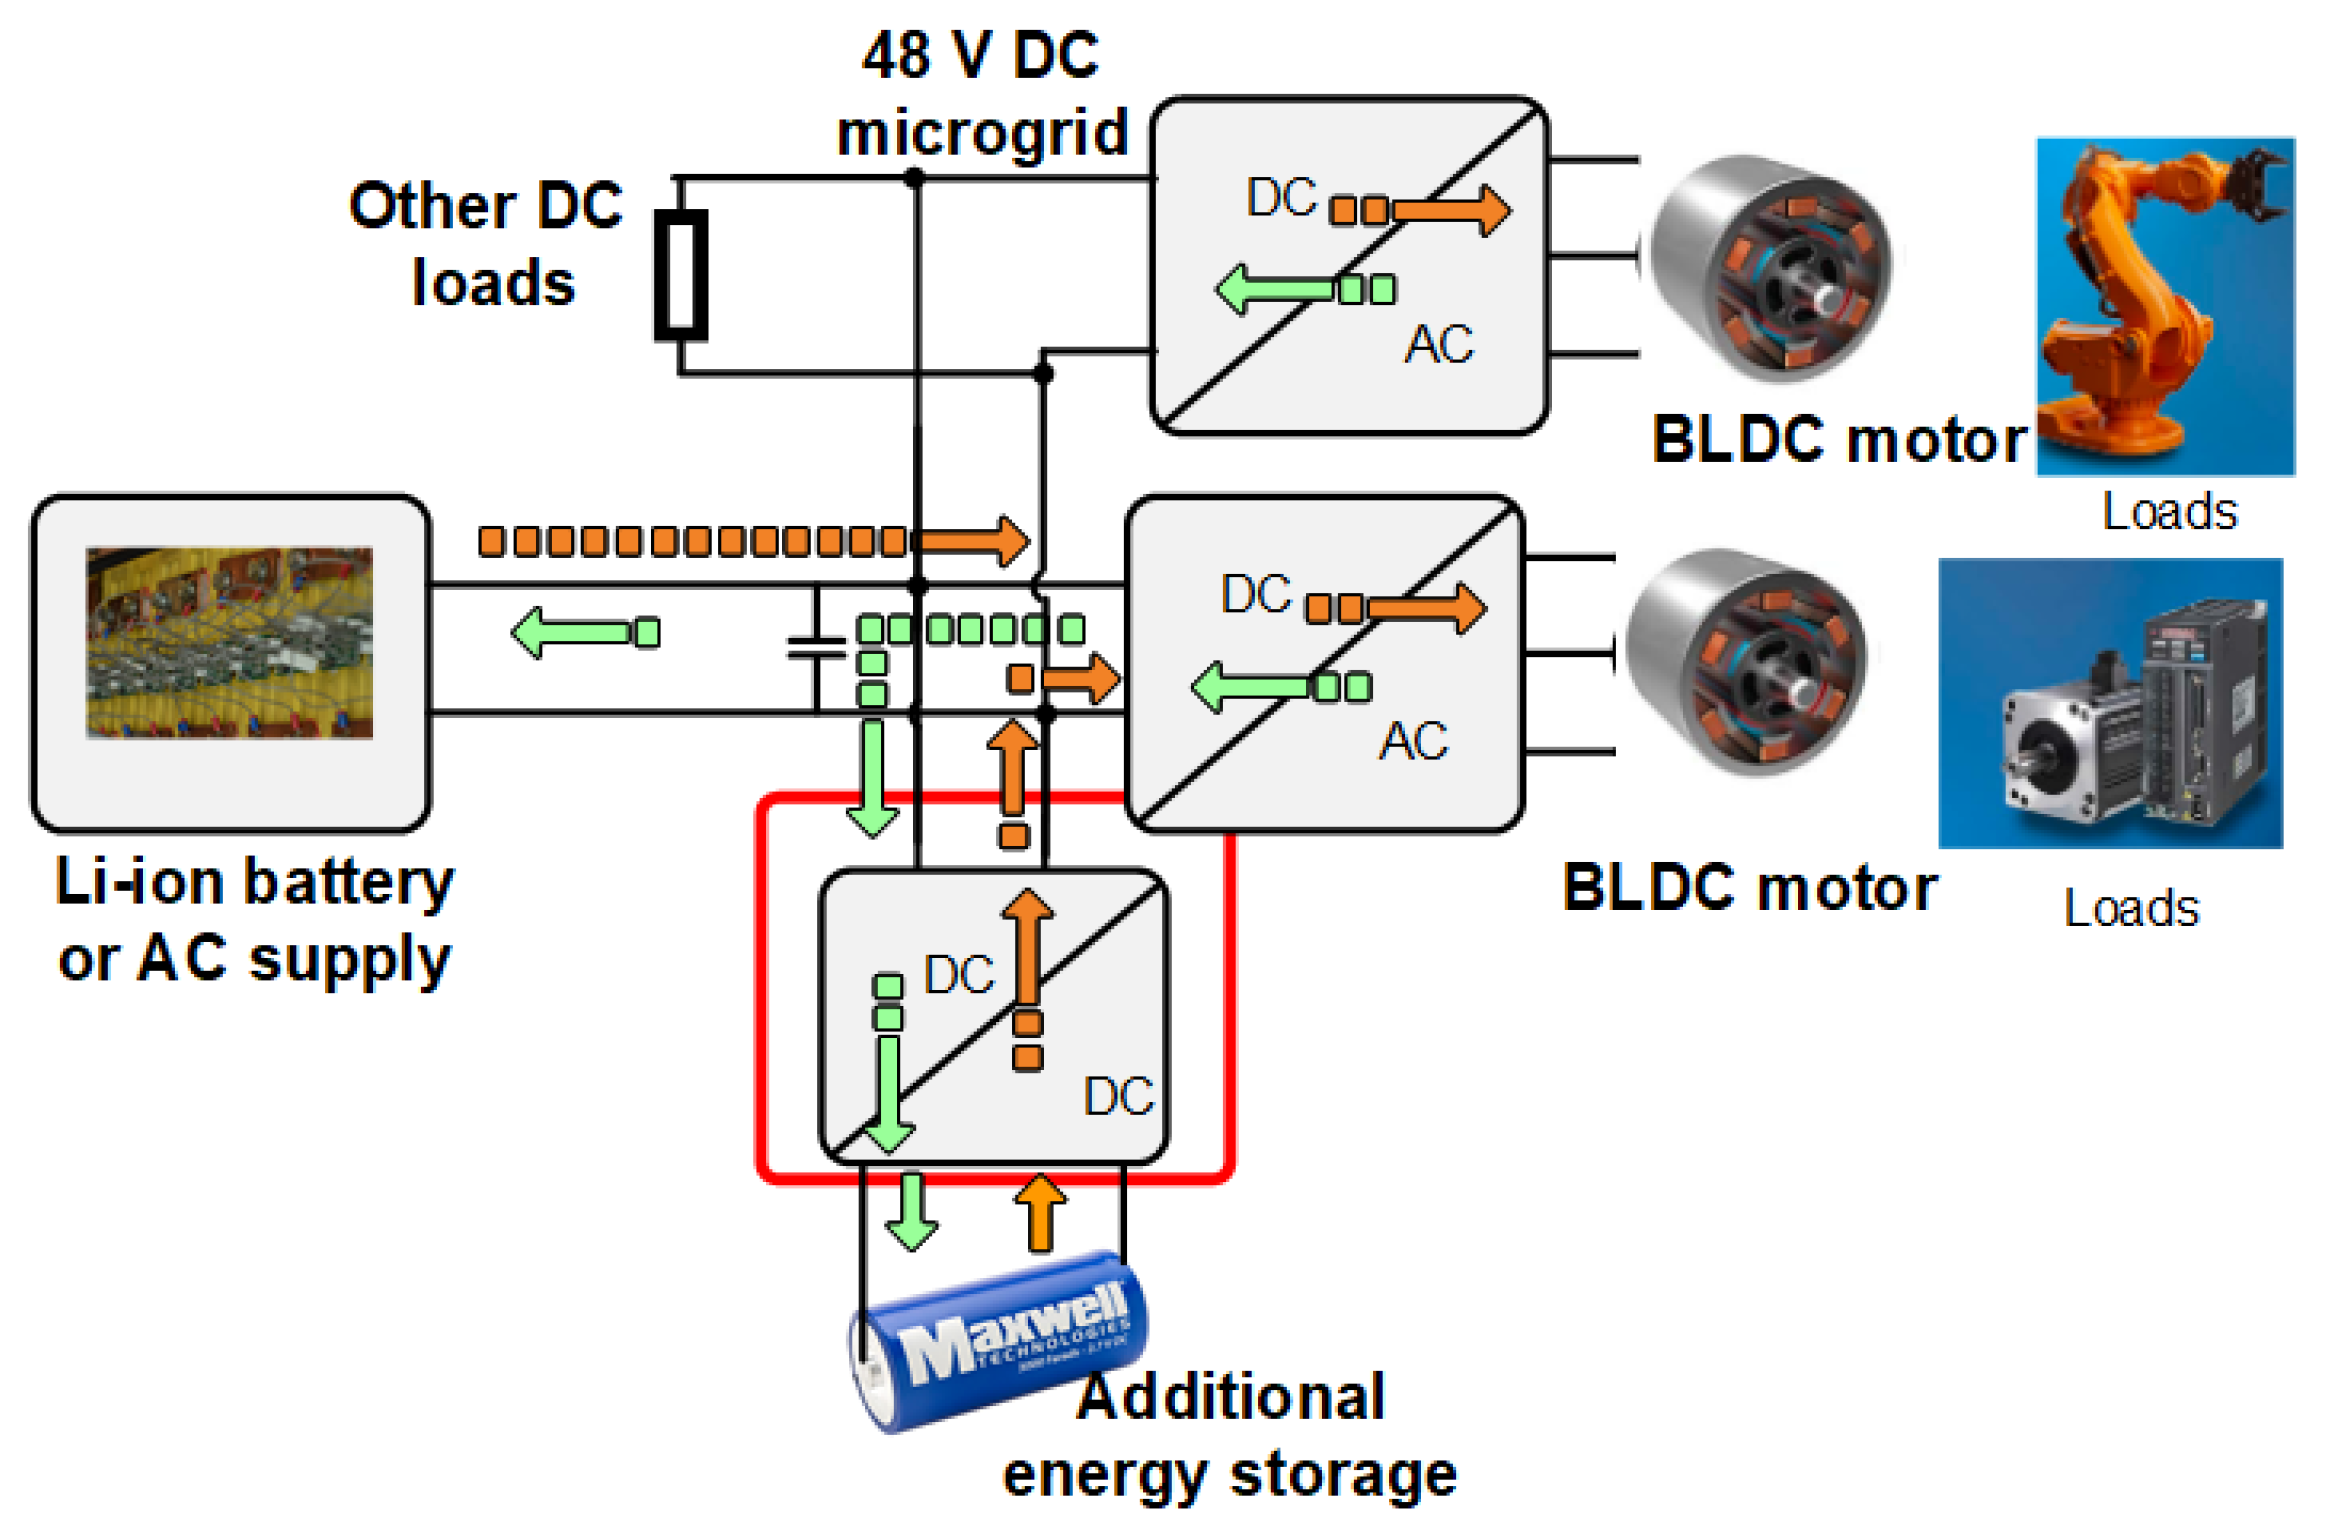
Figure 2.
(a) Basic schematics of interleaved bidirectional DC–DC converter for supercapacitor energy storage integration into a DC microgrid; (b) theoretical waveforms of per-phase currents.
Figure 2.
(a) Basic schematics of interleaved bidirectional DC–DC converter for supercapacitor energy storage integration into a DC microgrid; (b) theoretical waveforms of per-phase currents.
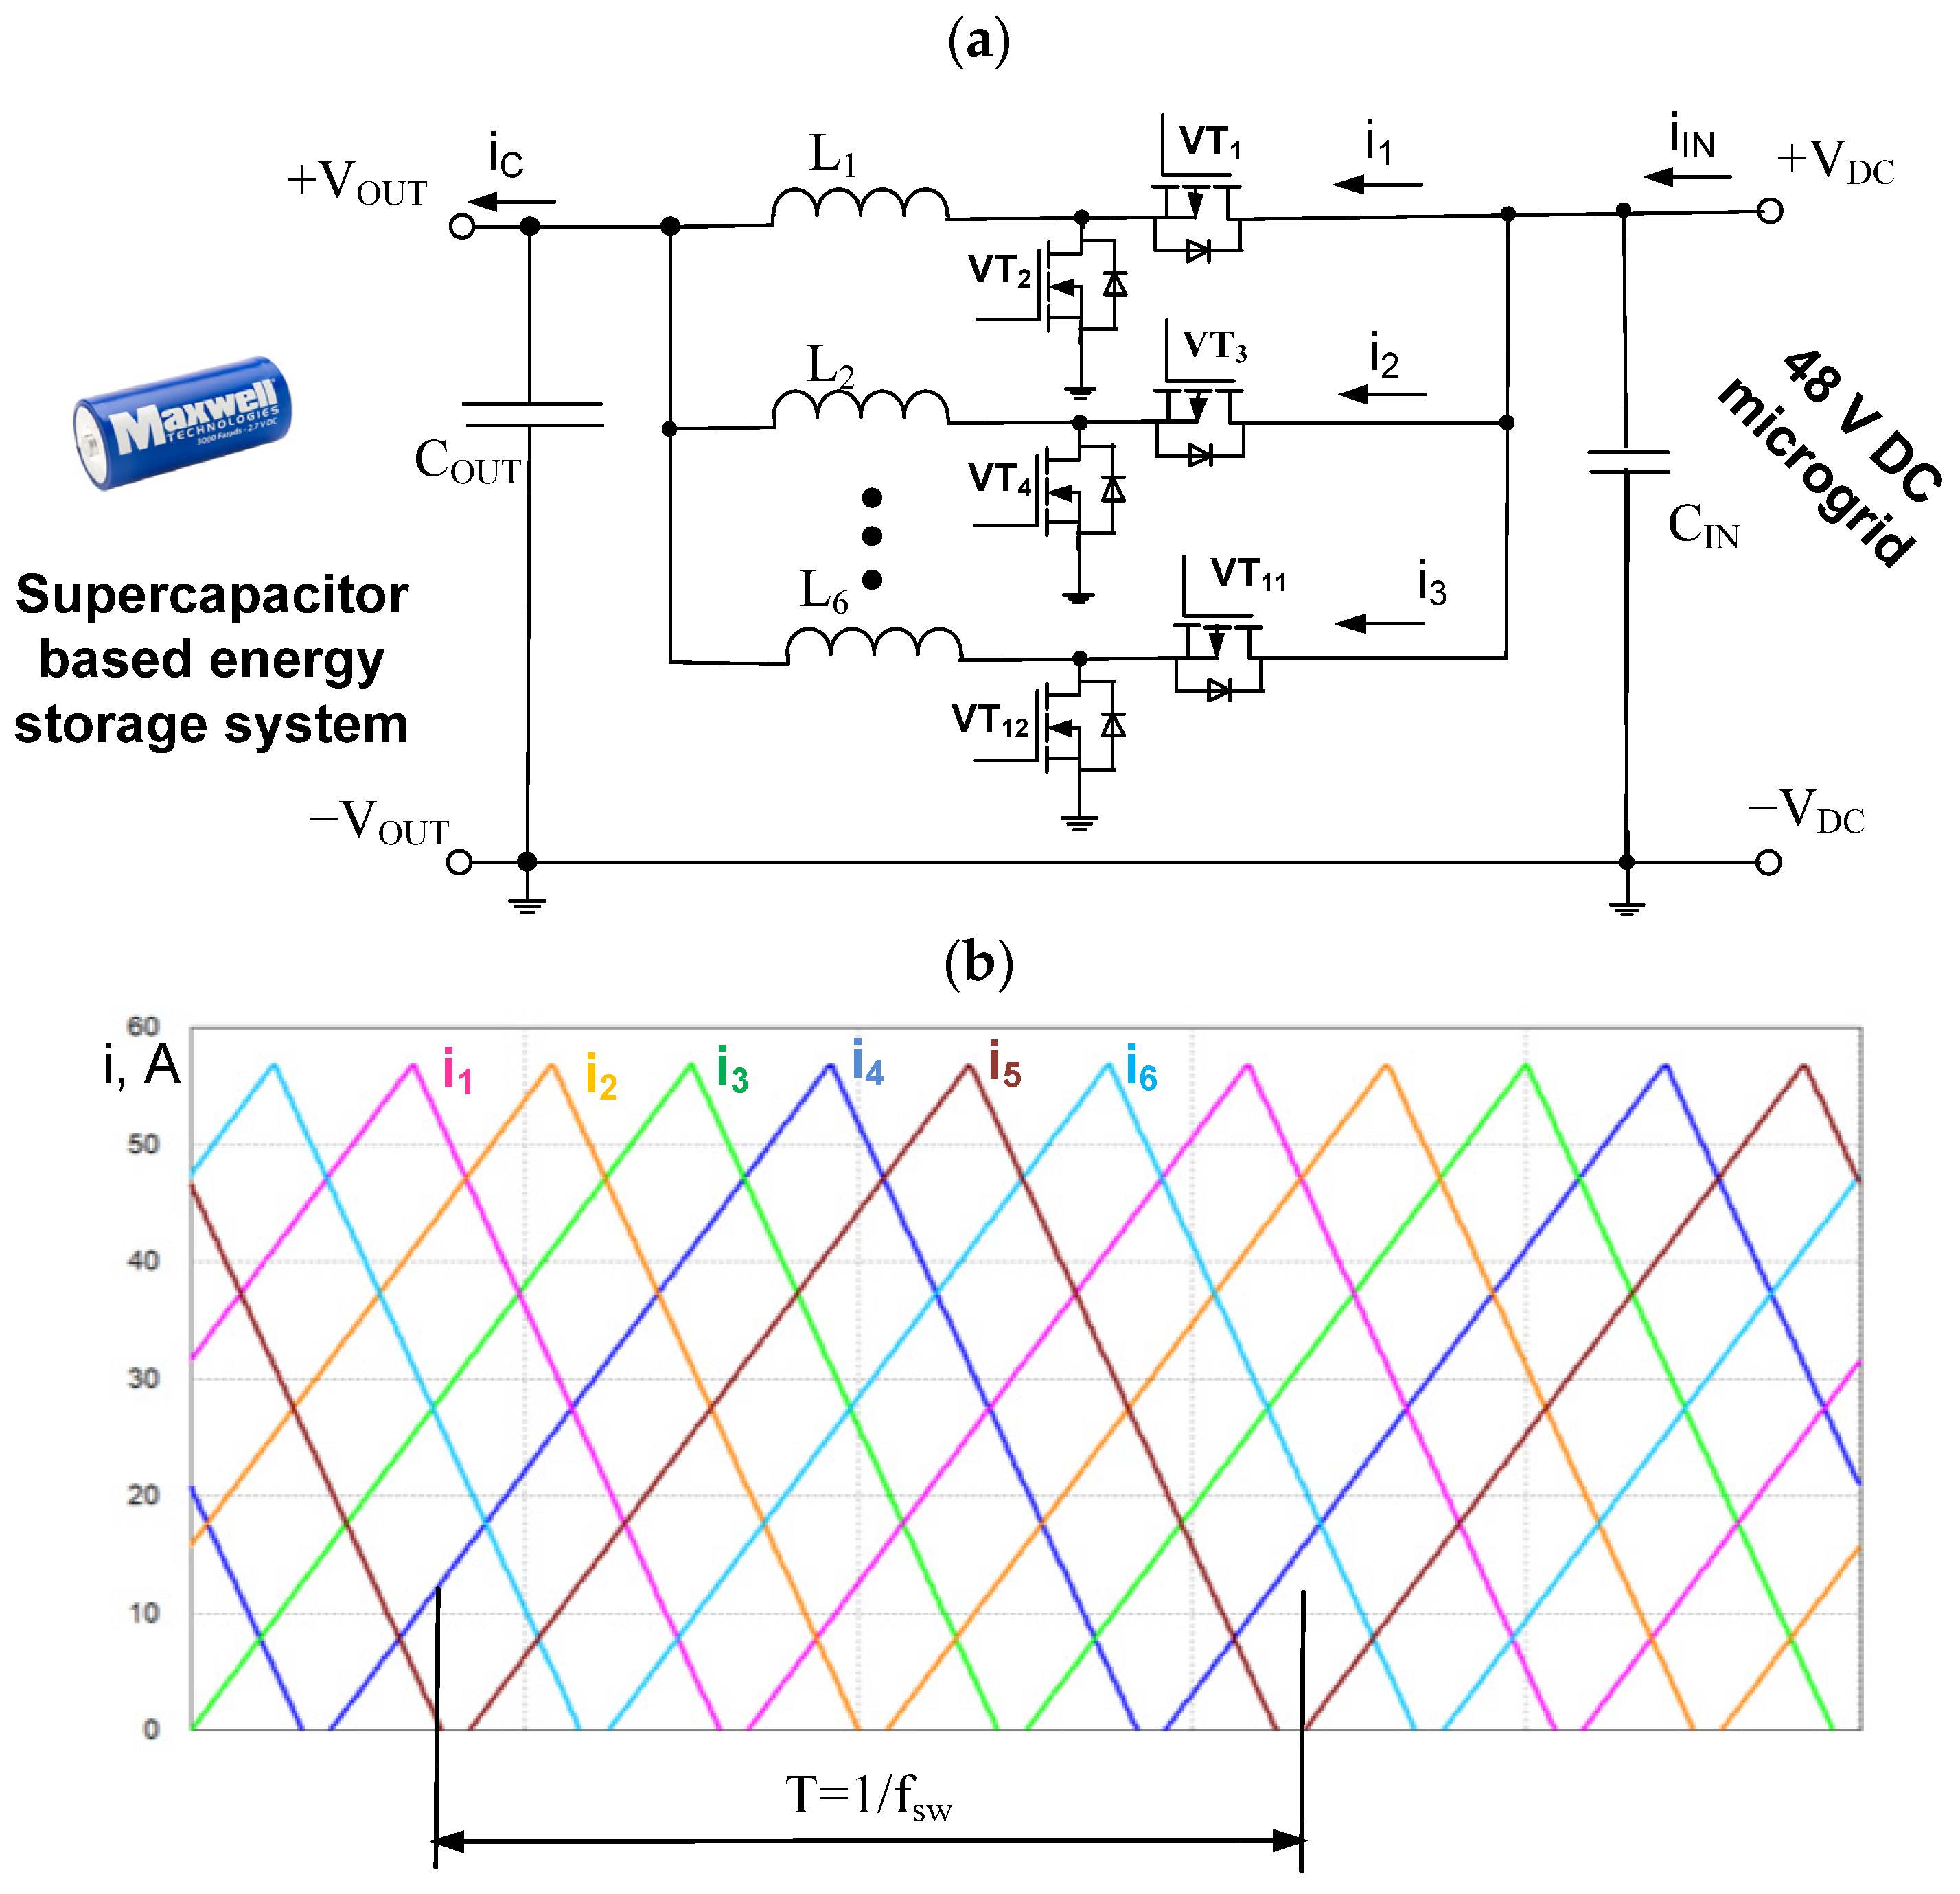
Figure 3.
Relative current pulsations diagrams of interleaved bidirectional DC–DC converter for energy storage integration into DC microgrid.
Figure 3.
Relative current pulsations diagrams of interleaved bidirectional DC–DC converter for energy storage integration into DC microgrid.
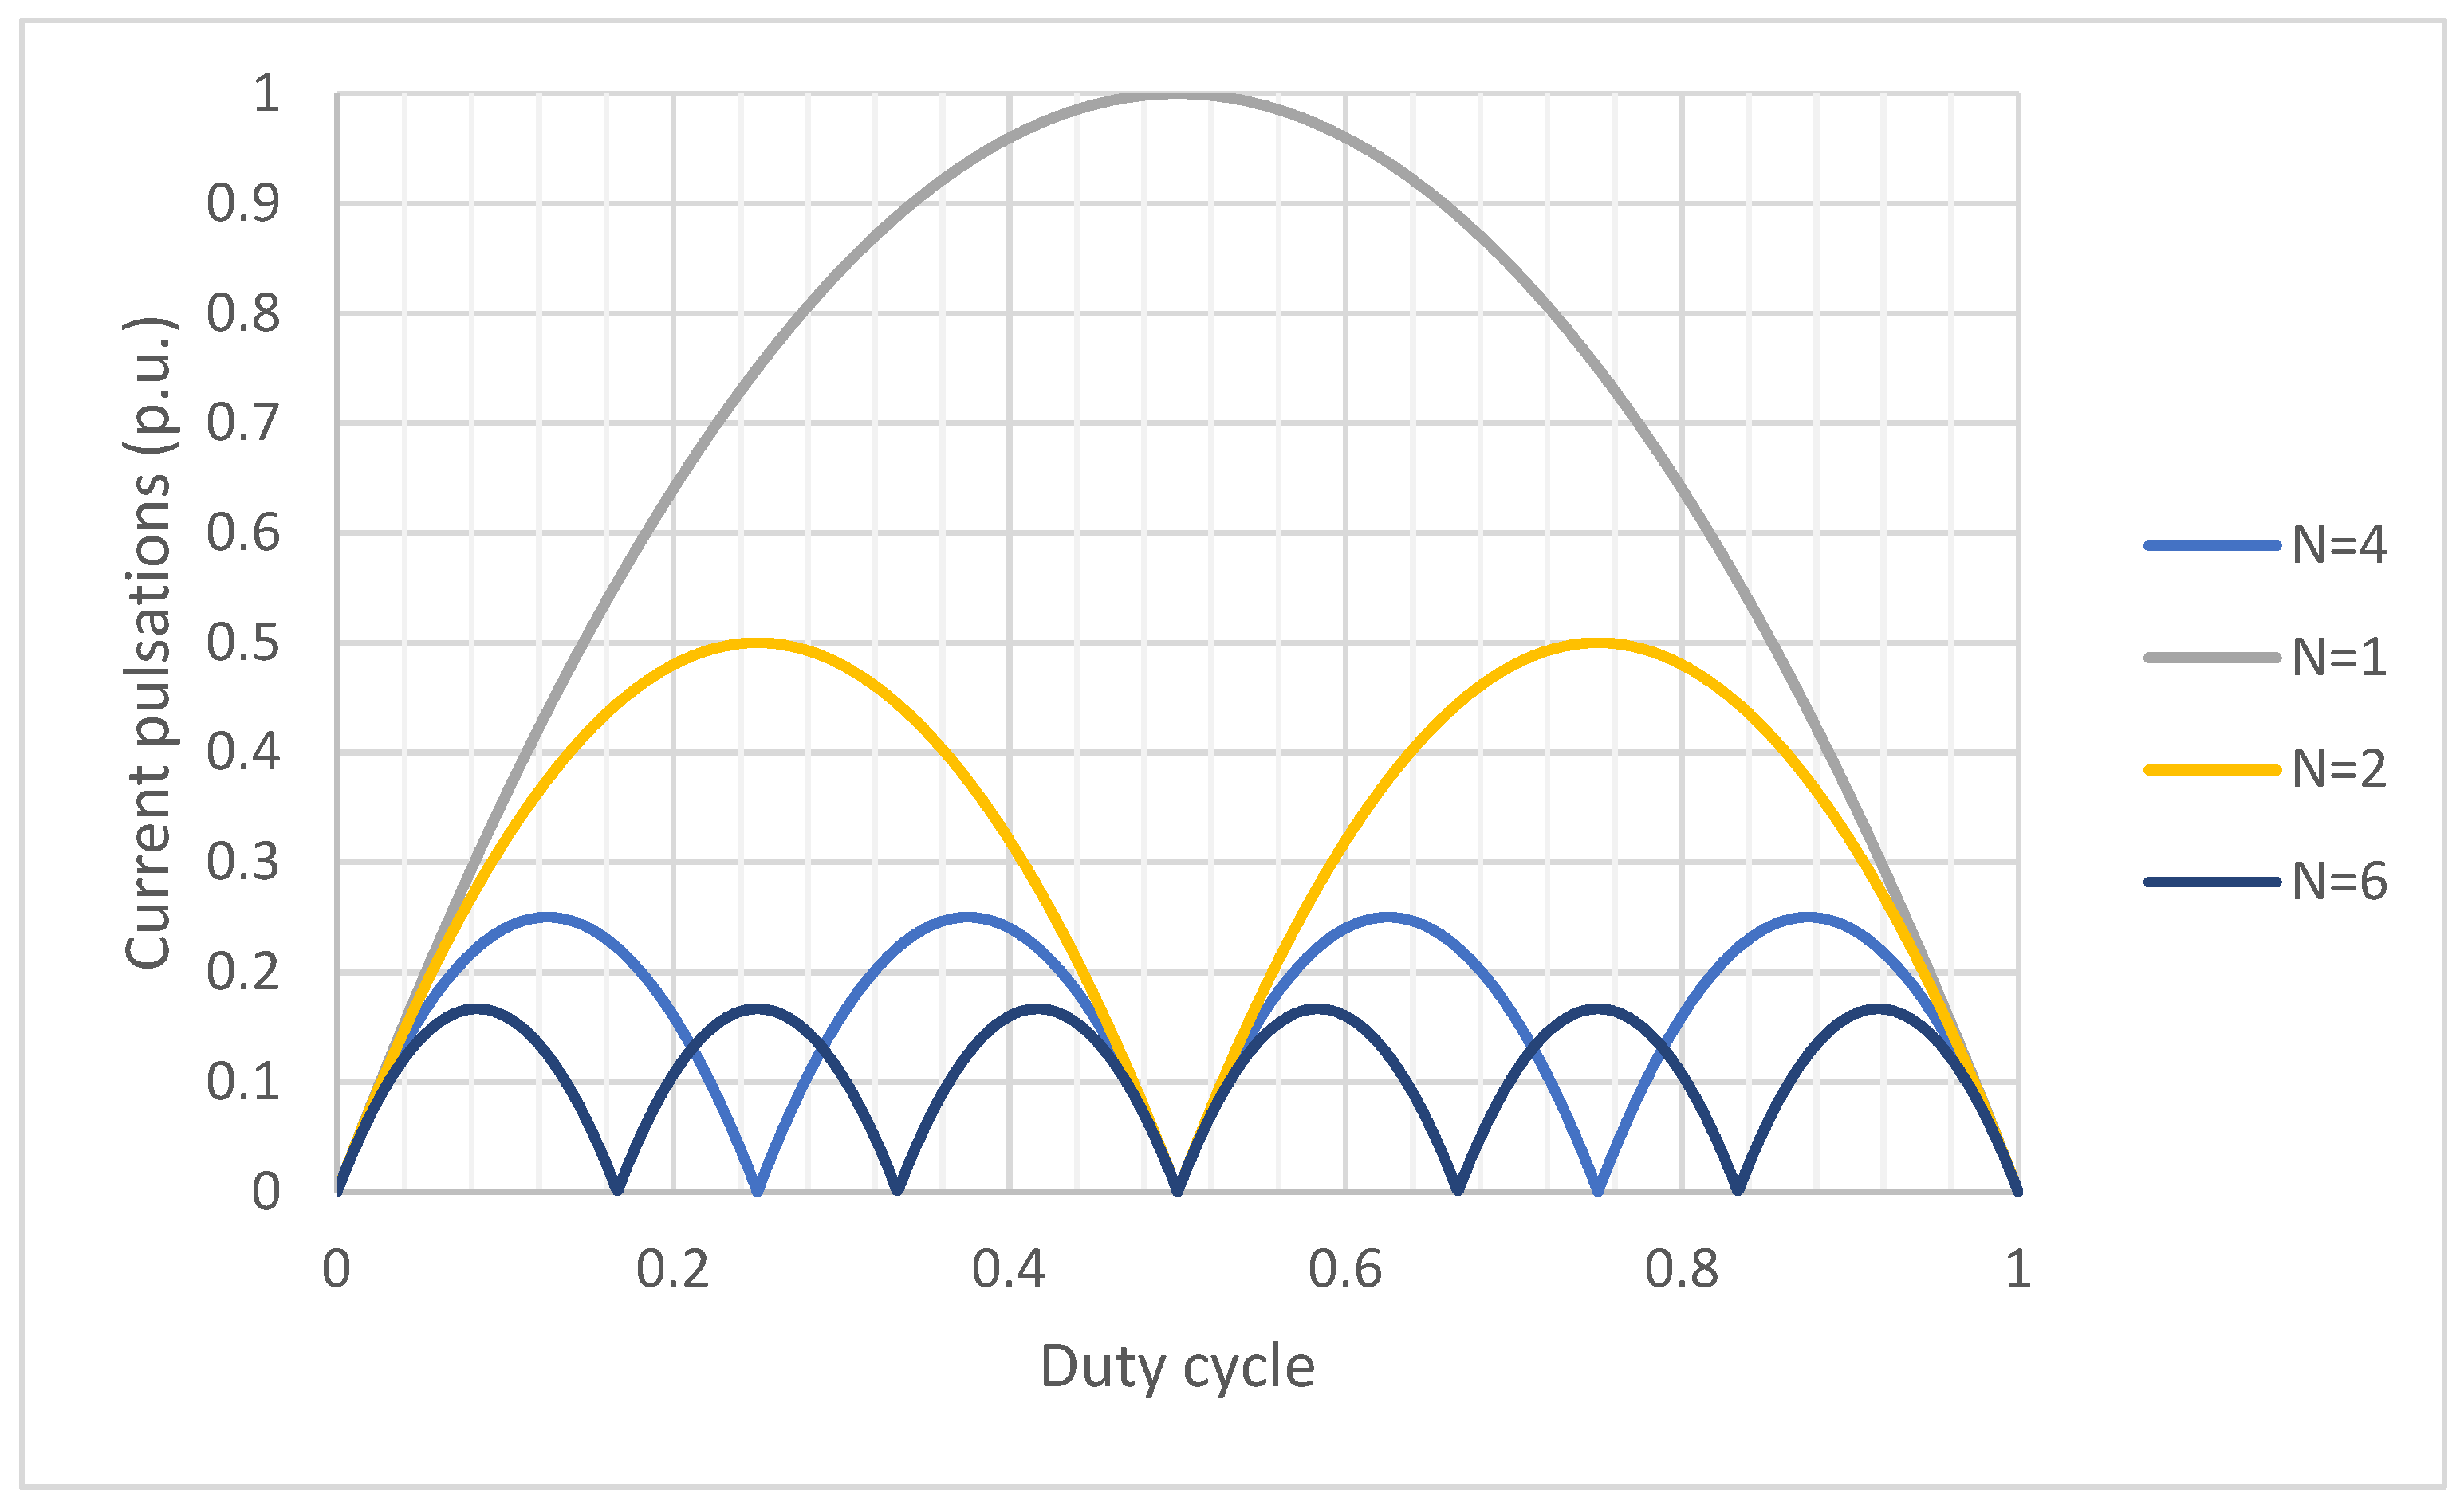
Figure 4.
Theoretical duty cycle values with zero-current ripple at different number of phases of interleaved DC–DC converter.
Figure 4.
Theoretical duty cycle values with zero-current ripple at different number of phases of interleaved DC–DC converter.
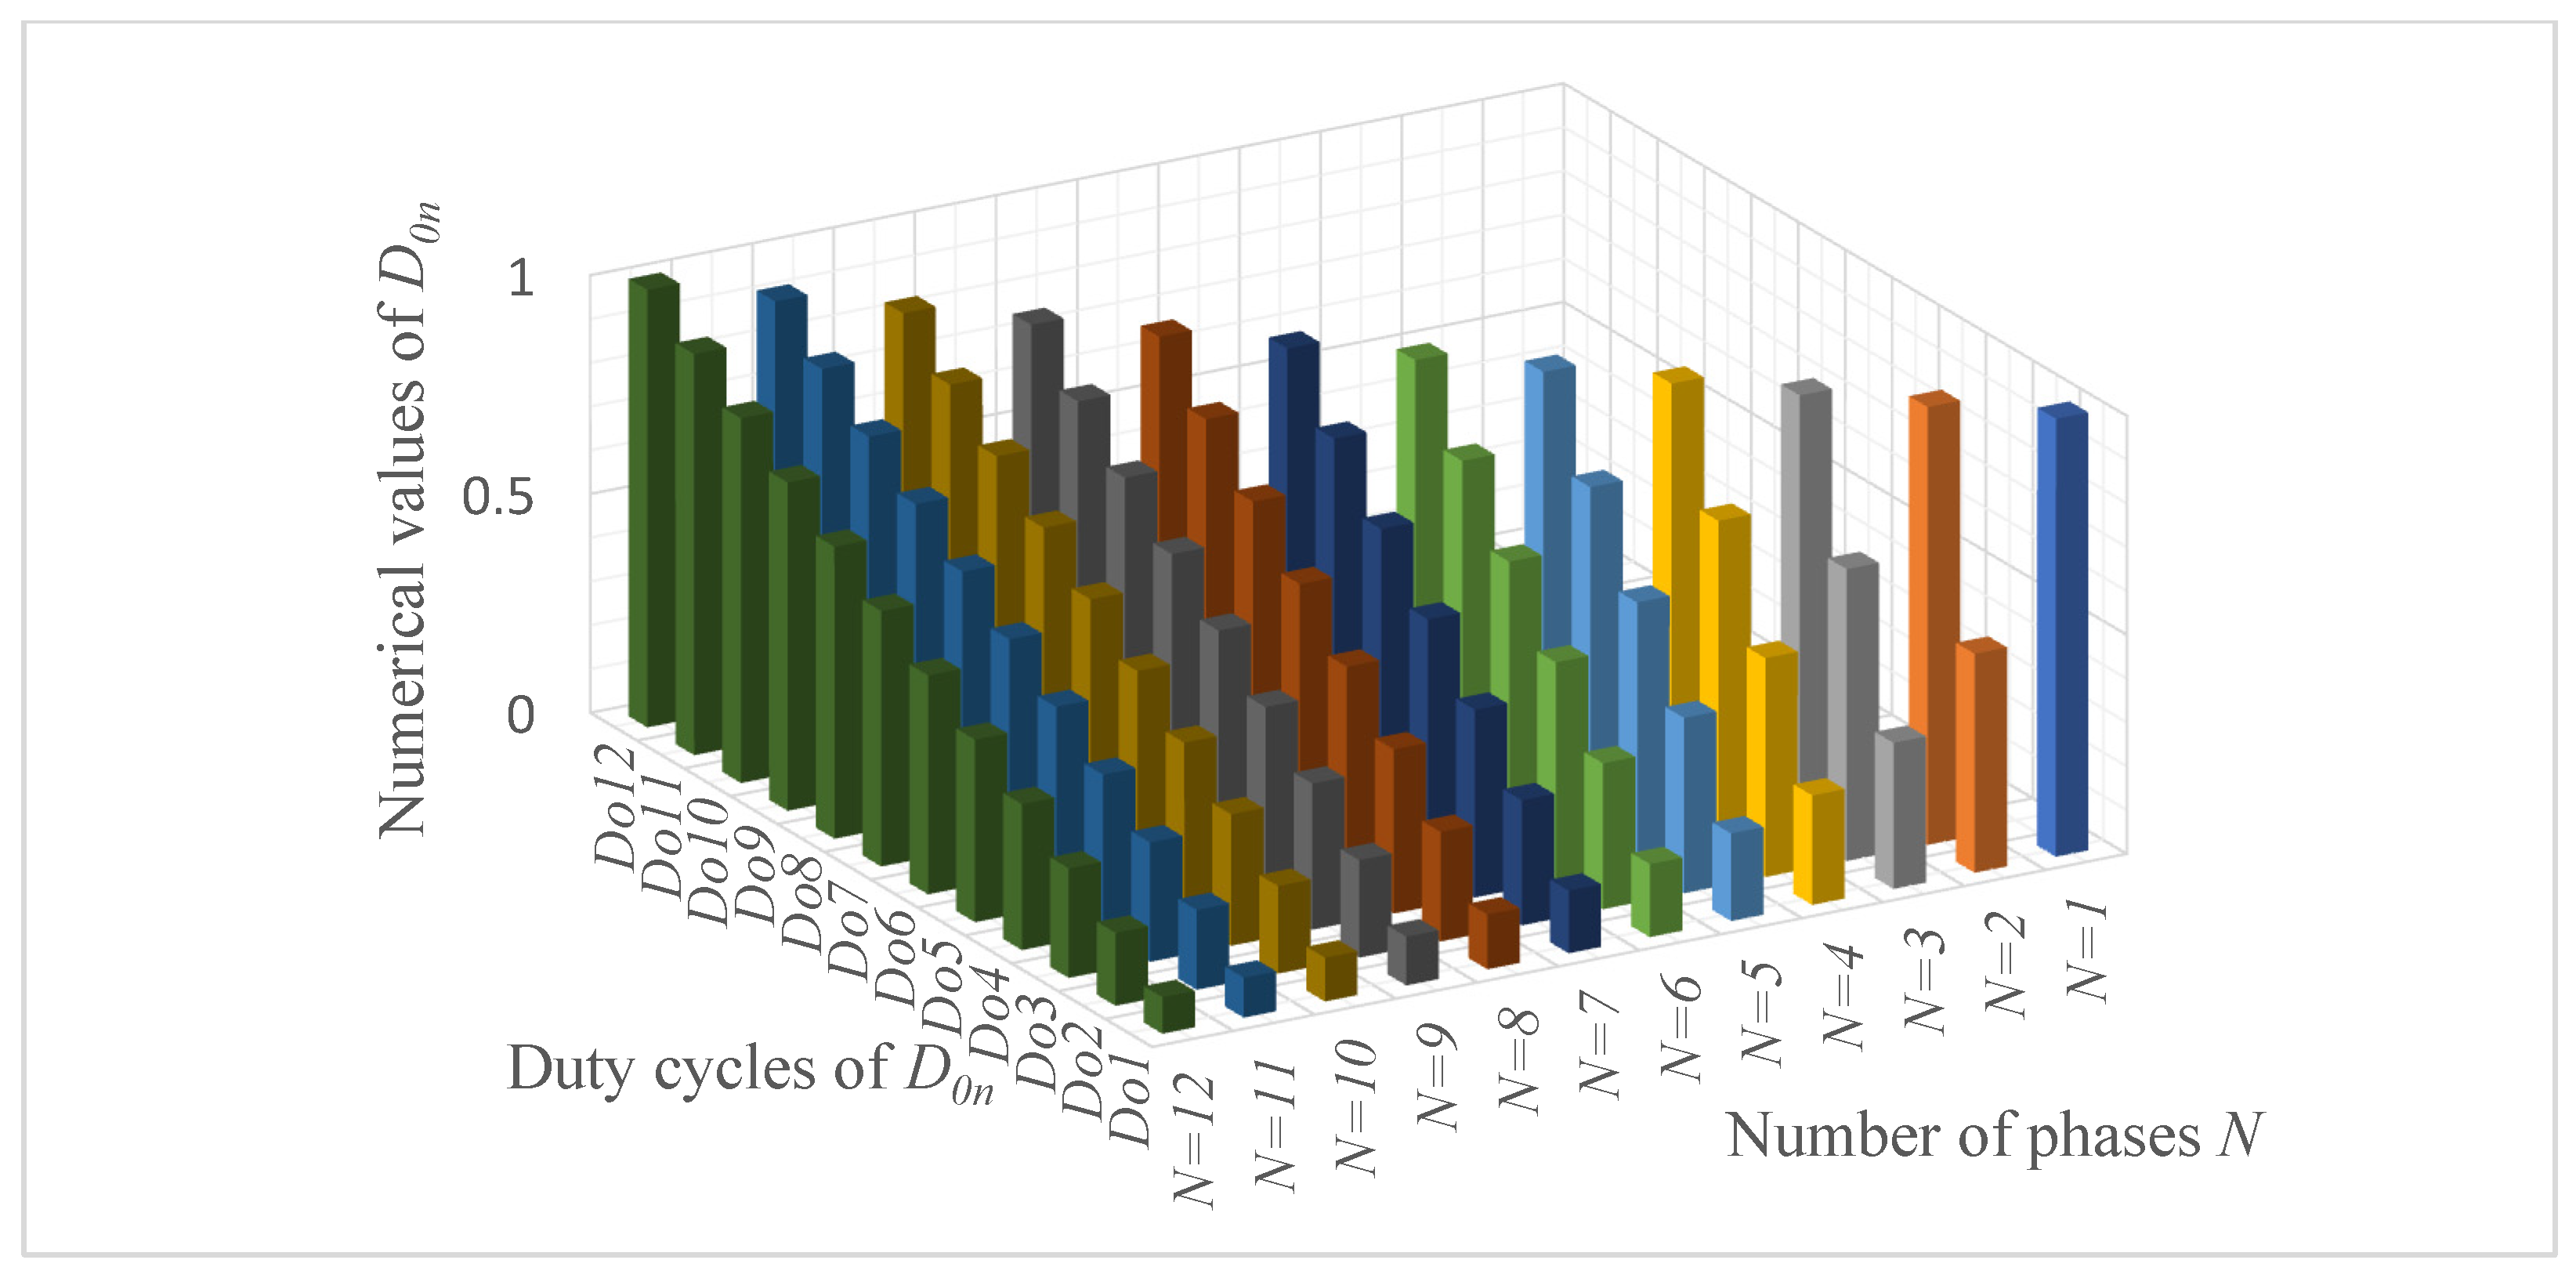
Figure 5.
Output voltage values with zero-current ripple corresponding to certain duty cycles at different numbers of phases of interleaved DC–DC converter.
Figure 5.
Output voltage values with zero-current ripple corresponding to certain duty cycles at different numbers of phases of interleaved DC–DC converter.
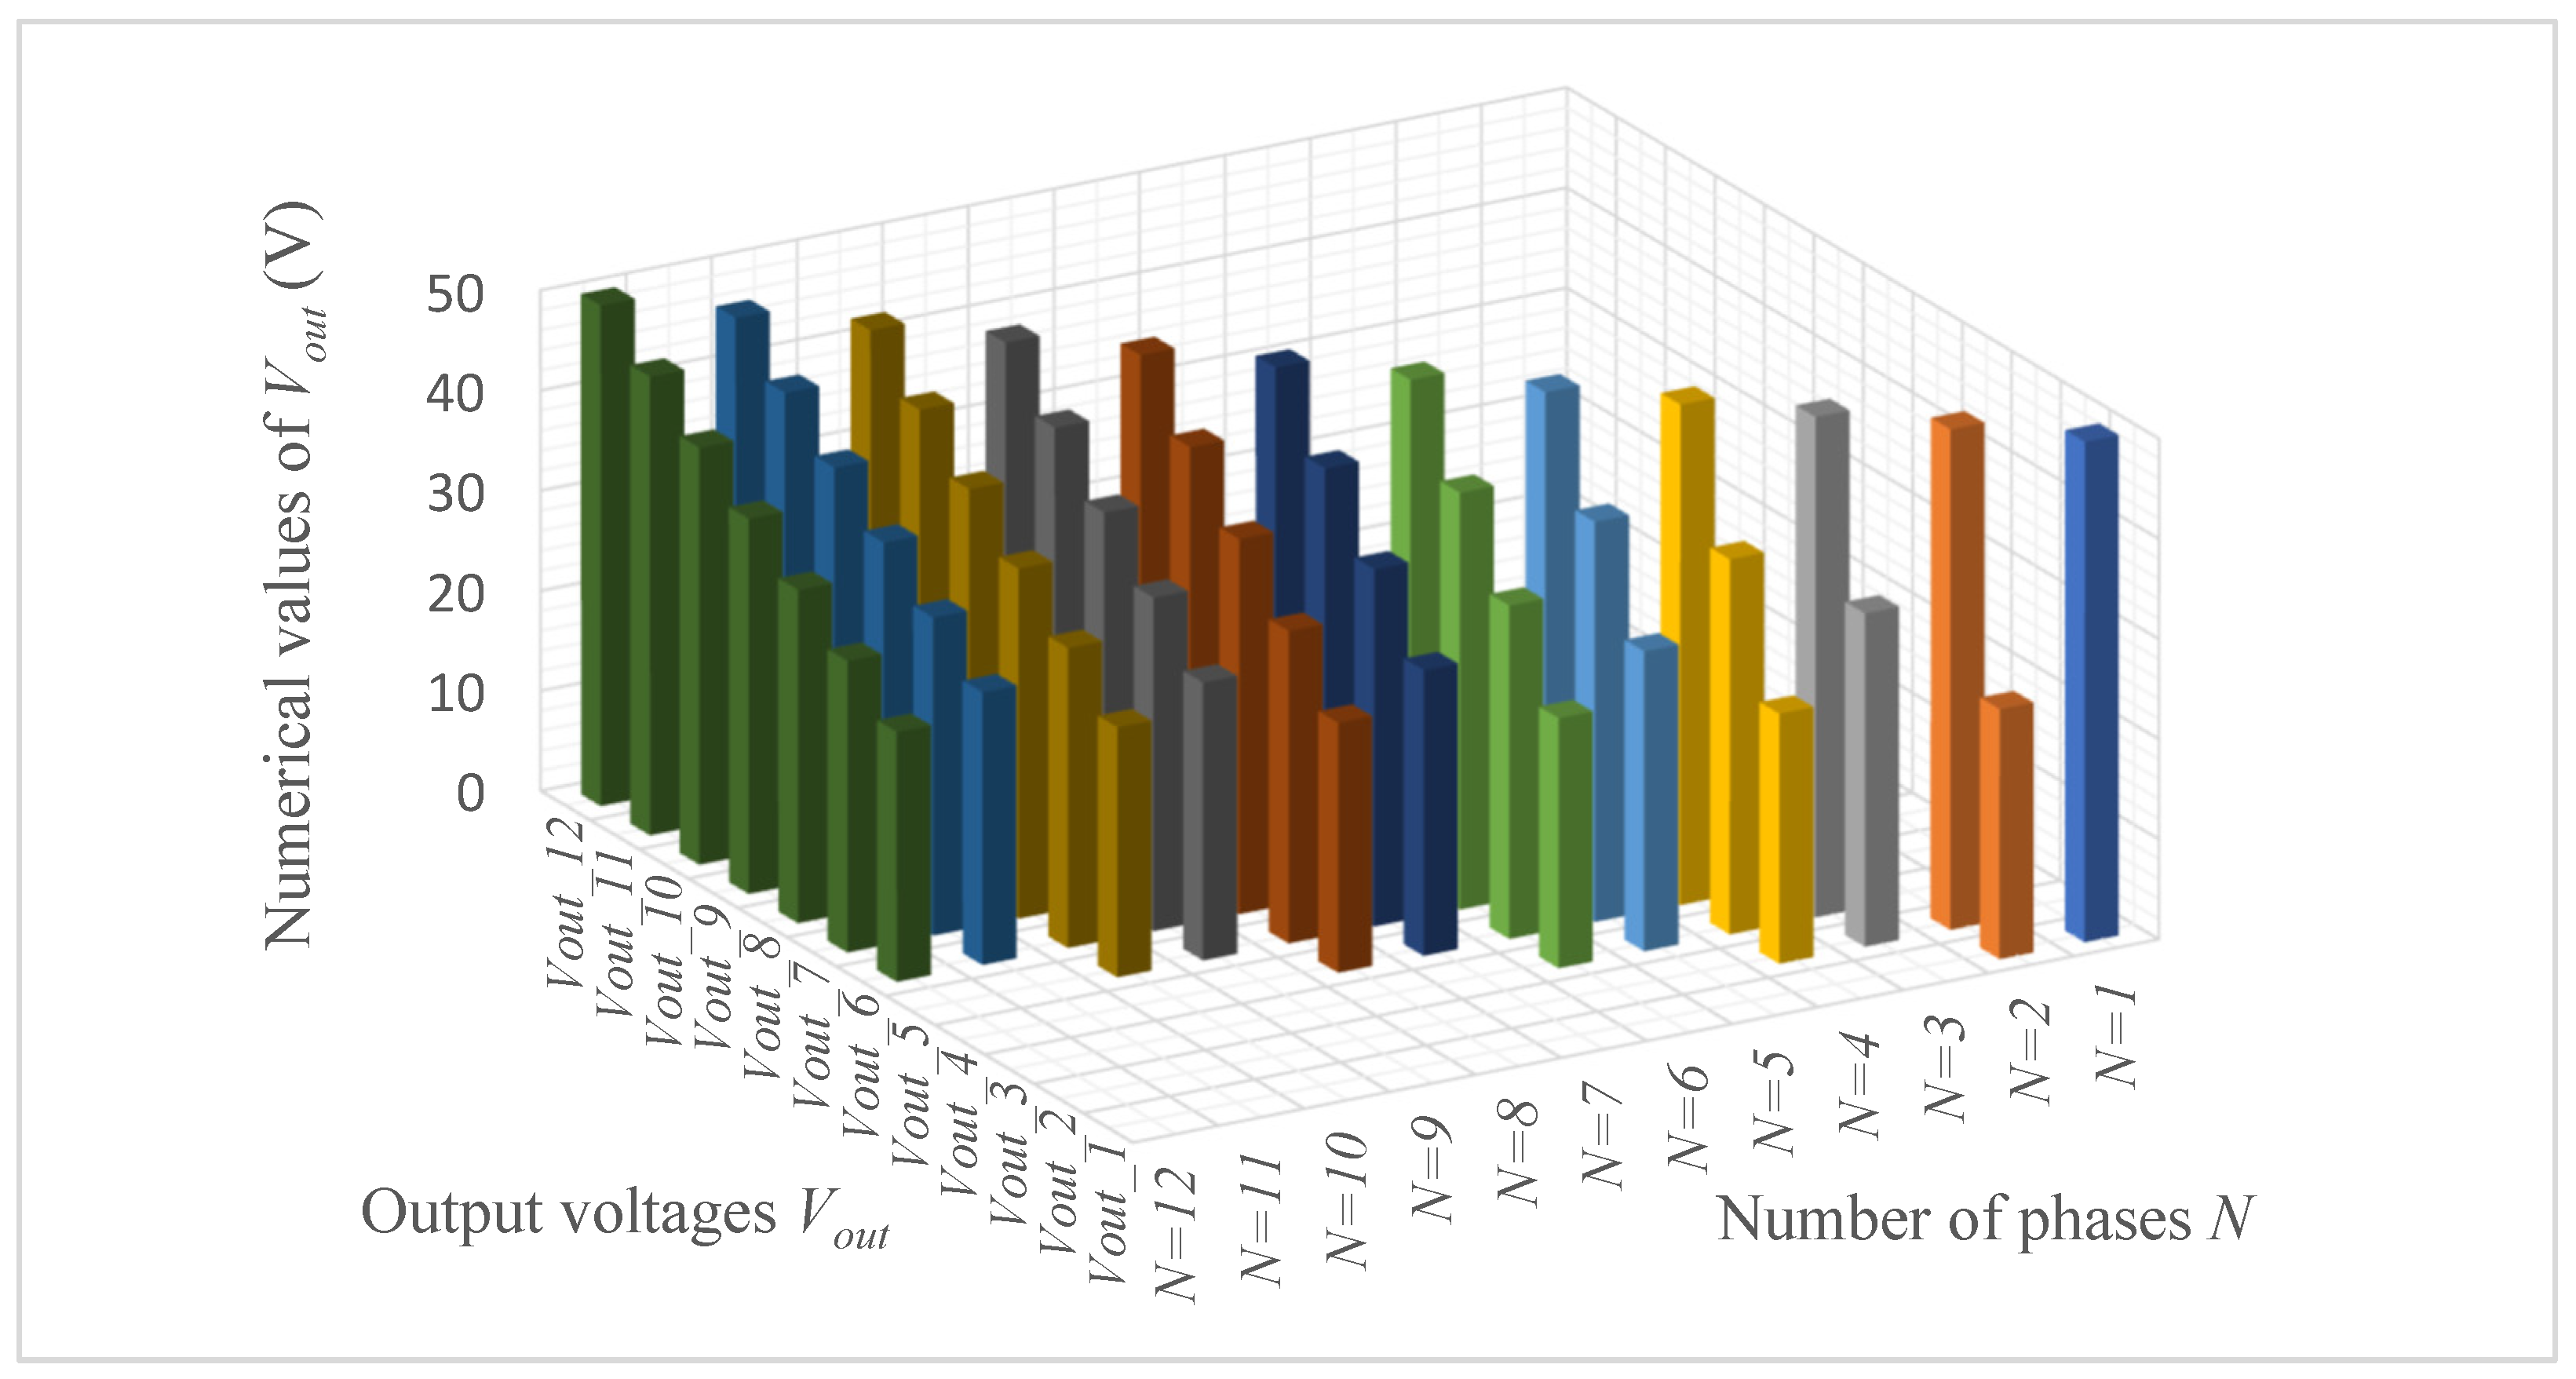
Figure 6.
Charging and discharging circuits in SC series connection for theoretical analysis.
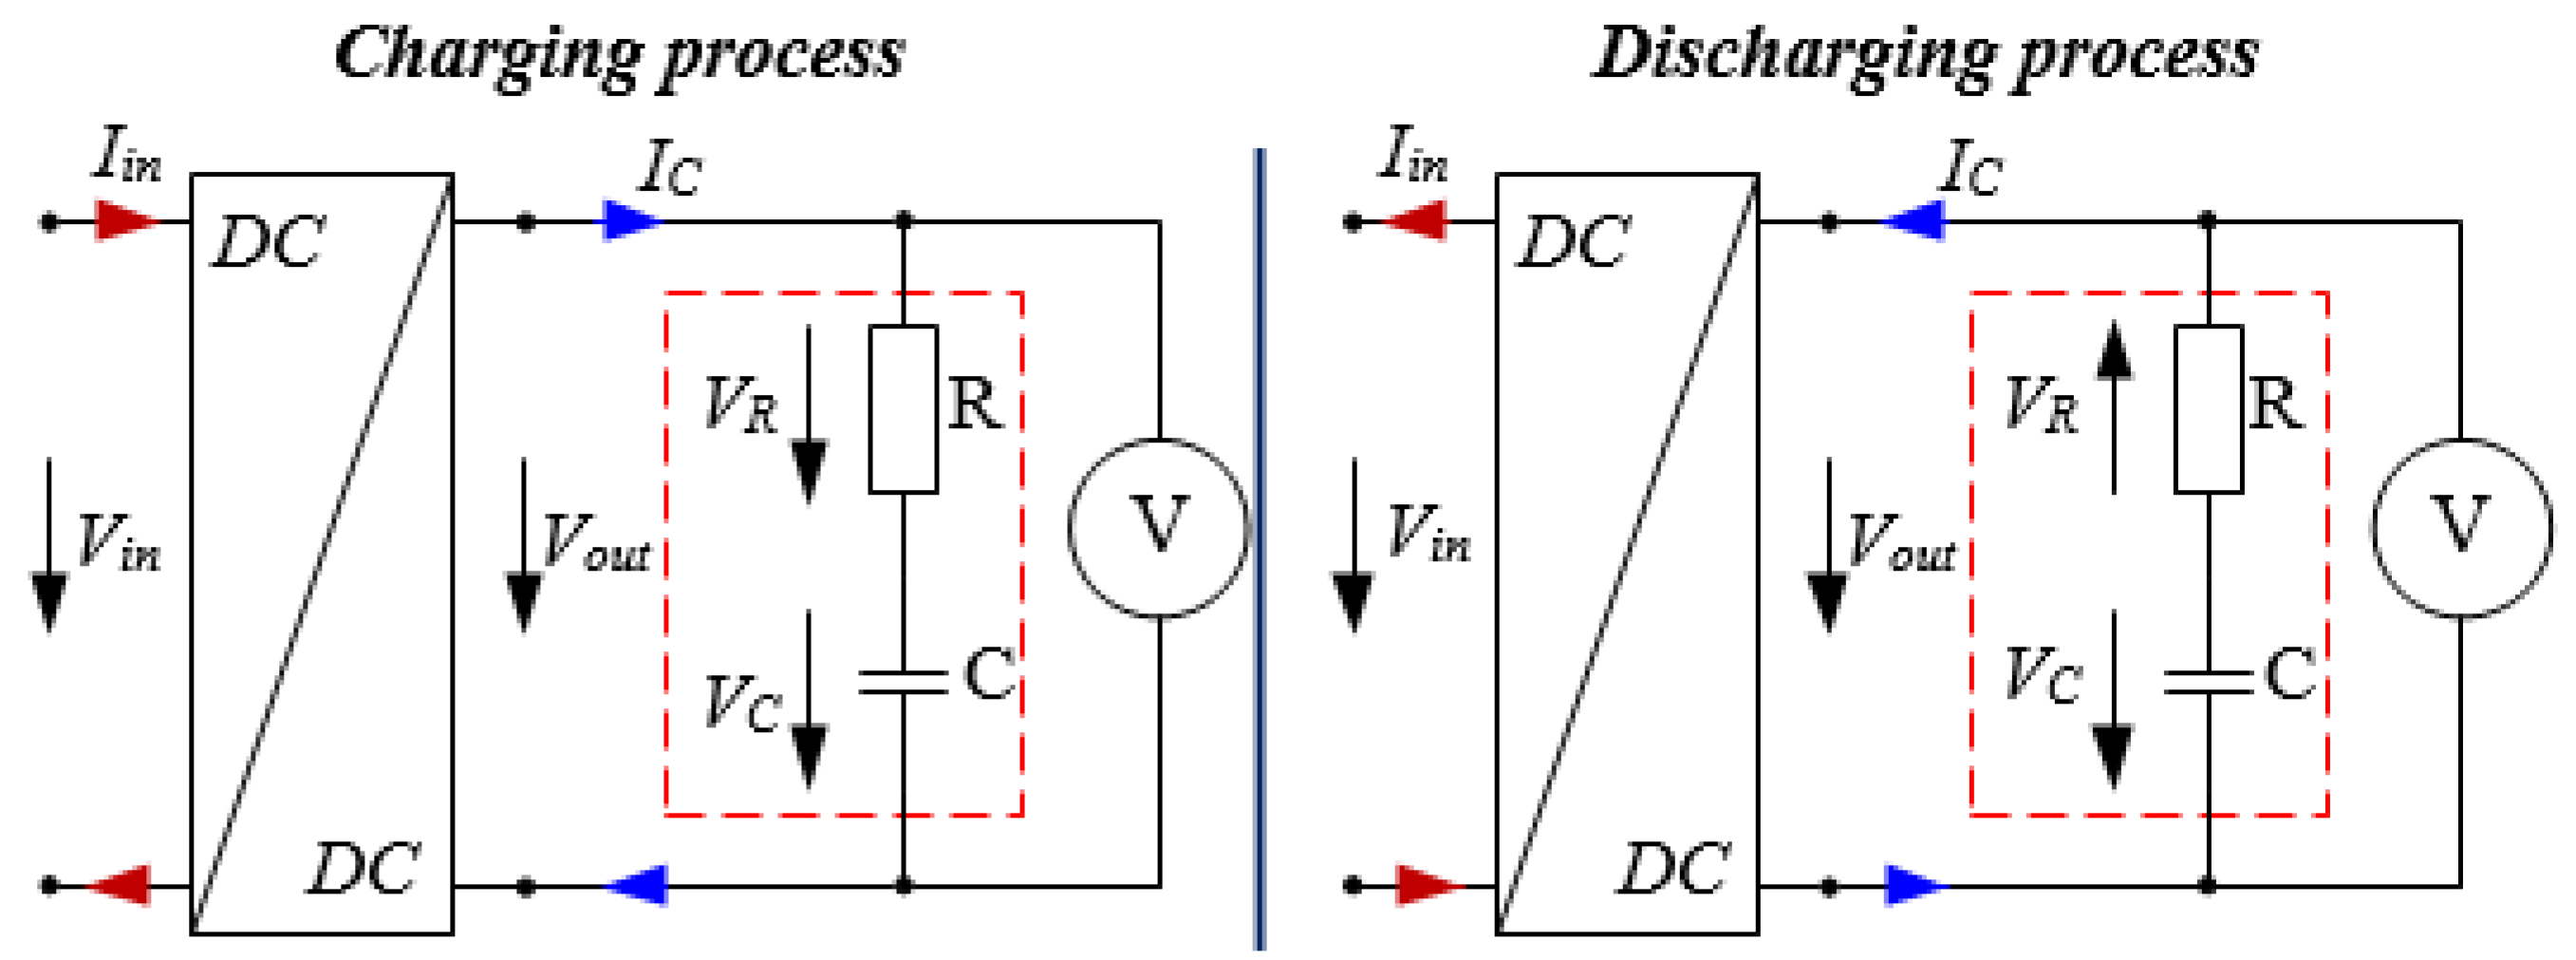
Figure 7.
SC charging and discharging with a constant voltage.

Figure 8.
Charging, discharging, and total charging/discharging efficiency comparative diagrams of the SC circuit with 24 V initial voltage and various charging voltages.
Figure 8.
Charging, discharging, and total charging/discharging efficiency comparative diagrams of the SC circuit with 24 V initial voltage and various charging voltages.
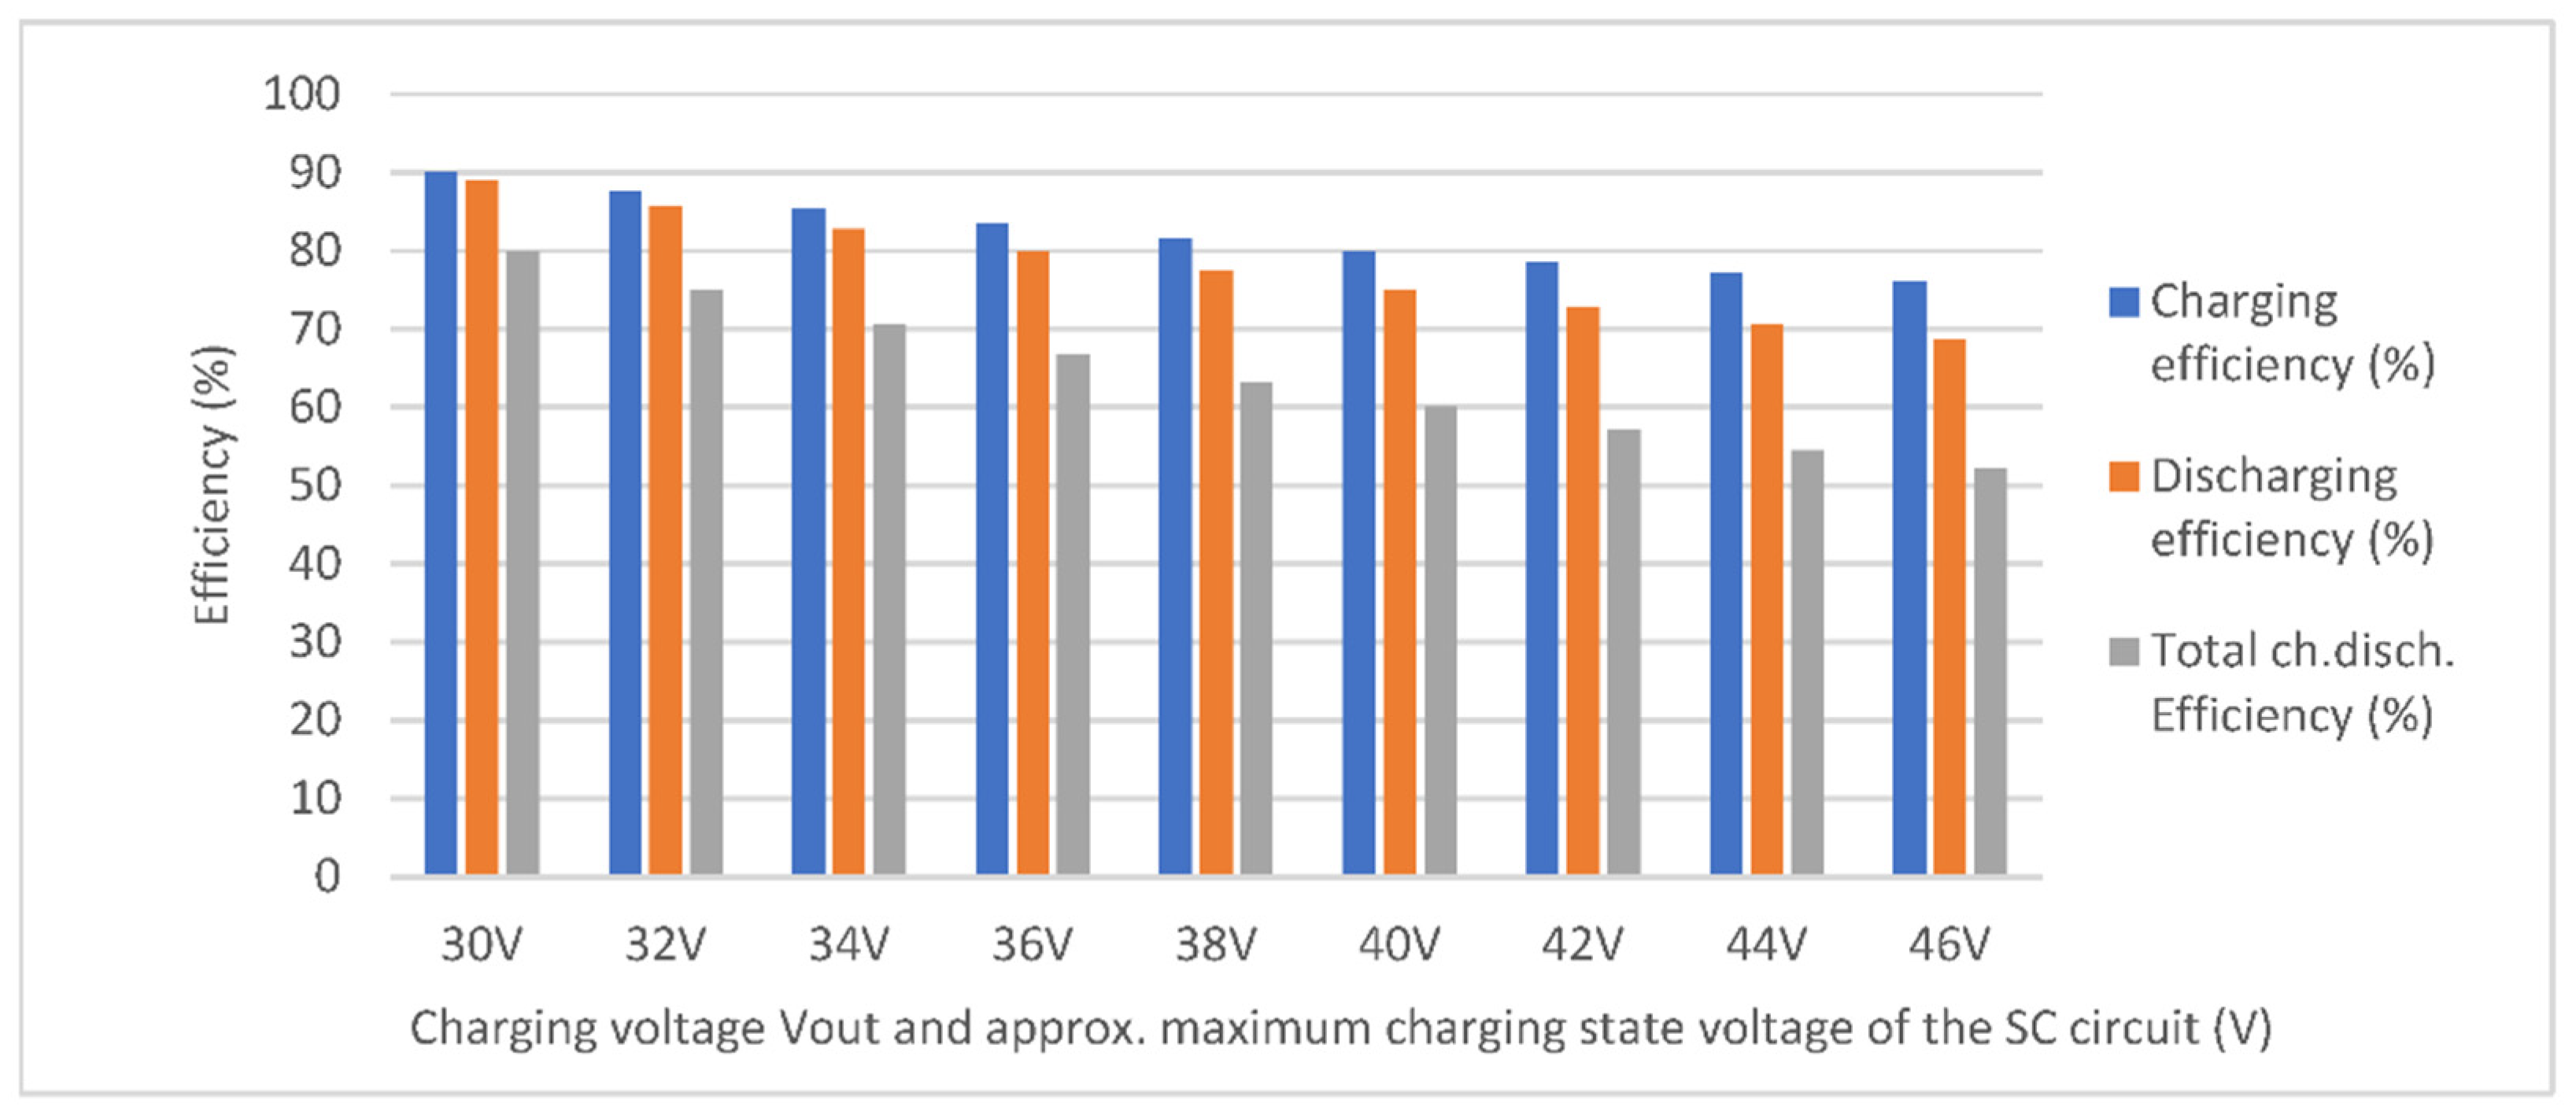
Figure 9.
Voltage variations during charging/discharging in the case of five phases with ∆Vx = 1 V.

Figure 10.
Time and lost energy during charging and discharging at different charging/discharging stages and total charging/discharging efficiencies in the case of five phases with ∆Vx = 1 V.
Figure 10.
Time and lost energy during charging and discharging at different charging/discharging stages and total charging/discharging efficiencies in the case of five phases with ∆Vx = 1 V.
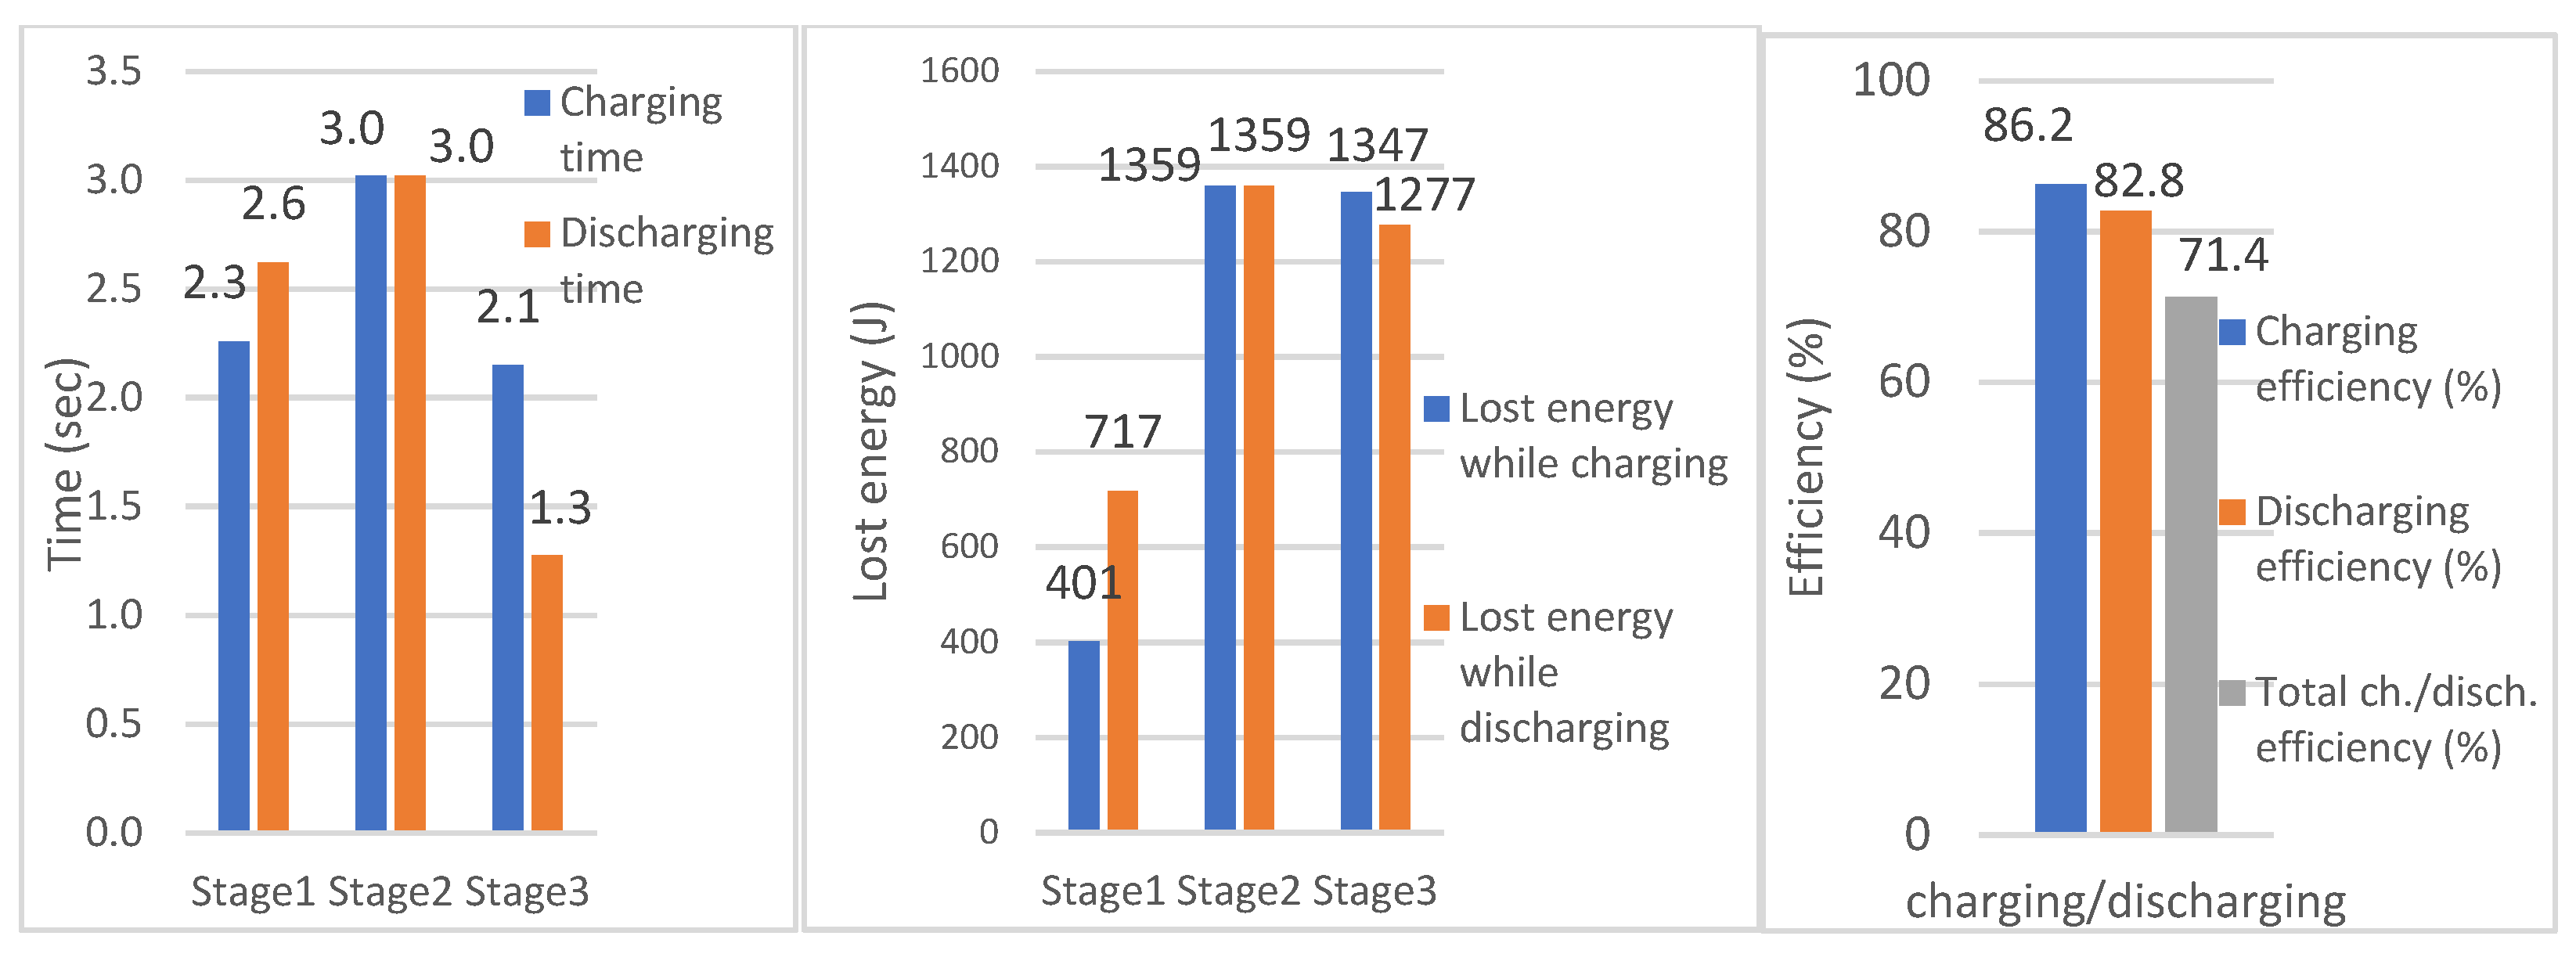
Figure 11.
SC charging state voltages at which switching to the next duty cycle is performed.
Figure 12.
Comparison of times needed to charge the SC circuit from the initial voltage to the voltage at which switching to the next D0n is performed for different numbers of phases N.
Figure 12.
Comparison of times needed to charge the SC circuit from the initial voltage to the voltage at which switching to the next D0n is performed for different numbers of phases N.

Figure 13.
Times of charging and discharging at different numbers of phases N when ∆Vx = 0.1 V.
Figure 14.
Peak currents of the SC circuit during the operations of certain duty cycles at different numbers of phases.
Figure 14.
Peak currents of the SC circuit during the operations of certain duty cycles at different numbers of phases.
Figure 15.
Energies stored in SC circuit during the operations of certain duty cycles at different numbers of phases.
Figure 15.
Energies stored in SC circuit during the operations of certain duty cycles at different numbers of phases.
Figure 16.
Amounts of energy lost during the charging of the SC circuit during the operations of the individual duty cycles at different numbers of phases.
Figure 16.
Amounts of energy lost during the charging of the SC circuit during the operations of the individual duty cycles at different numbers of phases.
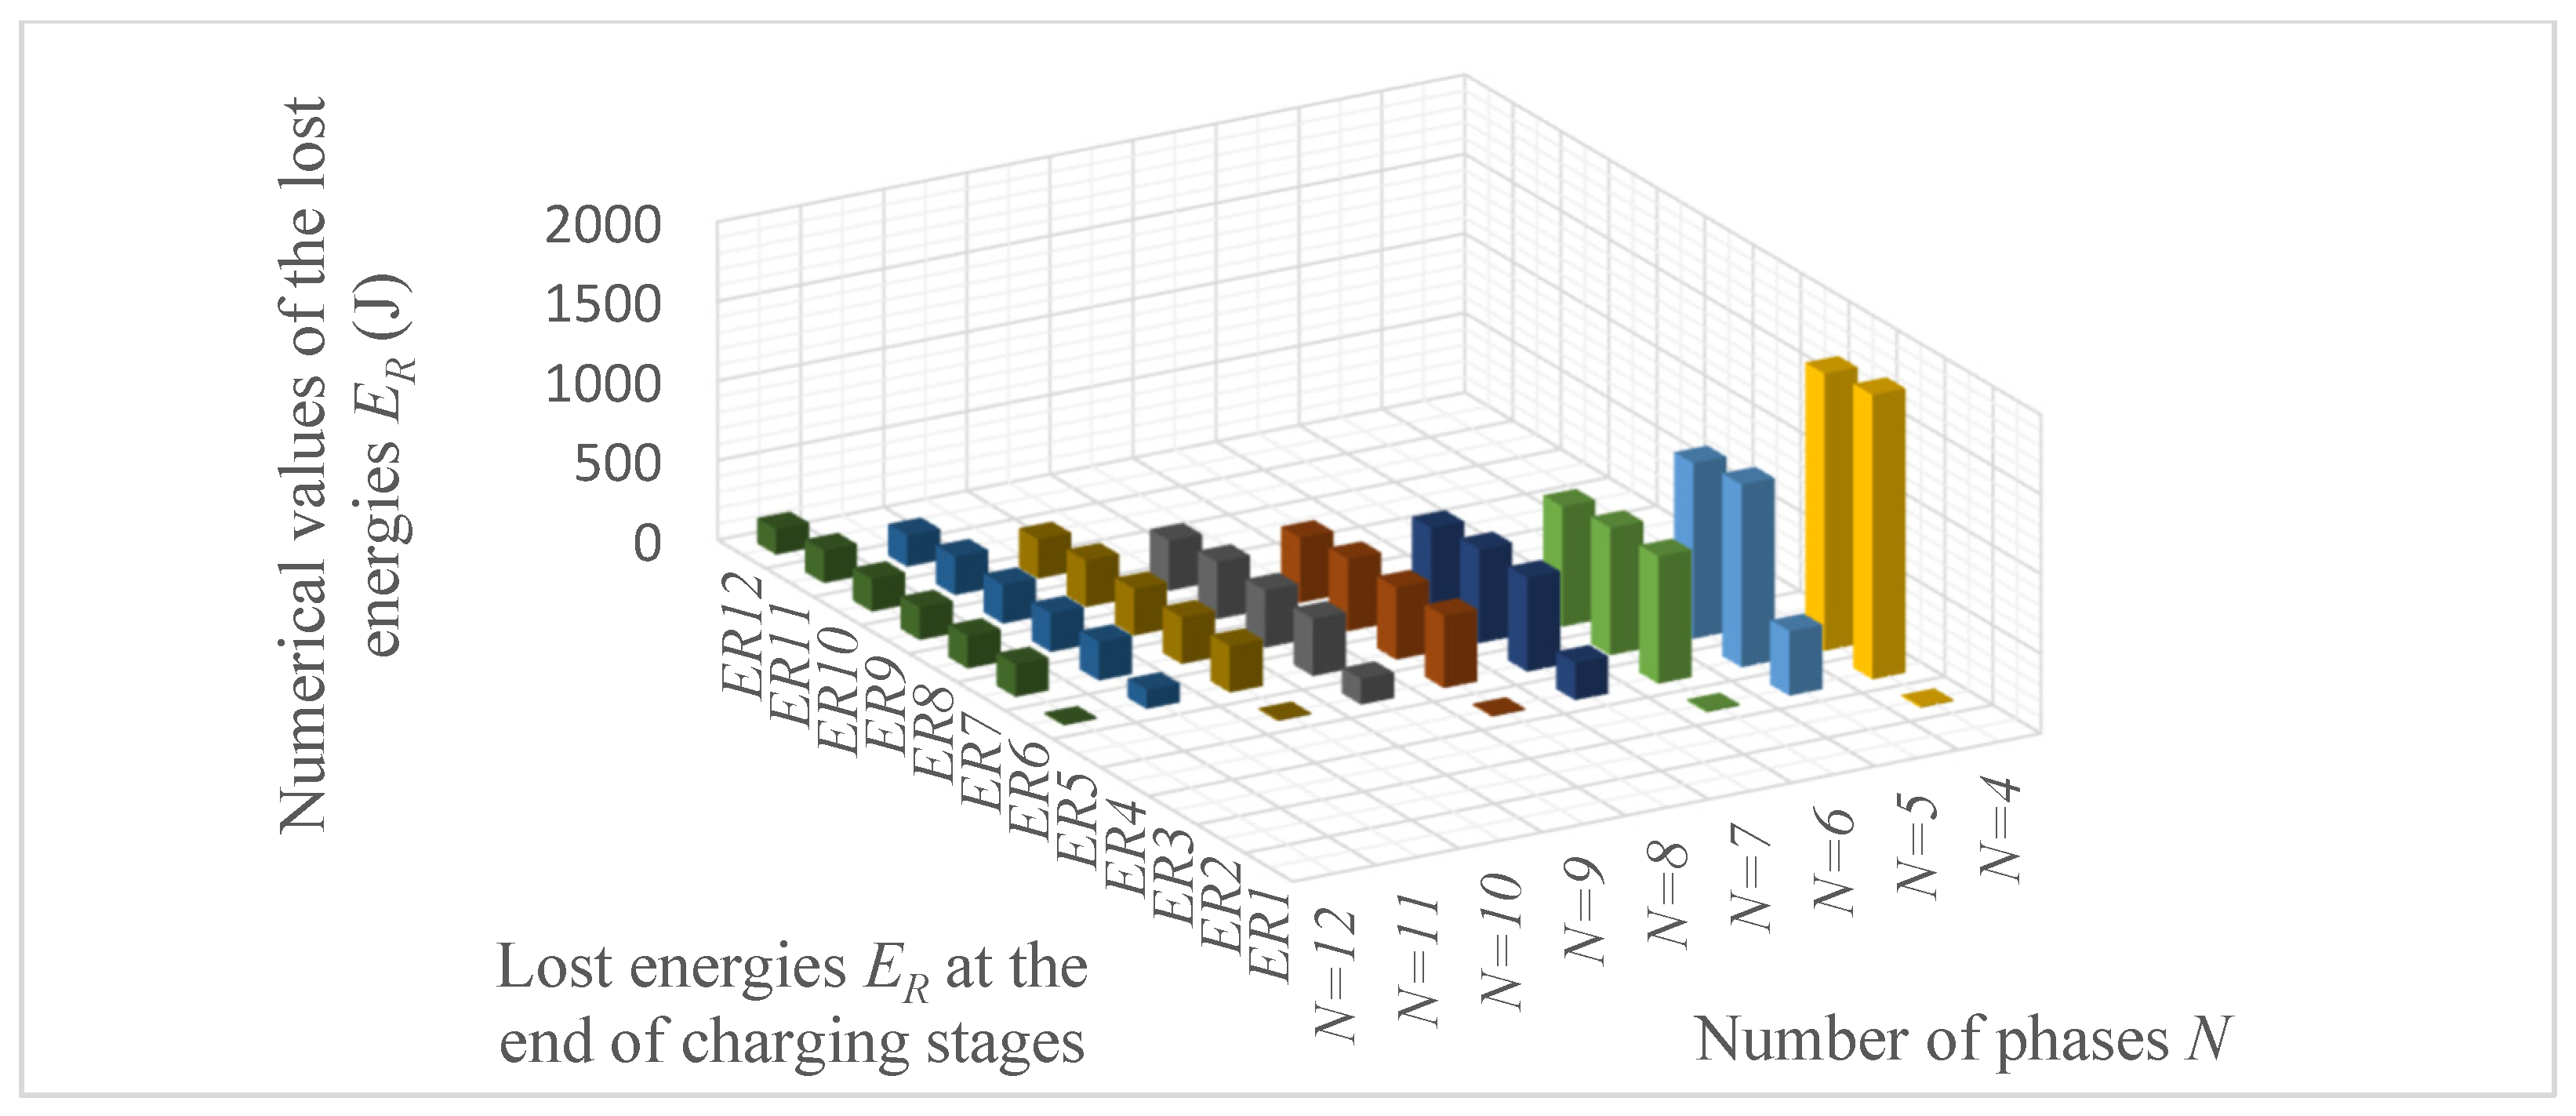
Figure 17.
Comparative diagrams of total energies lost during charging and discharging of the SC circuit at different numbers of phases.
Figure 17.
Comparative diagrams of total energies lost during charging and discharging of the SC circuit at different numbers of phases.

Figure 18.
Comparative diagrams of total transmitted, stored, and successfully discharged energies of the SC circuit at different numbers of phases.
Figure 18.
Comparative diagrams of total transmitted, stored, and successfully discharged energies of the SC circuit at different numbers of phases.
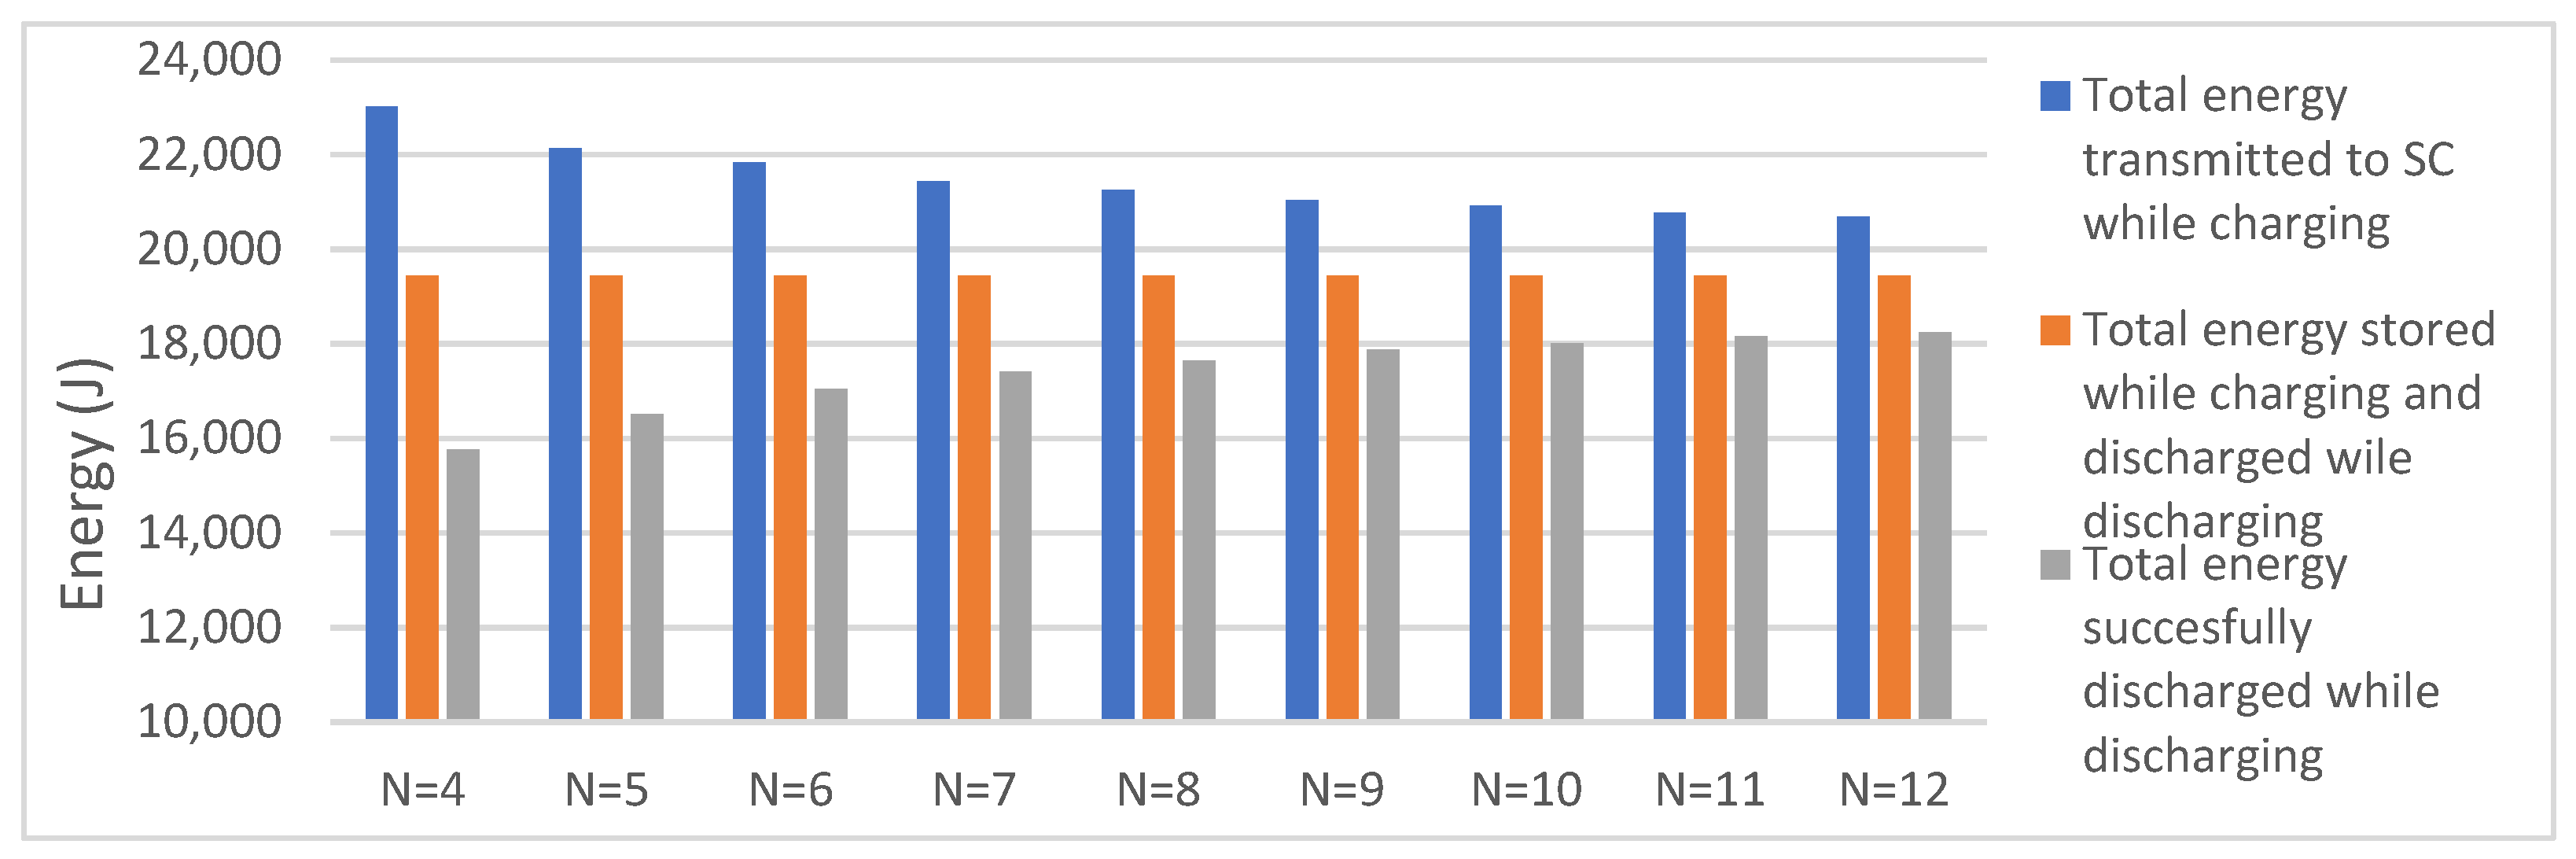
Figure 19.
Comparative diagrams of charging, discharging, and total charging/discharging efficiency diagrams of the SC circuit at different numbers of phases.
Figure 19.
Comparative diagrams of charging, discharging, and total charging/discharging efficiency diagrams of the SC circuit at different numbers of phases.
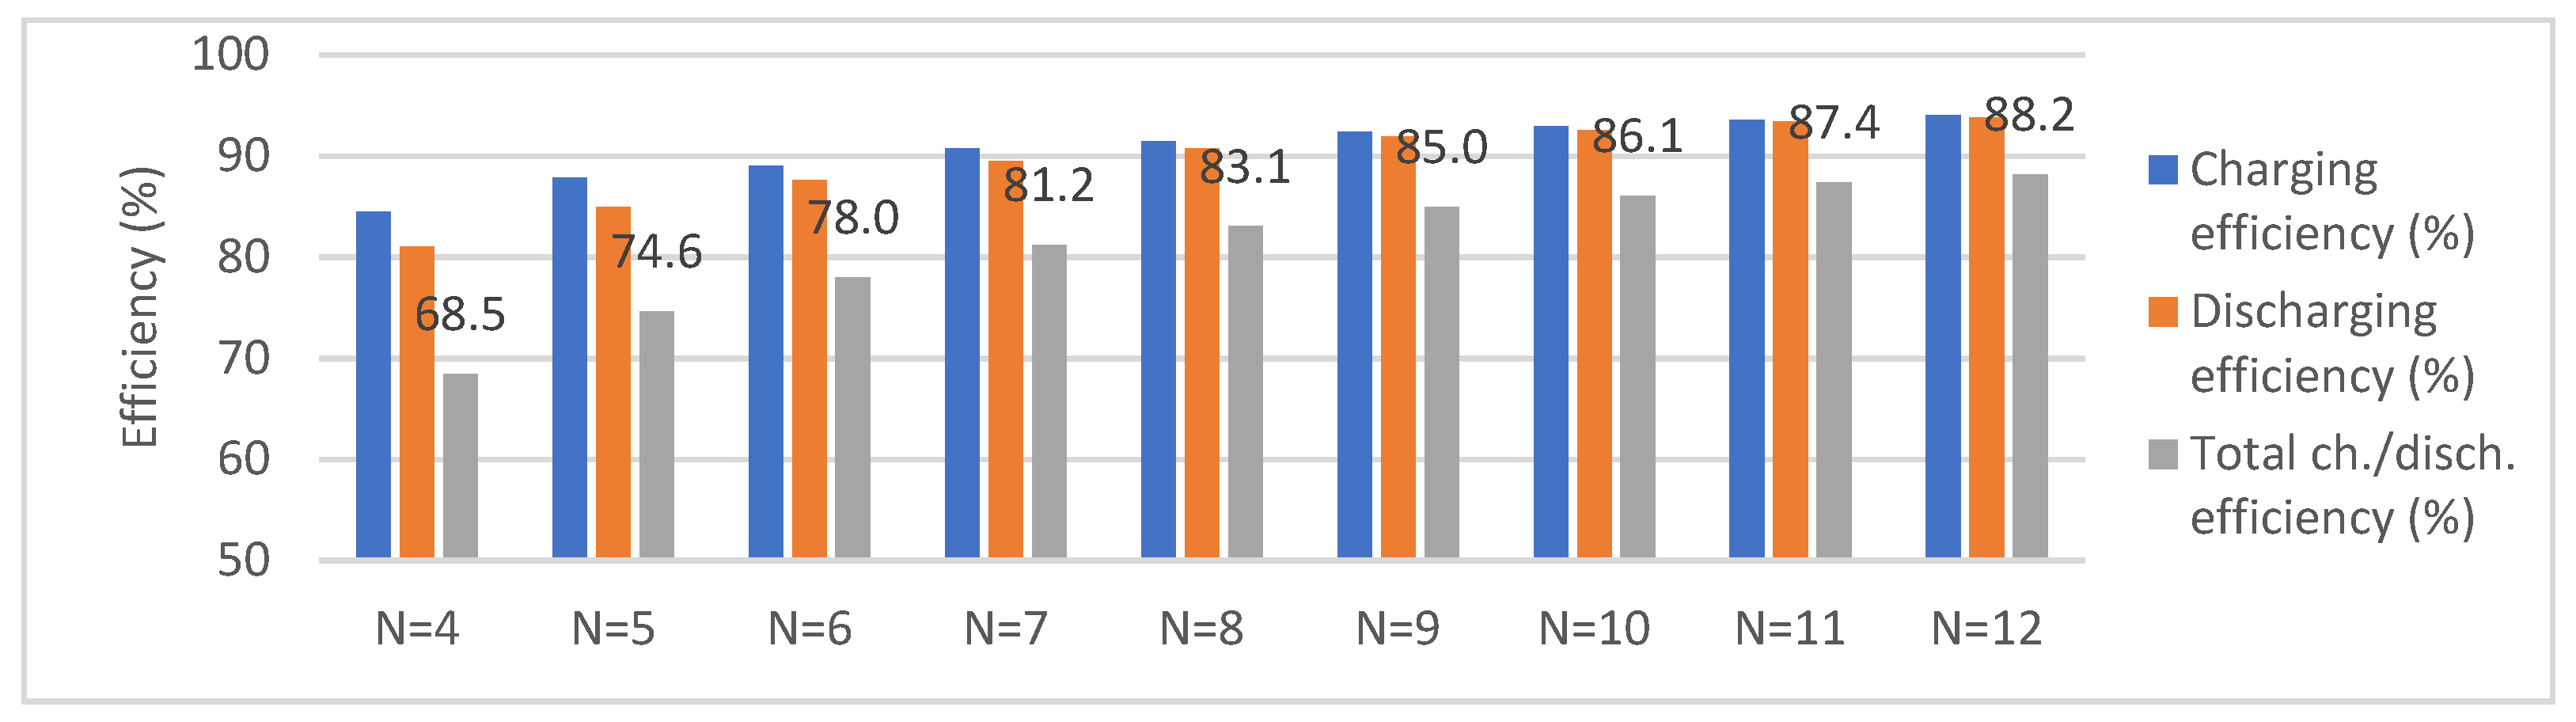
Figure 20.
SC circuit charging time durations at different ∆Vx for different numbers of phases.
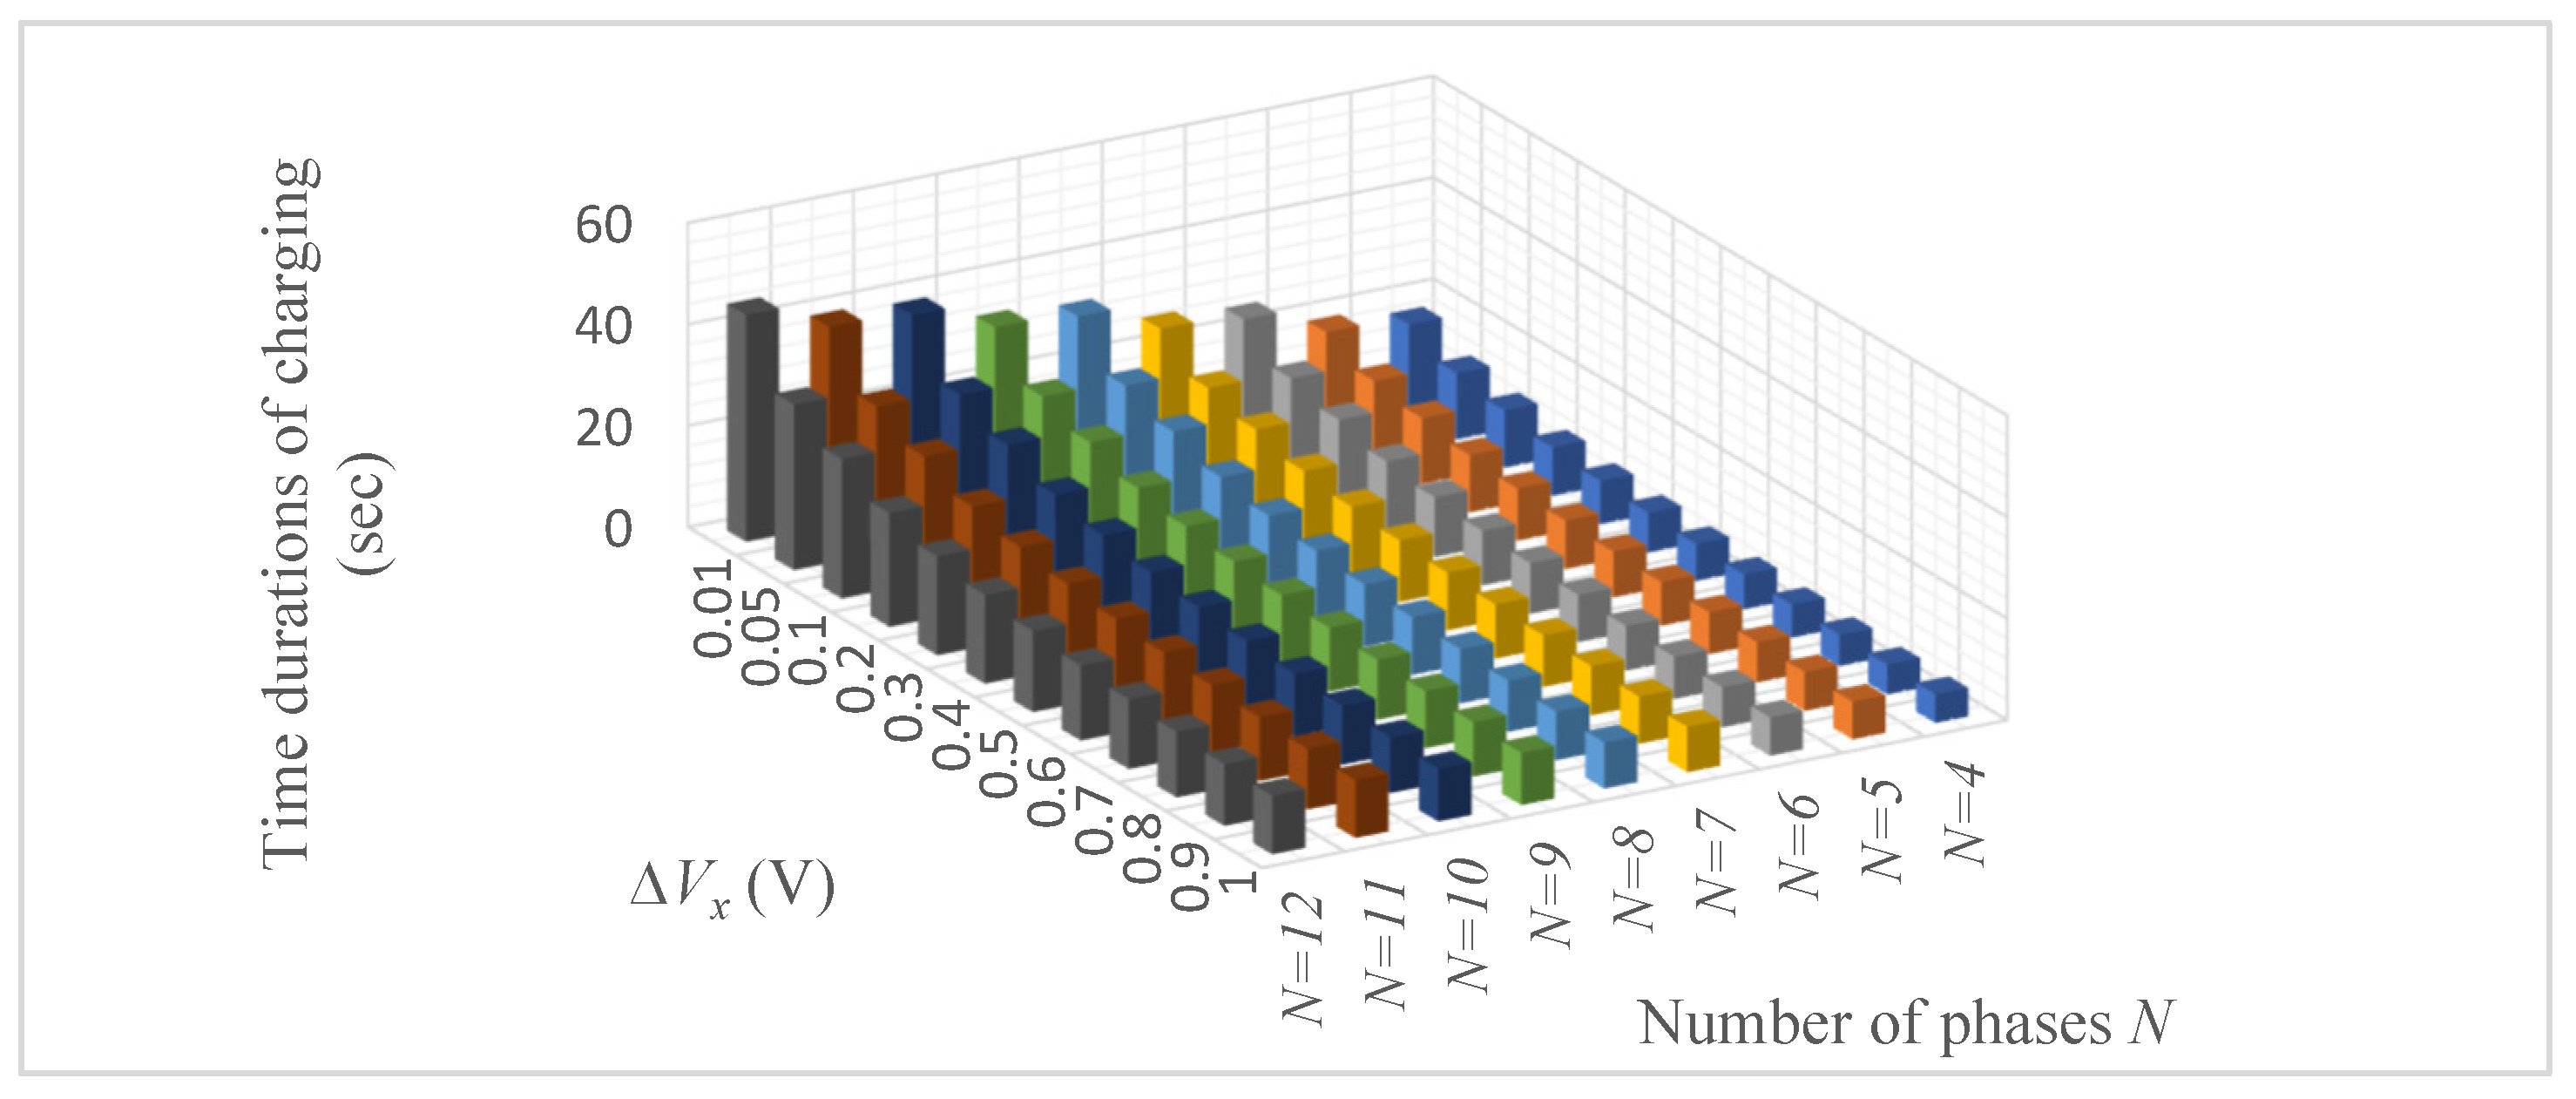
Figure 21.
Peak currents of the SC circuit at different ∆Vx for different numbers of phases.
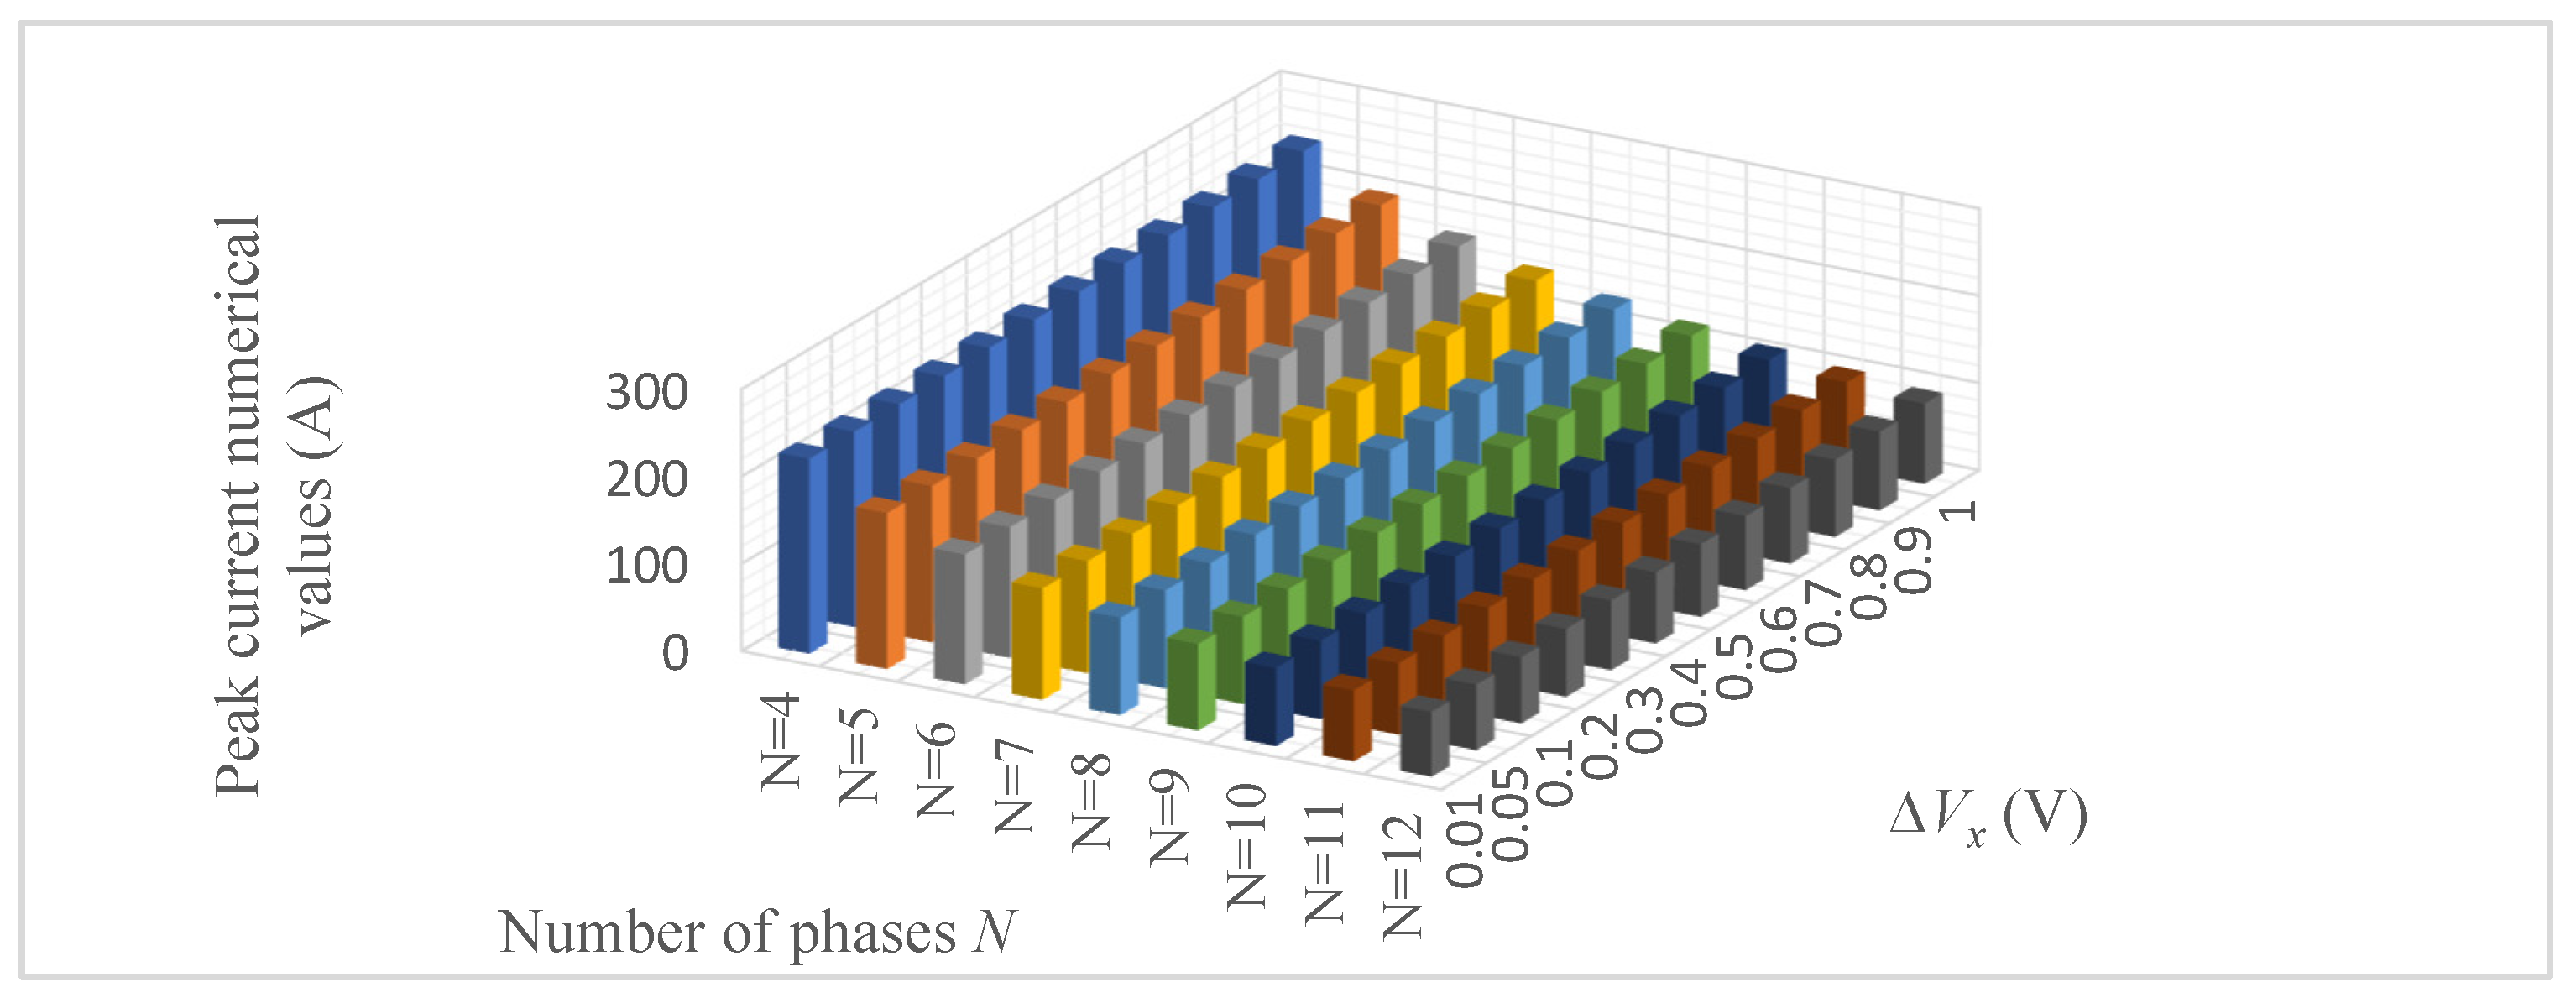
Figure 22.
Charging efficiency of SC circuit at different ∆Vx for different numbers of phases.
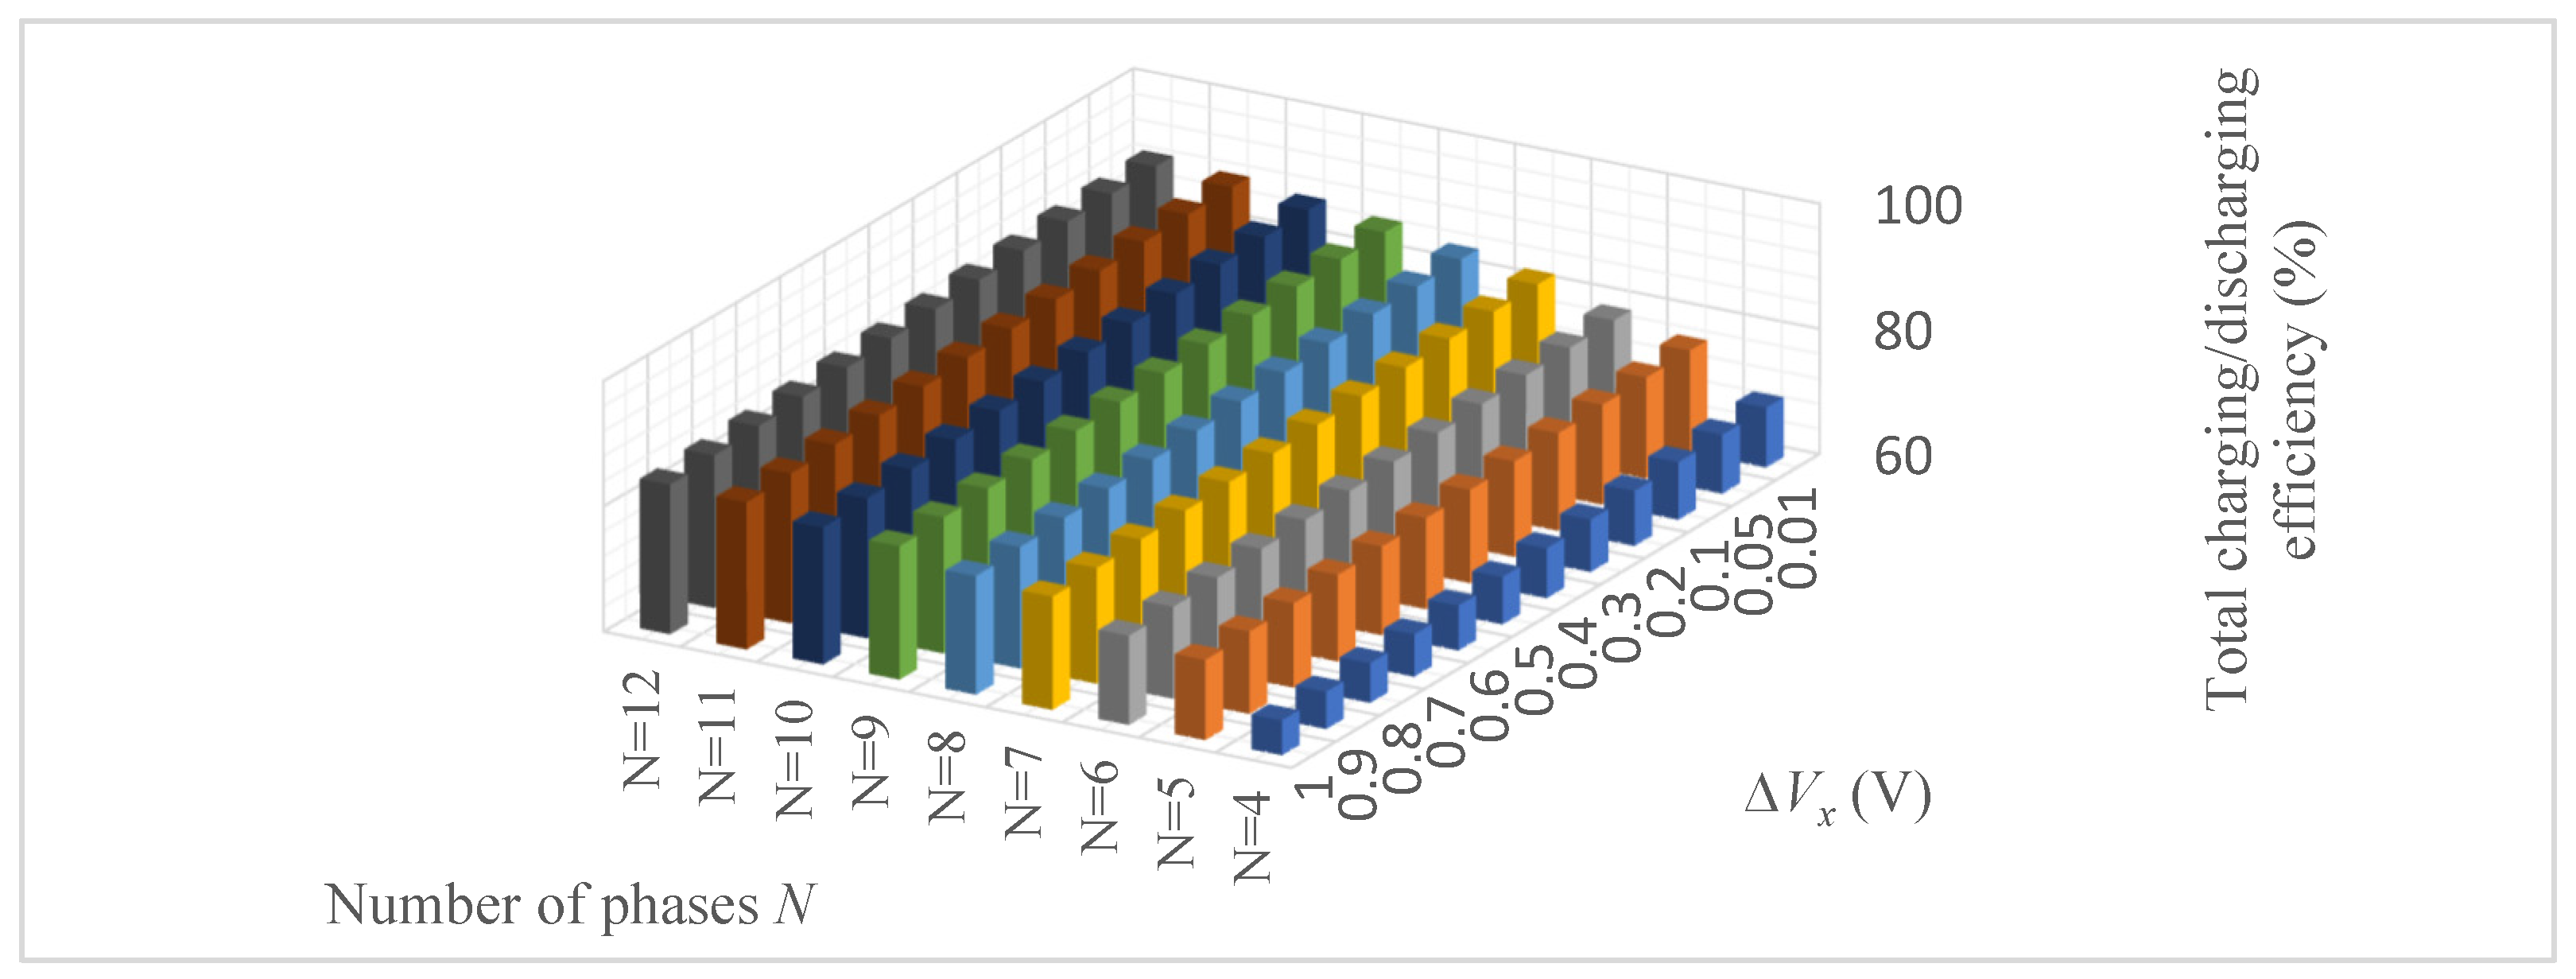
Figure 23.
SC circuit charging current and voltage curves in the case of six phases at different ∆Vx.
Figure 23.
SC circuit charging current and voltage curves in the case of six phases at different ∆Vx.
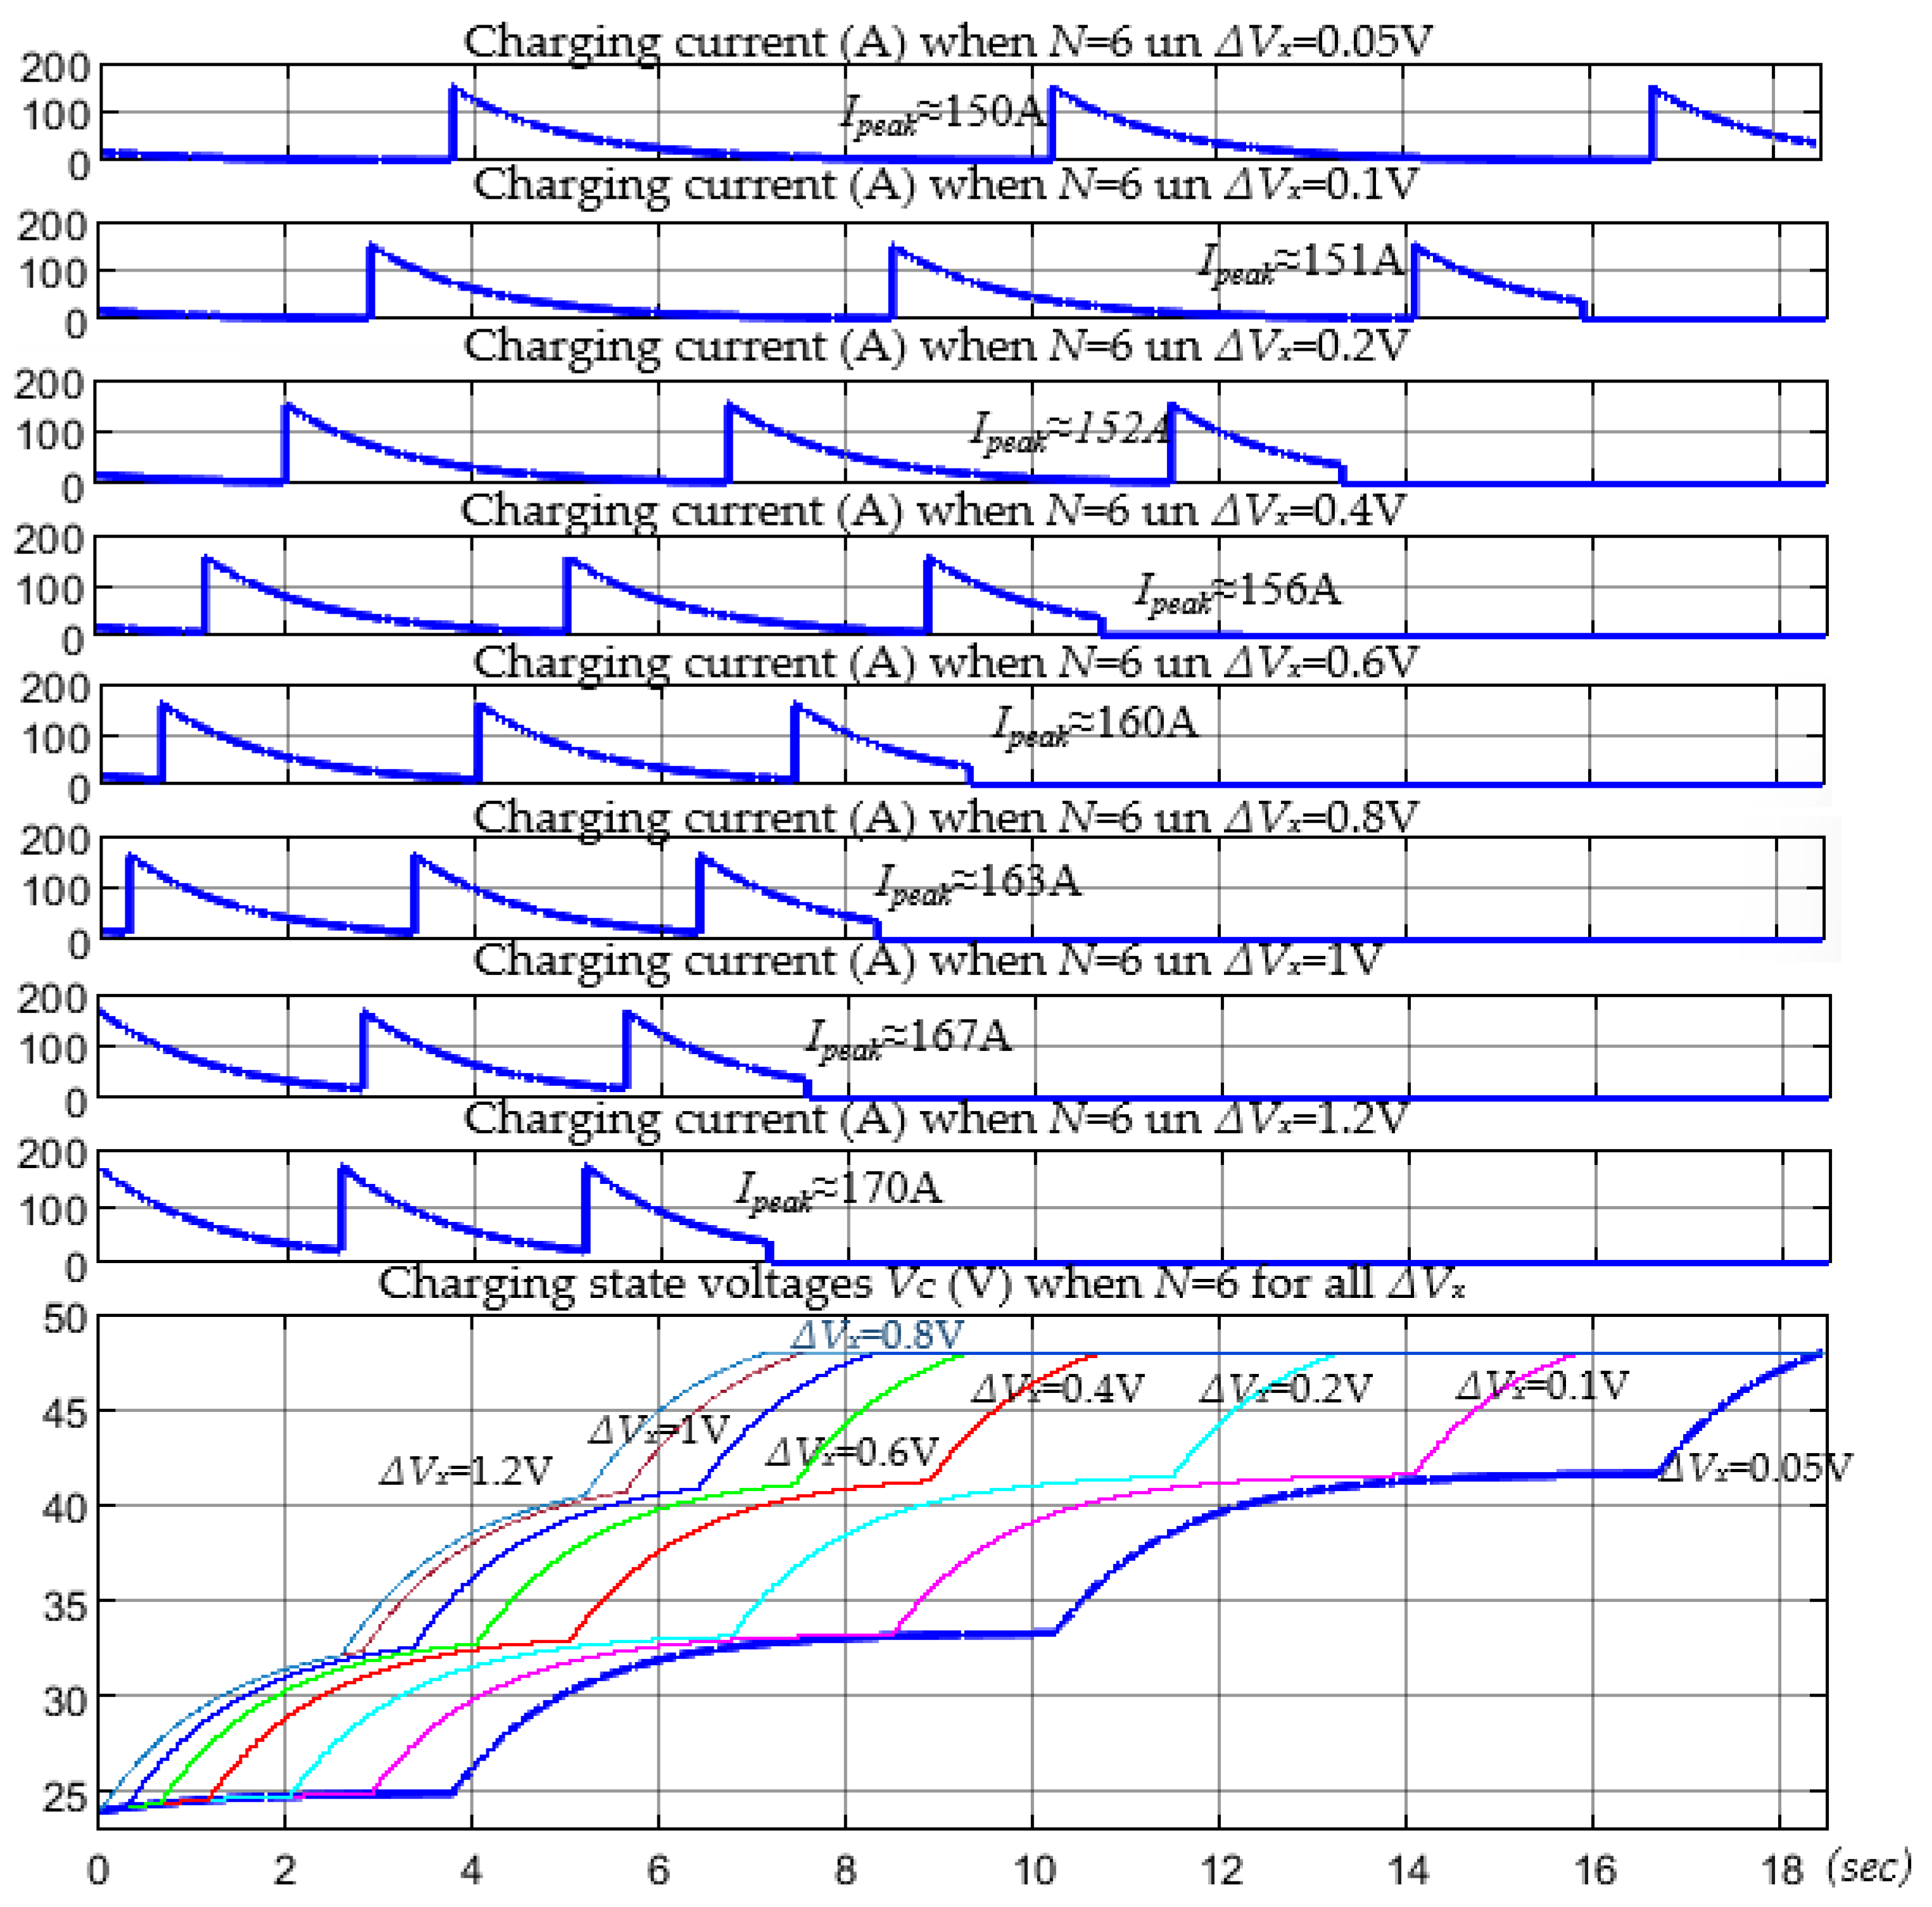
Figure 24.
Comparative diagrams of SC circuit charging durations and efficiency at different ∆Vx.

Figure 25.
SC circuit charging current, voltage, and power storage efficiency during charging in the case of a six-phase converter and ∆Vx = 0.6 V.
Figure 25.
SC circuit charging current, voltage, and power storage efficiency during charging in the case of a six-phase converter and ∆Vx = 0.6 V.
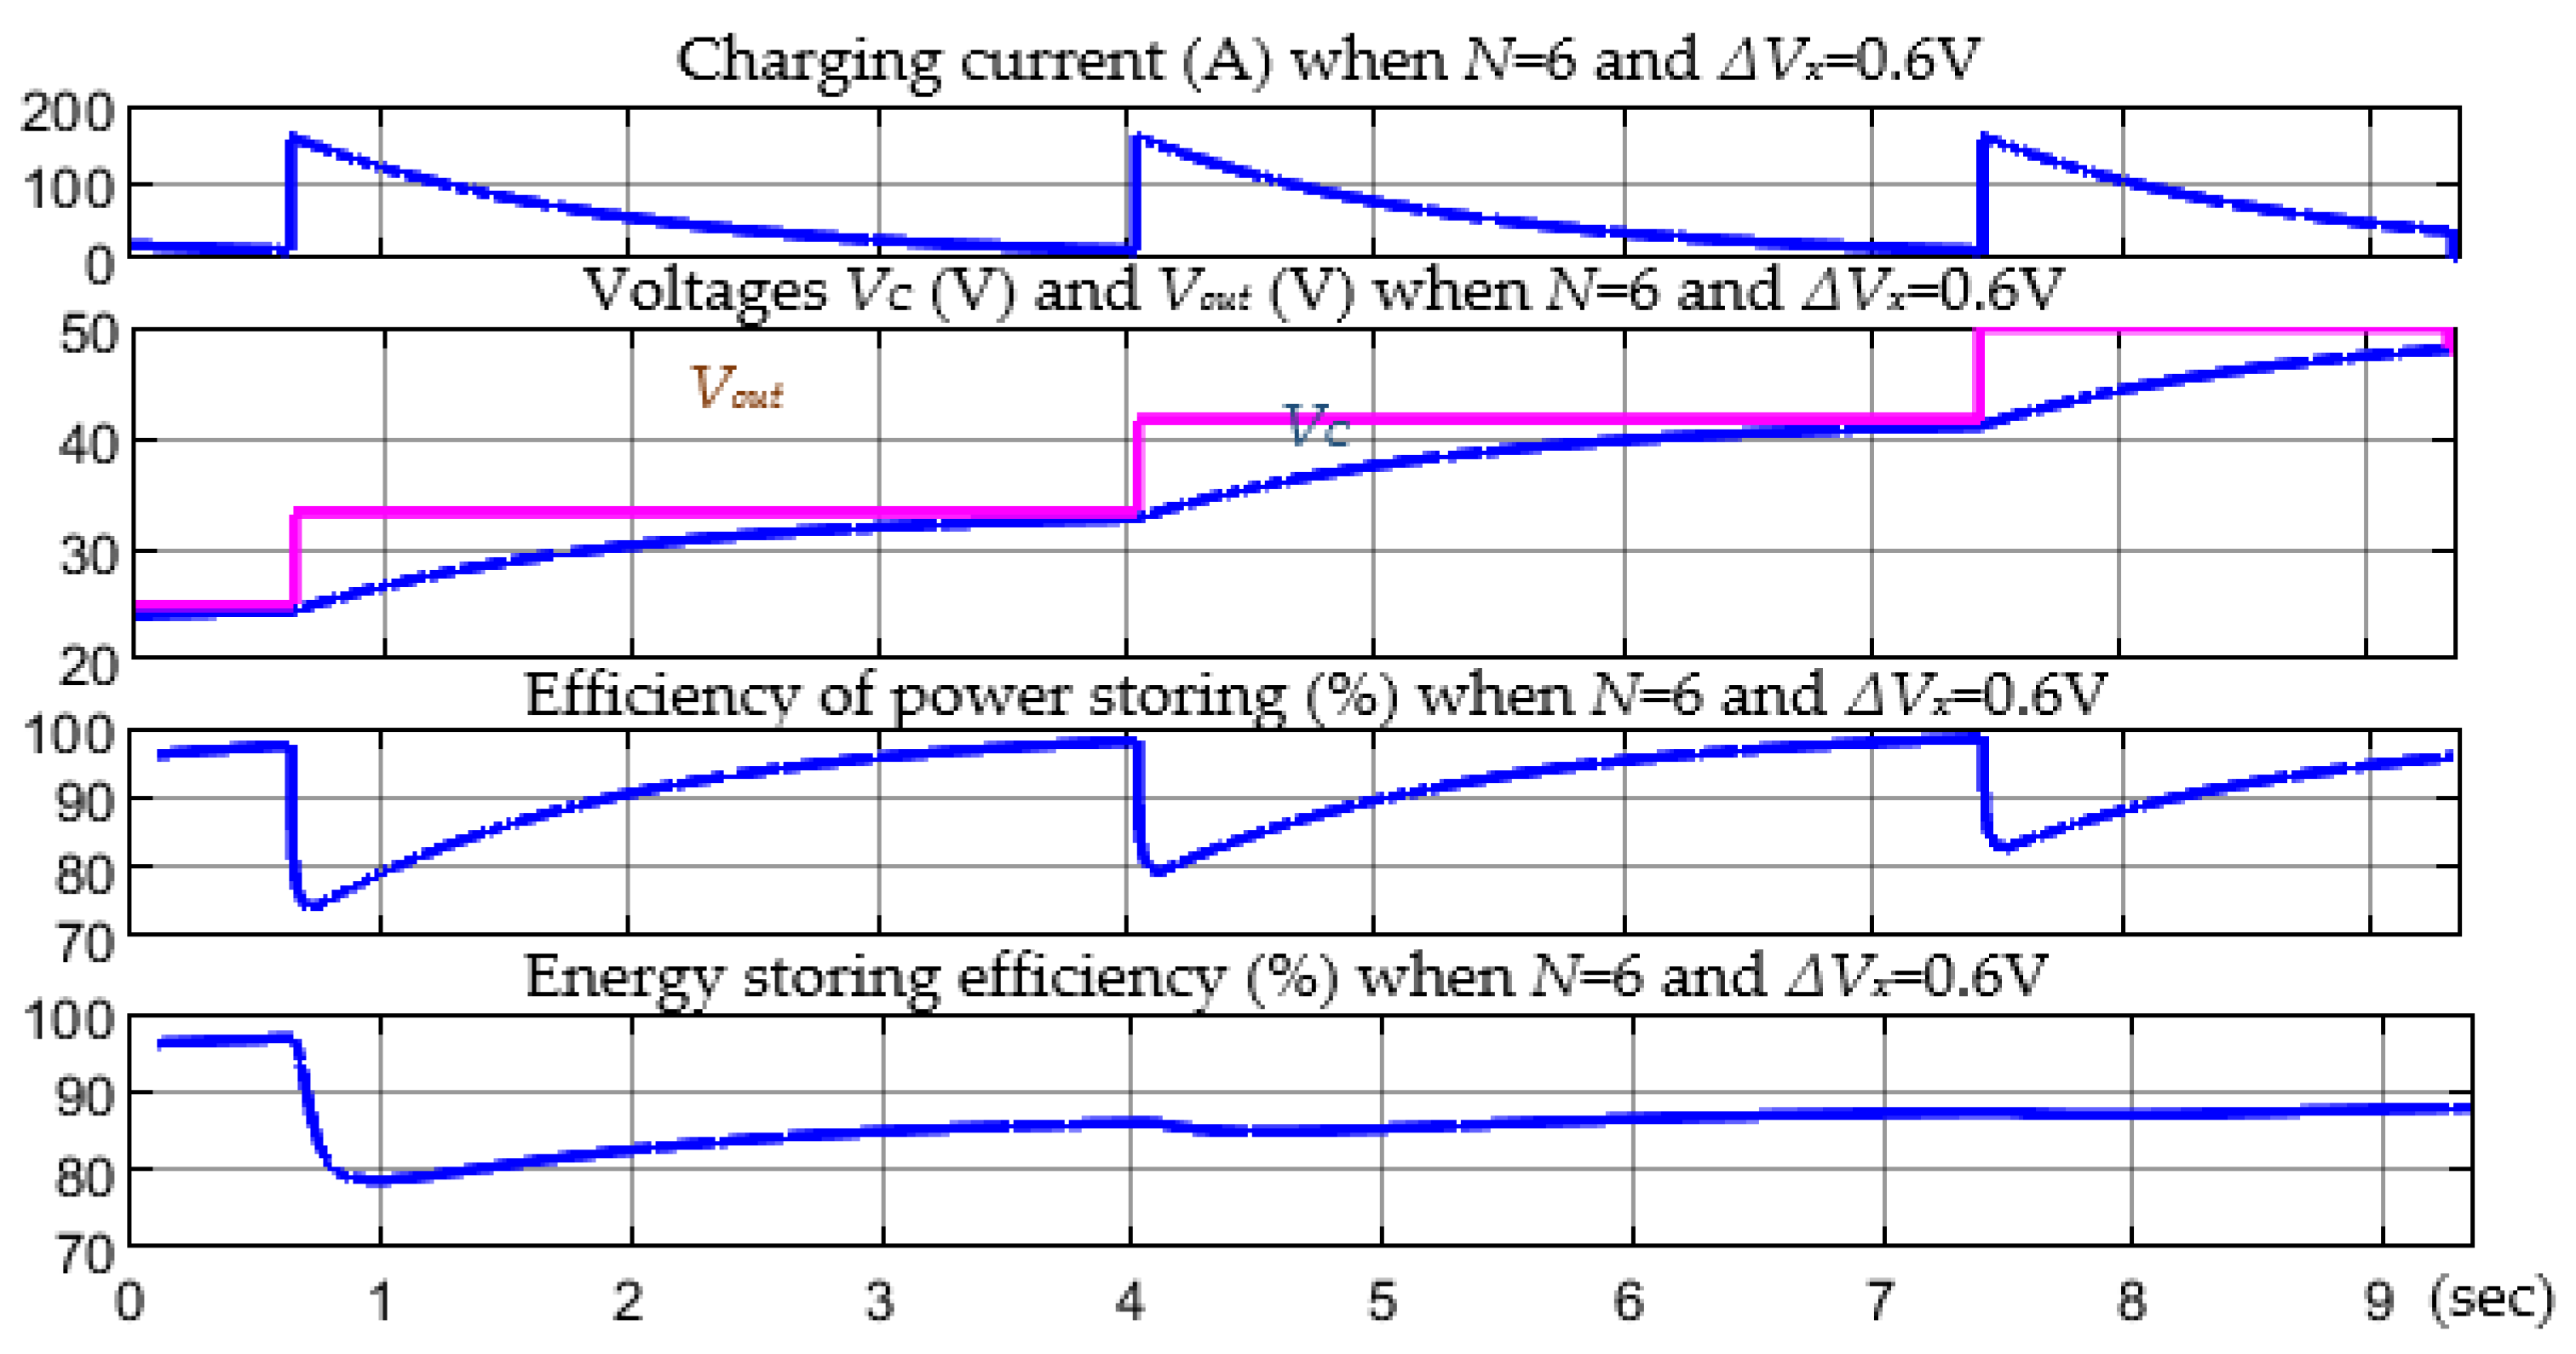
Figure 26.
Six-phase DC–DC converter current ripples and usable duty cycle regions.
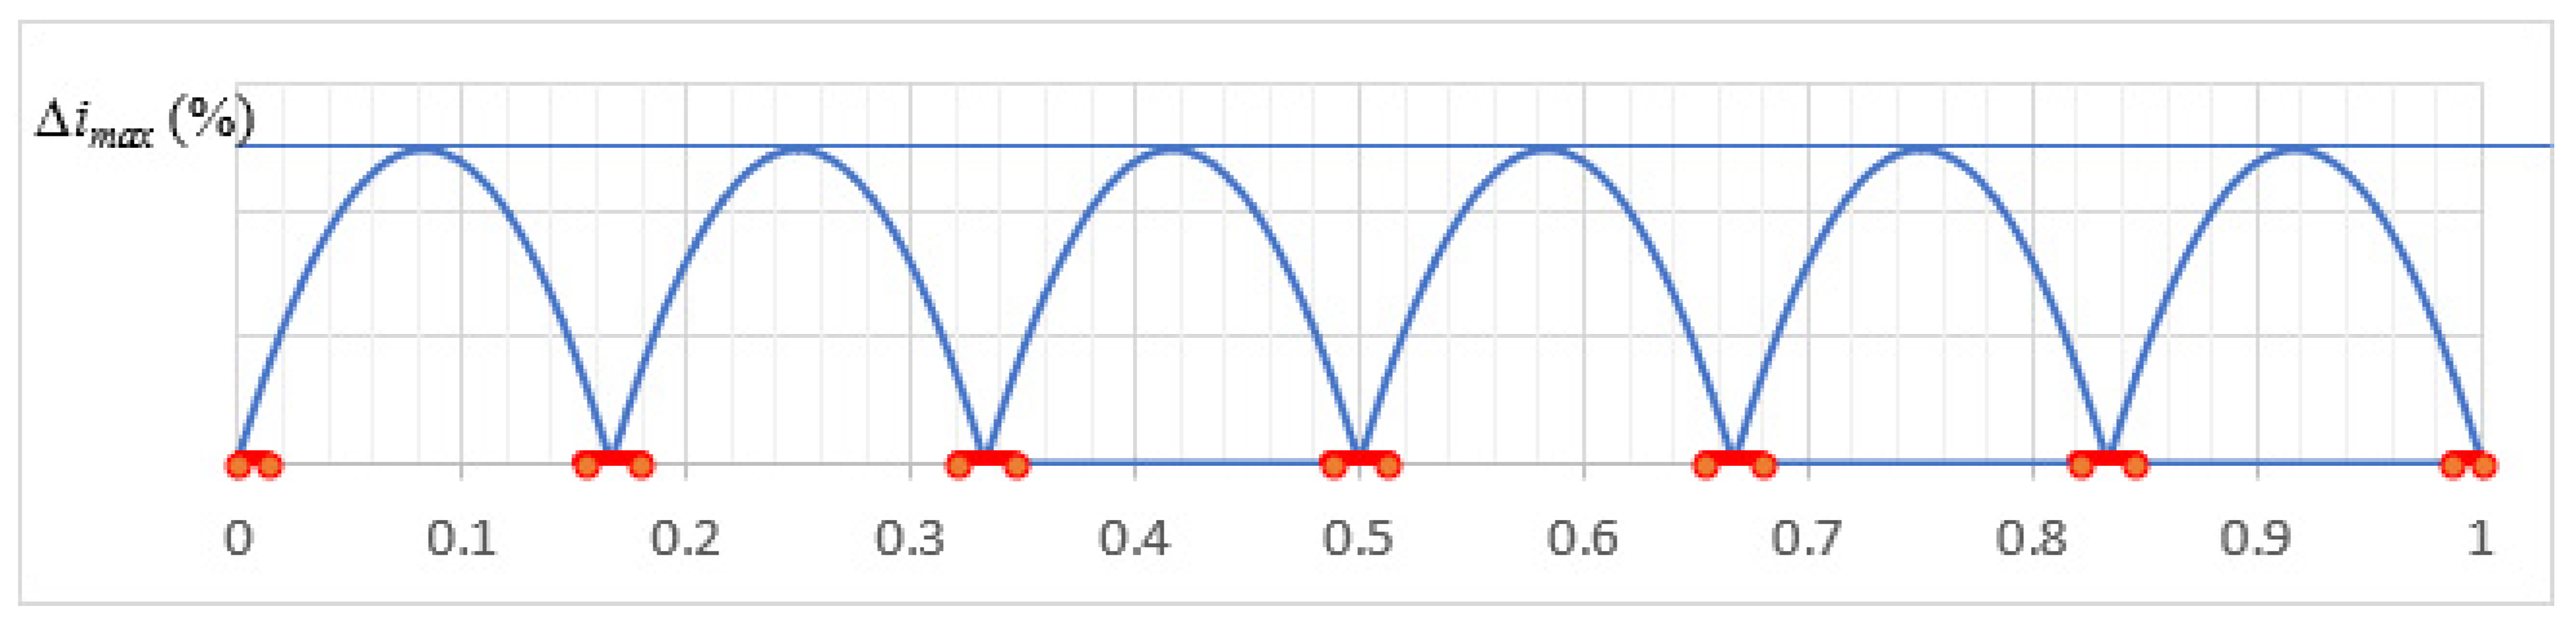
Figure 27.
SC circuit charging currents and voltages in case of six-phase converter at different ∆D0.
Figure 27.
SC circuit charging currents and voltages in case of six-phase converter at different ∆D0.
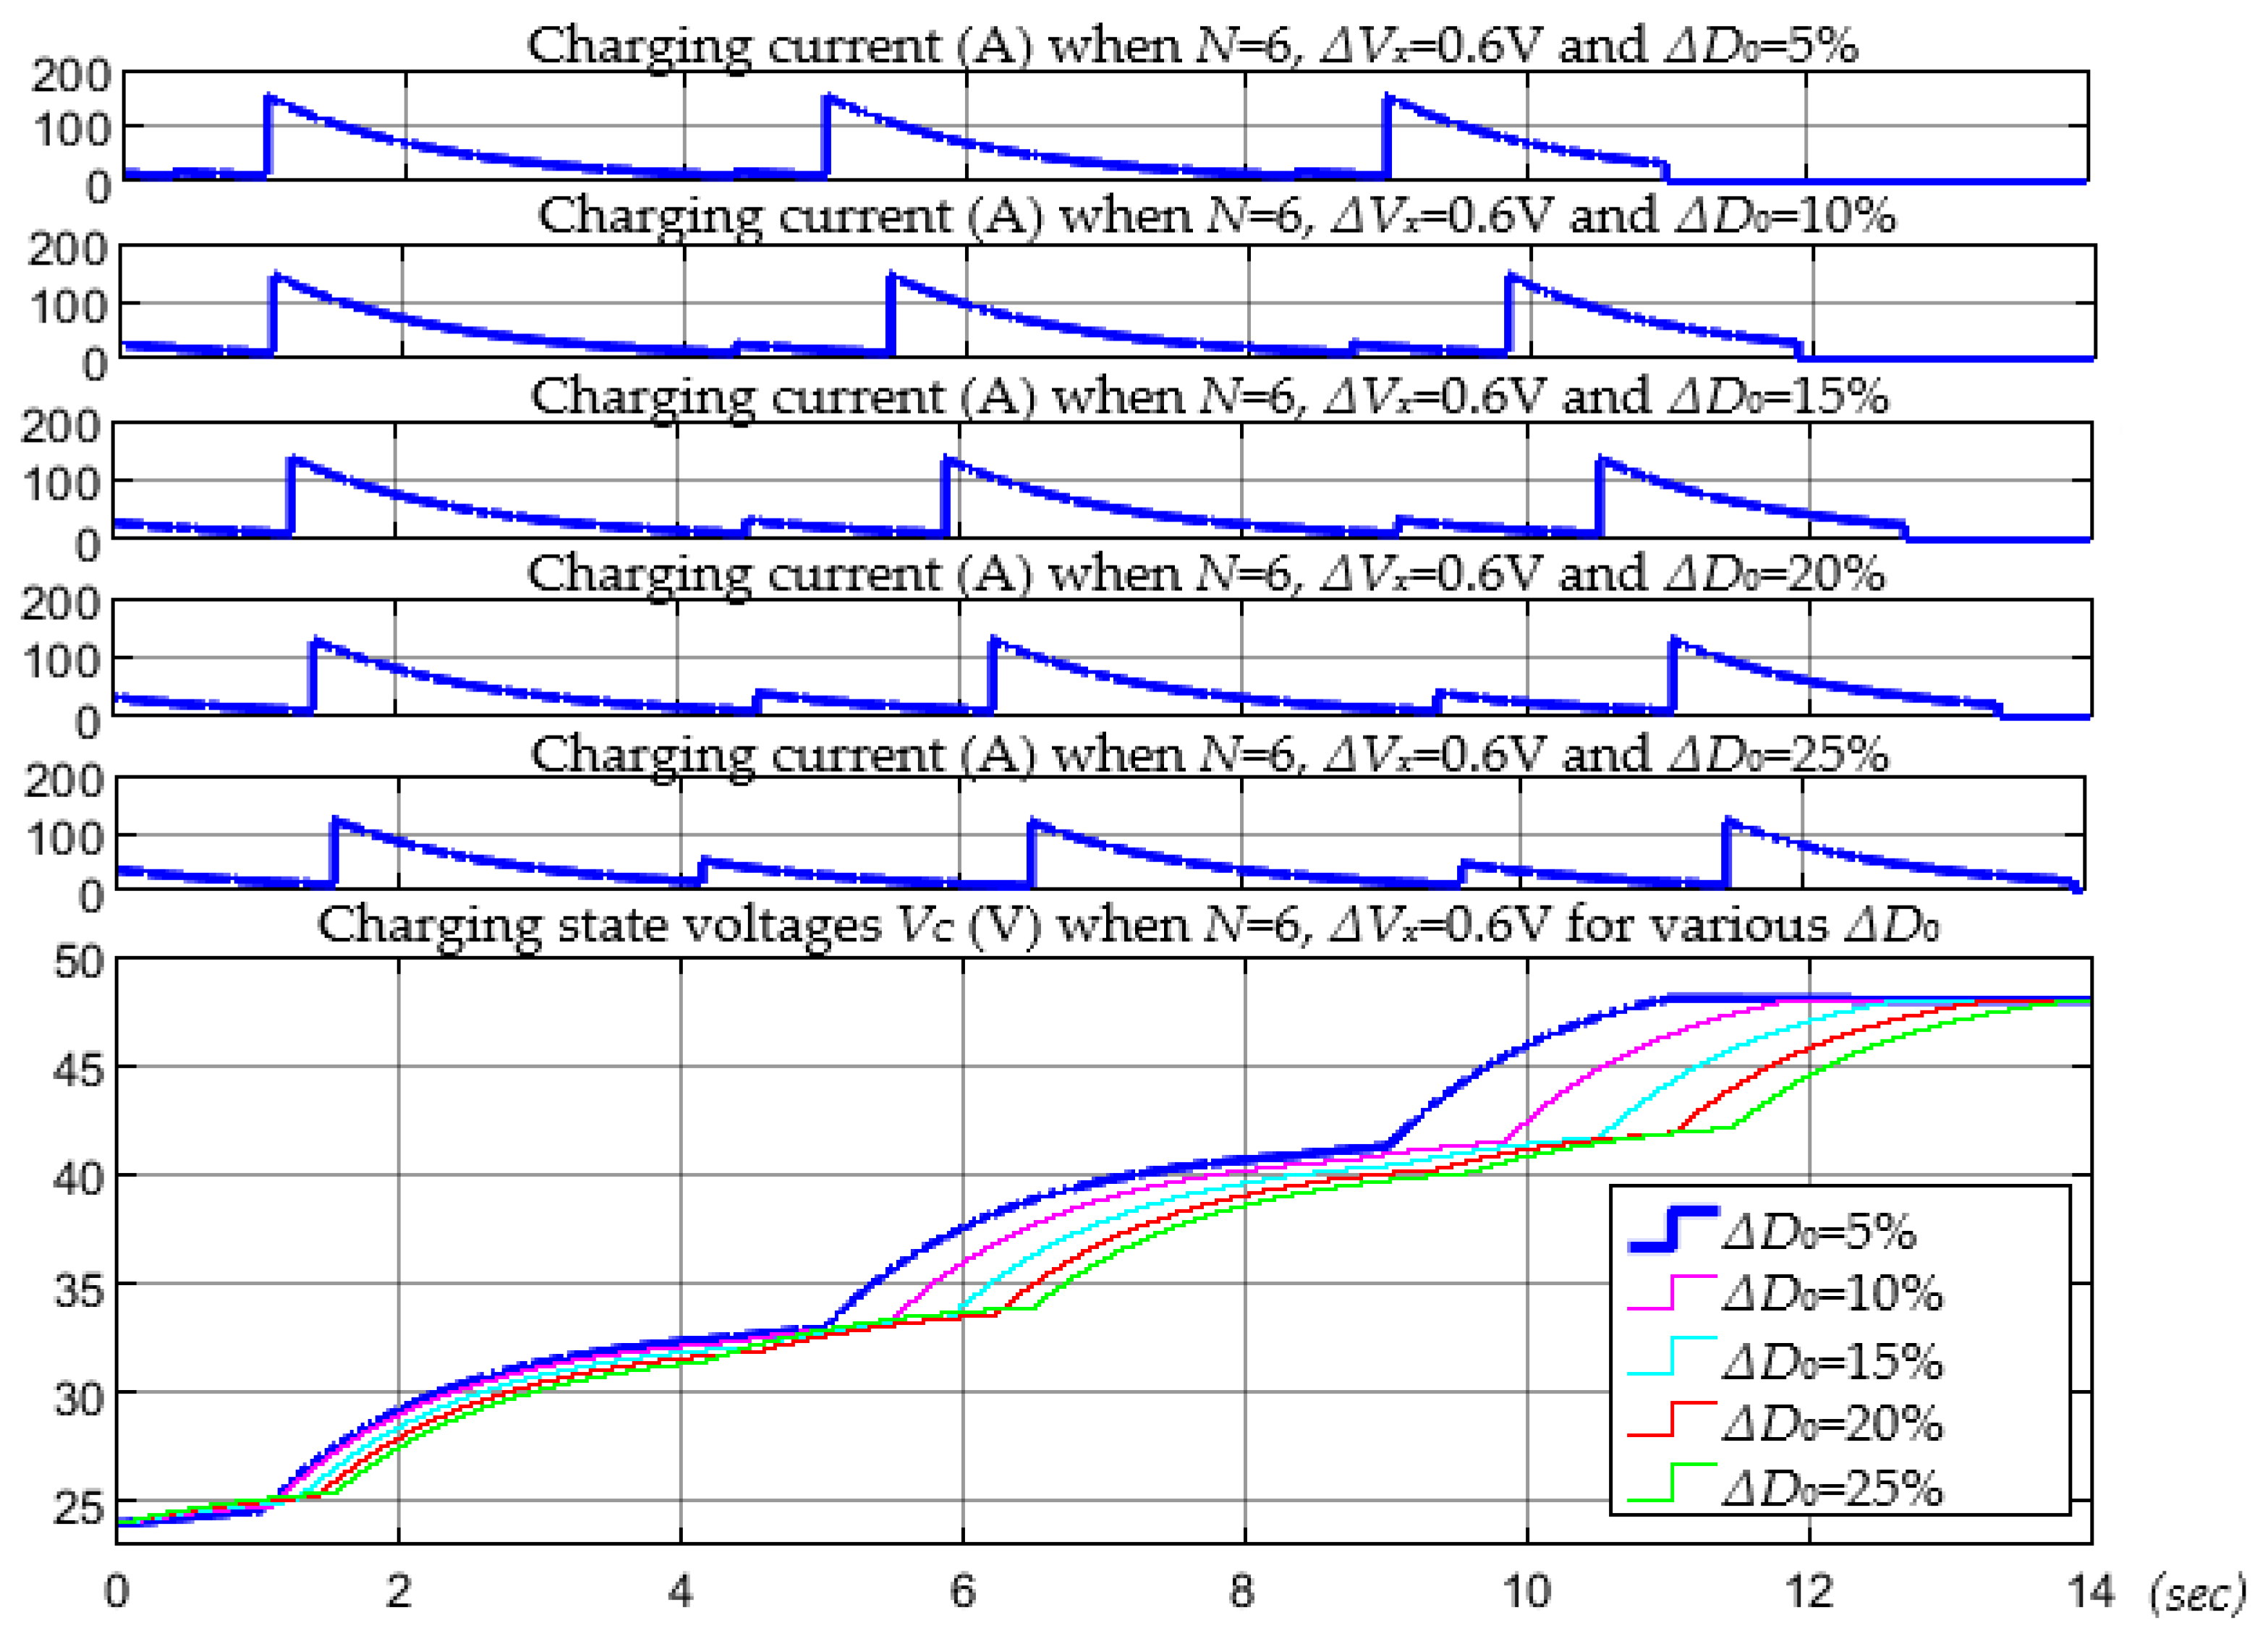
Figure 28.
SC circuit charging duration diagrams in case of six-phase converter at different ∆D0.
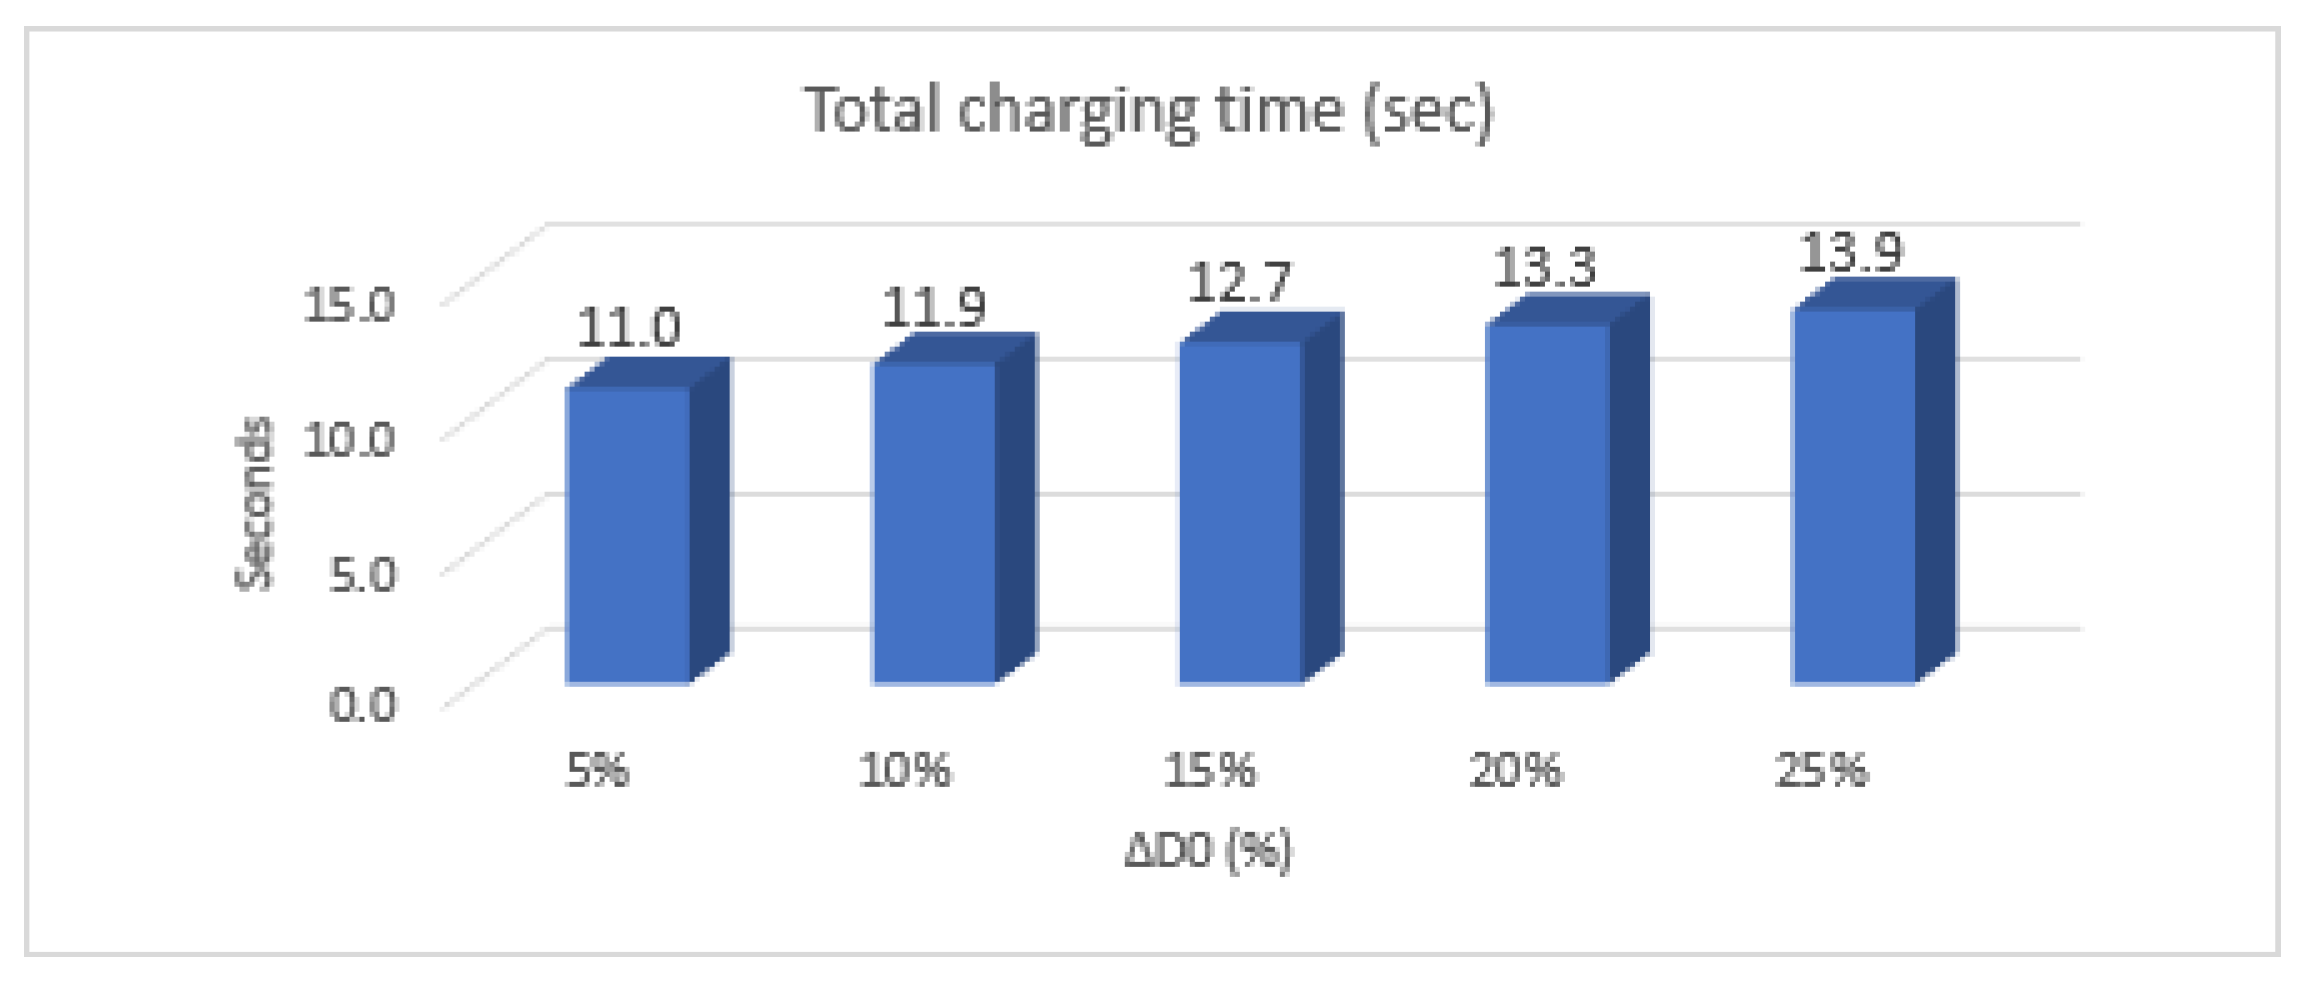
Figure 29.
SC circuit charging efficiency diagrams in case of six-phase converter at different ∆D0.
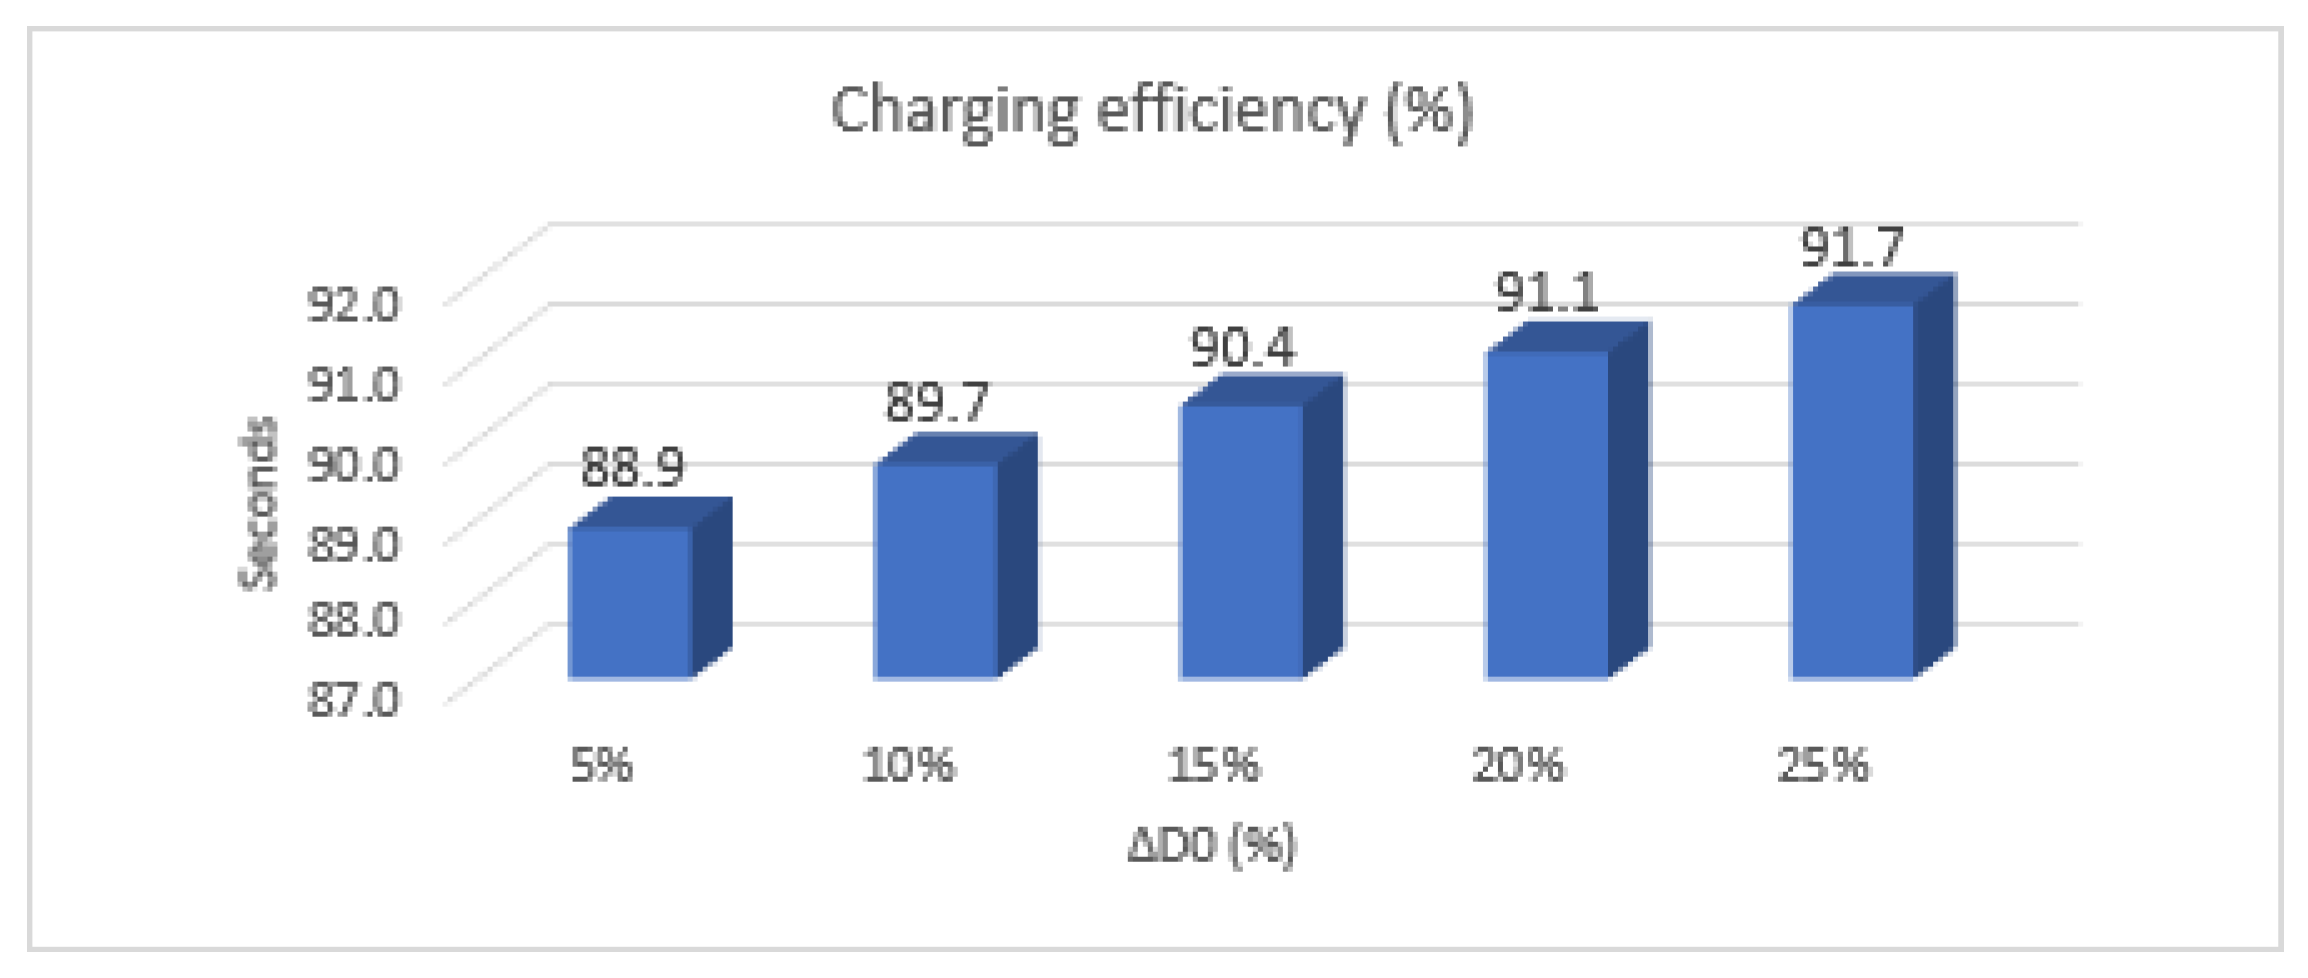
Figure 30.
SC circuit charging current and voltage diagrams with ∆Vx = 0.6 V, ∆D0 = 5% at different constant currents.
Figure 30.
SC circuit charging current and voltage diagrams with ∆Vx = 0.6 V, ∆D0 = 5% at different constant currents.
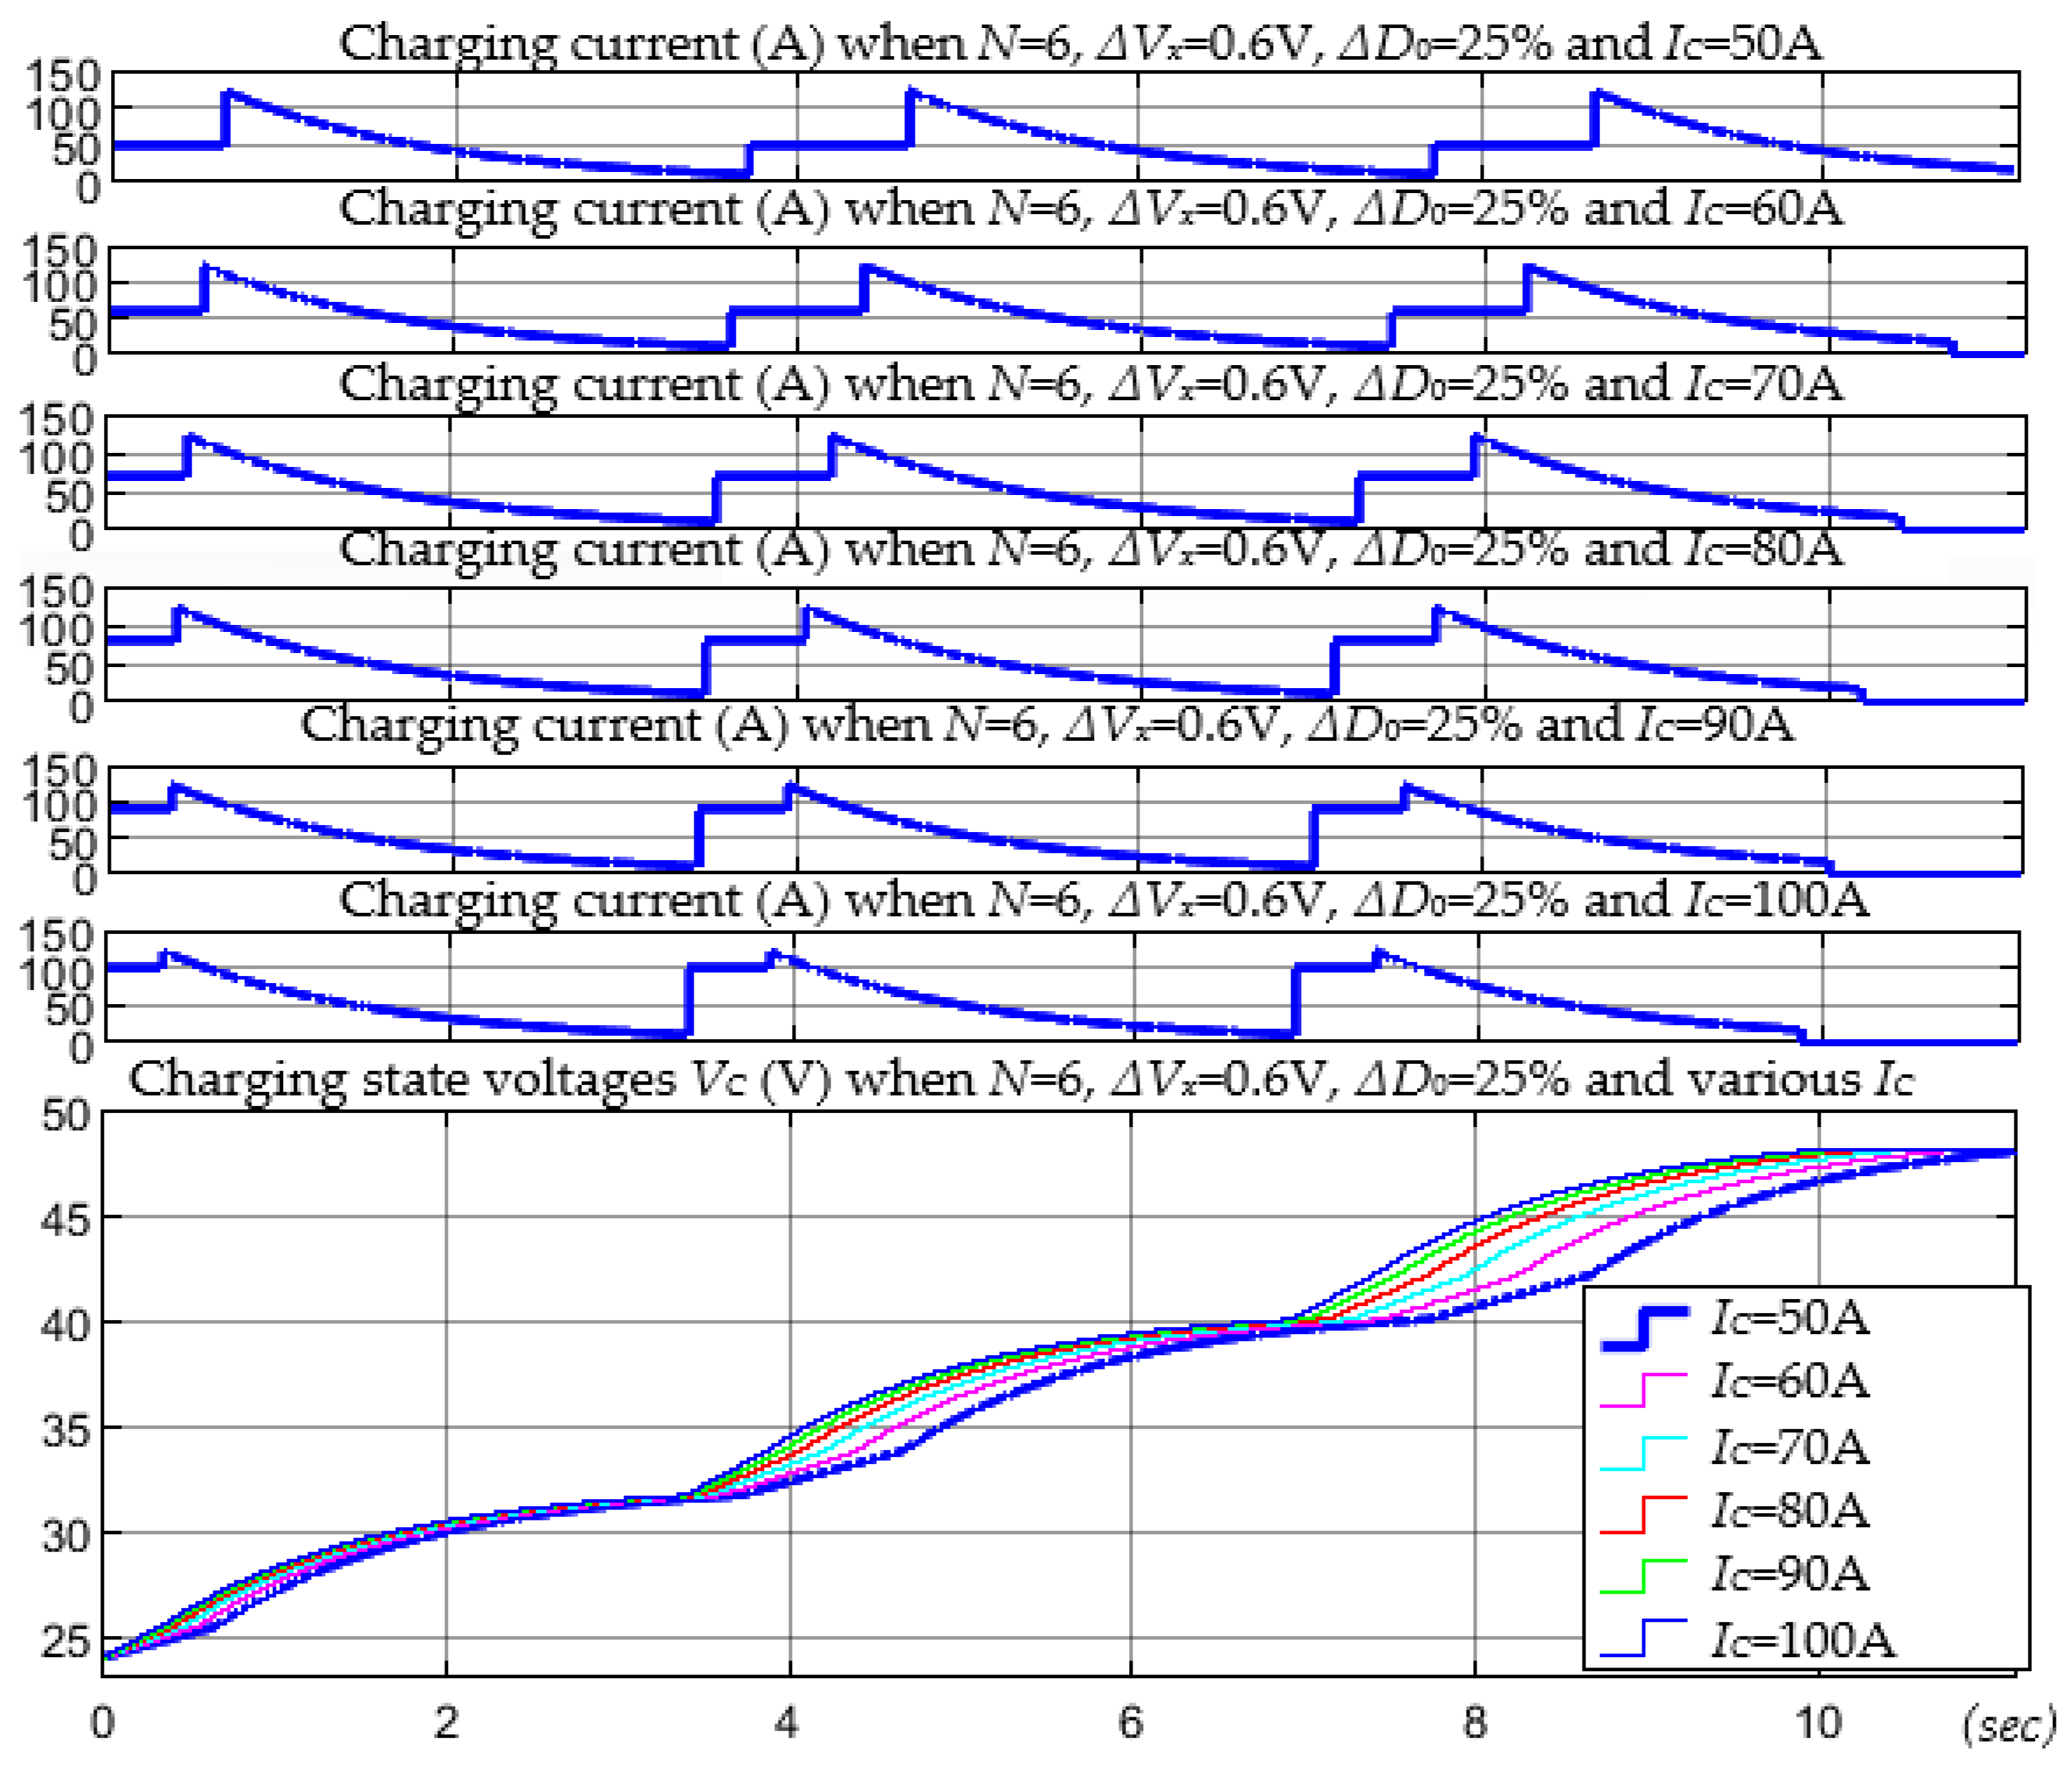
Figure 31.
Diagrams of SC circuit charging durations in the case of a six-phase converter with ∆Vx = 0.6 V, ∆D0 = 25% at different constant currents.
Figure 31.
Diagrams of SC circuit charging durations in the case of a six-phase converter with ∆Vx = 0.6 V, ∆D0 = 25% at different constant currents.
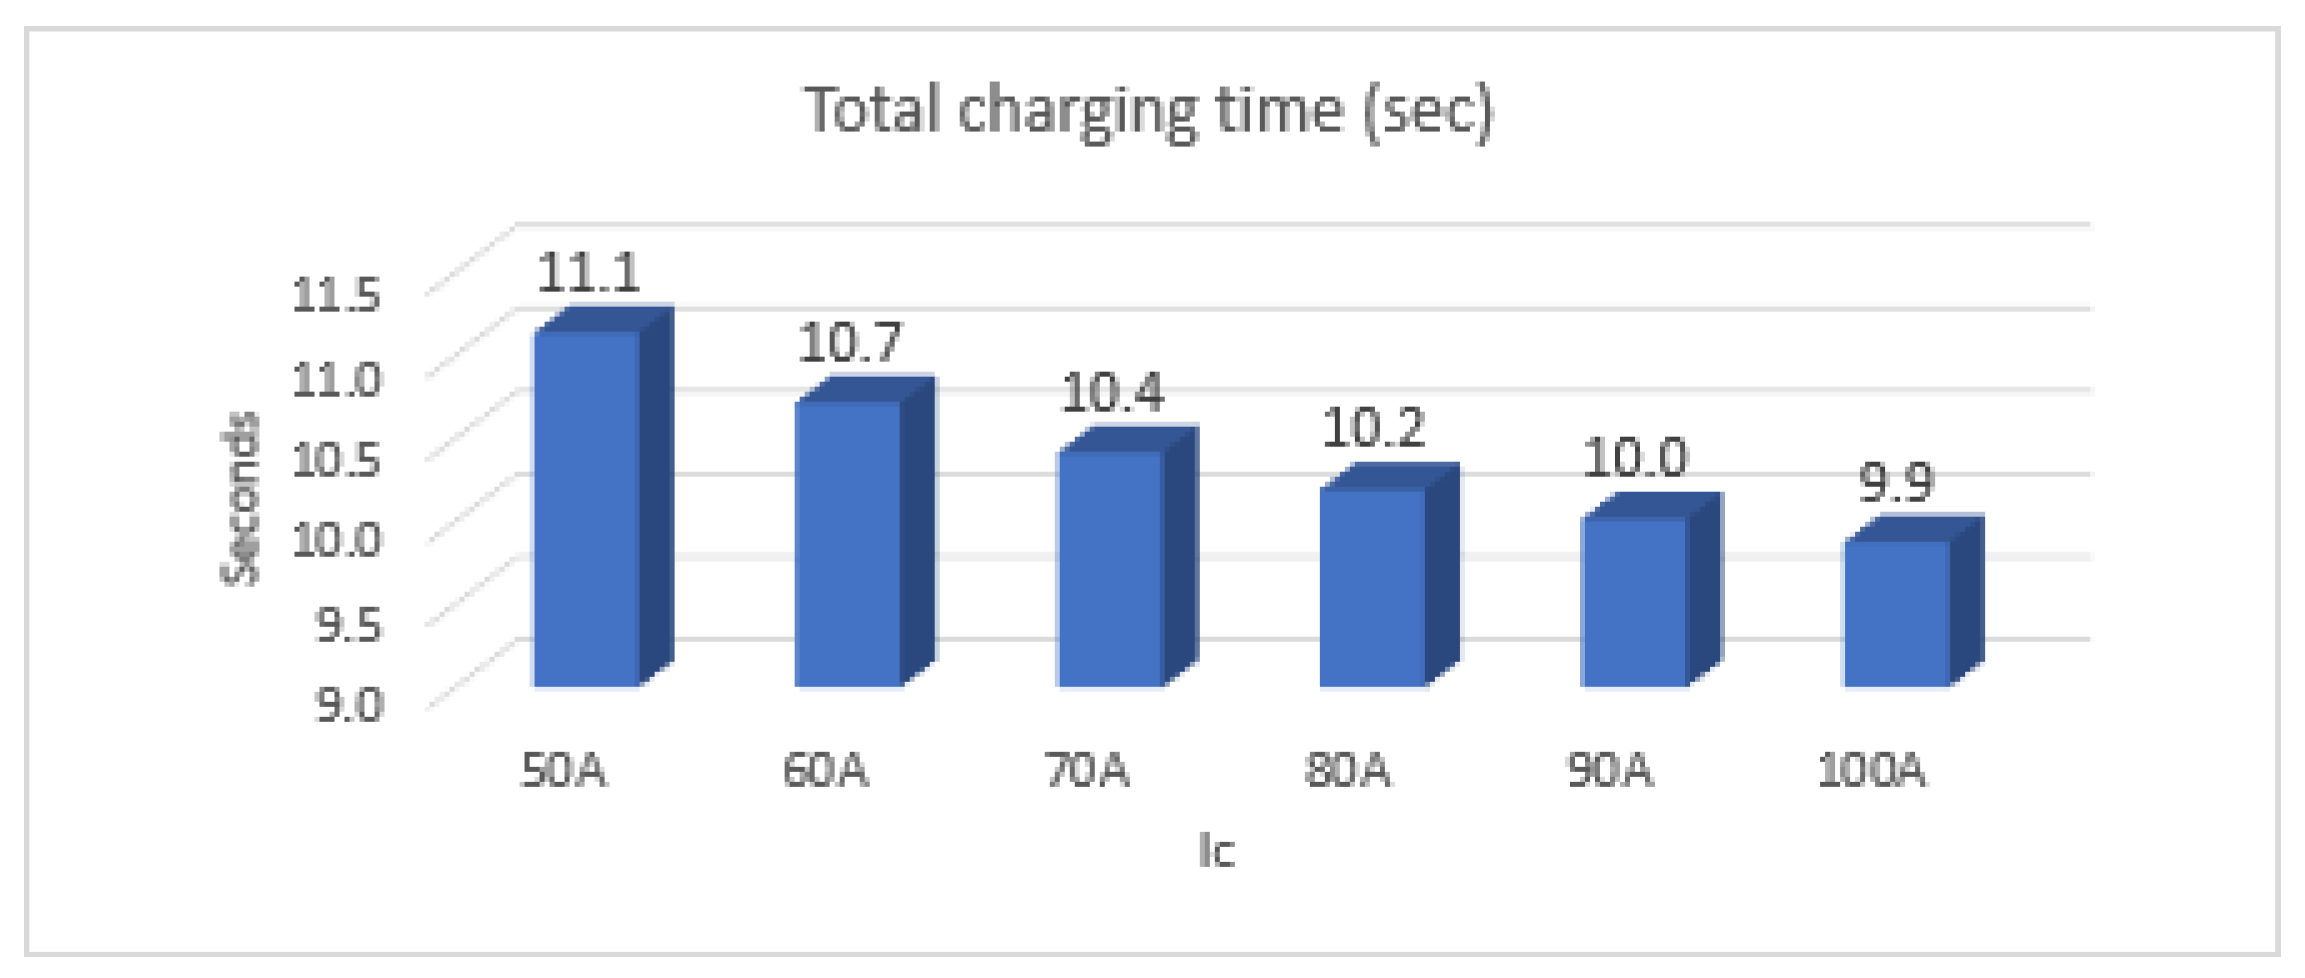
Figure 32.
Diagrams of SC circuit charging efficiencies in the case of a six-phase converter with ∆Vx = 0.6 V, ∆D0 = 25% at different constant currents.
Figure 32.
Diagrams of SC circuit charging efficiencies in the case of a six-phase converter with ∆Vx = 0.6 V, ∆D0 = 25% at different constant currents.
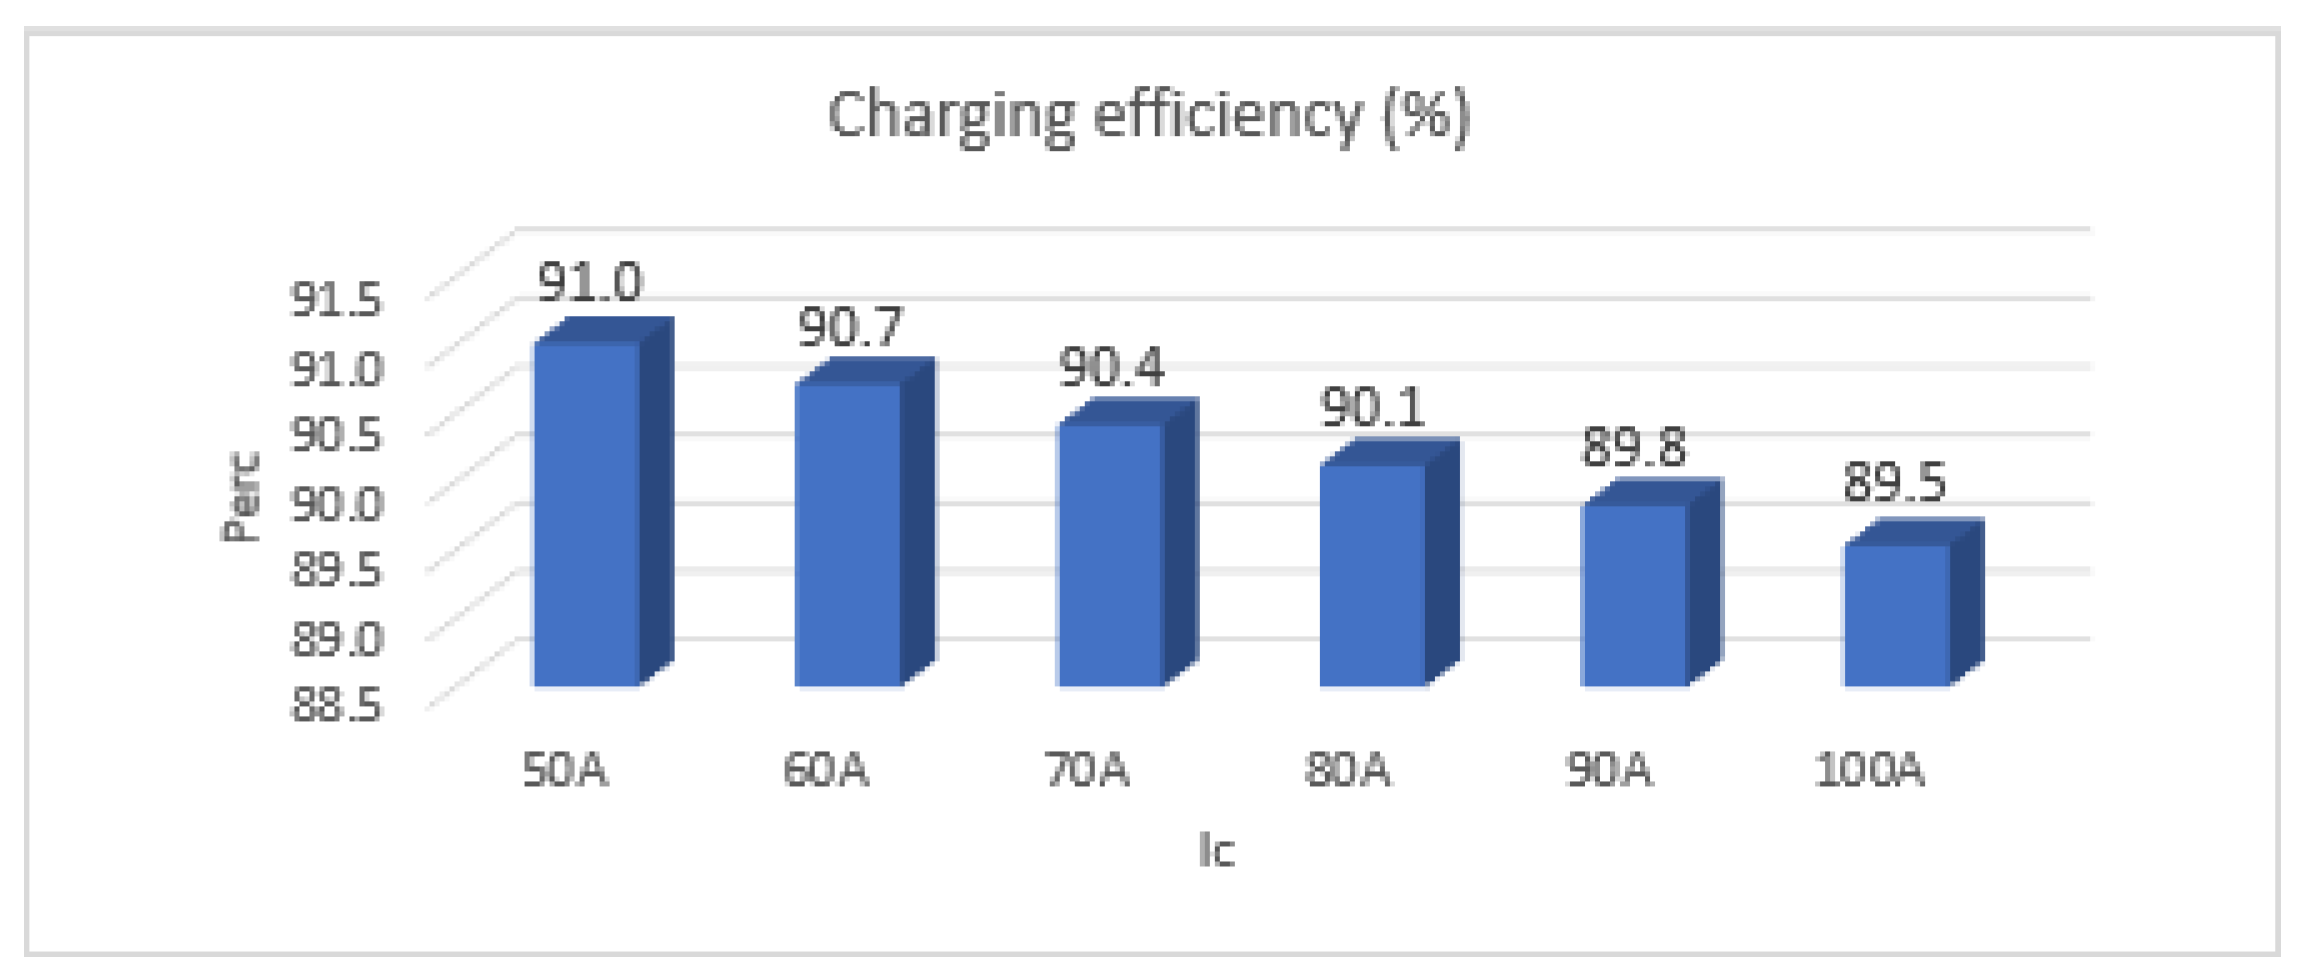
Figure 33.
(a) Experimental setup used for verification of theoretical results: 1—DC–DC converter, 2—current probe, 3—SC energy storage system, 4—electronic load, 5—DC power supply. (b) DC–DC converter experimental setup consisting of 1—inductors, 2—output capacitor, 3—STM32 microcontroller control board, 4—two or three modified TIDA-00909 three-phase GaN IC-based power stage boards.
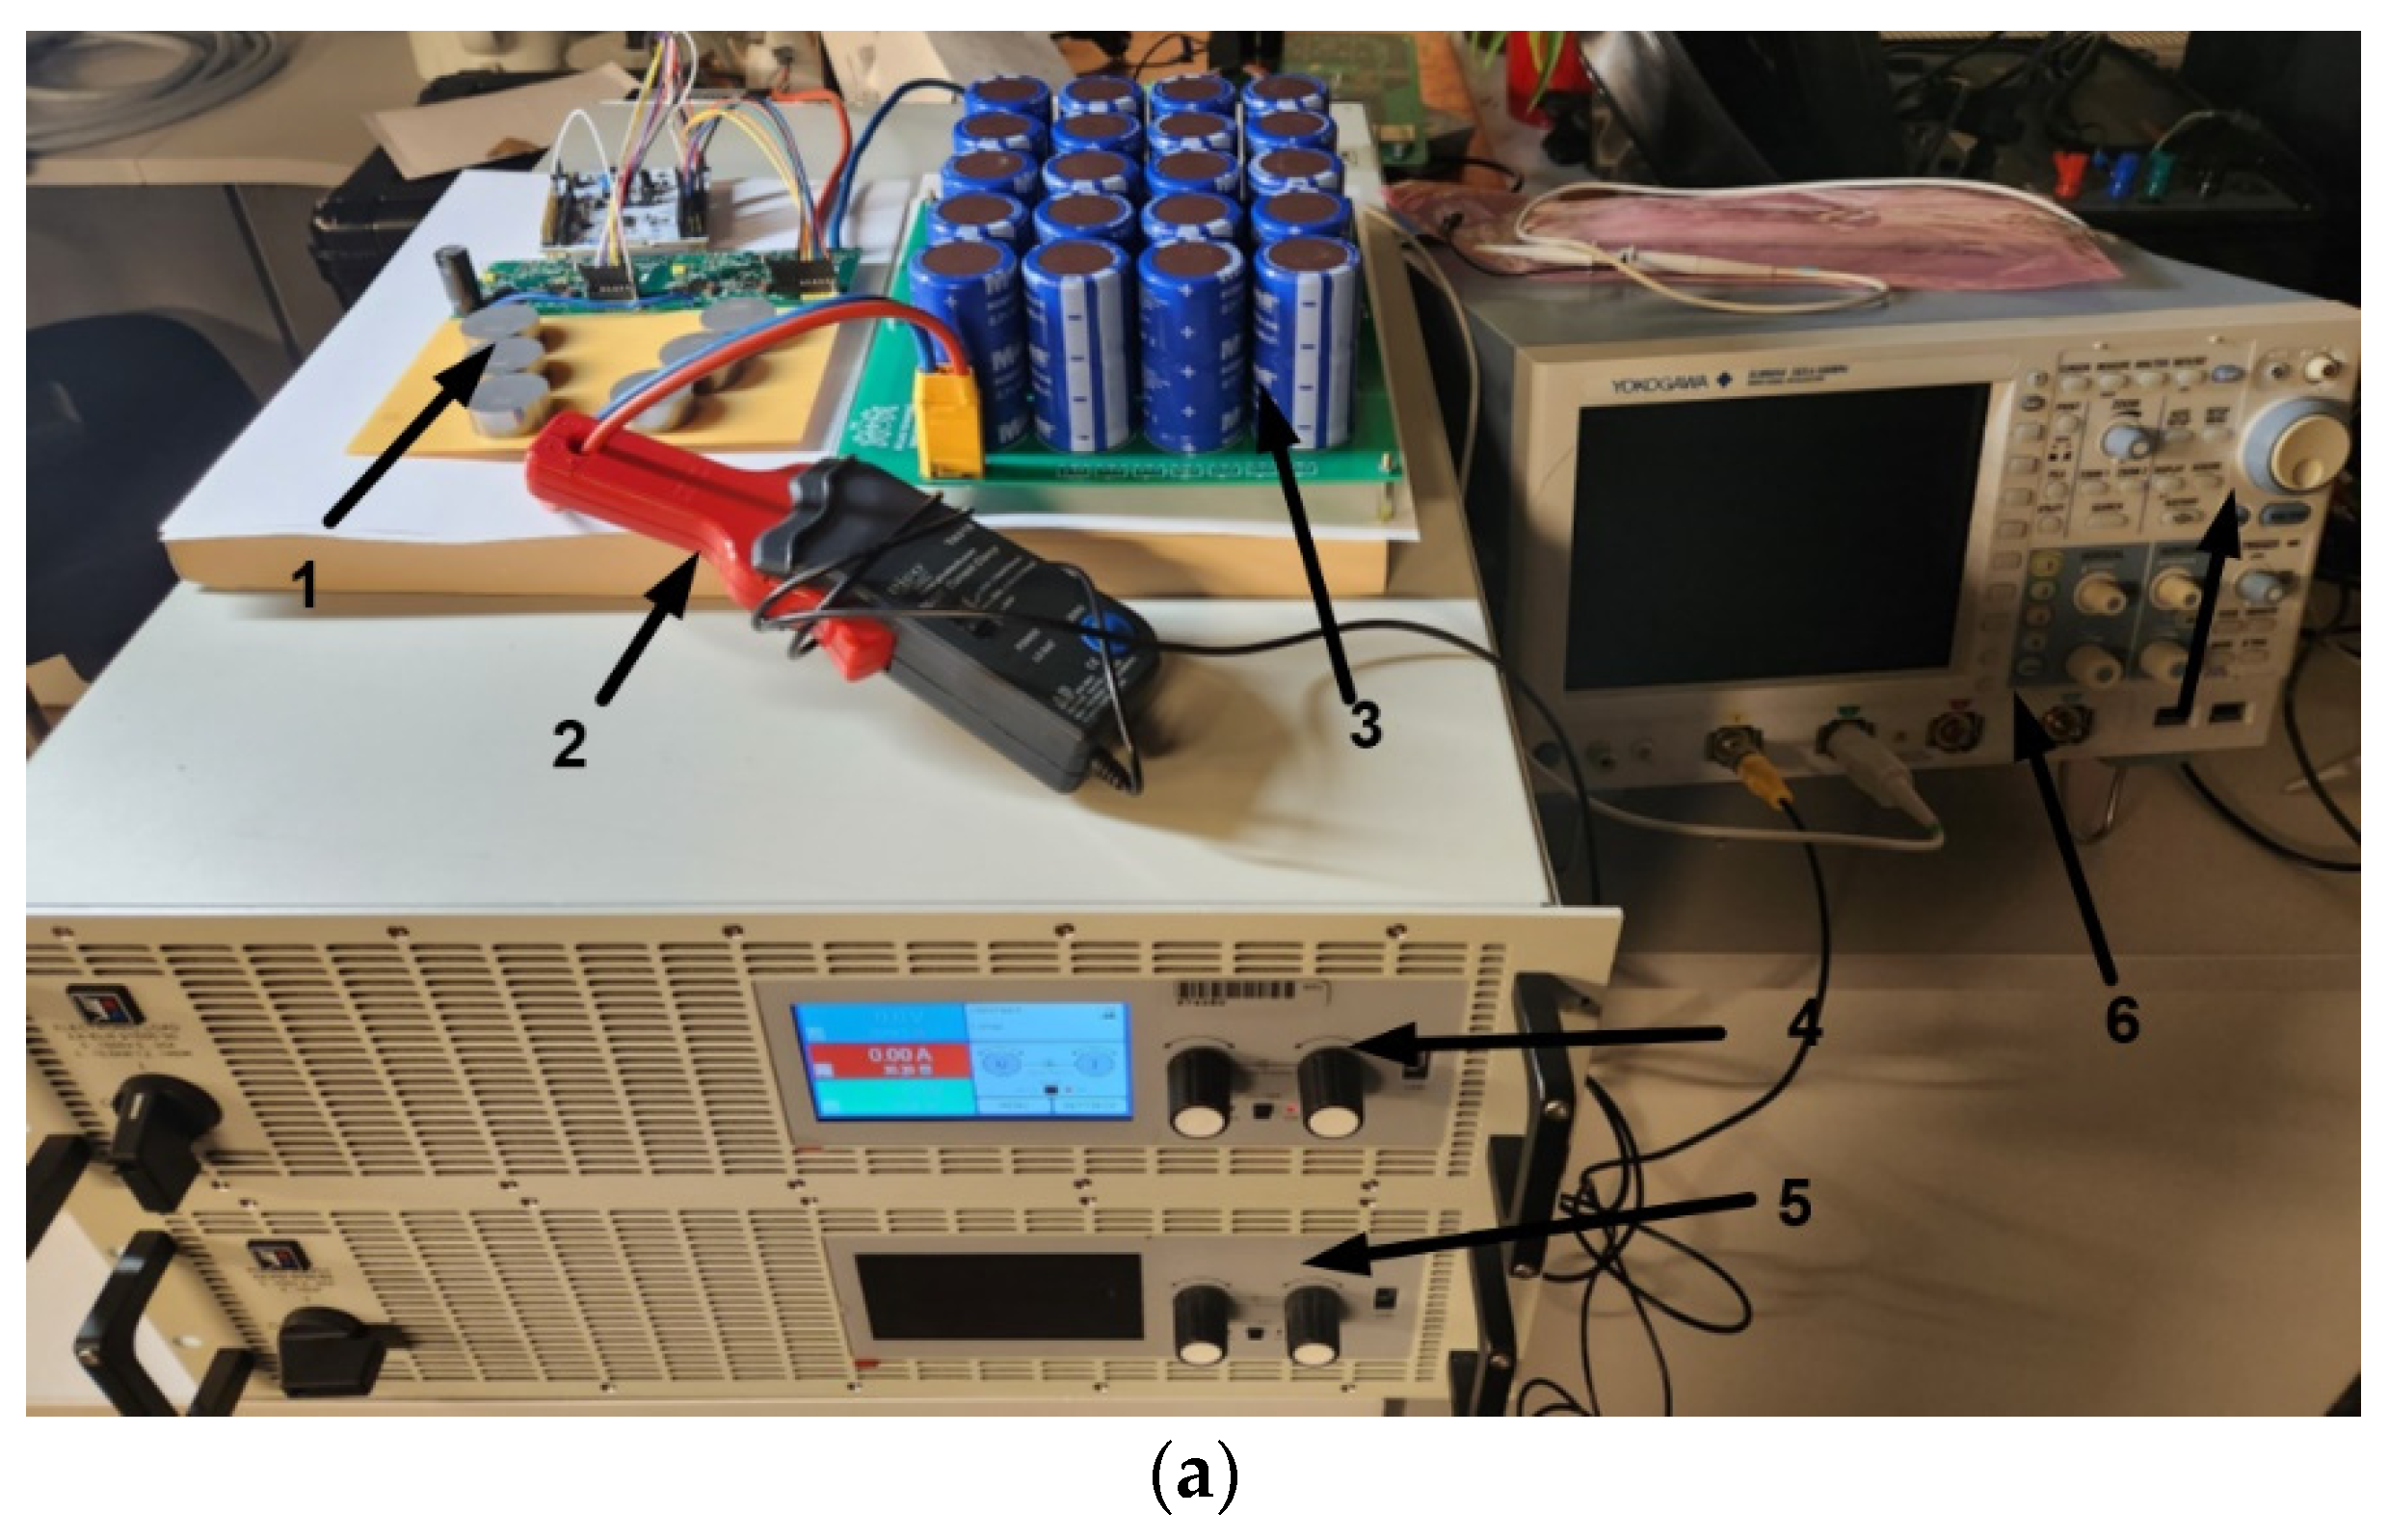

Figure 34.
Interleaved PWM signals generated by STM32G474RET6 microcontroller.
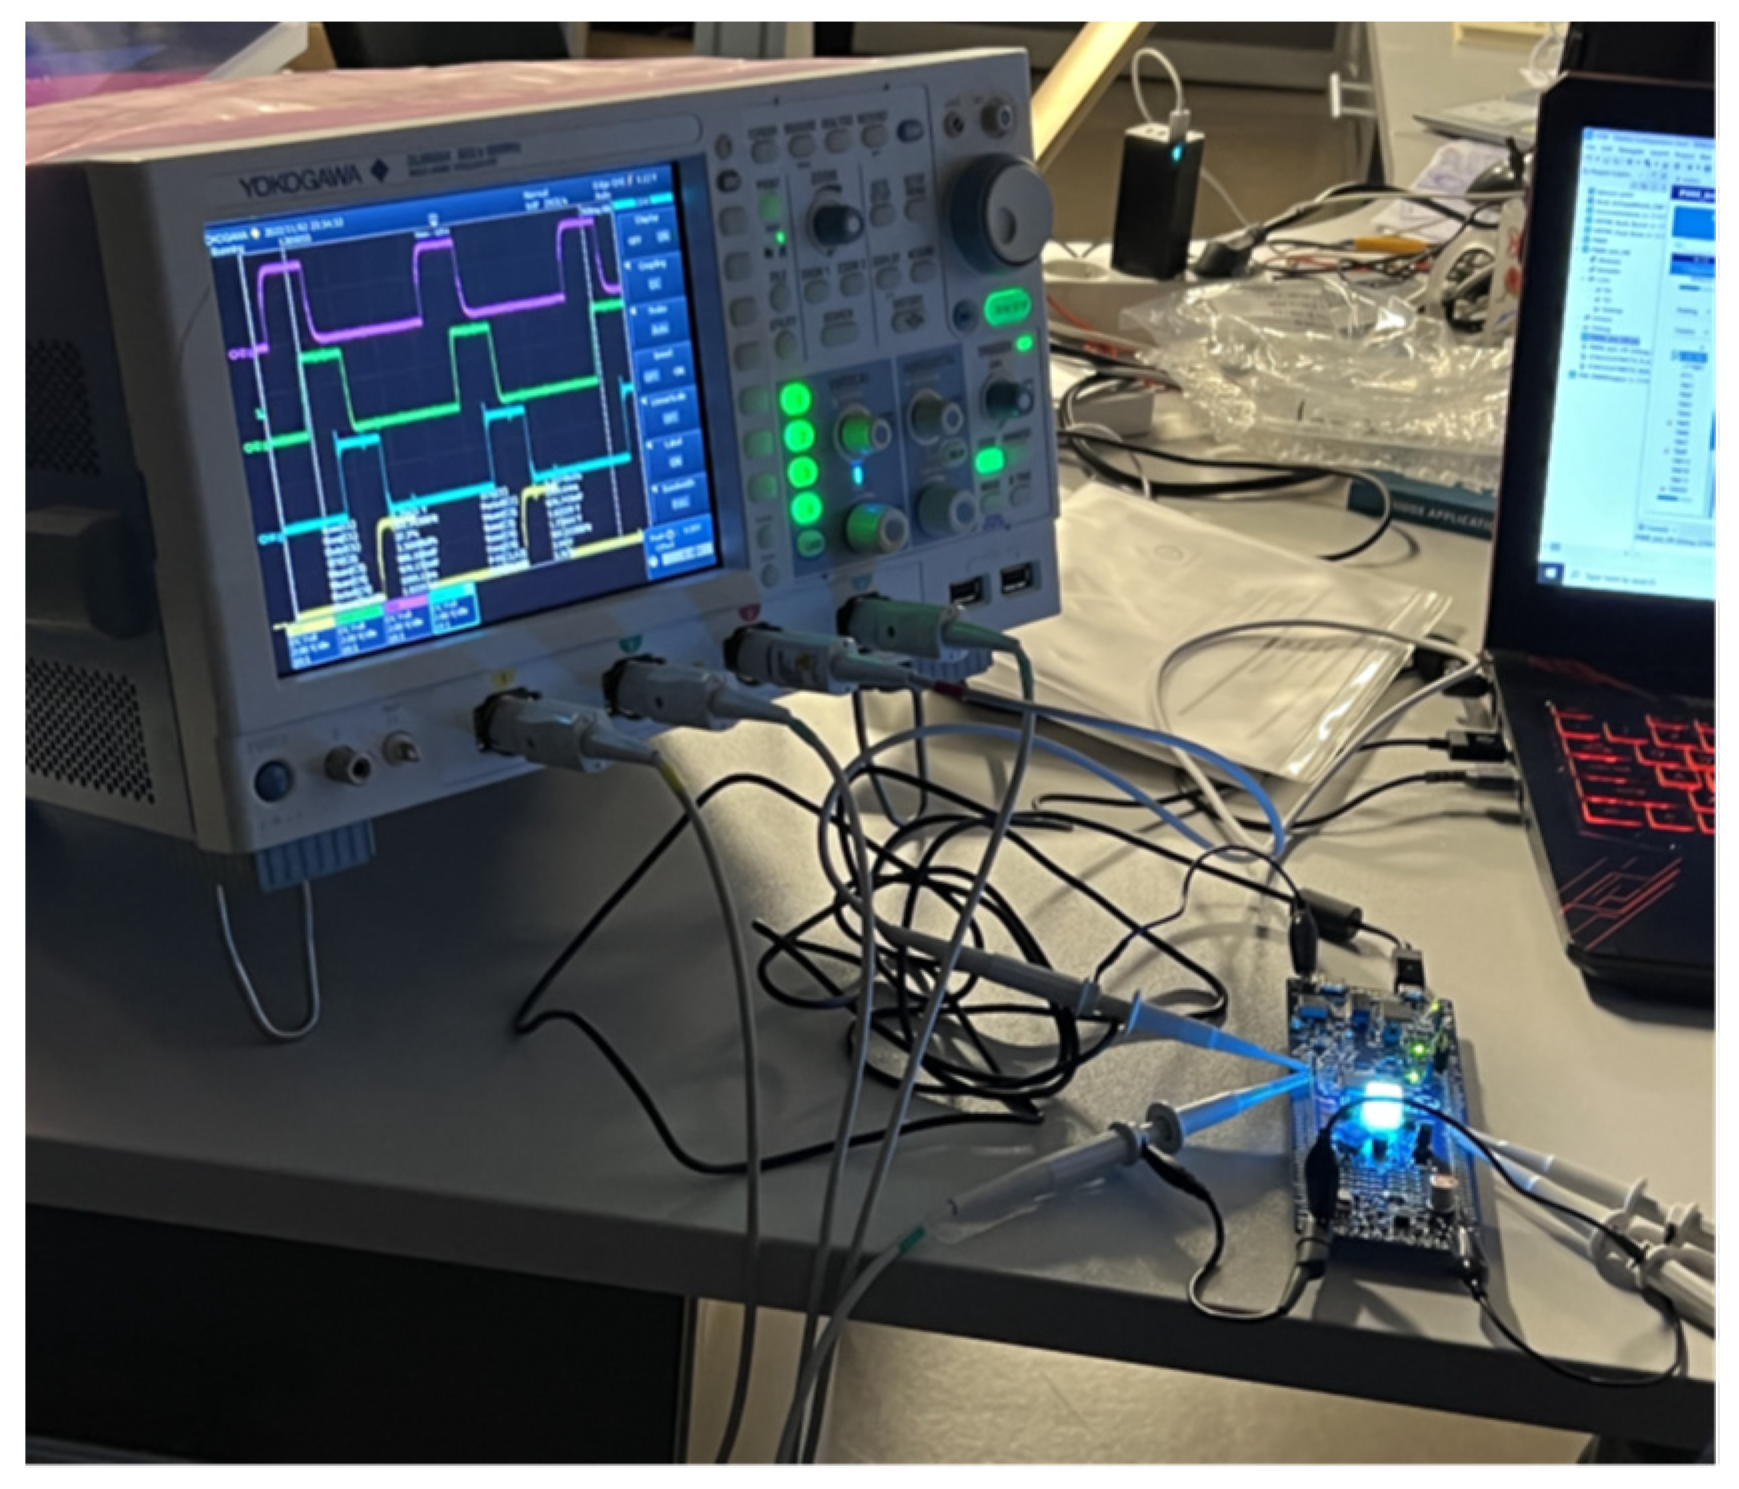
Figure 35.
SC energy storage consisting of 20 20 Maxwell BCAP0450 P270 S18 supercapacitors.
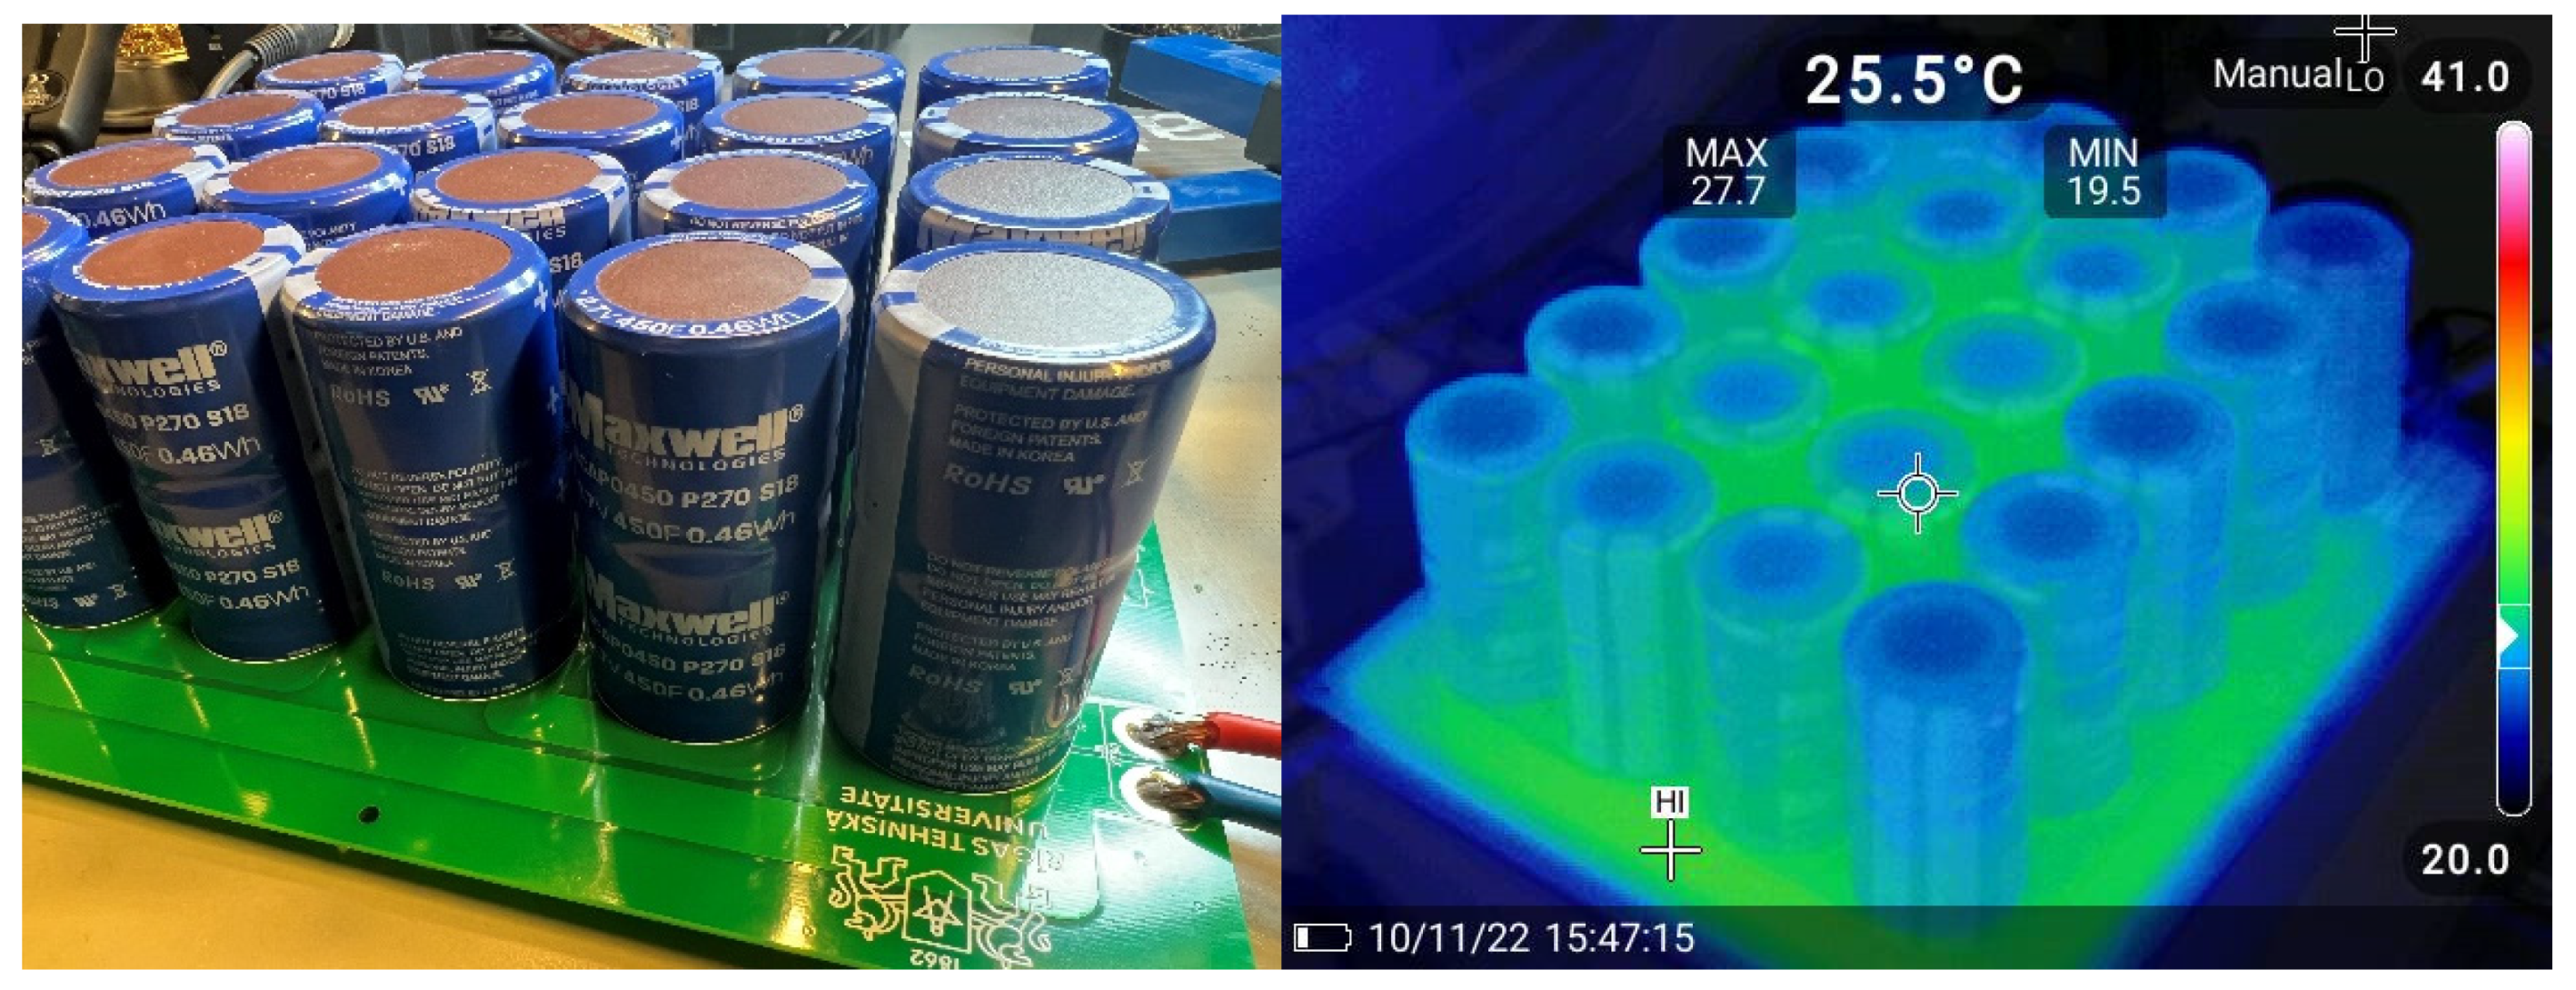
Figure 36.
Zero-current ripple duty cycle values of six-phase and eight-phase converters with duty cycle values corresponding to calculated output voltages Vout of the converter plotted on the x-axis.
Figure 36.
Zero-current ripple duty cycle values of six-phase and eight-phase converters with duty cycle values corresponding to calculated output voltages Vout of the converter plotted on the x-axis.
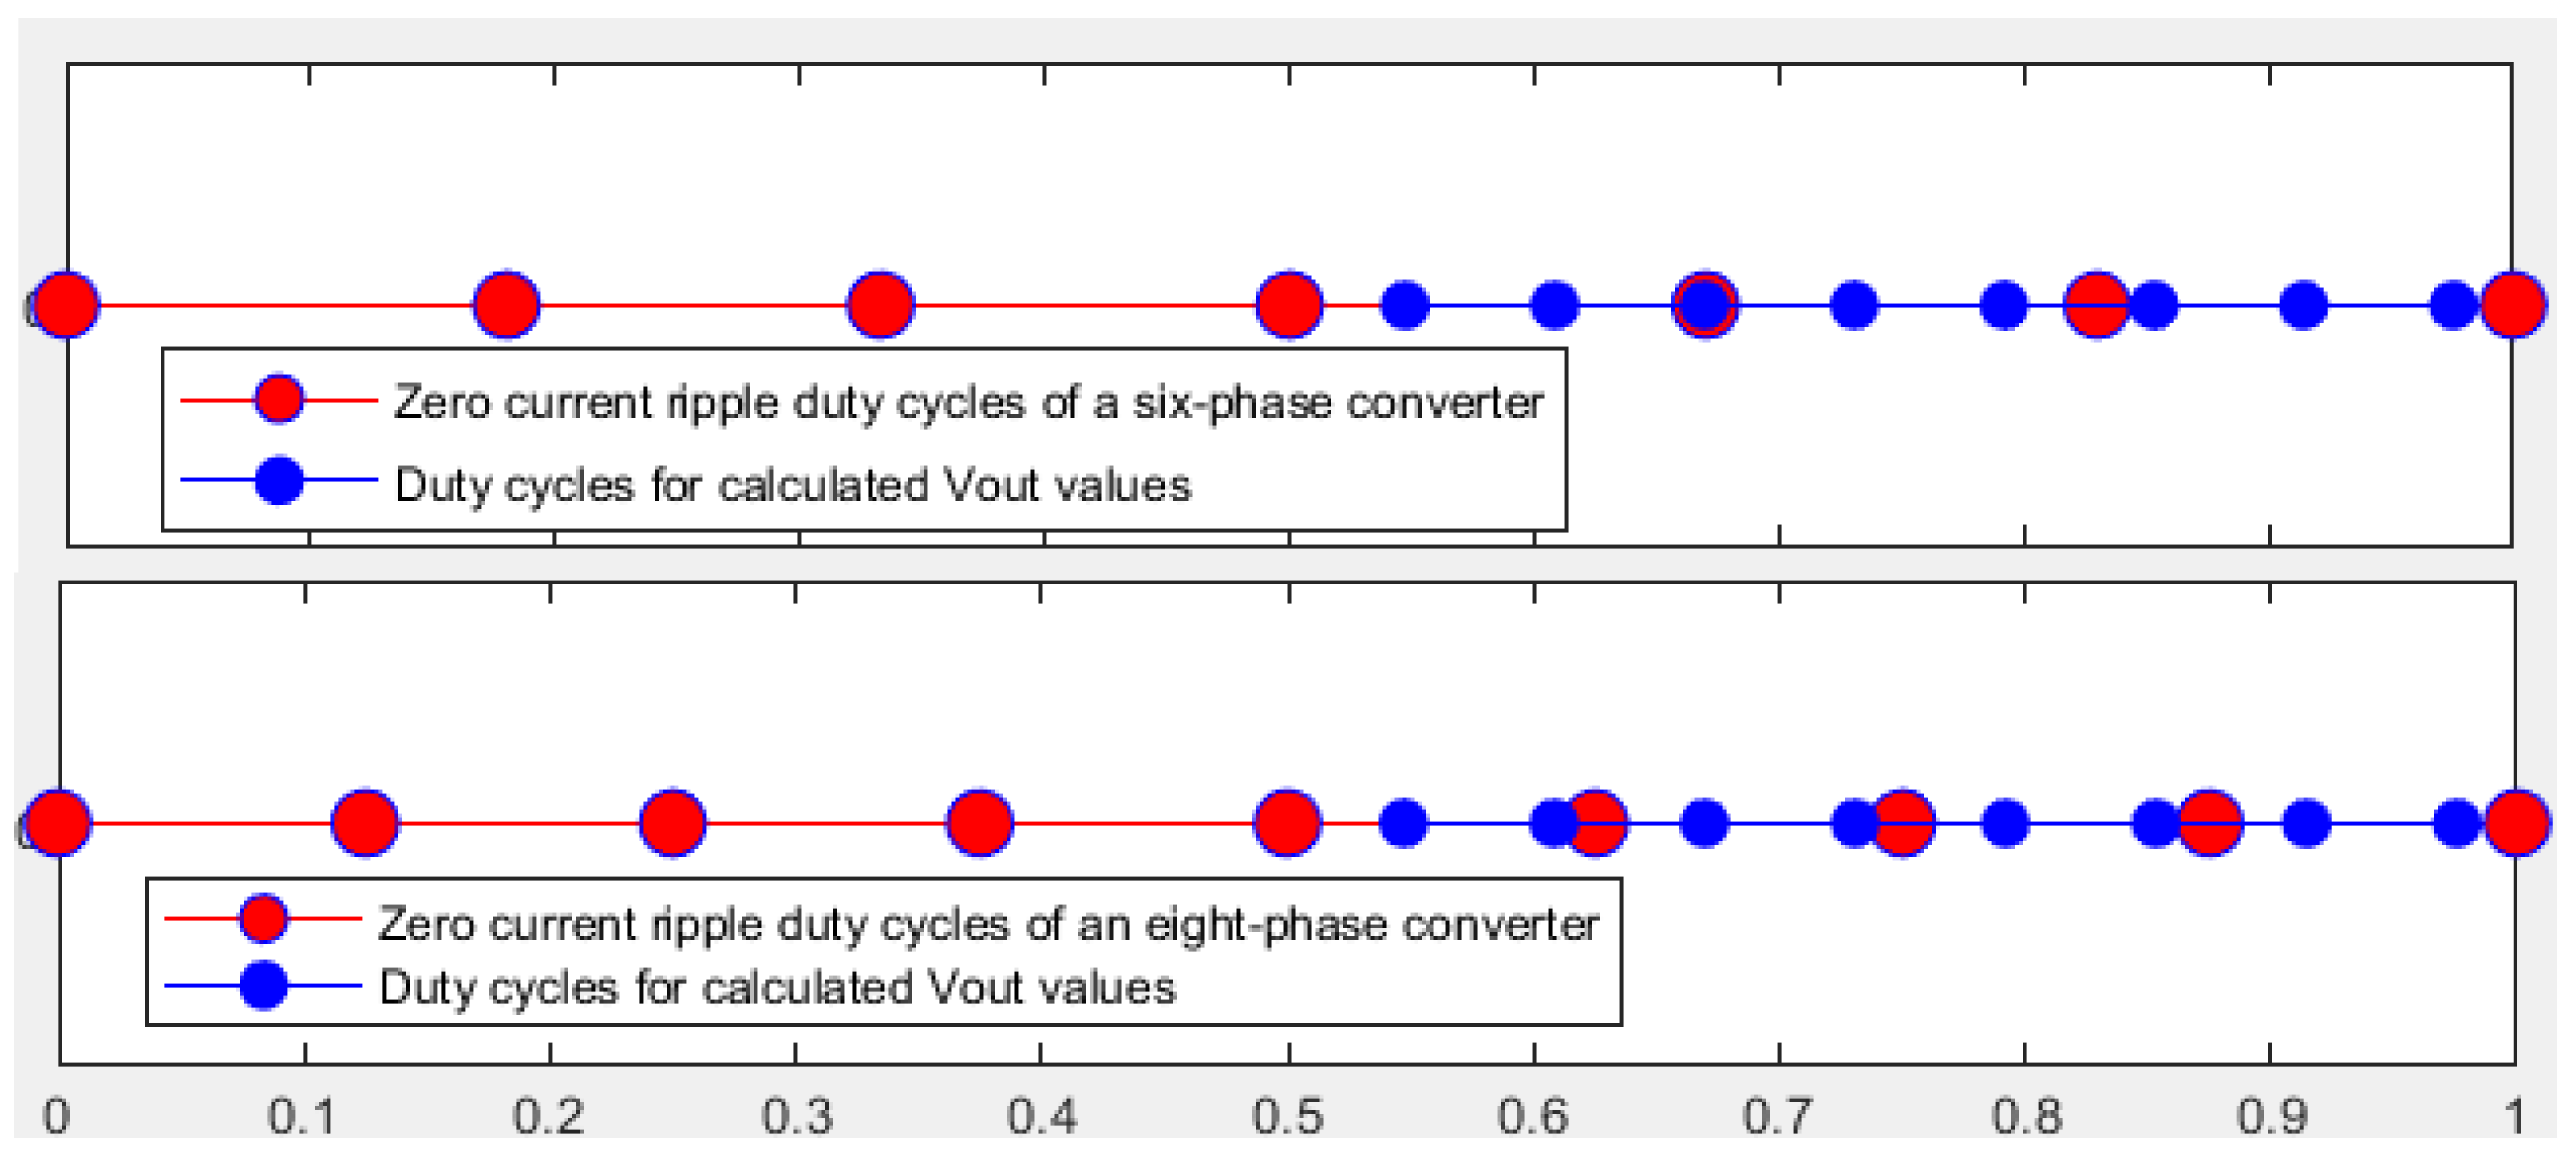
Figure 37.
SC charging simulation result diagrams.

Figure 38.
Experimentally obtained diagrams of charging voltage and current.

Figure 39.
SC circuit board conducive traces (red).

Figure 40.
Setup for measuring SC circuit board trace resistance using a micro-ohmmeter.
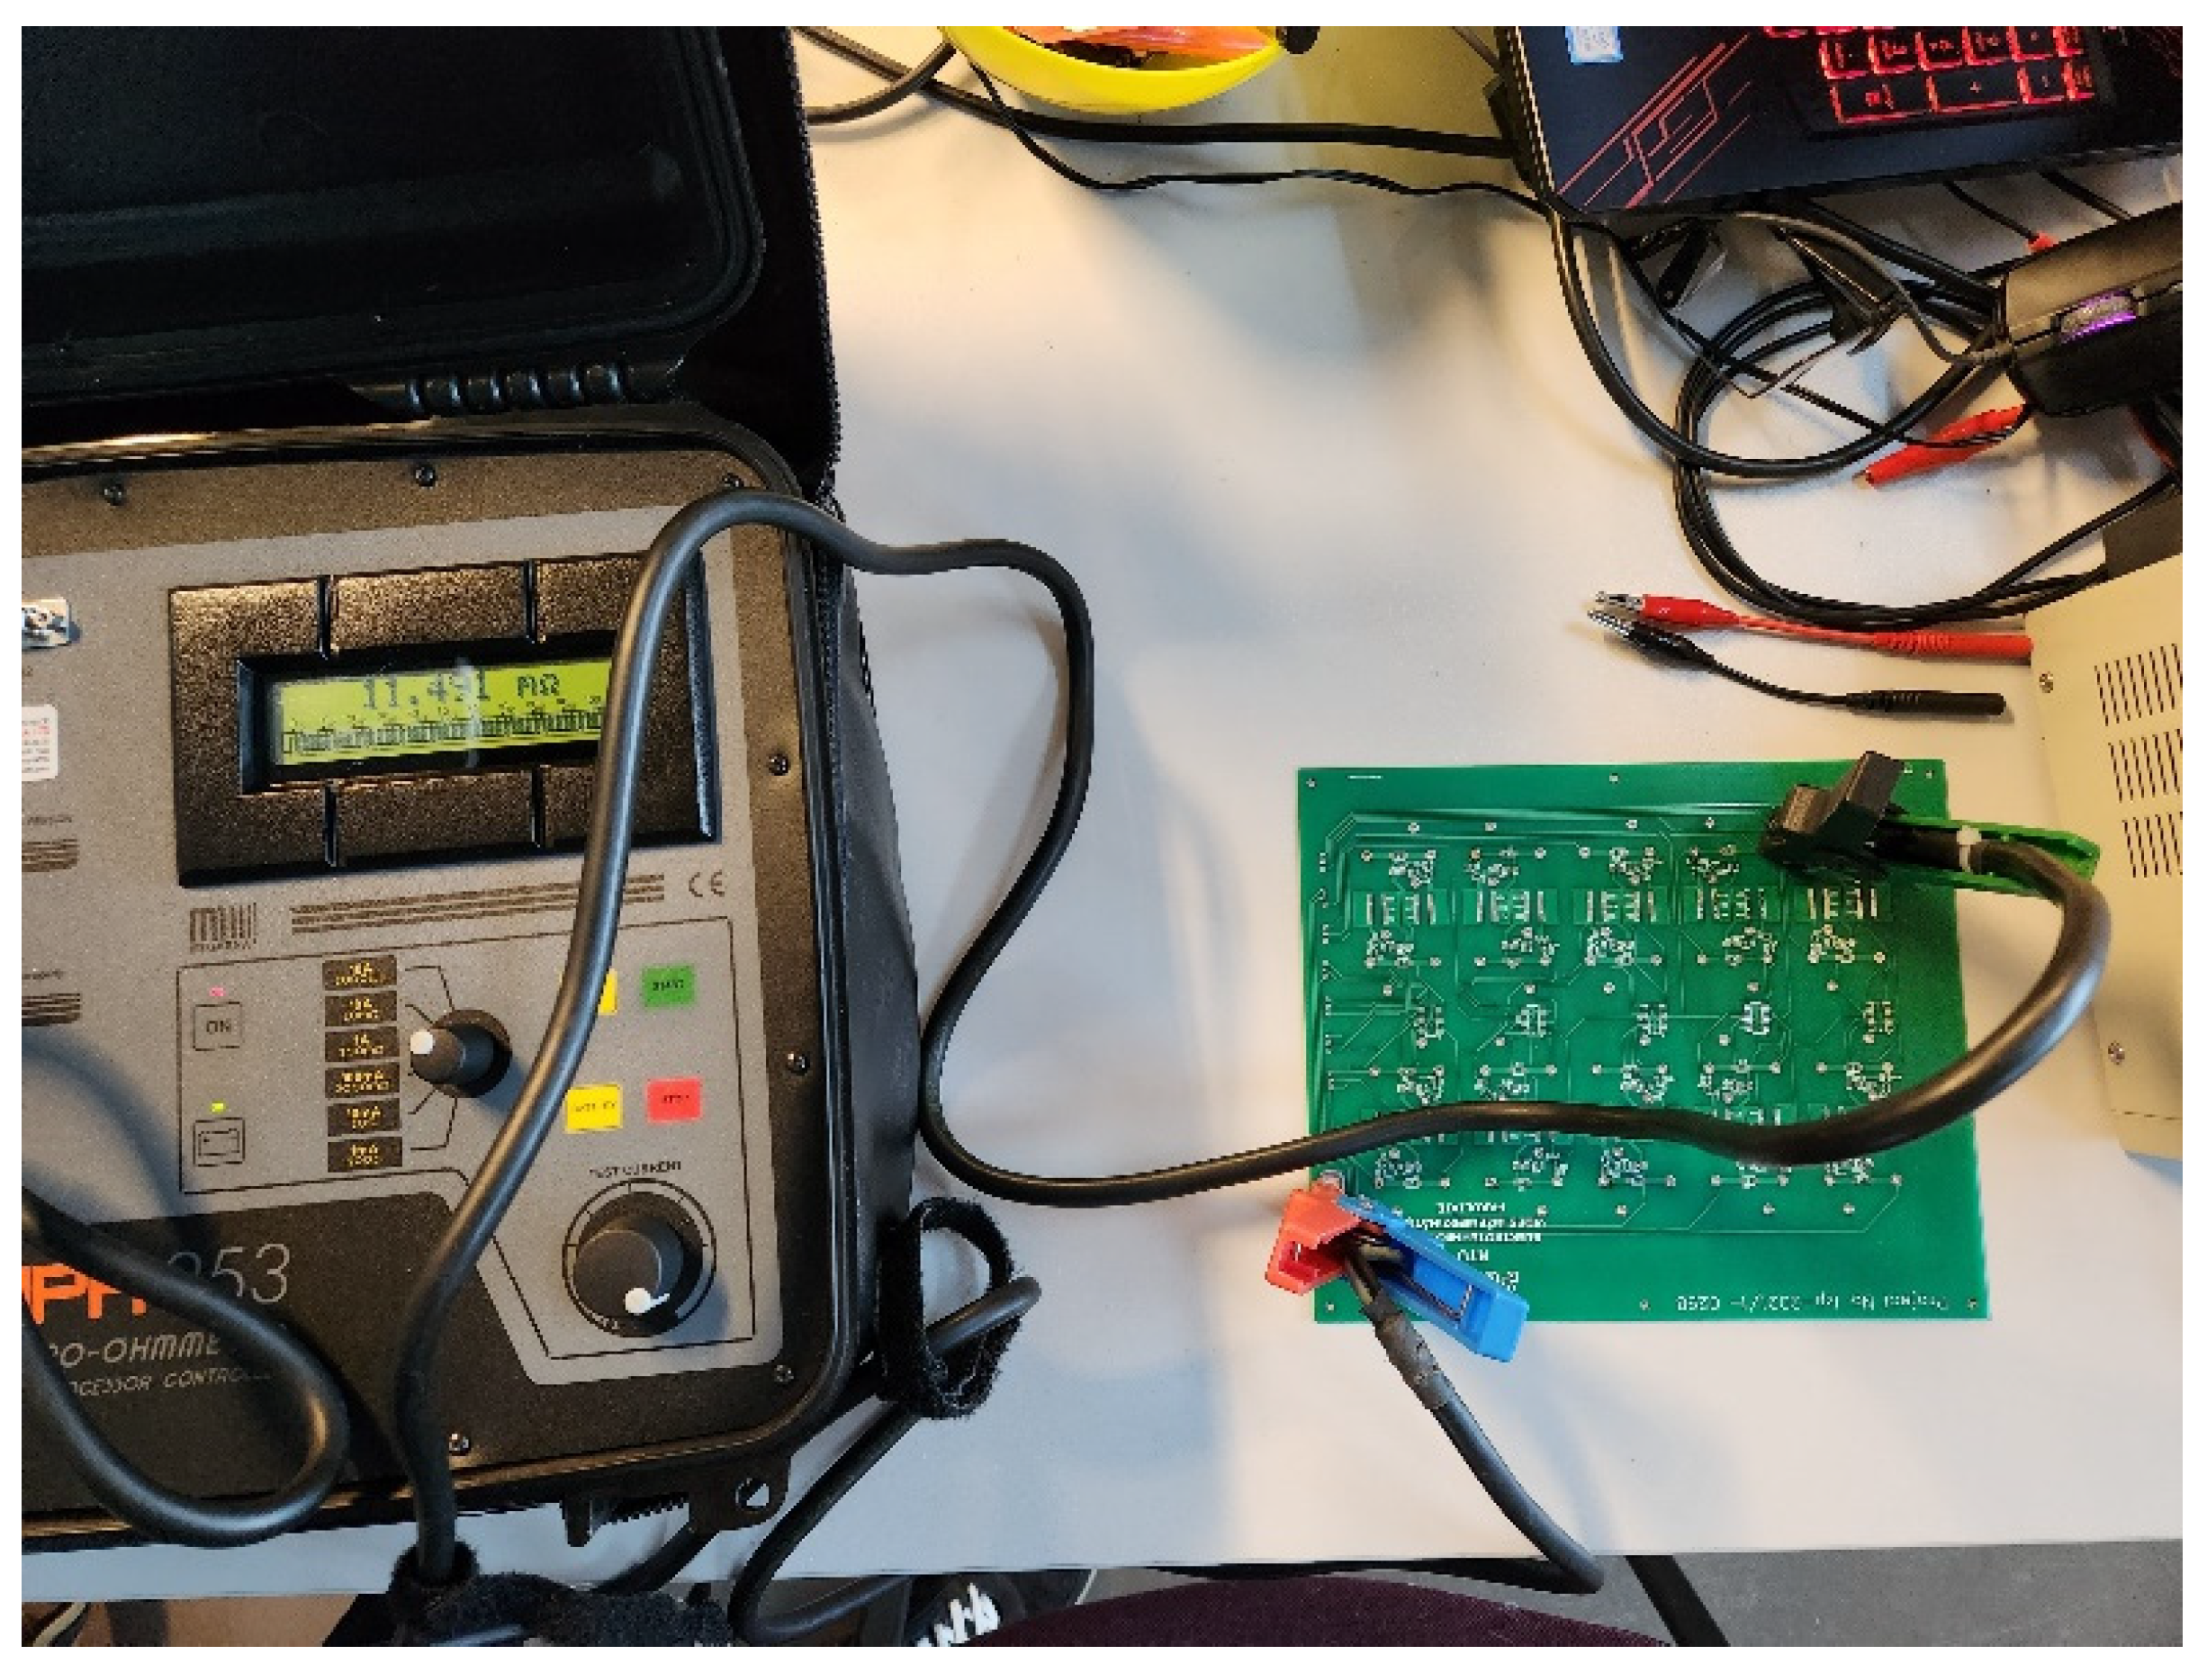
Figure 41.
SC charging simulation result diagrams.

Figure 42.
Minimum and maximum duty cycles of permissible duty cycle regions of an eight-phase converter.
Figure 42.
Minimum and maximum duty cycles of permissible duty cycle regions of an eight-phase converter.
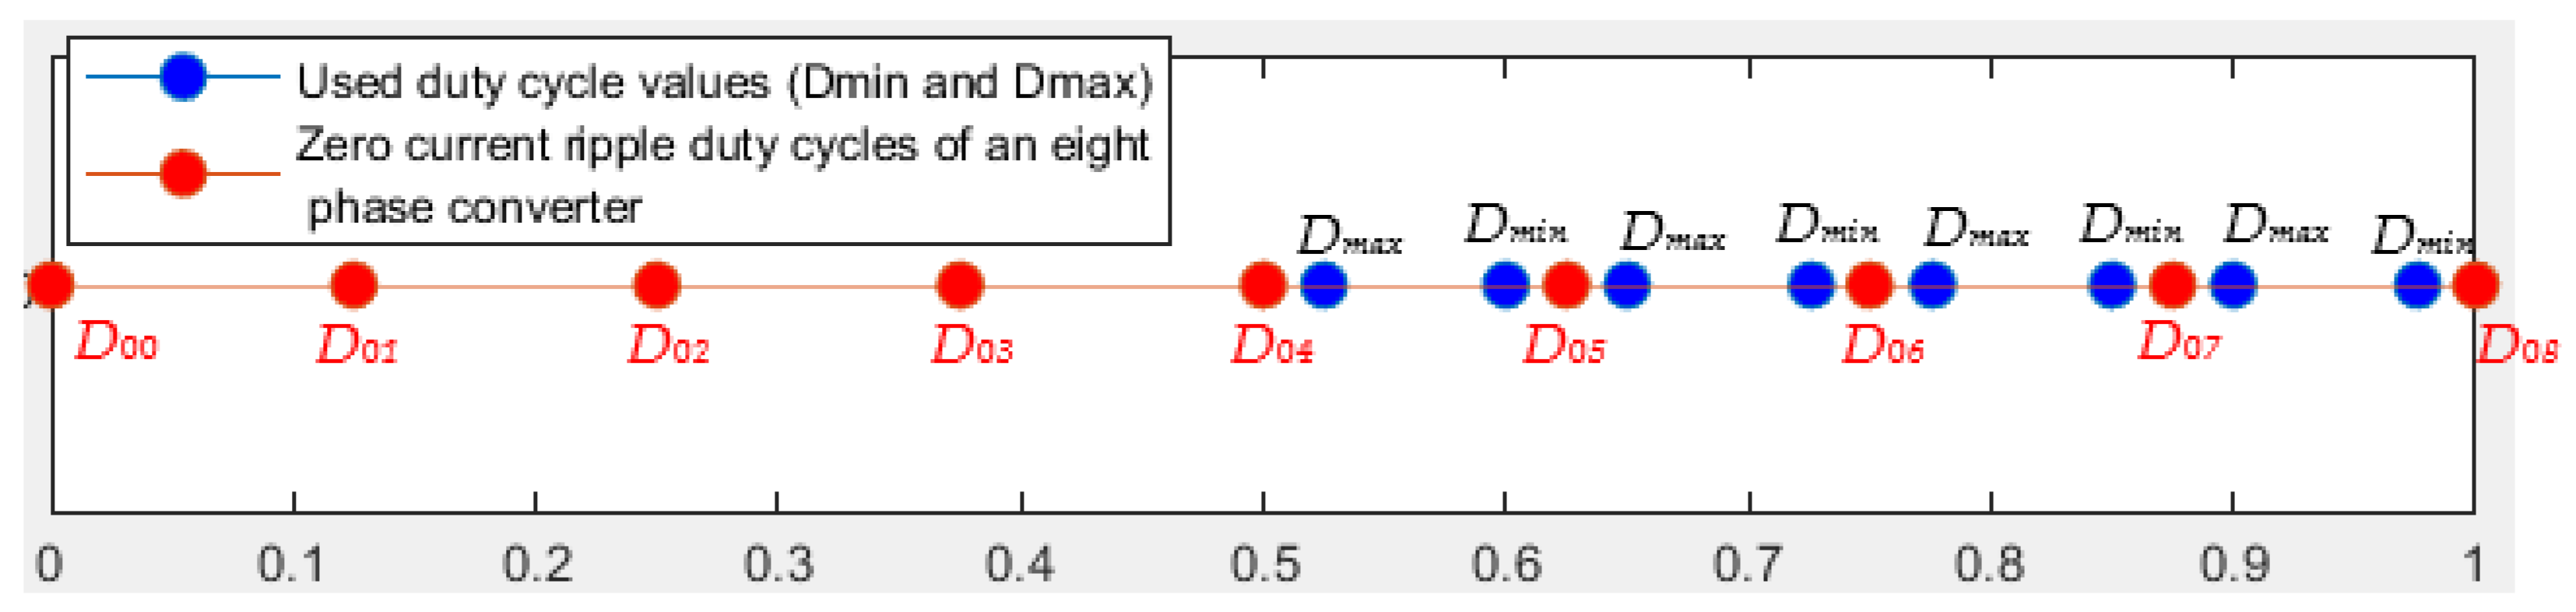
Figure 43.
Simulation results of the cases with considering (red) and without considering the SC circuit board trace resistance.
Figure 43.
Simulation results of the cases with considering (red) and without considering the SC circuit board trace resistance.
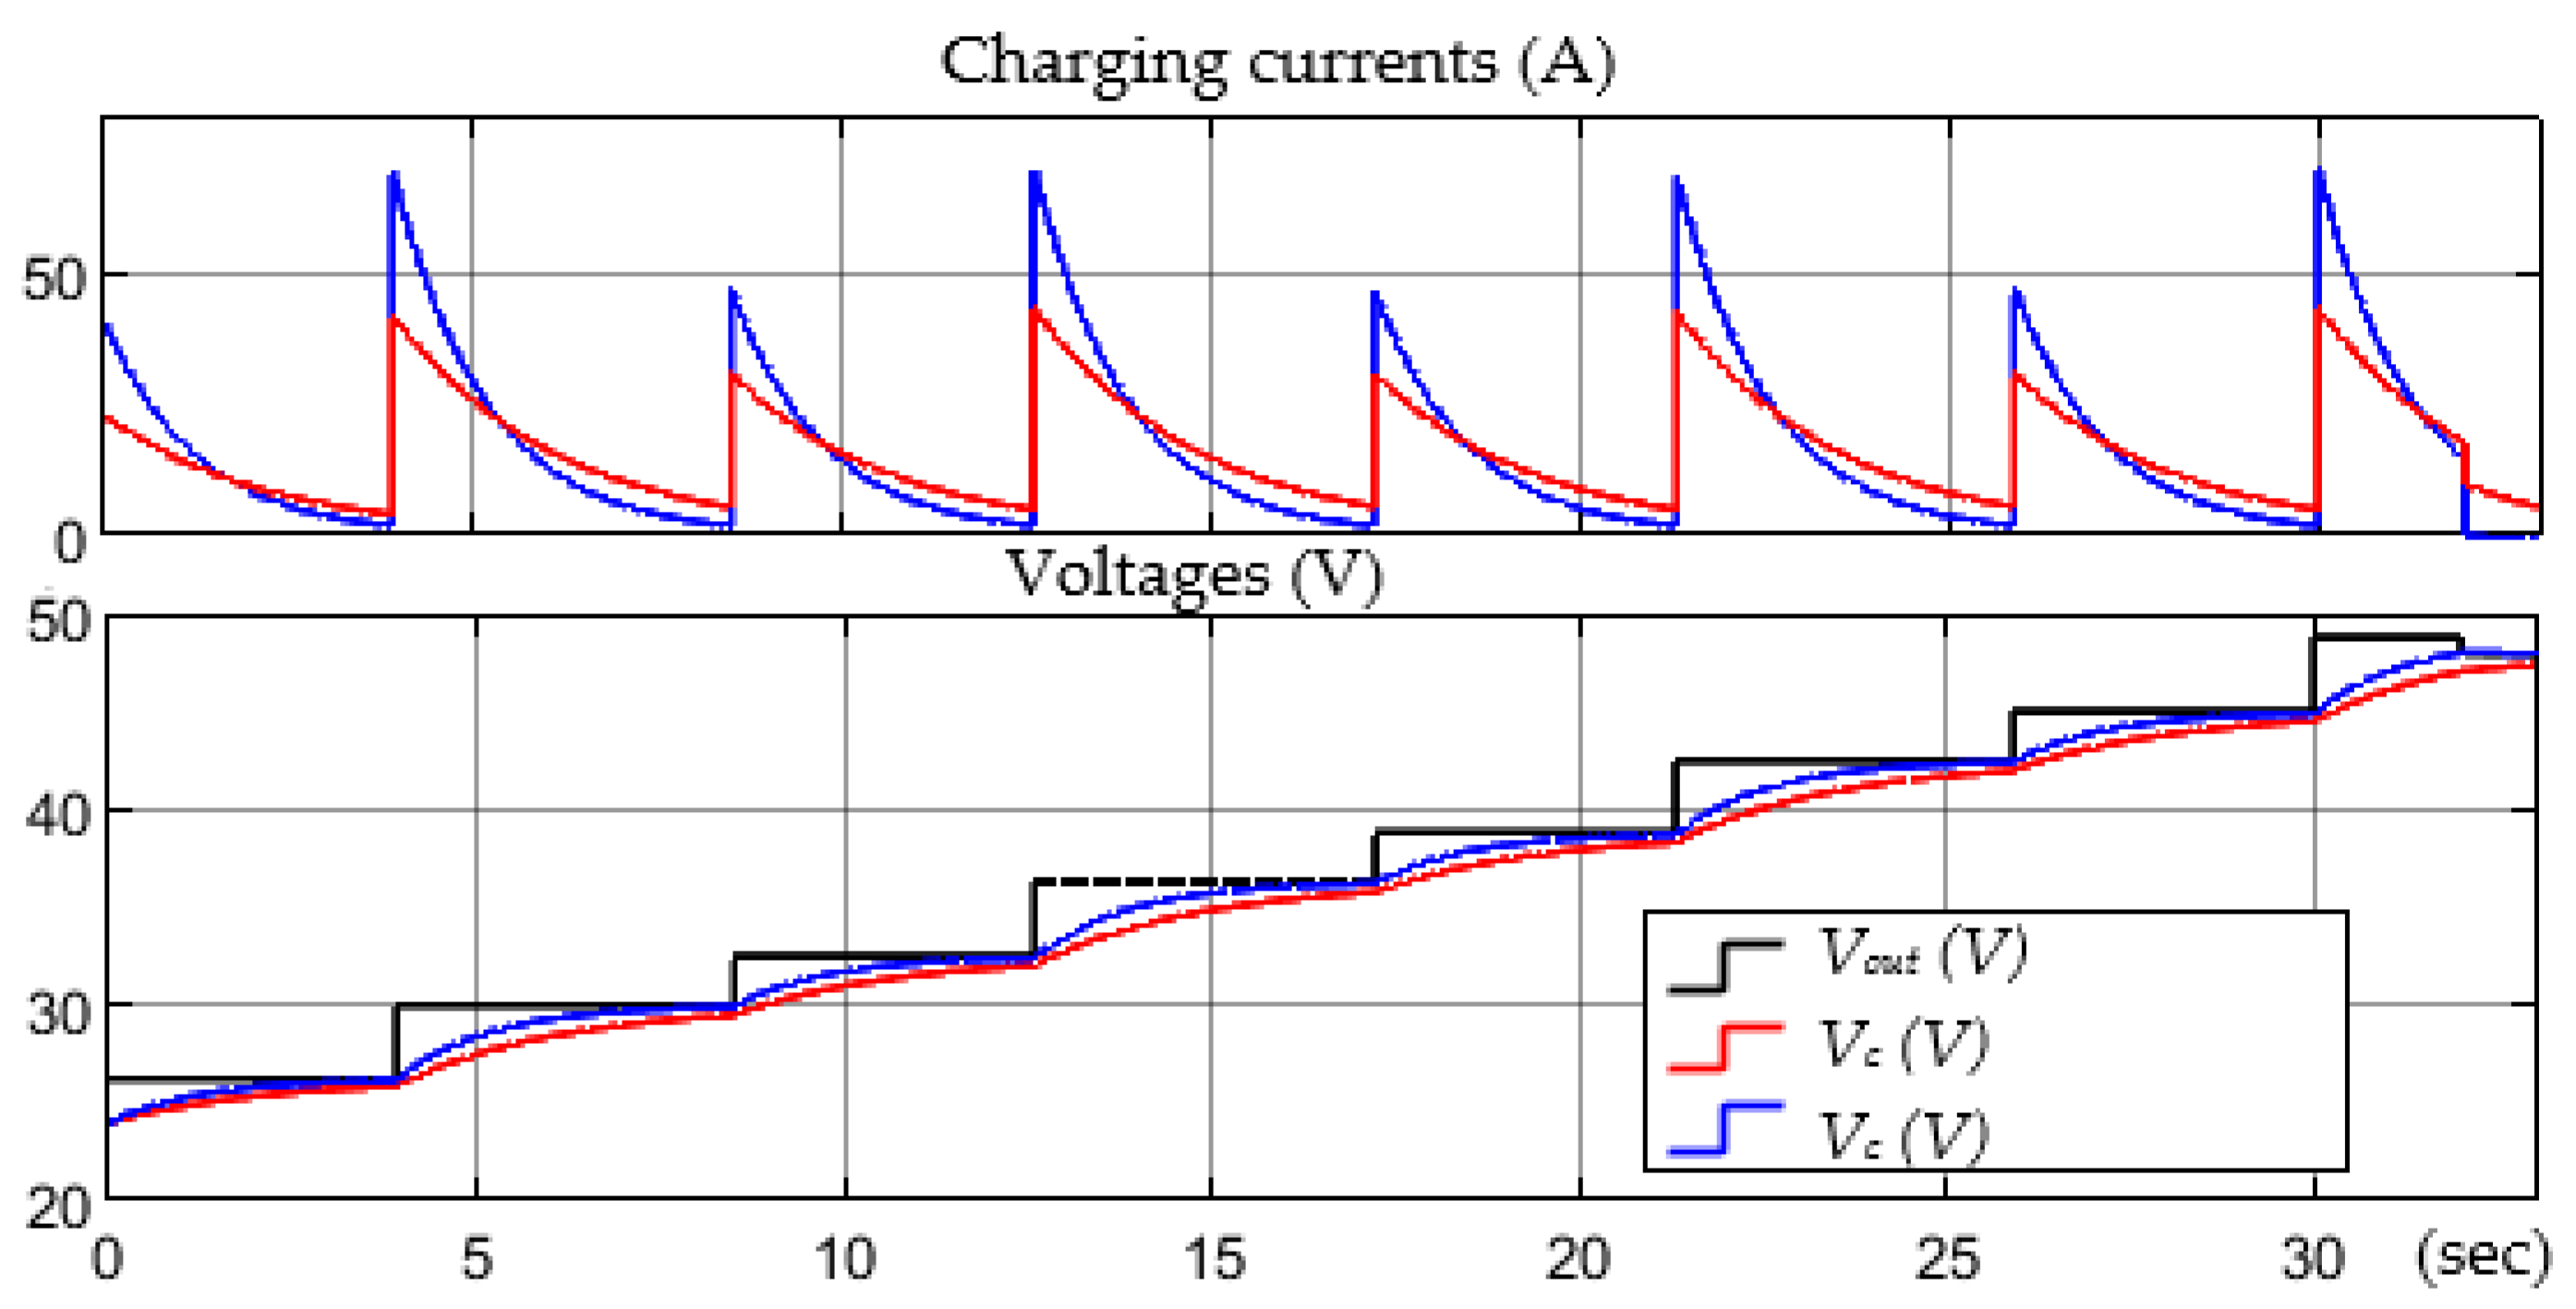
Figure 44.
Experimentally obtained diagrams of charging current and voltage.
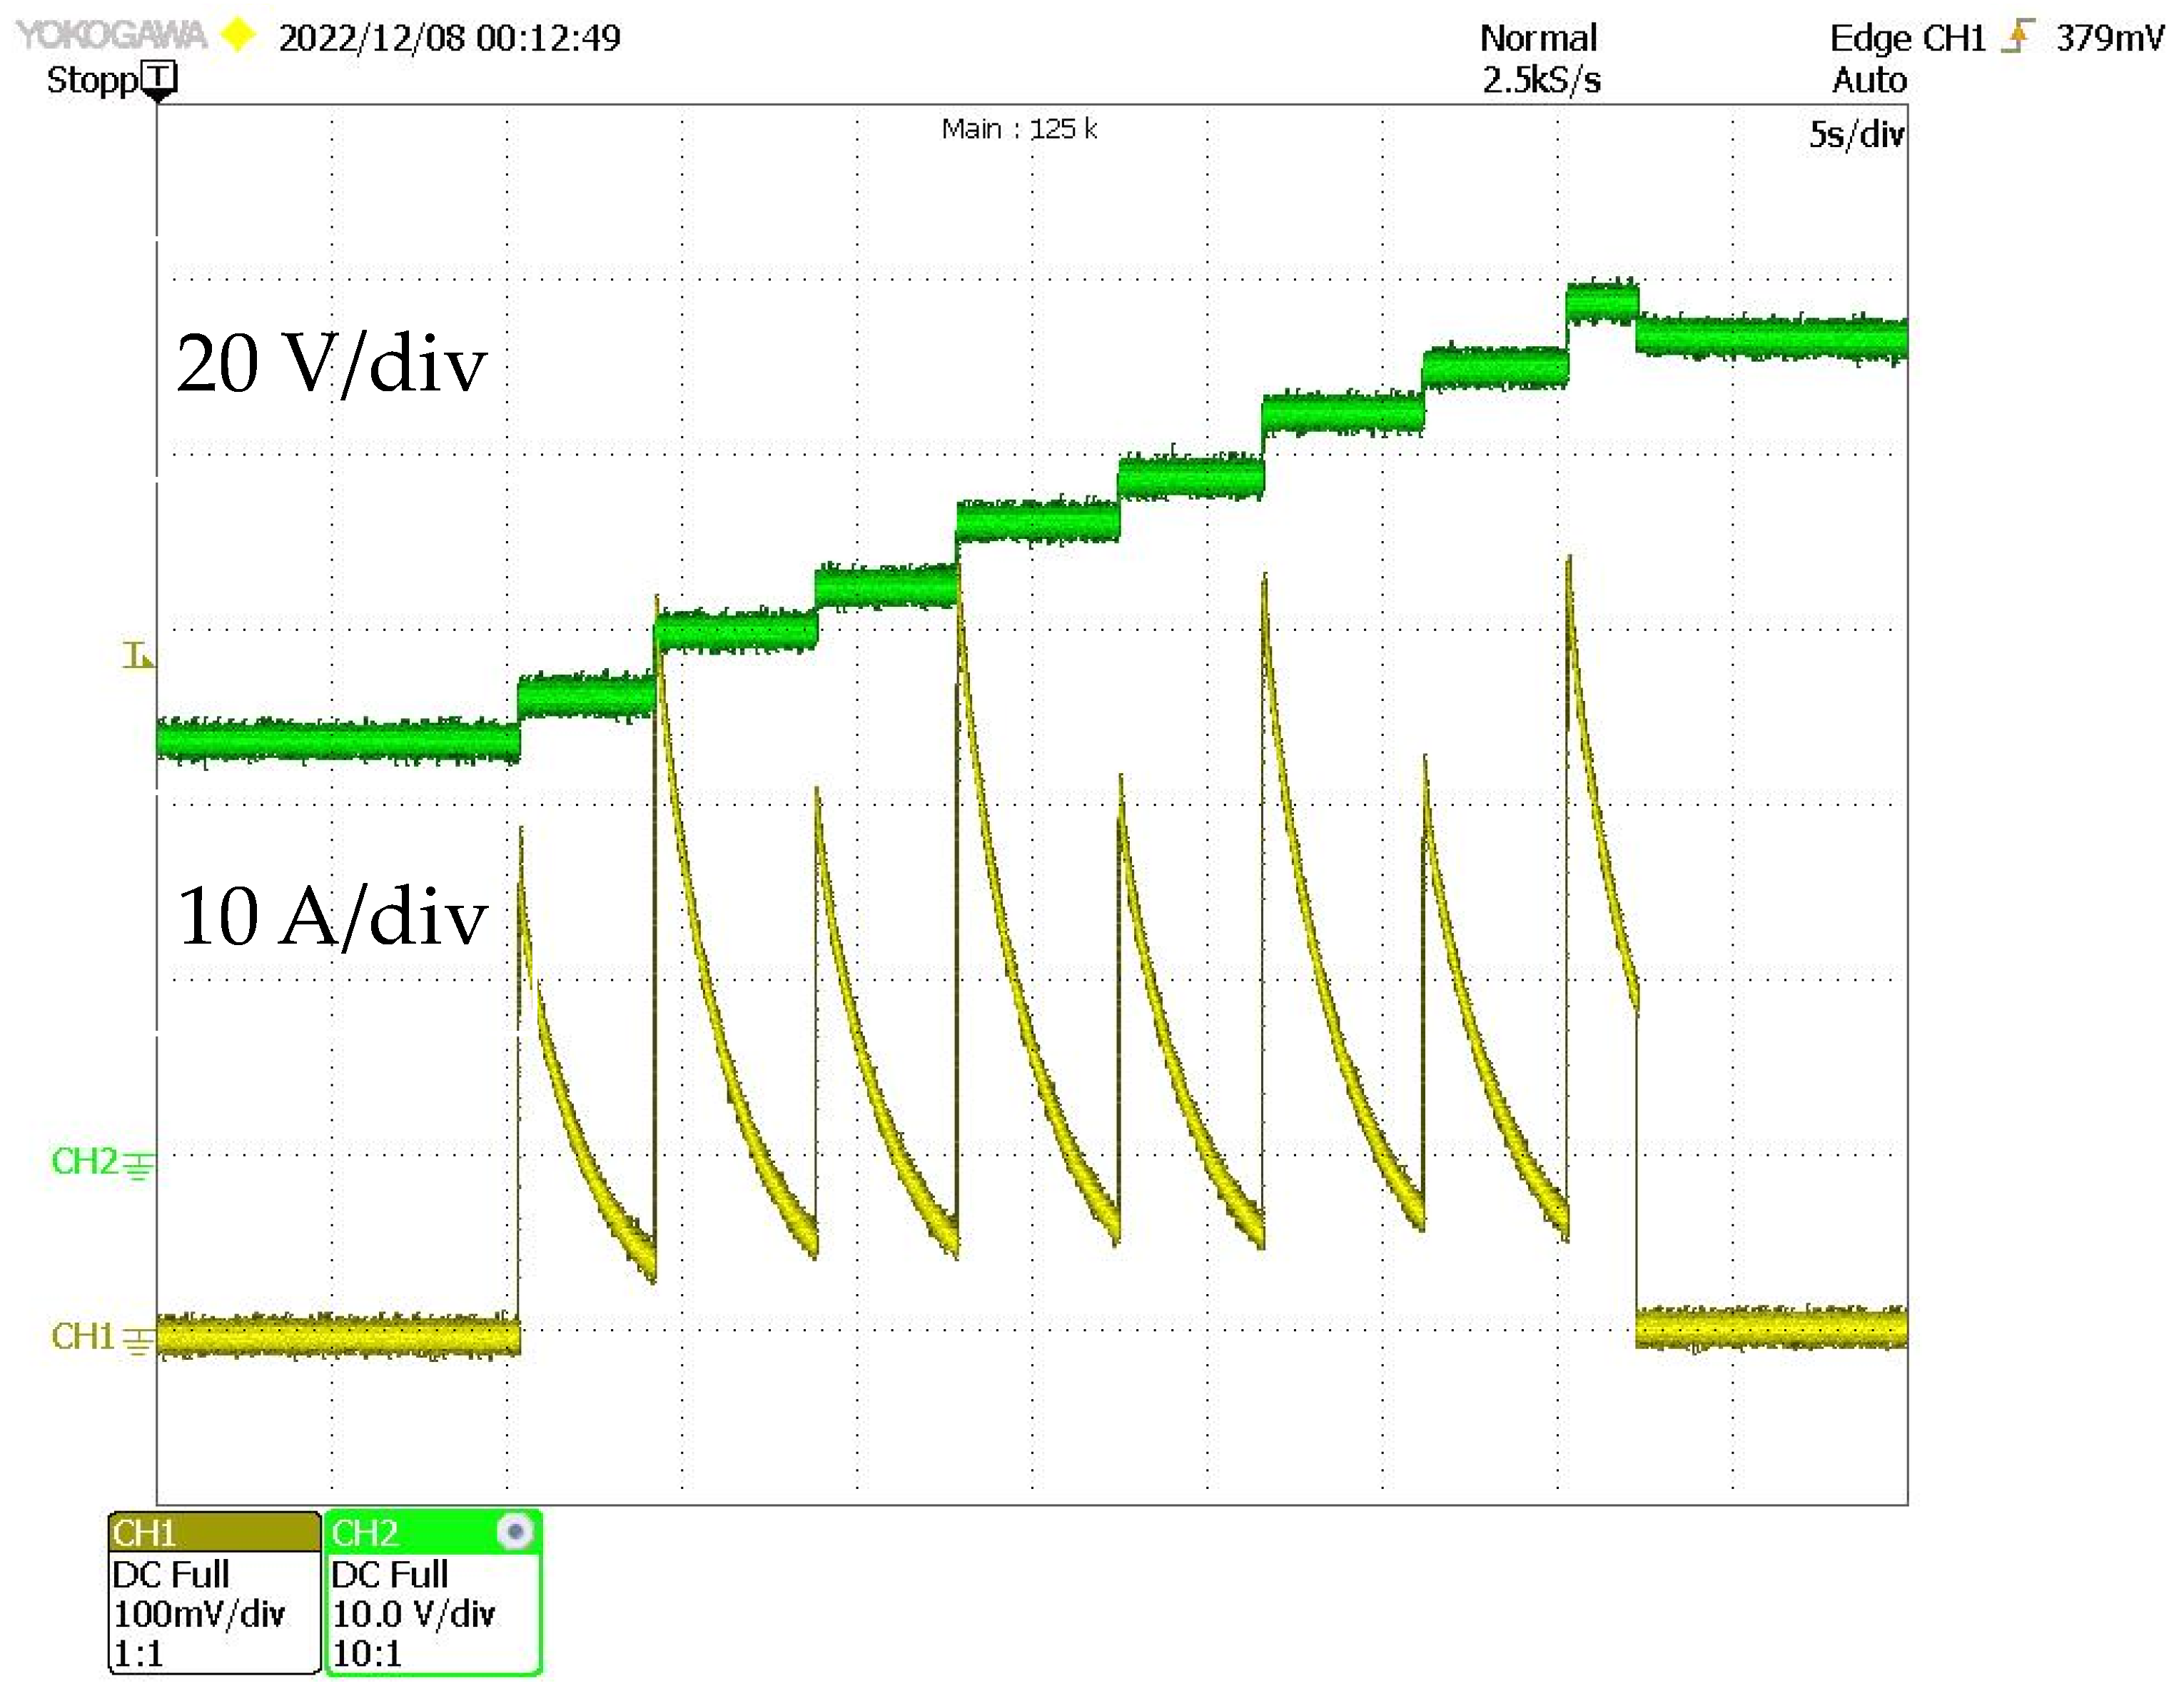
Figure 45.
Discharging simulation result diagrams.
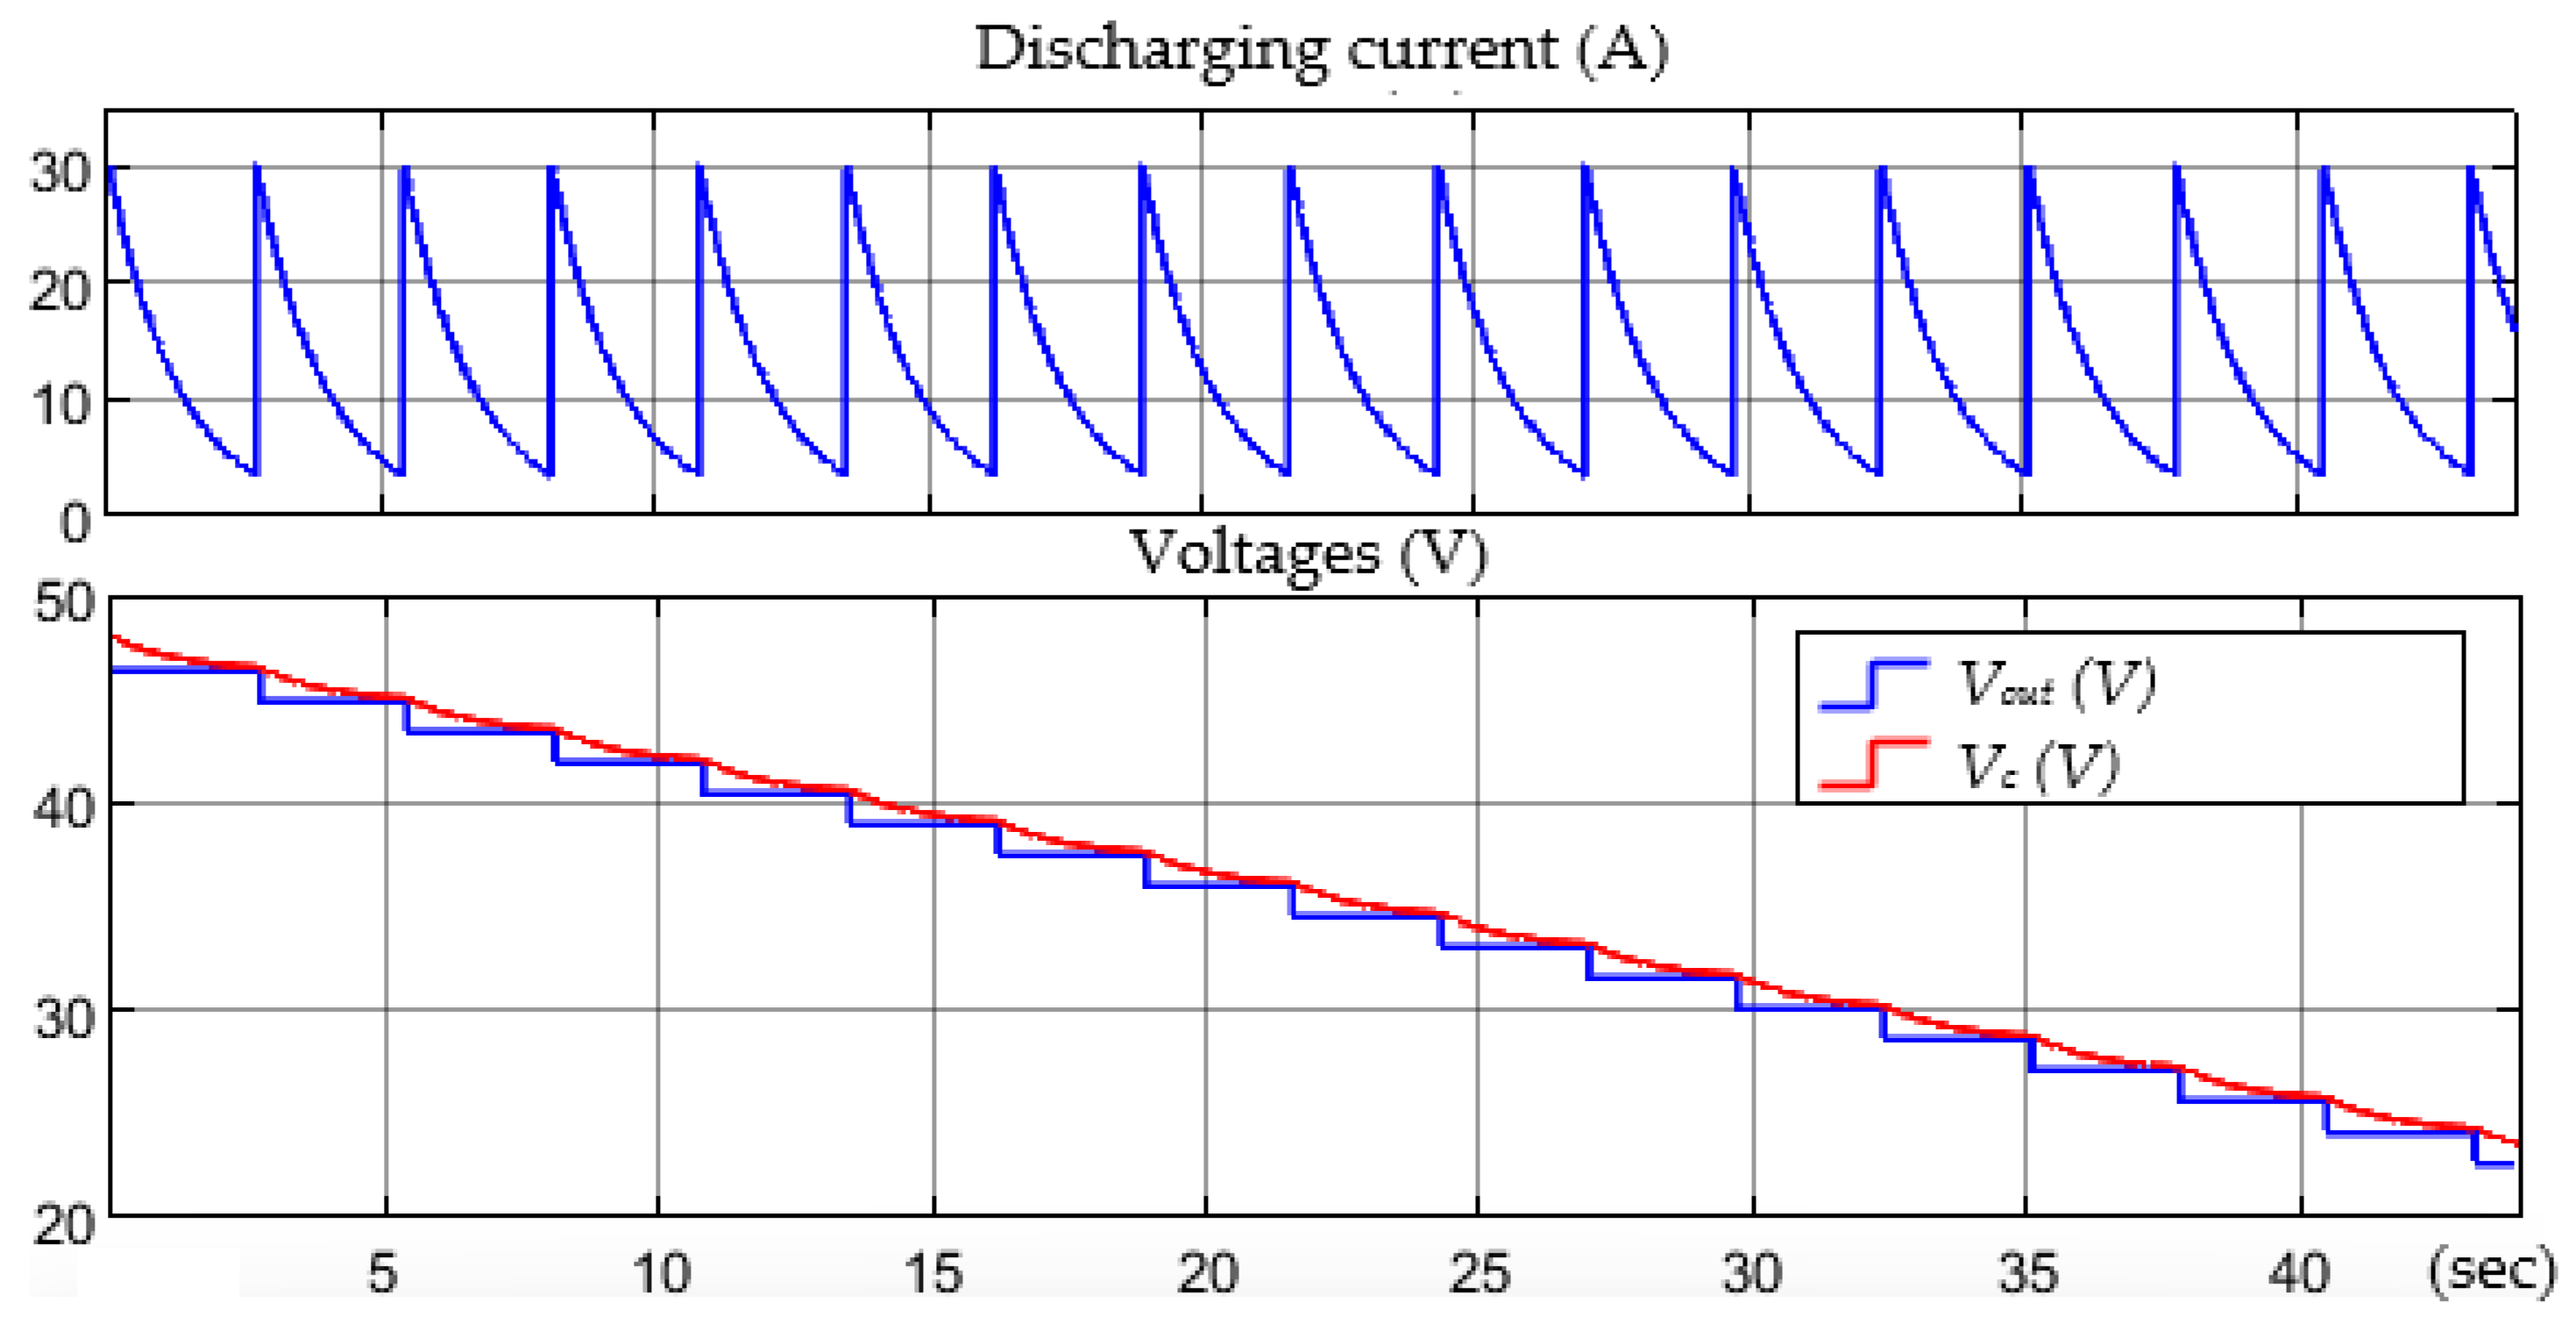
Figure 46.
Experimentally obtained diagrams of discharging current and voltage.

Table 1.
Main parameters of the DC–DC converter.
| Name | Unit | Value |
|---|---|---|
| Inductance L | µH | 1 |
| Output voltage | V | 50 |
| Input voltage | V | 20–48 |
| Power | kW | 3 |
| Switching frequency | kHz | 500 |
| Output capacitor | µF | 100 |
| Input capacitor | µF | 0–25 |
| Transistor on-state resistance | mΩ | 15 |
Disclaimer/Publisher’s Note: The statements, opinions and data contained in all publications are solely those of the individual author(s) and contributor(s) and not of MDPI and/or the editor(s). MDPI and/or the editor(s) disclaim responsibility for any injury to people or property resulting from any ideas, methods, instructions or products referred to in the content. |
© 2022 by the authors. Licensee MDPI, Basel, Switzerland. This article is an open access article distributed under the terms and conditions of the Creative Commons Attribution (CC BY) license (https://creativecommons.org/licenses/by/4.0/).
Share and Cite
MDPI and ACS Style
Kroičs, K.; Staņa, Ģ. Bidirectional Interleaved DC–DC Converter for Supercapacitor Energy Storage Integration with Reduced Capacitance. Electronics 2023, 12, 126. https://doi.org/10.3390/electronics12010126
AMA Style
Kroičs K, Staņa Ģ. Bidirectional Interleaved DC–DC Converter for Supercapacitor Energy Storage Integration with Reduced Capacitance. Electronics. 2023; 12(1):126. https://doi.org/10.3390/electronics12010126
Chicago/Turabian StyleKroičs, Kaspars, and Ģirts Staņa. 2023. "Bidirectional Interleaved DC–DC Converter for Supercapacitor Energy Storage Integration with Reduced Capacitance" Electronics 12, no. 1: 126. https://doi.org/10.3390/electronics12010126
Note that from the first issue of 2016, this journal uses article numbers instead of page numbers. See further details here.